


Design of a Short-To-Medium-Range Baseline Aircraft with an Entry into Service in 2035 for the HOPE Project


Abstract
1. Introduction
2. Methodology
2.1. Bauhaus Luftfahrt Aircraft Design Environment
2.1.1. Fuselage Module
2.1.2. Wing Module
2.1.3. Empennage Module
2.1.4. Landing Gear Module
2.1.5. Engine, Nacelle, and Pylon Module
2.1.6. Overall Aircraft and Subsystem Mass Estimation Module
2.1.7. Overall Aircraft Aerodynamic Analysis Module
2.1.8. Mission Analysis Module
2.1.9. Aircraft Design Workflow
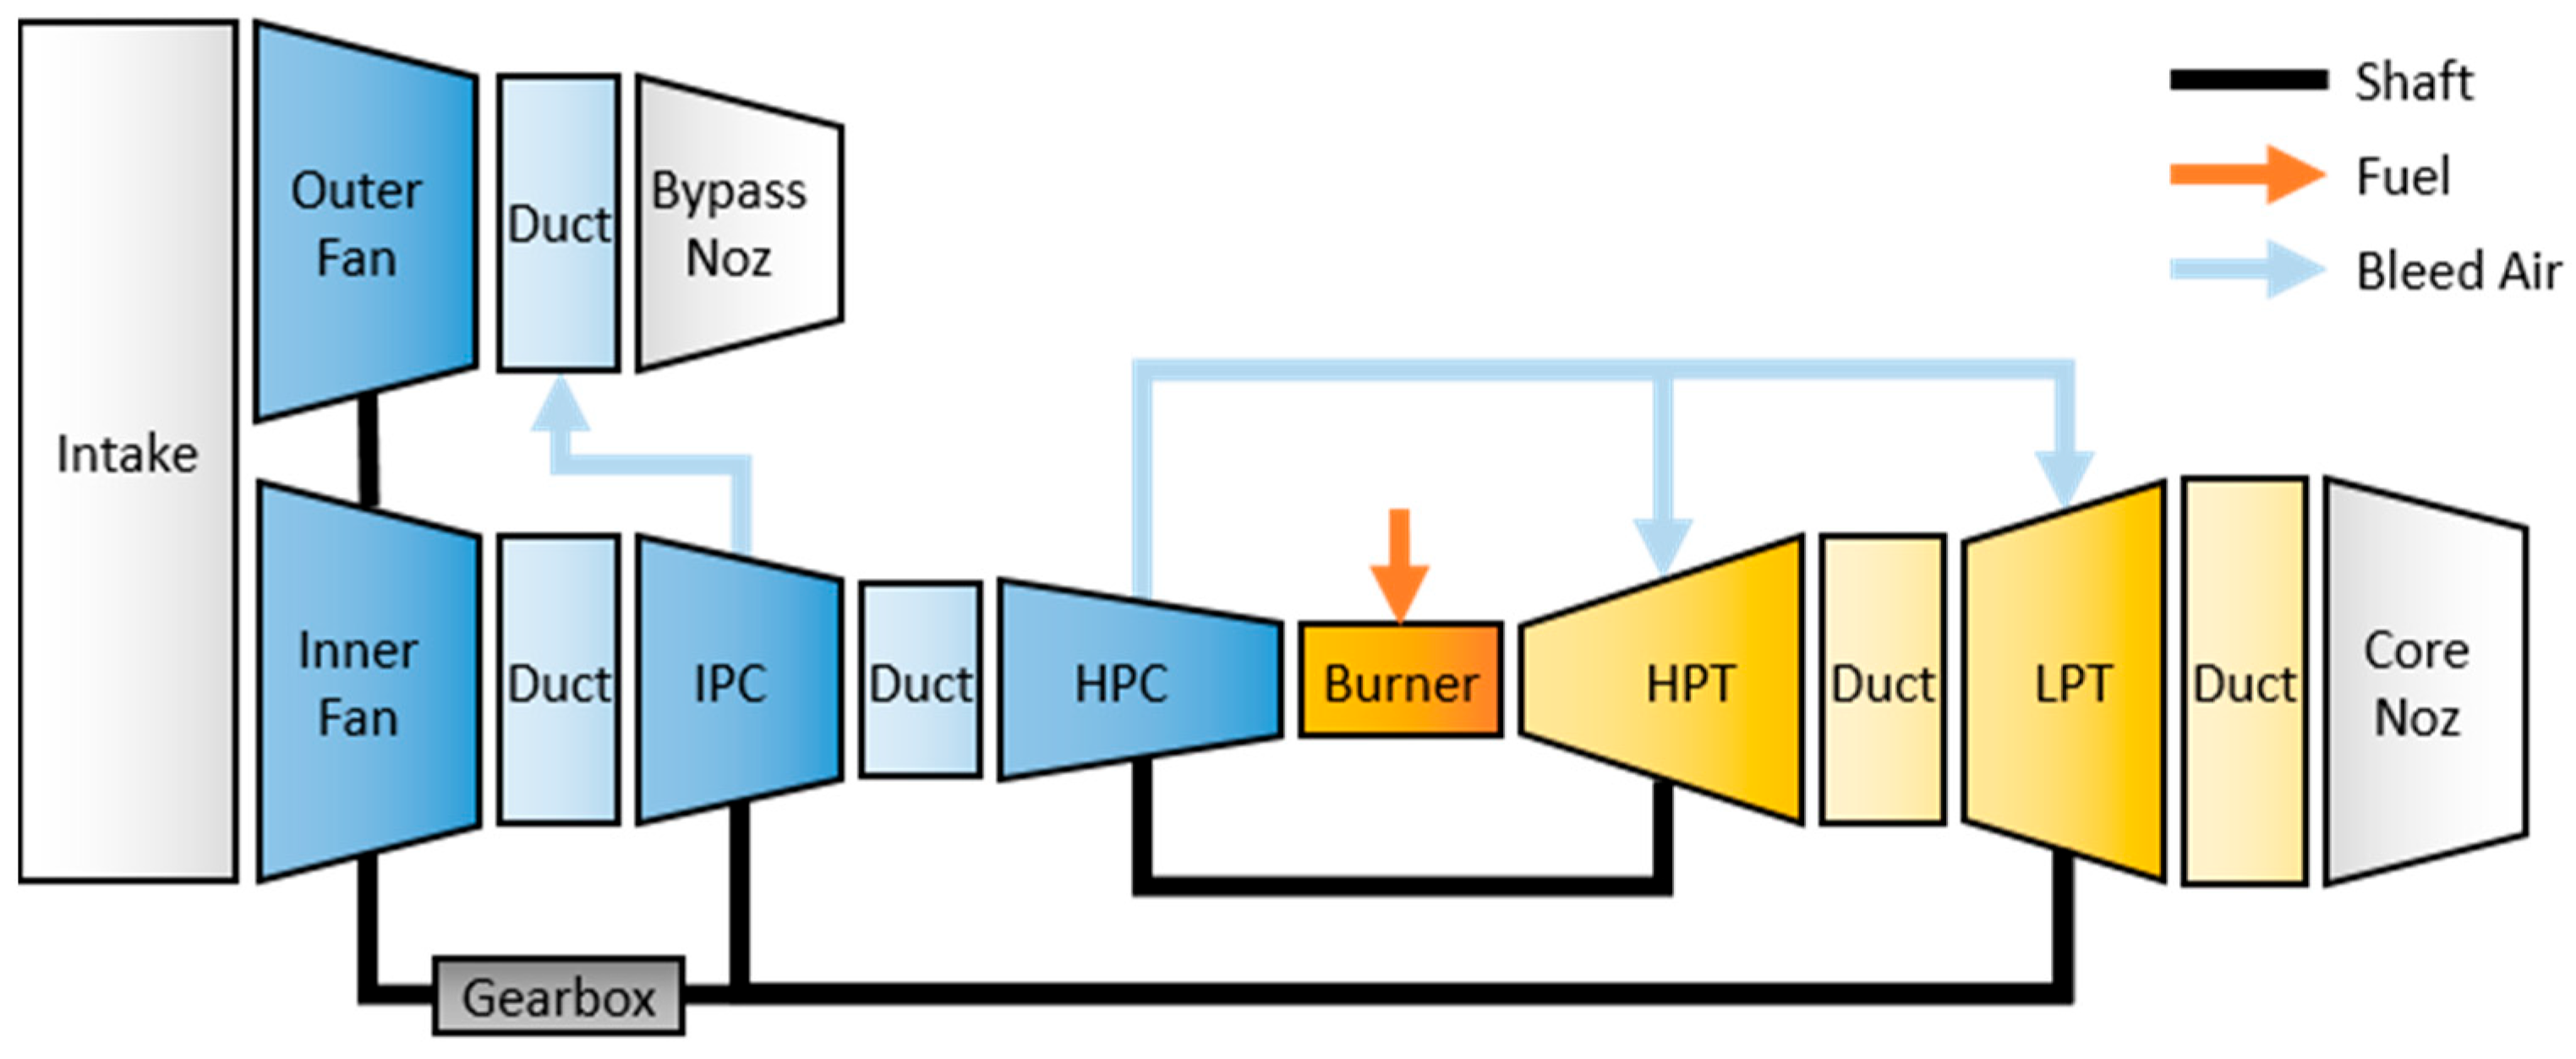
2.2. Engine Design Framework
2.3. Previous Relevant Studies in Literature
2.4. Top-Level Aircraft Requirements
2.5. Technology Assumptions
2.6. Aircraft Sizing Heuristics
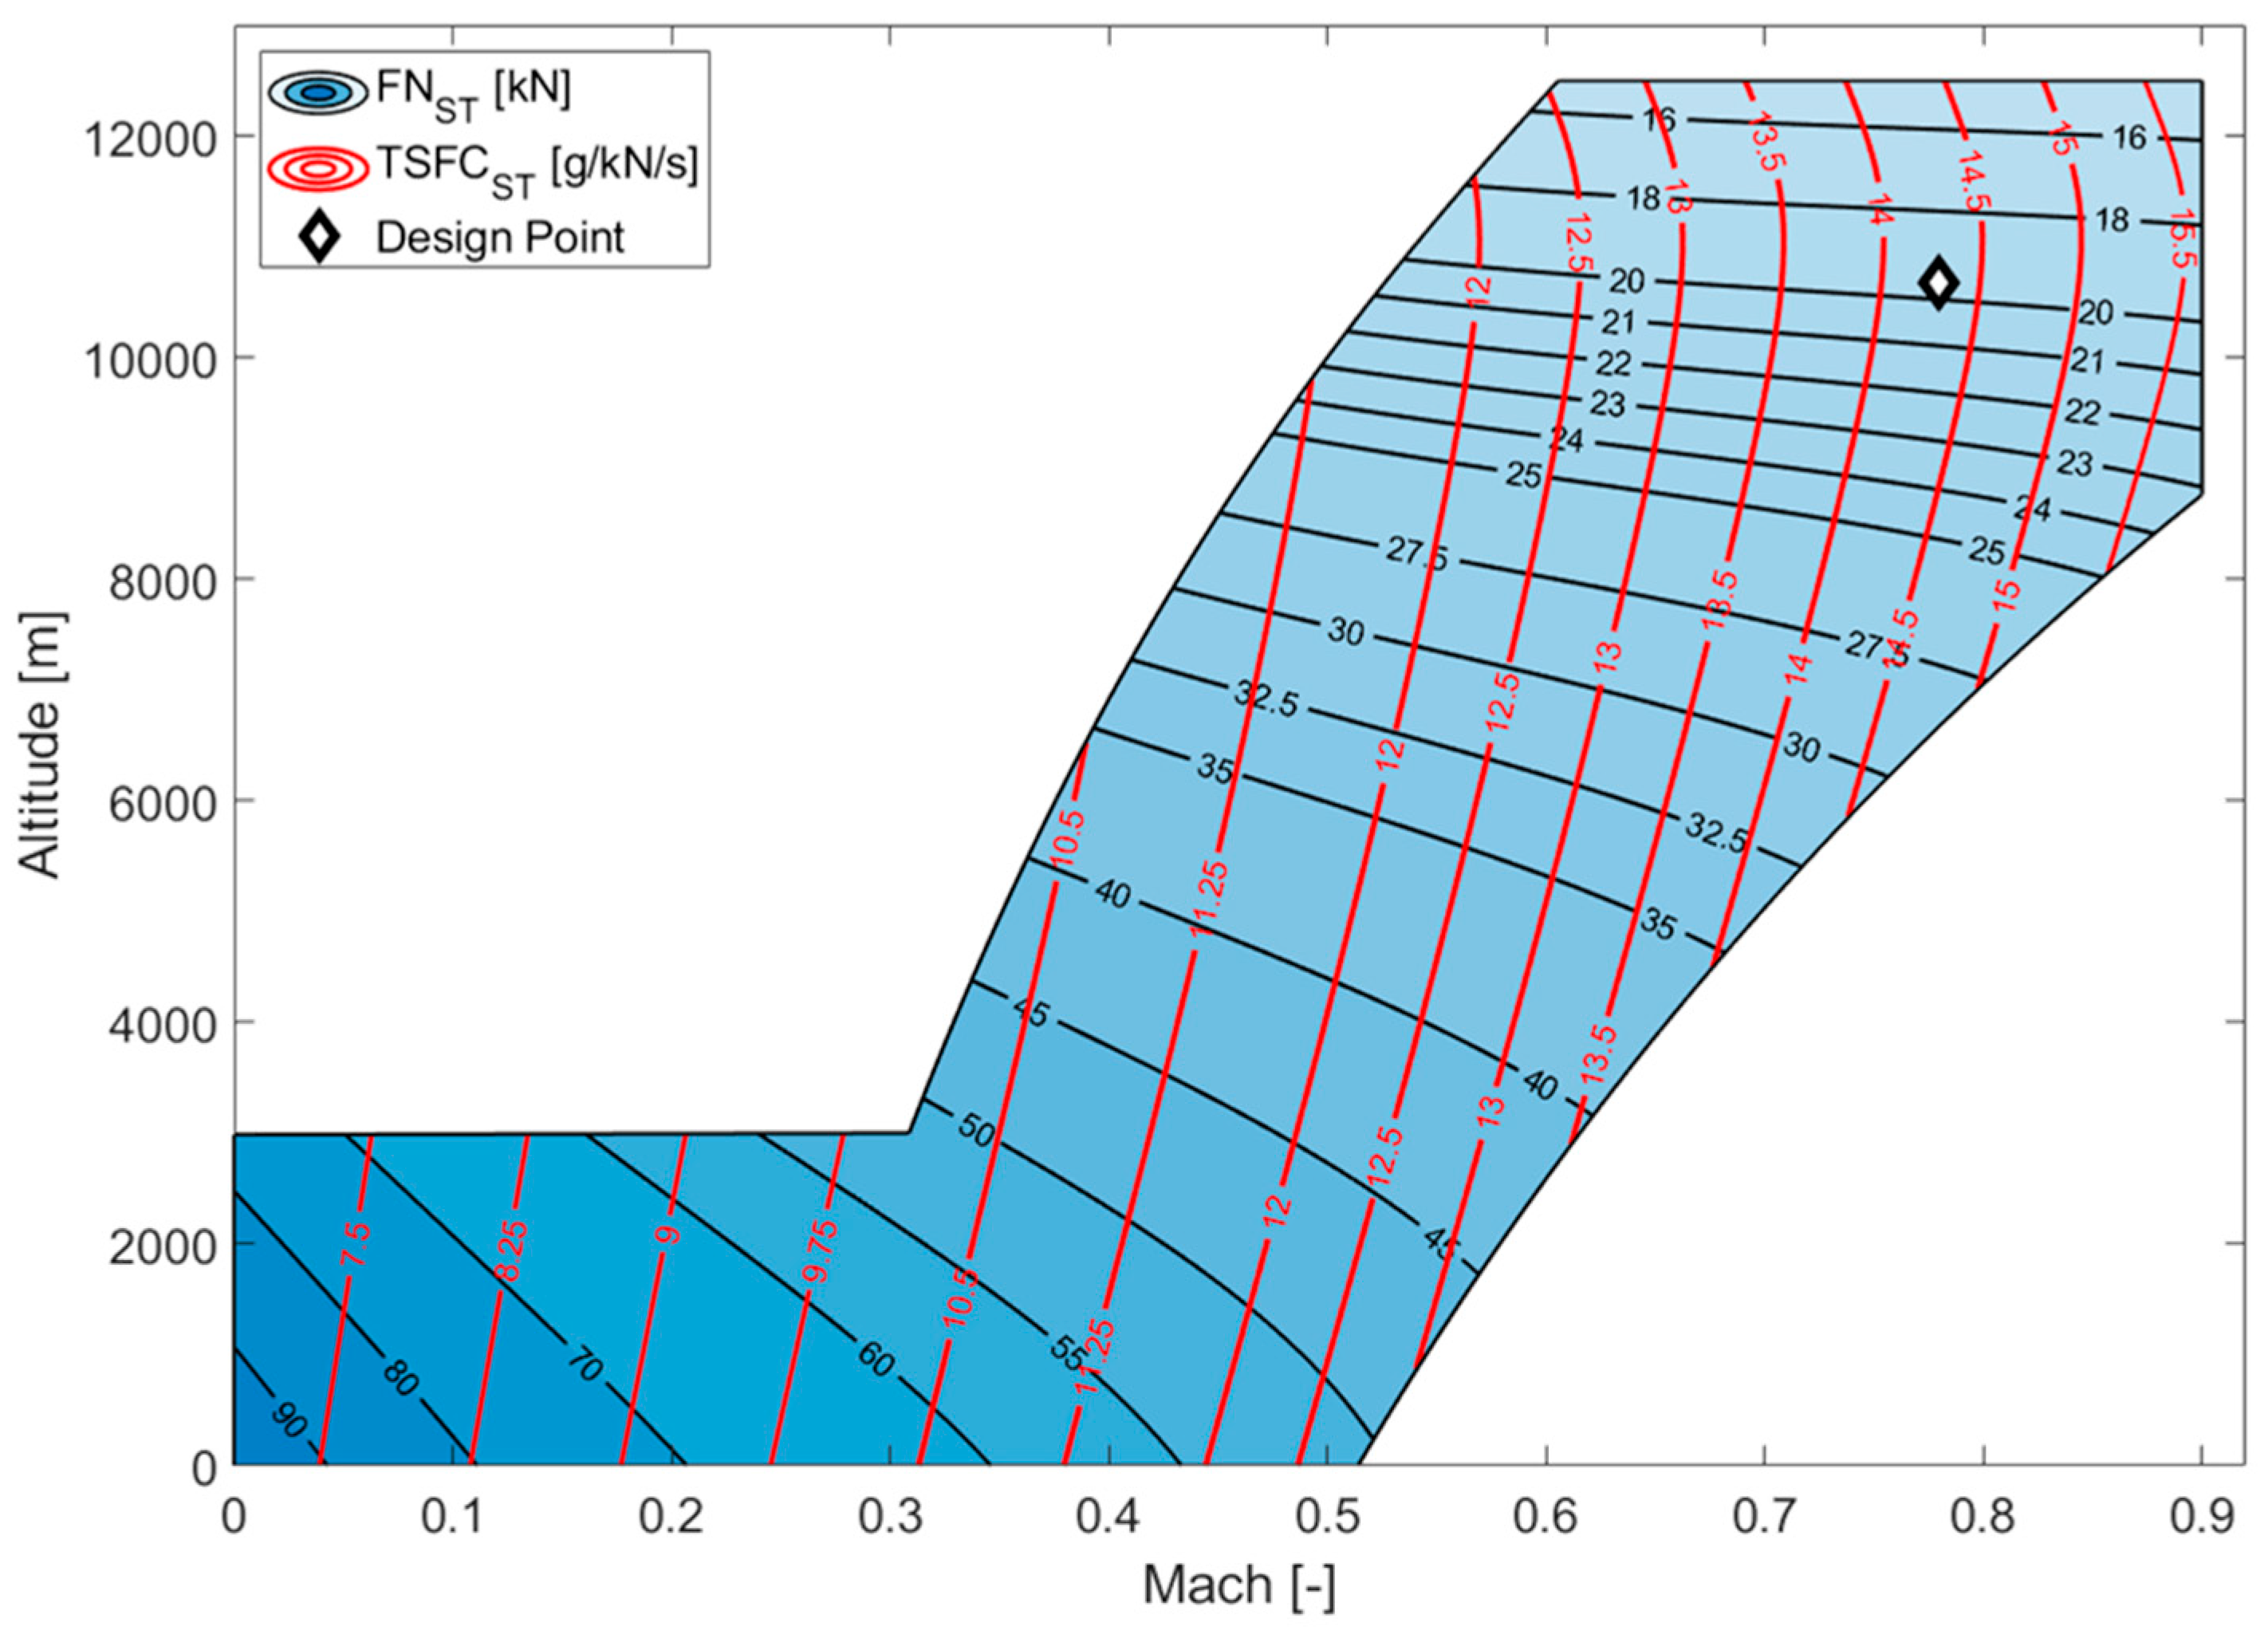
3. Engine Design and Results
4. Aircraft Design and Results
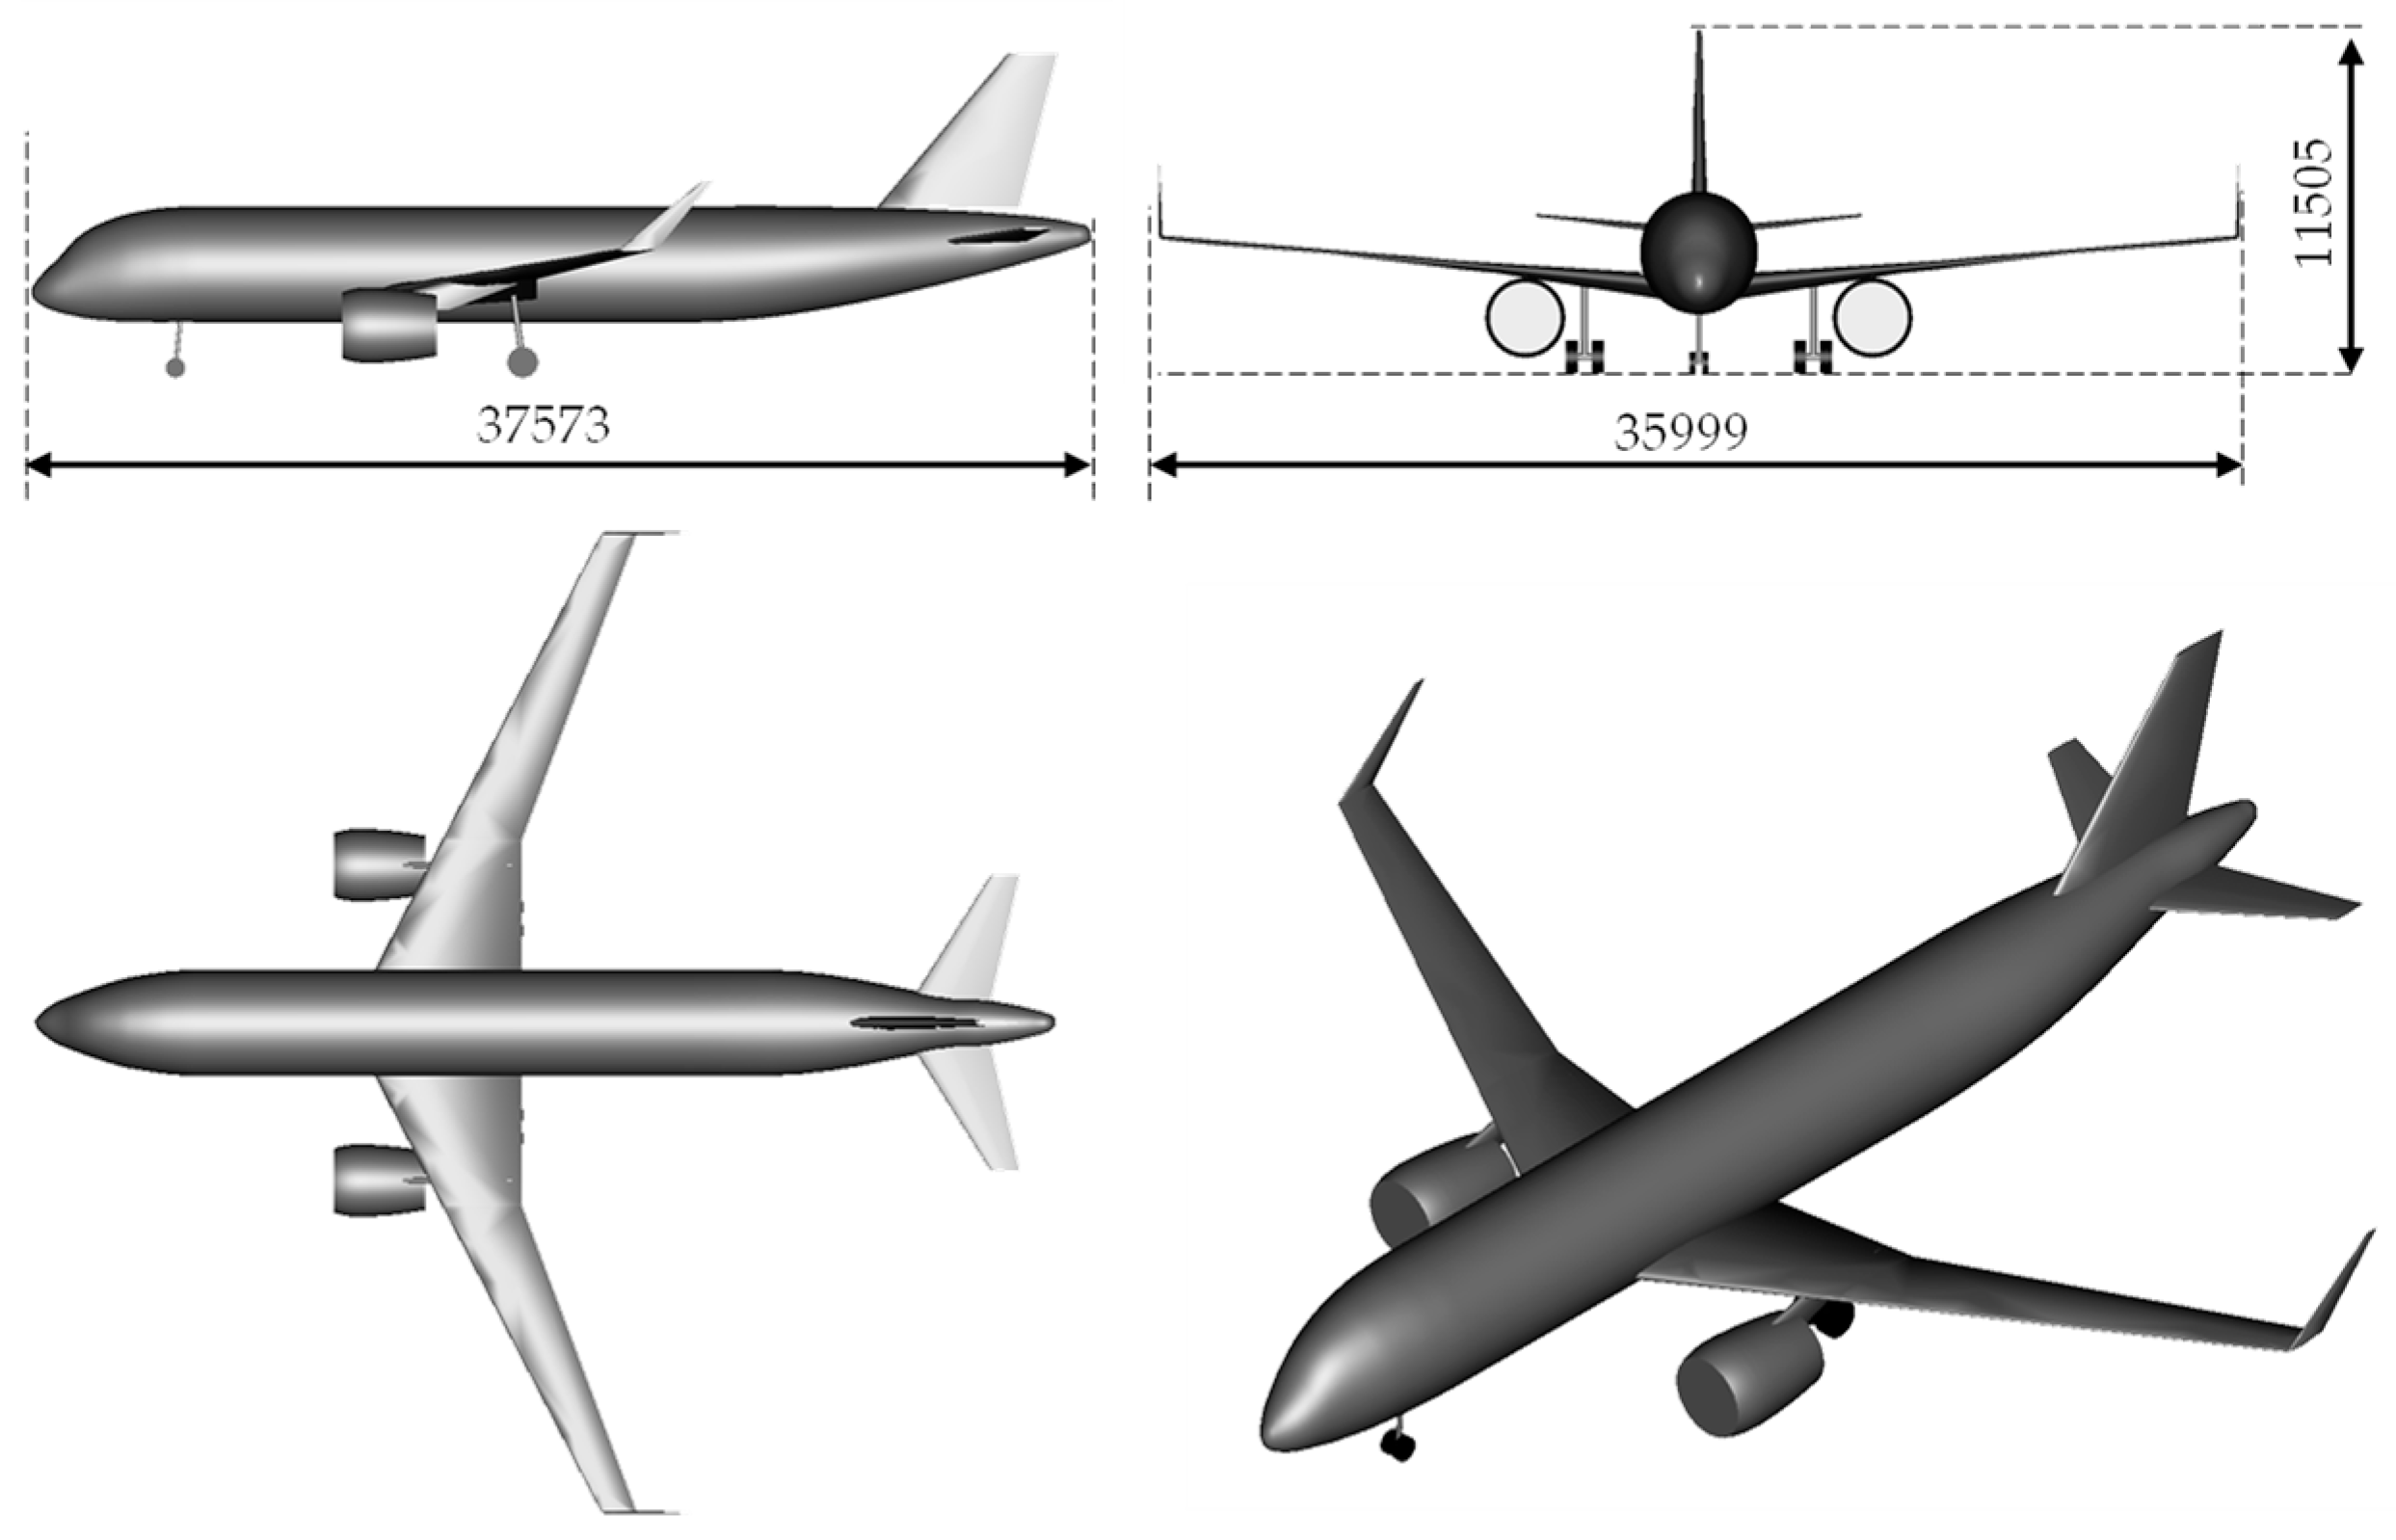
4.1. Geometries
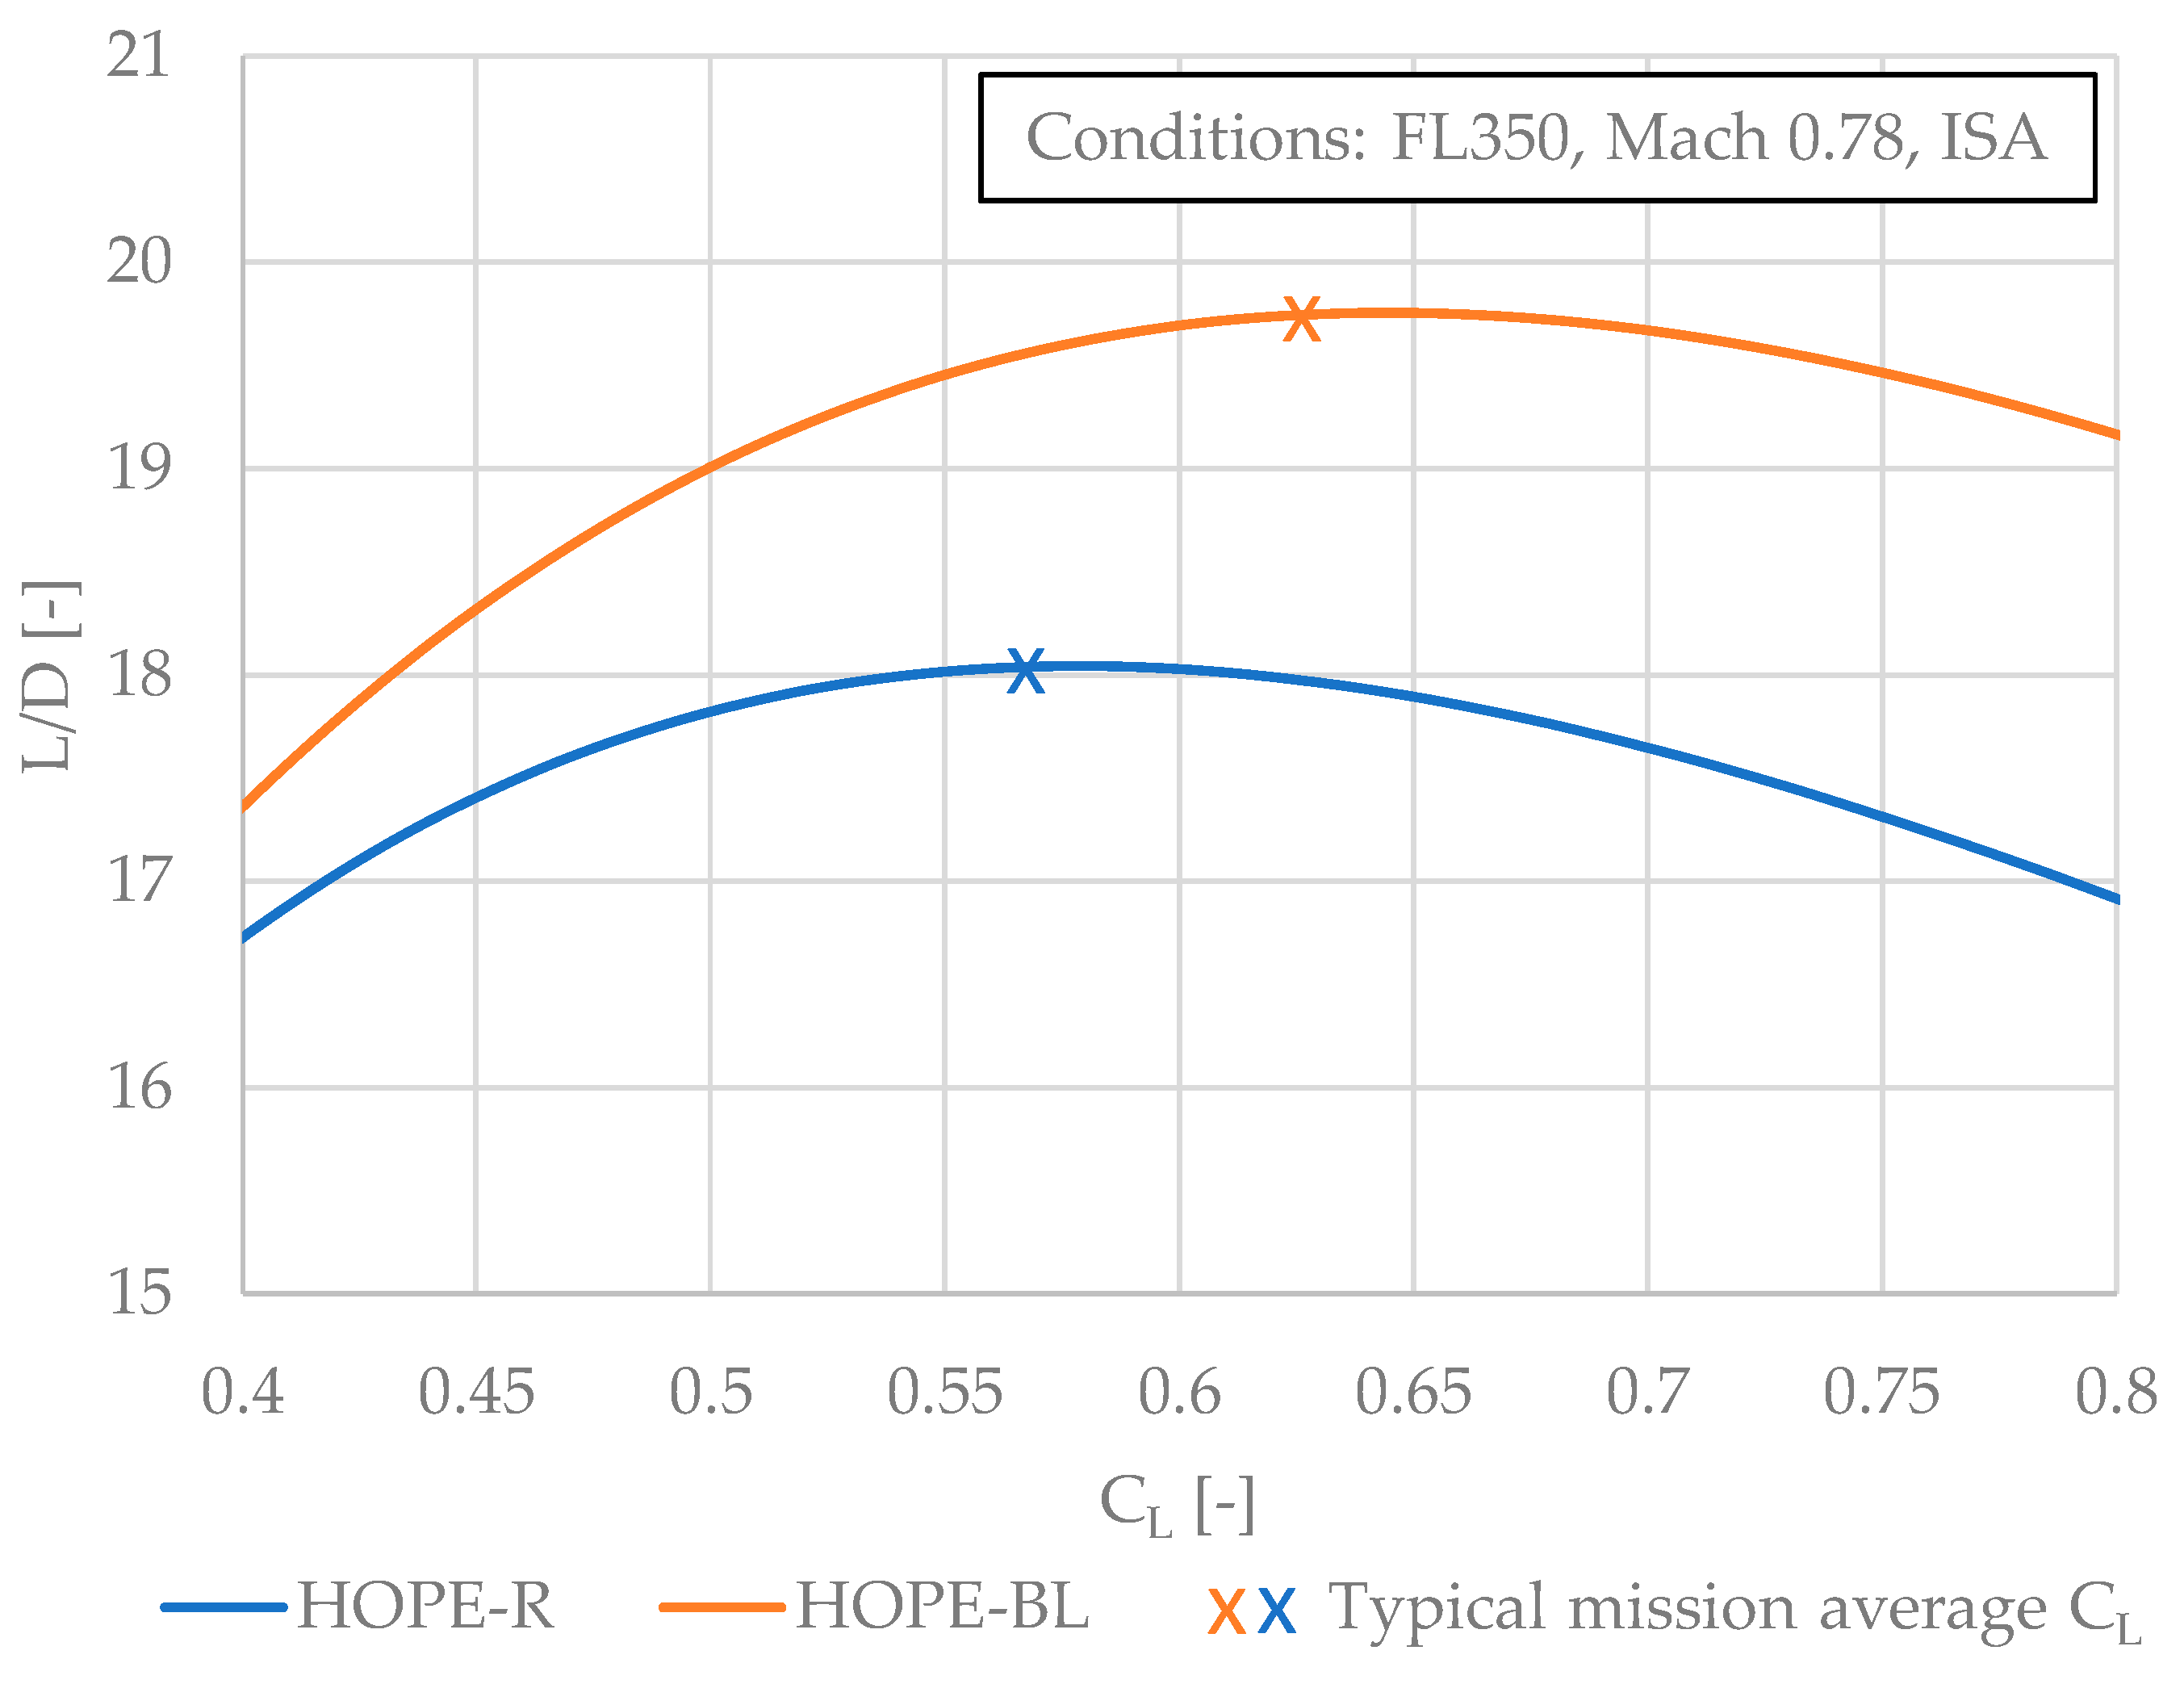
4.2. Aerodynamics
4.3. Masses
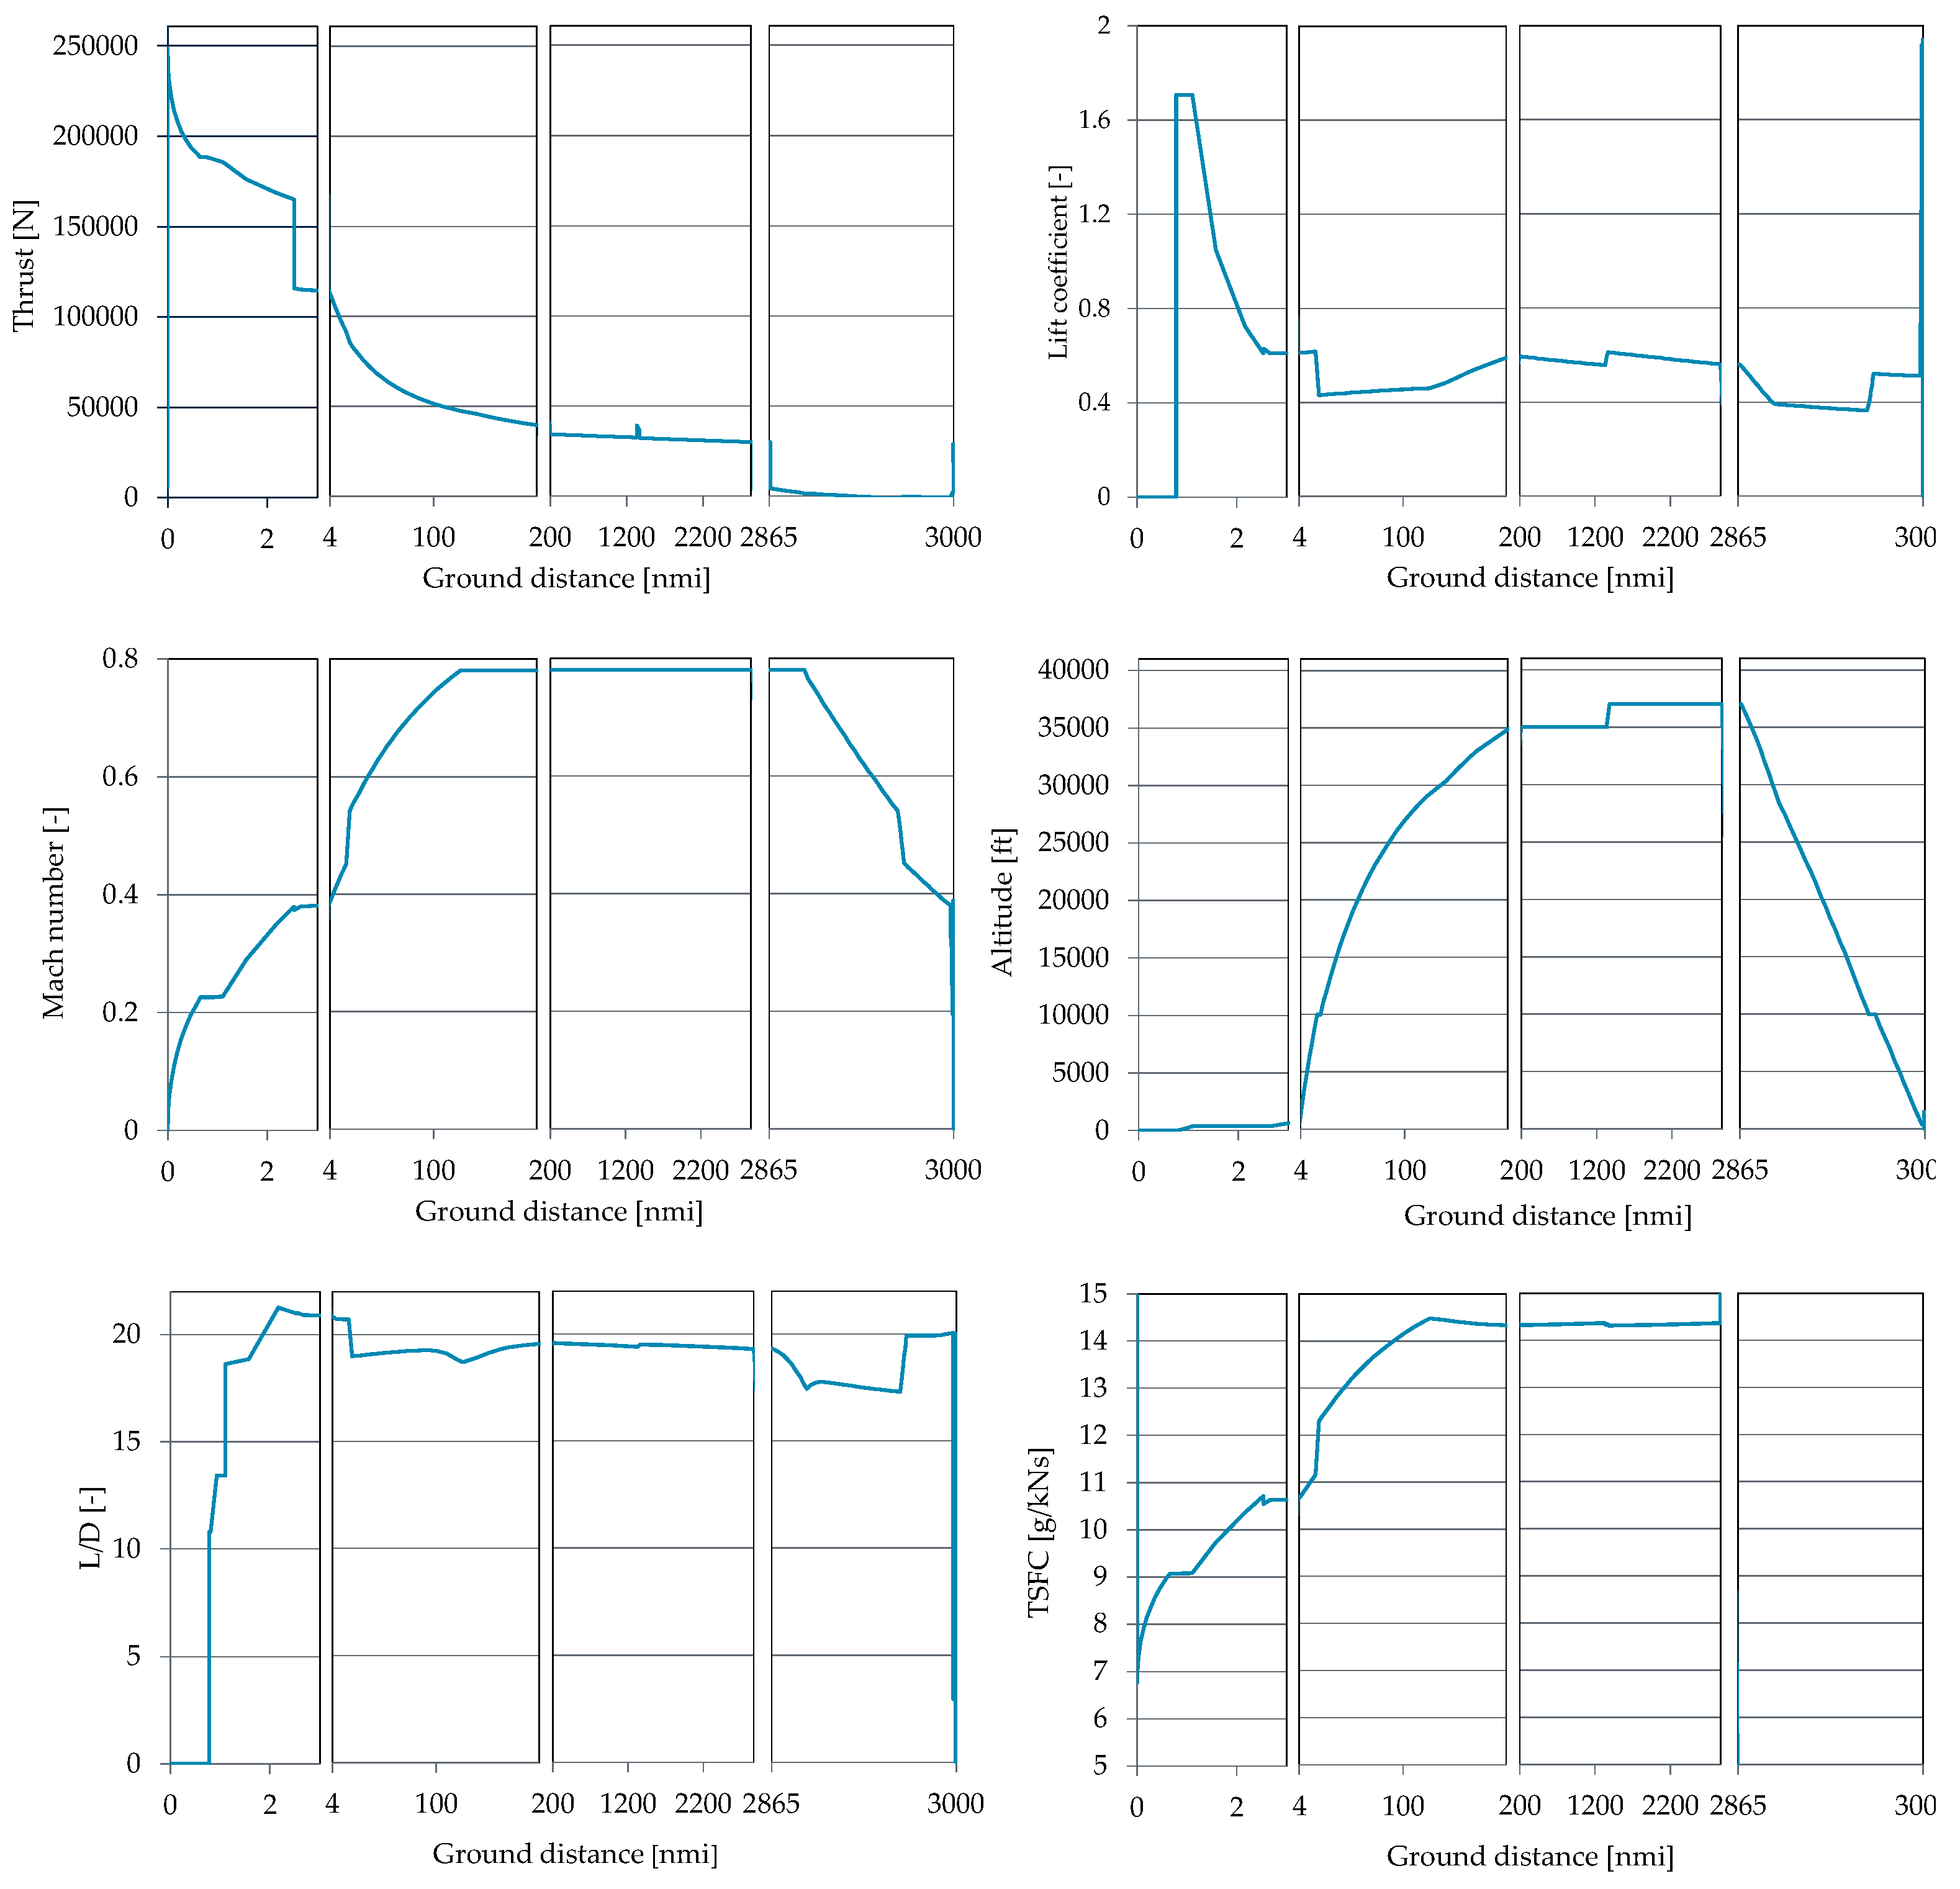
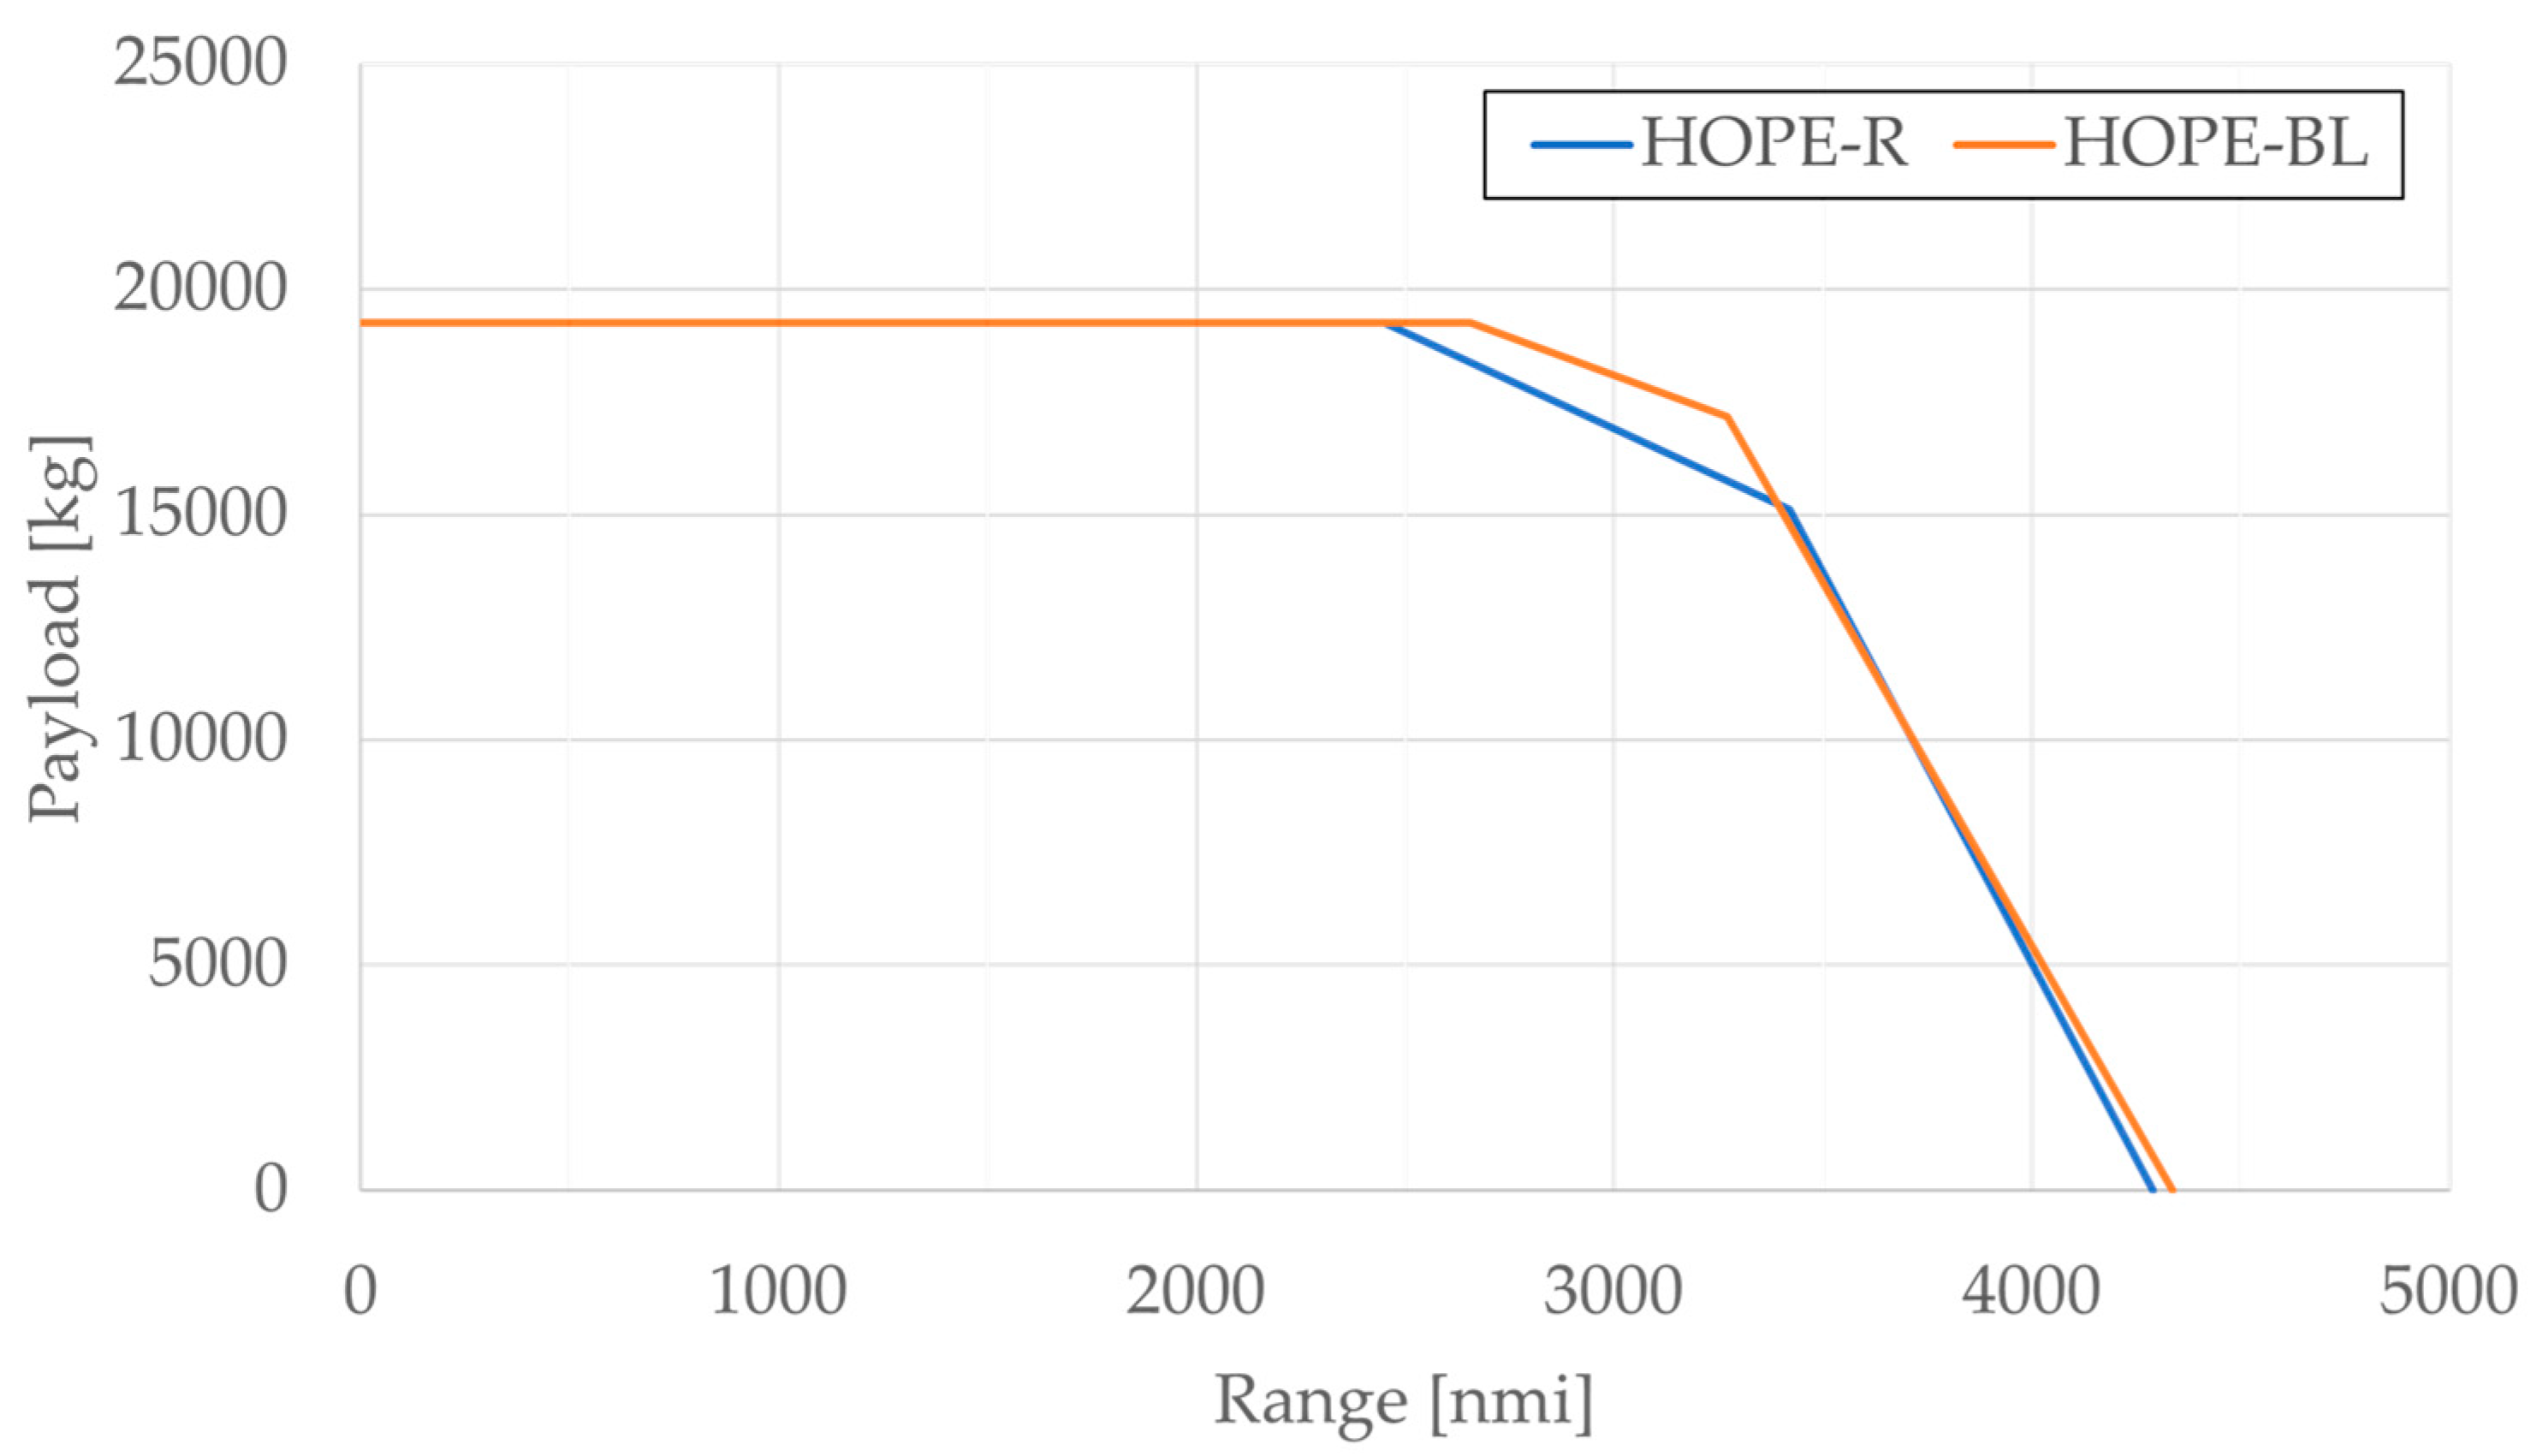
4.4. Performance
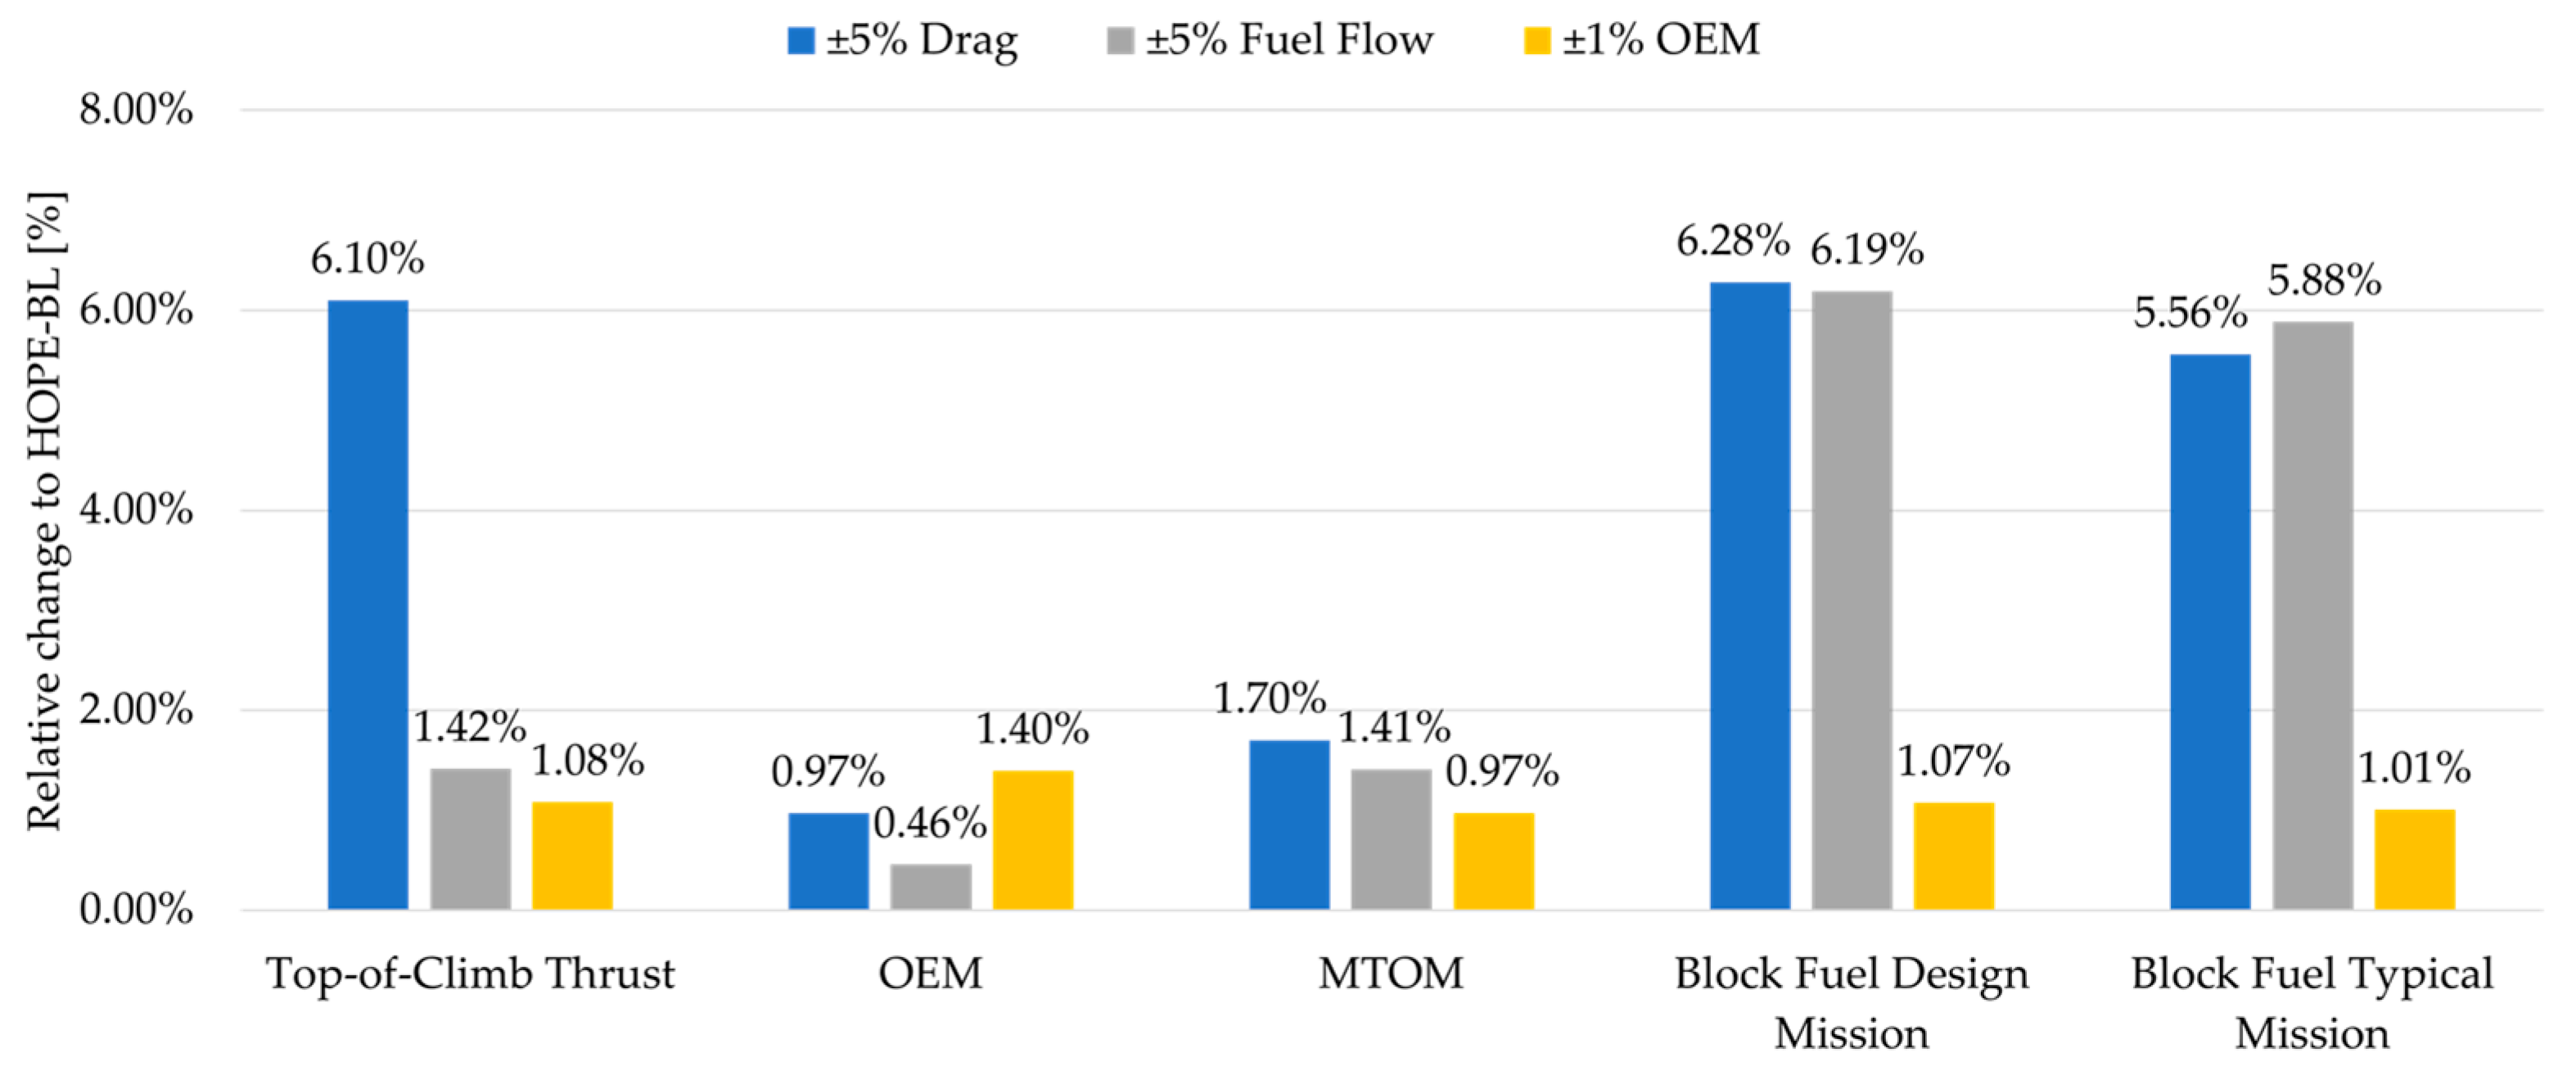
4.5. Design Sensitivities
5. Summary and Conclusions
Author Contributions
Funding
Data Availability Statement
Acknowledgments
Conflicts of Interest
Abbreviations
| APSS | Aircraft Propulsion System Simulation |
| BHL | Bauhaus Luftfahrt |
| BLADE | Bauhaus Luftfahrt Aircraft Design Environment |
| BLI | Boundary-Layer-Ingesting |
| BPR | Bypass Ratio |
| CD | Drag coefficient |
| CD0 | Zero-lift drag coefficient |
| CDI | Induced drag coefficient |
| CDW | Wave drag coefficient |
| CEA | Chemical Equilibrium with Applications |
| CFRP | Carbon-Fiber Reinforced Plastic |
| CG | Centre of Gravity |
| CL | Lift coefficient |
| DEN | Denver International Airport |
| EIS | Entry Into Service |
| FAR | Fuel Air Ratio |
| FL | Flight Level (100 ft) |
| FNN | Feedforward Neural Network |
| GTF | Geared Turbofan |
| HOPE | Hydrogen Optimized Multi-Fuel Propulsion System for Clean and Silent Aircraft |
| HOPE-BL | HOPE Baseline |
| HOPE-R | HOPE Reference |
| HPC | High-Pressure Compressor |
| HPT | High-Pressure Turbine |
| HTP | Horizontal Tailplane |
| IPC | Intermediate-Pressure Compressor |
| ISA | International Standard Atmosphere |
| KCAS | Knots Calibrated Airspeed |
| L/D | Lift-to-drag ratio |
| LHV | Lower Heating Value |
| LPT | Low-Pressure Turbine |
| MAC | Mean Aerodynamic Chord |
| MLM | Maximum Landing Mass |
| MTOM | Maximum Take-off Mass |
| NASA | National Aeronautics and Space Administration |
| OEI | One Engine Inoperative |
| OEM | Operating Empty Mass |
| OPR | Overall Pressure Ratio |
| SEP | Specific Excess Power |
| SL | Sea Level |
| SMR | Short-to-Medium Range |
| T4 | Turbine Entry Temperature |
| TLAR | Top-Level Aircraft Requirement |
| TOC | Top Of Climb |
| TOFL | Take-off Field Length |
| TSFC | Thrust-Specific Fuel Consumption |
| UHBR | Ultra-High Bypass Ratio |
| VTP | Vertical Tailplane |
Appendix A

| Parameter | Unit | HOPE-R | HOPE-BL | Δ |
|---|---|---|---|---|
| Fuselage mass | kg | 9398 | 8458 | −10% |
| Wing mass | kg | 8936 | 7502 | −16% |
| Winglet mass | kg | 170 | 164 | −4% |
| Horizontal tailplane mass | kg | 681 | 455 | −33% |
| Vertical tailplane mass | kg | 537 | 438 | −19% |
| Landing gear mass | kg | 2578 | 2122 | −18% |
| Power units mass | kg | 7833 | 5881 | −25% |
| Pylons mass | kg | 1237 | 1079 | −13% |
| Systems mass | kg | 5213 | 5185 | −1% |
| Furnishings mass | kg | 3398 | 3058 | −10% |
| Operator items mass | kg | 4941 | 4446 | −10% |
References
- ATAG (Air Transport Action Group). Waypoint 2050. 2021. Available online: https://aviationbenefits.org/downloads/waypoint-2050/ (accessed on 28 September 2024).
- Lee, D.S.; Fahey, D.W.; Skowron, A.; Allen, M.R.; Burkhardt, U.; Chen, Q.; Doherty, S.J.; Freeman, S.; Forster, P.M.; Fuglestvedt, J.; et al. The contribution of global aviation to anthropogenic climate forcing for 2000 to 2018. Atmos. Environ. 2021, 244, 117834. [Google Scholar] [CrossRef] [PubMed]
- IATA (The International Air Transport Association). Quarterly Air Transport Chartbook Q2 2023. 2023. Available online: https://www.iata.org/en/iata-repository/publications/economic-reports/quarterly-air-transport-chartbook/ (accessed on 24 July 2024).
- Airbus. Global Market Forecast 2024. 2024. Available online: https://www.airbus.com/en/products-services/commercial-aircraft/market/global-market-forecast (accessed on 24 July 2024).
- European Commission. Hydrogen Optimized Multi-Fuel Propulsion System for Clean and silEnt Aircraft, Grant Agreement ID: 101096275. Available online: https://cordis.europa.eu/project/id/101096275 (accessed on 24 July 2024).
- Airbus, S.A.S. Customer Service. In A320 Aircraft Characteristics Airport and Maintenance Planning; Airbus: Blagnac, France, 2017. [Google Scholar]
- Alder, M.; Moerland, E.; Jepsen, J.; Nagel, B. Recent Advances in Establishing a Common Language for Aircraft Design with CPACS. In Proceedings of the Aerospace Europe Conference 2020, Bordeaux, France, 25–28 February 2020; Available online: https://elib.dlr.de/134341/1/AEC2020_174.pdf (accessed on 9 October 2024).
- Schültke, F.; Stumpf, E. UNICADO: Development and Establishment of a University Conceptual Aircraft Design Environment. In Proceedings of the 70. Deutscher Luft- und Raumfahrtkongress 2021, Bremen, Germany, 31 August–2 September 2021; Available online: https://publications.rwth-aachen.de/record/828728/files/828728.pdf (accessed on 25 February 2025).
- Dorbath, F. Large Civil Jet Transport (MTOM > 40t) Statistical Mass Estimation (MA 401 12-01); Luftfahrttechnisches Handbuch: Koordinierungsstelle, Germany, 2022. [Google Scholar]
- Jenkinson, L.R.; Simpkin, P.; Rhodes, D. Civil Jet Aircraft Design; Arnold: London, UK, 1999; ISBN 034074152X. [Google Scholar]
- Torenbeek, E. Synthesis of Subsonic Airplane Design: An Introduction to the Preliminary Design of Subsonic General Aviation and Transport Aircraft, with Emphasis on Layout, Aerodynamic Design, Propulsion and Performance; Springer: Dordrecht, The Netherlands, 1982; ISBN 9789048182732. [Google Scholar]
- v. Baur/Wissel. Tragwerk Transporter: Statistische Masseabschätzung (MA 501 12-01); Luftfahrttechnisches Handbuch: Koordinierungsstelle, Germany, 2022. [Google Scholar]
- Scholz, D. Definition and discussion of the intrinsic efficiency of winglets. Incas Bull. 2018, 10, 117–134. [Google Scholar] [CrossRef]
- Raymer, D. Aircraft Design: A Conceptual Approach, 6th ed.; AIAA (The American Institute of Aeronautics and Astronautics): Washington, DC, USA, 2018; ISBN 978-1-62410-490-9. [Google Scholar]
- Currey, N.S. Aircraft Landing Gear Design: Principles and Practices, 4th ed.; AIAA (The American Institute of Aeronautics and Astronautics): Washington, DC, USA, 1988; ISBN 9780930403416. [Google Scholar]
- vom Baur. Bugfahrwerk, Transporter, Statistische Masseabschätzung (MA 510 12-01); Luftfahrttechnisches Handbuch: Koordinierungsstelle, Germany, 2022. [Google Scholar]
- vom Baur. Hauptfahrwerk, Transporter, Statistische Masseabschätzung (MA 511 12-01); Luftfahrttechnisches Handbuch: Koordinierungsstelle, Germany, 2022. [Google Scholar]
- Bijewitz, J.; Seitz, A.; Hornung, M. Architectural Comparison of Advanced Ultra-High Bypass Ratio Turbofans for Medium to Long Range Application. In Proceedings of the 63. Deutscher Luft-und Raumfahrtkongress (DLRK), Stuttgart, Germany, 16–18 September 2014; DGLR (Deutsche Gesellschaft für Luft-und Raumfahrt), Ed.; 2014. [Google Scholar]
- Seitz, A. Advanced Methods for Propulsion System Integration in Aircraft Conceptual Design. Doctoral Dissertation, TUM (Technische Universität München), Munich, Germany, 2012. [Google Scholar]
- Roskam, J. Airplane Design Part II: Preliminary Configuration Design and Integration of the Propulsion System, 4th ed.; DARcorporation: Lawrence, KS, USA, 1997; ISBN 9781884885433. [Google Scholar]
- Wells, D.P.; Horvath, B.L.; McCullers, L.A. The Flight Optimization System Weights Estimation Method NASA/TM–2017–219627/Volume I; Langley Research Center: Hampton, VA, USA, 2017. Available online: https://ntrs.nasa.gov/citations/20170005851 (accessed on 4 September 2024).
- Hilton, F.H. High-Speed Aerodynamics, 1st ed.; Longmans, Green and Co.: London, UK, 1951; ISBN 978-1124045726. [Google Scholar]
- Inger, G.R. Application of Stitch’s theorem to supercritical airfoil drag calculation. J. Aircr. 1993, 30, 415–416. [Google Scholar] [CrossRef]
- Boppe, C.W. CFD Drag Prediction for Aerodynamic Design. Technical Status Review on Drag Prediction and Analysis from Computational Fluid Dynamics: State of the Art. 1989, pp. 8.1–8.27. Available online: https://apps.dtic.mil/sti/tr/pdf/ADA212809.pdf (accessed on 16 June 2025).
- Mason, W.H. Analytic models for technology integration in aircraft design. In Proceedings of the AIAA/AHS/ASEE Aircraft Design, Systems and Operations Conference, Dayton, OH, USA, 17–19 September 1990; p. 395. [Google Scholar] [CrossRef]
- EASA (The European Union Aviaton Safety Agency). Certification Specifications and Acceptable Means of Compliance for Large Aeroplanes (CS-25), Amendment 28. 2023. Available online: https://www.easa.europa.eu/en/document-library/certification-specifications/cs-25-amendment-28 (accessed on 13 February 2025).
- Torenbeek, E. Flight Physics: Essentials of Aeronautical Disciplines and Technology, with Histrorical Notes; Springer: Dordrecht, The Netherlands; Berlin/Heidelberg, Germany; London, UK; New York, NY, USA, 2009; ISBN 9781402086632. [Google Scholar]
- Gudmundsson, S. General Aviation Aircraft Design: Applied Methods and Procedures, 1st ed.; Butterworth-Heinemann: Oxford, UK, 2014; ISBN 9781299847187. [Google Scholar]
- Airbus Customer Services. Getting to Grips with Aircraft Performance; Airbus: Blagnac Cedex, France, 2002. [Google Scholar]
- Schmitz, O.; Hornung, M. Methods for simulation and analysis of hybrid electric propulsion systems. CEAS Aeronaut. J. 2015, 6, 245–256. [Google Scholar] [CrossRef]
- Bijewitz, J.; Seitz, A.; Hornung, M. Power Plant Pre-Design Exploration for a Turbo-Electric Propulsive Fuselage Concept. In Proceedings of the Joint Propulsion Conference. 2018 Joint Propulsion Conference, Cincinnati, OH, USA, 9–11 July 2018; AIAA (The American Institute of Aeronautics and Astronautics), Ed.; AIAA (The American Institute of Aeronautics and Astronautics): Reston, VA, USA, 2018. ISBN 978-1-62410-570-8. [Google Scholar]
- Kaiser, S.; Seitz, A.; Donnerhack, S.; Lundbladh, A. Composite Cycle Engine Concept with Hectopressure Ratio. J. Propuls. Power 2016, 32, 1413–1421. [Google Scholar] [CrossRef]
- Mcbride, B.J.; Gordon, S. Computer Program for Calculation of Complex Chemical Equilibrium Compositions and Applications. Part 2: Users Manual and Program Description; NASA Lewis Research Center: Cleveland, OH, USA, 1996. [Google Scholar]
- Isikveren, A.T.; Seitz, A.; Bijewitz, J.; Mirzoyan, A.; Isyanov, A.; Grenon, R.; Atinault, O.; Godard, J.-L.; Stückl, S. Distributed propulsion and ultra-high by-pass rotor study at aircraft level. Aeronaut. J. 2015, 119, 1327–1376. [Google Scholar] [CrossRef]
- Seitz, A. Concept Validation Study for Fuselage Wake-Filling Propulsion Integration (CENTRELINE): H2020-MG-1.4–2016-2017: Breakthrough innovation, Proposal No. 723242, European Commission Directorate General for Research and Innovation. 2016. Available online: https://cordis.europa.eu/project/id/723242 (accessed on 10 June 2025).
- Bradley, M.K.; Droney, C.K. Subsonic Ultra Green Aircraft Research Phase II: N+4 Advanced Concept Development; NASA/CR-2012-217556; NASA: Hampton, VA, USA, 2012. [Google Scholar]
- Welstead, J.R.; Felder, J.L. Conceptual Design of a Single-Aisle Turboelectric Commercial Transport With Fuselage Boundary Layer Ingestion. In American Institute of Aeronautics and Astronautics (Hg.) 2016—AIAA SciTech Conference 2016; AIAA (The American Institute of Aeronautics and Astronautics): Reston, VA, USA, 2016. [Google Scholar]
- Welstead, J.; Felder, J.; Guynn, M.; Haller, B.; Tong, M.; Jones, S.; Gray, J.S.; Ordaz, I.; Quinlan, J.; Mason, B.; et al. Overview of the NASA STARC-ABL (Rev. B) Advanced Concept. In Proceedings of the One Boeing NASA Electric Aircraft Workshop, Washington, DC, USA, 22 March 2017; Available online: https://ntrs.nasa.gov/citations/20170005612 (accessed on 10 June 2025).
- Recine, C.; Pham, D.; Bowles, J.; Lyons, K.; Margolis, B.; Garcia, J.A. Analysis and Optimization of Baseline Single Aisle Aircraft for Future Electrified Powertrain Flight Demonstration Comparisons. In AIAA AVIATION 2023 Forum; AIAA AVIATION 2023 Forum, San Diego, CA and Online; AIAA (The American Institute of Aeronautics and Astronautics), Ed.; American Institute of Aeronautics and Astronautics: Reston, VA, USA, 2023; ISBN 978-1-62410-704-7. [Google Scholar]
- Wöhler, S.; Hartmann, J.; Prenzel, E.; Kwik, H. Preliminary Aircraft Design for a Midrange Reference Aircraft Taking Advanced Technologies into Account as Part of the AVACON Project for an Entry into Service in 2028; Deutsche Gesellschaft für Luft-und Raumfahrt-Lilienthal-Oberth eV: Bonn, Germany, 2019; Available online: https://www.dglr.de/publikationen/2019/480224.pdf (accessed on 30 November 2024).
- Wöhler, S.; Häßy, J.; Kriewall, V. Establishing the DLR-F25 as a Research Baseline Aircraft for the Short-Medium Range Market in 2035. In Proceedings of the 34th Congress of the International Council of the Aeronautical Sciences, Florence, Italy, 3–9 September 2024. [Google Scholar]
- Lammering, T.; Schneider, T.; Stumpf, E. The Right Single-Aisle for the Future Market. In Proceedings of the 53rd AIAA Aerospace Sciences Meeting, Kissimmee, FL, USA, 5–9 January 2015; AIAA (The American Institute of Aeronautics and Astronautics), Ed.; AIAA (The American Institute of Aeronautics and Astronautics): Reston, VA, USA, 2015. ISBN 978-1-62410-343-8. [Google Scholar]
- Fuchte, J.; Nagel, B.; Gollnick, V. Twin Aisle for Short Range Operations—An Economically Attractive Alternative? In Proceedings of the 12th AIAA Aviantion Technology, Integration, and Operations (ATIO) Conference and 14th AIAA/ISSM, Indianapolis, IN, USA, 17–19 September 2012; AIAA (The American Institute of Aeronautics and Astronautics), Ed.; AIAA (The American Institute of Aeronautics and Astronautics): Indianapolis, IN, USA, 2012. ISBN 9781600869303. [Google Scholar]
- David Debney. Zero Carbon Emission Aircraft Concepts FZO-AIN-REP-0007. 2022. Available online: https://www.ati.org.uk/wp-content/uploads/2022/03/FZO-AIN-REP-0007-FlyZero-Zero-Carbon-Emission-Aircraft-Concepts.pdf (accessed on 28 February 2025).
- Bradley, M.K.; Droney, C.K. Subsonic Ultra Green Aircraft Research: Phase I; NASA Technical Memorandum NASA/CR–2011-216847. 2011. Available online: https://ntrs.nasa.gov/archive/nasa/casi.ntrs.nasa.gov/20110011321.pdf (accessed on 28 February 2025).
- Chakraborty, I. Subsystem Architecture Sizing and Analysis for Aircraft Conceptual Design. Doctoral Dissertation, Georgia Institute of Technology, Atlanta, GA, USA, 2015. [Google Scholar]
- Todd, J.R.; Hay, J.A.; Dinh, T. Integrating Fly-By-Light/Power-By-Wire Flight Control Systems on Transport Aircraft. In Proceedings of the 12th DASC AIAA IEEE Digital Avionics Systems Conference, Fort Worth, TX, USA, 25–28 October 1993; IEEE (Institute of Electrical and Electronics Engineers): New York, NY, USA, 1993; pp. 457–462, ISBN 0780313453. [Google Scholar]
- Reducing the weight of aircraft interiors. Reinforced Plastics 2014, 58, 36–37. [CrossRef]

| Requirement | Value |
|---|---|
| Entry into service year | 2035 |
| Design range | 3000 nmi |
| Design the number of passengers (single-class) | 180 |
| Design payload | 18,000 kg |
| Maximum payload | 19,260 kg |
| Maximum operating Mach number | 0.82 |
| Initial cruise altitude | ≥FL330 |
| One-engine-inoperative ceiling altitude | FL170 |
| Maximum operating altitude | FL410 * |
| Take-off field length (MTOM, ISA, SL) | ≤2000 m |
| Landing field length (MLM, ISA, SL) | ≤1900 m |
| Second segment climb | 18,000 kg, DEN, ISA + 20 K ≥1000 nmi range |
| Time-to-climb | ≤25 minutes * |
| Airport compatibility | ICAO Code C Wingspan < 36 m |
| Parameter | Value | Source |
|---|---|---|
| Airframe structural component masses, except engine pylons | 0.9 | [45], BHL estimation |
| Engine pylon mass | 1.0 | BHL estimation |
| Wing aspect ratio | ≤12 | BHL estimation |
| Wave drag airfoil technology factor | 0.95 | [25] |
| Fly-by-light flight control system mass | 0.756 | [46,47] |
| Hydraulic system mass | 0 | [46] |
| Environmental control system mass | 1.7 | [46] |
| Electric system mass | 1.73 | [46] |
| Operator items & furnishings mass | 0.9 | [46,48], BHL estimation |
| Requirement | Value | Group |
|---|---|---|
| Approach speed at maximum landing mass | <140 KCAS | Wing |
| Payload-range capability | 3420 nmi, 15,120 kg | Wing |
| Take-off field length (MTOM, ISA, SL) | ≤2000 m | Engine |
| Second segment climb gradient (18,000 kg, DEN, ISA + 20 K, ≥1000 nmi range) | >2.4% <3657 m TOFL | Engine |
| OEI ceiling altitude SEP (ISA + 10, 95% MTOM) | >300 fpm | Engine |
| Service ceiling altitude SEP (ISA, 82% MTOM) | >300 fpm | Engine |
| Top-of-climb SEP (ISA + 10 K, TOC mass) | >300 fpm | Engine |
| Parameter | Unit | Top-of-Climb | Cruise | Take-Off |
|---|---|---|---|---|
| Mach number | [-] | 0.78 | 0.78 | 0.23 |
| Altitude | [m] | 10,668 | 10,668 | 0 |
| ISA temperature deviation | [K] | 10 | 0 | 0 |
| Streamtube thrust | [kN] | 19.8 | 17.0 | 94.2 |
| Net specific thrust | [m/s] | 86.8 | 74.9 | 164.9 |
| Streamtube TSFC | [g/s/kN] | 14.25 | 13.85 | 9.02 |
| Bypass ratio | [-] | 15.6 | 16.2 | 14.5 |
| Overall pressure ratio | [-] | 50.0 | 45.6 | 48.0 |
| Inlet mass flow (w2) | [kg/s] | 231 | 229 | 578 |
| Compressor exit temperature (T3) | [K] | 865 | 796 | 953 |
| Burner exit temperature (T4) | [K] | 1725 | 1568 | 1885 |
| Fuel-air ratio | [-] | 0.027 | 0.023 | 0.030 |
| Power offtake | [kW] | 175 | 175 | 175 |
| Parameter | Unit | HOPE-R | HOPE-BL |
|---|---|---|---|
| Wing area | m2 | 128.0 | 111.1 |
| Wing aspect ratio | - | 9.9 | 11.7 |
| Wing mean aerodynamic chord | m | 4.28 | 3.75 |
| Main landing gear length | m | 2.87 | 3.03 |
| Parameter | Unit | HOPE-R | HOPE-BL |
|---|---|---|---|
| Altitude | ft | 35,000 | 35,000 |
| Mach number | - | 0.78 | 0.78 |
| Lift coefficient (CL) | - | 0.57 | 0.57 |
| Drag coefficient (CD) | - | 0.0316 | 0.0291 |
| Lift-to-drag ratio (L/D) | - | 18.03 | 19.57 |
| Zero-lift drag coefficient (CD0) | - | 0.0172 | 0.0180 |
| Induced drag coefficient (CDi) | - | 0.0112 | 0.0091 |
| Wave drag coefficient (CDw) | - | 0.0020 | 0.0011 |
| Miscellaneous drag coefficient | - | 0.0012 | 0.0009 |
| Parameter | Unit | HOPE-R | HOPE-BL | Δ |
|---|---|---|---|---|
| Maximum take-off mass | kg | 79,000 | 69,990 | −11.4% |
| Maximum landing mass | kg | 67,400 | 60,191 | −10.7% |
| Operating empty mass | kg | 44,925 | 38,787 | −13.6% |
| Maximum fuel mass | kg | 18,729 | 14,131 | −24.6% |
| Parameter | Requirement | HOPE-BL |
|---|---|---|
| Approach speed at maximum landing mass | <140 KCAS | 128 KCAS |
| Take-off field length (MTOM, ISA, SL) | ≤2000 m | 1935 m |
| Second segment climb gradient (18,000 kg, DEN, ISA + 20, ≥1000 nmi range) | >2.4% <3657 m TOFL | 4.1% 2795 m TOFL 1500 nmi range |
| Time-to-climb * | 25 min | 28.2 min |
| OEI ceiling altitude SEP (ISA + 10 K, 95% MTOM) | >300 fpm | 300 fpm |
| Service ceiling altitude SEP (ISA, 82% MTOM) | >300 fpm | 500 fpm |
| TOC SEP (ISA + 10 K, TOC mass) | >300 fpm | 346 fpm |
| Mission | Unit | HOPE-R | HOPE-BL | Δ |
|---|---|---|---|---|
| Design mission * block fuel | kg | 14,338 | 11,276 | −21.4% |
| Typical mission ** block fuel | kg | 4013 | 3176 | −20.9% |
| Design mission * block energy per kg km | kJ/(kg km) | 6.57 | 4.83 | −26.5% |
| Typical mission ** block energy per kg km | kJ/(kg km) | 6.78 | 5.1 | −24.8% |
Disclaimer/Publisher’s Note: The statements, opinions and data contained in all publications are solely those of the individual author(s) and contributor(s) and not of MDPI and/or the editor(s). MDPI and/or the editor(s) disclaim responsibility for any injury to people or property resulting from any ideas, methods, instructions or products referred to in the content. |
© 2025 by the authors. Licensee MDPI, Basel, Switzerland. This article is an open access article distributed under the terms and conditions of the Creative Commons Attribution (CC BY) license (https://creativecommons.org/licenses/by/4.0/).
Share and Cite
Türkyilmaz, B.; Lüdemann, M.; Kolb, M.G.; Lessis, A. Design of a Short-To-Medium-Range Baseline Aircraft with an Entry into Service in 2035 for the HOPE Project. Aerospace 2025, 12, 585. https://doi.org/10.3390/aerospace12070585
Türkyilmaz B, Lüdemann M, Kolb MG, Lessis A. Design of a Short-To-Medium-Range Baseline Aircraft with an Entry into Service in 2035 for the HOPE Project. Aerospace. 2025; 12(7):585. https://doi.org/10.3390/aerospace12070585
Chicago/Turabian StyleTürkyilmaz, Barlas, Michael Lüdemann, Moritz Georg Kolb, and Alexandros Lessis. 2025. "Design of a Short-To-Medium-Range Baseline Aircraft with an Entry into Service in 2035 for the HOPE Project" Aerospace 12, no. 7: 585. https://doi.org/10.3390/aerospace12070585
APA StyleTürkyilmaz, B., Lüdemann, M., Kolb, M. G., & Lessis, A. (2025). Design of a Short-To-Medium-Range Baseline Aircraft with an Entry into Service in 2035 for the HOPE Project. Aerospace, 12(7), 585. https://doi.org/10.3390/aerospace12070585