Abstract
Repetitively pulsed (RP) laser propulsion is regarded as an alternative to chemical rockets for space launches, potentially offering remarkable cost reductions. Understanding the physics of laser-supported detonation (LSD) is important for designing a high-performance propulsion system. Experimentally observed LSD propagation velocities are reportedly lower than the Chapman–Jouguet (C-J) velocity; hence, a previous study that examined two-dimensional expansion behind the LSD to perform Hugoniot analysis using computational fluid dynamics (CFD) simulation resulted in strong detonation solution. In the present study, the effects of varying the relationship between heating and propagation velocity are investigated using CFD simulations. The findings indicate that a weak detonation solution was obtained with more realistic input of heating rate distribution and the pressure behind the LSD wave was lower than that in C-J detonation by a factor of three. The input LSD propagation velocity was changed by ±30% in the CFD simulation to examine the case of faster propagation in helium and slower propagation in argon and even so, a weak detonation mode was maintained. However, the input relaxation distance from the electron temperature to heavy particle temperature that is shorter in a light gas such as helium can produce a solution of C-J or strong detonation.
1. Introduction
Among the various beamed energy propulsion systems [1,2,3,4], repetitively pulsed (RP) laser propulsion systems have been proposed as alternatives to chemical launchers. In such systems, a high-power laser beam emitted from ground-based facilities is concentrated on the flight vehicle (Figure 1). The beam ionizes the atmosphere ingested to the vehicle. Electrons in the ionized atmosphere absorb the laser energy via the inverse Bremsstrahlung. Subsequently, the ionization front propagates, converting the energy into fluid enthalpy. With sufficiently high laser intensity, the ionization front propagates at supersonic velocity and induces shock waves. The phenomenon is called laser-supported detonation (LSD) [5] by analogy, with detonations caused by combustion in a premixed gas. The pressure increase caused by compression from the detonation wave generates thrust. By alternately repeating thrust generation and air-breathing processes, the system functions as a pulsed detonation engine (PDE), and its thruster shapes and performance have been analyzed [6,7,8,9,10]. The system requires neither onboard propellant nor pumping systems. Therefore, it has the potential to reduce the sum of manufacturing and launch costs to 1/100 that of conventional chemical rockets [11]. To design a high-performance laser propulsion system, the main challenge is quantitative estimation of the propagation velocity of LSD waves and prediction of the pressures underlying the waves without the need for full-scale experiments.
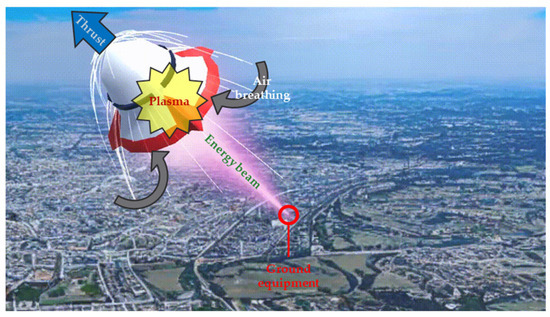
Figure 1.
The schematic diagram of the beamed energy propulsion system.
Chemical detonations generally follow the Zeldovich–von Neumann–Döring (ZND) structure [12], by which heating because of combustion and shock waves mutually drive each other. In this structure, the amount of heating and the shock propagation velocity are interrelated. The system reaches a steady state at the Chapman–Jouguet (C–J) condition, where entropy is maximized. In contrast, the mechanism governing the propagation velocity of the ionization front in LSD remains unclear. The system has the potential to propagate at the C–J velocity or even at an overdriven detonation velocity in a steady state.
Several theories have been proposed to explain the mechanism governing the ionization wavefront and its propagation velocity. Nevertheless, no definitive physical model has been established. Ramsden et al. first observed plasma expansion induced by laser focusing [13]. Raizer proposed three independent models (breakdown wave, detonation wave, and radiation wave) [14], arguing that if the effect of the detonation wave model is more dominant than the other models, a ZND structure can be assumed, such as chemical detonation, and the detonation will propagate at the C–J velocity. By contrast, if other propagation mechanisms dominate, the detonation might propagate faster than the C–J velocity. Analyses of LSD have been conducted to examine the detonation mode [15,16].
Matsui et al. conducted experiments using a large-diameter laser to obtain an accurate relation between the LSD propagation velocity and laser intensity minimizing the beam diameter effect [17,18]. The results show that the measured LSD propagation velocity is significantly lower than the one-dimensional C–J velocity predicted by Raizer [14]. Takeda et al. pointed out that advection in the lateral direction relative to the laser beam channel is important. They concluded that approximately 80% advection from the laser beam channel was necessary for the existence of a steady detonation solution [19]. Arai et al. showed in their calculations that the fluid energy is lower near the central axis [20].
Because of the absence of confinement, unlike chemical detonation in a tube, LSD propagation in open spaces induces strong shock waves outside the laser channel. Therefore, the effect must be incorporated into the analysis. Sugamura et al. investigated the two-dimensional flow using axisymmetric computational fluid dynamics (CFD) simulations and conducted the Hugoniot analysis modified using lateral advection fractions [21]. The findings suggest that the LSD might be in a strong overdriven detonation mode.
As described above, the relationship between the heating and propagation velocity is important to ascertain what propagation mode will occur during a detonation. For example, millimeter-wave supported detonation (MSD), a type of optical detonation generated by a millimeter-wave, is suggested to be a weak overdriven detonation mode [22]. MSD propagates much faster than LSD with the same beam intensity; therefore, LSD has the potential to result in different detonation modes.
In this study, by varying the relationship of the heating and the propagation velocity on CFD simulations, its effects on detonation modes and the resulting pressure underlying the LSD are assessed.
2. Numerical Methods
2.1. Governing Equations
The governing equations follow Sugamura’s CFD model [21]. The calculations solve two-dimensional axisymmetric Euler equations discretized by the upwind finite-difference scheme. Note that it does not fully reproduce oblique or asymmetric pressure gradients that may exist in a real three-dimensional flow. The spatial accuracy is extended to be third-order by MUSCL (Monotonic Upwind Scheme for Conservation Laws) interpolation. Additionally, to suppress the carbuncle phenomenon, which tends to occur along the central axis of bow shocks, the SLAU (Simple Low-dissipative AUSM) scheme [23] is used for the flux evaluation with the minmod flux limiter. The governing equations are written as
2.2. Heating Rate Distribution
The propagation physics of the ionization front in LSD is still not fully understood. In the CFD simulations, the laser power is constant through the simulation time and adjusted so that the peak laser intensity becomes 600 GW/m2. The LSD is modeled to be a heating rate distribution q = q(r,z) [W/m3] of the energy source term W in Equation (1), as presented in Figure 2, generated by the laser, which propagates in the axial direction with the LSD velocity given by Matsui’s experiment [18] as
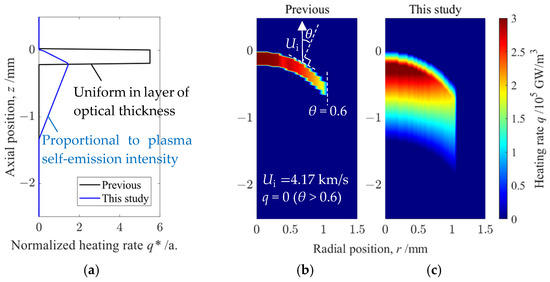
Figure 2.
(a) Normalized axial heating rate q*(r) in a previous study (black line) and in this study (blue line). The value is normalized so that the integral value is equal to the unit heating rate [W/m2]. To obtain the absolute distribution q(r,z), it is multiplied by ηS(r) (Equation (3)). (b) Input q(r,z) in the CFD of the previous study. q*(r) was given by (a) and axially uniform in the layer of optical thickness. The white arrows indicate the propagation direction of the heating region in the simulation. θ represents the angle of the wavefront relative to the propagation direction, and heating does not input in the region where cos θ is larger than 0.6. (c) Input q(r,z) in the CFD of this study. q*(r) is given by (a) as proportional to the measured self-emission intensity distribution. The other conditions are the same as (b).
The origin of the axial coordinate system q(0, 0) is fixed to the front and center of the heating region and propagates in velocity Ui. In this study, Speak = 600 GW/m2 and accordingly Ui = 4.17 km/s are the input parameters in the CFD simulation. The r-distribution of the heating rate q(r,z) [W/m3] is determined from the laser intensity distribution S(r) [W/m2] given by Sugamura’s experiment [21] and normalized z-distribution of heating rate q*(z) to satisfy
For this study, the uniform blast wave energy efficiency η is set as 0.38, which was deduced by the method comparing the observed blast wave propagation history with Sedov’s self-similar point blast solution, proposed by Mori et al. [24,25]. The position of the ionization front zi(r) is determined using Matsui’s oblique LSD relation [18], written as
Therein, θ(r) denotes the angle between the oblique ionization front and the direction of LSD propagation (Figure 2b).
To examine the effects of the heating rate distribution on the Hugoniot analysis, the normalized z-distribution of the heating rate q*(z) is updated. In Sugamura’s calculation [21], the heating layer thickness was identical to the optical thickness of the CO2 laser in the air plasma, assuming local thermodynamic equilibrium and instantaneous relaxation from the electron temperature to the translational temperature of the heavy particles. This assumption produced a gap separating the shock wave and the heating region and causing lateral mass advection though the gap. However, no such gap has been observed in experiments. Therefore, a more realistic distribution must be given to analyze the two-dimensional flow of LSD. For this study, the laser energy is first assumed to be absorbed by electrons through the inverse Bremsstrahlung process. Subsequently, it is converted into fluid enthalpy via relaxation processes. The relaxation from the electron temperature to the translational temperature of heavy particles occurs gradually, accompanied by radiative depopulation. Therefore, q*(z) is assumed to be proportional to the plasma self-emission intensity distribution. For the simulation, a self-emission intensity distribution measured at Speak = 600 GW/m2 is used to determine the axial heating distribution produced by the relaxation. Figure 2a compares q*(z) found from Sugamura’s calculation [21] and from this study. These distributions are normalized so that the axial integral is equal to the unit heating rate q(r,z) [W/m2]; it is multiplied by ηS(r) to obtain the absolute values as presented, respectively, in Figure 2b,c.
2.3. Computational Domain
The computational domain is a rectangle, sufficiently larger than the domains shown in figures, to ensure that the phenomenon does not reach the boundaries, except for the axisymmetric boundary (Figure 3). The size of the calculation region is 20 mm for axial and 10 mm for radial. In the figures, the left side is an axisymmetric boundary. The other sides that are distant from the phenomenon are outflow boundaries. A heating region propagates from the bottom to the top of the computational domain. The axial grid size Δz is uniform to capture the steady state of LSD propagating in the axial direction. The radial grid size Δr is smallest and Δr = Δz on the axis; it increases gradually toward the outer boundary to calculate faster. The characteristic length scale to resolve is the axial width of the shock front (~200 μm) and the radial width of the heating region (~1 mm). To examine the mesh convergence, the cases of grid size on the axis ∆r = ∆z = 200, 100, 50, 25, 12.5 μm are calculated to resolve the width of the shock front.
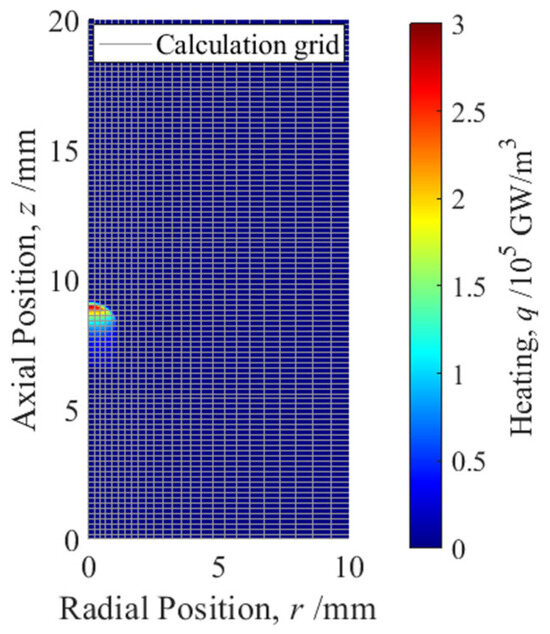
Figure 3.
The computational domain and the grid size of the CFD simulation. The grid is represented by gray lines, and the size is the case of ∆r = ∆z = 200 μm on the axis, which is the coarsest setting. The heating distribution is shown in the colormap, and the heating region propagates upward at a speed determined by Equation (2). The left side is an axisymmetric boundary, and the other boundaries are outflow boundaries.
2.4. Changes in Gas Constant and the Specific Heat Ratio
Next, we examined the effects of variations in the gas constant and specific heat ratio. The initial gas state parameters are set to air at 288.15 K and 1.0 atm with a specific heat ratio of γ1 = 7/5 and R1 = 287.15 J/kg-K and Sugamura’s calculation neglected air dissociation [21]. For this study, γ = 5/3 and R = 2R1 are assumed because diatomic nitrogen (N2) and oxygen (O2) molecules are regarded as fully dissociated immediately behind the shock front because of compression. At each time step, the shock front is determined as the discontinuity of the density and the gas constant distribution is updated. Note that the characteristics of plasma, such as ionization reactions, radiation loss, and plasma transport properties, are not considered in the present model. Nevertheless, no significant deviations are expected in the Hugoniot analysis because the computed pressure and enthalpy behind the LSD wave are computed based on the measured detonation wave propagation velocity and the measured blast wave energy efficiency as explained in Section 2.2.
2.5. Hugoniot Analysis for the Quasi-One-Dimensional Control Volume
To analyze the detonation mode, a Hugoniot analysis is conducted. Because the two-dimensional effects are not negligible in the LSD analysis, Sugamura et al. modified one-dimensional Hugoniot analysis taking the control volume on the central axis by evaluating the lateral advection [21]. In this study, Hugoniot analysis is expected to capture the phenomenon more accurately by extending the control volume to the radial direction. Figure 4a presents an example CFD simulation result for an LSD, showing the input heating rate as a color map and a yellow outline and the position of shock front as a blue dashed line. The streamlines are drawn as solid white lines that expand laterally more toward the end of the heated region. By defining the inside of a certain streamline as the control volume, as presented in Figure 4a as the orange region, the conservation equations for the inside of an expanding tube are formulated as
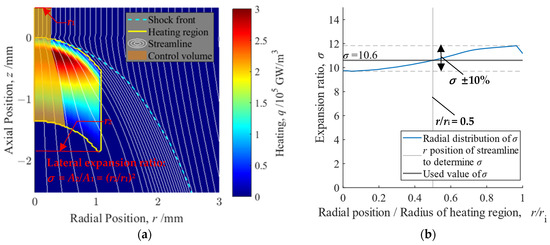
Figure 4.
(a) The definition of control volume for the Hugoniot analysis is shown as the orange region. The two-dimensional effect is evaluated as the lateral expansion ratio σ = A2/A1 = (r2/r1)2 of a certain streamline. The front of the control volume is defined as an initial state of gas and is given as a z-plane sufficiently far forward of the wavefront. The end of control volume is defined as the end of the heating region shown as the yellow outline. (b) Distribution of the value of σ depends on the position of the streamline through the end of the control volume. σ used for the Hugoniot analysis is obtained from the streamlines passing through the r/ri = 0.5 position, where the error is within 10% and so that the error in the back pressure evaluation will be within 10%.
In those equations, σ represents the lateral expansion ratio, the parameter indicating the significance of the two-dimensional effect. Equation (5) is the conservation equation of mass. Also, Equation (6) is the conservation equation of the momentum. The third term on the left-hand side represents the force acting on the side boundary of the control volume, which is computed automatically as the difference between the first term of the left-hand side and the term in the right-hand side. Equation (7) is the conservation equation of the enthalpy, for which the second term on the left-hand side represents the total heating inside the control volume.
To determine which streamline should be used for the Hugoniot analysis, Figure 4b shows the distribution of the value of σ depending on the position of the streamline through the end of the control volume. The horizontal axis is the relative position normalized by the radius of the heating region. The difference from the value at the central axis is as much as 10% at r/ri = 0.5 and as much as 20% at r/ri = 1. σ is obtained from the streamlines passing through the r/ri = 0.5 position so that the error in the back pressure evaluation is within 10% because of the error in σ. In this example, σ = 10.6; also, in Figure 4a, the used streamline to obtain σ is shown as the outline of the control volume.
3. Results and Discussion
3.1. Flow Field
From the calculations, the input of heating W and the result of pressure p, the density ρ, and temperature T are shown as color maps in Figure 5. The axial coordinate system is fixed relative to the front of the heating region. The positions of the shock front and sonic surface (contour of relative Mach number is 1) and streamlines are drawn on each color map. These calculations provided steady-state results. To examine the grid convergence based on these results, the grid size on the axis is changed. Here, pressure on the end of the control volume p2 and lateral expansion ratio σ converged at grid widths of ∆r = ∆z = 25 μm or less on the axis. These variables were adopted as index values for the axial and the radial grid convergence, respectively. Therefore, the analysis is conducted using the result in the condition of the ∆r = ∆z = 25 μm grid on the axis.
The gap separating the heating region and the shock front observed in Sugamura’s calculation has been eliminated, providing better agreement with observations from experimentation. This is because the heating rate near the shock wave was moderated by changing the method to determine the heating rate distribution. The simulation result approached the experimental observations (Figure 5a). The pressure discontinuity coincides with the front edge of the heating region, confirming that the pressure rise is attributable to shock wave compression (Figure 5b). The shock wave density peak is not on the central axis (Figure 5c) because the shock wave overlaps on the heating region where the temperature is extremely high (Figure 5d). The temperature rises to exceed 5000 K immediately behind the shock wave. Therefore, the assumption of complete dissociation is not a problem. The streamlines expand laterally as they go downward and are concentrated on the side of the shock wave.
3.2. Hugoniot Analysis
The Hugoniot diagram is modified to reflect changes in the conservation equations (Equations (5)–(7)). The Rayleigh line equation is written as follows by eliminating u2 from Equations (5) and (6).
The equation of the Hugoniot curve is written as shown below by eliminating u1, u2 from Equations (5)–(7).
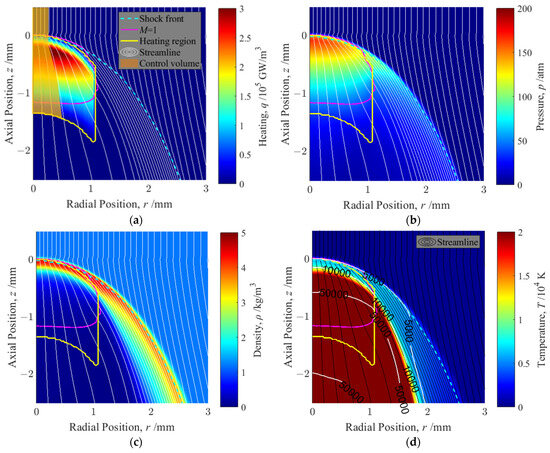
Figure 5.
(a) Input heating W and results for the position of shock front, sonic surface, and streamlines shown in the coordinate system fixed in the front of the heating region. Other color maps portray results for (b) pressure p, (c) density ρ, and (d) temperature T. Blue dashed lines show the positions of density peaks as the shock front of LSD. Pink lines show the M = 1 contour line of the relative Mach number to the shock front.
The Hugoniot diagram is drawn by application of p, ρ, and u in the front and end of the control volume (subscripts 1 and 2) to Equations (8) and (9), as shown in Figure 6a. The blue lines are the Rayleigh lines. The green lines are the Hugoniot curve. The black line is the shock adiabat. The Rayleigh line and Hugoniot curve do not move in one-dimensional detonation, but in LSD, both lines move to the right (low density ρ side) as lateral expansion σ increases, changing their relationship in position. When σ = 1 in Figure 6a, the analysis is one-dimensional. There is no intersection between the Rayleigh line and the Hugoniot curve, as shown by Takeda et al. [19]. At the obtained value of σ = 10.6, intersections exist. It is the lower solution within the intersection of the Rayleigh line and the Hugoniot curve. Therefore, the result is a weak overdrive detonation. The mode of the detonation solution depends on whether the sonic surface (the M = 1 contour line in Figure 5a) or the heating region is farther back. In Sugamura’s calculation [21], the heating region was short and was located in front of the sonic surface, resulting in strong overdrive detonation. By contrast, in this study, the heating region ends behind the sonic surface, as depicted in Figure 5a, resulting in weak overdrive detonation. For this analysis, back pressure p2/p1 = 8.60, while by assuming C-J detonation (the sonic surface coincides with the end of the heating region) as chemical detonations, it would lead to p2/p1 = 24.0 in Figure 6a, which overestimates p2 by a factor of approximately three. Therefore, one approach to improving performance would be to design the wall of the thruster to effectively suppress lateral expansion.
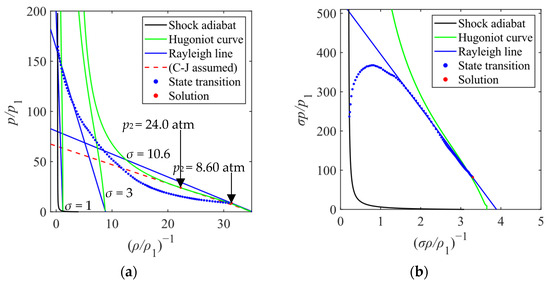
Figure 6.
(a) The Hugoniot diagram of LSD. The Hugoniot curve (green line) is drawn by application of σ2 to Equation (9). The Rayleigh line (blue lines) drawn by Equation (8) moves to the right as σ increases. (b) The Hugoniot diagram has axes normalized by the changing expansion ratio σ to remove effects of expansion from the diagram. The gas state (blue dots) always transitions along a fixed Rayleigh line (blue solid line) drawn as a fit line of the dots of the state transition, which is similar to a one-dimensional Hugoniot diagram.
Figure 6b is a Hugoniot diagram normalized by σ to eliminate effects of lateral expansion. Although the force of the third term on the right-hand side of Equation (8) (the third term on the left-hand side of Equation (6)) has a strong influence immediately behind the shock wave and although the graph becomes a curve, gas states (red plots) almost transition on a fixed Rayleigh line. Therefore, Figure 6b can be discussed as similar to a one-dimensional Hugoniot diagram. It can be said that the propagation velocity of the LSD is insufficiently large for the slope of the Rayleigh line (proportional to the propagation velocity) to be tangent to the Hugoniot curve. However, the Rayleigh line and the Hugoniot curve have some intersection, which explains the result reported from Matsui’s experiment [18], indicating that the LSD is maintained at a propagation velocity slower than the C-J velocity. The solution corresponds to a weak detonation mode (not overdriven because the propagation velocity is slower than the C-J velocity for this analysis method), which is typically not possible in one-dimensional detonation unless entropy-reducing reactions occur. However, the lateral expansion moves the gas state to the right side of the graph as portrayed in Figure 6a. The gas state can reach the lower solution without decreasing entropy. In conventional analysis of overdriven detonations, solving the Hugoniot relation produces two solutions for which it is impossible to tell which is real. However, in this case, the solution is uniquely determined to be a weak detonation mode.
3.3. Effect of the Varying Relationship Between Heating and Propagation Velocity
This section presents an examination of the range of conditions under which the conclusions of the analysis remain valid. First, because the propagation velocity of LSD is known to vary depending on the atmospheric conditions [26,27,28], the calculation results are presented in Figure 7 for the same heating input with the changed propagation velocity. If Speak > 200 GW/m2, then LSD propagates faster in helium and slower in argon [27]. Figure 7a was input 30% faster than Matsui’s measurement; Figure 7b was input 30% slower. The axial coordinate system is fixed relative to the front of the heating region, allowing a comparison of the shock wave and sonic surface positions.
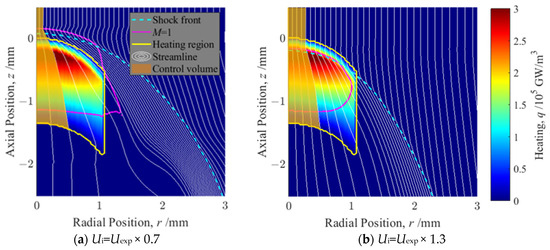
Figure 7.
Input heating W and result with changed propagation velocity Ui for the position of the shock front, sonic surface, and streamlines shown in the coordinate system fixed in the front of the heating region. The color map shows the input heating and distribution; propagation velocity Ui is (a) Ui = Uexp × 0.7, and (b) Ui = Uexp × 1.3.
The position of the shock wave, as indicated by the blue dashed line, moves backward as the propagation velocity increases. Also, it moves forward as the propagation velocity decreases. As presented in Figure 7a, no LSD has been observed, which has a gap separating the heated region and the shock wave. This finding suggests that the gap might be regulated by interactions between the plasma and the shock wave, which might not be fully captured by Euler equation-based simulations alone. However, the phenomenon by which the heated region moves ahead of the shock wave, as presented in Figure 7a, has been observed from experiments and simulations of MSD, which has a higher propagation velocity than that achieved with LSD. Therefore, the possibility exists that a similar structure can be reproduced in LSDs depending on the propagation velocity. The end of the sonic surface position, represented by the solid pink line, is less affected by the propagation velocity than the shock wave. In both results, Hugoniot diagrams similar to Figure 6b can be drawn. The weak detonation mode is maintained because the end of the sonic surface is ahead of the heated region.
Second, because the length of the axial heating distribution is determined by the relaxation distance of the electron temperature to the heavy particle temperature, one can consider the case in which the heating distribution length differs according to the type of gas. For the same amount of heating, if the molecules are heavy, such as argon, then the particle velocity will be low and the relaxation distance will be large. If the molecules are light, such as helium, then the particle velocity will be low and the relaxation distance will be small. The results obtained for different widths of the heating region are depicted in Figure 8. For the same laser intensity Speak = 600 GW/m2, Figure 8a,b presents the results of calculations with l = 0.50 mm and l = 0.35 mm as the width of the axial heating region.
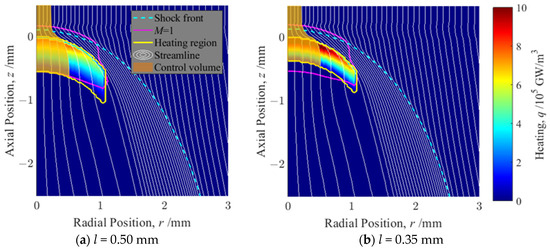
Figure 8.
Input heating W and result for position of shock front, sonic surface, and streamlines shown in coordinate system fixed in the front of heating region. The color maps show the input heating and distribution. The axial lengths of heating region l are (a) 0.50 mm and (b) 0.35 mm.
The shock wave position, shown by the blue dashed line, shifts forward as the heating region becomes shorter. For conditions shorter than l = 0.50 mm, a gap separates the shock wave and the heating region, as in Sugamura’s calculation. The position of the end of the sonic surface, as represented by the solid pink line, also moves forward as the heating region becomes shorter, coinciding with the end of the heating region at l = 0.50 mm, resulting in C-J detonation: all longer cases show a weak detonation.
The detonation mode of an LSD is determined such that the position of the end of heating region is above or below the sonic surface (contour of M = 1 shown in color maps). As depicted in Figure 8b, if the end of the heating region lies ahead of the sonic surface, then the relative flow speed to the LSD propagation is subsonic, and the solution is strong detonation, as a result of Sugamura’s calculation [21]. If the end of the control volume is on the sonic surface, then the relative flow speed is sonic and the solution is C-J detonation as chemical detonations. If the end of the control volume is below the sonic surface, then the relative flow speed is supersonic and the solution is weak detonation.
4. Conclusions
In this study, the detonation mode and the resulting pressure behind the LSD wave are examined by varying the relationship between heating and propagation velocity on CFD simulations. The heating distribution predicted from the measured propagation velocity and the plasma self-emission intensity distribution is input for the CFD simulation. By modifying the Hugoniot analysis by defining a lateral expansion ratio σ, a weak detonation solution is obtained. The pressure behind the LSD wave is lower than that in C-J detonation by a factor of three. The range of conditions under which these conclusions would not change is examined, assuming different gas species. Because LSD propagates faster in helium and more slowly in argon, the input propagation velocity is changed by ±30%. The results show that the weak detonation mode is maintained. However, if the relaxation distance from electron temperature induced by laser heating to heavy particle temperature becomes shorter using a light gas such as helium, then a solution of C-J or strong detonation is obtainable. Although the model does not incorporate detailed plasma properties, the use of the measured detonation wave propagation velocity and the measured blast wave energy efficiency ensures the accuracy of the Hugoniot analysis in this laser propulsion system.
Author Contributions
Conceptualization, Y.I., K.K. (Kyohei Kato) and K.K. (Kimiya Komurasaki); formal analysis, Y.I.; investigation, Y.I., K.K. (Kyohei Kato) and K.K. (Kimiya Komurasaki); writing—original draft preparation, Y.I.; writing—review and editing, H.S. and H.K.; supervision, K.K. (Kimiya Komurasaki); funding acquisition, K.K. (Kimiya Komurasaki). All authors have read and agreed to the published version of the manuscript.
Funding
This research was supported by JSPS KAKENHI Grant Number JP20H02344.
Data Availability Statement
The data that support the findings of this study are available from the corresponding author upon reasonable request.
Acknowledgments
I would like to express my deepest gratitude to Kimiya Komurasaki for his advice and discussions throughout this research.
Conflicts of Interest
The authors declare that they have no conflicts of interest.
Nomenclature
| A | cross-sectional area of control volume, m2 |
| E | flux vector |
| e | internal energy, J/kg |
| F | flux vector |
| H | flux vector |
| l | axial length of heating region, mm |
| p | pressure, atm |
| pVN | pressure at von Neumann point, atm |
| Q | conserved vector |
| q | heating rate, W/m3 |
| r | radial position, m |
| S | local laser intensity, W/m2 |
| Speak | laser intensity on axis, W/m2 |
| Ui | propagation velocity of ionization front, m/s |
| u | axial velocity, m/s |
| V | control volume |
| v | radial velocity, m/s |
| W | source term vector |
| z | axial position, m |
| zi | axial position of an ionization front, where is the front of the heating region, m |
| β | exponential coefficient for propagation velocity of ionization front Ui |
| η | conversion efficiency of laser energy to fluid enthalpy |
| specific heat ratio | |
| ρ | density, kg/m3 |
| ratio of cross-sectional area A2/A1 | |
| θ | local angle of ionization wavefront, rad |
Subscripts
| i | ionization front |
| 1 | front of the control volume, which is the initial state of the atmosphere in front of the shock wave of LSD |
| 2 | end of the control volume, which is end of the heating region |
References
- Komurasaki, K.; Wang, B. Laser Propulsion; John Wiley & Sons, Ltd.: Chichester, UK, 2010. [Google Scholar]
- Mori, K.; Oda, Y.; Masayuki, T.; Shimamura, K. Beamed-Mobility Engineering: Wireless-Power, Beaming to Aircraft, Spacecraft and Rockets; Springer Nature: Cham, Switzerland, 2024. [Google Scholar]
- Myrabo, L.N. Brief History of the Lightcraft Technology Demonstrator (LTD) Project. AIP Conf. Proc. 2003, 664, 49–60. [Google Scholar]
- Kare, J.T. Laser-powered heat exchanger rocket for ground-to-orbit launch. J. Propul. Power 1995, 11, 535–543. [Google Scholar] [CrossRef]
- Raizer, Y.P. Laser-Induced Discharge Phenomena; Consultants Bureau: New York, NY, USA, 1977. [Google Scholar]
- Katsurayama, H.; Komurasaki, K.; Momozawa, A.; Arakawa, Y. Numerical and Engine Cycle Analyses of a Pulse Laser Ramjet Vehicle. Trans. JSASS 2003, 1, 9–16. [Google Scholar] [CrossRef]
- Mori, K.; Komurasaki, K.; Arakawa, Y. Nozzle Scale Optimum for the Impulse Generation in a Laser Pulsejet. J. Spacecr. Rocket. 2004, 41, 887–889. [Google Scholar] [CrossRef]
- Katsurayama, H.; Komurasaki, K.; Hirooka, Y.; Mori, K.; Arakawa, Y. Numerical Analyses of Exhaust and Refill Processes of a Laser Pulse Jet. J. Propul. Power 2008, 24, 999–1006. [Google Scholar] [CrossRef]
- Wang, B.; Han, T.; Michigami, K.; Komurasaki, K.; Arakawa, Y. Thrust Measurement of Laser Detonation Thruster with a Pulsed Glass Laser. AIP Conf. Proc. 2011, 1402, 282–289. [Google Scholar]
- Wang, B.; Michigami, K.; Komurasaki, K. Thrust Measurement for Laser-Detonation Propulsion with a Solid-State Laser. J. Propul. Power 2013, 29, 276–278. [Google Scholar] [CrossRef]
- Katsurayama, H.; Komurasaki, K.; Arakawa, Y. A preliminary study of pulse-laser powered orbital launcher. Acta Astronaut. 2009, 65, 1032–1041. [Google Scholar] [CrossRef]
- Lee, J.H. The Detonation Phenomenon; Cambridge University Press: Cambridge, UK, 2008; pp. 75–97. [Google Scholar]
- Ramsden, S.A.; Davies, W.E.R. Radiation Scattered from the Plasma Produced using a Focused Ruby Laser Beam. Phys. Rev. Lett. 1964, 13, 227–229. [Google Scholar] [CrossRef]
- Raizer, Y.P. Heating of a Gas by Powerful Light Pulse. Sov. Phys. JETP 1965, 21, 1009–1017. [Google Scholar]
- Shimamura, K.; Matsui, K.; Ofosu, J.A.; Yokota, I.; Komurasaki, K. Mode transition of plasma expansion for laser induced breakdown in Air. Appl. Phys. Lett. 2017, 110, 134104. [Google Scholar] [CrossRef]
- Shimamura, K.; Ofosu, J.A.; Fukunari, M.; Komurasaki, K. A weak overdriven detonation mode for laser-produced plasma. In Proceedings of the Abstracts ICOPS, San Francisco, CA, USA, 16–21 June 2013. [Google Scholar]
- Matsui, K.; Shimano, T.; Ofosu, J.A.; Komurasaki, K.; Schoenherr, T.; Koizumi, H. Accurate propagation velocity measurement of laser supported detonation waves. Vacuum 2017, 136, 171–176. [Google Scholar] [CrossRef]
- Matsui, K.; Komurasaki, K.; Kanda, K.; Koizumi, H. Observation of Oblique Laser-Supported Detonation Wave Propagating in Atmospheric Air. Aerospace 2024, 11, 327. [Google Scholar] [CrossRef]
- Takeda, R.; Kanda, K.; Matsui, K.; Komurasaki, K.; Koizumi, H. Hugoniot Analysis of Laser Supported Detonation Using Measured Blast Wave Energy Efficiency. J. IAPS 2020, 28, 34–40. [Google Scholar]
- Arai, T.; Matsui, K.; Kitagawa, K. Construction of the Calculation Model to Clarify the Energy Conversion Ratio in the Entire Area of an LSD Wave. J. Evol. Space Act. 2024, 2, 191. [Google Scholar]
- Sugamura, K.; Kato, K.; Komurasaki, K.; Sekine, H.; Itakura, Y.; Koizumi, H. Hugoniot Relation for a Bow-Shaped Detonation Wave Generated in RP Laser Propulsion. Aerospace 2023, 10, 102. [Google Scholar] [CrossRef]
- Shimada, Y.; Shibata, T.; Yamaguchi, T.; Oda, Y.; Kajiwara, K.; Takahashi, K.; Kasugai, A.; Sakamoto, K.; Komurasaki, K.; Arakawa, Y. Propagating Structure Of A Microwave Driven Shock wave Inside A Tube. AIP Conf. Proc. 2010, 1230, 366–376. [Google Scholar]
- Shima, E. Simple Compressible CFD Solvers’ Story. J. Jpn. Soc. Fluid Mech. Nagare 2015, 34, 67–79. [Google Scholar]
- Mori, K.; Komurasaki, K.; Arakawa, Y. Energy transfer from a laser pulse to a blast wave in reduced-pressure air atmospheres. J. Appl. Phys. 2004, 95, 5979–5983. [Google Scholar] [CrossRef]
- Wang, B.; Komurasaki, K.; Yamaguchi, T.; Shimamura, K.; Arakawa, Y. Energy conversion in a glass-laser-induced blast wave in air. J. Appl. Phys. 2010, 108, 124911. [Google Scholar] [CrossRef]
- Shimamura, K.; Komurasaki, K.; Ofosu, J.A.; Koizumi, H. Precursor Ionization and Propagation Velocity of a Laser-Absorption Wave in 1.053 and 10.6-µm Wavelength Laser Radiation. IEEE Trans. Plasma Sci. 2014, 42, 3121–3128. [Google Scholar] [CrossRef]
- Shimano, T.; Ofosu, J.A.; Matsui, K.; Komurasaki, K.; Koizumi, H. Laser-Induced Discharge Propagation Velocity in Helium and Argon Gases. Trans. JSASS 2017, 60, 378–381. [Google Scholar] [CrossRef]
- Ofosu, J.A.; Matsui, K.; Kanda, K.; Komurasaki, K.; Koizumi, H. Applicability of 1-D Laser-Induced Discharge Model to Discharges Extending in Large Beam Diameters: A Case Study in Helium Gas. Front. Appl. Plasma Technol. 2018, 11, 2. [Google Scholar]
Disclaimer/Publisher’s Note: The statements, opinions and data contained in all publications are solely those of the individual author(s) and contributor(s) and not of MDPI and/or the editor(s). MDPI and/or the editor(s) disclaim responsibility for any injury to people or property resulting from any ideas, methods, instructions or products referred to in the content. |
© 2025 by the authors. Licensee MDPI, Basel, Switzerland. This article is an open access article distributed under the terms and conditions of the Creative Commons Attribution (CC BY) license (https://creativecommons.org/licenses/by/4.0/).