Article

Study on Multi-Heat-Source Thermal Management of Hypersonic Vehicle Based on sCO2 Brayton Cycle

Research Institute of Aero-Engine, Beihang University (Shahe Campus), Beijing 100191, China
*
Author to whom correspondence should be addressed.
Aerospace 2025, 12(7), 575; https://doi.org/10.3390/aerospace12070575
Submission received: 30 May 2025 / Revised: 18 June 2025 / Accepted: 20 June 2025 / Published: 25 June 2025
(This article belongs to the Special Issue Aircraft Thermal Management Technologies)

Abstract

To address the thermal protection challenges of multiple high-temperature components and the electrical power deficiency in hypersonic vehicles, this study proposes twelve multi-heat-source thermoelectric conversion schemes based on the sCO2 Brayton cycle. A three-dimensional evaluation system for thermal management is established, incorporating thermal efficiency, coolant mass flow rate, and system mass as key metrics. A comprehensive parameter sensitivity analysis was conducted on the twelve dual-heat-source cycle configurations. For systematic performance comparison, the Non-dominated Sorting Genetic Algorithm II (NSGA-II) was employed for multi-objective optimization, with Pareto fronts analyzed to determine optimal configurations. The results demonstrate that appropriately increasing the minimum cycle temperature can significantly reduce coolant flow requirements. Multi-objective optimization reveals the following: (1) The pre-compressed aero-comb configuration achieves optimal performance in the efficiency-mass flow rate optimization scenario; (2) Both pre-compressed aero-comb and re-compressed comb-aero configurations show superiority in the efficiency-mass optimization scenario; (3) The pre-compressed aero-comb configuration exhibits lower system mass in low coolant flow regions for the mass flow rate-mass optimization scenario. Overall, the performance of the precompression aero-comb configuration is relatively superior. This work provides an important reference for the design of thermal management systems for hypersonic vehicles.

1. Introduction

Hypersonic vehicles, as next-generation aircraft capable of achieving speeds above Mach 5 within the atmosphere, demonstrate tremendous application potential. In civilian domains, they enable rapid material delivery and logistics replenishment, while militarily, they facilitate high-altitude reconnaissance and strategic strike missions [1]. However, two critical challenges emerge in hypersonic vehicle design: thermal management and electrical power deficiency.
Hypersonic vehicles typically need to manage thermal loads from three primary sources: the aerodynamic leading edges, the scramjet combustion chamber walls, and the avionics bay. External aerodynamic heat loads are concentrated at the leading edges, such as the wing leading edges, the nose cone, and the lip of the scramjet inlet [2]. For the aerodynamic leading edges, Japan’s JAXA simulated the heat load on the vehicle surface at Mach 5 and found that the heat flux at the leading edges of the fuselage and wings could reach 40 kW/m2 [3]. Liu [4], in studying the thermal management of the nose cone using heat pipes at Mach 8, reported that even with thermal conduction via heat pipes, the maximum temperature at the nose cone could reach 1313 K, with a corresponding heat flux of up to 1 MW/m
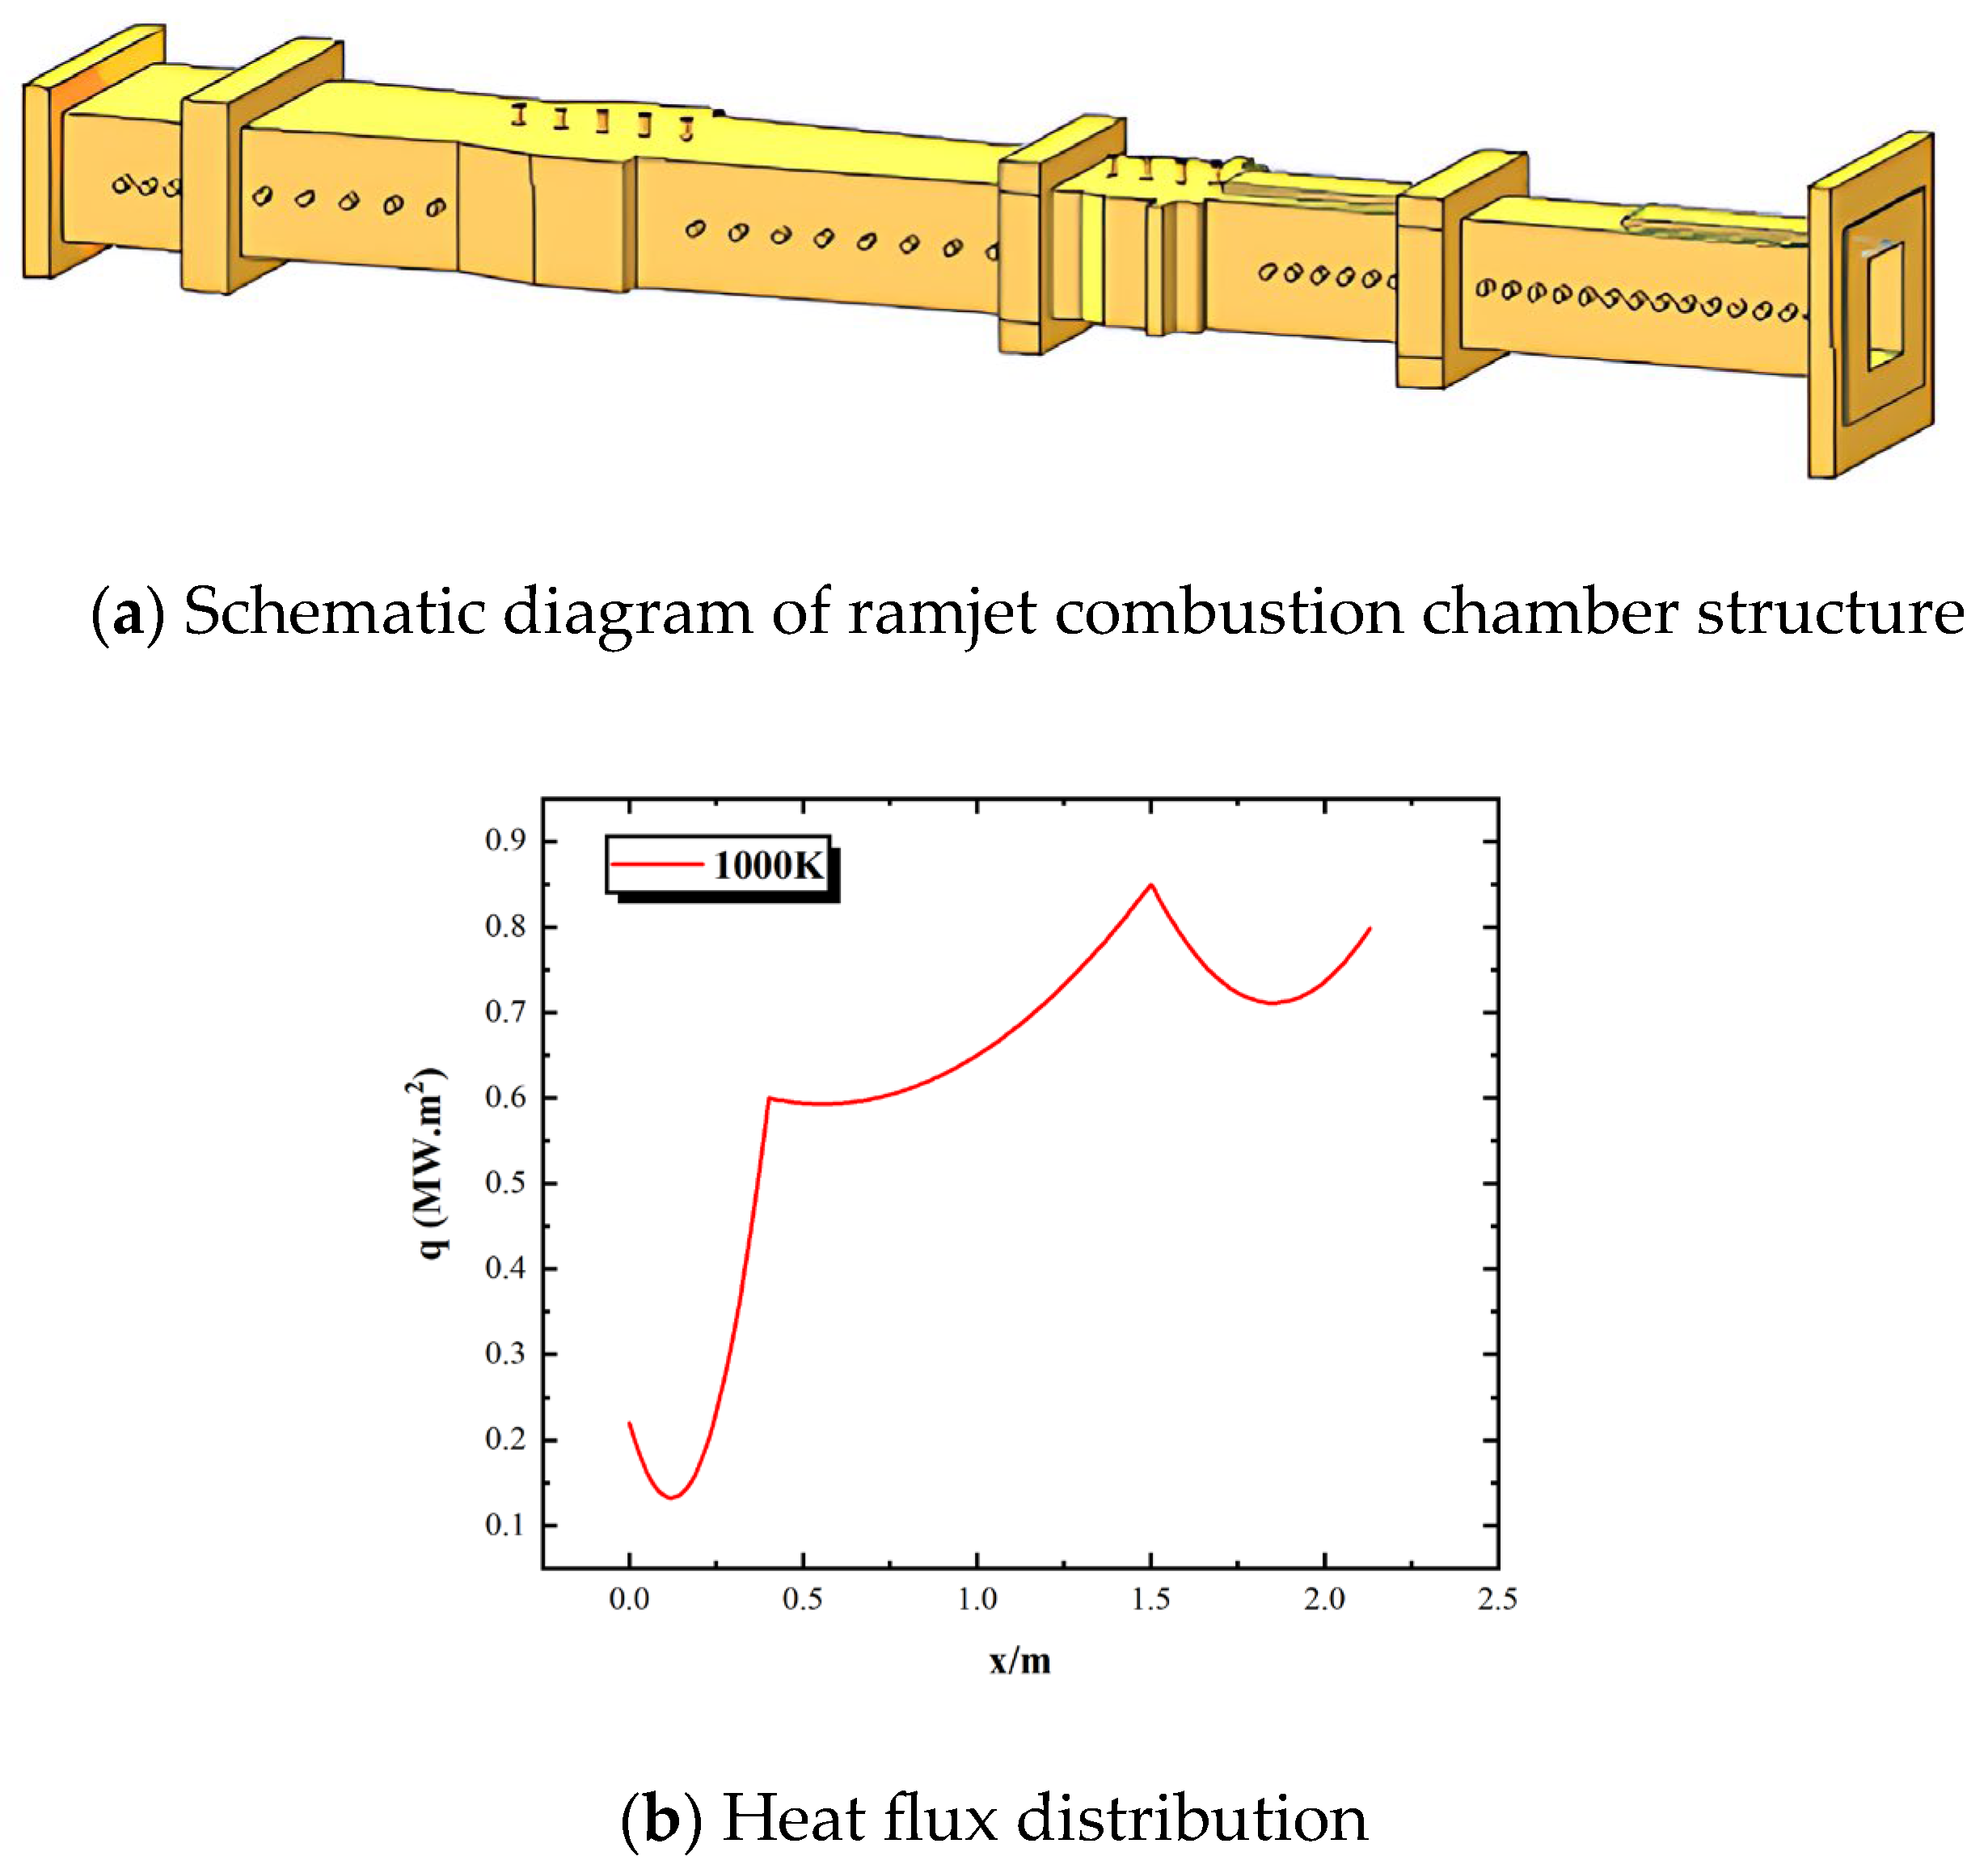
2. Currently, thermal protection methods for aerodynamic leading edges are either passive or semi-active (ablative protection), which are only suitable for short-duration high heat flux conditions and are inadequate for long-duration missions with sustained thermal loads. Combined-cycle engines are considered the most promising propulsion systems for hypersonic vehicles. Due to their superior performance, the walls of scramjet combustion chambers are subject to extremely high thermal loads, far exceeding the limits of current materials. Jason et al. [5] used direct-write temperature sensors to measure the heat flux within the combustion chamber and found it could reach 780 kW/m2 under a dynamic pressure of 1000 psf. Existing cooling solutions, such as film cooling, evaporative cooling, and regenerative cooling, all have drawbacks: they either require additional coolant or may lead to coking and cracking of the fuel (kerosene) [6]. As such, wall thermal protection technology represents a critical bottleneck that must be overcome for scramjet engine applications. The thermal load in the avionics bay is relatively low and determined by the number and power of onboard electronic devices. This heat comes entirely from electrical power consumption and typically does not exceed 125 kW [7]. Given its low energy quality, this heat is usually dissipated using high-pressure bleed air for expansion cooling. The duration of high-Mach flight generally depends on the mission. According to limited flight data from the European Space Agency’s European Space Research and Technology Centre (ESA-ESTEC) under the LAPCAT2 program, the A2 and MR2 vehicles (with cruise Mach numbers of 5 and 8, respectively) demonstrated that Mach 5 flight could last up to 169 min [8]. In summary, it can be seen that the thermal load on the aerodynamic leading edge and the combustion chamber wall is very large and has a high thermal quality, which requires special attention. Hypersonic vehicles must manage at least two high-temperature (T > 1200 K), high-energy-density heat sources for extended periods.
Simultaneously, hypersonic vehicles face critical electrical power deficits during high-Mach-number operations. These aircraft require substantial electrical power for control and sensing systems during hypersonic flight, yet encounter fundamental energy conversion constraints: Ramjet engines typically lack rotating components for shaft work-to-electricity conversion, while conventional power solutions prove inadequate: chemical batteries exhibit low energy density, and auxiliary power units (APUs) [9]/ram air turbines (RATs) [10] suffer compromised mechanical efficiency due to extreme incoming airflow temperatures (>1000 K) [11].
Recent years have witnessed the emergence of thermoelectric conversion-based thermal management concepts, aiming to achieve both thermal protection and energy reuse for hot-end components like scramjet combustors [12,13]. Technologies including magnetohydrodynamic (MHD) power generation, thermoelectric generators (TEGs), and thermodynamic cycles have attracted significant research attention. During the 1990s, the United States and Russia proposed the energy-bypass hypersonic vehicle concept based on MHD technology [14]. This method generates electricity by creating gaseous plasma through interactions between high-temperature incoming flow/combustion gases and low-ionization-potential compounds, subsequently extracting power via superconducting magnetic fields. While demonstrating advantages such as rapid response and huge power output [15], MHD systems still face critical challenges, including magnetic/thermal instability issues. The stringent cryogenic requirements for superconductors limit their application exclusively to hydrogen-fueled vehicles, rendering them incompatible with kerosene-based systems [16]. TEG technology, operating through the Seebeck effect for direct thermoelectric conversion, offers distinct benefits such as the absence of rotating parts, structural simplicity, and high reliability. Cheng et al. [17] implemented TEGs in multi-stage energy utilization for hypersonic environments, developing a variable-stage TEG model that considers flow directions of heat/cold sources, along with performance evaluation and stage-number optimization [18]. Some research has also been conducted on TEG technology in the field of thermoelectric conversion for exhaust gas reuse in ground vehicles. Using TEG generators to replace alternators can provide electricity at the 1 kW level and reduce fuel consumption by 12–30% [19]. However, the thermoelectric conversion efficiency of TEG is only 5–10% [20], with additional challenges in hypersonic applications: thermoelectric materials struggle to withstand extreme temperature gradients, resulting in insufficient power density. Current technological constraints position TEGs primarily as auxiliary power units in hypersonic vehicles.
Additionally, thermodynamic cycle-based thermoelectric conversion systems have garnered researchers’ attention due to their more mature technological foundation. Sforza [21] proposed a Rankine cycle thermoelectric conversion scheme suitable for hypersonic vehicles. However, this approach exhibited low thermoelectric efficiency, and using fuel as the working medium caused heat transfer degradation, posing risks of structural damage to heat exchangers. Bao [22] introduced a hydrogen-fueled re-cooling cycle, but this solution is only compatible with hydrogen fuel possessing substantial thermal sink capacity. Zhang [23] developed a fuel vapor turbine power generation system. Nevertheless, these thermodynamic cycle-based solutions suffer from low energy conversion efficiency, limiting their potential for higher electrical power generation. Consequently, hypersonic vehicles demand thermoelectric conversion solutions with higher efficiency and more compact configurations.
In recent years, the supercritical carbon dioxide (sCO2) Brayton cycle has found applications across multiple domains, including nuclear power generation [24], solar energy [25], geothermal energy [26], and waste heat recovery [27]. The sCO2 Brayton cycle is renowned for its compactness and high efficiency, owing to the unique thermophysical properties of sCO2 near its critical point, which significantly improve the power-to-weight ratio of compressors. Advancements in printed circuit heat exchangers (PCHEs) have further enhanced the compactness and lightweight characteristics of Brayton cycle systems [28,29], thereby enhancing their potential applicability for hypersonic vehicles. Cheng [30] investigated sCO2 Brayton cycles under fuel-limited cold source conditions in hypersonic vehicles, where the fuel (acting as the cold source) is constrained by combustion mass flow rate limitations. Using a scramjet engine as the heat source, their study compared simple recuperative and recompression cycle configurations. The results indicated that while the recompression cycle achieves higher thermal efficiency, the simple recuperative configuration exhibits enhanced utilization of the fuel’s thermal sink capacity. Thus, the simple recuperative cycle demonstrates greater applicability for hypersonic vehicle power generation systems under fuel-constrained operating conditions. To prevent blockage of the wall channels in the ramjet combustor caused by fuel cracking, Guo [31] introduced a SCO2 Brayton cycle into the original fuel-turbine system. A comparison between the original and the modified systems showed that the new system achieved higher power output and thermoelectric conversion efficiency, while requiring less fuel for cooling. The additional mass introduced by the new system was offset by the reduced fuel consumption after 3025 s of flight. In further research, Guo [32] developed a two-stage optimization approach for this system: first, conducting a dual-objective optimization at the cycle level to minimize system weight and coolant mass flow rate, followed by a component-level dual-objective optimization of the PCHE to reduce mass and entropy generation. Ma [
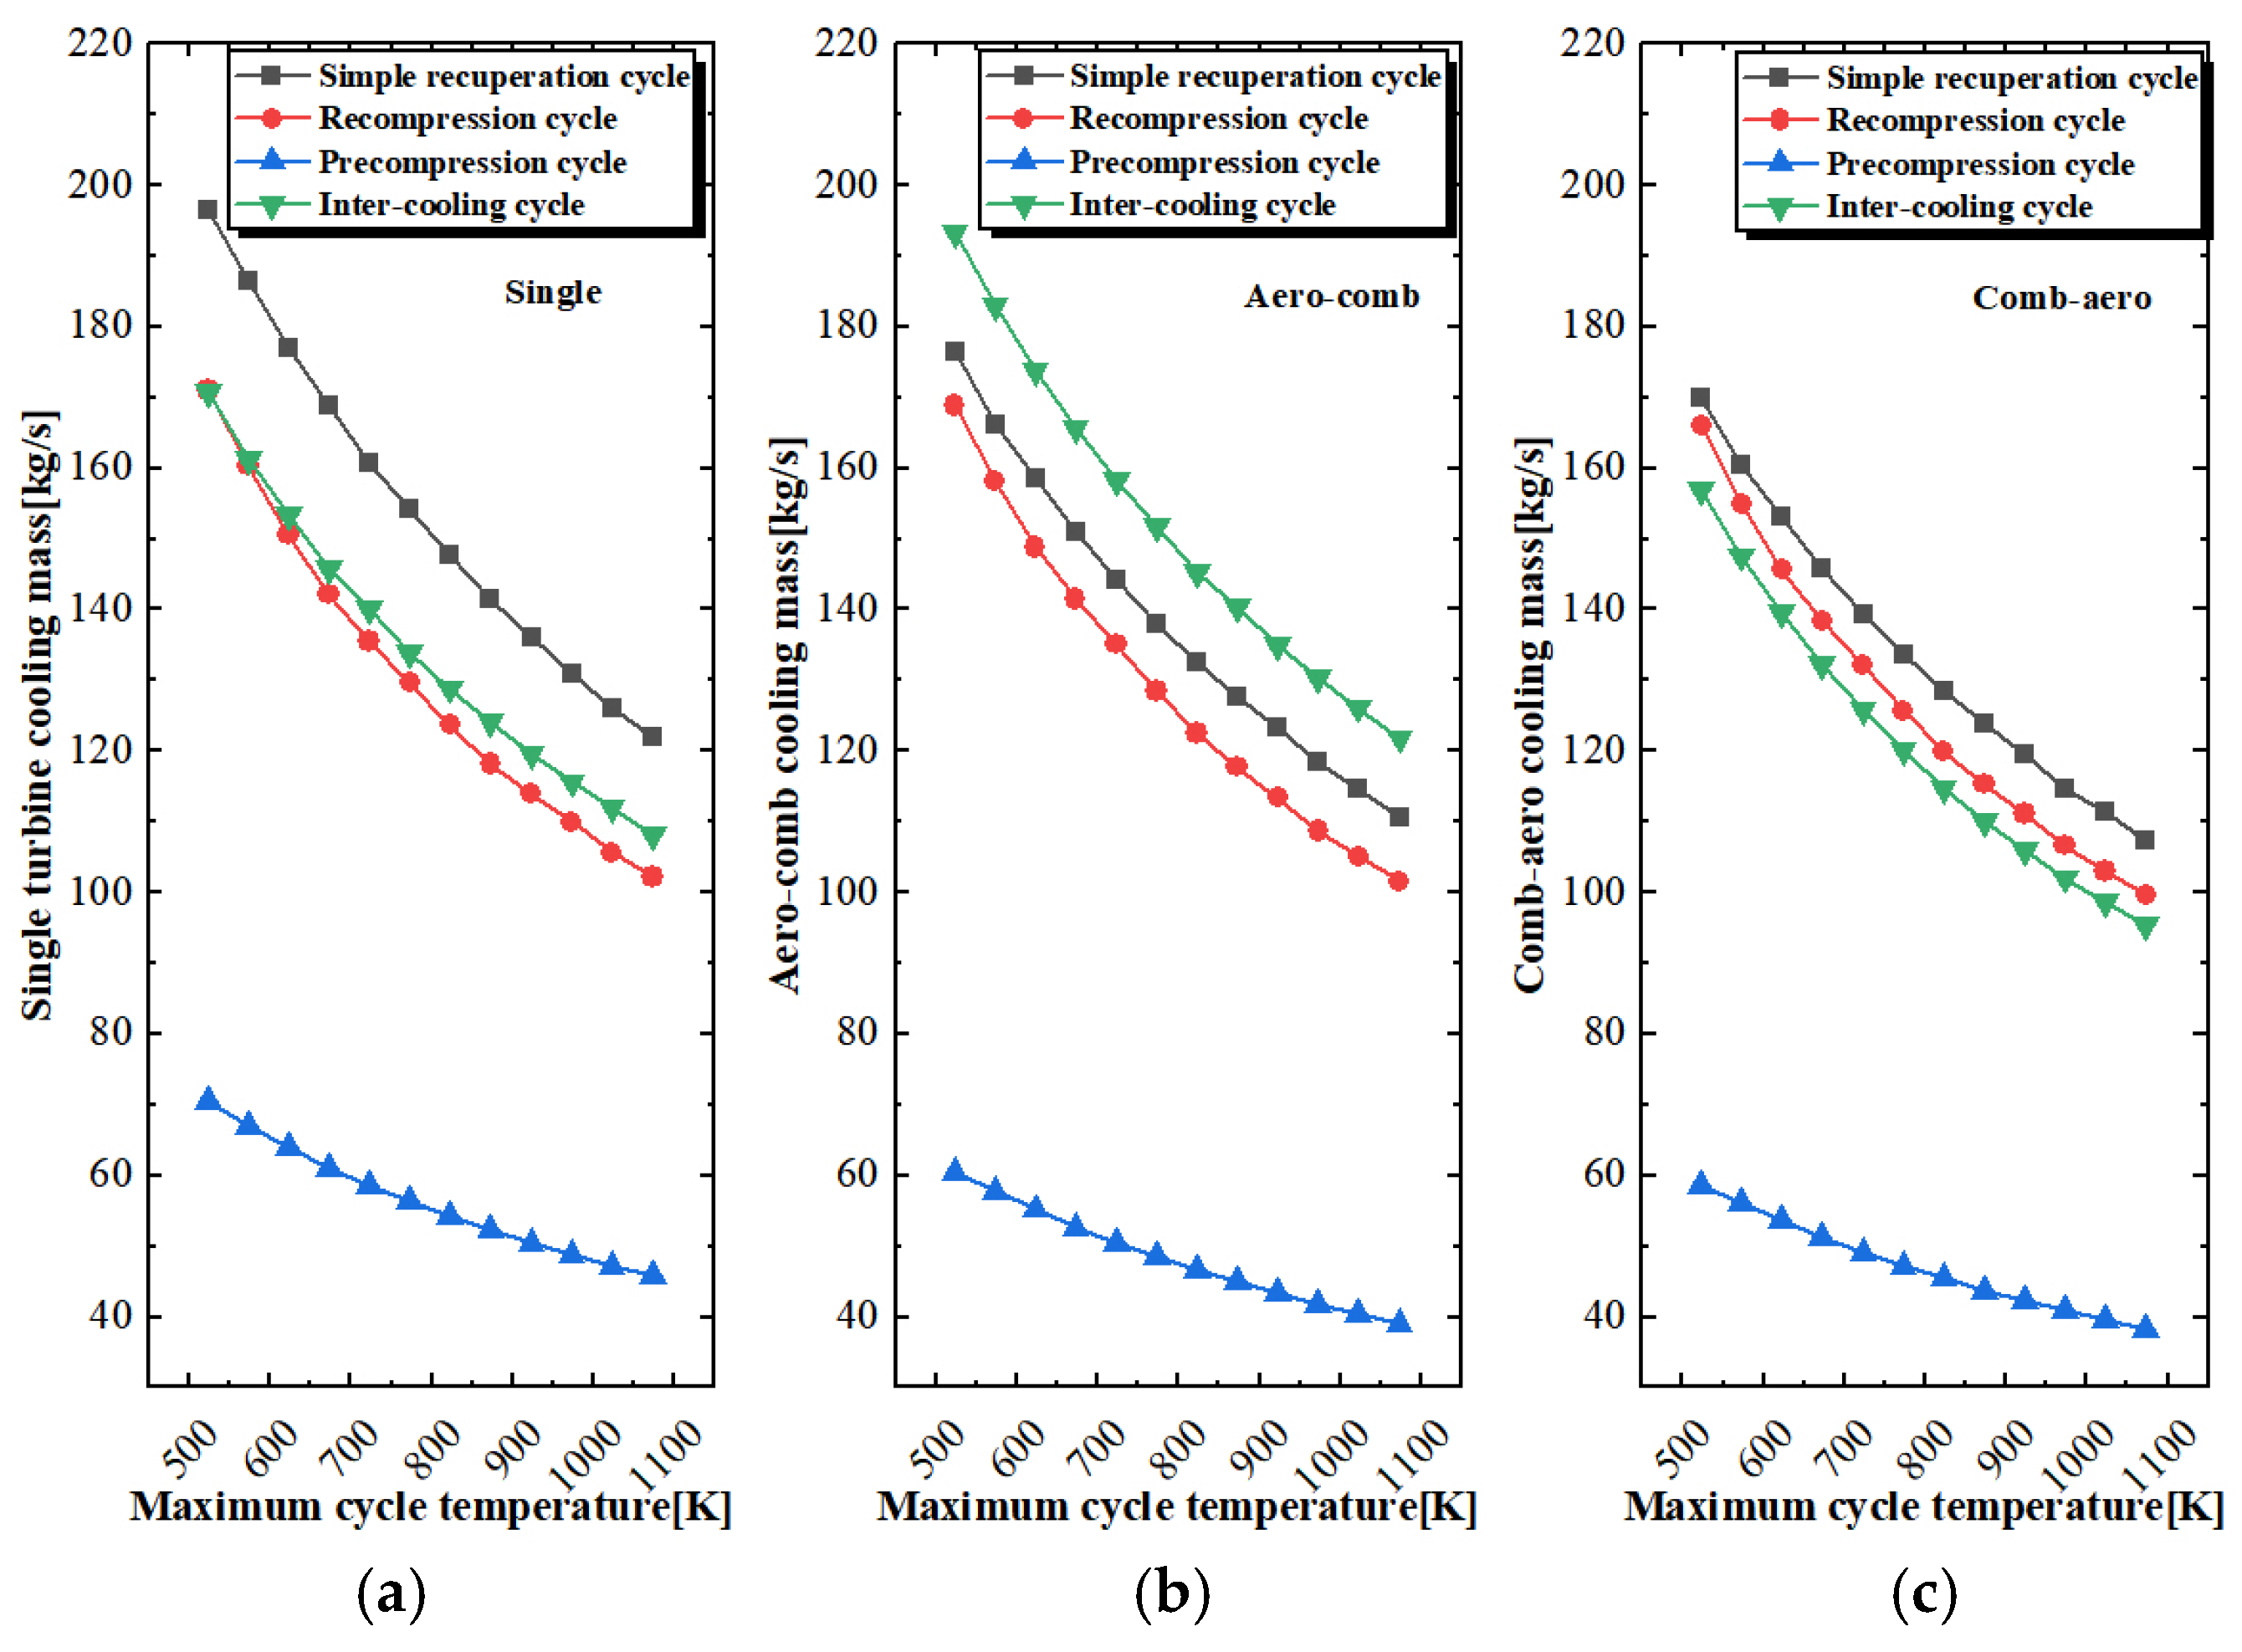
33] investigated the application potential of two cycles—simple recuperative and recompression recuperative cycles—in an integrated hypersonic vehicle engine cooling and power generation system. The study analyzed the thermal performance of both systems and the working fluid mass flow rate under given heat source conditions. The results demonstrated that the recompression cycle achieved 16.6% higher efficiency than the simple recuperative cycle but required 27.53% more working fluid flow. Under the specified heat source power, the recuperator heat transfer in the recompression cycle exceeded that of the simple recuperative cycle by 726.81 kW. Additionally, recuperator effectiveness and pressure drop were found to significantly influence cycle performance. Furthermore, numerous thermoelectric conversion studies focus on utilizing the ramjet combustor as the heat source for hypersonic flight applications [34,35,36], while other investigations explore inlet precooling as an alternative heat source. Ma [11] proposed a turbofan precooling system based on the sCO2 Brayton cycle, establishing coupling between the Brayton cycle and turbofan engines, and conducted dynamic analysis of this configuration [37]. Further research led to the design of an sCO2 Brayton cycle-based integrated system applicable to all operational phases of TBCC engines [38], providing both thermal protection and electrical power generation during precooling and ramjet phases.
Most previous studies have focused on thermal protection and thermoelectric conversion for ramjet engines, with limited consideration of multiple heat sources, such as the aerodynamic leading edge and the combustor. In the onboard environment of hypersonic vehicles, hydrocarbon fuel serves both as a coolant and a propellant, making its consumption a critical concern. Furthermore, vehicles exhibit high sensitivity to the mass of onboard thermoelectric conversion systems. This necessitates the development of a multi-heat-source thermoelectric conversion system tailored for hypersonic vehicles, requiring concurrent optimization of conversion efficiency, coolant flow requirements, and system mass.
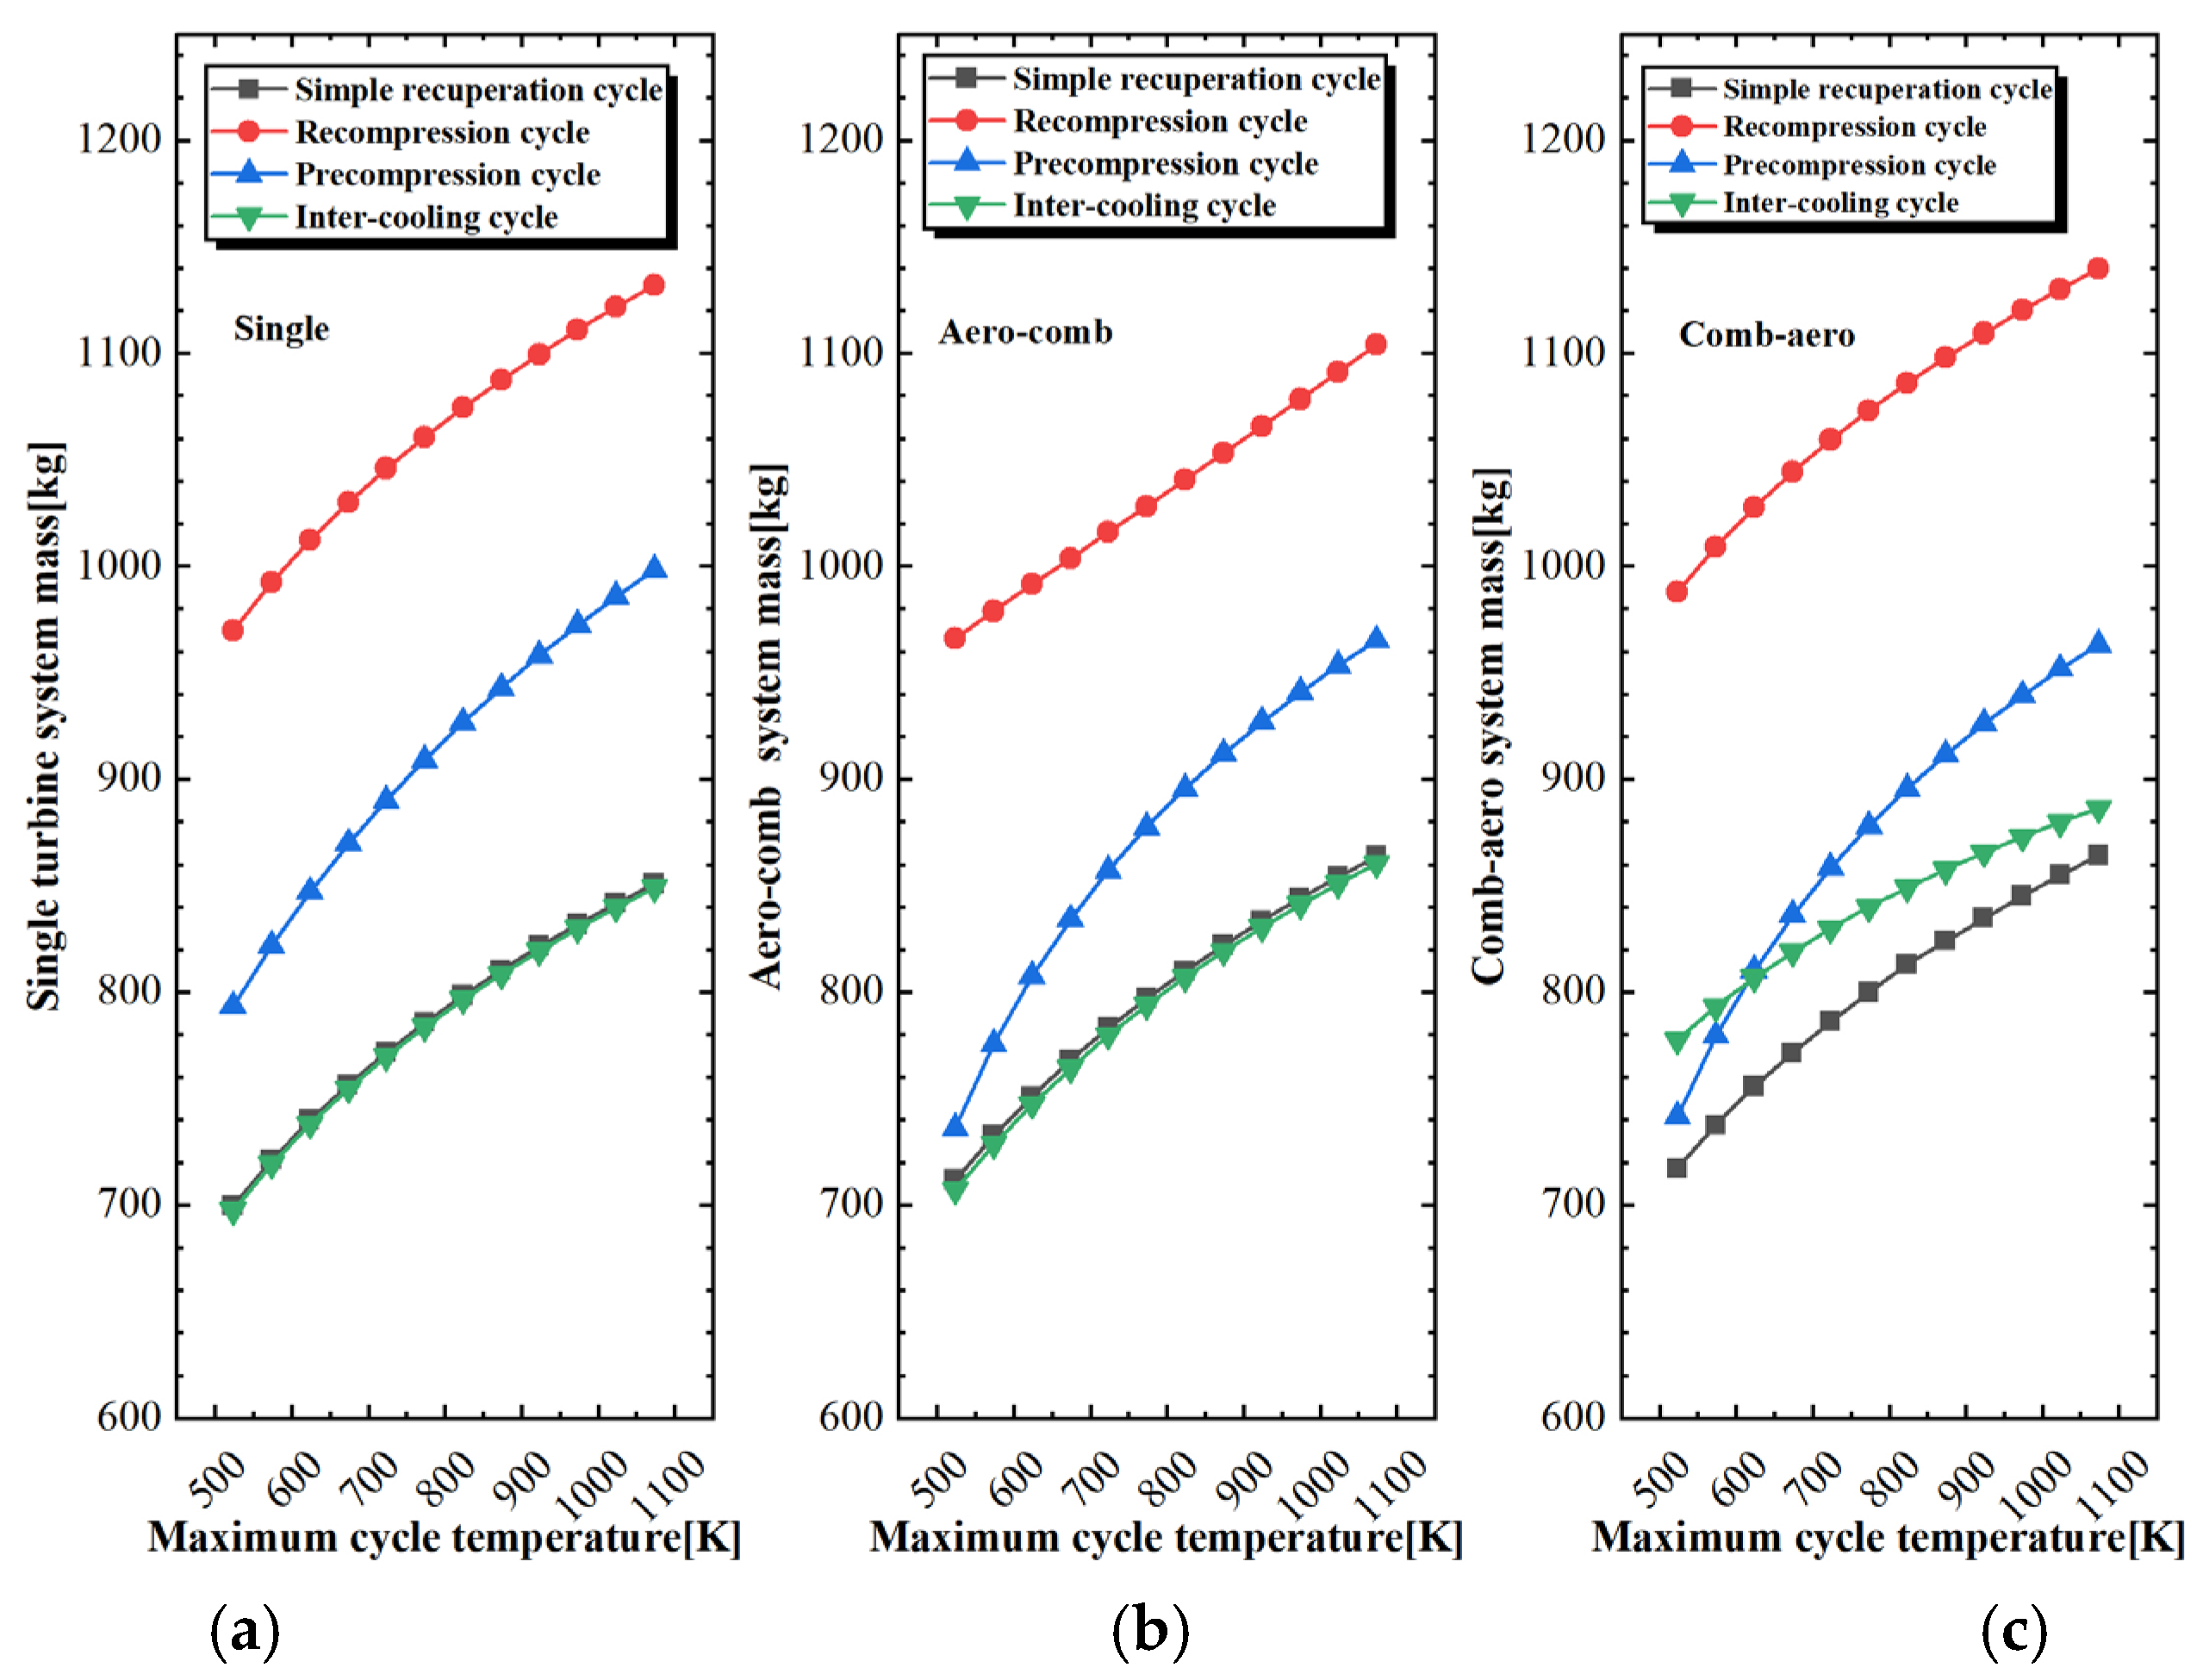
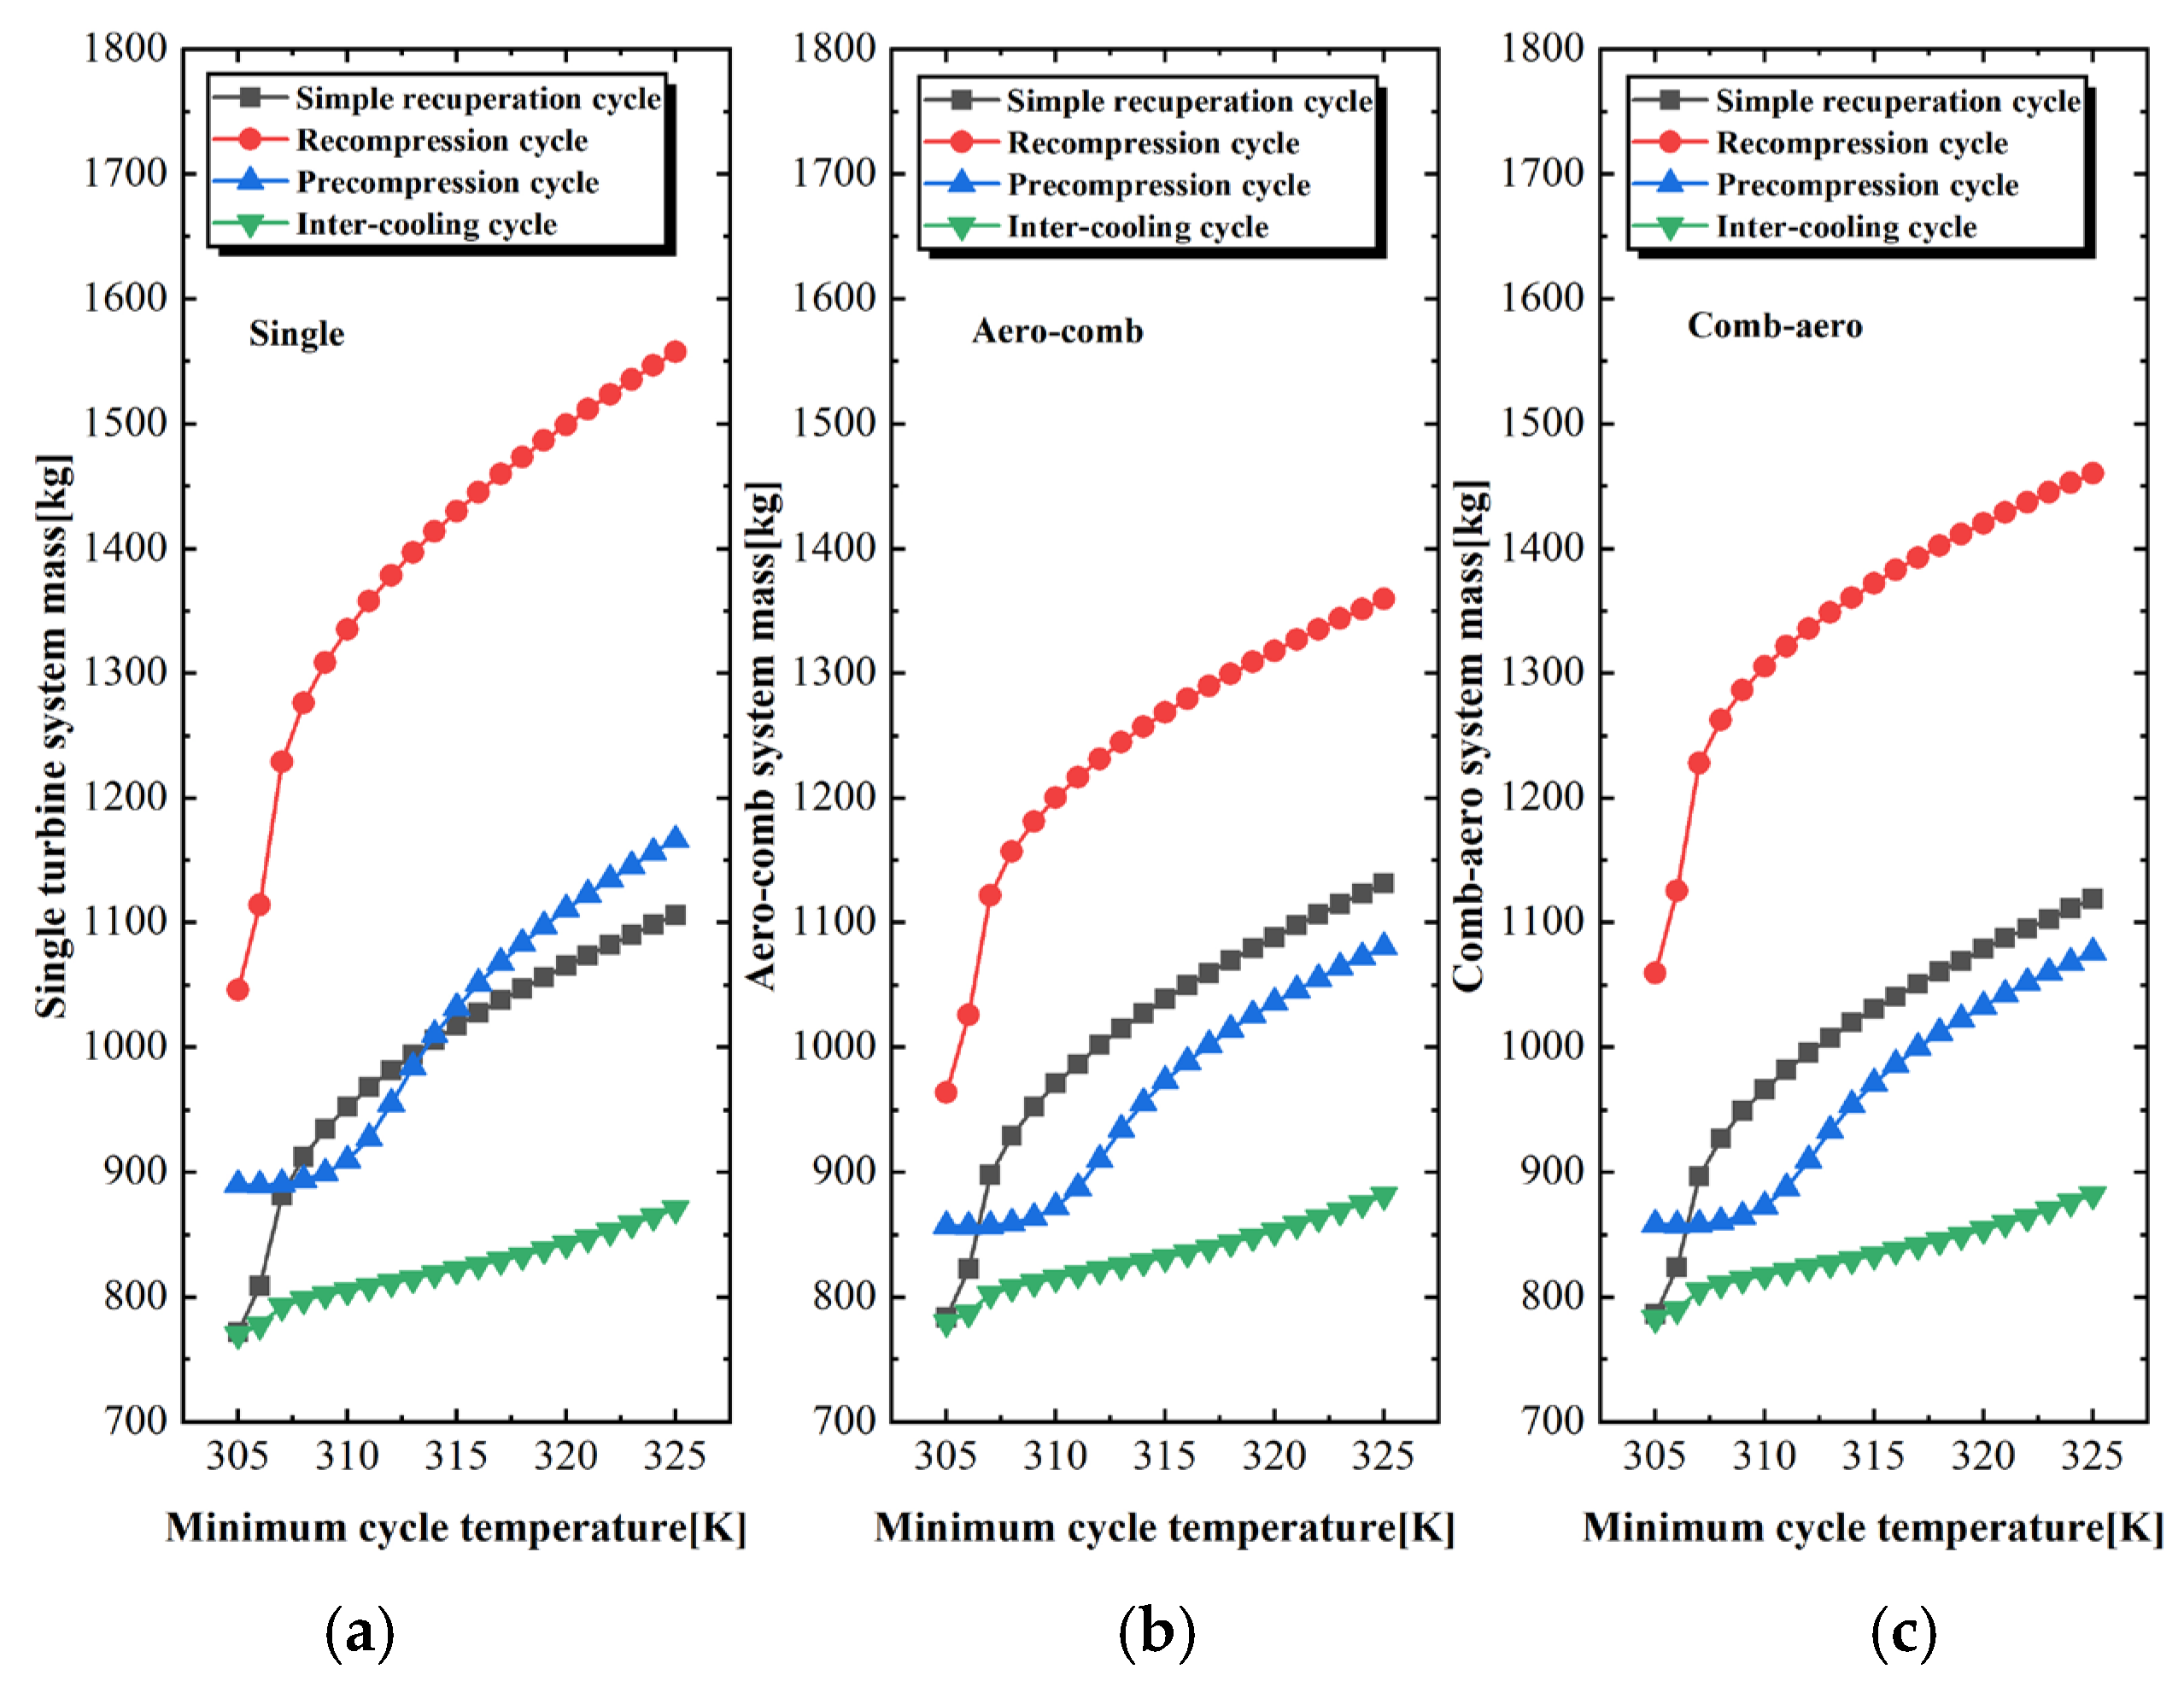
This paper establishes multiple sCO2 Brayton cycle configurations targeting two heat sources: aerodynamic leading edges and ramjet combustor walls. The evaluation criteria include cycle efficiency, coolant mass flow rate, and system mass. Parametric sensitivity analysis is conducted to reveal the impacts of key parameters on thermodynamic performance and system mass. Subsequently, the Non-dominated Sorting Genetic Algorithm II (NSGA-II) method is employed for bi-objective optimization, targeting efficiency-coolant mass flow rate, efficiency-mass, and coolant mass flow rate-mass as optimization objectives. The Pareto fronts of each cycle configuration under different optimization goals are obtained, and the superiority of cycle configurations is evaluated based on the positions of these Pareto fronts. Designers can select cycle solutions based on specific onboard system requirements or design specifications.

2. System Description

In response to the two primary heat sources of hypersonic vehicles, this study designs 4 groups comprising 12 dual-heat-source sCO2 closed Brayton cycle configurations based on four traditional cycle architectures: simple recuperative cycle, recompression cycle, precompression cycle, and intercooling cycle.
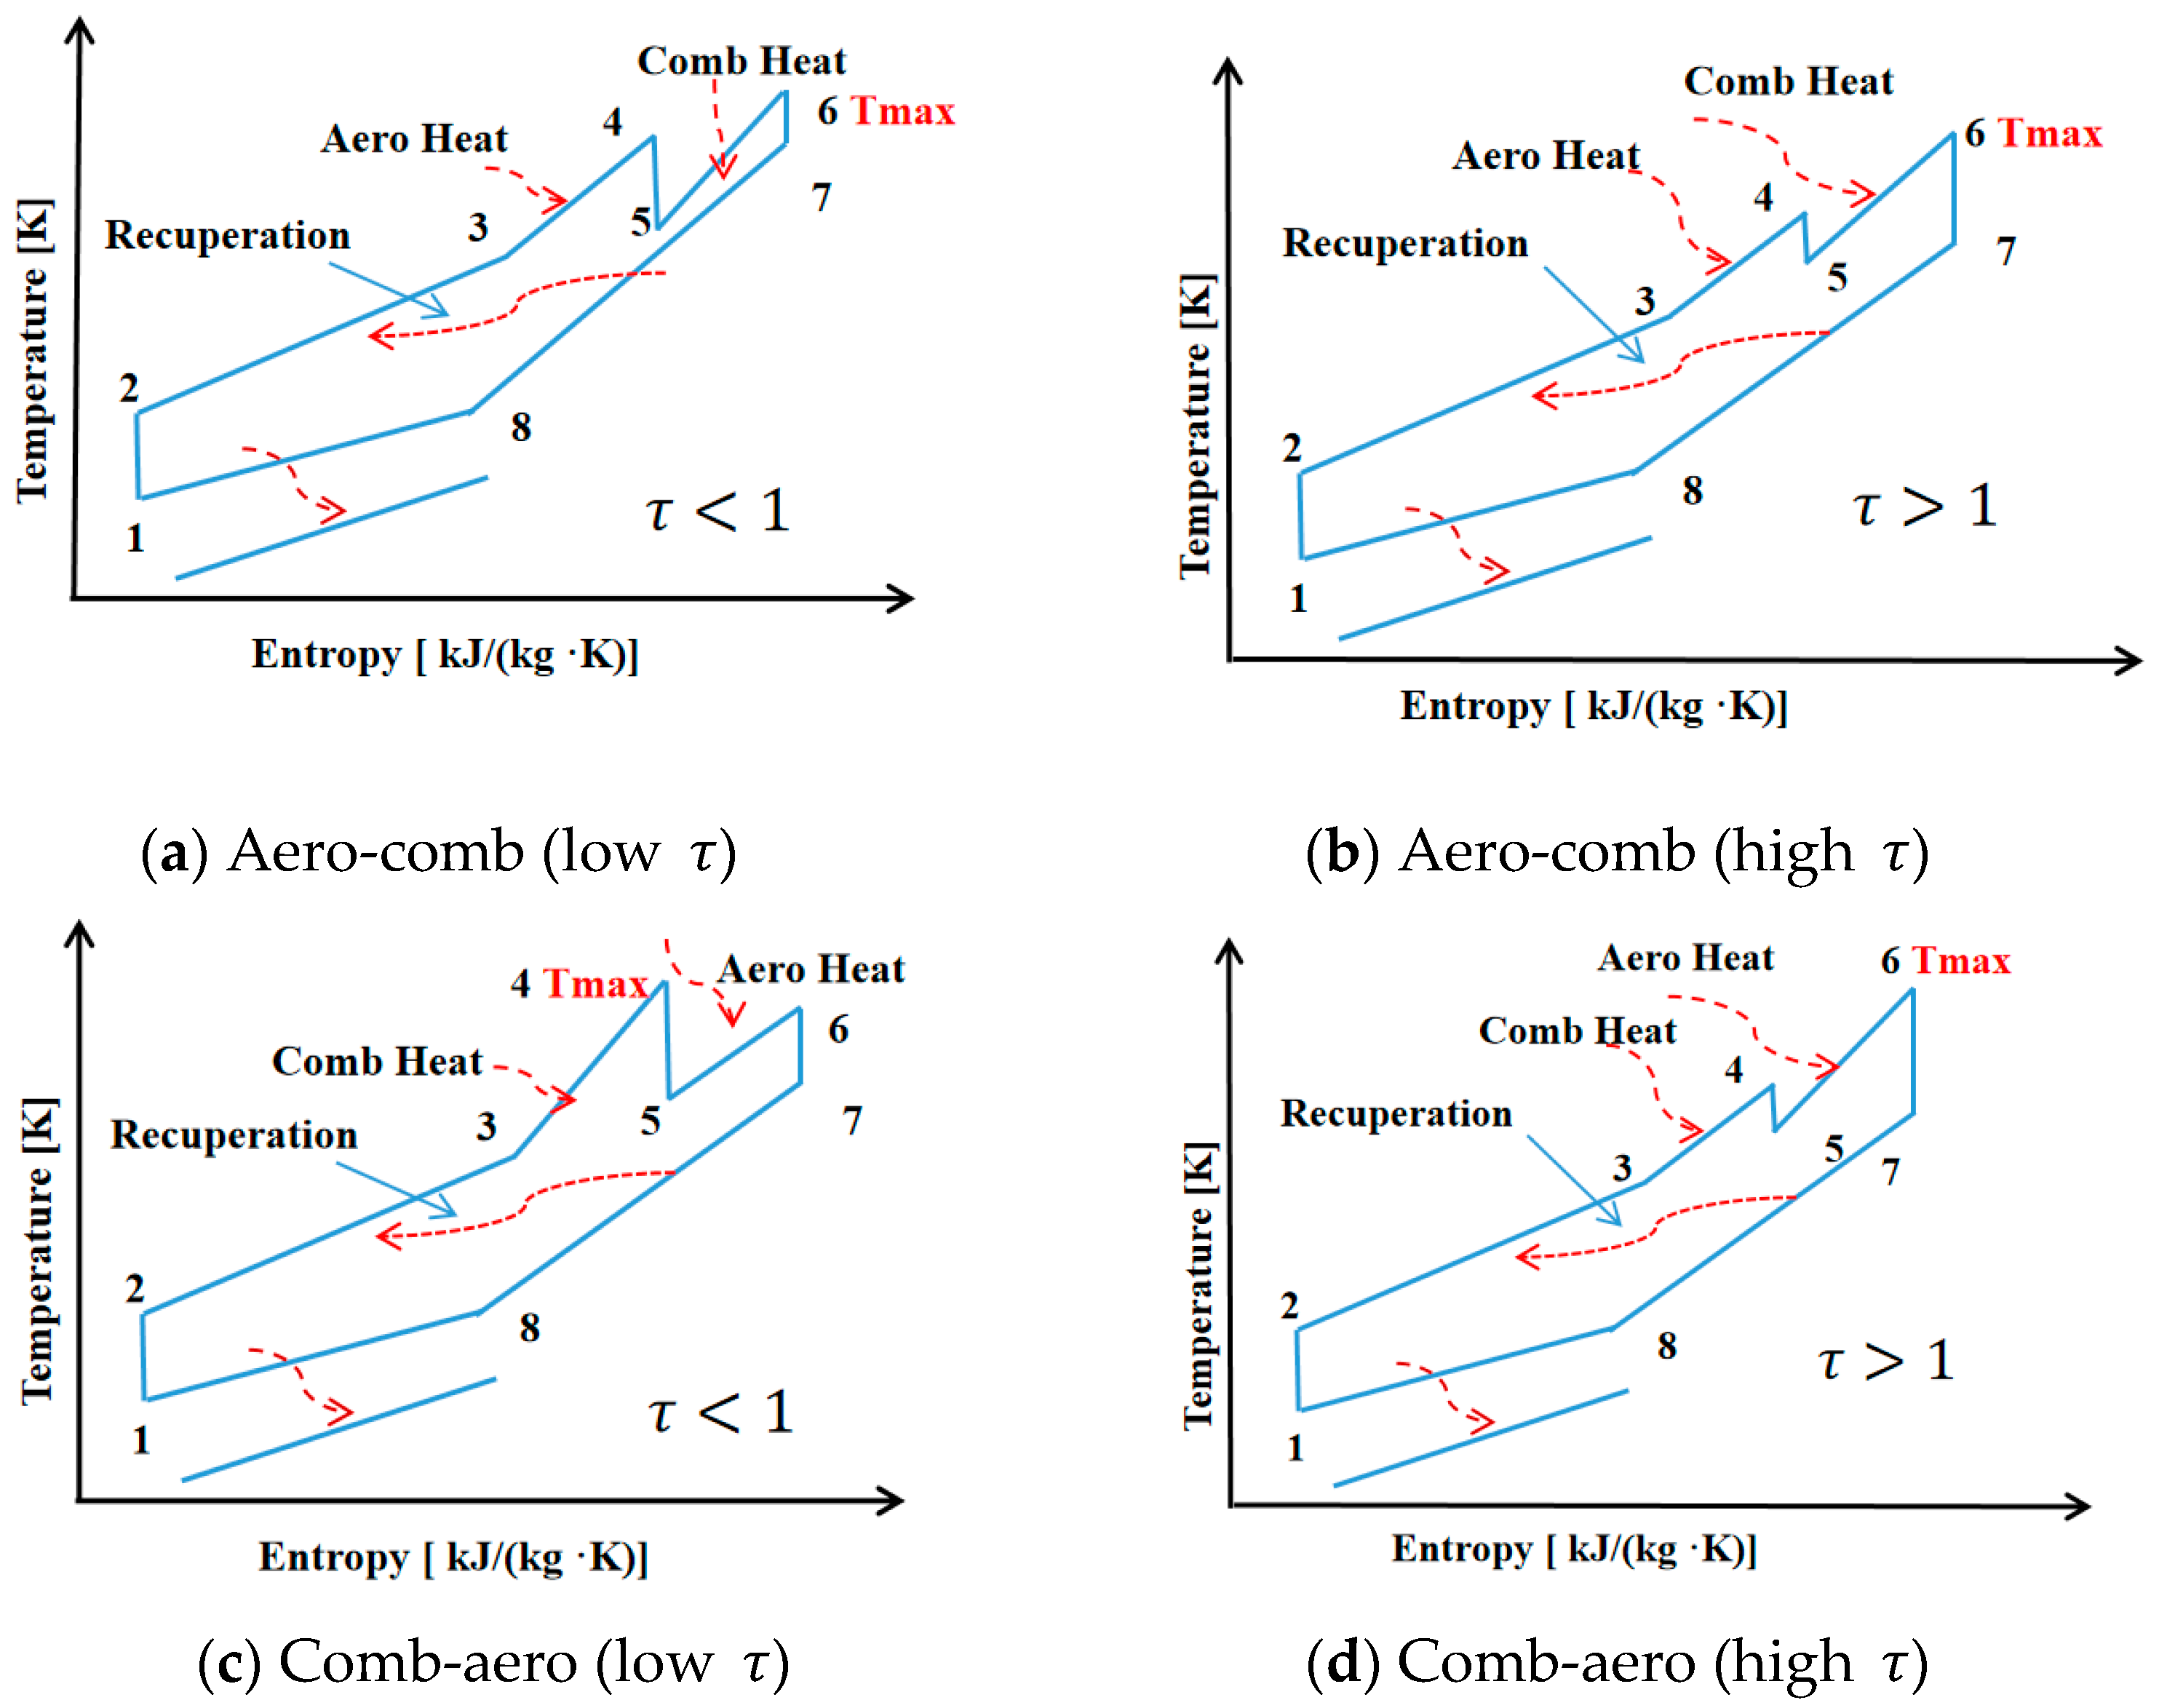
The main thermal characteristic difference between aero heat and comb heat lies in their different heat loads, which in turn lead to differences in cycle performance. The specific reason is as follows: in the calculation of a dual-turbine reheat cycle, it is necessary to ensure that the maximum temperature does not exceed the preset temperature. However, due to the difference in power between the two heat sources, the location of the maximum temperature is uncertain, which in turn affects the area enclosed by the temperature-entropy (T-S) diagram, i.e., the cycle performance. When Aero heat comes first and comb heat comes after, if it is assumed that the maximum temperature appears after the aero heat source (before the first turbine), calculations under any turbine expansion ratio distribution coefficient show that the fluid temperature after passing through the comb heat source always exceeds the preset, so the assumption is incorrect. If it is assumed that the maximum temperature appears after the comb heat source (before the second turbine), the calculation converges and the assumption is correct. When comb heat comes first and aero heat comes after, the comb heat has a larger heat load. Under a lower turbine expansion ratio distribution coefficient (i.e., a larger expansion ratio for the first turbine), the maximum temperature appears after the comb heat source (before the first turbine). Under a higher turbine expansion ratio distribution coefficient (i.e., a larger expansion ratio for the second turbine), although the fluid temperature increases after passing through the comb heat source, the temperature and pressure after work done by the first turbine remain relatively high. After being further heated by the aero heat source, a higher temperature is achieved, so the maximum temperature appears after the aero heat source (before the second turbine). This is illustrated using four T-S diagrams: Figure 1a shows the T-S diagram of the aero-comb configuration under a high turbine expansion ratio coefficient; Figure 1b shows the T-S diagram of the aero-comb configuration under a low turbine expansion ratio coefficient. It can be seen that in both cases, the maximum temperature appears before the second turbine. Figure 1c shows the T-S diagram of the comb-aero configuration under a low turbine expansion ratio coefficient, where the maximum temperature appears before the first turbine. Figure 1d shows the T-S diagram of the comb-aero configuration under a high turbine expansion ratio distribution coefficient, where the maximum temperature appears before the second turbine. In the calculations, the location of the maximum temperature needs to be assumed and confirmed. Therefore, in the configuration of dual-turbine reheat, the comb-aero and aero-comb sequences affect the cycle performance and thus should be considered as two separate configurations.
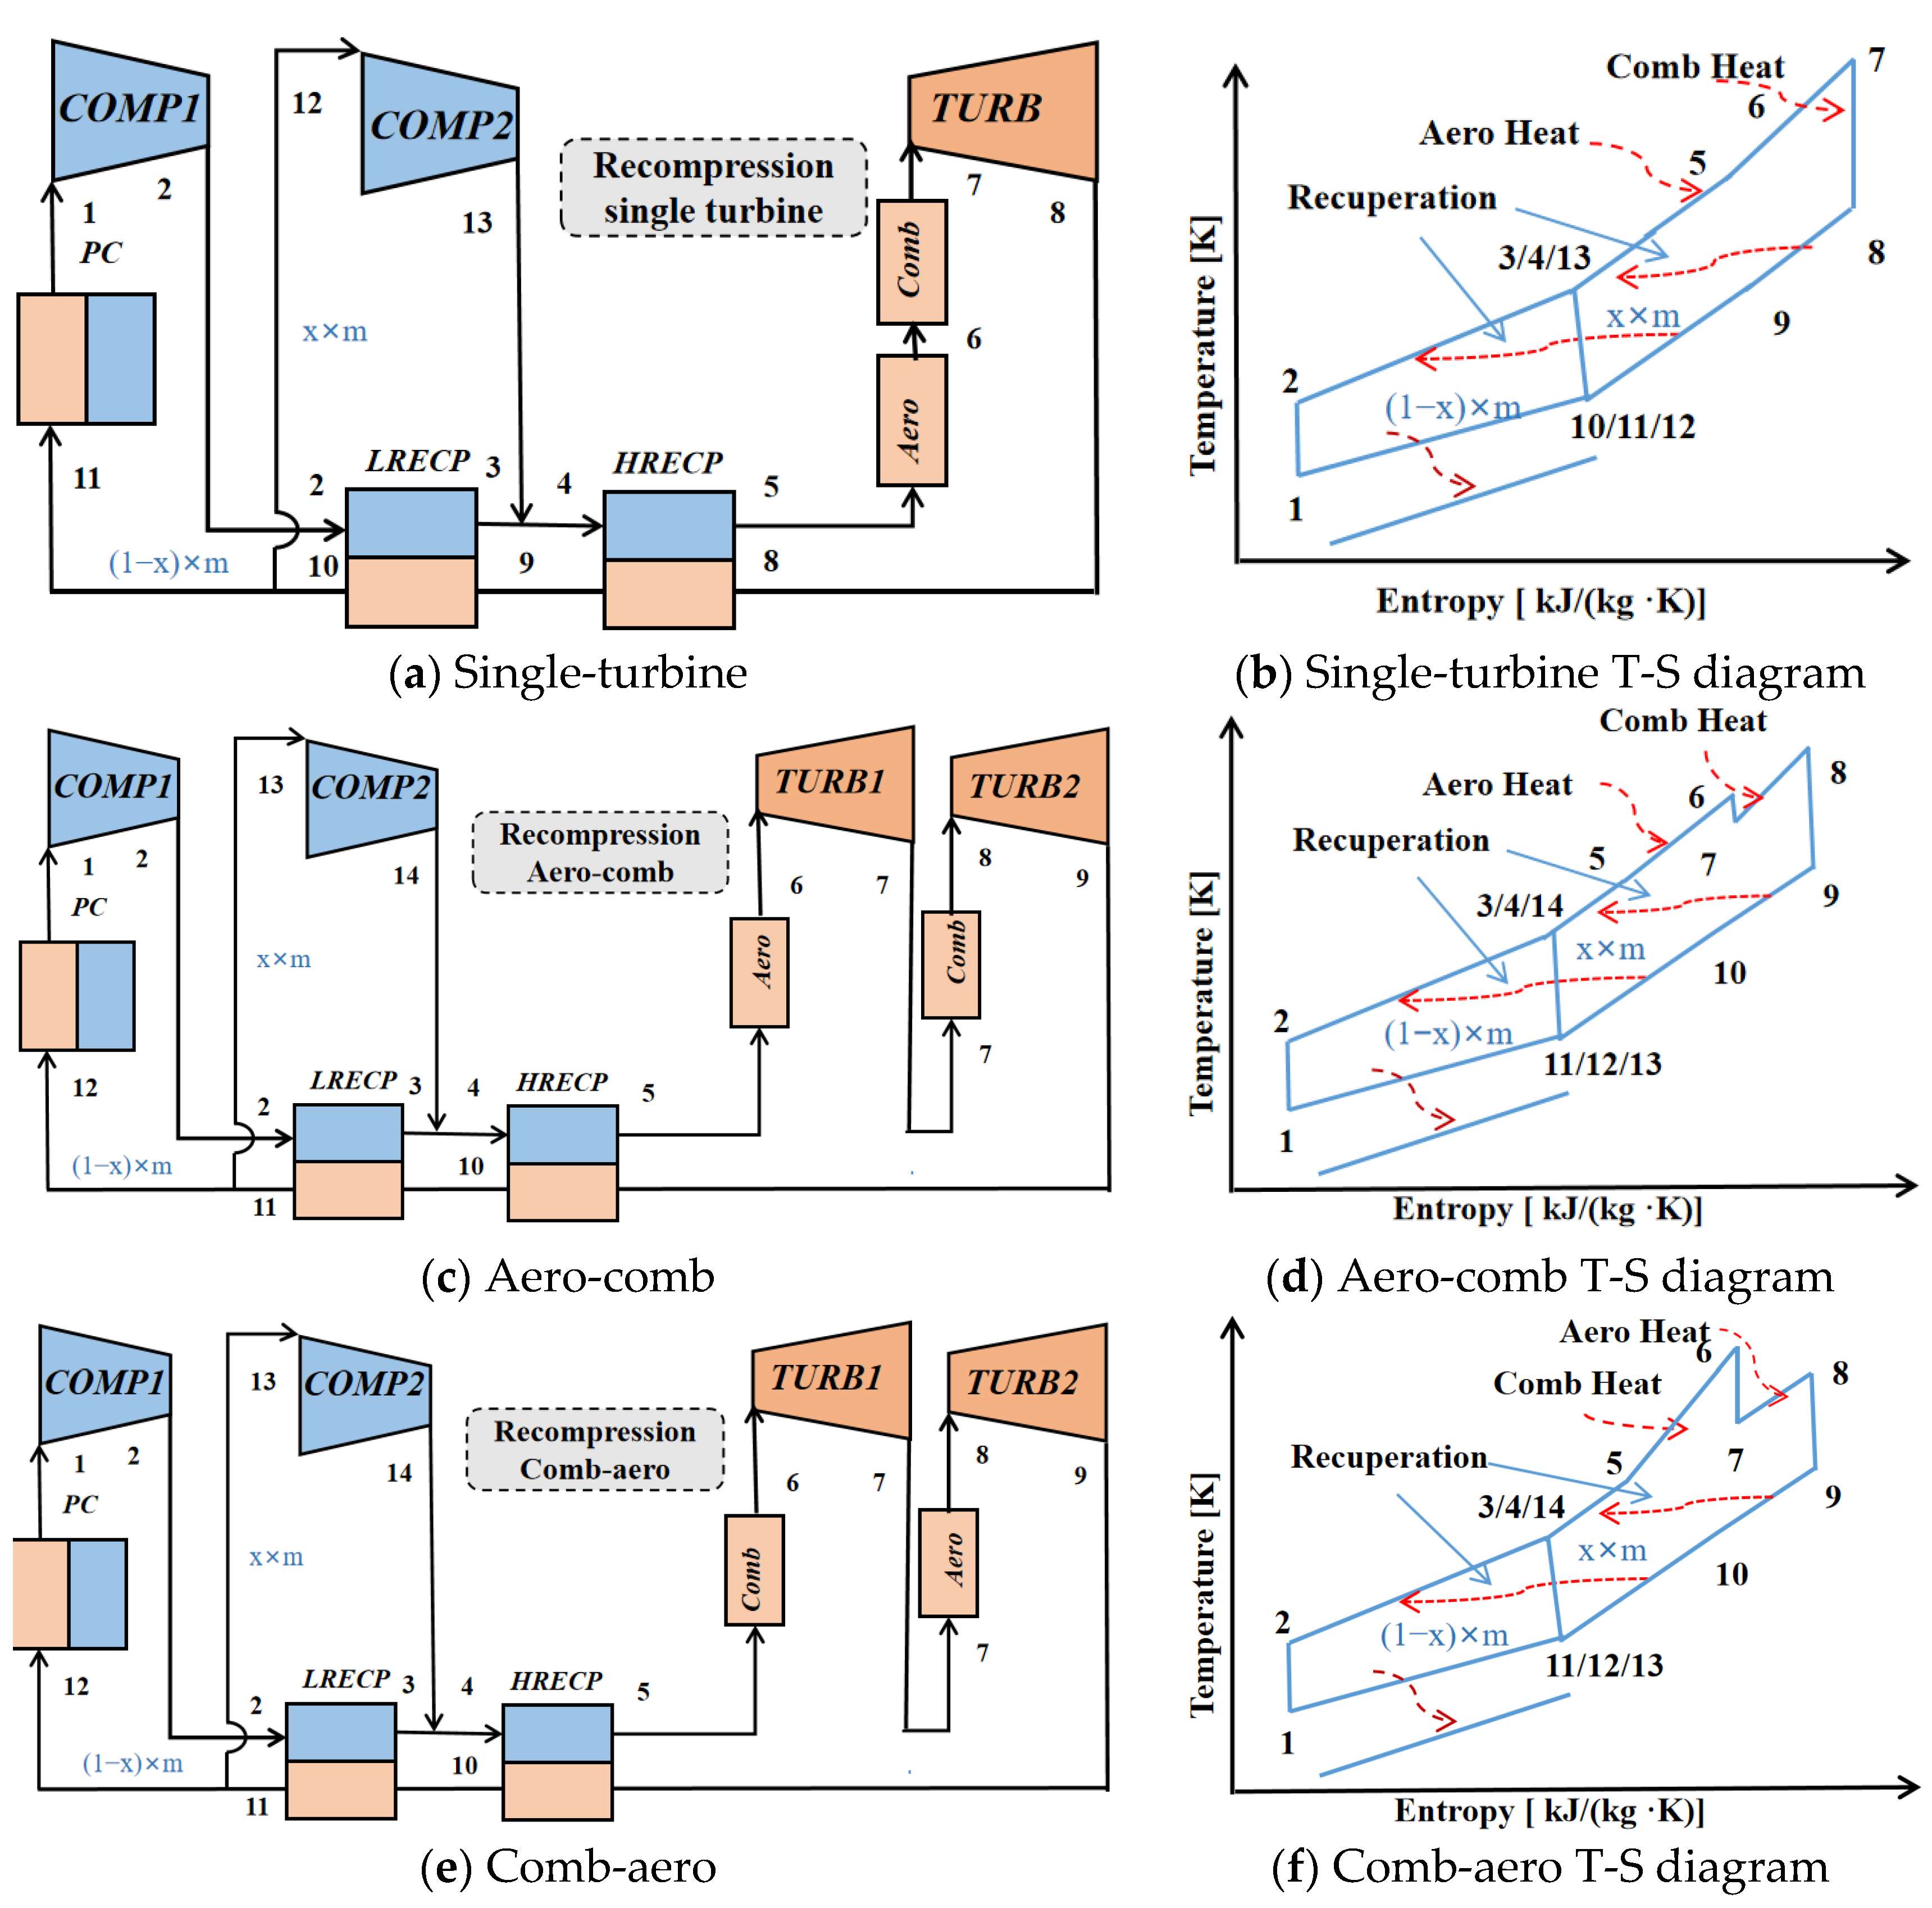
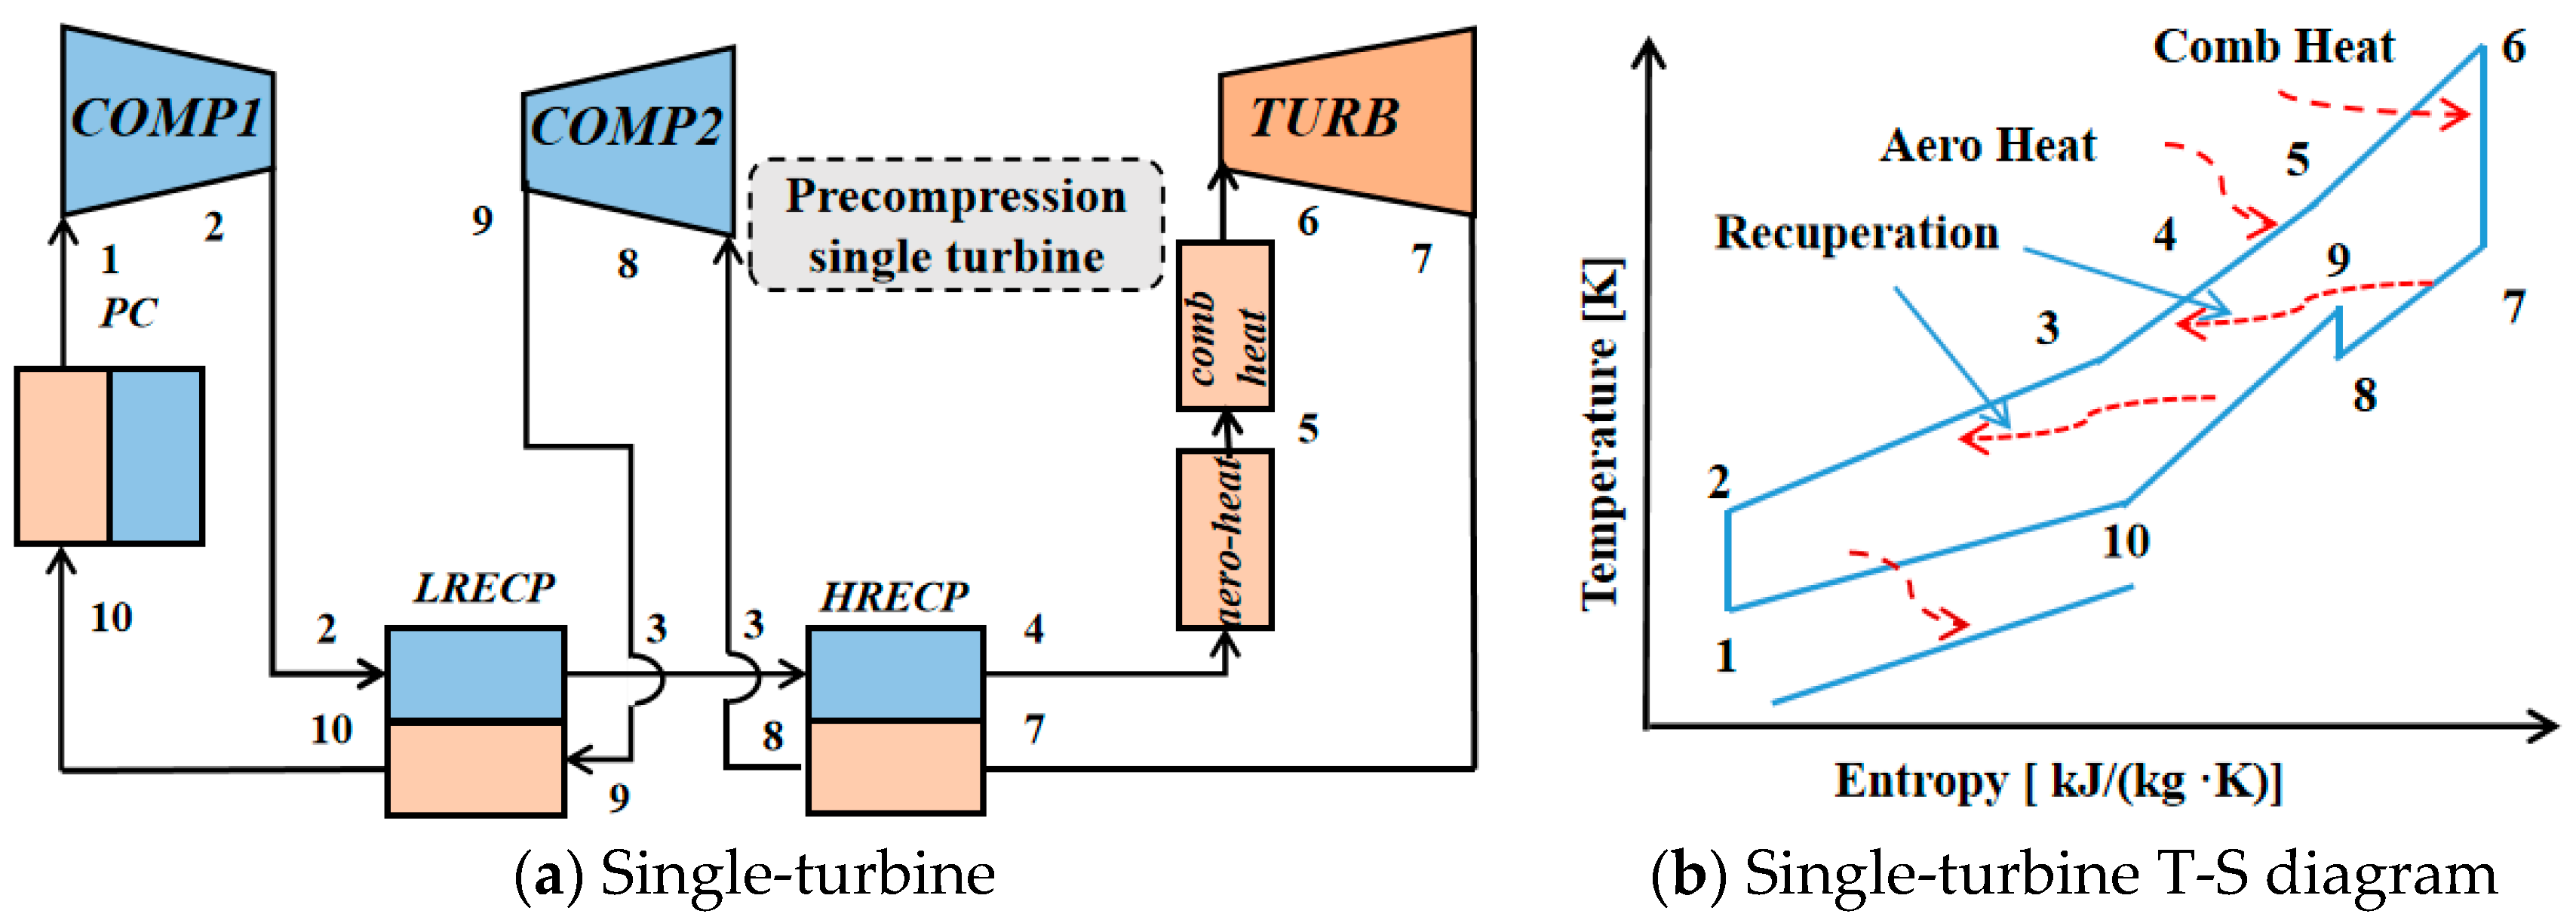
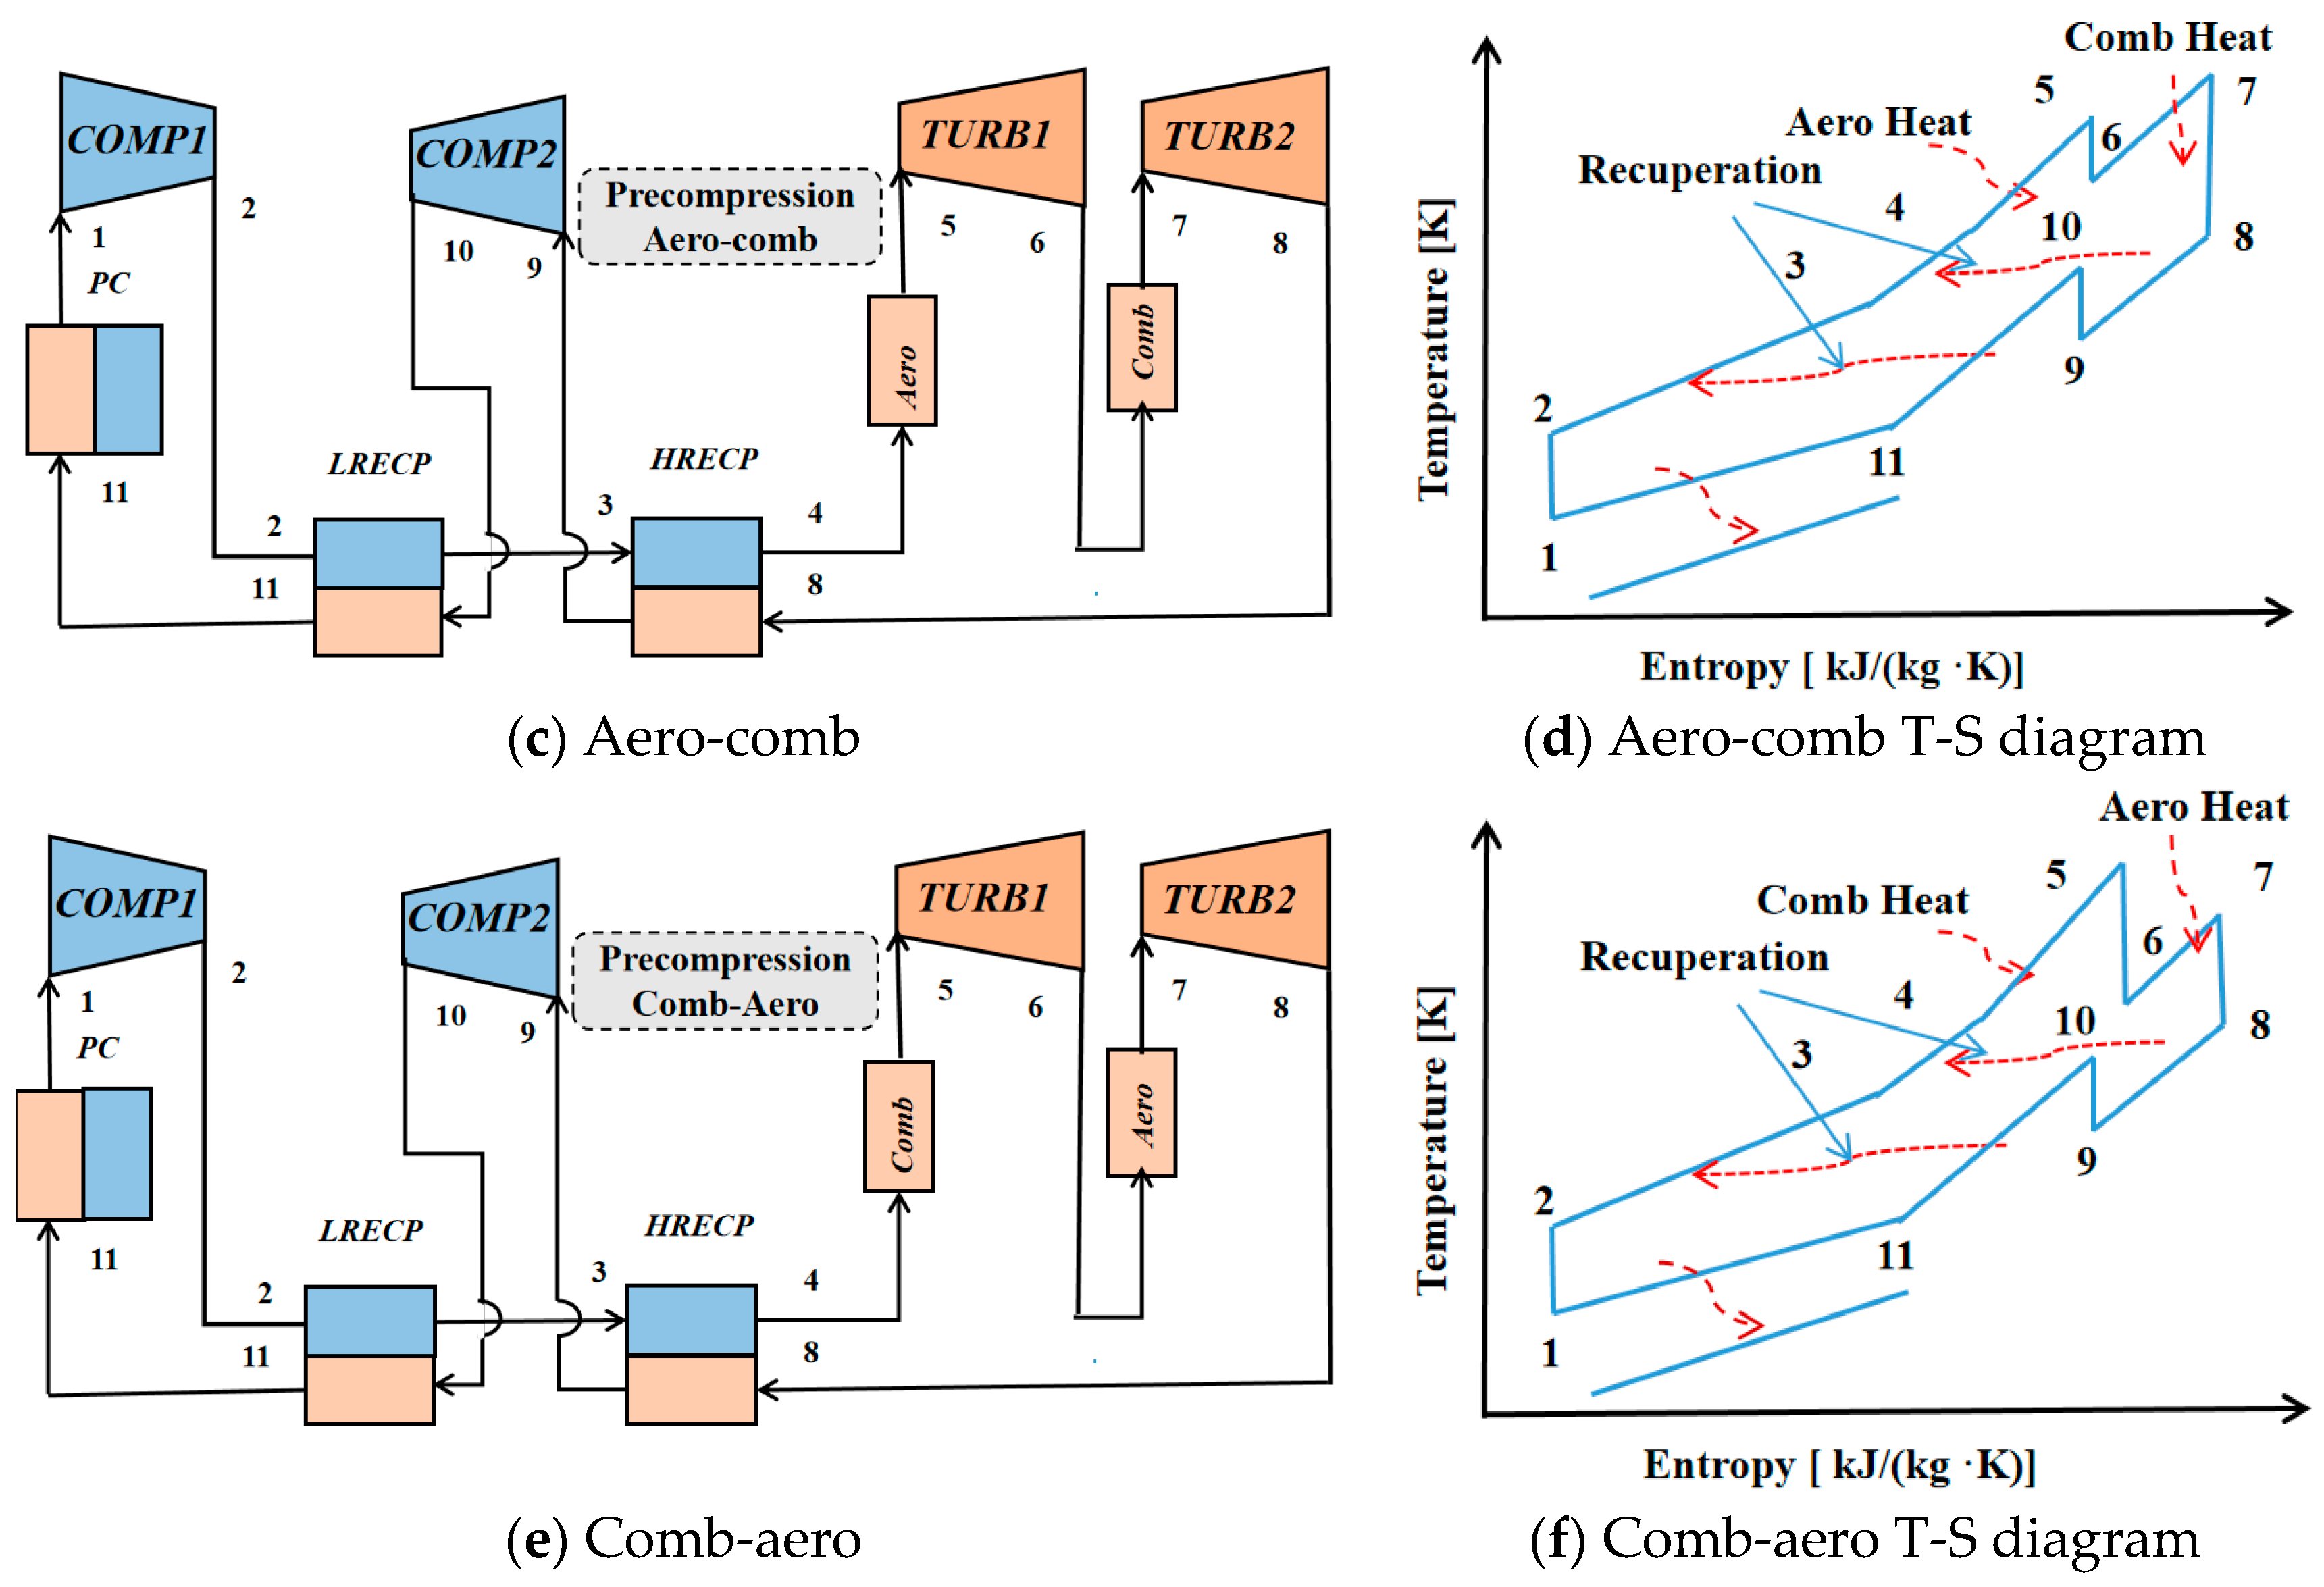
Figure 2, Figure 3, Figure 4 and Figure 5 illustrate the layouts and T-S diagrams of these cycles. The characteristic of aero-comb is that the CO2 first absorbs heat in the aerodynamic heat source, then expands and works in the first turbine, and then absorbs heat in the combustion chamber heat source and works in the second turbine; comb-aero is the opposite, the medium passes through the combustion chamber heat source, the first turbine, the aerodynamic heat source and the second turbine in sequence. These 12 cycles are as follows: simple recuperation single-turbine cycle, simple recuperation “aero-comb”, simple recuperation “comb-aero”, recompression single-turbine layout, recompression “aero-comb”, recompression “comb-aero”, precompression single-turbine cycle, precompression “aero-comb”, precompression “comb-aero”, intercooling single-turbine, intercooling “aero-comb”, and intercooling “comb-aero”. The red dotted lines in the figures represent the heat transfer directions.

3. System Modeling and Performance Evaluation

This section will introduce cycle modeling methods and thermal boundary conditions, including the characteristics of heat sources and coolant sources, as well as the 1D modeling method for the precooler PCHE. Additionally, three-dimensional system performance criteria are proposed to lay the foundation for subsequent parametric analysis and system optimization.

3.1. Modeling Approach

3.1.1. Characteristics of Heat and Cooling Sources

The heat sources investigated in this study are the leading edge and combustor walls, both of which employ active convective cooling [34,39,40,41,42] for thermal protection. The internal channel structure adopts rectangular channels, with sCO2 as the working fluid flowing through the channels. Notably, the literature [39] demonstrates that pressure loss in channel structures is relatively small. Therefore, in the channel discussed in this section, the influence of pressure drop is neglected, and only the thermal power of the heat sources is considered.
A schematic diagram of the aerodynamic leading-edge model is shown in Figure 6. The red arrows in Figure 6 represent the aerodynamic heat load. A tapered segment of the aerodynamic leading edge is selected. sCO2 flows through channels embedded in the leading edge to dissipate heat. The width of the leading edge is S = 10 m, the inner diameter of the channels is d = 2 mm, the rib width between channels is d1 = 1 mm, the cone radius is R = 38.1 mm, and the chord length is L = 431 mm.
The heat flux distribution along the wing leading edge is shown in Figure 7. The heat flux density is highest at the stagnation point, with qf0 = 4.74 × 10⁵ W/m2 [42]. The heat flux density decreases along the upper and lower chordwise directions. Integrating the heat flux along the path yields the total heat transferred into the wall. To simplify the integration, the heat flux function is approximated as a piecewise function as follows:
q x = 3083 e 3 x 3 1266 e 3 x 2 + 183 e 3 x + 122187                                       0 x 0.38   m q x = 8489722 × x 3160298                                                                                 0.38   m < x 0.42   m q x = 848109 × x + 4128603                                                                               0.42   m < x 0.46   m q x = 291 e 4 x 3 + 6346 e 3 x 2 4623 e 3 x + 1256 e 3             0.46   m < x 0.862   m
For the combustor walls, the same calculation method is applied. The model is illustrated in Figure 8a, with an inlet cross-section of width × height = 125 mm × 100 mm, a length L = 2.13 m, and an outlet cross-section of width × height = 125 mm × 300 mm. Channels are embedded within the walls, and external thermal loads are applied to the outer wall surfaces. The heat flux density distribution is shown in Figure 8b, displaying profiles under three wall temperatures. For the selected wall temperature of 1000 K, the heat flux density distribution can be expressed as a piecewise formula as follows [43]:
q x = 6 x 2 1.45 x + 0.22 ,                                                         0 < x < 0.4   m q x = 0.288 x 2 0.320 x + 0.682 ,                     0.4   m < x < 1.5   m q x = 1.128 x 2 4.178 x + 4.580 ,                 1.5   m < x 2.13   m
The heat loads of the two heat sources can be obtained through calculation. The calculation results are shown in Table 1.
As for the cooling source, kerosene (replaced by n-decane [44] is the only cooling source for hypersonic vehicles at high Mach numbers. The state of kerosene is in Table 2:

3.1.2. Model of sCO2 Brayton Cycle

This study establishes zero-dimensional models for all Brayton cycle configurations to predict and optimize system performance. The performance of PCHE recuperators is characterized by effectiveness. However, for the PCHE precooler, where the hot side involves sCO2 and the cold side uses kerosene, the significant variations in sCO2 properties and the potential occurrence of the minimum temperature difference within the precooler necessitate the development of a one-dimensional precooler model. To simplify the modeling process, the following assumptions are proposed:
  • These cycles operate under steady-state conditions;
  • Heat losses due to heat exchange with the external environment are neglected;
  • Pressure losses in pipes and junctions within the cycle are ignored;
  • Turbomachinery is modeled using isentropic efficiency;
  • The power consumption of the fuel pump is disregarded.
The isentropic efficiencies of the compressor and turbine are defined as follows:
η c o m = h c , i n h c , o u t , s h c , i n h c , o u t
η t u r b = h t , i n h t , o u t h t , i n h t , o u t , s
where the subscript “s” represents the parameters under the isentropic process. “in” and “out” represent inlet and outlet.
The recuperator’s heat transfer capability is characterized by enthalpy-based effectiveness:
ε r e c p = Δ Q Δ Q m a x = Δ Q m i n ( Δ Q m a x , h , Δ Q m a x , c )
Δ Q m a x , h = m h h t i n , h , p i n , h h t i n , c , p o u t , h
Δ Q m a x , c = m c h t i n , c , p i n , c h t i n , h , p o u t , c
Here, “in” denotes the inlet, “out” the outlet, “c” the cold side, and “h” the hot side. Typically, the minimum heat transfer occurs on the recuperator’s hot side. However, in cases involving flow splitting, the cold-side mass flow may be smaller, leading to the possibility of the minimum heat transfer occurring on the cold side.
Kerosene precools sCO2 in PCHE. Due to the significant variation in the specific heat capacity ratio between kerosene and sCO2, the pinch point (minimum temperature difference) may occur internally within the heat exchanger. Characterizing performance using heat exchanger effectiveness could lead to an excessively small or even negative pinch-point temperature difference, rendering the design infeasible. Therefore, it is more appropriate to evaluate the performance of the sCO2-kerosene PCHE based on the pinch-point temperature difference. For the sCO2-kerosene precooler, the hot-side inlet corresponds to the recuperator outlet condition, and the hot-side outlet corresponds to the compressor inlet condition (known parameters). The coolant kerosene mass flow rate can be determined by iteratively targeting the pinch-point temperature difference. The heat exchange between sCO2 and kerosene adopts the PCHE model described in the literature [45], with a specified pinch-point temperature difference of 9 K. A one-dimensional model of the precooler is developed using a discretization method [46], and the results are validated. The geometric characteristics and material parameters of the fundamental heat transfer units in the precooler. The inlet status of the hot and cold sides of the model is in Table 3:
The geometric characteristics and material parameters of the basic heat transfer unit of the precooler PCHE are in Table 4:
The calculation results are compared with the reference data in the literature in Figure 9. It can be seen that the one-dimensional model of PCHE precooler established in this paper is relatively accurate.

3.1.3. Performance Evaluation

To address the unique engineering requirements of airborne thermoelectric conversion systems, this study moves beyond the traditional ground-based systems’ limitation of evaluating performance solely through thermal efficiency. Instead, a multi-objective comprehensive evaluation framework based on the Brayton cycle is established. Unlike terrestrial applications, airborne systems necessitate prioritizing critical parameters such as coolant consumption intensity and system mass. Therefore, this work expands the evaluation dimensions to three core aspects: thermodynamic efficiency, coolant utilization, and system mass, with corresponding evaluation models developed through quantitative analytical methods.
The cycle thermal efficiency represents the system’s energy conversion capability and is defined as the ratio of the net shaft power output to the heat absorbed from the heat sources:
η = W t u r b + W c o m p Q t o t a l
where W t u r b represents turbine power, W c o m p represents compressor power consumption, and Q t o t a l represents the heat input into the system.
Although the amount of heat released to the cold source can be known if the thermal efficiency is known, the kerosene flow rate is not completely determined by the heat release but is also affected by the inlet temperature of the hot side of the precooler (when the pinch temperature is constant): inside the precooler, the outlet temperature of kerosene is affected by the inlet temperature of sCO2. If the outlet temperature of kerosene is high under the same heat release, the kerosene heat sink can be more fully utilized, and the kerosene consumption can be reduced. This is why a one-dimensional model is built for the kerosene-sCO2 PCHE precooler to calculate the kerosene mass flow rate. When evaluating the coolant consumption characteristics of thermal protection systems, a comparison is made with the traditional regenerative cooling scheme. Regenerative cooling typically employs kerosene as the coolant medium. The core mechanism involves active convective heat transfer between the kerosene and high-temperature heat sources (e.g., combustor inner walls), during which the kerosene absorbs heat and rises in temperature. However, constrained by the thermal stability limits of kerosene, its outlet temperature must be strictly controlled below a threshold of 650 K [38] to avoid thermal cracking reactions and carbon deposition, which could lead to cooling channel blockage. Therefore, this paper introduces a reference mass flow rate as a comparison based on the kerosene demand for regenerative cooling. This reference mass flow rate is defined as the kerosene consumption for regenerative cooling at an outlet temperature of 650 K:
m f r e f = Q t o t a l h f m a x h f i n
where h f m a x represents the enthalpy value of kerosene at the maximum outlet temperature of 650 K, and h f i n represents the enthalpy value of kerosene at the inlet, which can be retrieved from the NIST database [44]. In this paper, n-decane is used as a substitute for RP-3 kerosene [47].
The heat sources are the leading edge and combustor walls. Based on the content in Section 3.1.1, the aerodynamic heat power of the leading edge is selected as Q a e r o = 1159.2   k W , and the heat power of the combustor walls is Q c o m b = 2368.4   k W . The reference coolant mass flow rate m f r e f = 8.11   k g / s is derived using Equation (9).
When the sCO2 Brayton cycle is introduced, the kerosene consumption is expressed as follows:
m f = Q t o t a l ( 1 η ) h f o u t h f i n
where h f o u t represents the kerosene outlet temperature, and η represents the cycle efficiency. Q t o t a l ( 1 η ) represents the amount of heat released to the cooling source.
Compared to ground-based sCO2-CBC systems, the total weight of the Brayton cycle system on a hypersonic vehicle is critically important. As an auxiliary system, its total mass should be minimized. In this paper, the sum of the compressor, turbine, regenerator, and precooler components is taken as the total mass of the system. The mass of each component is determined by its load and either the heat-to-weight ratio (HWR) or power-to-weight ratio (PWR). The definitions of HWR and PWR for the components are as follows:
H W R = Q W e i g h t
P W R = W W e i g h t
The HWR applies to heat exchangers, while the PWR applies to turbomachinery. The HWR of heat exchangers is influenced by their structure, materials, and average temperature difference, whereas the PWR of turbomachinery depends on their design and materials. In this study, the selected HWR/PWR values for components account for both empirical data and advancements in design and manufacturing technologies. Specific details are provided in Table 5 [11]:

3.2. Model Validation

This section compares the cycle calculation results of the four basic cycle models with the literature data. Table 6 lists the parameter settings and calculation results, where ε r e c p denotes the effectiveness of the high-temperature and low-temperature recuperators, λ represents the compressor pressure ratio distribution coefficient, and x is the flow split ratio. It can be observed that the deviations between the calculation results of the models established in this study and the literature data are minimal, which is acceptable.

4. Results and Discussion

4.1. Parameter Study

A performance analysis was conducted on the above 4 groups of 12 cycle configurations, and the influence of design parameters on the cycle was explored to compare the performance of each cycle. The design parameters discussed included the maximum cycle temperature T m a x , the maximum cycle pressure P m a x , the minimum cycle temperature T m i n , and the minimum cycle pressure P m i n . The evaluation indicators were system thermal efficiency, cold source mass flow rate, and system weight. At the same time, the influence of the turbine expansion ratio distribution coefficient λ, the pressure ratio distribution coefficient τ , and the flow split ratio x on efficiency was also discussed.
The range of the maximum cycle temperature T m a x is mainly determined by the characteristics of CO2 and the limit of the turbine material. When the operating temperature is higher than 523 K, the performance of the CO2 Brayton cycle is better than that of the Rankine cycle [45]. The limit temperature of the turbine material is 1100 K, so the range of T m a x is selected as T m a x ∈ (523 K, 1073 K). The maximum cycle pressure is limited by the pipeline sealing and usually does not exceed 25 MPa. Exceeding 25 MPa will greatly increase the thickness of the system pipe wall and increase the difficulty of sealing. However, in order to obtain a wider range of cycle performance, the P m a x value range is P m a x ∈ (15 MPa, 30 MPa); the selection of the minimum cycle pressure P m i n is related to the critical pressure of CO2 (7.39 MPa). In this study, the P m i n range is P m i n ∈ (7.1 MPa, 8.8 PMa); the minimum cycle temperature range is near the critical temperature of CO2 (305 K), T m i n ∈ (305 K, 325 K).
In addition to the design parameters, non-design parameters, and environmental parameters, such as compressor efficiency, turbine efficiency, cold source parameters, and heat load power, all use the data in Table 7.

4.1.1. Effect of Maximum Temperature

For ease of presentation and comparison, each cycle was divided into single-turbine, “aero-comb”, and “comb-aero” groups according to the arrangement of the heat sources, and subsequent research plots were compared according to the groups. Figure 10 shows the effect of the maximum cycle temperature T m a x on the efficiency of each cycle: Figure 10a shows the trend of the efficiency of the single-turbine configuration with temperature for the five configurations. Before 673 K, the most efficient one is the precompression one. After the temperature is higher than 673 K, the efficiency of the recompression single-turbine is the highest; Figure 10b shows the trend of efficiency with temperature for five configurations of the “aero-comb” type. The precompression “aero-comb” configuration exhibits the best efficiency; Figure 10c shows the trend of efficiency with temperature for five configurations of the “comb-aero” type. Its overall performance is similar to the “aero-comb” type, with the precompression “aero-comb” configuration showing the best efficiency. The efficiency of the single-turbine in this study is generally lower than that of “aero-comb” and “comb-aero”. This is because, from the temperature-entropy diagram in Figure 2, it can be found that at the hot end, the single-turbine has only one “bump”, while the reheated “aero-comb” and “comb-aero” have two “bumps”. The more “bumps” there are, the larger the area enclosed by the temperature-entropy diagram, and the higher the efficiency. The efficiency of each cycle increases with the increase in the maximum temperature. This trend is consistent with the ideal Brayton cycle theory.
Figure 11 shows the effect of the cycle’s maximum temperature T m a x on the coolant consumption of each cycle. The coolant consumption of all configurations decreases with increasing maximum cycle temperature, primarily due to reduced heat rejection to the cold source. Figure 11a (single-turbine group) shows that the precompression configuration has the lowest coolant consumption, with a relatively gradual decline curve, indicating lower sensitivity of coolant flow to temperature changes in the precompression single-turbine; followed by recompression and intercooling cycles; the simple recuperative cycle has the highest coolant consumption. Figure 11b (aero-comb group) shows that the precompression configuration has the lowest coolant consumption, followed by the recompression and simple recuperative cycles; the intercooling cycle has the highest coolant consumption. Figure 11c (comb-aero group) shows that the precompression configuration still has the lowest coolant consumption, followed by the intercooling cycle and recompression cycle. For the precompression configuration with minimal flow, comparing all three figures reveals that the coolant consumption of dual-turbine configurations is slightly lower than that of single-turbine configurations.
Figure 12 shows the effect of the cycle’s maximum temperature T m a x on the mass of each cycle system. The mass of all 12 cycle configurations increases with an increasing maximum temperature. For the single-turbine group and aero-comb group, the simple recuperative and intercooling cycles have an advantage in light mass, followed by the recompression cycles. In the comb-aero group, the simple recuperative cycle has the lightest mass, followed by the precompression cycle and intercooling cycle; when T m a x < 623 K, the precompression mass is lighter; when   T m a x > 623 K, the intercooling cycle mass is lighter.

4.1.2. Effect of Minimum Temperature

Figure 13, Figure 14 and Figure 15 show the effect of the cycle’s minimum temperature T m i n on the performance of each cycle system. They respectively illustrate the impact of T m i n on system efficiency, coolant consumption, and system mass. The compressor inlet temperature, serving as the cycle minimum temperature, is typically determined by the hot-side outlet temperature of the precooler. Except for the precompression series cycles, the efficiency of each cycle first increases and then decreases with increasing compressor inlet temperature, peaking around 305 K, primarily due to changes in working fluid properties and increased compressor power consumption. Among them, the precompression configuration exhibits the best efficiency performance. Specifically, within the aero-comb and comb-aero groups, the precompression efficiency remains around 0.45 with minimal variation, indicating a low sensitivity of precompression efficiency in dual-turbine configurations to the cycle minimum temperature. Within the single-turbine group, the precompression efficiency surpasses that of recompression after T m i n > 308 K, and its trend also remains relatively flat. The area enclosed by the temperature entropy diagram of the precompression single-turbine is smaller, and the working fluid flow is less, making its efficiency far less than that of the reheated “aero-comb” and “comb-aero”. Additionally, the recompression series ranks second only to the precompression series, benefiting from the flow split in the recompression configuration, which reduces heat rejection to the cold source.
Figure 14 shows the effect of the cycle’s minimum temperature T m i n on the coolant consumption of each cycle. From the three figures, it can be seen that the coolant consumption of all configurations decreases as T m i n increases. This is primarily because an increase in T m i n leads to a rise in the hot-side inlet temperature of the precooler. With the pinch point temperature unchanged, the outlet temperature of the coolant (kerosene) increases, allowing the heat sink capacity of the kerosene to be fully utilized. That is, in Formula (9), h f o u t increases, resulting in a corresponding decrease in m f . Notably, except for the precompression configuration, which shows a gradual decrease, the consumption of all other configurations drops sharply as the temperature rises from 305 K to 307 K, and then decreases gradually from 308 K to 325 K. In the sharp decline stage, taking the recompression single-turbine as an example, the coolant mass flow rate drops from 202.2 kg/s (305 K) to 46.7 kg/s (307 K). This indicates that the cycle can appropriately increase the compressor inlet temperature to achieve a significant reduction in coolant consumption at the cost of a small efficiency loss.
Figure 15 shows the effect of the cycle’s minimum temperature T m i n on the mass of each cycle system. As for system mass, except for the precompression series configurations, whose mass first slightly decreases and then increases with increasing T m i n , the system mass of all other configurations increases as T m i n rises. The mass of the three intercooling cycle configurations is the lightest among the four groups, and their trend lines are relatively flat. This shows that the mass of the intercooling cycle is insensitive to T m i n .

4.1.3. Effect of Maximum Pressure

Figure 16, Figure 17 and Figure 18 show the effect of the cycle’s maximum pressure P m a x on the performance of each cycle system. They respectively illustrate the impact of Pmax on system efficiency, coolant mass flow, and system mass. Figure 16 shows the effect of the cycle’s maximum pressure P m a x on the efficiency of each cycle. From the figure, it can be seen that the efficiency of recompression and precompression cycles first increase and then decreases with increasing P m a x , indicating the existence of an optimal cycle pressure ratio. The efficiency of simple recuperative and intercooling configurations increases with increasing P m a x ; this increase is initially rapid, then slows, implying a reduced sensitivity of cycle efficiency to P m a x at high pressures. Within the single-turbine group, the recompression cycle exhibits the highest efficiency; within the aero-comb and comb-aero groups, the precompression configuration achieves the highest efficiency.
Figure 17 shows the effect of the cycle’s maximum pressure P m a x on the coolant mass flow of each cycle. It can be observed that the coolant mass flow of the simple recuperative, recompression, precompression, and intercooling cycles monotonically decreases as P m a x increases. Among these, the precompression configuration exhibits the largest change magnitude, indicating high sensitivity of its coolant mass flow to P m a x . This high sensitivity occurs because an increase in P m a x raises the pressure ratio of the precompression compressor, which elevates the temperature and pressure of the CO2 at the precompression compressor outlet. This, in turn, increases the CO2 temperature on the hot side of the kerosene precooler. Given an unchanged pinch point temperature difference, this results in a higher kerosene outlet temperature, thereby enabling more efficient utilization of the kerosene heat sink.
Figure 18 shows the effect of the cycle’s maximum pressure P m a x on the mass of each cycle system. From the figure, it can be observed that the mass of the precompression configuration first decreases and then increases with increasing P m a x , exhibiting a monotonically decreasing trend only within the 15–16 MPa range, followed by a monotonically increasing trend. The mass of all other configurations increases with increasing P m a x . Among the monotonically increasing sections, the precompression configuration has the steepest slope. This occurs because the power consumption of the precompression compressor increases sharply with rising P m a x , making the precompression compressor the primary contributor to the mass increase. Compared to other configurations, the intercooling and simple recuperative configurations show similar and relatively gradual growth trends, indicating a low sensitivity of their system mass to P m a x .

4.1.4. Effect of Minimum Pressure

Figure 19 shows the effect of the cycle’s minimum pressure P m i n on the performance of each cycle system. From the figure, it can be seen that the efficiency of all three intercooling configurations increases with increasing P m i n . The simple recuperative single-turbine and simple recuperative aero-comb configurations show an initial increase followed by a decrease in efficiency. The simple recuperative comb-aero configuration exhibits an increasing efficiency trend. The recompression single-turbine configuration demonstrates a monotonically increasing trend with rising P m i n . The recompression aero-comb and comb-aero configurations show an initial increase followed by a decrease in efficiency, with a relatively flat increase within a specific range (7.6 MPa to 8.5 MPa), indicating a low sensitivity of efficiency to P m i n changes in this region. The efficiency of all three precompression configurations shows a slight increasing trend with rising P m i n , demonstrating a low sensitivity to P m i n variation. Within the precompression configurations, the comb-aero configuration achieves higher efficiency than the aero-comb, while the single-turbine configuration has the lowest efficiency among the three.
Figure 20 shows the effect of the cycle’s minimum pressure P m i n on the coolant mass flow of each cycle. It can be seen that, except for the precompression series, which exhibits a relatively gradual decrease, all other configurations show a trend of first increasing and then decreasing, peaking at 7.6 MPa. The primary reason for this phenomenon relates to the utilization of the kerosene heat sink. Figure 21 displays the trend of kerosene outlet temperature with the cycle minimum pressure. Except for the precompression series cycles, the kerosene outlet temperature of all other cycles first decreases and then increases, indicating an initial deterioration followed by an improvement in the utilization of the kerosene heat sink. Notably, the coolant mass flow of the three precompression series configurations not only maintains a low level but also exhibits a low sensitivity to changes in P m i n .
Figure 22 shows the effect of the cycle’s minimum pressure P m i n on the mass of each cycle system. From the figure, it can be seen that the system mass of the three intercooling series configurations first decreases and then increases with increasing P m i n , reaching a minimum at 7.6 MPa. The system mass of the three precompression series configurations exhibits minimal variation with Pmin, indicating a low sensitivity of precompression system mass to P m i n . The mass of all other configurations first decreases rapidly with increasing P m i n (7.1 MPa to 7.6 MPa), then either slowly decreases or slightly increases between 7.6 MPa and 8.8 MPa, demonstrating a low sensitivity to P m i n within this range.

4.1.5. Effect of Expansion Ratio and Pressure Ratio

The turbine expansion ratio distribution coefficient τ is a design parameter for dual-turbine configurations, influencing cycle performance by altering the expansion ratios of the two turbines. It can be seen from Figure 23, for the simple recuperative aero-comb configuration and the intercooled aero-comb configuration, cycle efficiency increases monotonically with the rise of τ. For the recompression Aero-comb configuration, when P m a x < 20 MPa, efficiency increases with τ; when P m a x > 20 MPa, efficiency first increases and then decreases with τ. The efficiency of the precompression aero-comb configuration decreases monotonically with increasing τ. It is noteworthy that for all four configurations, higher P m a x values result in relatively flatter trend lines, implying reduced sensitivity of the aero-comb group cycle efficiency to τ under high P m a x conditions.
Figure 24 illustrates the effect of the turbine expansion ratio distribution coefficient on efficiency for various configurations in the comb-aero form. It can be observed that the efficiency of the simple recuperative comb-aero configuration, intercooled comb-aero, and recompression comb-aero configurations all exhibit a trend of first increasing and then decreasing. This indicates the existence of an optimal turbine expansion ratio distribution coefficient. Among them, the trend line of the simple recuperative comb-aero configuration is relatively flat overall, implying a low sensitivity of this configuration to the expansion ratio distribution coefficient. For the intercooled comb-aero configuration, the trend line is steep at low expansion ratio distribution coefficients (<0.8) and flat at high coefficients. The efficiency of the precompression comb-aero configuration decreases with increasing expansion ratio distribution coefficient.
Figure 25a–c illustrate the trend of efficiency with the pressure ratio distribution coefficient λ for the three intercooling configurations. It can be observed that the efficiency of all three cycles decreases with increasing λ . When λ < 1, the efficiency declines rapidly; when λ > 1, the efficiency trend line becomes flatter, indicating reduced sensitivity of cycle efficiency to λ when the secondary compressor pressure ratio exceeds 1. Figure 25d–f show the trend of efficiency with λ for the three precompression configurations. As λ increases, the efficiency of all three configurations first increases and then decreases, demonstrating the existence of an optimal pressure ratio distribution coefficient λ b s t at different P m a x levels. Furthermore, λ b s t shifts toward lower values as Pmax increases. Higher P m a x also results in flatter efficiency trend lines, indicating lower sensitivity of efficiency to λ under elevated P m a x conditions. When λ > λ b s t , cycle efficiency drops sharply. This occurs because the pressure ratio of the precompression compressor increases to a point where its power consumption exceeds the performance benefits gained from recuperation. Additionally, λ cannot exceed a certain threshold—which decreases with rising P m a x —beyond which the calculation diverges, confirming that the pressure ratio of the precompression compressor cannot be excessively large.

4.2. Multi-Objective Optimization

A simple parametric analysis cannot provide concise, intuitive, and convincing results for comparing different configurations, as varying conditions lead to divergent outcomes. Therefore, it is preferable to compare performance under their respective optimal parameter settings rather than under identical settings. By conducting multi-objective optimization for different Brayton cycles, their optimal configurations and corresponding peak performance can be obtained, thereby enabling a comparative evaluation of sCO2 Brayton cycle configurations under optimized conditions.

4.2.1. Optimization Methodology

To obtain the performance of different Brayton cycle configurations under optimal parameter settings, this section employs the Non-dominated Sorting Genetic Algorithm II (NSGA-II) to conduct multi-objective optimization for each cycle configuration [50]. This approach yields a Pareto front solution set under the optimization objectives, identifying the optimal cycle configuration to provide a reference for system design. NSGA-II is an efficient and stable multi-objective evolutionary algorithm capable of achieving trade-offs among multiple objectives and obtaining a set of non-dominated solutions that approximate the true Pareto front. The algorithm was proposed by Deb et al. and has been widely applied in numerous fields.

4.2.2. Problem Description

The objective functions for multi-objective optimization are as follows: system thermal efficiency η and coolant mass flow; system thermal efficiency η and system mass M ; as well as coolant mass flow and system mass M . The decision variables include cycle maximum temperature, cycle minimum temperature, cycle minimum pressure, cycle maximum pressure, flow split factor, turbine expansion ratio distribution coefficient, and compressor pressure ratio distribution coefficient. Considering the characteristics of the different cycle configurations mentioned above, the decision variable vector is represented as follows:
X ¯ = T m a x , P m a x , T m i n , P m i n , x                                                                           f o r   r e c o m p r e s s i o n   s i n g l e   t u r b i n e T m a x , P m a x , T m i n , P m i n , x , τ                                                                           f o r   r e c o m p r e s s i o n   d u a l   t u r b i n e T m a x , P m a x , T m i n , P m i n , λ                 f o r   i n t e r c o o l i n g   a n d   p r e c o m p r e s s i o n   s i n g l e   t u r b i n e T m a x , P m a x , T m i n , P m i n , λ , τ               f o r   i n t e r c o o l i n g   a n d   p r e c o m p r e s s i o n   d u a l   t u r b i n e
The optimization objective model for efficiency–coolant mass flow is modeled as follows:
F X = M a x ( η ) M i n ( m f )
The optimization objective model for efficiency–system mass is modeled as follows:
F X = M a x ( η ) M i n ( M )
The optimization objective model for coolant mass flow–system mass is as follows:
F X = M i n ( m f ) M i n ( M )
The variation ranges of the corresponding decision variables:
523 T m a x ( K ) 1073 15000 P m a x ( kPa ) 40000 305 T m i n ( K ) 325 7100 P m i n kPa 8800 0.1 x 0.6 1 / P m a x / P m i n < λ < P m a x / P m i n 1 / P m a x / P m i n < τ < P m a x / P m i n

4.2.3. Comparison of Cycle Configurations Based on Dual-Objective Optimization

The design parameters serve as decision variables, as shown in Equation (16), while non-design parameters refer to Table 7. Through multi-objective optimization, the optimal performance of different Brayton cycle configurations can be obtained, presented in the form of Pareto fronts. To facilitate the display of Pareto fronts for all 12 cycles, they are grouped according to simple recuperative, recompression, precompression, and intercooling cycles. Within each group, the three configurations—single-turbine, aero-comb, and comb-aero—are compared first, ultimately yielding the optimal cycle configuration.
In the dual-objective optimization of thermal efficiency η and coolant mass flow (Figure 26), within the simple recuperative group, the simple recuperative single-turbine configuration demonstrates the best performance, achieving an efficiency of 0.463 when the coolant mass flow reaches the reference mass flow rate m r e f = 8.11   kg / s . Within the recompression group, the recompression comb-aero cycle delivers optimal performance; within the precompression group, the precompression aero-comb cycle exhibits superior performance; within the intercooling group, the intercooled aero-comb cycle achieves peak performance. To facilitate further comparison, the Pareto fronts of the optimal cycles are contrasted, revealing in Figure 27 that the precompression aero-comb configuration significantly leads in performance. At the reference mass flow rate, the precompression aero-comb efficiency is 28.3% higher than the recompression comb-aero and 47.8% higher than the simple regenerative single-turbine.
In the dual-objective optimization results of thermal efficiency and system mass (Figure 28), it can be seen that the three simple recuperated cycle configurations show little difference in the evaluation of thermal efficiency and system mass, with the simple recuperated single-turbine having a slight advantage; among the three recompression cycle configurations, the single-turbine configuration has the most advanced Pareto frontier; among the three precompression cycle configurations, the aero-comb configuration has the most advanced Pareto frontier; among the three intercooling cycle configurations, the Aero-comb configuration also has the most advanced Pareto frontier. Figure 29 comprehensively compares the Pareto frontiers of the best configurations and shows that the Pareto frontiers of the precompression Aero-comb configuration and the recompression comb-aero configuration are more advanced. When the thermal efficiency is greater than 0.5, the Pareto frontier of the precompression aero-comb configuration is more advanced; when the efficiency is less than 0.5 (green dotted lines), the Pareto frontier of the recompression comb-aero configuration is more advanced.
In the dual-objective optimization results of coolant mass flow and system mass (Figure 30), the three configurations in the simple recuperated group show little difference, with the simple recuperated aero-comb configuration having a slight advantage; among the three configurations in the recompression group, the recompression single-turbine configuration has the most optimal Pareto frontier; among the three cycle configurations in the precompression group, the aero-comb configuration has the most advanced Pareto frontier. When the coolant mass flow exceeds 25 kg/s, the system mass advantage of the precompression single-turbine configuration becomes more evident; among the three configurations in the intercooling cycle, the comb-aero configuration has the most advanced Pareto frontier. Figure 31 comprehensively compares the Pareto frontiers of the best configurations and shows that within the range of 5–20 kg/s, the Pareto frontier of the precompression aero-comb configuration is more advanced.

5. Conclusions

This paper designs 12 cycle schemes for the thermoelectric conversion system with dual heat sources in a hypersonic vehicle. First, key parameter analysis of the cycles is conducted. On this basis, the NSGA-II method is used to obtain the Pareto frontiers of each cycle under different dual-objective conditions. The Pareto frontiers present the optimal set of points under the best conditions for the dual objectives, enabling a clearer comparison of the advantages and disadvantages of the configurations and providing a reference for design. The main conclusions of this study are as follows:
  • Increasing the maximum temperature T m a x of the cycle is beneficial to improving efficiency and reducing the refrigerant flow, but it will increase the weight of the system, and the maximum temperature will be limited by the temperature resistance of the turbine material;
  • Appropriately increasing the compressor inlet temperature T m i n can achieve a significant reduction in coolant mass flow rate at the cost of a relatively small efficiency loss. In the sharp decline stage, taking the recompression single-turbine as an example, the coolant mass flow rate drops from 202.2 kg/s (305 K) to 46.7 kg/s (307 K). This rule applies to all cycle layouts;
  • Compared to the other three groups, the three cycle configurations in the precompression group are distinct, primarily in that their performance—including efficiency, coolant mass flow rate, and system mass— is relatively insensitive to changes in the compressor inlet temperature T m i n and the minimum pressure P m i n . However, these cycles are more sensitive to the maximum pressure P m a x , mainly because an increase in P m a x leads to higher power consumption by the pre-compressor;
  • In the dual-objective optimization of thermal efficiency and coolant mass flow, the performance of the precompression aero-comb configuration is far superior. At the reference mass flow rate, the precompression aero-comb efficiency is 28.3% higher than the recompression comb-aero and 47.8% higher than the simple regenerative single-turbine. In the dual-objective optimization results of thermal efficiency and system mass, the Pareto frontiers of the precompression aero-comb configuration and the recompression Comb-Aero configuration are more advanced. In the dual-objective optimization results of coolant mass flow rate and system mass, within the range of 5–20 kg/s, the Pareto frontier of the precompression aero-comb configuration is more advanced. Overall, the performance of the precompression aero-comb configuration is relatively superior.
Further potential research work in this paper includes the following: developing refined models of system heat sources based on specific vehicles to determine the impact of the thermal-hydraulic characteristics of the heat sources on the system; establishing detailed models for turbomachinery and heat exchangers; conducting dynamic characteristic research on thermoelectric conversion system; and considering the integration of additional heat sources into the existing system, such as the electronics bay and the environmental control system.

Author Contributions

Conceptualization, X.Q. and H.L.; Writing—original draft preparation, X.Q.; Writing—review and editing, Z.Z. and Z.T. All authors have read and agreed to the published version of the manuscript.

Funding

This research received no external funding.

Data Availability Statement

The data that support the findings of this study are available from the corresponding author upon reasonable request.

Conflicts of Interest

The authors declare no conflicts of interest.

Abbreviations

The following abbreviations are used in this manuscript:
sCO2Supercritical Carbon Dioxide
CBCClosed Brayton Cycle
Aero-combAerodynamic heat source and combustion chamber heat source
Comb-aeroCombustion chamber heat source and aerodynamic heat source
MHDMagneto Hydro Dynamic
APUAuxiliary Power Units
RATRam Air Turbines
TEGThermoelectric Generators
PCHEPrinted Circuit Heat Exchangers
TBCCTurbine Based Combined Cycle
NSGA-IINon-dominated Sorting Genetic Algorithm II
HWRthe heat-to-weight ratio
PWRpower-to-weight ratio
PCPrecooler

Nomenclature

The following nomenclature is used in this manuscript:
inInlet
outOutlet
hHot side
cCold side
maxMaximum
sIsentropic
turbTurbine
compCompression
recpRecuperation
ηEfficiency
λCompressor pressure ratio distribution coefficient
xThe flow split ratio
τPressure ratio distribution coefficient
&Reference coolant mass flow
bstBest
mcMain compressor
rcRecompression compressor
pcPrecompression compressor
hptHigh pressure turbine
lptLow pressure turbine
hrecpHigh temperature recuperation
lrecpLow temperature recuperation

References

  1. Jackson, T.; Eklund, D.; Fink, A. High speed propulsion: Performance advantage of advanced materials. J. Mater. Sci. 2004, 39, 5905–5913. [Google Scholar] [CrossRef]
  2. Song, K.D.; Choi, S.H.; Scotti, S.J. Transpiration cooling experiment for scramjet engine combustion chamber by high heat fluxes. J. Propuls. Power 2006, 22, 96–102. [Google Scholar] [CrossRef]
  3. Kojima, T.; Taguchi, H.; Kobayashi, H.; Ueno, A. Aerodynamic Heating Rate Evaluation of Mach 5 Hypersonic Airplanes. In Proceedings of the 18th AIAA/3AF International Space Planes and Hypersonic Systems and Technologies Conference, Tours, France, 24–28 September 2012. [Google Scholar]
  4. Liu, H.; Liu, W. Thermal–structural analysis of the platelet heat-pipe-cooled leading edge of hypersonic vehicle. Acta Astronaut. 2016, 127, 13–19. [Google Scholar]
  5. Trelewicz, J.R.; Longtin, J.P.; Gouldstone, C.; Kennedy, P.J.; Donbar, J.M. Heat flux measurements in a scramjet combustor using embedded direct-write sensors. J. Propuls. Power 2015, 31, 1003–1013. [Google Scholar] [CrossRef]
  6. Zhong, F.; Fan, X.; Yu, G.; Li, J.; Sung, C.-J. Heat transfer of aviation kerosene at supercritical conditions. J. Thermophys. Heat Transf. 2009, 23, 543–550. [Google Scholar] [CrossRef]
  7. Iya, S.K.; Trikha, A.K.; Ladd, M.M. Thermal management and environmental control of hypersonic vehicles. SAE Trans. 1989, 98, 393–401. [Google Scholar]
  8. Villace, V.F.; Steelant, J. The Thermal Paradox of Hypersonic Cruisers. In Proceedings of the 20th AIAA International Space Planes and Hypersonic Systems and Technologies Conference, Glasgow, Scotland, 6–9 July 2015. [Google Scholar]
  9. Zhang, Y.; Wang, L.; Wang, S.; Wang, P.; Liao, H.; Peng, Y. Auxiliary power unit failure prediction using quantified generalized renewal process. Microelectron. Reliab. 2018, 84, 215–225. [Google Scholar] [CrossRef]
  10. Surhone, L.M.; Tennoe, M.T.; Henssonow, S.F. Ram Air Turbine; Collins Aerospace: Wilson, NC, USA, 2010. [Google Scholar]
  11. Ma, X.; Jiang, P.; Zhu, Y. Modeling and performance analysis of a pre-cooling and power generation system based on the supercritical CO2 Brayton cycle on turbine-based combined cycle engines. Energy 2023, 284, 128540. [Google Scholar] [CrossRef]
  12. Alkhulaifi, Y.M.; Qasem, N.A.; Zubair, S.M. Exergoeconomic assessment of the ejector-based battery thermal management system for electric and hybrid-electric vehicles. Energy 2022, 245, 123252. [Google Scholar] [CrossRef]
  13. Kalkan, O.; Celen, A.; Bakirci, K. Multi-objective optimization of a mini channeled cold plate for using thermal management of a Li-Ion battery. Energy 2022, 251, 123949. [Google Scholar] [CrossRef]
  14. Schneider, S.; Blankson, I.; Adamovich, I.; Rich, J. Magnetogasdynamic Inlet Power Extraction for a Gas Turbine. In Proceedings of the 34th AIAA Plasmadynamics and Lasers Conference, Orlando, FL, USA, 23–26 June 2003. [Google Scholar]
  15. Macheret, S.O.; Shneider, M.N.; Miles, R.B. Magnetohydrodynamic power extraction from cold hypersonic airflows with external ionizers. J. Propuls. Power 2002, 18, 424–431. [Google Scholar] [CrossRef]
  16. Cheng, K.; Qin, J.; Zhang, D.; Bao, W.; Jing, W. Performance evaluation for a combined power generation system of closed-Brayton-cycle and thermoelectric generator with finite cold source at room temperature on hypersonic vehicles. Energy 2022, 254, 124444. [Google Scholar] [CrossRef]
  17. Cheng, K.; Qin, J.; Jiang, Y.; Lv, C.; Zhang, S.; Bao, W. Performance assessment of multi-stage thermoelectric generators on hypersonic vehicles at a large temperature difference. Appl. Therm. Eng. 2018, 130, 1598–1609. [Google Scholar] [CrossRef]
  18. Cheng, K.; Qin, J.; Jiang, Y.; Zhang, S.; Bao, W. Performance comparison of single-and multi-stage onboard thermoelectric generators and stage number optimization at a large temperature difference. ” Appl. Therm. Eng. 2018, 141, 456–466. [Google Scholar] [CrossRef]
  19. Bass, J.C.; Elsner, N.B.; Leavitt, F.A. Performance of the 1 kW thermoelectric generator for diesel engines. AIP Conf. Proc. 1994, 316, 295–298. [Google Scholar]
  20. Kushch, A.S.; Bass, J.C.; Ghamaty, S.; Eisner, N.B. Thermoelectric development at Hi-Z technology. In Proceedings of the ICT2001. 20 International Conference on Thermoelectrics (Cat. No. 01TH8589), Beijing, China, 8–11 June 2001; IEEE: Piscataway, NJ, USA, 2001. [Google Scholar]
  21. Sforza, P. Electric power generation onboard hypersonic aircraft. In Proceedings of the 45th AIAA/ASME/SAE/ASEE Joint Propulsion Conference & Exhibit, Denver, CO, USA, 2–5 August 2009. [Google Scholar]
  22. Bao, W.; Qin, J.; Zhou, W.; Yu, D. Parametric performance analysis of multiple re-cooled cycle for hydrogen fueled scramjet. Int. J. Hydrogen Energy 2009, 34, 7334–7341. [Google Scholar] [CrossRef]
  23. Zhang, D.; Qin, J.; Feng, Y.; Ren, F.; Bao, W. Performance evaluation of power generation system with fuel vapor turbine onboard hydrocarbon fueled scramjets. Energy 2014, 77, 732–741. [Google Scholar] [CrossRef]
  24. Wu, P.; Ma, Y.; Gao, C.; Liu, W.; Shan, J.; Huang, Y.; Wang, J.; Zhang, D.; Ran, X. A review of research and development of supercritical carbon dioxide Brayton cycle technology in nuclear engineering applications. Nucl. Eng. Des. 2020, 368, 110767. [Google Scholar] [CrossRef]
  25. Padilla, R.V.; Too, Y.C.; Benito, R.; Stein, W. Exergetic analysis of supercritical CO2 Brayton cycles integrated with solar central receivers. Appl. Energy 2015, 148, 348–365. [Google Scholar] [CrossRef]
  26. Jiang, P.X.; Zhang, F.Z.; Xu, R.N. Thermodynamic analysis of a solar–enhanced geothermal hybrid power plant using CO2 as working fluid. Appl. Therm. Eng. 2017, 116, 463–472. [Google Scholar] [CrossRef]
  27. Pan, M.; Zhu, Y.; Bian, X.; Liang, Y.; Lu, F.; Ban, Z. Theoretical analysis and comparison on supercritical CO2 based combined cycles for waste heat recovery of engine. Energy Convers. Manag. 2020, 219, 113049. [Google Scholar] [CrossRef]
  28. Li, H.; Liu, H.; Zou, Z. Experimental study and performance analysis of high-performance micro-channel heat exchanger for hypersonic precooled aero-engine. Appl. Therm. Eng. 2021, 182, 116108. [Google Scholar] [CrossRef]
  29. Zou, Z.; Wang, Y.; Li, H.; Chen, Y.; Yao, L.; Li, H.; Liu, H. Thermal-hydraulic characteristics of a PCHE with zigzag microchannel for hypersonic precooled aero-engines: An experimental study. Exp. Heat Transf. 2023, 36, 1012–1033. [Google Scholar] [CrossRef]
  30. Cheng, K.; Qin, J.; Sun, H.; Li, H.; He, S.; Zhang, S.; Bao, W. Power optimization and comparison between simple recuperated and recompressing supercritical carbon dioxide Closed-Brayton-Cycle with finite cold source on hypersonic vehicles. Energy 2019, 181, 1189–1201. [Google Scholar] [CrossRef]
  31. Liang, G.U.; Liping, P.A.; Xiaodong, Y.A.; Jingquan, Z.H.; Desheng, M.A. A power and thermal management system for long endurance hypersonic vehicle. Chin. J. Aeronaut. 2023, 36.2, 29–40. [Google Scholar]
  32. Guo, L.; Pang, L.; Zhao, J.; Yang, X. Optimization of power and thermal management system of hypersonic vehicle with finite heat sink of fuel. Energies 2022, 15, 5332. [Google Scholar] [CrossRef]
  33. Ma, Y.; Xie, G.; Manca, O. Thermodynamic analysis and the recuperator’s effects on two cycle systems aiming for hypersonic vehicles. Therm. Sci. Eng. Prog. 2022, 34, 101432. [Google Scholar] [CrossRef]
  34. Cheng, K.; Xu, J.; Dang, C.; Qin, J.; Jing, W. Performance evaluation of fuel indirect cooling based thermal management system using liquid metal for hydrocarbon-fueled scramjet. Energy 2022, 260, 125068. [Google Scholar] [CrossRef]
  35. Miao, H.; Wang, Z.; Niu, Y. Performance analysis of cooling system based on improved supercritical CO2 Brayton cycle for scramjet. Appl. Therm. Eng. 2020, 167, 114774. [Google Scholar] [CrossRef]
  36. Miao, H.; Wang, Z.; Niu, Y. Key issues and cooling performance comparison of different closed Brayton cycle based cooling systems for scramjet. Appl. Therm. Eng. 2020, 179, 115751. [Google Scholar] [CrossRef]
  37. Ma, X.; Jiang, P.; Zhu, Y. Dynamic simulation and analysis of transient characteristics of a thermal-to-electrical conversion system based on supercritical CO2 Brayton cycle in hypersonic vehicles. Appl. Energy 2024, 359, 122686. [Google Scholar] [CrossRef]
  38. Ma, X.; Jiang, P.; Zhu, Y. Performance analysis and dynamic optimization of integrated cooling and power generation system based on supercritical CO2 cycle for turbine-based combined cycle engine. Appl. Therm. Eng. 2022, 215, 118867. [Google Scholar] [CrossRef]
  39. Yu, T.; Guo, X.; Min, J.; Tang, Y. Numerical analysis on the active cooling characteristics for a hypersonic vehicle leading edge and coolant distribution strategy. Int. J. Therm. Sci. 2025, 211, 109703. [Google Scholar] [CrossRef]
  40. Xu, J.; Cheng, K.; Dang, C.; Wang, Y.; Liu, Z.; Qin, J.; Liu, X. Performance comparison of liquid metal cooling system and regenerative cooling system in supersonic combustion ramjet engines. Energy 2023, 275, 127488. [Google Scholar] [CrossRef]
  41. Zhang, X.; Guo, W.; Gao, G.; Xi, W.; Liu, J.; Sunden, B. Numerical investigations of flow and heat transfer characteristics of a regenerative cooling channel using supercritical CO2 with different cross-section shapes. Int. J. Therm. Sci. 2025, 215, 109965. [Google Scholar] [CrossRef]
  42. Sun, J. Research on the Working Mechanism of the Leading Edge Thermal Protection Structure of Hypersonic Aircraft; National University of Defense Technology: Changsha, China, 2013. [Google Scholar]
  43. Ma, X. Study on Coupled Heat Transfer of Scramjet Combustion Chamber and Its Cooling Structure; Harbin Institute of Technology: Harbin, China, 2007. [Google Scholar]
  44. Nist. NIST 12: Thermodynamic and Transport Properties of Pure Fluids; NIST Stand Reference Database Number 12, Version 5.0; National Institute of Standards and Technology: Gaithersburg, MD, USA, 2000. [Google Scholar]
  45. Marchionni, M.; Chai, L.; Bianchi, G.; Tassou, S.A. Numerical modelling and transient analysis of a printed circuit heat exchanger used as recuperator for supercritical CO2 heat to power conversion systems. Appl. Therm. Eng. 2019, 161, 114190. [Google Scholar] [CrossRef]
  46. Yao, L.; Zou, Z. A one-dimensional design methodology for supercritical carbon dioxide Brayton cycles: Integration of cycle conceptual design and components preliminary design. Appl. Energy 2020, 276, 115354. [Google Scholar] [CrossRef]
  47. Edwards, T. Cracking and deposition behavior of supercritical hydrocarbon aviation fuels. Combust. Sci. Technol. 2006, 178, 307–334. [Google Scholar] [CrossRef]
  48. Dostal, V. A Super Critical Carbon Dioxide Cycle for Next Generation Nuclear Reactors. Mass. Inst. Technol. 2004, 154, 265–282. [Google Scholar]
  49. Ahn, Y.; Bae, S.J.; Kim, M.; Cho, S.K.; Baik, S.; Lee, J.I.; Cha, J.E. Review of Supercritical CO2 Power Cycle Technology and Current Status OF Research and Development. Nucl. Eng. Technol. 2015, 47, 647–661. [Google Scholar] [CrossRef]
  50. Deb, K.; Agrawal, S.; Pratap, A.; Meyarivan, T. A fast elitist non-dominated sorting genetic algorithm for multi-objective optimization: NSGA-II. In International Conference on Parallel Problem Solving from Nature; Springer: Berlin/Heidelberg, Germany, 2000; pp. 849–858. [Google Scholar]
Figure 1. Aero-comb and comb-aero T-S diagrams.
Aerospace 12 00575 g001
Figure 2. Single recuperation three kinds of layout and T-S diagrams.
Aerospace 12 00575 g002
Figure 3. Recompression of three kinds of layouts and T-S diagrams.
Aerospace 12 00575 g003
Figure 4. Precompression of three kinds of layouts and T-S diagrams.
Aerospace 12 00575 g004aAerospace 12 00575 g004b
Figure 5. Intercooling of three kinds of layouts and T-S diagrams.
Aerospace 12 00575 g005aAerospace 12 00575 g005b
Figure 6. Aerodynamic leading edge active convection cooling solution: (a) Schematic diagram of aerodynamic leading edge; (b) rectangular channel.
Aerospace 12 00575 g006
Figure 7. Thermal load distribution along the aerodynamic leading edge.
Aerospace 12 00575 g007
Figure 8. Ramjet combustion chamber structure and thermal characteristics [43].
Aerospace 12 00575 g008
Figure 9. Comparison of temperature and pressure drop along the PCHE channel: (a) Temperature distribution; (b) pressure distribution.
Aerospace 12 00575 g009
Figure 10. Effect of maximum temperature on cycle efficiency: (a) single; (b) aero-comb; (c) comb-aero.
Aerospace 12 00575 g010
Figure 11. Effect of maximum temperature on coolant mass flow: (a) single; (b) aero-comb; (c) comb-aero.
Aerospace 12 00575 g011
Figure 12. Effect of maximum temperature on system mass. (a) single; (b) aero-comb; (c) comb-aero.
Aerospace 12 00575 g012
Figure 13. Effect of minimum temperature on cycle efficiency: (a) single; (b) aero-comb; (c) comb-aero.
Aerospace 12 00575 g013
Figure 14. Effect of minimum temperature on coolant mass flow: (a) single; (b) aero-comb; (c) comb-aero.
Aerospace 12 00575 g014
Figure 15. Effect of minimum temperature on system mass: (a) single; (b) aero-comb; (c) comb-aero.
Aerospace 12 00575 g015
Figure 16. Effect of maximum pressure on cycle efficiency: (a) single; (b) aero-comb; (c) comb-aero.
Aerospace 12 00575 g016
Figure 17. Effect of maximum pressure on coolant mass flow: (a) single; (b) aero-comb; (c) comb-aero.
Aerospace 12 00575 g017
Figure 18. Effect of maximum pressure on system mass: (a) single; (b) aero-comb; (c) comb-aero.
Aerospace 12 00575 g018
Figure 19. Effect of minimum pressure on cycle efficiency: (a) single; (b) aero-comb; (c) comb-aero.
Aerospace 12 00575 g019
Figure 20. Effect of minimum pressure on coolant mass flow: (a) single; (b) aero-comb; (c) comb-aero.
Aerospace 12 00575 g020
Figure 21. Variation trend of precooler kerosene outlet temperature with cycle minimum pressure: (a) single; (b) aero-comb; (c) comb-aero.
Aerospace 12 00575 g021
Figure 22. Effect of minimum pressure on system mass: (a) single; (b) aero-comb; (c) comb-aero.
Aerospace 12 00575 g022
Figure 23. Effect of expansion ratio distribution coefficient on cycle efficiency (aero-comb group).
Aerospace 12 00575 g023
Figure 24. Effect of expansion ratio distribution coefficient on cycle efficiency (comb-aero group).
Aerospace 12 00575 g024
Figure 25. Effect of pressure ratio distribution coefficient on cycle efficiency.
Aerospace 12 00575 g025
Figure 26. Comparison of the Pareto optimal front between different layouts: Efficiency-coolant mass flow.
Aerospace 12 00575 g026
Figure 27. Pareto fronts of the optimal layouts: Efficiency-coolant mass flow rate.
Aerospace 12 00575 g027
Figure 28. Comparison of the Pareto optimal front between different sCO2 cycle layouts: Efficiency-system mass.
Aerospace 12 00575 g028
Figure 29. Pareto fronts of the optimal layouts: Efficiency-system mass.
Aerospace 12 00575 g029
Figure 30. Comparison of the Pareto optimal front between different sCO2 cycle layouts: Coolant mass flow rate-system mass.
Aerospace 12 00575 g030
Figure 31. Pareto fronts of the optimal layouts: Coolant mass flow rate-system mass.
Aerospace 12 00575 g031
Table 1. Two heat sources heat load.
Heat Source LocationHeat Load [kW]
Leading edge1159.2
Combustion wall2368.4
Table 2. The state of kerosene.
StatusValues
Inlet temperature [K]295
Inlet pressure [MPa]3
Table 3. Precooler hot and cold side inlet status.
StatusHot SideCold Side
Mass flux [kg/m2]509.3509.3
Inlet temperature [K]673.15373.15
Inlet pressure [bar]75150
Table 4. PCHE geometric characteristics and material parameters [38].
NameValues
Wetted perimeter [mm]5.14
Hydraulic diameter [mm]1.22
Cross-sectional area [mm2]1.57
Length [mm]272.00
Plate thickness [mm]1.63
Channel surface roughnessNeglected
MaterialStainless steel 316 L
Table 5. HWR/PWR of each component [11].
ComponentHWR/PWR [kW/kg]
sCO2 compressor4
sCO2 turbine4
Recuperator45
Precooler10
Table 6. Model validation of all layouts.
Parameters
and Variables
Simple
Recuperation
RecompressionPrecompressionInter-Cooling
T m i n [K]305.15305.15305.15305.15
P m i n [kPa]7353750075007500
T m a x [K]823.15823.15823.15823.15
P m a x [MPa]25252525
η c o m 0.890.880.850.88
η t u r b 0.930.920.900.92
ε r e c p 0.950.950.950.95
λ 0.6341
x 0.31
Ref values40.39% [48]43.84% [49]39.08% [49]40.39% [49]
Results39.98%44.04%39.76%39.98%
Error1.01%0.45%1.70%−1.01%
Table 7. Cycle non-design parameters and other parameters.
Fixed ParametersValues
Maximum cycle temperature, T m a x [K]723
Minimum cycle temperature, T m i n [K]305
Maximum cycle pressure, P m a x [MPa]20
Minimum cycle pressure, P m i n [MPa]7.7
Ratio of pressure ratio, λ 1.0
Expansion ratio, τ 1.0
Split ratio, x 0.3
Compressor efficiency, η m c , η r c , η p c 0.8
Turbine efficiency, η h p t , η l p t 0.9
Recuperator effectiveness, ε h r e c p , ε l r e c p 0.95
Fuel inlet temperature [ K ] 295
Fuel inlet pressure,   [ M P a ] 3
Aerodynamic heat load, [kW]1159.2
Combustion chamber wall heat load, [kW]2368.4
Disclaimer/Publisher’s Note: The statements, opinions and data contained in all publications are solely those of the individual author(s) and contributor(s) and not of MDPI and/or the editor(s). MDPI and/or the editor(s) disclaim responsibility for any injury to people or property resulting from any ideas, methods, instructions or products referred to in the content.

