1. Introduction
Innovation in atmospheric supersonic flight technology is crucial for realizing supersonic and hypersonic passenger aircraft, as well as reusable spaceplanes. The Aerospace Plane Research Center at the Muroran Institute of Technology is developing a small-scale supersonic flight experiment vehicle as a flying testbed for technical demonstrations in high-speed flight environments [
1]. This vehicle will be equipped with a gas generator cycle air turbo ramjet (GG-ATR) engine suitable for high-speed flight [
2]. Furthermore, bioethanol (BE) will be used as the fuel, and liquid oxygen (LOX) will be used as an oxidizer. Storage tanks for the BE and LOX will be installed on the experimental aircraft. There are concerns that sloshing may occur in these due to changes in acceleration during flight. Fuel tank sloshing is known to have adverse effects on the flight dynamics of aircraft and spacecraft. Furthermore, when the remaining liquid in the tank becomes low, gas entrainment in the discharged fuel may occur due to liquid movement caused by sloshing, which can potentially lead to engine malfunctions.
Sloshing within aircraft fuel tanks is a concern due to its potential impact on the aircraft’s responsiveness and stability. Studies have been conducted on mechanical models of sloshing specific to aircraft [
3,
4]. Recently, in hydrogen-powered aircraft aimed at reducing environmental impacts, the sloshing of liquid hydrogen in fuel tanks has been identified as a possible risk to flight stability. As a result, the installation of baffles in the tanks to suppress sloshing [
5].
On the other hand, when gas entrainment caused by fuel movement within a tank is suppressed in an aircraft, engine malfunctions can be prevented, and this can be achieved with less remaining fuel, thereby extending the aircraft’s range. To suppress gas entrainment, it is considered effective to apply a propellant management device (PMD), which are commonly used in spacecraft propellant tanks [
6,
7,
8], to aircraft fuel tanks. However, no examples of the application of PMDs to aircraft tanks have been found. This study explored the application of a propellant management device (PMD) as a method to suppress gas entrainment in BE and LOX tanks for our small-scale supersonic flight experiment vehicle.
PMDs are categorized into two types: those that forcibly separate the gas and liquid phase using a rubber diaphragm [
6,
7,
8,
9,
10], and those that utilize surface tension to separate the gas and liquid phases and collect the liquid [
6,
7,
8,
11,
12,
13,
14,
15]. Diaphragms have restrictions for compatibility with liquids and cannot be applied to cryogenic liquids such as liquid oxygen. In this study, we therefore considered applying a surface tension type approach. The surface tension type can be further subcategorized into vane [
12], sponge [
13], and screen channel types [
14]. The vane type acquires liquid by utilizing the capillary force acting on the meniscus formed between the thin plates and the tank wall, with the plates installed along the inner surface of the tank [
12]. The sponge type acquires liquid through capillary forces acting between multiple thin plates arranged radially [
13]. However, the curvature radius of the free surface formed in these types is large, resulting in a small capillary force available for liquid acquisition. Therefore, the applicable accelerations for these types are minimal, and they are primarily applied in the propellant tanks of spacecraft that require liquid acquisition in microgravity environments [
6]. On the other hand, the screen channel type forms a liquid film on the surface of a mesh screen, enabling gas–liquid separation and liquid acquisition. The curvature radius of the free surface formed on the mesh surface is in the order of micrometers, equivalent to the scale of the mesh openings, enabling this type to produce an exceptionally large capillary force. As a result, the applicable acceleration level is significantly increased [
6].
This study investigates the application of the screen channel type, which is capable of operating under the high-acceleration conditions encountered during flight. In this configuration, under high acceleration or high discharge flow rate conditions, the pressure difference across the free surface on the mesh screen can exceed the capillary pressure, resulting in gas entrainment into the interior of the PMD [
6,
7,
8,
11,
14,
15]. To identify the bubble point condition at which gas ingestion occurs, extensive research has been conducted on the screen channel type. In recent years, fundamental experiments using cryogenic liquids such as hydrogen have been conducted, along with the development of physical models and numerical analyses [
16,
17,
18].
The ultimate objective of this study is to develop a PMD utilizing the screen channel type and aimed at suppressing gas entrainment. Conventional screen-channel-type PMDs are designed with a screen channel installed on one face of a rectangular flow channel, which is oriented toward the tank wall to collect liquid adhering to the inner surface of the tank [
6,
7,
8,
11,
14,
15,
16,
17,
18]. In this study, a method is adopted in which the screen mesh is formed into a cylindrical shape and used as a liquid acquisition nozzle. By using this nozzle, liquid can be acquired from the entire circumference, increasing the effective flow area and reducing the flow velocity through the mesh, which results in a lower pressure loss across the screen. As a result, an improvement in liquid acquisition performance can be expected. The authors previously fabricated a prototype PMD and conducted a liquid discharge test by using pure water as a simulated propellant [
19]. As a result, we confirmed that gas entrainment could be suppressed at the designed flow rate [
19]. However, the discharge flow rate during the discharge tests was not constant; therefore, it was not possible to confirm the suppression of gas entrainment under the continuous design flow rate [
19]. In the present study, the pressure distribution inside the PMD was obtained through a flow analysis, and the effects of the length of the mesh screen nozzle on liquid film formation on the mesh screen surface and gas entrainment were investigated experimentally. Through these efforts, the specifications for a PMD capable of suppressing gas entrainment at the design flow rate were clarified.
2. Design of the Propellant Management Device PMD
Figure 1 presents an overview of the small-scale supersonic flight experiment vehicle and propulsion system targeted in this research [
19,
20]. In addition,
Table 1 presents the general specification of this experimental vehicle [
19]. As depicted in
Figure 1, the tanks for BE (fuel) and LOX (oxidizer) are installed on the aircraft, and BE and LOX are supplied to the engine via pressurization with nitrogen gas (GN2). Based on an analysis of the engine system, the BE and LOX flow rates during rated operation were determined to be 36 L/min and 12 L/min, respectively.
As previously mentioned, gas pressurization is employed for propellant supply in this flight experiment vehicle. In contrast, practical aerospace systems such as hydrogen-powered aircraft typically employ pump pressurization systems [
5]. Gas-pressurized systems exhibit greater changes in tank pressure and gas phase temperature than pump-based systems. For storable propellants such as ethanol or kerosene, the gas phase temperature decreases during discharge; however, the change in liquid phase temperature is considered small due to the significantly larger heat capacity of the liquid phase compared to the gas phase. Therefore, variations in thermophysical properties that influence sloshing and gas entrainment, such as density, viscosity, and surface tension, are expected to be minimal. Consequently, the effect of gas phase temperature changes on sloshing behavior and liquid acquisition characteristics is considered negligible. In contrast, for cryogenic propellants such as LOX and liquid hydrogen, the temperature of the vapor phase exceeds that of the liquid phase, resulting in heat transfer from the vapor phase to the liquid phase. Furthermore, it is known that sloshing enhances the heat transfer between the gas and liquid phases, thereby increasing the extent of phase change and resulting in larger fluctuations in tank pressure [
21,
22]. Excessive heat input to the liquid phase can induce bubbling within the liquid, which may adversely affect the liquid acquisition performance of the screen channel. To prevent this situation, it is necessary to suppress sloshing and to carefully consider the heat transfer behavior inside the tank; however, these aspects are designated as subjects for future research.
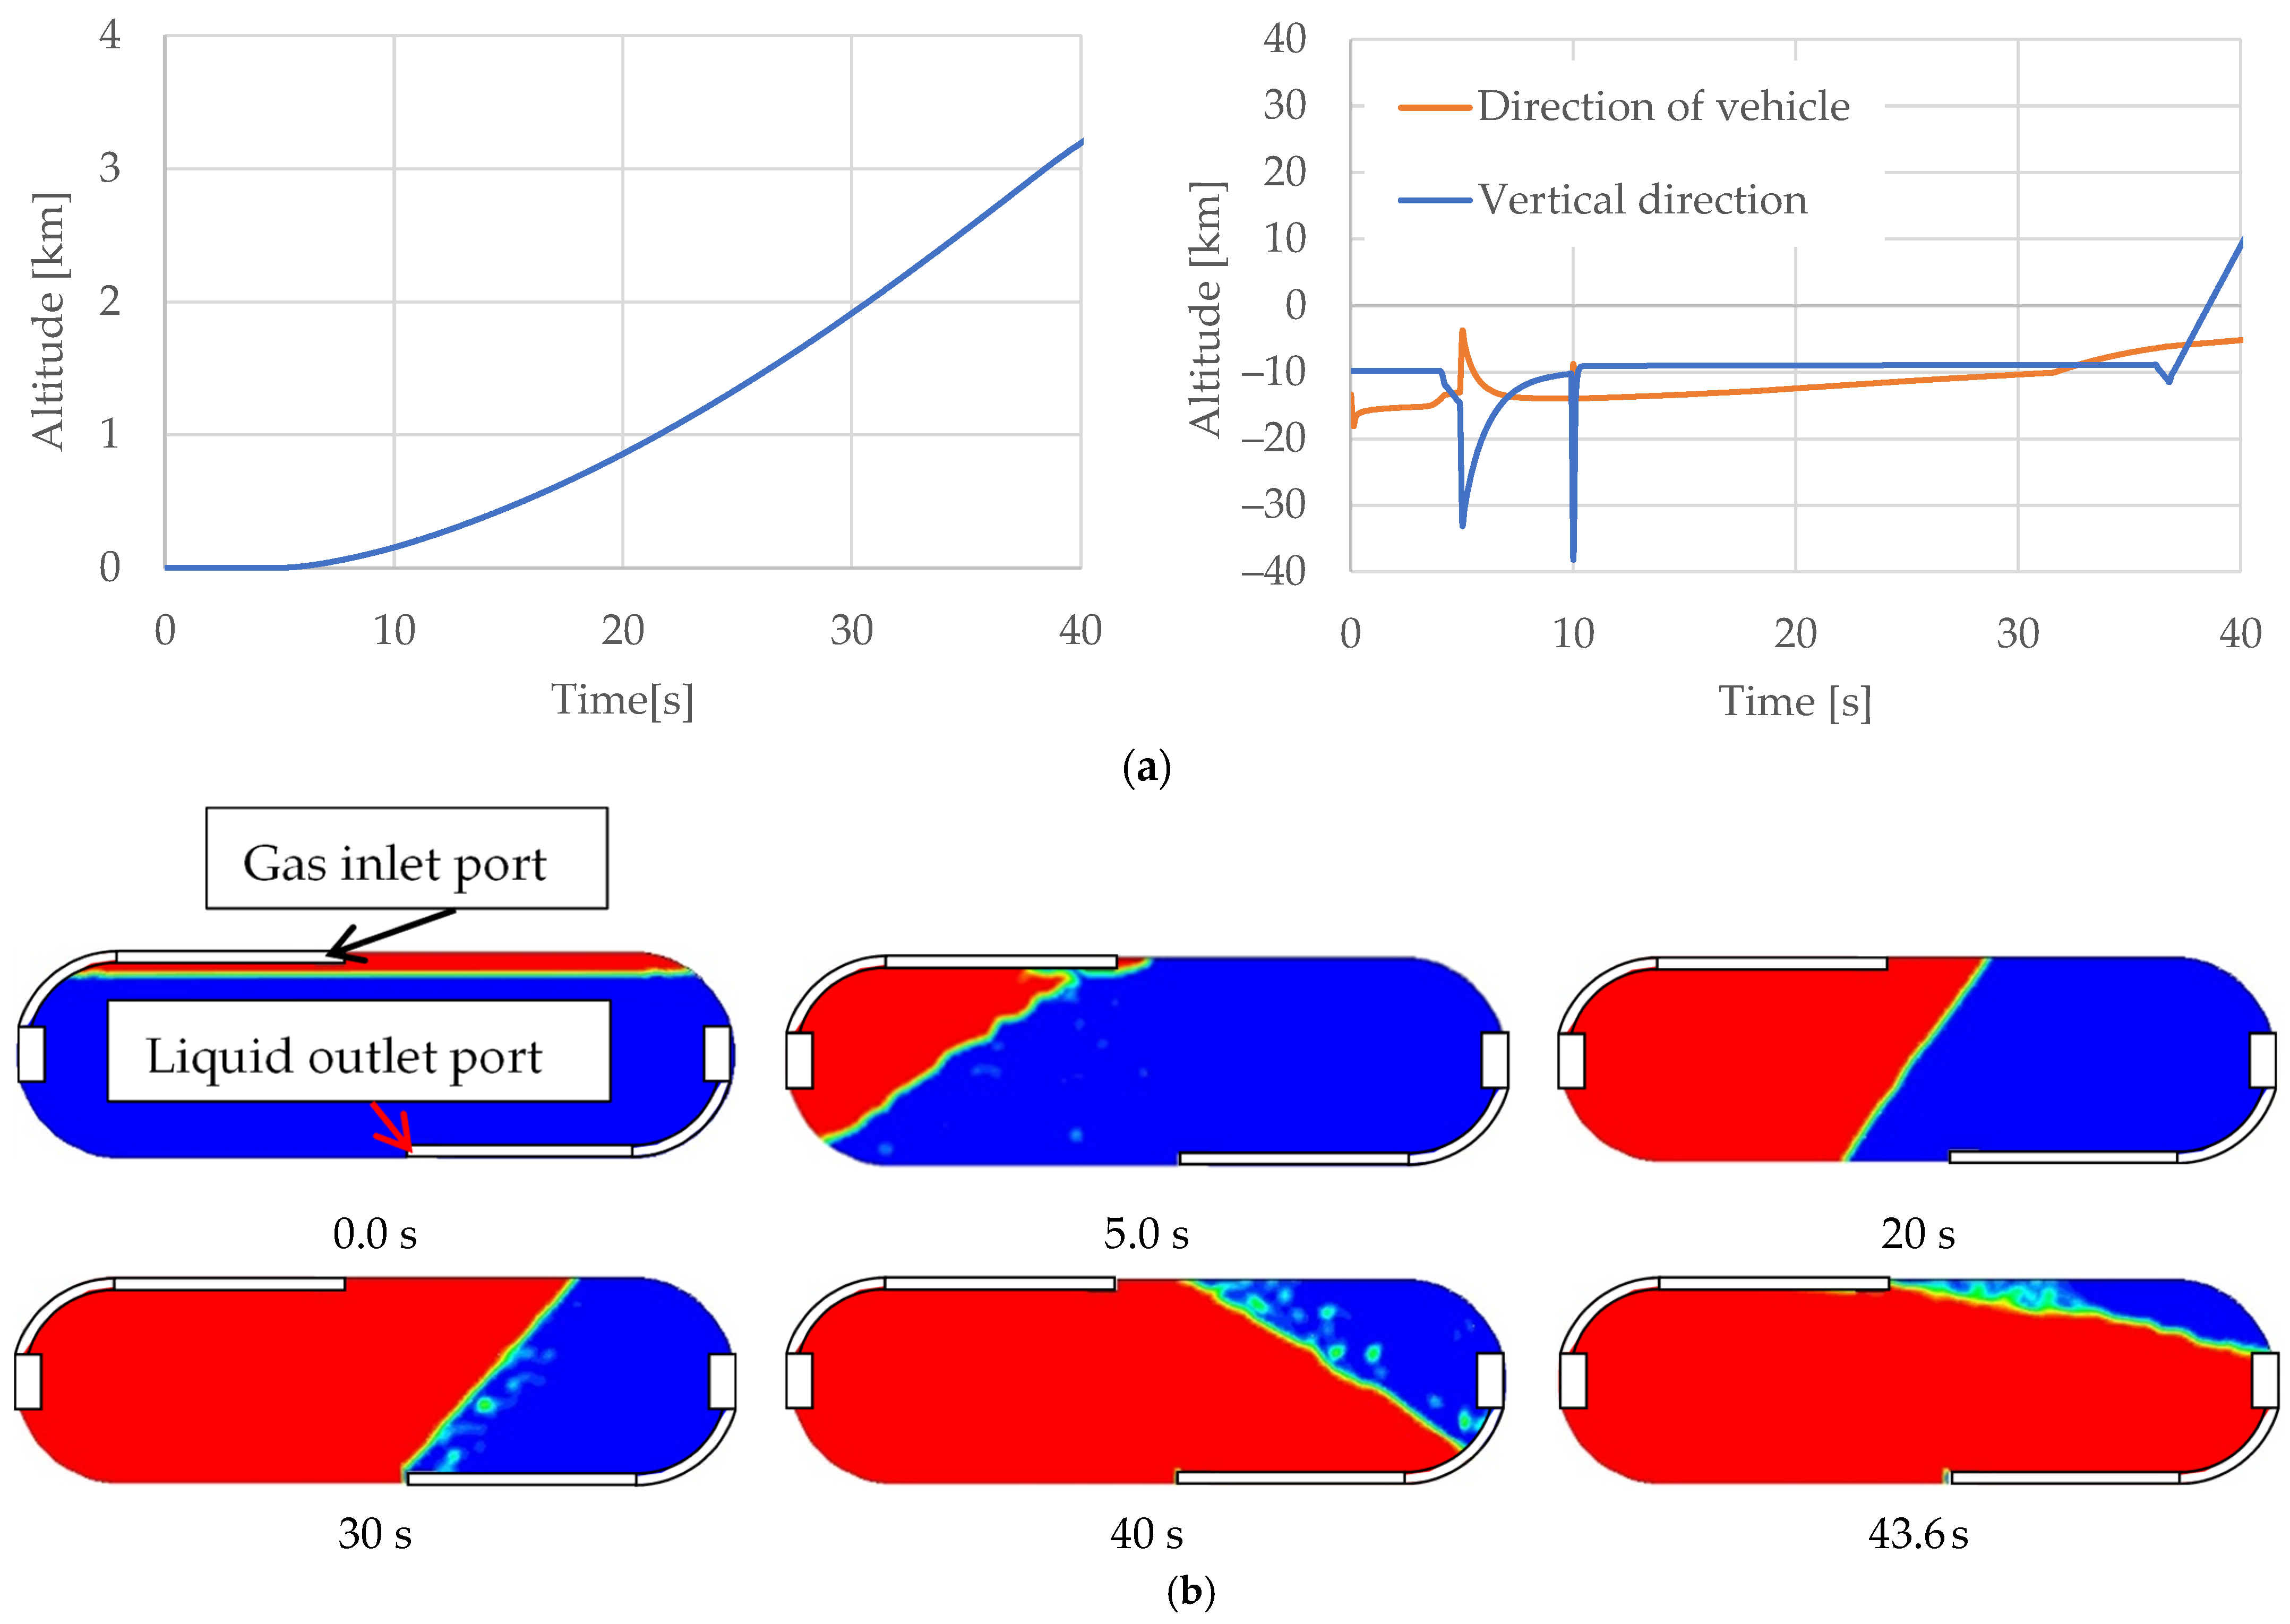
Figure 2 illustrates the flight sequence designed to achieved a Mach number of 1.0 for the small-scale supersonic flight experiment vehicle equipped with this tank, as well as the behavior of the liquid inside the tank [
20,
23]. These results were obtained by inputting the time history of the acceleration obtained from a flight analysis of the experiment vehicle into a two-dimensional computational fluid dynamics (CFD) analysis of the flow behavior inside the tank [
23]. As illustrated in this figure, for 30 s after the start of the flight, the free surface becomes inclined due to the vehicle’s vertical downward acceleration and the nose, and it moves parallel to the liquid outlet. After this, the nose is raised and a vertically upward relative acceleration occurs, causing the liquid phase to move vertically upward. If a liquid discharge port is provided at the bottom of the tank due to the movement of the liquid phase, the gas phase will face the liquid discharge port after 30–40 s, and the gas phase will be entrained into the liquid phase.
In the PMD used in this study, we aimed to suppress the entrainment of the gas phase during liquid discharge, even in the presence of the aforementioned liquid behavior during the experimental vehicle’s flight. As described in
Section 1, this study aimed to develop screen a channel type PMD. The screen-channel-type PMD used in spacecraft propellant tanks consists of multiple rectangular cross-section channels installed along the inner wall of the tank with a defined gap, where the mesh screen is mounted only on the side of each channel facing the tank wall [
6,
7,
8,
11,
14,
15,
16,
17,
18]. This configuration is designed to accommodate the characteristic liquid behavior in microgravity, where the liquid tends to adhere to the tank wall due to wetting phenomena. Furthermore, by installing the mesh screen on only one side of the channel, the mechanical strength of the structure is preserved, ensuring robustness to the vibrational and high-acceleration environments experienced during spacecraft launch.
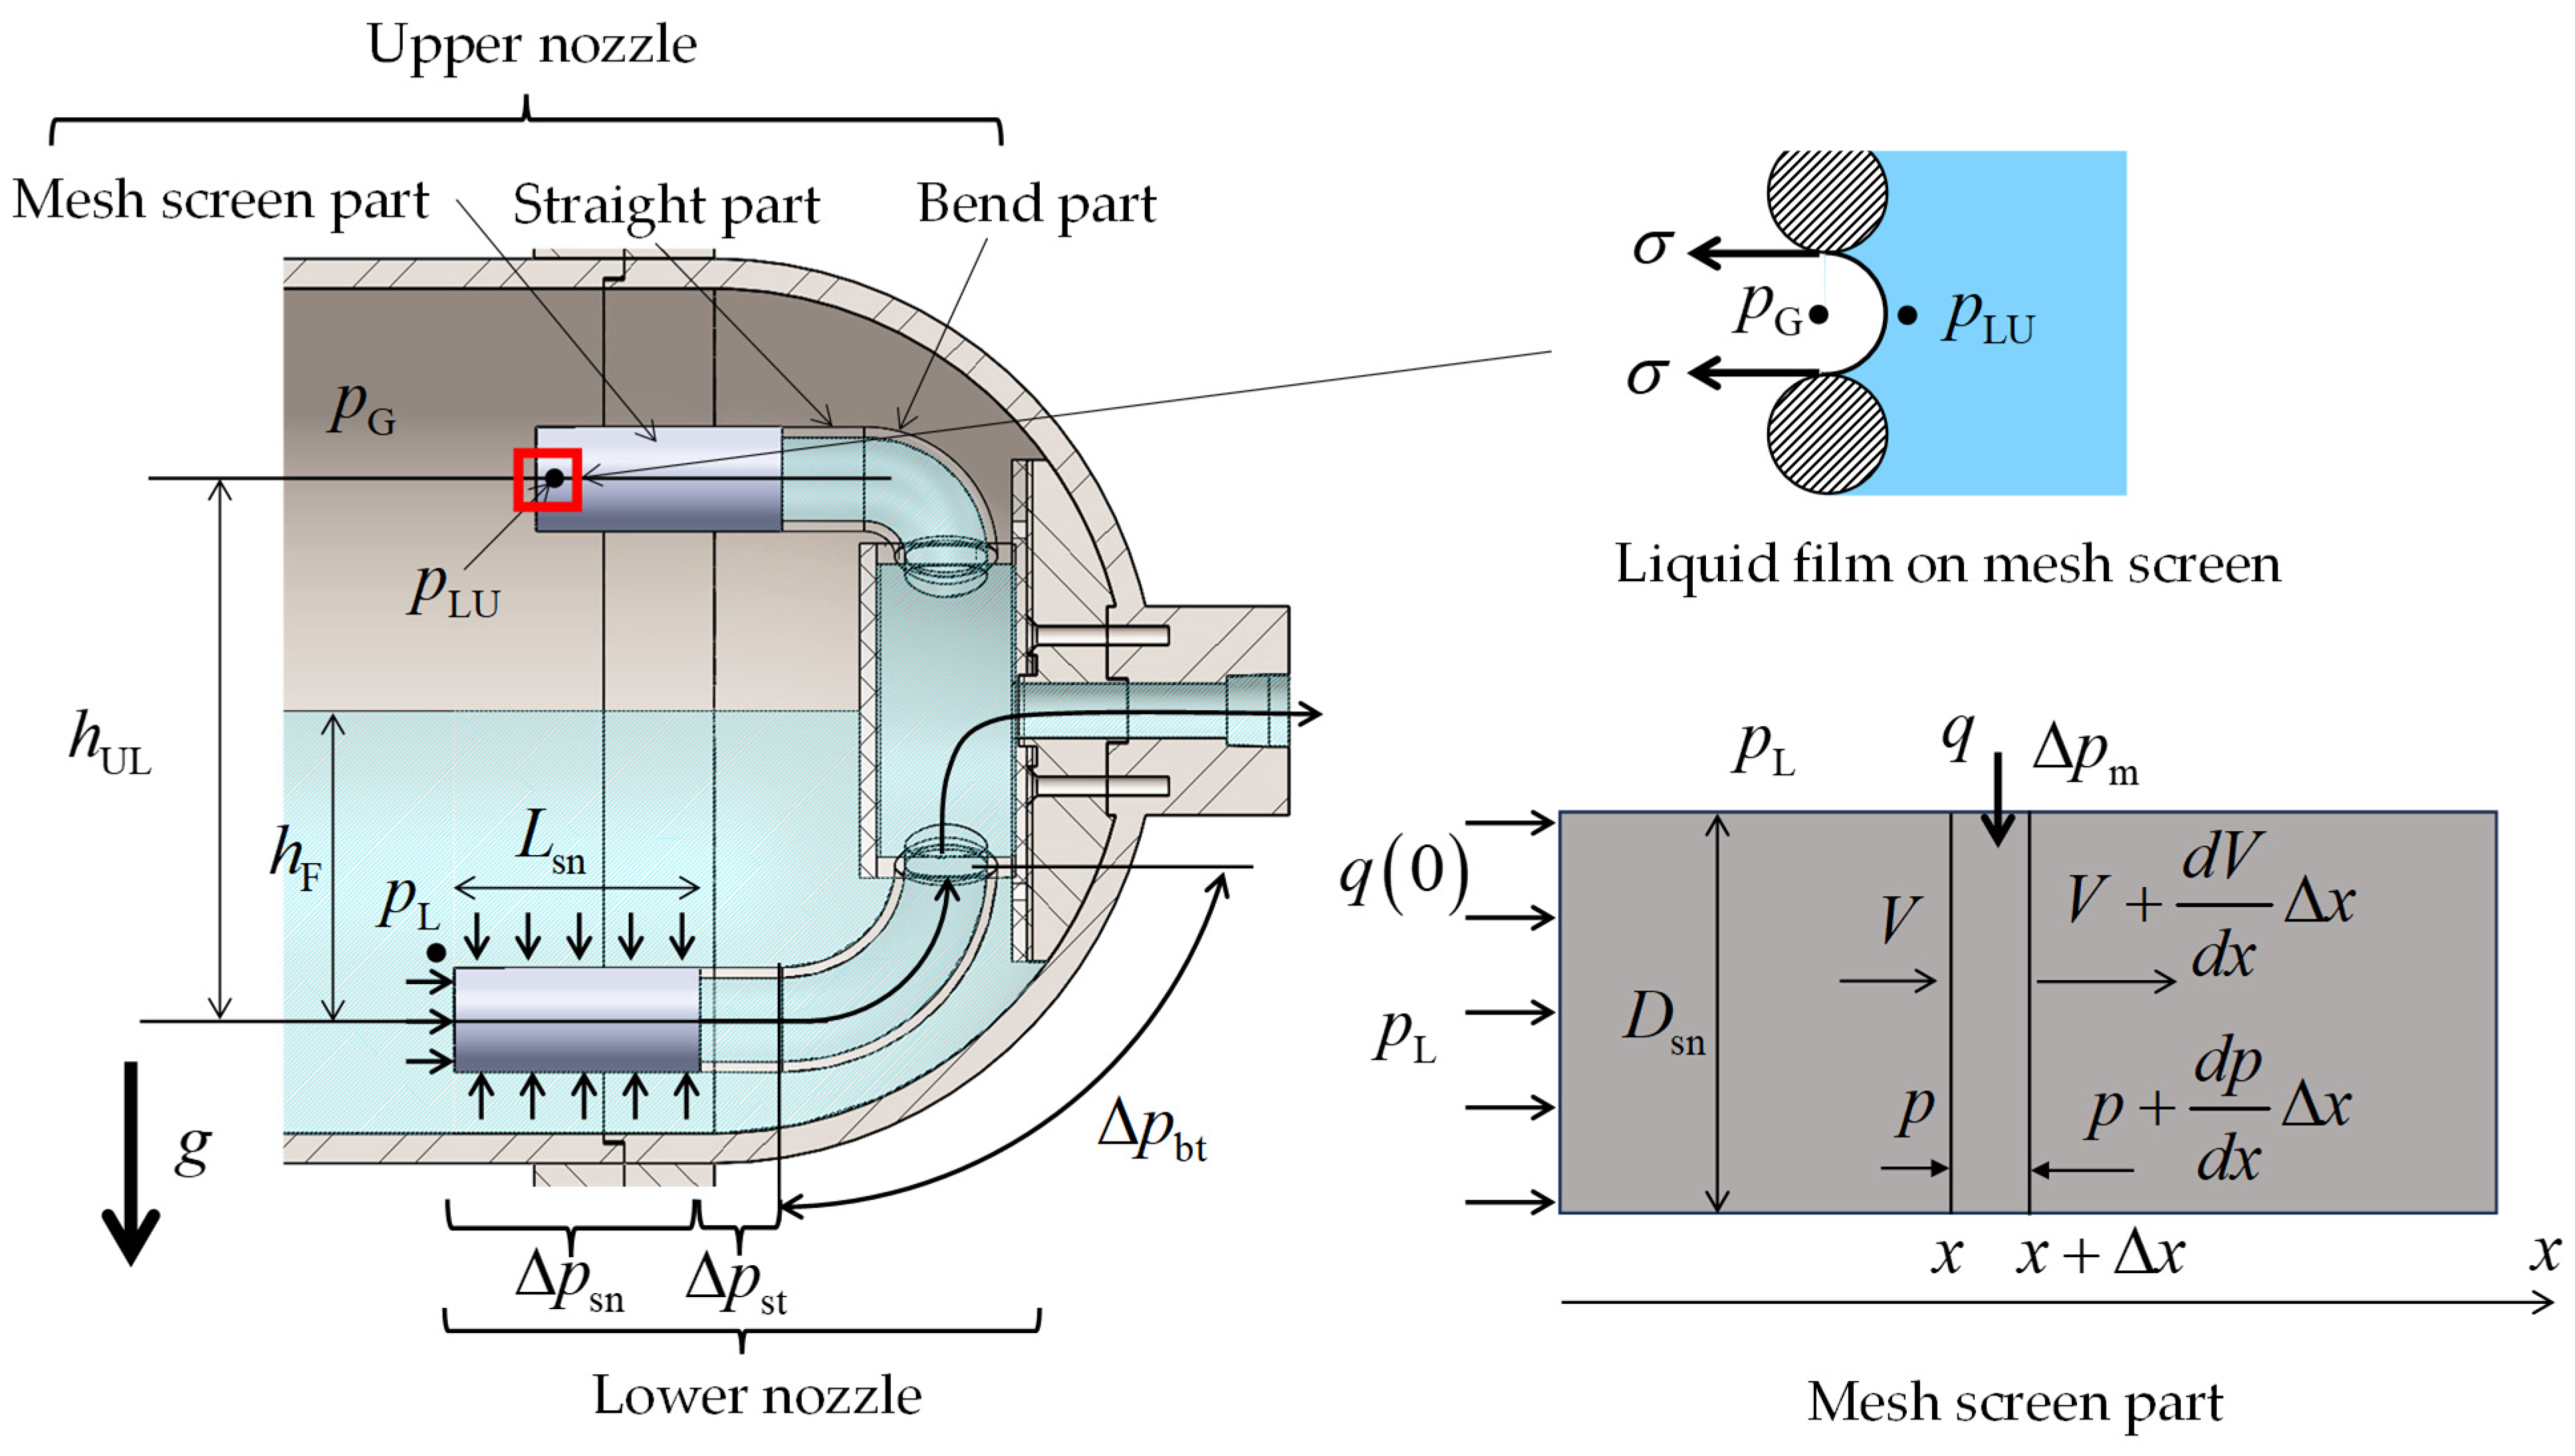
Figure 3 illustrates the structure of the PMD prototype developed in this study.
This PMD consists of a cylindrical container installed at the liquid outlet of the tank, along with a nozzle that supplies the liquid in the tank to the cylindrical container. The inside of the PMD is always filled with liquid, regardless of the direction of acceleration, which suppresses gas contamination when liquid is discharged. The PMD has four nozzles, two of which are installed at the bottom of the tank (i.e., the lower nozzles) and two at the top of the tank (i.e., the upper nozzles). In addition, a cylindrical metal mesh (i.e., the mesh screen part) is installed at the end of the nozzle mentioned above, which allows the liquid phase to pass through when it faces the liquid phase, and when it faces the gas phase, a liquid film formed on the surface of the metal mesh by surface tension prevents gas phase penetration. In the structure of a PMD incorporating such a cylindrical mesh, unlike conventional screen channel types that acquire liquid from a single face [
6,
7,
8,
11,
14,
15,
16,
17,
18], liquid can be acquired from the entire circumference of the cylinder. This increases the effective flow across the cross-sectional area and reduces the pressure loss across the mesh screen. This configuration is expected to offer improved suppression of gas entrainment at higher flow rates compared to conventional screen channel types. On the other hand, although the structural strength of this PMD is inferior to that of conventional types, excessive vibrational and acceleration environments are not a concern in aircraft applications. Therefore, structural strength is not considered to be a critical issue. Moreover, to stably maintain this liquid film, the capillary pressure difference acting on the liquid film must exceed the pressure difference formed through the liquid film during liquid discharge. To satisfy this condition, it is necessary to consider the pressure loss through the mesh screen, inside the nozzle, as well as other factors. In a previous report, the length of the mesh screen part was calculated based on the required surface area of the mesh screen considering the conditions for maintaining the liquid film [
19]. However, this analytical model was a simplified one that did not account for flow losses inside the cylindrical mesh due to liquid inflow from the side. In this study, a more rigorous one-dimensional flow analysis model was developed that accounts for the flow losses described above. It is worth noting that for conventional screen channel types, studies have investigated flow within the channels in one dimension [
14], two dimensions [
16,
17], and three dimensions [
18]. In this study, a one-dimensional analysis model with low computational cost was first developed. Based on this model, a parametric study was conducted to determine the main geometrical dimensions of the PMD and the specifications of the mesh screens. Furthermore, the one-dimensional model was validated by comparison with the results of verification experiments.
Figure 3 illustrates the pressure exerted on each part during liquid discharge. The liquid phase is located at the bottom of the tank. The lower nozzle is positioned to face the liquid phase, and the upper nozzle is positioned to face the gas phase. Additionally, the upper nozzle is filled with liquid. In this situation, the gas phase pressure is
, the liquid phase pressure facing the lower nozzle is
, the pressure loss in the mesh screen part of the lower nozzle is
, and the pressure losses in the straight part and bent part are
and
, respectively. The pressure loss
is defined as the sum of the mesh screen passage loss and the flow resistance inside the mesh screen part. Finally, the liquid phase pressure inside the mesh screen part of the upper nozzle is
. When a liquid film is maintained at the mesh screen part of the upper nozzle, as shown in the figure, the following equation is obtained from the Young–Laplace equation:
is the pressure difference defined by Equation (1), and
is the capillary pressure defined by Equation (2).
is the surface tension, and
is the screen pore diameter. On the other hand, when a gravitational acceleration
acts vertically downward, as shown in
Figure 3,
is obtained with the following equation, which uses
, a head difference, and pressure losses
,
, and
.
is the height difference between the lower nozzle and the upper nozzle, and
is the liquid density. For simplicity, we assume that
is uniform around the lower nozzle. Furthermore,
is obtained by Equation (4) using
and a liquid level measured from the lower nozzle
.
In order to calculate
at the lower nozzle, it is necessary to take into account the flow resistance inside the circular pipe with inflow from the cylindrical side wall and pressure loss through the mesh screen
. The flow conditions on the surface and inside of the mesh screen part are shown in
Figure 3, where
denotes the coordinate in the flow direction, and
and
denote the local velocity and local pressure at position
inside the mesh screen part, respectively. It should be noted that, unlike the existing two-dimensional [
16,
17] and three-dimensional [
18] models, the flow velocity within the nozzle is assumed to be uniform across the cross-section and
depends solely on the axial coordinate
.
denotes the volumetric flow rate per unit area of the fluid passing through the mesh screen, and the law of conservation of mass and conservation of momentum is expressed as follows:
is the nozzle diameter and
is the pipe friction coefficient.
is calculated as follows according to the Reynolds number defined by
:
where
is the dynamic viscosity of the liquid. In addition, by taking into account
,
is obtained as follows:
can be calculated using the following formula, which utilizes the volumetric flow rate per unit area passing through the mesh screen
, as per Hartwig’s formula [
24].
and are the fitting parameters concerning viscous pressure loss and inertia pressure loss, respectively. In addition, as a geometric parameter of the screen mesh, is the tortuosity factor, is the thickness of the screen mesh, is the void fraction in the screen mesh, is the surface area to volume ratio of the screen, and is the liquid viscosity.
Furthermore, analyses were also carried out using the following equation proposed by Ingmanson et al. [
25] to calculate
.
Here, the first term in Equation (10) is the viscosity term, the second term is the inertia term, and and are the fitting constant parameters.
Equations (3)–(10) are a system of differential equations with unknowns
,
, and
, and the unknowns can be determined by obtaining boundary conditions. In this analysis, we give
at
for the assumed value
as a boundary condition, and then solve the differential equation system to obtain
. We then update the value of
until the volumetric flow rate
shown in Equation (11), which is obtained by integrating
with respect to the length of the mesh screen part, becomes equal to the volumetric flow rate
flowing through each nozzle in the design flow rate condition.
is the length of the mesh screen part. Boundary conditions concerning
and
are given at
as follows:
are the values of
at
.
is calculated by following the equation:
denotes
at
. The pressure loss in the bent part
is calculated using the following formula:
is at , is the curvature radius of the bend, is the bending angle (the unit degree), and is the pressure loss coefficient at the bend.
When the level of the free surface becomes lower than the upper end of the mesh screen part on the lower nozzle, the contacting area of the screen mesh on the liquid decreases with , and the flow velocity and pressure loss through the screen mesh increase. To express this effect, the law of conservation of mass (Equation (5)) and the pressure loss formula through the mesh screen part (Equations (9) and (10)) can account for the dependence of the area of the liquid contacting part on .
Using the one-dimensional flow analysis model described above, a parametric study was conducted to determine the key design parameters of our PMD, including the mesh screen specification, the length of the mesh screen section
, the nozzle diameter
, and the number of nozzles
. The nozzles are arranged in equal numbers on the upper and lower sides, and the number installed on one side is defined as
. Prior to the parametric study, the influence of two evaluation formulas for pressure loss through the mesh screen—Hartwig’s formula (Equation (9)) [
24] and Ingmanson’s formula (Equation (10)) [
25]—on the propellant acquisition characteristics was investigated. Specifically, the effect of the two evaluation formulas for pressure loss through the mesh screen on the relationship between liquid level height
and pressure difference
was clarified. In the analysis, the following conditions were applied:
mm;
mm;
; and
mm. Additionally, the discharge flow rate was set to the design value of the BE tank,
L/min. The mesh specification was set to 165 × 1400 Dutch Twill. The parameters used in Hartwig’s formula and Ingmanson’s formula for the mesh screen are presented in
Table 2. It should be noted that the capillary pressure
listed in the table was obtained experimentally in previous studies [
19].
Figure 4a,b illustrate the relationship between
and
when Hartwig’s formula (Equation (9)) and Ingmanson’s formula (Equation (10)) were used for
. Here, the liquid was water, and thermal properties at 20 °C were used, as shown in
Table 3. These values were based on data from the REFPROP thermal properties database [
28].
As mentioned above, in order for the liquid film to be maintained,
must be satisfied. As can be seen from
Figure 4, the head pressure decreased with
, therefore
also decreased, and gas entrapment was more likely to occur in the mesh screen parts of the upper nozzle. At the point where the curve in the figure shows an inflection point, the free surface reached the upper end of the mesh screen part of the lower nozzle, and as
decreased,
sharply increased, which caused a sudden drop in
.
Figure 4 shows that at
mm, gas entrainment occurred when the free surface was located above the upper end of the mesh screen part of the lower nozzle for any formula for
. Based on these results, it was determined that the PMD would not function effectively. In this study, we fabricated PMD diameters of 110 mm and 150 mm for
, and verified the propellant acquisition mechanism by observing the flow behavior inside the tank and the PMD.
Additionally, the results obtained by varying other parameters, including the mesh screen specifications, nozzle diameter
, and the number of nozzles
, are described. As discussed in a later section, it was found that the analysis results using Ingmanson’s formula for evaluating the pressure loss through the mesh screen were in closer agreement with the experimental data. Therefore, Ingmanson’s formula was applied in the subsequent parameter study.
Figure 4c presents the analysis results obtained using a finer mesh, specifically a 325 × 2300 Dutch Twill screen mesh, with
mm and
. From the figure, it can be seen that the liquid level height at which gas entrainment occurred was slightly lower than that for the 165 × 1400 mesh shown in
Figure 4b, indicating a slight improvement in liquid acquisition performance. To investigate the effect of the number of nozzles, an analysis was performed with
and
. It was found that the liquid level height
satisfying
was 85 mm at
mm, indicating that this condition was unacceptable. An analysis was therefore conducted for the configuration with a nozzle diameter of
mm, as shown in
Figure 4d. While results comparable to those obtained with a single nozzle
were observed, an increase in nozzle diameter may lead to structural deformation due to the pressure differential between the internal and external surfaces. Based on the results of the aforementioned parameter study, the subsequent experiments were conducted employing the conditions of a 165 × 1400 mesh,
mm,
, and
mm.
3. Liquid Discharge Test Under Static Conditions
The flow behavior inside the tank and the PMD during liquid discharge were observed under static conditions, where the test tank was placed horizontally, and gravitational acceleration was applied downward. In conventional screen channel types, studies have conducted detailed measurements of the liquid acquisition process through the mesh screen, as well as the flow dynamics inside the channel during liquid discharge [
16,
17,
18]. In these studies, the screen channels were not installed inside actual tanks, and their geometry was simplified to a straight configuration. In contrast, this study installed a full-scale PMD in a test tank identical in shape and size to the actual flight propellant tank and conducted observations of the fluid behavior during liquid discharge, with verification of the liquid acquisition mechanism within the PMD.
Figure 5 presents a drawing of the test tank. The tank is made of transparent polycarbonate resin, allowing the internal flow behavior to be visualized. The inner wall of the tank was formed by stacking rectangular blocks with hollowed-out hemispheres and cylinders. By making the outer wall of the test tank a flat surface, we reduced the effects of refraction when visualizing the tank interior. The PMD was installed on the liquid outlet side (i.e., right side of the figure), and a gas supply nozzle was installed on the pressurized gas supply side (i.e., left side of the figure).
Figure 6 illustrates the system schematic of the liquid discharge experiment under static conditions. The test tank was connected to a gas supply line, a test liquid supply line, and a liquid discharge line. Pressurized gas was supplied from a gas tank to the test tank via a regulator and a pressure-regulating solenoid valve, and the test liquid was discharged from the test tank to the drain tank via an ultrasonic volumetric flowmeter (FD-Q20C, Keyence Corp.). The test liquid was supplied to the test tank by vacuum filling, and a rotary vacuum pump (G-25SA, ULVAC, Inc.) was used to evacuate the test tank and the PMD. Other measurement items included the tank pressure (PT), gas supply pressure (PS), and the tank’s internal liquid temperature (T). For pressure measurement, pressure transducers (PSE560-02, SMC Corporation) were used, and K-type thermocouples were employed for temperature measurement. In addition, volumetric flow rate, pressure, and temperature data were recorded at a sampling rate of 100 Hz using a data acquisition system (Memory Hilogger 8423 and Universal Unit 8949, Hioki E.E. Corporation). Additionally, the fluid behavior inside the tank was observed using a video camera (GoPro HERO4, GoPro, Inc., San Mateo, CA, USA). Pure water was used as a test liquid.
The tank pressure during liquid discharge was set using Bang–Bang control [
19,
20]. When the pressure fell below the lower limit pressure, the solenoid valve opened to supply pressurized gas. When the pressure exceeded the upper limit pressure, the solenoid valve shut off to stop the pressurized gas supply. The tank pressure was adjusted between the lower and upper limit pressures.
The liquid discharge test was carried out with the
of the upper and lower nozzles changed to 110 mm and 150 mm, respectively. The flow behavior in the tank and the liquid acquisition behavior in the PMD during liquid discharge were investigated.
Table 4 shows the test conditions in the liquid discharge experiments. In these experiments, the tank pressure was regulated by Bang–Bang control during liquid discharge, as described above. The lower and upper limits for each experimental condition are listed in the table below. To achieve an even higher liquid discharge flow rate, the tank pressure had to be 0.3 MPaG or higher. However, we found that Bang–Bang control could not be implemented due to constraints in the gas supply system, and the tank pressure and liquid flow rate decreased over time. Liquid discharges under these conditions were carried out in Tests 4–6 and 10–11. Under these liquid discharge conditions, the flow rate was at its maximum immediately after the start of liquid discharge. In this PMD, gas entrainment is more likely to occur as the free surface approaches the bottom. To confirm gas entrainment at higher discharge flow rates, the initial liquid level height was set lower on the center axis of the tank in Tests 5–6 and 10–11 (denoted as “Half” in the table).
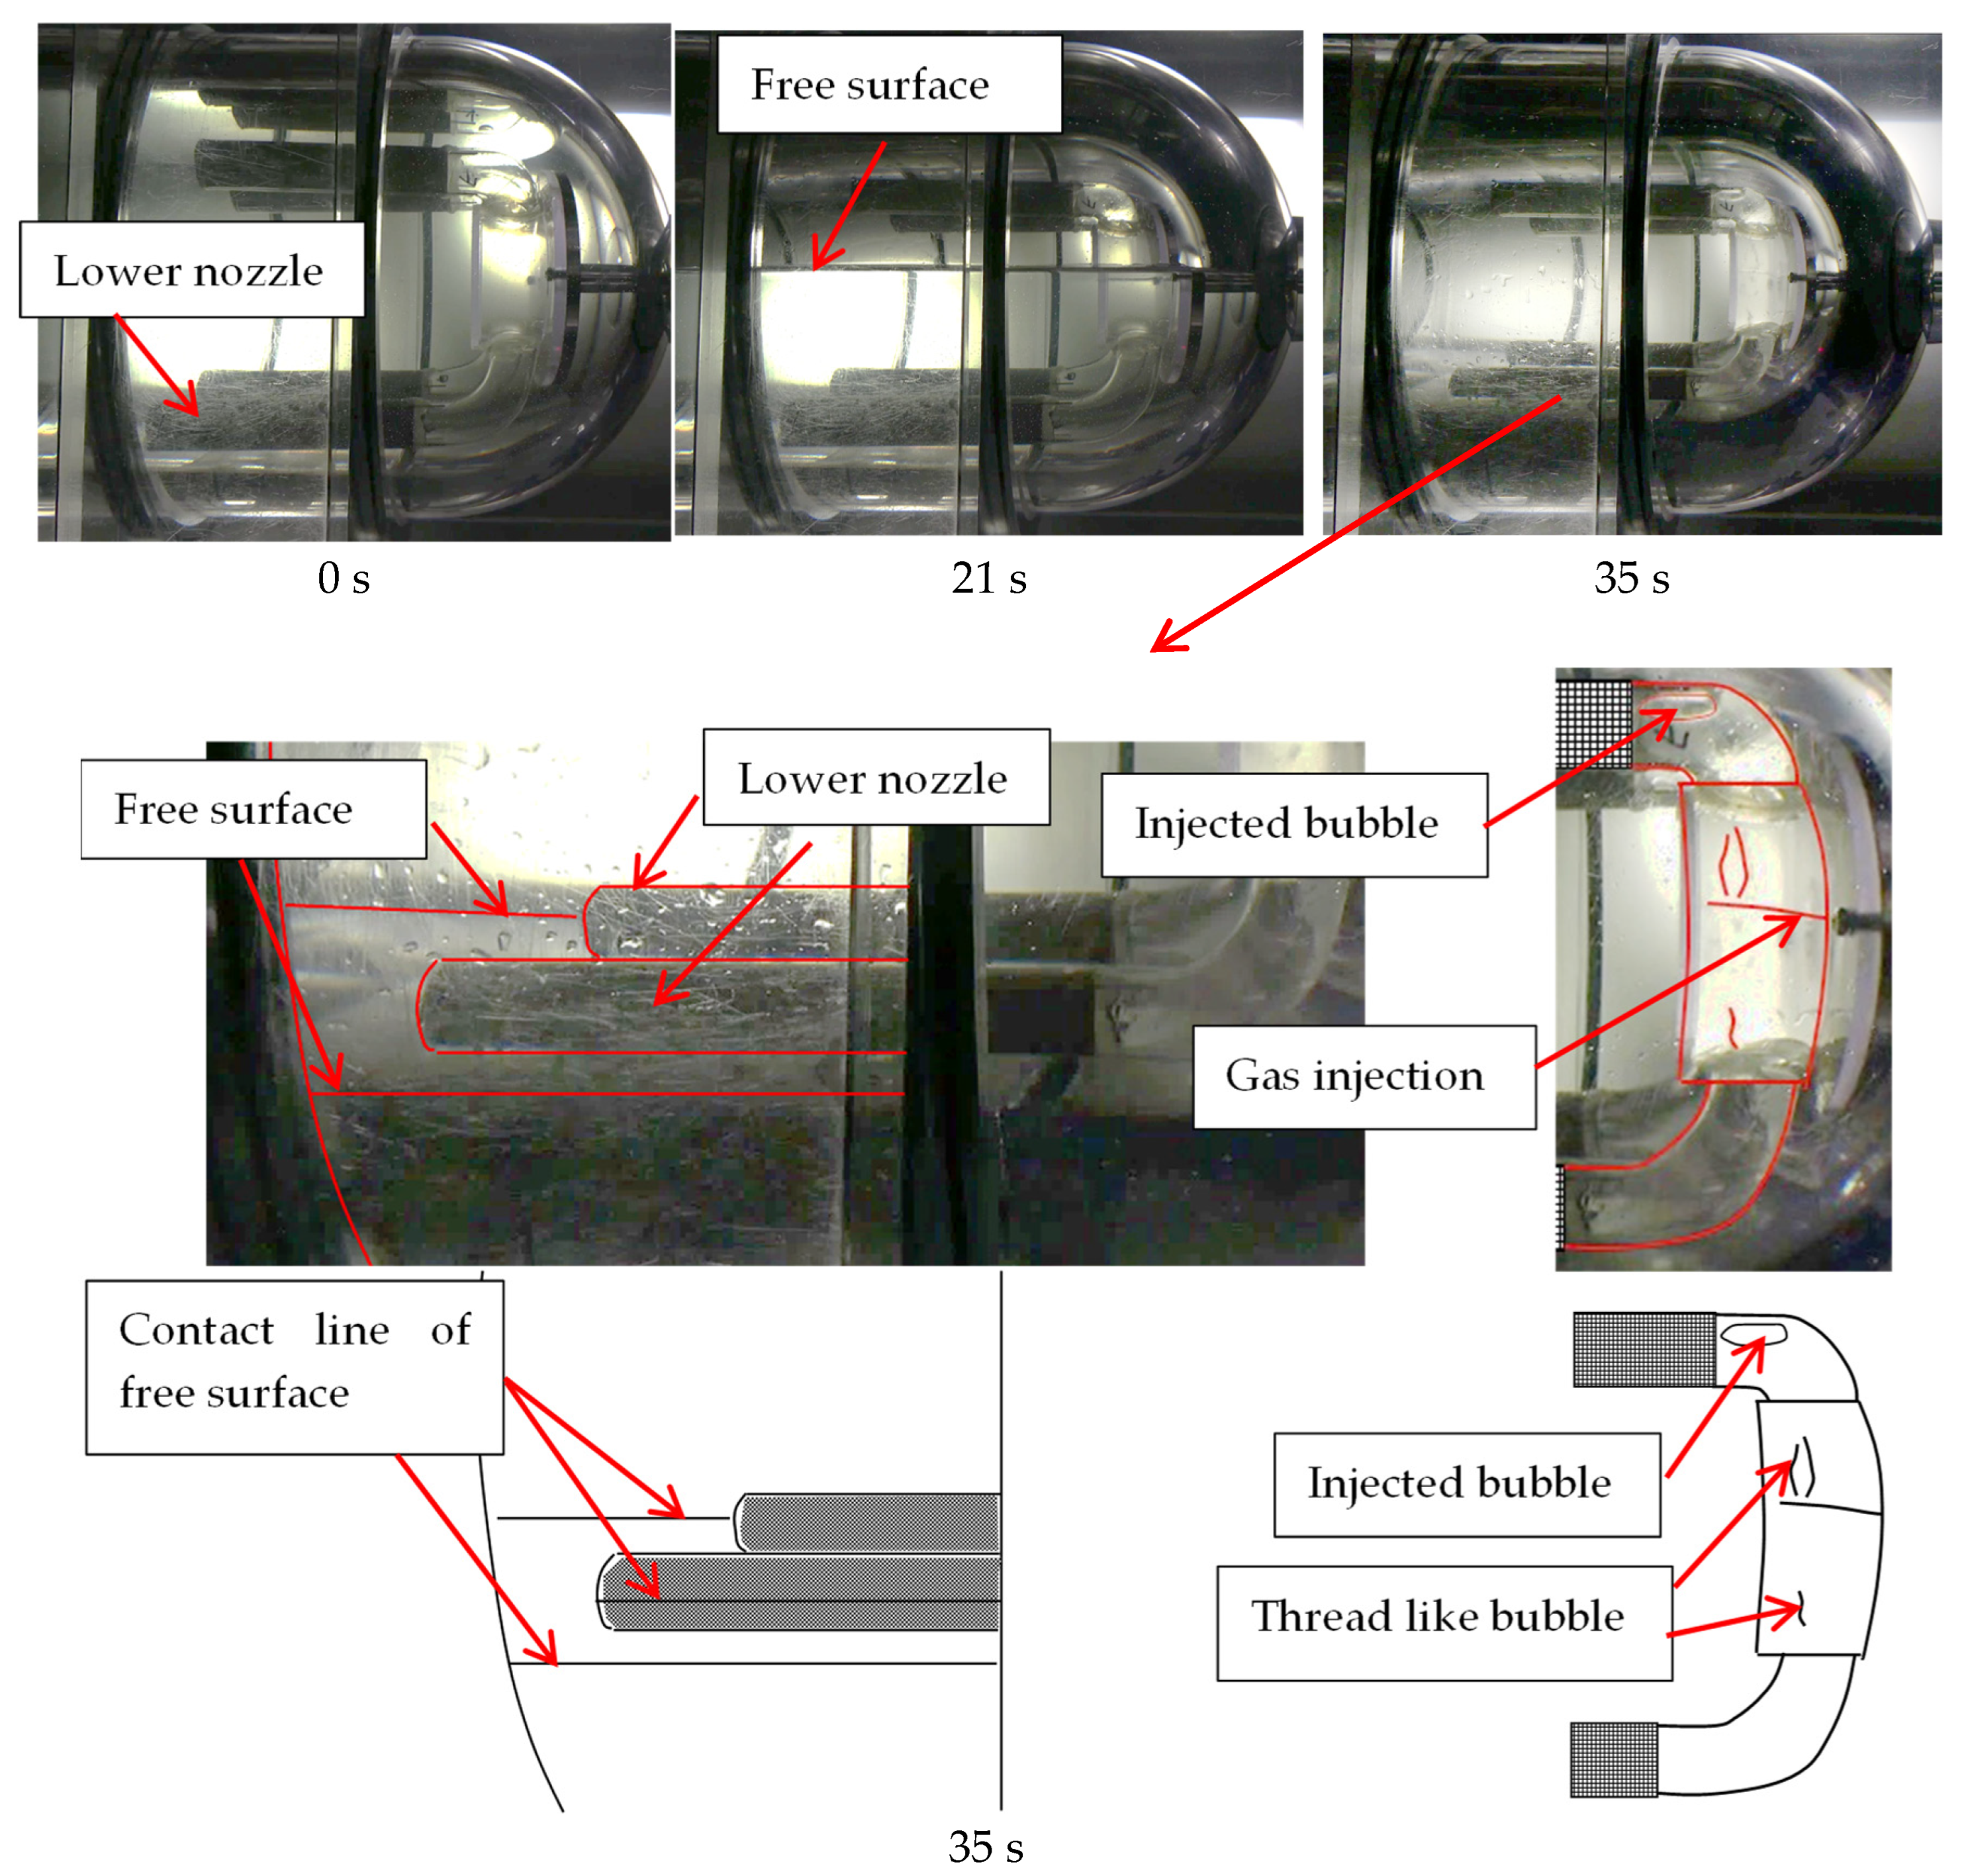
First, we present the results regarding the liquid behavior in the tank when the mesh screen part length was 110 mm.
Figure 7 illustrates the liquid behavior in the tank, and
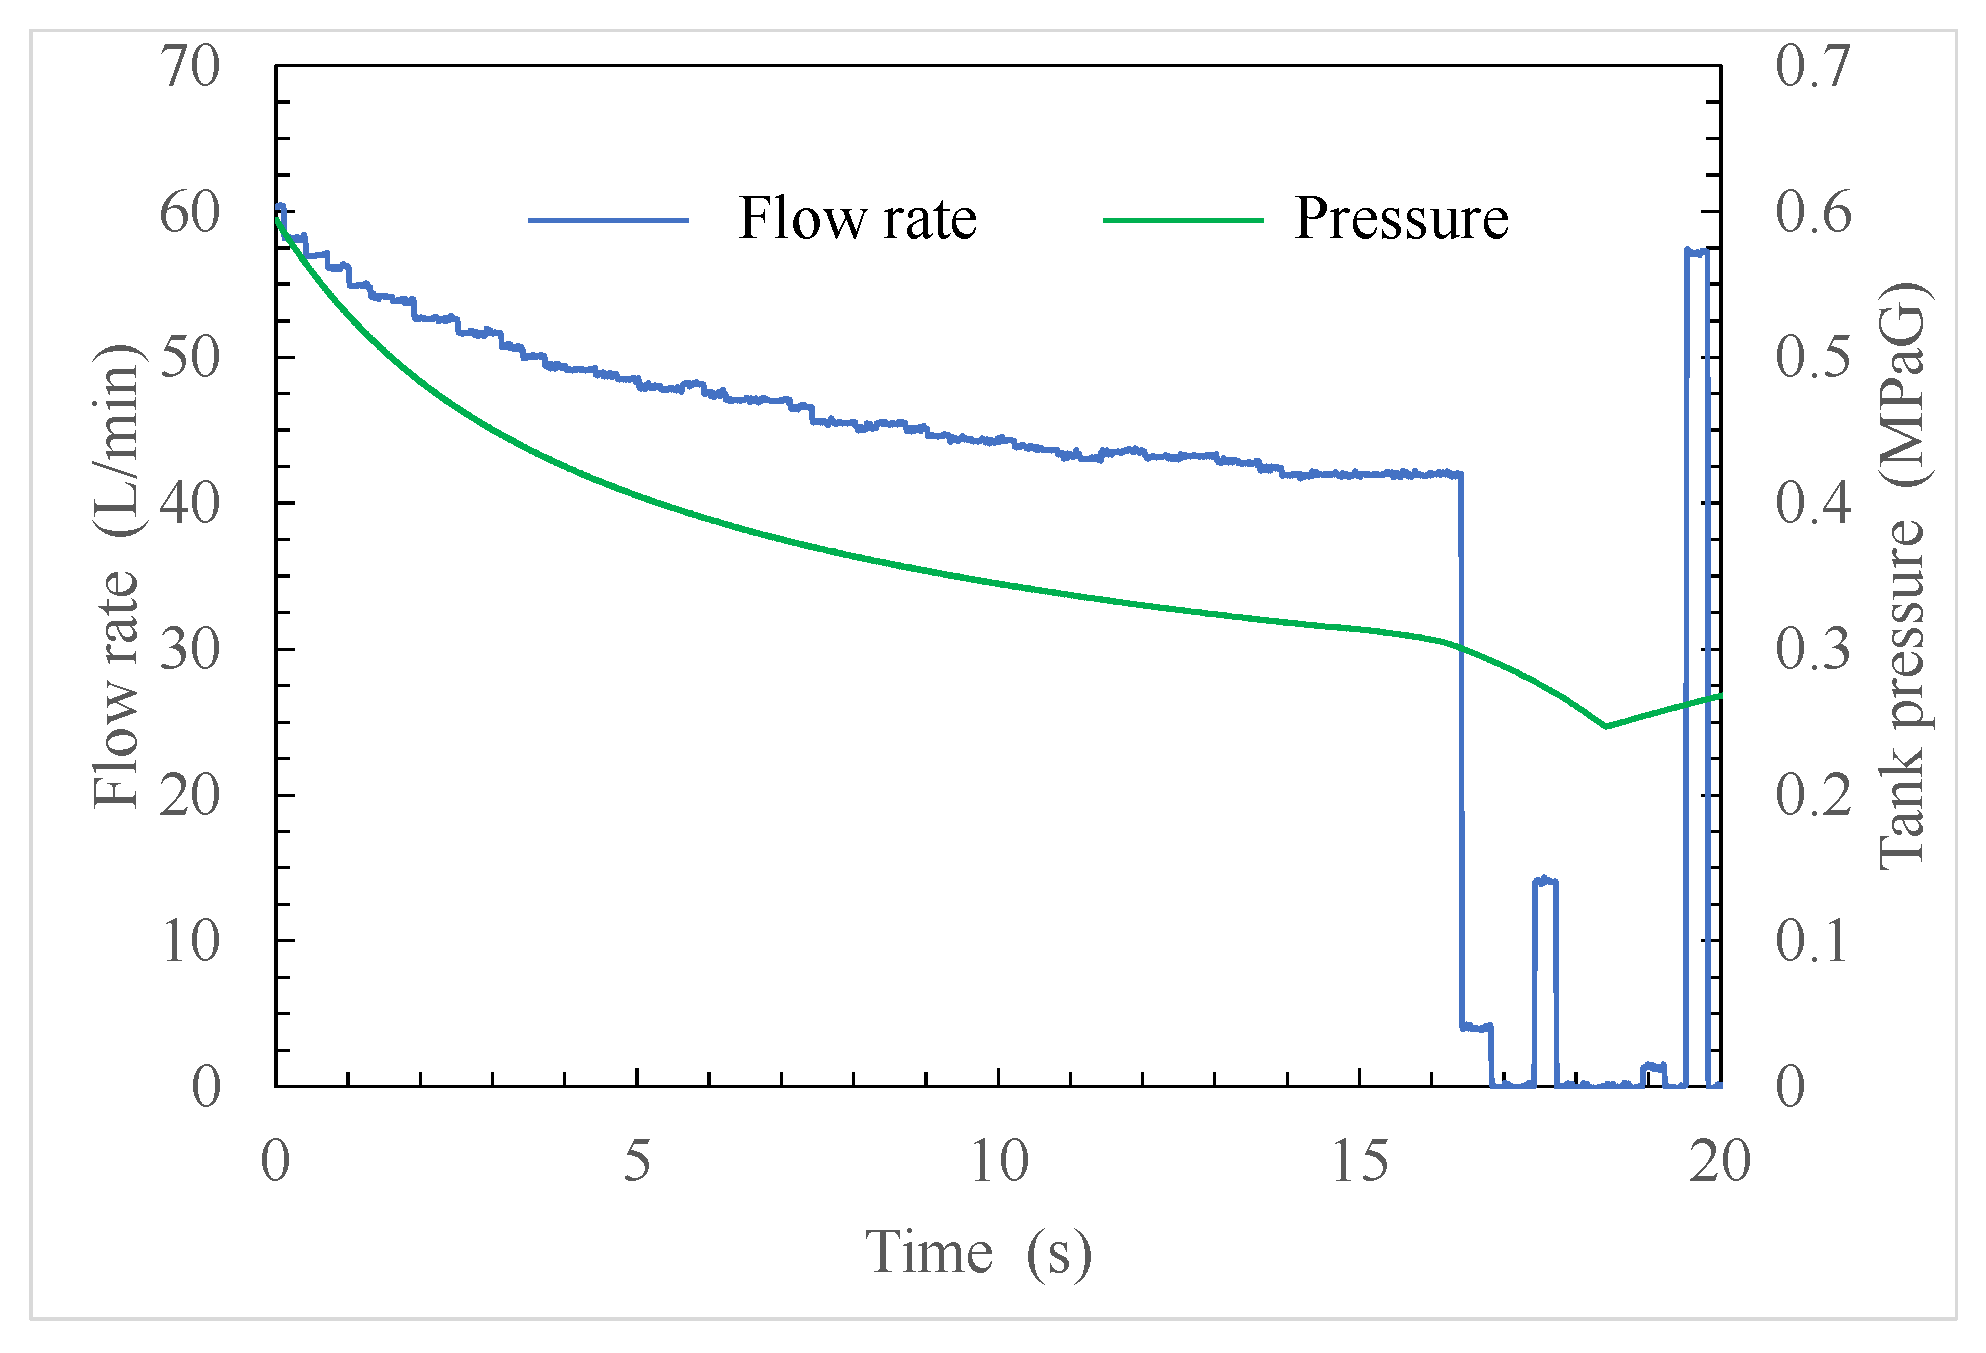
Figure 8 denotes the time history of the liquid discharge flow rate and the tank pressure under the conditions of Test 2. The average flow rate was 35.3 L/min, which was close to the design flow rate of 36 L/min. Furthermore, the tank pressure was maintained within the range between the upper and lower limits. As illustrated in the figure, gas entrainment was observed near the liquid outlet 35 s after the liquid was discharged; it can be seen that, at this point, the liquid level had almost reached the center of the lower nozzle.
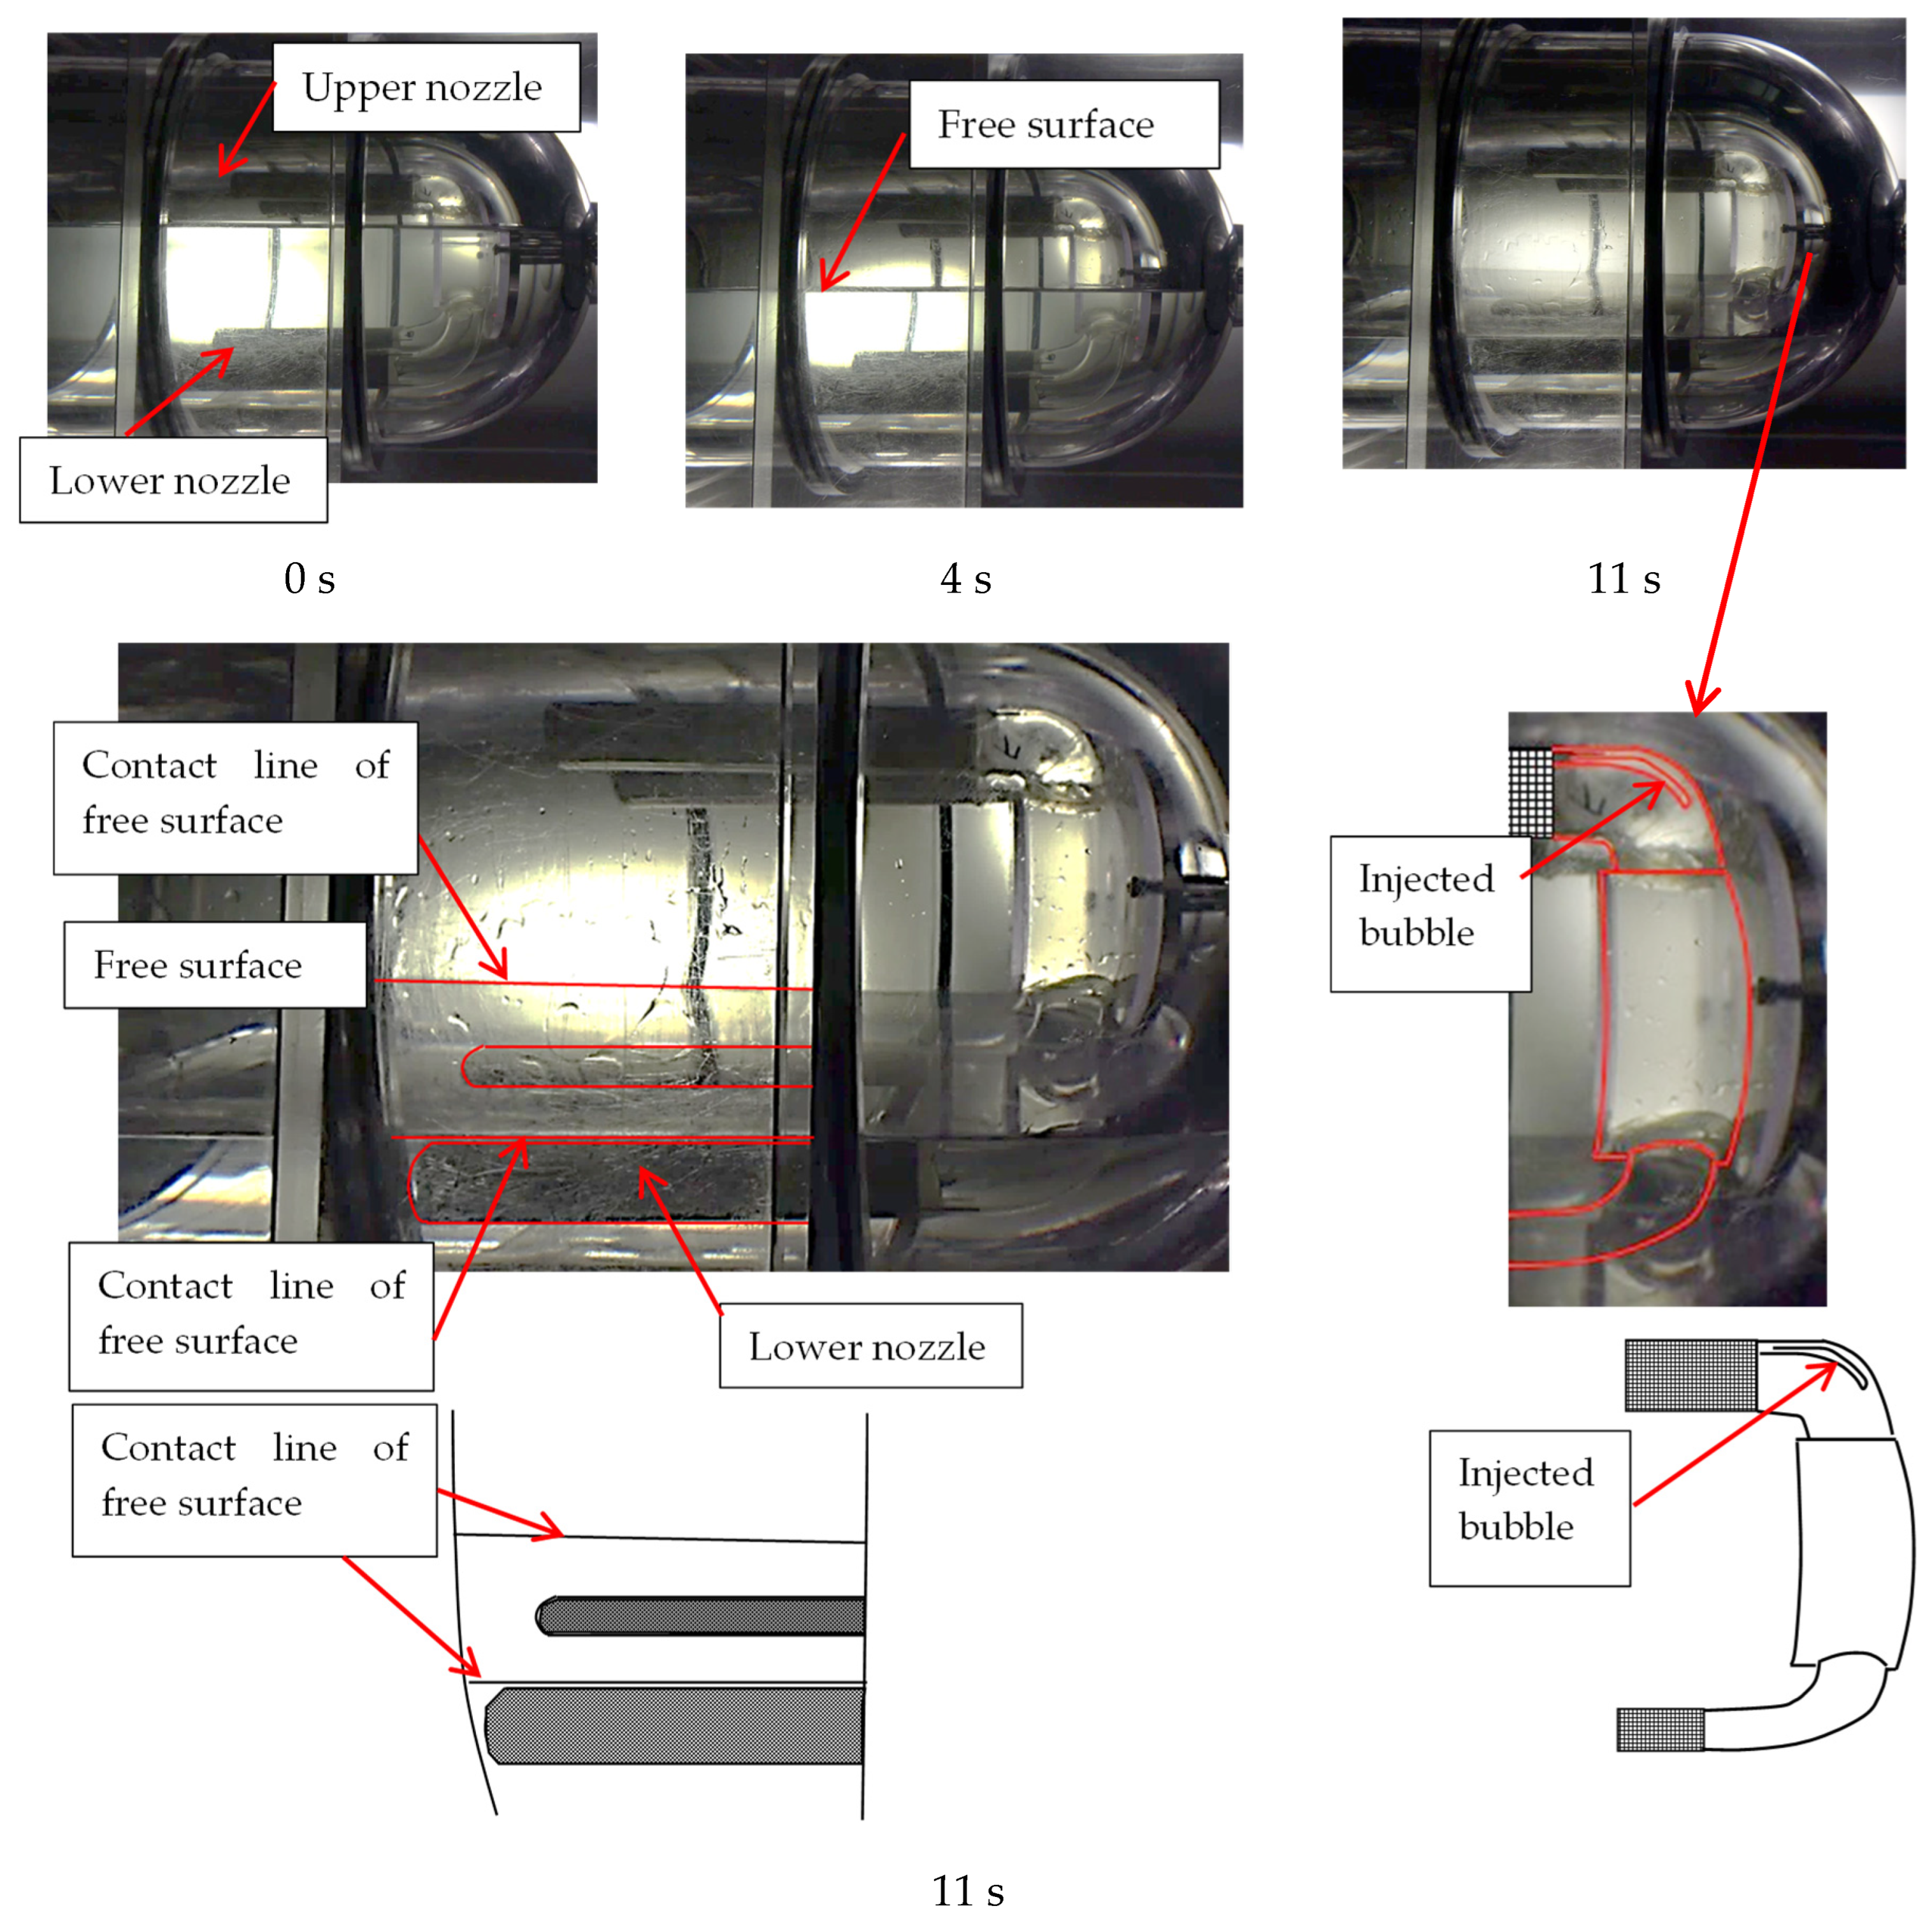
Figure 9 illustrates the liquid behavior in the tank, and
Figure 10 presents the time history of the liquid discharge flow rate and the tank pressure under the conditions of Test 6. As illustrated in
Figure 9, gas entrapment was observed near the liquid outlet 11 s after the liquid was discharged; at this point, the free surface was located above the lower nozzle, and the amount of residual liquid when gas entrainment occurred was large. As illustrated in
Figure 10, both the discharge flow rate and the tank pressure decreased with time. The liquid discharge flow rate just before gas entrapment occurred was 43.4 L/min.
Next, we present the results regarding the liquid behavior in the tank when the mesh screen part length was 150 mm.
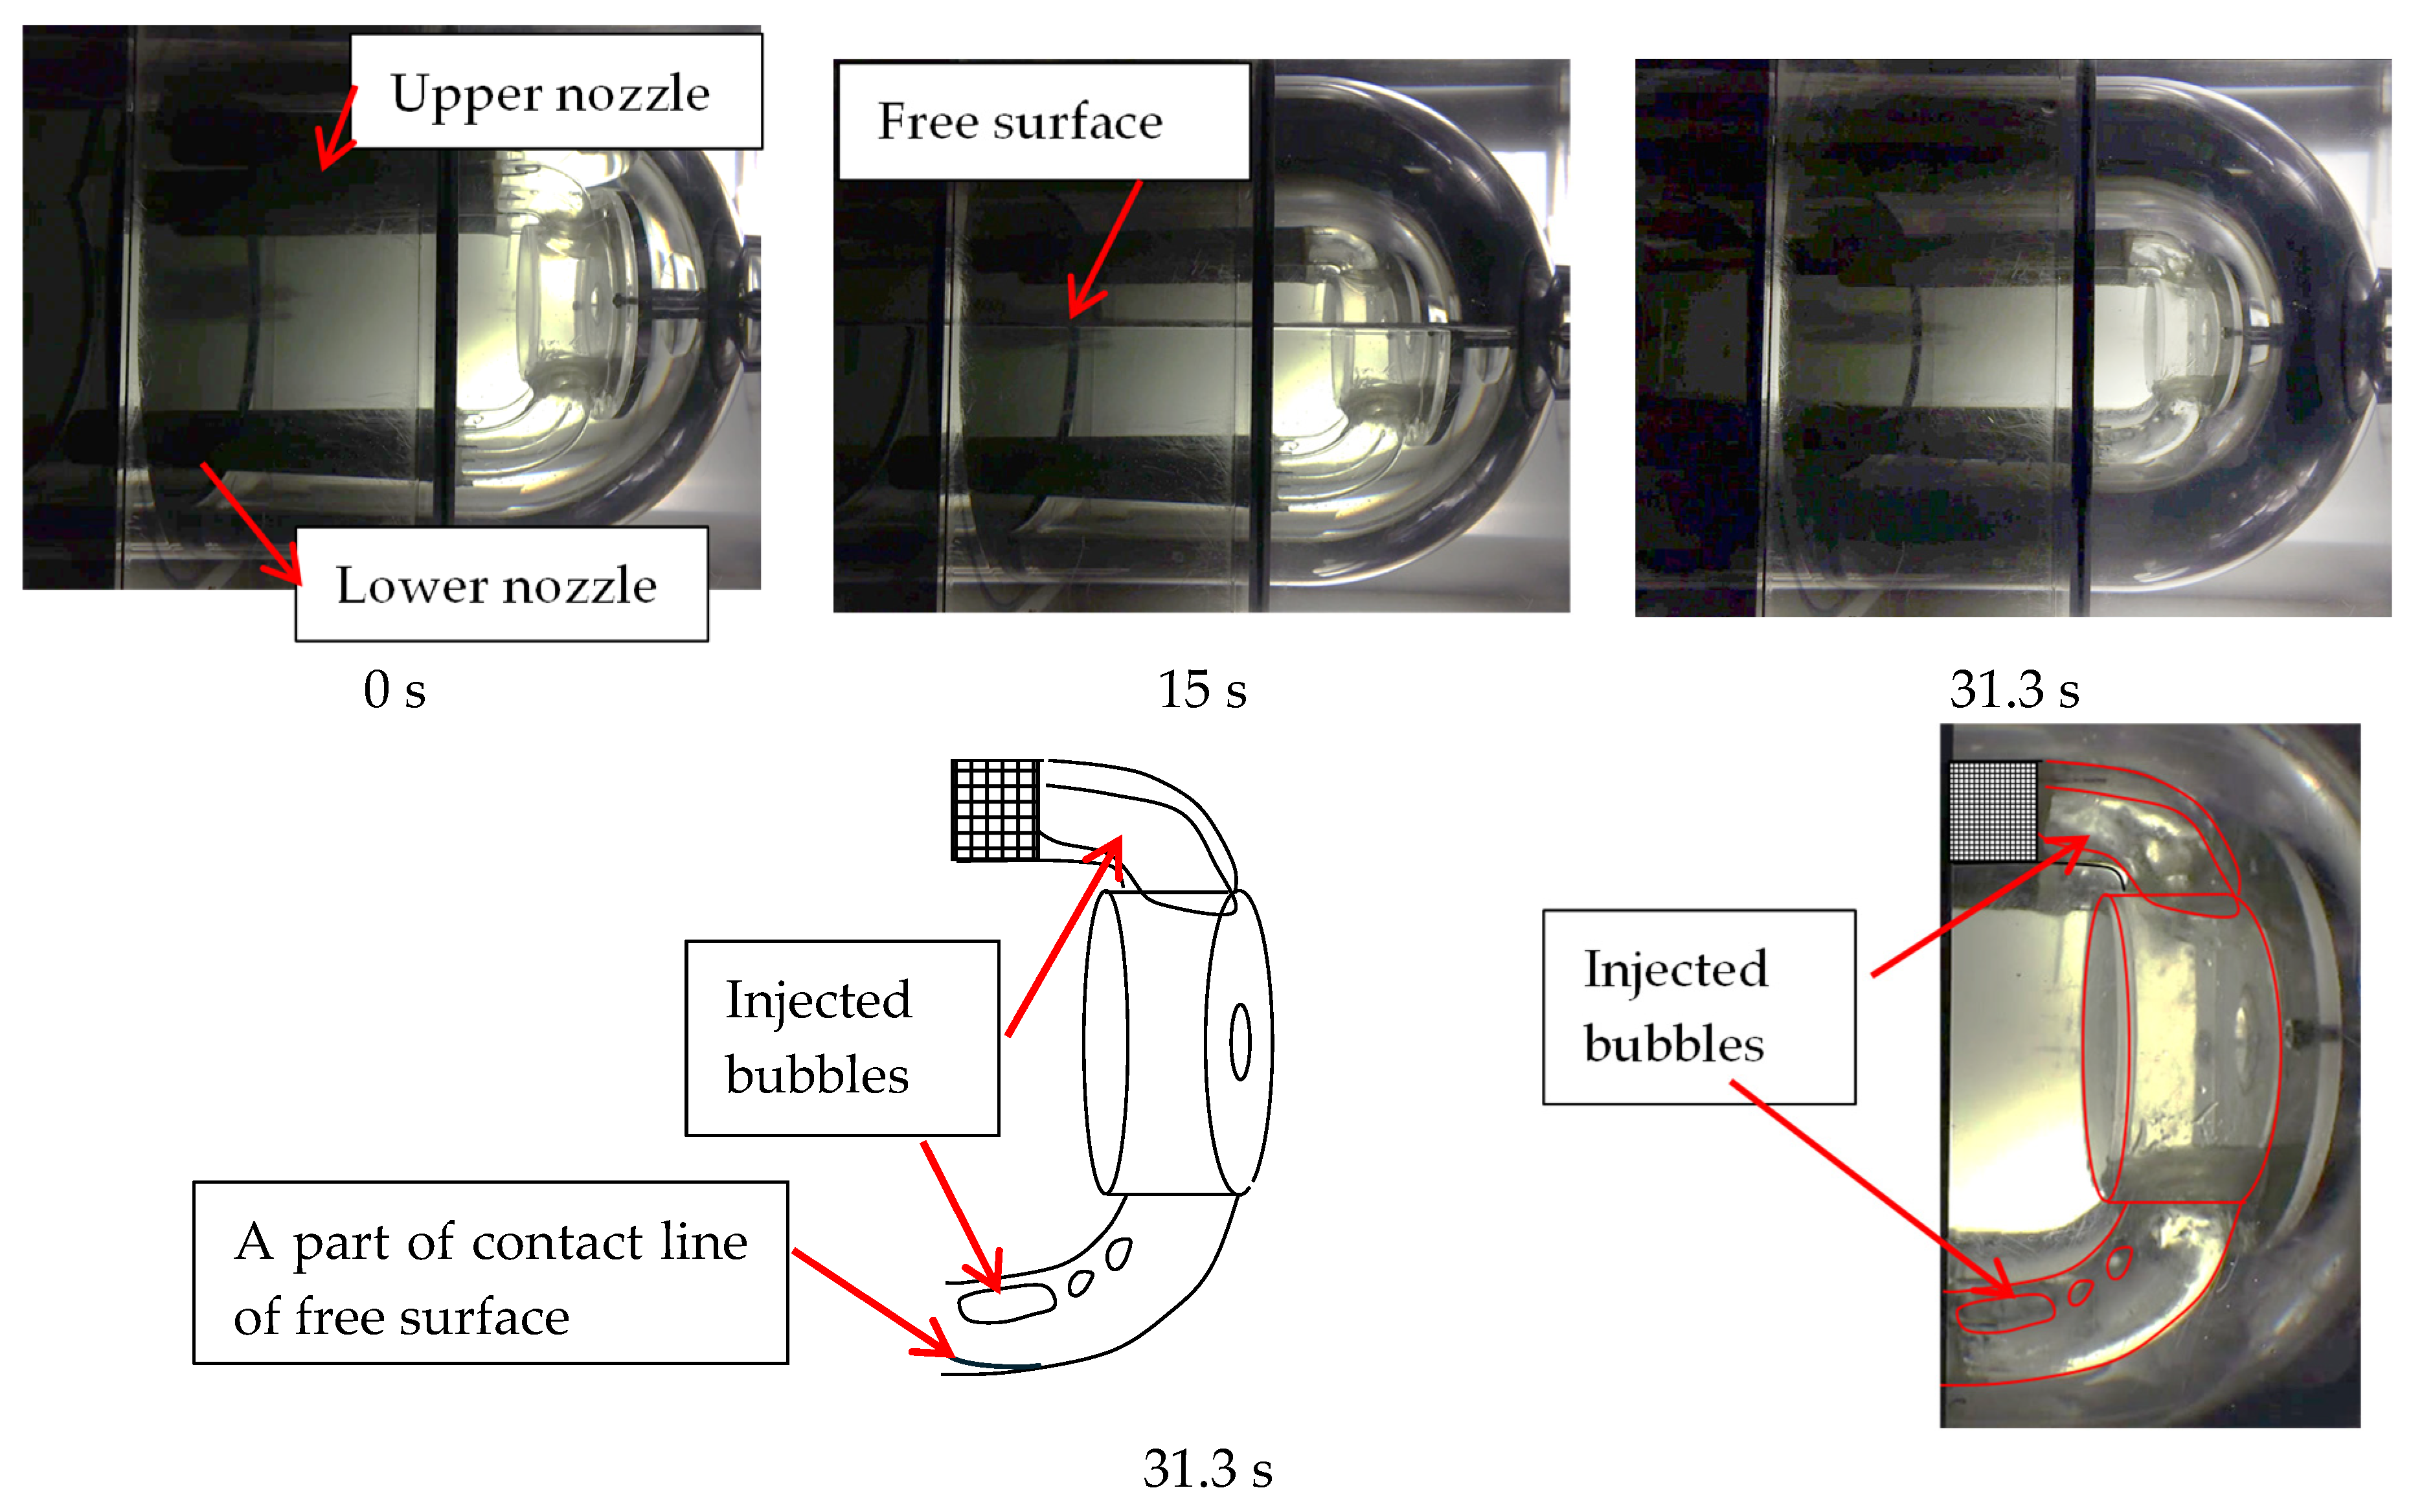
Figure 11 illustrates the liquid behavior in the tank, and
Figure 12 denotes the time history of the liquid discharge flow rate and the tank pressure under the conditions of Test 8. As illustrated in
Figure 11, gas entrainment occurred 31.3 s after the liquid was discharged, and at that point, the free surface was located near the bottom of the lower nozzle. As a result of extending the nozzle length to 150 mm, we were able to reduce the amount of liquid remaining inside the tank when gas entrainment occurred compared to when the nozzle length was 110 mm. According to
Figure 12, the average liquid discharge flow rate was 36.8 L/min, exceeding the design flow rate.
The tank pressure was maintained within the upper and lower limits in the early stages after discharge but decreased over time thereafter; this phenomenon was due to the performance of the present gas supply system. However, the primary concern of this study was to confirm the liquid acquisition performance of the PMD; therefore, we did not consider the fact that the tank pressure could not be maintained at a constant level to be a significant issue. It was confirmed that, within the pressure range illustrated in
Figure 12, the changes in thermophysical properties that affected the PMD performance were exceedingly small.
Figure 13 illustrates the liquid behavior in the tank, and
Figure 14 denotes the time history of the liquid discharge flow rate and the tank pressure under the conditions of Test 11. As illustrated in
Figure 13, gas entrapment was observed near the liquid outlet 13.3 s after the liquid was discharged. At this point, the free surface was located near the bottom of the lower nozzle. As a result of extending the nozzle length to 150 mm, we were able to reduce the amount of liquid remaining inside the tank when gas entrainment occurred compared to when the nozzle length was 110 mm. As illustrated in
Figure 14, both the discharge flow rate and the tank pressure decreased with time. The liquid discharge flow rate just before gas entrapment occurred was 44.6 L/min.
4. Discussion
In order to make a comparison between the analytical results described in
Section 2 and the experimental results described in
Section 3, the relationship between the liquid discharge flow rate
and the free surface height
at which gas entrapment occurred was obtained from the flow analysis for two types of
, and the experimental results were plotted against this. In the numerical analysis, the relationship between
and
was obtained for each
, and from this results,
and the relationship between
and
were obtained.
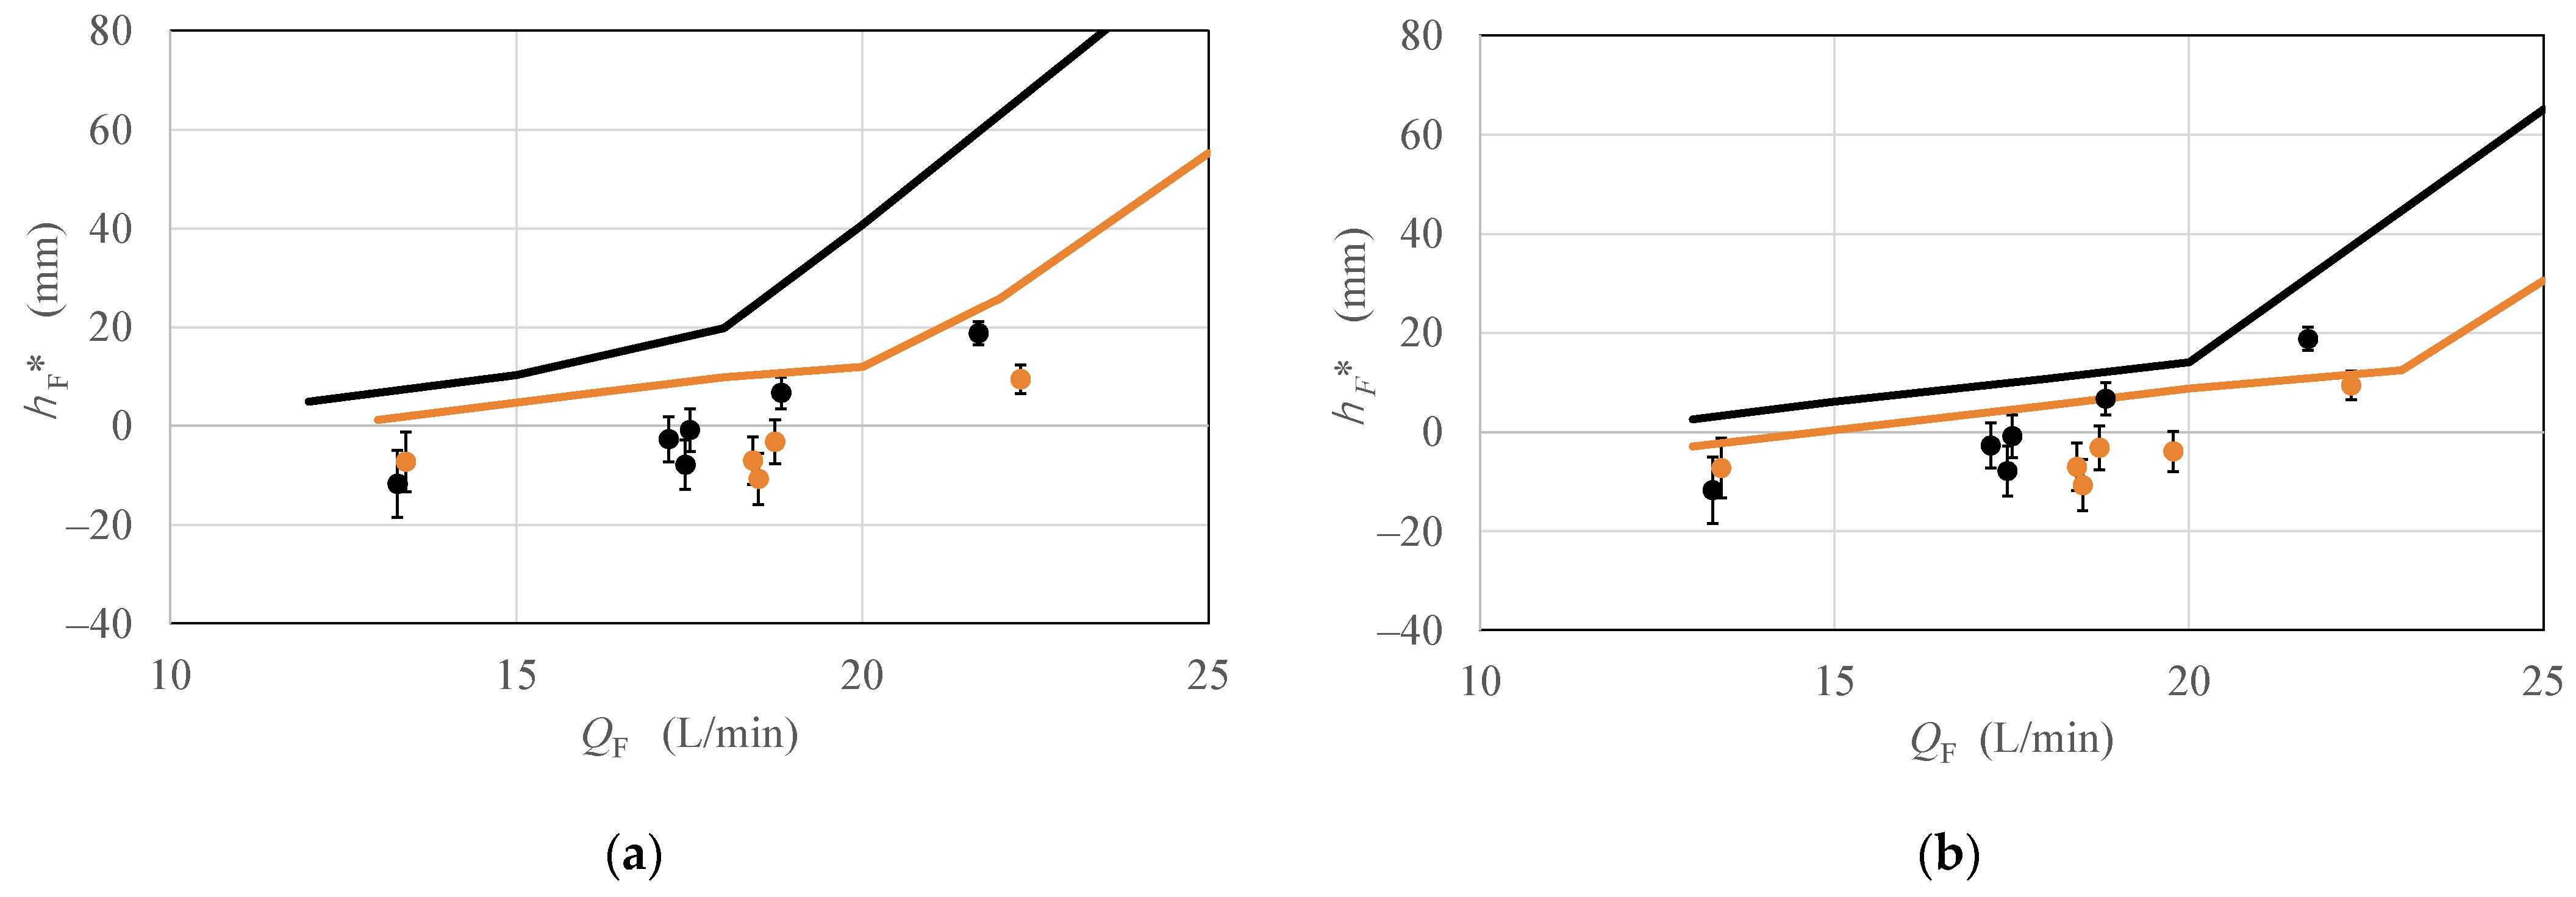
Figure 15 illustrates the numerical results for mesh screens
with lengths of 110 mm and 150 mm. Here, we present the results obtained using Hartwig’s and Ingmanson’s formulas to calculate the pressure loss through the mesh screen. From this figure,
= 12.5 mm indicates that the free surface reached the top of the lower nozzle. At
mm, the wetted area of the screen mesh decreased, and the pressure loss through the screen mesh therefore increased. As a result, compared to the condition in
mm, the rate of change in
relative to
decreased, and the slope of this curve therefore decreased.
When calculating the experimental result , it was difficult to determine the free surface height in the tank from the video camera images. It was found that the visibility of the tank interior was low due to the difference in the refractive index between the fluid inside the tank and the solid wall, especially when the free surface was located near the top or bottom of the tank, Therefore, was obtained using the following procedure:
The relationship between the free surface height and the liquid volume was analytically obtained in advance.
After the liquid was discharged, the time taken for the free surface to reach the center of the tank, where visibility was favorable, was obtained from the video camera. Based on the relationship between and obtained above, the liquid volume , where the free surface was located at the center of the tank, could be determined.
The time when gas entrainment occurred was obtained from the video camera image, the integrated volumetric flow rate from to was calculated from the measured , and the liquid volume at the time of gas entrainment was calculated from .
was calculated from the relationship between and using .
Evaluations of the uncertainty in are described. The following three factors were identified as the primary sources of error:
- (1)
The spatial resolution of the recorded images capturing the liquid behavior inside the tank,
- (2)
The temporal resolution of the recorded image sequence,
- (3)
The measurement uncertainty of the flow meter.
was obtained by the following equation.
The average value of
is herein defined as
, as expressed below:
By differentiating the equation derived from Equations (17) and (18), the following expression was obtained, representing the relationship among the uncertainties of the respective physical quantities.
It is noted that the uncertainty associated with time is denoted as
herein. Furthermore, by taking into account the relationship between
and
, the following expression for
is obtained:
Therefore,
is given by the following equation:
From Equations (20) and (21), the error
can be determined for each of the error sources, represented by
,
, and
, respectively. Note that
could be determined for each experimental condition based on the resolution of the video camera used in the experiment and the dimensions of the observed object. Furthermore,
was determined based on the video camera’s frame rate of 30 fps, and
was derived from the measurement error of 1.2 L/min of the volumetric flow meter used in the experiment; using these values, the error
was calculated for each experimental condition.
and
obtained in the experiment using the above method are plotted in
Figure 15. The errors derived from the experimental data, as outlined above, are represented by the error bars in the respective plots shown in the figure. Furthermore, as shown in
Figure 15, the value of
at the same discharge flow rate was smaller for
= 150 mm than for
= 110 mm, indicating that the PMD equipped with 150 mm long cylindrical mesh screens exhibited superior liquid retention performance.
The analytical results were compared with the experimental results. These figures show that the analytical results obtained using Ingmanson’s formula for the mesh screen passing loss were closer to the experimental results compared to those obtained using Hartwig’s formula. However, discrepancies still existed between the analytical and experimental results. In this analysis, we applied the capillary pressure
of the mesh screen measured in a previous study [
19]. This measurement was taken using a flat mesh screen, which differed from the
capillary pressure measurement for the cylindrical mesh screen used in this study. In the cylindrical screen mesh, the dimensions of the outer and inner mesh openings differed, which caused a discrepancy with the capillary pressure of a flat screen mesh. Furthermore, the present analysis did not account for the flow field inside the tank, and as a result, the pressure around the lower nozzle was assumed to be uniform. Additionally, the inflow velocity into the mesh screen nozzle was assumed to be uniformly distributed circumferentially, and the flow within the nozzle was treated as one-dimensional. These simplifications are considered to be contributing factors to the discrepancies observed between the analytical and experimental results. To obtain more accurate and reliable results, it would be necessary to model the flow inside and outside the nozzle in the three-dimensional domain using CFD. However, this remains a subject for future studies. Additionally, future studies will include measurements of
for cylindrical mesh screens. To conduct this measurement, a method is employed in which liquid is confined within a cylindrical mesh screen and gas is pressurized from outside the screen; the onset of gas entrainment is identified by detecting slight changes in gas pressure. Additionally, we will verify the liquid acquisition performance of the PMD under flight acceleration conditions. To simulate these conditions, it is possible to tilt or invert the test tank. Moreover, using the high-speed rocket sled experimental equipment owned by our college [
29], we will observe the liquid behavior and confirm the propellant acquisition performance when the test tank is placed under acceleration and deceleration environments.
The liquid acquisition performance of the present PMD when applied to ethanol and liquid oxygen (LOX) is discussed below.
Table 5 summarizes the relevant physical properties—density, viscosity, and surface tension—of water, ethanol, and LOX, which are known to influence the liquid acquisition characteristics of the PMD. These values are based on data from the REFPROP [
28]. Generally, a higher surface tension, lower density, and lower viscosity contribute to improved liquid acquisition performance. For ethanol, its lower density compared to water contributes positively to this performance, whereas its higher viscosity and lower surface tension are considered detrimental factors. In the case of LOX, its low viscosity supports better performance, while its high density and low surface tension act as negative factors. From these perspectives, both ethanol and LOX exhibit physical property trends that include both enhancing and degrading influences on liquid acquisition performance relative to water. Moreover, since LOX is a cryogenic fluid, it is subject to heat leaks from the gas phase and the external tank environment. This could lead to bubbling within the PMD, which may negatively impact its liquid retention capability. Future studies will involve the design and verification testing of PMDs specifically suited for use with BE and LOX.


