Abstract
The failure mode and effect analysis (FMEA) method, which estimates the risk levels of systems or components solely based on the multiplication of simple risk rating indices, faces several limitations. These include the risk of inaccurate risk level judgment and the potential for misjudgments due to human factors, both of which pose significant threats to the safe operation of aircraft. Therefore, a Probabilistic Language based on a cumulative prospect theory (Probabilistic Language, PL) risk assessment strategy was proposed, combining the technique for order preference with similarity to an ideal solution (TOPSIS). The probabilistic language term value and probability value were fused in the method through the cumulative prospect theory, and a new PL measure function was introduced. The comprehensive weights of evaluation strategies were determined by calculating the relevant weights of various indicators through the subjective expert weight and objective entropy weight synthesis. So, a weighted decision matrix was constructed to determine the ranking order close to the ideal scheme. Finally, the risk level of each failure mode was ranked according to its close degree to the ideal situation. Through case validation, the consistency of risk ranking was improved by 23.95% compared to the traditional FMEA method. The rationality of weight allocation was increased by 18.2%. Robustness was also enhanced to some extent. Compared with the traditional FMEA method, the proposed method has better rationality, application, and effectiveness. It can provide technical support for formulating a new generation of airworthiness documents for the risk level assessment of civil aircraft and its subsystem components.
1. Introductory
With the development and operation of new multi-electric/all-electric civil aircraft, compared with the traditional civil aircraft, the electric power-based binary energy source has begun to completely replace various forms of binary energy sources, including mechanical power, pneumatic pressure and hydraulic pressure, and other forms of binary energy sources [1]. This not only effectively reduces the complexity of aircraft design, but also improves overall stability and ease of maintenance [2]. For future all-electric aircraft, adopting a high-voltage DC power supply system represents a key development trend. This approach offers several advantages, including reduced structural weight, enhanced energy storage capacity, optimized equipment layout, improved ground maintenance efficiency, better electromagnetic compatibility, and increased system stability [3]. Therefore, for all kinds of multi-electric/all-electric aircraft, the stable operation of the aircraft power supply system is more critical to the flight safety of the aircraft. The aircraft power supply power system is essential for flight control, navigation, communication, and safety. It comprises multiple sources—IDGs, batteries, TRUs, and emergency units like the RAT—interconnected via AC/DC buses for continuous and redundant supply. System failures may endanger flight safety, highlighting the need for precise risk assessment in design and certification. This issue has been extensively studied by researchers worldwide. Yin Zeyong et al. [4] analyzed the technical framework of aircraft engine airworthiness regulations and systematically identified issues in current domestic and international standards. Li Zhiping et al. [5] used the Monte Carlo method to call the engine aerodynamic thermal model to construct the safety assessment method of the aero-engine system. Bayesian theory is used in the literature [6] to study the reliability of aircraft landing gear; Reference [7] used an improved STPA-TOPSIS method to assess the reliability of onboard network information security, while Reference [8] used a fault tree to assess the reliability of aircraft power systems. In the literature [9], reliability evaluation indexes are introduced to determine the structure of general aviation aircraft power supply systems and calculate their reliability to conduct reliability analyses.
FMEA is a standardized technique used in the certification of aircraft airborne systems for airworthiness. It is a systematic analytical method designed to identify potential failure modes, causes, and effects in advance. The method is suitable for risk analysis at various levels of the system [10]. Traditional FMEA uses a 1–10 scale to score three core risk factors: occurrence (O), severity (S), and detection (D). These scores are used to assess each failure mode quantitatively. The risk priority number (RPN) is calculated by multiplying the evaluated values of the risk factors (O, S, D) together. It can be seen that the larger the RPN value, the greater the impact of the failure mode on the system risk. This further indicates that the risk level of the failure mode is higher [11]. Nevertheless, the conventional FMEA methodology is beset with the following shortcomings in actual practice [12]. First, the risk factor scores for occurrence, severity, and detection are often too close, making it difficult for evaluators to distinguish between adjacent levels. In addition, traditional FMEA does not consider the varying importance of these factors across different systems and fails to assign appropriate weights. Moreover, the RPN calculation method may introduce inconsistencies, as the resulting RPN values do not always reflect the actual level of risk.
In order to address the limitations of the traditional FMEA, researchers in both domestic and international contexts have devoted considerable effort to developing enhanced methodologies. Zhou Qian et al. introduced the Fuzzy C-Means algorithm and integrated it with triangular fuzzy numbers and the structural entropy weighting method. Based on this integration, they proposed a novel FMEA model for reliability risk assessment in intelligent manufacturing systems [13]. To overcome the limitations of traditional FMEA—such as inaccurate fault prioritization and excessive subjectivity in risk evaluation—Muhammad Akram et al. proposed a novel FMEA risk evaluation method. This method incorporates a Z-number-based preference ranking approach using similarity to attain the ideal solution [14]. In their study, Junyuan Qiu and colleagues examined the limitations of the conventional FMEA method, particularly the subjectivity and uncertainty in expert assessments and the challenge of expert weight assignment. To address these issues, they proposed an improved FMEA approach by integrating information entropy and hierarchical analysis, termed the Information Entropy–Hierarchical Analysis FMEA method [15]. In their study, Wang et al. [16] proposed a novel fuzzy RPN analysis method. The approach uses fuzzy linguistic terms to evaluate the factors contributing to each failure mode and applies a fuzzy weighted geometric mean to calculate the RPN. Gargama and Chaturvedi [17] employed fuzzy linguistic variables to express expert evaluations of the three influencing factors. They assessed the consistency between the evaluation information and the corresponding fuzzy numbers, using the alpha-level set to compute the fuzzy RPN.
This paper synthesizes previous studies by integrating probabilistic linguistic terms with cumulative prospect theory and the TOPSIS method. Based on this integration, a novel information entropy TOPSIS-FMEA assessment method, which is based on probabilistic language terms, is proposed. The combination of the subjective assignment method and the entropy weighting method allows for the integration of both the empirical knowledge of the evaluation experts and the objective information of the influencing factors themselves. This approach ensures a more reasonable assignment of weights, as it considers the subjective input of the experts while also accounting for the objective data pertaining to the influencing factors. The issue of determining the evaluation level of risk factors with a high degree of difficulty has been resolved. Furthermore, a shortcoming of the traditional FMEA, in which the RPN value does not align with the actual hazard level, has been addressed.
2. Probabilistic Language Terminology Measures and Cumulative Prospect Theory
2.1. Glossary of Probabilistic Language Terms
Definition 1
[18]. The glossary of linguistic terms is represented by the following set:
The term is a linguistic term. It is possible to select different linguistic terminology meta-models. The number of term elements in set is odd and symmetrical. For instance, when the linguistic term set consists of five elements, the scale is used to represent linguistic assessments such as “Very Poor”, “Poor”, “Neutral”, “Good”, and “Very Good”, respectively. For computational convenience, the scale is normalized to the range of 0 to 4 in the present study for computational convenience. The Probability Language Terminology Set satisfies the following equation:
(1) If , then ;
(2) The negation operation is satisfied by the following: , and .
Definition 2
[19]. The set of probabilistic language terms for the Glossary of linguistic term set is as follows:
In the above equation, is a probabilistic language term indicating that the probability of the th probabilistic language term element is ; if , then it means that the information about the probability distribution of all linguistic term elements is known; if , then this implies the existence of missing probability distribution information for certain language term elements. This suggests that some information has been lost during the decision-making process, indicating that the current knowledge is inadequate for providing decision-makers with a comprehensive assessment.
Definition 3
[19]. When , the standardized Glossary of linguistic terms corresponding to the probabilistic language term is defined as follows:
For the sake of convenience, subsequent probability language terms are provided in a standardized format. Any term not mentioned has been assigned a probability of 0.
Definition 4
[19]. In probabilistic language, the measure of , that is to say the score function, can be expressed as follows:
The deviation function can be defined as follows:
In Equation (5), is the subscript of the linguistic terminology element corresponding to .
The above definition allows a comparison of two probabilistic language terms and : if , then ; if , when , then ; when , then ; when , then .
2.2. Measurement of New PLs Under Cumulative Prospect Theory
Tversky and Kahneman, through comprehensive experimental research [20], ultimately represented the decision-maker’s “bounded rationality” with three functions: the prospect function, the value function, and the weighting function. Further improvements were made to this foundation, resulting in the following specific forms for these three functions:
The cumulative prospect function is as follows:
The value function is as follows:
The weighting function is as follows:
In Equation (8), is used to denote the reference point; is used to denote the value risk attitude coefficient in the face of gain or loss; is used to denote the loss aversion factor; and is used to denote the risk attitude coefficient for probability weights in the face of gain or loss. The discrepancy in the scale between these terms is not taken into account when calculating the scoring values for probability language terms as set out in Definition 4. The application of cumulative prospect theory enables the integration of subjective psychological research results and the consideration of value functions pertaining to reference point variables and probability weighting functions for the purpose of calculating a combined measure. The fusion measure of the obtained PLTS can be more accurately reflected by the decision-maker’s evaluation of the information presented [21].
Definition 5.
The probability of language terms can be calculated using cumulative prospect theory, whereby the scoring function is as follows:
Based on Equation (9), the definitions of and are given below:
The variance value is as follows:
In light of the data presented in reference [18], it is proposed that the variables in the formula be set as follows: , , , .
Traditional FMEA, with its discrete scoring system, encounters challenges when addressing the ambiguity and probabilistic uncertainty inherent in expert judgment. The Probabilistic Linguistic Term Set (PLTS) mitigates this limitation by quantifying uncertainty by representing linguistic terms through probability distributions. Cumulative Prospect Theory (CPT) further enhances the evaluation process by incorporating the risk biases of decision-makers, thereby overcoming the limitations of the “perfect rationality” assumption inherent in traditional expected utility theory. Meanwhile, the Technique for Order Preference by Similarity to Ideal Solution (TOPSIS) resolves prioritization ambiguities that arise when multiple risk scenarios share the same RPN value by calculating proximity rankings. The combined use of these three methods offers several advantages:
(1) PLTS quantifies fuzzy linguistic information, CPT adjusts for subjective risk preferences, and TOPSIS provides a robust ranking system;
(2) The integration of combined weights mitigates the one-sidedness associated with single-assignment methods;
(3) Case study validation demonstrates that the sensitivity of the method to changes in ratings is reduced by 23.95%, outperforming single approaches such as fuzzy TOPSIS, which only reduces sensitivity by 7.5%.
3. Failure Mode Analysis of Aircraft Power Supply System
ARP4761 clearly defines the recommended methods for system safety assessment, including FHA, FTA, and FMEA. It specifies how these methods should be applied at different stages of system development. The standard also classifies failure conditions into five levels: Catastrophic, Hazardous, Major, Minor, and No Safety Effect. Each level has a defined maximum allowable failure rate. For example, Catastrophic failures must occur at a rate lower than 10−9 per flight hour to meet safety objectives. This provides a basis for evaluating compliance with safety targets.
The power system architecture of the Boeing 787 is shown in Figure 1. As shown in Figure 1, it features multiple power sources, including variable frequency starter generators (VFSGs), an APU, an RAT, and batteries. Power is managed via the BPCU and distributed through generator control breakers (GCBs), bus tie breakers (BTBs), and the backup bus. The system supports both 230VAC and ±270VDC main buses, with conversion to 115VAC and 28VDC via autotransformers (ATUs), transformer rectifier units (TRUs), and ATRUs. Redundant left and right channels ensure continuous power supply under various operational conditions.
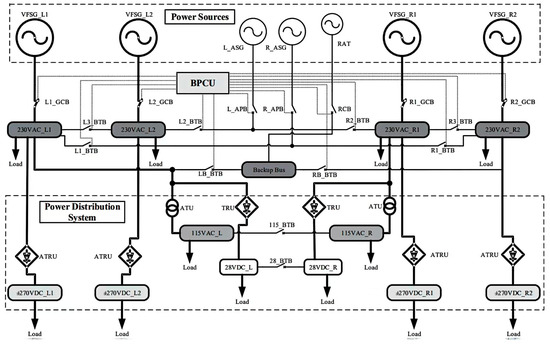
Figure 1.
Electrical power system structure of B787.
We analyzed the architecture of the Boeing 787 power supply system, analyzed the functional and structural analysis of the power supply system of the Boeing 787 aircraft according to its working principle, and obtained several main failure modes and failure causes of the power supply system of this aircraft. The specific results are shown in Table 1:

Table 1.
Aircraft power supply system main failure modes and fault causes.
4. A TOPSIS-FMEA Assessment Method Based on Probabilistic Language Term Set and Information Entropy
The traditional Failure Modes and Effects Analysis (FMEA) method is highly subjective and fails to account for the inherent ambiguity in risk assessment indicators. To address this limitation, the concept of the probabilistic linguistic term set is introduced to enhance the assessment process. Accordingly, a novel evaluation method, based on probabilistic linguistic term set information entropy and the VIKOR-FMEA approach, is proposed. The specific steps of this method are illustrated in Figure 2.
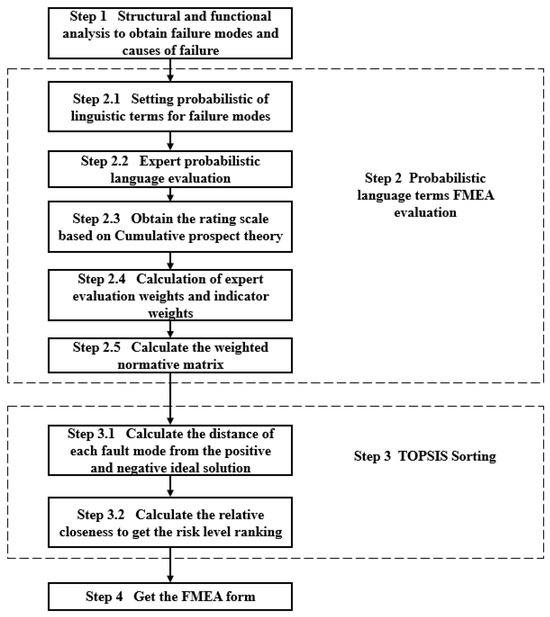
Figure 2.
Probabilistic language term TOPSIS-FMEA method main steps.
Step 1: Failure modes and their underlying causes are identified through a comprehensive analysis of the structure and functionality of the evaluated object.
Step 2: Evaluation of FMEA based on probabilistic language terms.
Step 2.1: For the failure modes identified in Step 1, define the three risk evaluation indices of the probabilistic linguistic term set as the probability of occurrence (O), the severity level (S), and the detection difficulty level (D).
Step 2.2: Engage domain experts to assess the failure modes identified in Step 1 using the probabilistic linguistic term set established in Step 2.1.
Step 2.3: Transform the expert evaluation data obtained in Step 2.2 using cumulative prospect theory to generate the corresponding evaluation value matrix.
In the matrix, represents the evaluation value assigned by expert i for failure mode j. The parameter corresponds to the evaluations of the probability of occurrence (O), severity level (S), and detection difficulty level (D), respectively.
Step 2.4: Determine the weights of the experts. The accuracy and consistency of the evaluation results are influenced by the work experience and professional expertise of each expert. Therefore, it is essential to assign appropriate evaluation weights to each expert and establish a corresponding weight vector . The criteria for expert weight allocation are presented in Table 2:
Table 2.
Weighting of expert evaluations.
The evaluation weight of expert i is determined by summing the scores of two criteria: professionalism and work experience. The calculation is expressed as follows:
In Equation (13), n represents the total number of experts, denotes the score assigned to expert i based on their level of expertise, and denotes the score reflecting expert i’s work experience [22]. The expert weight vector is then derived accordingly.
Next, the entropy weight method is employed to calculate the weights of the indicators. The entropy weight method is a widely used approach for determining objective weights, originating from Shannon’s information entropy theory. According to this theory, a greater amount of information corresponds to lower entropy, indicating higher certainty. The entropy value reflects the degree of disorder in an event, characterizing the level of dispersion—greater disorder implies a more significant impact in the comprehensive assessment [23]. The determination of indicator weights is based on the computation of the entropy value for each indicator. This approach ensures that the results align with actual data, minimizing the influence of subjective human interference. The calculation steps are as follows:
Step 2.41: First process the raw data by the expression . Second, normalize data in by the expression ; in this expression is an element in , , .
Step 2.42: The objective is to determine the characteristic weights. For failure mode i, the characteristic weight of index j is calculated using the following expression:
Step 2.43: Compute the entropy value of the jth indicator as follows:
Step 2.44: Calculate the entropy weight of each indicator according to this formula: ,,. The resulting matrix of indicator weights is as follows:
Step 2.5: Calculate the weighted normative matrix based on the indicator weights obtained in step 2.4 according to this formula:
Step 3: Conduct the TOPSIS ranking for each failure mode based on the FMEA evaluation results obtained in Step 2.
Step 3.1: Compute the distance of each failure mode from the positive and negative ideal solutions. In risk assessment, the positive ideal solution and the negative ideal solution for each indicator correspond to the maximum and minimum values of the respective columns in the weighted judgment matrix . The optimal scenario occurs when the evaluated failure mode is closest to the positive ideal solution while being farthest from the negative ideal solution.
The Euclidean distances and of the failure modes i and the positive and negative ideal solutions are calculated in accordance with the methodology outlined in Equation (15):
In Equation (15), denotes the evaluation value of fault mode i with respect to the j index; m is the total number of fault modes; is the positive ideal solution of the j index; and is the negative ideal solution of the j index.
Step 3.2: Determine the relative closeness of each failure mode using the Euclidean distance to rank the risk levels. Based on the values of and obtained in Step 3.1, the closeness of each failure mode is calculated using the following formula:
A higher value of indicates a more hazardous failure mode i, requiring greater attention. By ranking the relative closeness of each failure mode, a corresponding risk level ranking is obtained.
Step 4: A table of the results of the FMEA evaluation should be obtained.
5. Risk Assessment Strategy Based on PLTS-TOPSIS-FMEA
5.1. Glossary of Probabilistic Language Terms for Aircraft Power Supply Systems
The probabilistic linguistic term set is established for the following failure modes: IDG fault, GCU fault, power supply management center fault, AC distribution unit fault, rectifier fault, and emergency power failure, as detailed in Table 1. The corresponding representation is provided in Table 3.
Table 3.
Probabilistic language term set.
Five experts were invited to assess the six failure modes of the aircraft power supply system using the probabilistic linguistic term set presented in Table 3. The evaluation results are provided in Table 4.
Table 4.
Expert’s probabilistic language evaluation results.
Subsequently, based on cumulative prospect theory, the evaluation value table is derived, as presented in Table 5.
Table 5.
Scale of evaluation values based on cumulative prospect theory.
Based on Table 2, along with the qualification levels and work experience of each of the five invited experts, the expert evaluation weights are determined, as shown in Table 6.
Table 6.
Expert evaluation weights.
Based on the expert assessment weights presented in Table 6, the entropy weighting method is then applied to determine the indicator weights as = (0.3526, 0.4427, 0.2048). These weights are subsequently substituted into Equation (14) to derive the weighted specification matrix, as shown below:
The positive ideal solution is obtained from as (0.8967, 0.9633, 0.3644), and the negative ideal solution is (0.2939, 0.2569, 0.1658). Subsequently, the Euclidean distances and of each fault mode to the positive and negative ideal solutions are calculated using Equation (15), as presented in Table 7.
Table 7.
Euclidean distances between each failure mode and the positive and negative ideal solutions.
The relative closeness of each failure mode is calculated using Equation (16) and subsequently normalized. The results are presented in Table 8.
Table 8.
Ranking of risk level of each failure mode of aircraft power supply system.
By applying the TOPSIS-FMEA risk assessment methodology, which integrates probabilistic linguistic term sets and information entropy, it is concluded that IDG failures represent the greatest hazard to the aircraft power supply system, while GCU failures pose the least threat.
5.2. Comparison of Case Evaluation Effectiveness
Five experts with the same qualification level and work experience were invited to conduct a Failure Modes and Effects Analysis (FMEA) assessment of the new aircraft power supply system. Based on the experts’ evaluation data, a system safety assessment was performed. The results obtained using the TOPSIS-FMEA method—incorporating a probabilistic linguistic terminology set and information entropy, as proposed in this study—were compared with those derived from the traditional FMEA method. As shown in Table 9 and Table 10, when the risk value associated with the occurrence degree of the wind factor in the AC distribution unit failure decreases from 4 to 3, the corresponding risk priority score drops from 120 to 90. Under these conditions, the failure of the power supply management center becomes more critical than that of the AC distribution equipment. This observation highlights a key limitation of the traditional FMEA method, where slight variations in evaluation values can result in changes in the failure mode ranking.
Table 9.
Traditional FMEA evaluation results.
Table 10.
Comparison between traditional FMEA and probabilistic language terminology information entropy TOPSIS-FMEA evaluation.
Consistent with the traditional FMEA approach, the same data in the probabilistic linguistic term entropy TOPSIS-FMEA method were modified in a similar manner. Subsequently, a comparative analysis was conducted between the results before and after the modification of this method and those of the traditional FMEA method. As shown in Table 10, unlike the traditional FMEA method, the ranking results of the probabilistic linguistic term entropy-based TOPSIS-FMEA method remain consistent after minor data variations. The failure modes with the highest and lowest risk levels remain unchanged. By integrating probabilistic linguistic terminology and prospect theory with the TOPSIS ranking method, the proposed approach effectively addresses the limitations of traditional FMEA, which relies on RPN sorting. This integration prevents minor variations in the assessed values of risk evaluation indicators from altering the final ranking, thereby enhancing the robustness and reliability of the assessment. Consequently, the proposed method demonstrates distinct advantages over the traditional FMEA approach.
Next, the risk assessment performance of the improved method is compared with that of the traditional FMEA method, the fuzzy TOPSIS method, and the entropy weight TOPSIS method. A deviation metric was introduced as an indicator of robustness [24]:
In Equation (17), denotes the rank of the th item in the original ordering, and denotes its rank after perturbation. The total number of items is denoted by .
For each of the above methods, ten perturbation tests were conducted. Ranking consistency (%) was calculated as the number of unchanged rankings after perturbation divided by the total number of rankings, multiplied by 100%. The final ranking consistency was obtained by averaging the results over the ten tests. Robustness was evaluated by calculating the average value of the robustness metric across the ten perturbations.
The comparison results, presented in Table 11, indicate that the PLTS-TOPSIS-FMEA method enhances ranking consistency by 12.6% compared to the fuzzy TOPSIS method, by 9.4% compared to the entropy weight TOPSIS method, and also by 18.3% compared to the traditional FMEA method. This improvement demonstrates the superior robustness of the proposed approach, which is primarily attributed to the probabilistic distribution characteristics of PLTS and the risk preference correction mechanism of cumulative prospect theory. Although the computational complexity of the proposed method is slightly higher, its superior accuracy in risk assessment for safety-critical aviation systems enhances its practical application value. Moreover, it provides a more scientifically sound and rational foundation for optimizing the design, operation, and maintenance strategies of next-generation aircraft.
Table 11.
Comparison of risk assessment performance among different methods.
Finally, to validate that the introduction of the comprehensive weighting method improves the rationality of indicator weight allocation, the five experts were invited to evaluate the “rationality” of both the comprehensive weighting method and the equal-weighting method. The results, shown in Table 12, indicate the following improvement:
Table 12.
Expert evaluation of the rationality of different weighting schemes.
6. Conclusions
In this study, a novel FMEA-based safety assessment method is proposed by integrating cumulative prospect theory with probabilistic linguistic term sets (PLTS), tailored to the characteristics of the aircraft power supply system in more-electric/all-electric airplanes. The effectiveness of the proposed approach is demonstrated through case calculations, as presented in the results:
- Using a probabilistic linguistic term set to assess system failure modes addresses the ambiguity in risk evaluation caused by the subjectivity of traditional FMEA. This is more suitable for the risk assessment thinking and behavioral habits of airborne systems and can improve the accuracy of analysis.
- The proposed method integrates probabilistic linguistic term sets with cumulative prospect theory by incorporating value functions and probability weighting functions based on relative reference points. Additionally, it employs a novel PL measurement function, effectively addressing the lack of intuitiveness in evaluation information. This approach offers the advantage of capturing expert assessments in a more direct and precise manner, thereby enhancing the reliability of the evaluation process.
- The methodology proposed in this paper employs a combination of subjective and objective weighting approaches to determine comprehensive weights. This integration enhances the credibility of the evaluation results, making them more persuasive compared to existing studies on data processing and practical applications.
- The TOPSIS ranking method is employed to achieve a detailed classification of risk levels across various failure modes. This approach effectively mitigates the ambiguity in risk level determination caused by identical RPN values. Additionally, it addresses the assessment bias and increased complexity that may arise in traditional FMEA due to the direct multiplication of multiple influencing factors.
Based on the case study results and comparative analysis, the PLTS-TOPSIS-FMEA method demonstrates a 23.95% () improvement in risk ranking consistency compared to the traditional FMEA approach, a 15.34% () improvement compared to the fuzzy TOPSIS method, and an 11.01% () improvement compared to the entropy-weighted TOPSIS method. Additionally, its robustness to variations in expert evaluations is significantly enhanced. For instance, when the “occurrence probability” score of a failure mode is adjusted from 4 to 3, the ranking fluctuation in traditional FMEA is ±2 positions. In contrast, the fluctuation in the PLTS-TOPSIS-FMEA method is constrained to just ±0.5 positions. Furthermore, by incorporating comprehensive weighting, the rationality of index weight allocation improves by 18.2%, indicating that the proposed method more accurately reflects actual risk levels. Therefore, the methodology presented in this study offers an intuitive, accurate, and rational approach for FMEA assessment in novel aircraft power supply systems. The proposed FMEA evaluation strategy enables a comprehensive risk assessment of various failure modes in aircraft power supply systems. This assessment covers the entire lifecycle, including the design, manufacturing, operation, and maintenance stages. The strategy helps designers and operators develop more effective maintenance plans. In addition, it provides a technical reference for the formulation of airworthiness standards for next-generation all-electric aircraft.
Author Contributions
Z.X.: conceptualization, methodology, software, validation, writing—original draft, writing—review and editing. J.B.: formal analysis, data curation, investigation, resources. Z.S.: visualization, supervision, project administration, funding acquisition. All authors have read and agreed to the published version of the manuscript.
Funding
This research was funded by: National 268 Project Program (China) and by the Civil Aviation Security Capacity Building Project (Grant number MHRD20190185). This research was funded by Central University Project (Grant number 3122016D032).
Data Availability Statement
The data presented in this study are available on request from the corresponding author. The data are not publicly available due to privacy concerns.
Acknowledgments
Thank you to all the personnel for their dedication.
Conflicts of Interest
The funders had no role in the design of the study; in the collection, analyses, or interpretation of data; in the writing of the manuscript; or in the decision to publish the results.
References
- Zhang, Z.R.; Xu, Y.W.; Yao, Y.M.; Yu, L.; Yan, Y.G. Development status and key technologies of high-voltage DC parallel power supply systems for more-electric aircraft. Acta Aeronaut. Astronaut. Sin. 2021, 42, 12–25. [Google Scholar]
- Zhang, Z.R.; Xu, Y.W.; Yao, Y.M. Power system and key technologies of more-electric aircraft. J. Nanjing Univ. Aeronaut. Astronaut. 2022, 54, 969–984. [Google Scholar]
- Zhang, Z.; Li, J.; Han, J.; Lu, J.; Shi, H. Research and implementation of high-power high-voltage DC starter-generator system for more-electric aircraft. Acta Aeronaut. Astronaut. Sin. 2020, 41, 324–335. [Google Scholar]
- Yin, Z.Y.; Ding, S.T.; Li, G.; Qiu, T.; Liu, C.K.; Zhou, Y.; Qi, L. Strategies and technical paths for the development of next-generation airworthiness regulations for aero-engines. China Eng. Sci. 2022, 24, 230–239. [Google Scholar] [CrossRef]
- Li, Z.P.; Sun, Z.Q.; Zhu, X.Y.; Zhao, Y.J.; Qi, L. A safety assessment method for aero-engine systems based on surge/stall. J. Aerosp. Dyn. 2025, 40, 20230187. [Google Scholar]
- Lv, Y.; Zhang, F.; Chen, X.; Li, Y.; Tian, Y. Reliability Evaluation of Landing Gear Retraction/Extension Accuracy Based on Bayesian Theory. Aerospace 2025, 12, 300. [Google Scholar] [CrossRef]
- Wang, K.; Zhang, M.; Hong, Y.; Bai, J.; Zhang, L. Airborne Network Information Security Risk Assessment Method Based on Improved STPA-TOPSIS. Aerospace 2025, 12, 442. [Google Scholar] [CrossRef]
- Song, S.F.; Ma, Y.Y.; Wang, L. Importance analysis of fault tree in probabilistic safety assessment and reliability analysis. Prog. Progress Aerosp. Eng. 2018, 9, 506–513. [Google Scholar]
- Huang, M. Reliability Analysis of Power Supply System for General Aviation Aircraft. Institute of Management Science and Industrial Engineering. In Proceedings of the 2019 International Conference on Information Science, Medical and Health Informatics (ISMHI 2019), Xiamen, China, 17–19 May 2019. [Google Scholar] [CrossRef]
- Xi, X.H.; Zhang, C.; Ren, Y. Risk management of civil aircraft flight test items based on FMEA. Civ. Aircr. Des. Res. 2025, 1, 131–137. [Google Scholar]
- Li, Z.Y.; Zhang, X.; Chen, X.; Tong, B.; Li, H.; Zhao, Y. Safety risk assessment method for deep-sea mining transportation systems based on α-cut fuzzy numbers and FMEA. Shipbuilding 2024, 35, 92–101. [Google Scholar]
- Pillay, A.; Wang, J. Modified failure mode and effects analysis using approximate reasoning. Reliab. Eng. Syst. Saf. 2003, 79, 69–85. [Google Scholar] [CrossRef]
- Zhou, Q.; Huang, J.; Song, M.S. Reliability and risk assessment of intelligent manufacturing system based on improved FMEA. Mod. Manuf. Eng. 2024, 5, 145–152. [Google Scholar] [CrossRef]
- Akram, M.; Ullah, I.; Allahviranloo, T.; Shahriari, M. An integrated weighted multi-criteria decision making method using Z-number and its application in failure modes and effect analysis. J. Ind. Inf. Integr. 2025, 45, 100805. [Google Scholar] [CrossRef]
- Qiu, J.Y.; Liu, K.; Yang, L.F.; Jiang, X.S.; Cang, S.L. Information entropy-hierarchical analysis combined empowerment FMEA method. Ind. Technol. Innov. 2023, 10, 77–87. [Google Scholar] [CrossRef]
- Wang, Y.-M.; Poon, G.K.K.; Yang, J.-B.; Chin, K.-S. Risk evaluation in failure mode and effects analysis using fuzzy weighted geometric mean. Expert Syst. Appl. 2009, 36, 1195–1207. [Google Scholar] [CrossRef]
- Gargama, H.; Chaturvedi, S.K. Criticality assessment models for failure mode effects and criticality analysis using fuzzy logic. IEEE Trans. Reliab. 2011, 60, 102–110. [Google Scholar] [CrossRef]
- Xu, Z.S. Uncertain Multi-Attribute Decision Making Methods and Applications; Springer: Berlin/Heidelberg, Germany, 2015. [Google Scholar]
- Pang, Q.; Wang, H.; Xu, Z.S. Probabilistic linguistic term sets in multi-attribute group decision making. Inf. Sci. 2016, 369, 128–143. [Google Scholar] [CrossRef]
- Tversky, A.; Kahneman, D. Advances in prospect theory: Cumulative representation of uncertainty. J. Risk Uncertain. 1992, 5, 297–323. [Google Scholar] [CrossRef]
- Zhang, Y.; Wang, L.; Lu, L.; Ye, Y.P.; Wan, L. PL-VIKOR group decision making based on Cumulative prospect theory and academic rating. Syst. Eng. Electron. 2023, 45, 1762–1771. [Google Scholar]
- Shi, X.D.; Cheng, B.Y.; Huang, K.; Yang, Z.G. Aircraft IDG risk evaluation based on fuzzy TOPSIS-FMEA. Syst. Eng. Electron. 2022, 44, 2060–2064. [Google Scholar]
- Cheng, Q.Y. Structural entropy weighting method for weight determination of evaluation indexes. Syst. Eng. Theory Pract. 2010, 30, 1225–1228. [Google Scholar]
- Tian, Z.; Nie, R.; Wang, J.; Li, L. Group multigranular linguistic QFD for prioritizing service designs with combined weighting method. Expert Syst. 2019, 36, e12419. [Google Scholar] [CrossRef]
Disclaimer/Publisher’s Note: The statements, opinions and data contained in all publications are solely those of the individual author(s) and contributor(s) and not of MDPI and/or the editor(s). MDPI and/or the editor(s) disclaim responsibility for any injury to people or property resulting from any ideas, methods, instructions or products referred to in the content. |
© 2025 by the authors. Licensee MDPI, Basel, Switzerland. This article is an open access article distributed under the terms and conditions of the Creative Commons Attribution (CC BY) license (https://creativecommons.org/licenses/by/4.0/).