Abstract
Eye movement features of pilots are critical for aircraft landing, especially in low-visibility and windy conditions. This study conducts simulated flight experiments concerning aircraft approach and landing under three low-visibility and windy conditions, including no-wind, crosswind, and tailwind. This research collects 30 participants’ eye movement data after descending from the instrument approach to the visual approach and measures the landing position deviation. Then, a random forest method is used to rank eye movement features and sequentially construct feature sets by feature importance. Two machine learning models (SVR and RF) and four deep learning models (GRU, LSTM, CNN-GRU, and CNN-LSTM) are trained with these feature sets to predict the landing position deviation. The results show that the cumulative fixation duration on the heading indicator, altimeter, air-speed indicator, and external scenery is vital for landing position deviation under no-wind conditions. The attention allocation required by approaches under crosswind and tailwind conditions is more complex. According to the MAE metric, CNN-LSTM has the best prediction performance and stability under no-wind conditions, while CNN-GRU is better for crosswind and tailwind cases. RF also performs well as per the RMSE metric, as it is suitable for predicting landing position errors of outliers.
1. Introduction
Approach and landing are the most critical phases of a flight, as they are highly associated with flight hazards. According to data from the International Civil Aviation Organization (ICAO), approximately 80% of aviation accidents occur during the takeoff and landing phases. The high accident rate and fatality proportion highlight the necessity of analyzing and mitigating the risks associated with these phases to ensure flight safety.
Many well-known accident cases (e.g., Delta Flight 191 and Henan Airlines VD8387) have demonstrated that the approach and landing phases are easily influenced by environmental factors, such as wind and visibility [1]. While auto-landing systems have been in use since the 1970s, they are still not installed on many types of aircraft and are not allowed at some airports because of the inadequacy of precision-approach infrastructure and corresponding approach procedures. In these cases, pilots must rely on runway navigation lights for visual guidance and manually control the aircraft during landing. The challenge of a manual approach and landing may increase the pilot’s workload and affect their psychological and physiological state, which, in turn, impacts their ability to control the aircraft [2,3]. If pilots are unable to precisely control the airspeed, height, attitude, and heading of the airplane during landing in special weather conditions, it may result in severe incidents, such as controlled flight into terrain, hard landings, bounces, and runway overruns [4,5,6].
During a normal approach, the aircraft descends along a specific glide slope to safely align with the runway, typically set at a 3° angle. This glide slope provides a stable and safe descent path, ensuring the aircraft touches down at the designated landing position. The glide slope for an airplane landing in low-visibility conditions is similar to that in normal conditions. However, the entire approach can be divided into two parts: the instrument approach and the visual approach [3,7]. The instrument approach refers to the phase in which the aircraft is primarily guided by flight instruments that offer navigation aids. In contrast, the visual approach involves pilots using visual references to navigate when they can see the ground [8]. During the instrument approach, pilots rely on systems such as the Instrument Landing System (ILS), VOR (VHF Omnidirectional Range), and NDB (Non-Directional Beacon) to guide the aircraft. In the visual approach, pilots pay more attention to external visual cues while also using the instruments to capture necessary information [9]. In this sense, pilots must remain alert to changing weather conditions and effectively maintain a stable approach path by balancing information from onboard instruments and external visual cues. Hence, approach and landing performance can be analyzed by examining the correlation between pilots’ eye movements and flight data [10,11,12,13].
A safe and standardized landing requires, first and foremost, minimal load on the landing gears to avoid airframe damage [14,15,16,17,18,19]. Additionally, it requires an appropriate touchdown position on the runway. An early touchdown may damage both the runway infrastructure and the aircraft, while a late touchdown could result in the aircraft overrunning the runway [20,21]. To assess these risks, landing position deviation is commonly used as an indicator to ensure a standard landing. Landing position deviation refers to the distance between the aircraft’s actual touchdown position and the designated position. Accurately predicting landing position deviation is crucial for ensuring flight safety. However, few studies have investigated landing position deviation when landing in special weather conditions. Moreover, the relationship between pilots’ attention allocation during the approach and the resulting landing position deviation has not been thoroughly explored.
To address this knowledge gap, this study designs a series of simulated flight experiments to record flight data during approaches and landings in low-visibility and windy conditions (no-wind, crosswind, and tailwind). Additionally, pilots’ eye movement data are measured during the transition from the instrument approach to the visual approach, which are processed to extract eye movement features through sliding time windows. The pilots’ attention allocations toward instruments and external cues in different approaching conditions are analyzed. Subsequently, the eye movement features are input into a random forest model to determine the importance ranking of each eye movement feature in predicting landing position deviation. This study also develops two machine learning models (SVR, RF) and four deep learning models (GRU, LSTM, CNN-GRU, and CNN-LSTM) to predict landing position deviation using pilots’ eye movement features. The main contributions of this study are as follows:
(1) This study compares the differences in pilots’ attention allocation during the approach under low-visibility conditions with various wind types.
(2) This study uses eye movement features to predict pilots’ landing position deviations and compares the performance of machine/deep learning models in predictions.
(3) This study uncovers the impacts of eye movement features on landing position deviation in low-visibility and no-wind/crosswind/tailwind conditions.
2. Simulation Flight Experiment
2.1. Participants
The flight simulation experiments were conducted at the Civil Aviation Flight University of China. This study involved 30 flight cadets, with an average age of 22.3 years (SD = 2.6). All participants had normal or corrected-to-normal vision, and all were right-handed. The average flight experience of the pilots was 157.9 h (SD = 50.6). It is important to note that each participant had at least 20 h of real aircraft flying experience. Prior to the experiments, all participants were fully briefed on the experimental procedures and training objectives. They confirmed that their participation was entirely voluntary, with each participant signing an informed consent form. No invasive devices or disturbing simulation scenarios were used during the experiments. Ethical approval for this study was granted by the management department of the Civil Aviation Flight University of China.
2.2. Experiment Equipment
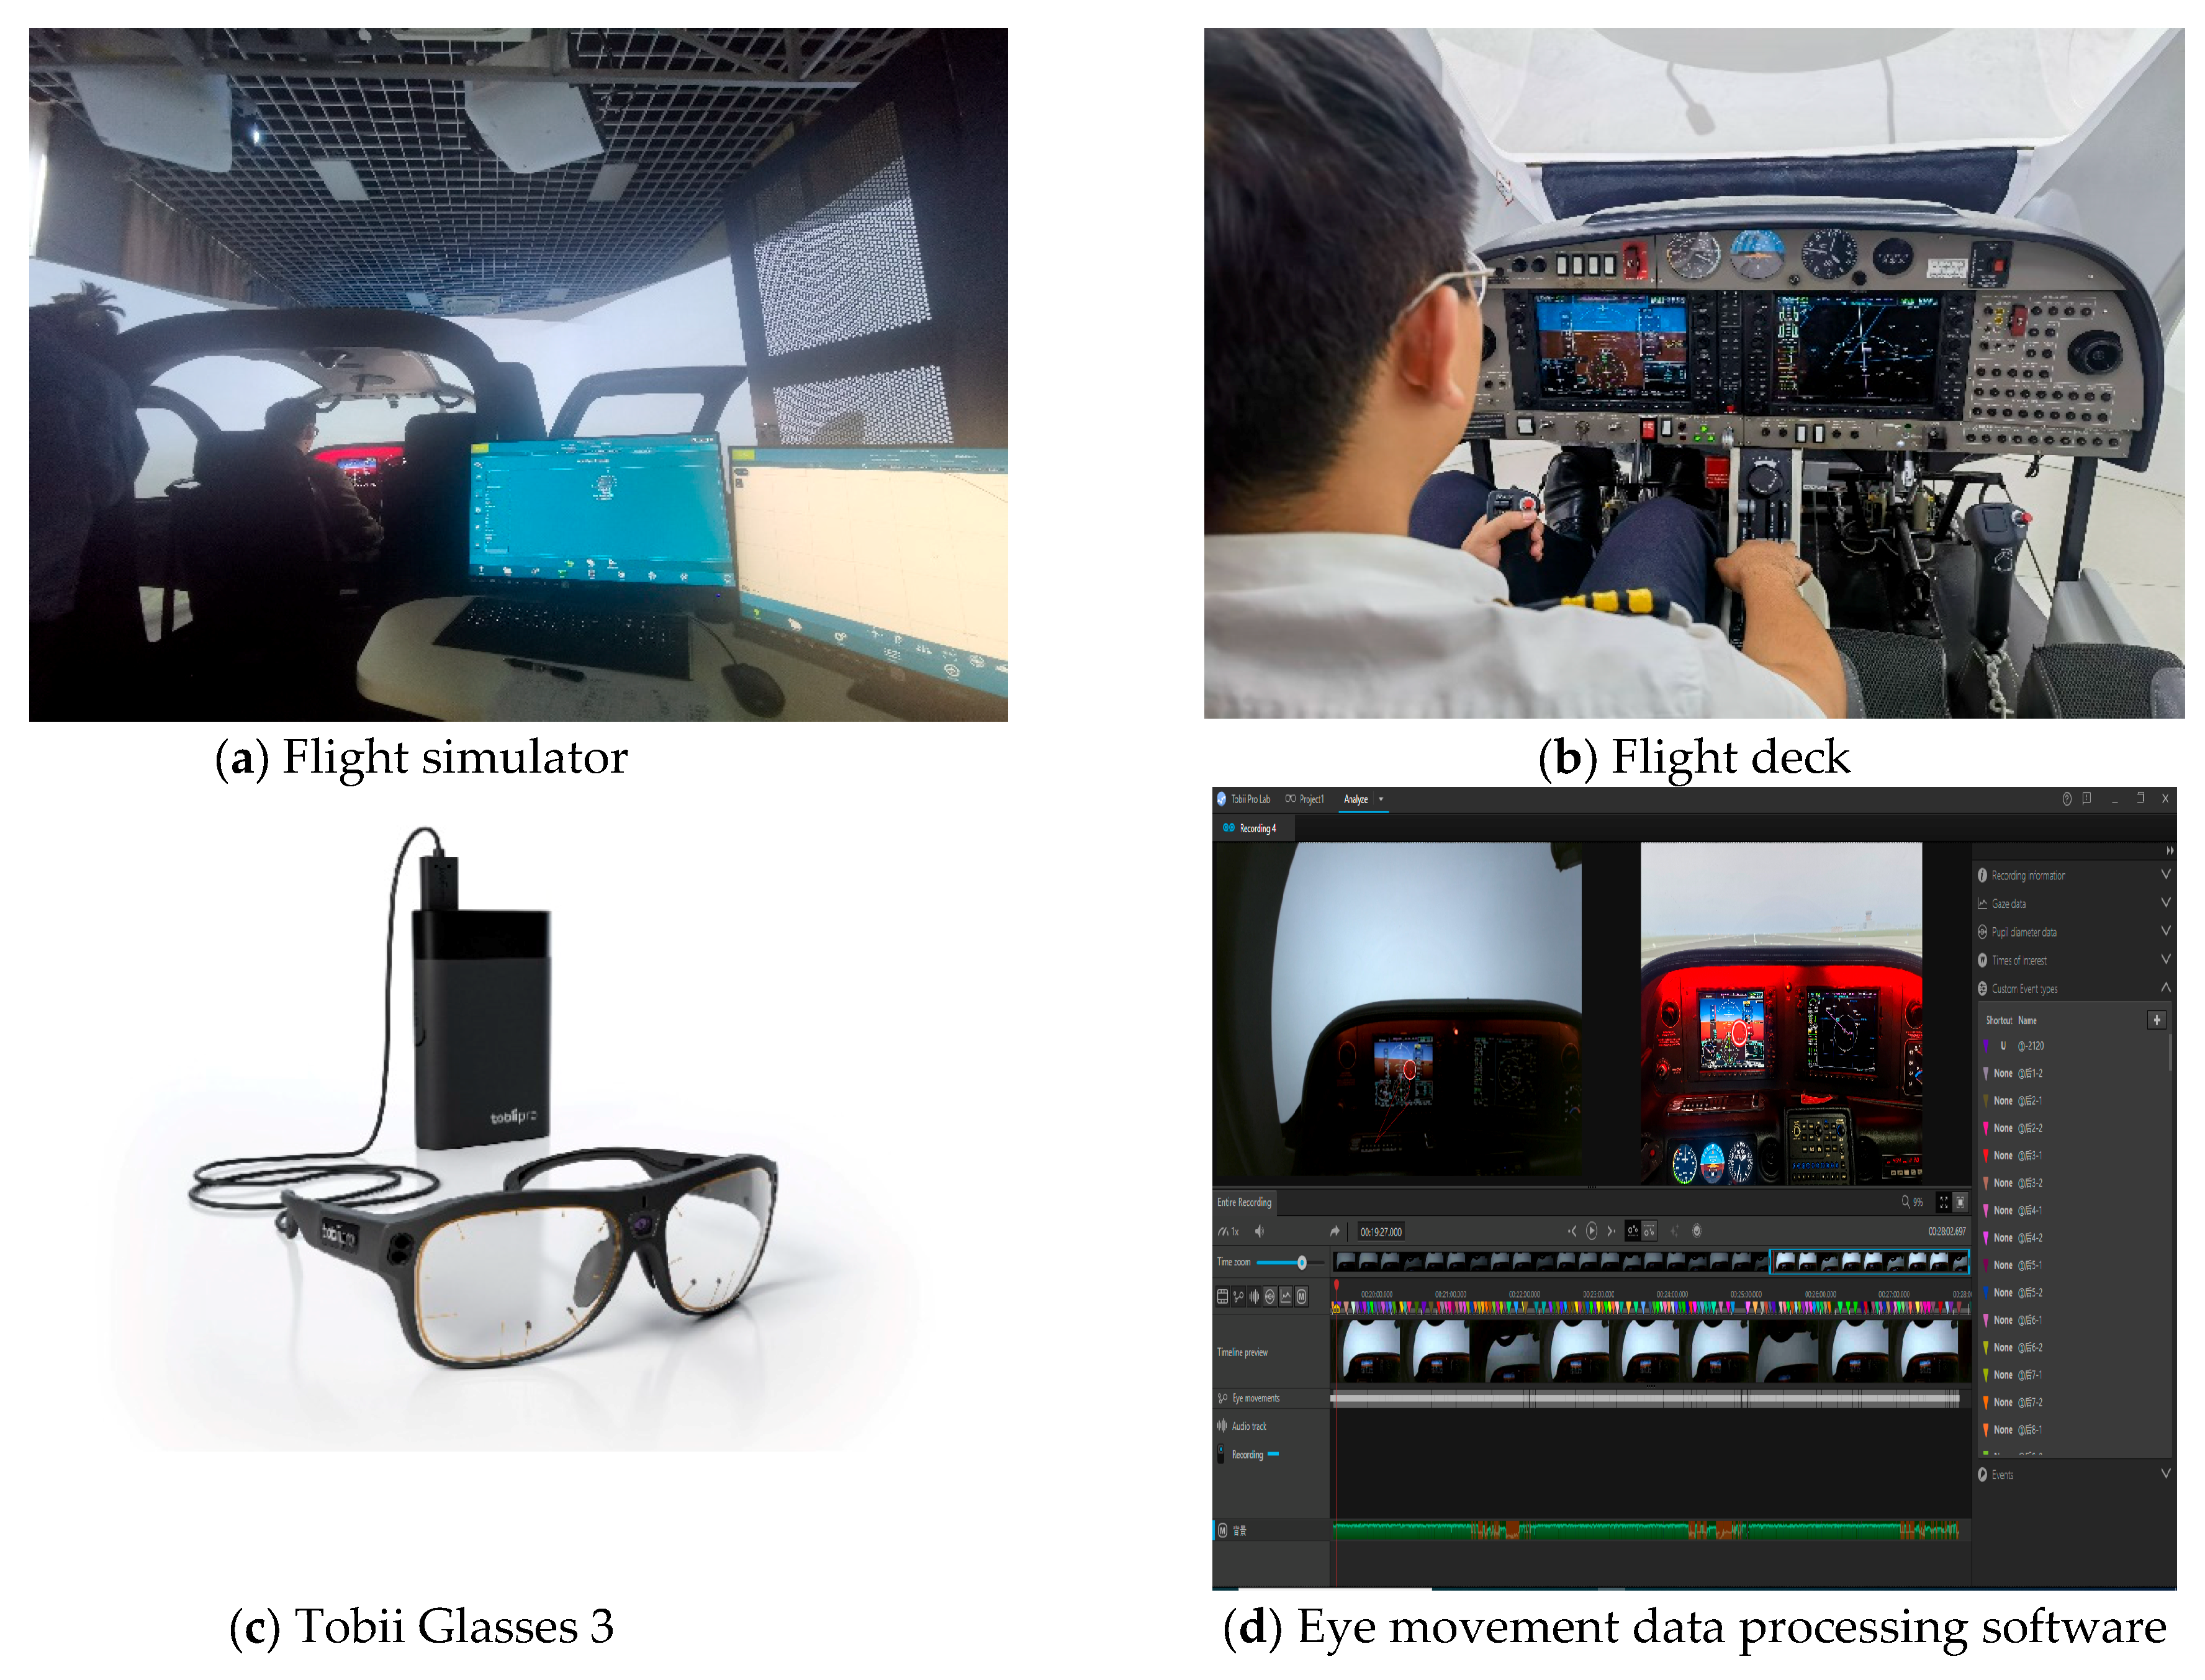
All experiments were conducted using a fixed Cirrus SR20 aircraft flight simulator (maintained by Civil Aviation Flight University of China, Guanghan, China, produced by Harbin Wright Brothers Technology Development Co., Ltd., Harbin, China). The SR20 is a single-engine, two-seat, light fixed-wing aircraft primarily used for pilot training. As shown in Figure 1a,b, this simulator replicates the cockpit of a real SR20. It adheres to the standards set by the European Union Aviation Safety Agency (EASA) and has received certification from the Civil Aviation Administration of China (CAAC). The simulator’s cockpit is equipped with the original avionics and backup instruments of the SR20. A 180° surround screen is installed outside the simulator cockpit to simulate the flight environment, providing exceptional realism. The simulator can replicate the entire flight process with high immersion, from taxiing and takeoff to landing. At the rear of the cockpit, a computer system controls the flight scene, aircraft positioning, and the environmental settings required for the experiments.

Figure 1.
Experiment apparatus and data processing software.
To capture pilots’ attention allocation during the approach and landing phases, this study used a Tobii Glasses 3 eye-tracking device (maintained by Civil Aviation Flight University of China, Guanghan, China, produced by Tobii Technology AB Co., Ltd., Stockholm, Sweden) to record eye movement data. As shown in Figure 1c, the Tobii Glasses 3 is a wearable eyewear device equipped with multiple micro-cameras that track the rotation of the eyes. The recorded eye movement data are transmitted to Tobii’s processing software for calibration and analysis. This software matches the gaze points with the observed visual field, allowing for the identification of attention focus and the corresponding eye movement features, as presented in Figure 1d.
2.3. Experiment Procedure
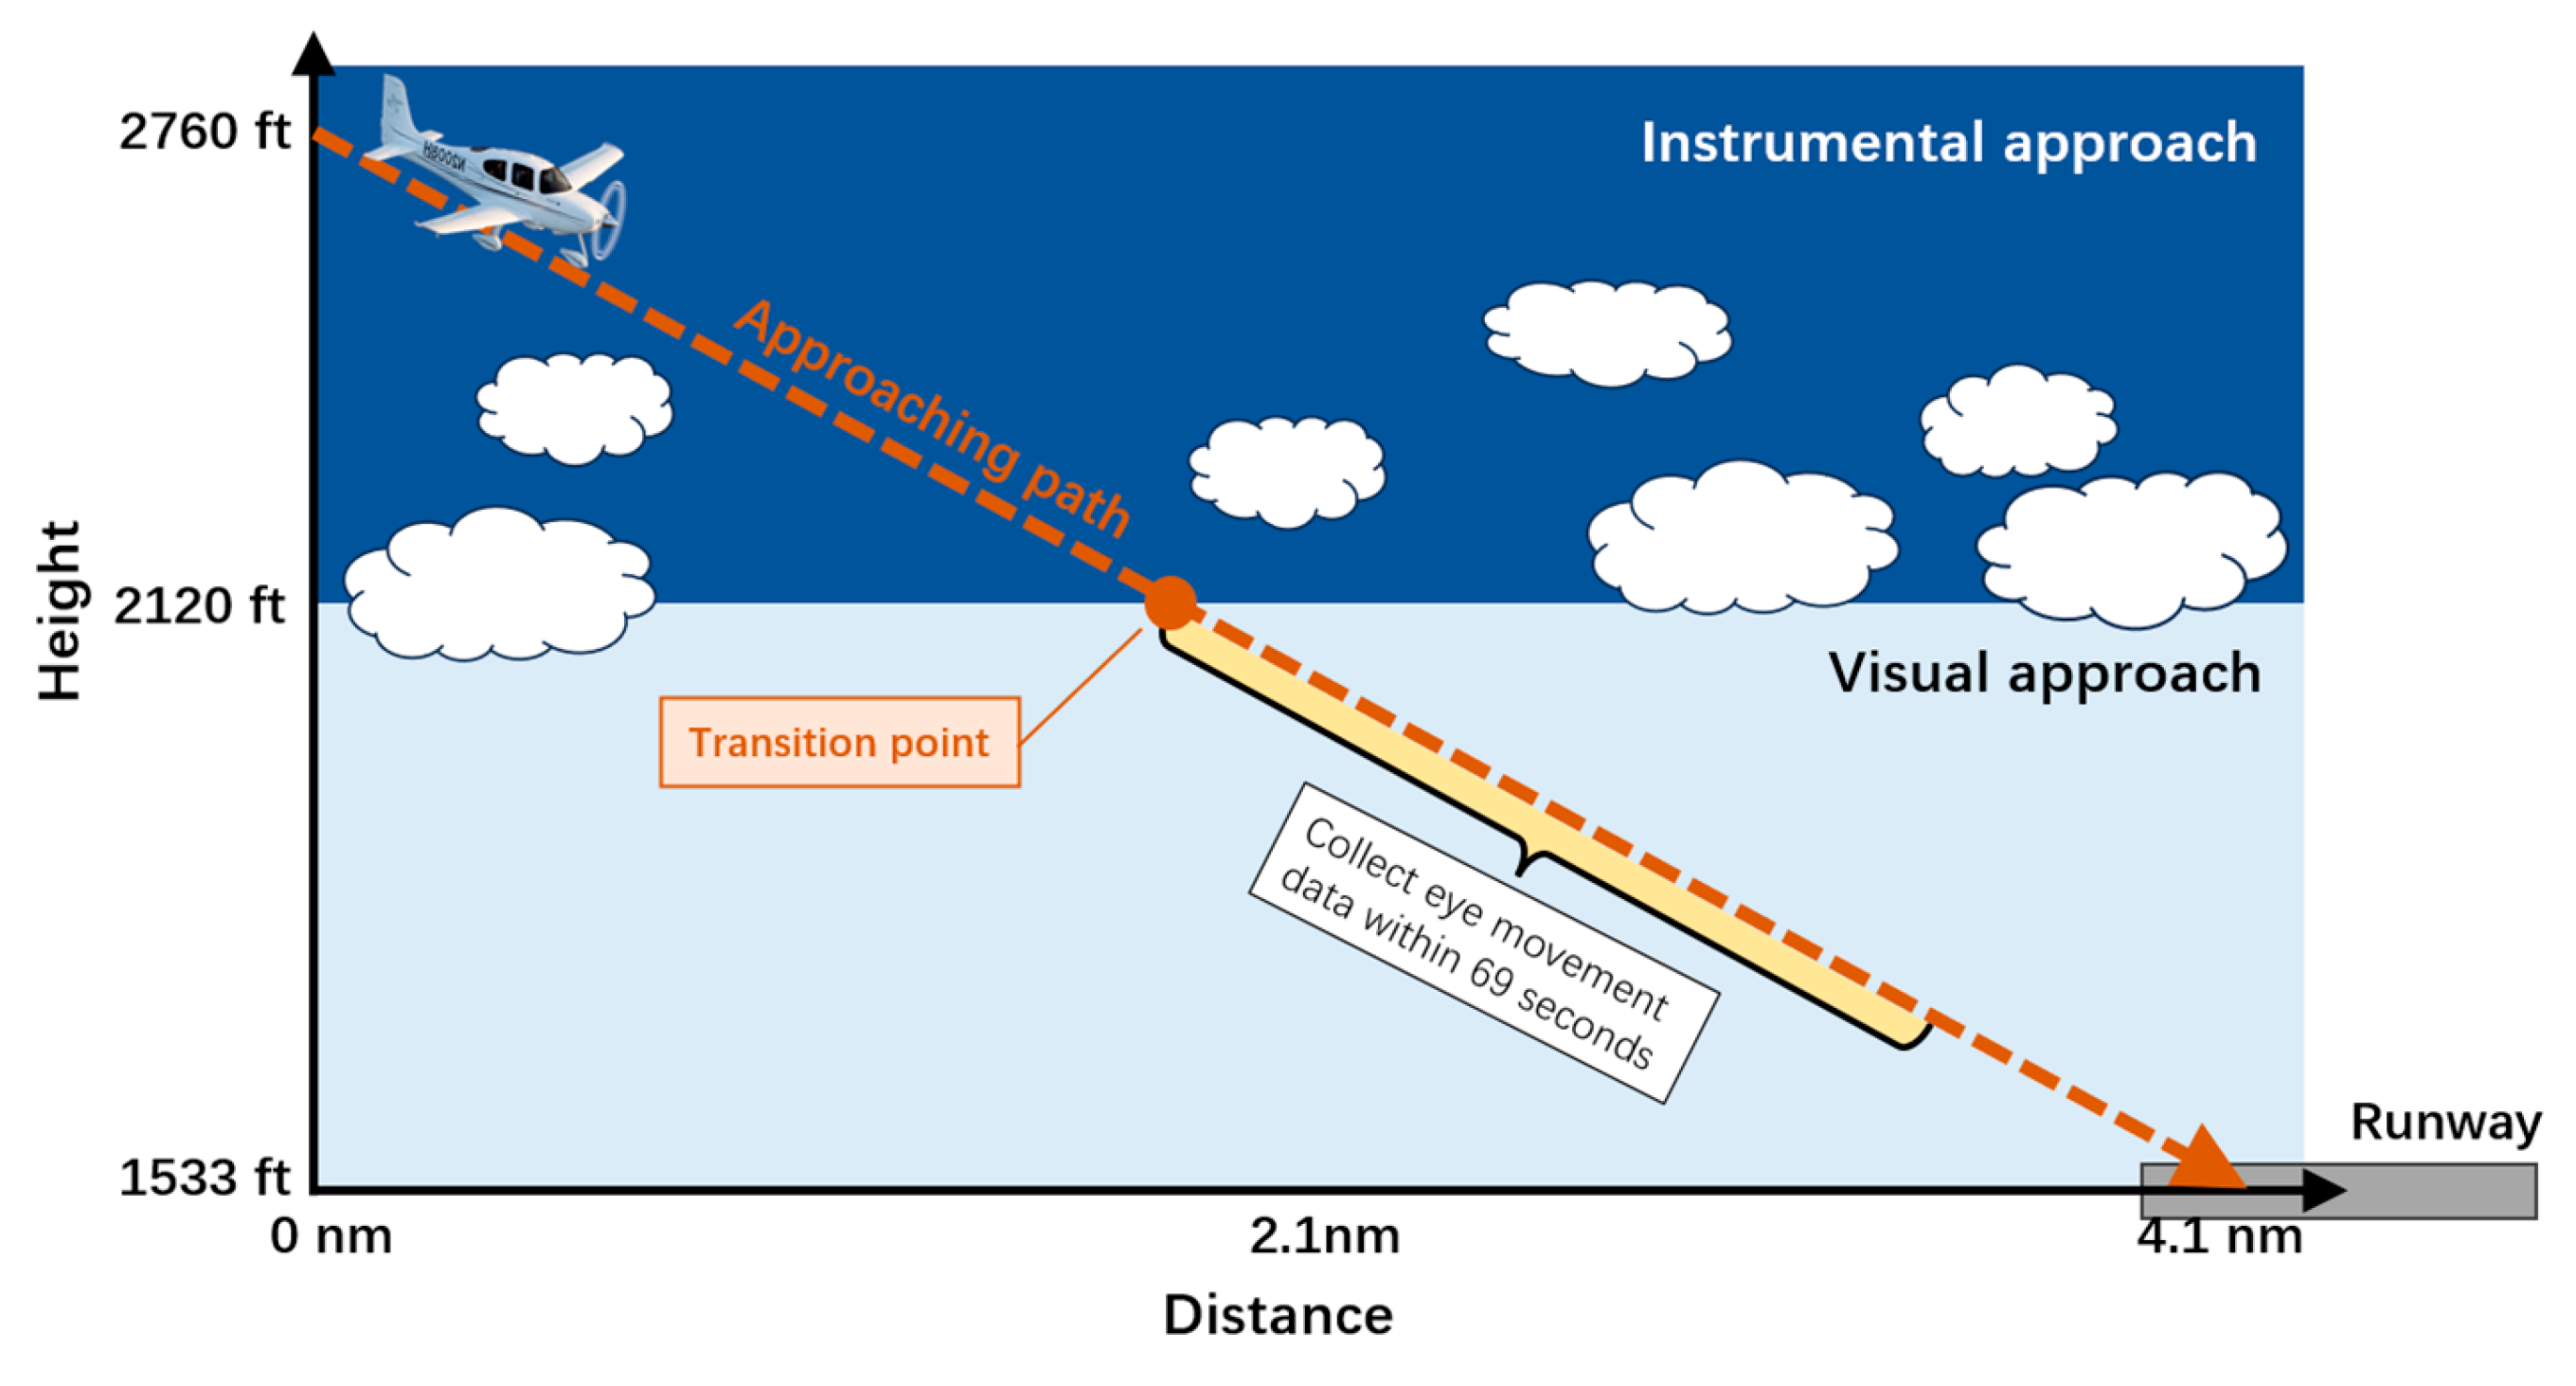
The airport selected for the simulation experiments was Guanghan Airport (GHN). The experimental setup for the simulated approach and landing is illustrated in Figure 2. In the experiments, the pilot began at a position 3 miles from the runway entrance, at an altitude of 2760 feet. The aircraft headed directly toward the runway. The approach began at an airspeed of 125 knots. The experiment simulated a fog condition (visibility of 0.5 miles) above 2120 feet, requiring the pilot to rely on instruments for navigation during the descent from 2760 feet to 2120 feet. Once the aircraft descended below 2120 feet, the pilot could visually identify the runway and terrain, marking the transition from instrument approach to visual approach. This altitude (2120 feet) served as the critical point at which the approach switched from instrument flight rules (IFRs) to visual flight rules (VFRs).

Figure 2.
Flight profile of the instrument approaching GHN airport.
The eye movement data recorded by the Tobii Glasses 3 were used to reveal the pilots’ attention allocations after descending from the transition point (2120 feet) within 69 s before touchdown on the runway (1533 feet). The rationale for selecting the 69 s time frame can be found in Section 2.4.2. The collected eye movement data were then correlated with landing position deviation. The experiments included three wind scenarios: no-wind, left crosswind, and tailwind. In the no-wind condition, the aircraft’s approach was unaffected by environmental wind. In the left crosswind condition, the aircraft encountered a consistent crosswind blowing from the left side with an average speed of 10 knots. In the tailwind condition, the aircraft was subjected to a continuous wind blowing from behind with an average speed of 5 knots.
Before starting the experiments, the researchers conducted a system check on both the flight simulator and eye-tracking equipment to ensure proper functionality. Each participant then entered the SR20 simulator cockpit and wore the Tobii Glasses 3. The participants performed three approach tasks under each of the three wind conditions, resulting in a total of nine approach tasks per participant. All participants in this study acted as single-pilot crews, which is common in general aviation and training tasks. The single pilot was required to manually operate the aircraft, executing a standard approach by maintaining a stable aircraft attitude and controlling the descent rate and speed within the prescribed approach parameters. The participants also needed to appropriately allocate their attention to flight instruments to complete the approach and landing. Each task lasted approximately 3 min. Throughout the experiments, no participant reported fatigue or discomfort. All participants stated that they did their best to complete the tasks.
2.4. Data Collection in the Experimental Procedure
2.4.1. Flight Parameters and Landing Deviation
The SR20 simulator used in this study is capable of collecting both flight and environmental data during a flight, with a sampling frequency of 1 Hz. The main flight parameters collected included altitude, speed, heading, flight path, and latitude/longitude coordinates of the aircraft throughout the flight. The altitude and trajectory data were specifically extracted during the approach and landing phases. The altitude data were used to determine the transition point when the airplane moved from the instrument approach to the visual approach. The trajectory data, including latitude and longitude coordinates, were used to pinpoint the landing position for each trial and compute the position deviation from the standard landing position (30°57′09″ N, 104°19′23″ E). All position deviation values are represented as positive numbers to quantify the landing accuracy.
2.4.2. Eye Movement Features
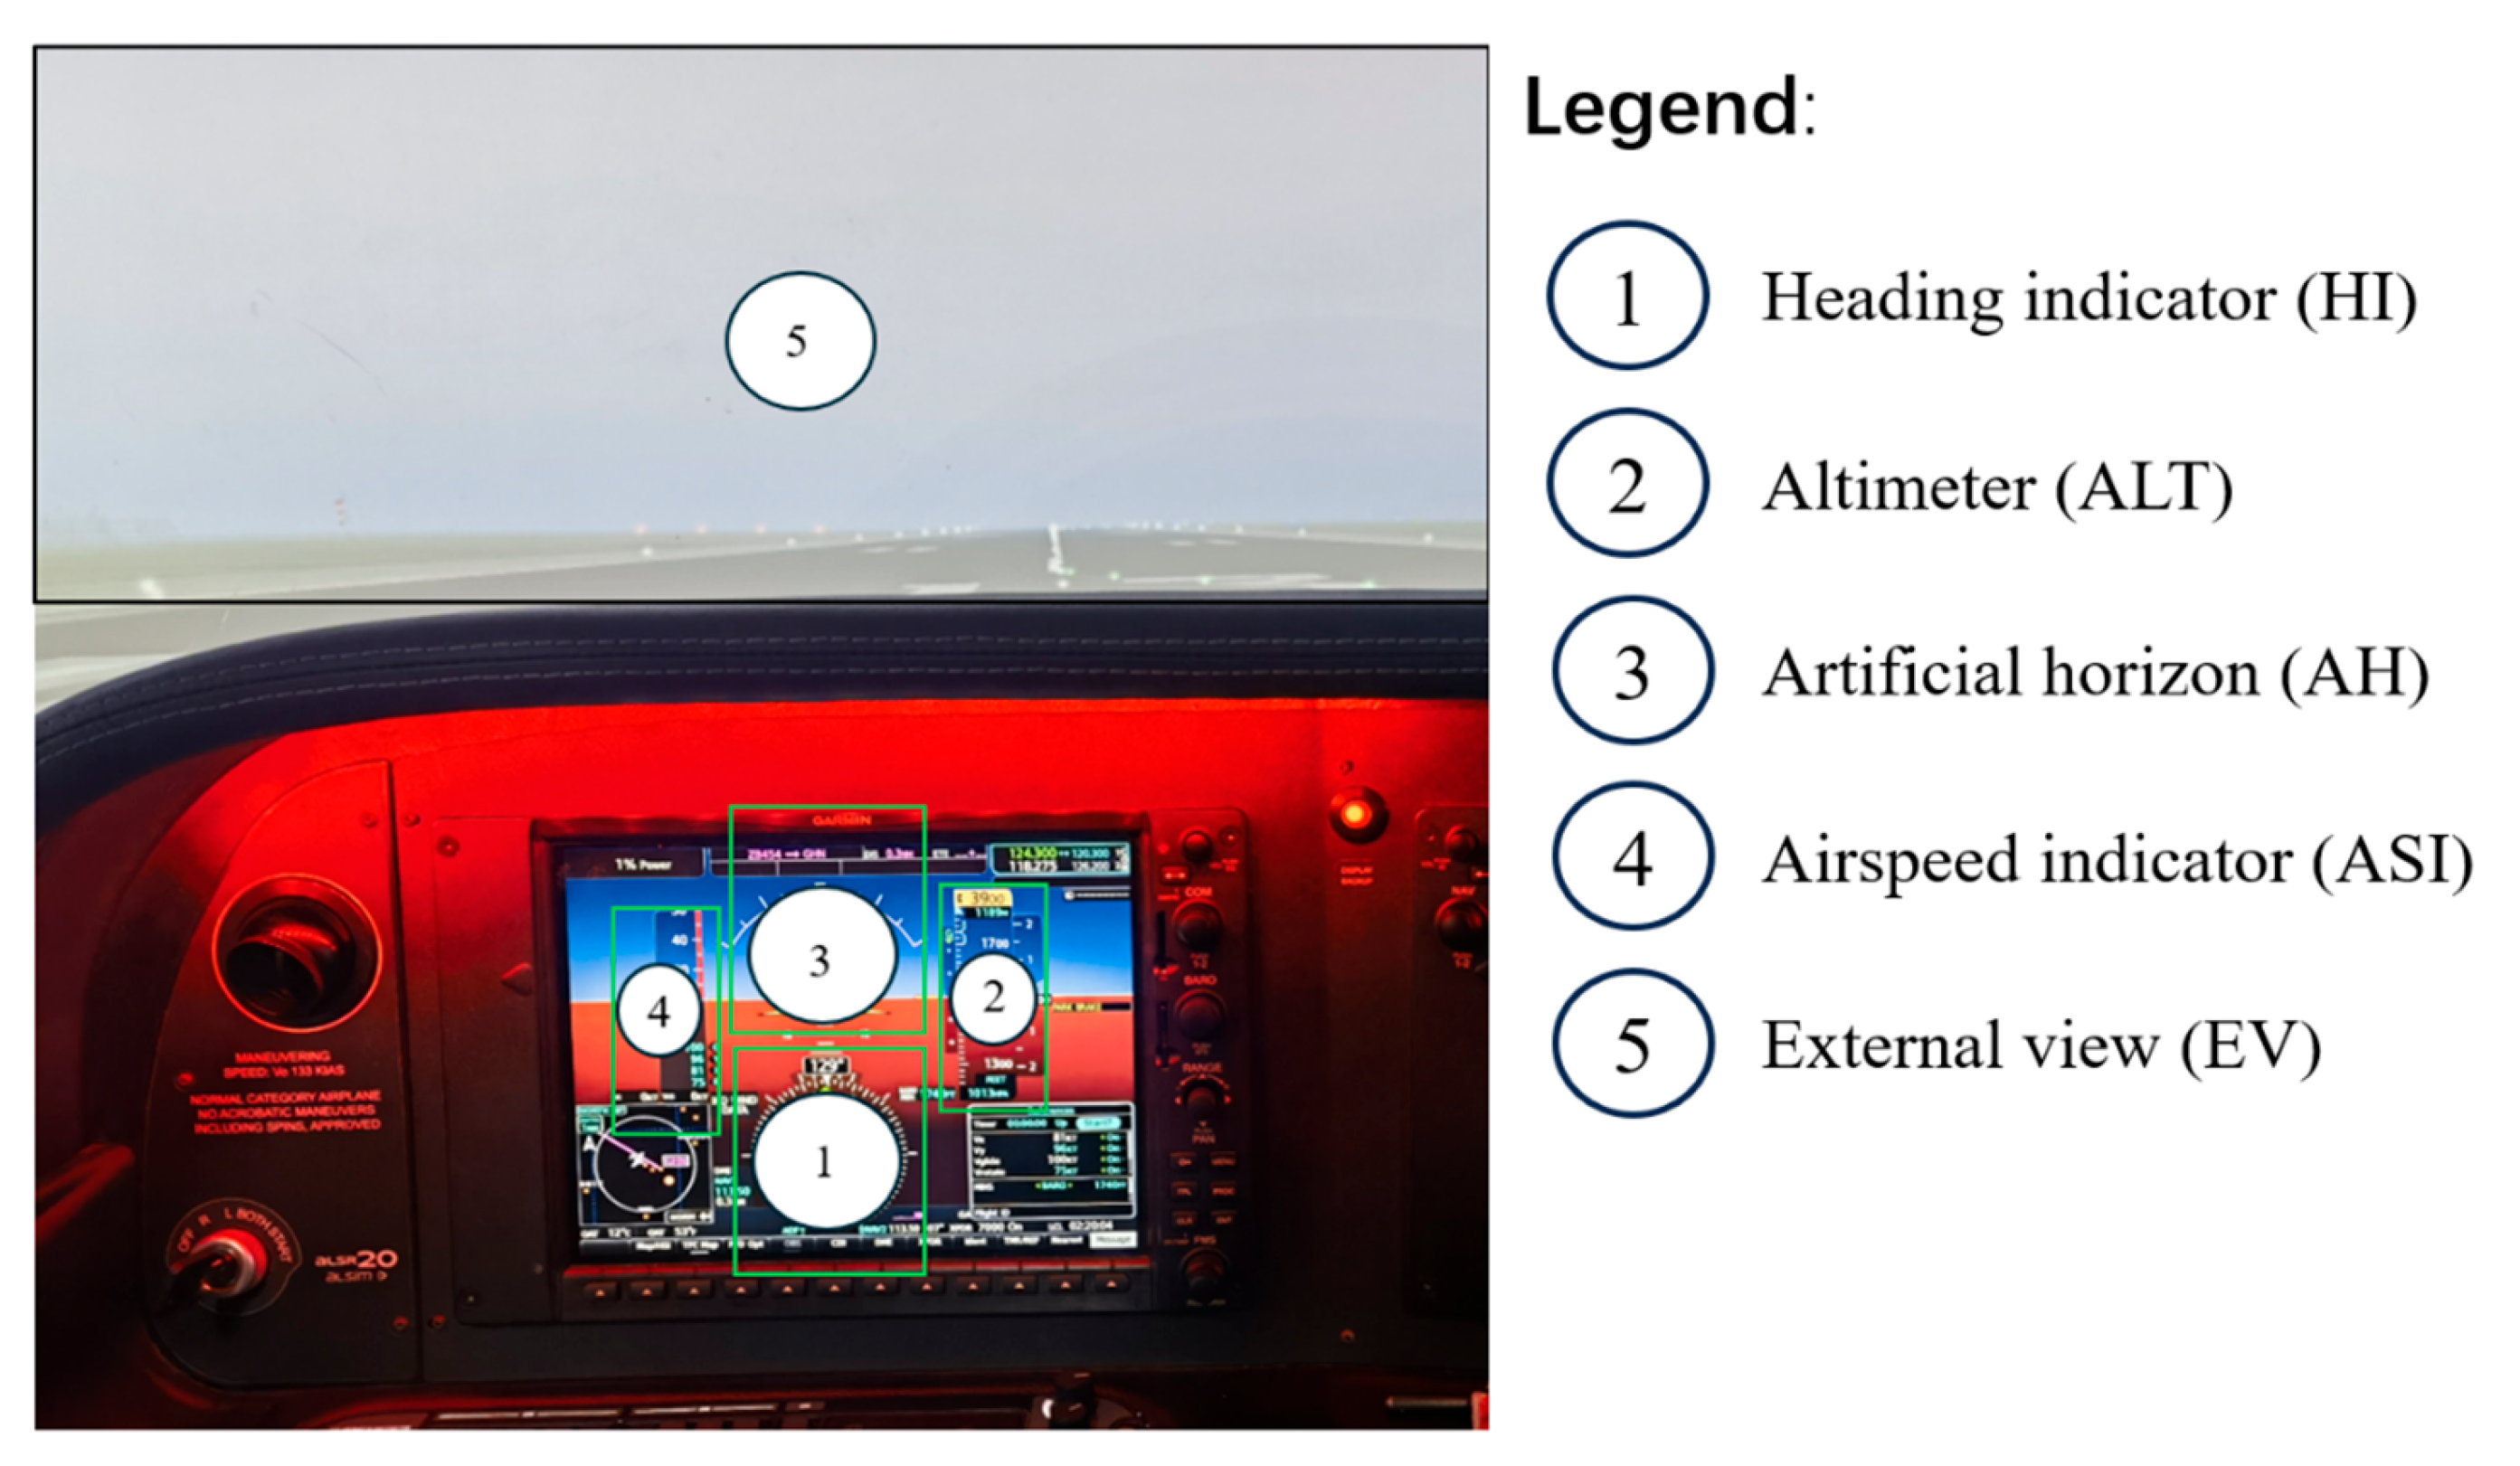
The pilots’ eye movement data, collected using Tobii Glasses 3, were recorded after each pilot began the visual approach, i.e., when the airplane descended below 2120 feet. To define the data collection interval, the eye movement data were captured within 69 s after descending below 2120 feet (Figure 2). The overlap rate of the time windows was 60%. Thus, a time window had a 60% interval covered by the next time window, which is 15 s × 60% = 9 s. The interval of a time window that was not included by the next time window was, therefore, 15 s − 9 s = 6 s. Hence, the 10 time windows covered a total time interval of 9 s + 10 s × 6 = 69 s. The visual approaches in our experiments commonly lasted for 72–80 s for different pilots, so the 69 s duration before touchdown was enough to analyze the pilots’ attention allocations. The visual scene viewed by the pilots during the approach phase, as shown in Figure 3, included the main flight panel with the Garmin 1000 electronic display, the cockpit front panel, and the external environment.

Figure 3.
Division areas of interest (AOIs).
Given the pilots’ attention demands during the approach procedure, this study categorized the pilots’ areas of interest (AOIs) into five distinct regions: ① heading indicator (HI), ② altimeter (ALT), ③ artificial horizon (AH), ④ airspeed indicator (ASI), and ⑤ external view (EV). As the aircraft approached, the Tobii Glasses 3 device continuously recorded the pilots’ eye movements as they transitioned among these five areas, using Tobii software (Tobii Pro Lab, Full Edition) for tracking. The extracted eye movement features can be categorized into six types: total fixation duration (Tfd), Fixation Count (Fc), time to first fixation duration (Tff), First Fixation Duration (Ffd), Total Visit Duration (Tvd), Average Visit Duration (Avd), and visit count (Vci). The interpretations of these features can be found in Table 1.

Table 1.
Description of eye movement features.
Therefore, the combination of the AOI and eye movement feature types generates specific eye movement features. For example, a feature labeled “HI-Tfd” refers to the pilot’s total fixation duration on the heading indicator during the analyzed visual approach. Additionally, some features include statistical measures of the eye movement feature types, such as average, median, and sum. Features like “Average-Tfd”, “Median-Tff”, and “Sum-Vci” correspond to the average total fixation duration, median time to first fixation duration, and the sum of visit count across all AOIs, respectively. In total, this study collected 55 distinct eye movement features.
3. Analysis Method
3.1. Workflow
This study performed separate analyses and modeling for the three experimental conditions: no-wind, crosswind, and tailwind. Under each condition, there were 90 data groups, with each data group consisting of eye movement features captured from 10 time windows in a flight task. The dataset was split into a 20% test set (18 data groups, 180 time windows) and an 80% training set (72 data groups, 720 time windows) under each condition. These data groups were used for model training and prediction to preserve the temporal continuity of the samples.
This study first used ANOVA to assess the differences in pilots’ eye movement features across the different environmental conditions, in order to identify variations in attention allocation. Next, a random forest algorithm was employed to rank the eye movement features based on their contribution to the outcome. The ranked features were then sequentially added to the model training data.
To predict landing position deviations, we established four deep learning (DL) models, including GRU, LSTM, CNN-GRU, and CNN-LSTM, using the ranked eye movement features. Additionally, two traditional machine learning models—Support Vector Regressor (SVR) and random forest (RF)—were used as baseline models for comparison. The two machine learning models utilized the eye movement features from the last time window, so these models had the same sample size as the deep learning models during the training process.
For model training, this study first ranked the eye movement features by their importance and then sequentially added the ranked features to the training data. With each added feature, the model was tuned using 5-fold Bayesian optimization to ensure optimal performance on the validation set. The tuned model was then tested on the test data. Model metrics were computed to evaluate the prediction performance of each model in terms of landing position deviation. The overall technical workflow is illustrated in Figure 4.
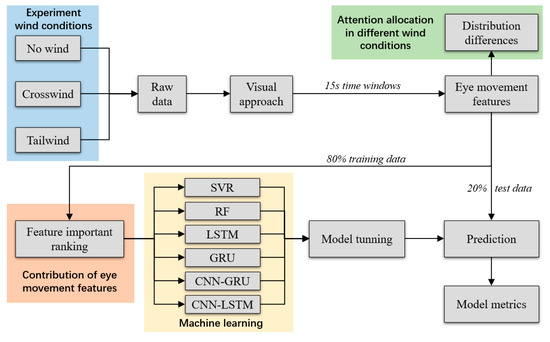
Figure 4.
Methodology and workflow.
3.2. Analysis of the Importance of Eye Movement Features
This study first ranked the eye movement features using the random forest algorithm [22,23]. In a random forest, the importance of a variable is determined by the frequency with which it is used across decision tree nodes, weighted by the number of samples that pass through those nodes [24,25,26]. The higher the sensitivity analysis value, the greater the importance of the variable in the prediction model. This study primarily focused on ranking the importance of continuous variables [26]. Hence, we selected mean squared error (MSE) as the evaluation basis. To accomplish this, the algorithm calculates the change in MSE before and after the regression tree in the random forest is split into two child nodes when feature is included:
where is the MSE of the node before splitting, and are the MSEs of the left child node and the right child node after splitting, and , , and are the number of samples before splitting, the number of samples in the left child node, and the number of samples in the right child node, respectively.
For feature , its importance in the random forest is equal to the weighted sum of the MSE reductions in the nodes of all trees, given by:
where T is the total number of trees in the random forest and is the importance of feature in the k-th tree.
3.3. Landing Position Deviation Prediction Models
Since the data collected in the experiments are temporally sequential, events can be predicted by models that capture the temporal relationships between features across time windows. In line with past studies, this study first employed two classic recurrent neural network (RNN) algorithms, namely, Long Short-Term Memory (LSTM) and Gated Recurrent Unit (GRU), to establish the prediction model.
It is also important to note that there are multiple eye movement features of pilots during the approach phase. In addition to their temporal correlations, these features may also interrelate with each other [27]. To effectively capture both these correlations and the temporal dynamics, this study extended the LSTM and GRU models by adding a Convolutional Neural Network (CNN) architecture, forming the CNN-LSTM and CNN-GRU models, respectively, for predicting landing position deviations. Brief descriptions of the four deep learning models are provided below.
3.3.1. LSTM Model
LSTM is a category of recurrent neural networks (RNNs) [28], which is particularly effective at processing time series data. In our study, LSTM was employed to capture both the recent and current temporal effects of pilots’ eye movement features on landing position deviation. In this study, we used an architecture including three LSTM layers with a ReLU activation function and dropout to build the LSTM model.
3.3.2. CNN-LSTM Model
As shown in Figure 5, the proposed CNN-LSTM model consists of two main components: the CNN part and the LSTM part. This is a classic CNN-LSTM architecture. The CNN part is used to extract high-dimensional information from the eye movement features within a given time window, while the extracted information is then processed by the subsequent LSTM to capture the temporal correlations of these features across different time windows. The CNN part includes a feature extraction block made up of two 1D convolutional layers with ReLU activation and two Batch Normalization (BN) layers [29]. The subsequent LSTM block consists of three LSTM layers. This CNN-LSTM architecture is derived from the study by Elmadjian et al. [30], who also analyzed eye movement data. To prevent overfitting, each LSTM layer incorporates Dropout regularization. The model parameters indicated as “***” in Figure 5 signify that the parameters are subject to tuning using the Bayesian optimization and thus are not fixed.
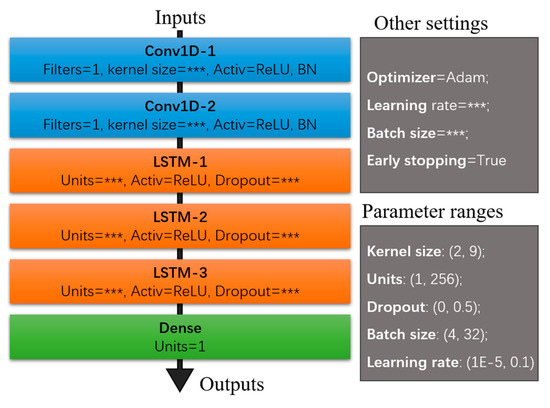
Figure 5.
The structure of the CNN-LSTM model.
3.3.3. GRU and CNN-GRU Model
GRU was employed to predict the landing position deviation. GRU is another type of RNN model and can be considered a simplified version of the LSTM model. GRU features two gates: the update gate and the reset gate. This structure allows GRU to retain memory information from previous sequences while updating or resetting this information through its gating mechanism. GRU mitigates the issues of gradient explosion, making it particularly suitable for capturing short-term time series correlations.
Similar to the CNN-LSTM model, we also developed a CNN-GRU model to simultaneously capture feature correlations and temporal dependencies. The basic architecture of the CNN-GRU model is fundamentally the same as that of the CNN-LSTM model illustrated in Figure 5. The key difference is that the three LSTM layers are replaced with three GRU layers. Both the number of neurons (units) and the Dropout rate for each GRU layer were treated as optimizable parameters.
3.3.4. Model Prediction Performance Indicators
In order to measure the performance of prediction models, this study used two model metrics to measure the prediction accuracy of each model, namely, mean absolute error (MAE) and root mean square error (RMSE). Moreover, as different ranked features were sequentially added in the feature set, the performance of the model may fluctuate, leading to the possibility that the model was either excellent or poor after being tuned. Hence, this study additionally proposed two global metrics, i.e., global MAE and global RMSE. These two metrics actually are the average of the MAE and RMSE of models trained across the whole feature set, which were used to provide the overall performance and stability of the model being trained with various feature sets. For the same model, the smaller the four metrics, the better the model’s performance in prediction. The calculations of the four metrics are as follows:
where i represents the number of samples, m represents the number of test samples, j is the number of feature sets, and represents the landing position deviation value of the ith sample, and and represents the true value of the ith sample.
4. Results and Discussion
4.1. Differences in Eye Movement Features Across Windy Conditions
A primary objective of this study is to identify differences in pilots’ attention allocation during the approach phase across wind conditions. Table 2 presents the mean values of the eye movement features of the pilots during visual approaches under the no-wind, crosswind, and tailwind scenarios and the corresponding results of the ANOVA analysis. According to the analysis, there is no significant difference in landing position deviations among the three conditions (p = 0.457). Regarding the eye movement features, 32 and 10 features exhibited significant differences in distribution across the three conditions in the 95% and 99% confidence intervals, respectively. This indicates that out of the 55 eye movement features, 58.2% of the features show significant differences across the wind scenarios, demonstrating that pilots’ attention allocations are significantly affected by environmental winds when approaching under low-visibility conditions.
Table 2.
Descriptive statistics of eye movement features under different wind conditions.
Among the eye movement features with significant distribution differences, pilots tend to have notably reduced attention to the attitude indicator (AI) and altimeter (ALT) under the no-wind conditions. Conversely, under crosswind and tailwind conditions, pilots are likely to have increasing attention toward the attitude indicator (AI). This trend suggests that when facing crosswinds and tailwinds, pilots focus more on maintaining the stability of the aircraft’s altitude during the visual approach.
In terms of attention allocation to the heading indicator, pilots have the lowest attention under tailwind conditions and the highest attention under crosswind conditions. The heading indicator is crucial for ensuring that the aircraft is aligned with the runway for a successful landing. Crosswinds can significantly disrupt the aircraft’s heading, implying that pilots need to focus more on the heading indicator. In contrast, tailwind conditions primarily affect the aircraft’s forward lift and do not substantially impact directions, which leads to reduced attention to the heading indicator.
Regarding the airspeed indicator, pilots tend to allocate faster and more attention under tailwind conditions, which have a considerable influence on the aircraft’s lift and altitude. An increase in airspeed serves as an effective means to enhance lift, particularly under conditions associated with lift loss. Additionally, during no-wind conditions, precise airspeed control is needed to maintain a normal descent rate and ensure adequate lift. Thus, under both tailwind and no-wind conditions, pilots generally direct more attention to the airspeed indicator.
Pilots also show significant variations in their visual attention toward the external view across the three wind conditions. Specifically, in no-wind conditions, pilots tend to allocate a larger share of their limited attention resources to visually assessing the ground and runway to evaluate whether the aircraft’s heading and attitude are appropriate. Conversely, when influenced by environmental winds and experiencing unstable aircraft attitude, pilots rely more on their instruments to accurately judge the aircraft’s state during the approach, which leads to a notable decrease in external view.
Interestingly, although the altimeter is a vital instrument in the approaching phase, pilots do not show significant differences in attention allocation across the three wind conditions. This indicates that, despite environmental influences, the primary attention differences lie in the focus on aircraft attitude stability and the control of descent rate through speed adjustments, while attention to the aircraft’s real-time altitude remains relatively consistent.
4.2. Importance of Eye Movement Features Across Windy Conditions
Figure 6 illustrates the importance ranking of pilots’ eye movement features on landing position deviation using the random forest algorithm. Under no-wind conditions, the most important features include “HI-Tfd”, “AH-Tfd”, “EV-Tfd”, “ASI-Tfd”, and “ALT-Tfd”. These features indicate that, after switching to the visual approach, the timing at which pilots acquire critical information, such as flight heading, attitude stability, descent rate, speed, and altitude during the approach phase, is vital for determining an accurate landing. The earlier pilots receive the flight information, the better they can establish a standard and stable approach path.
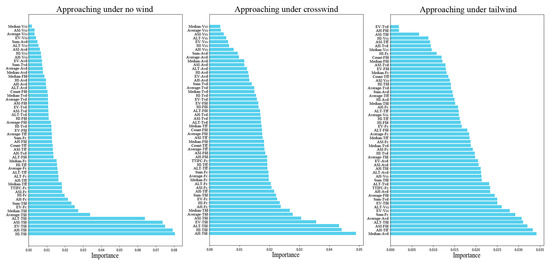
Figure 6.
The importance of eye movement features under different wind conditions.
Compared to no-wind conditions, there are notable differences in pilots’ attention allocation under crosswind conditions. While the eye movement features indicate that pilots’ first notice of critical instrument areas, e.g., “AH-Tfd”, “HI-Tfd”, “ALT-Tfd”, “ASI-Tfd”, and “EV-Tfd”, remain important, the significance of other features also increases. The increasing contribution of various eye movement features to landing deviation demonstrates that pilots need to implement a more complex attention allocation strategy during approaches in crosswind conditions. This is probably because the pilots need to strengthen their dynamic observations of speed, attitude, descent rate, altitude, and external conditions, making timely adjustments to the aircraft’s approach attitude.
Under tailwind conditions, the importance of pilots’ total fixation duration (Tfd) to important AOIs decreases, with only “ALT-Tfd” maintaining a relatively high ranking. Conversely, eye movement features, such as “Median-Avd” and “Average-Avd”, emerge as more significant contributors to landing position deviation. This suggests that tailwind approaches not only impose higher demands on pilots’ attention allocation in terms of aircraft attitude and airspeed but also require a more comprehensive exploitation of various instrument information and external visual information. This conclusion aligns with the significant increase in the importance of nearly all eye movement indicators in tailwind approaches. The underlying reason for this is that tailwind can yield noticeable lift loss and thus cause instability in the aircraft’s approach attitude. Therefore, when approaching under tailwind conditions, pilots must continuously and dynamically monitor various instruments to ensure better control of the aircraft’s descent path, particularly prioritizing updates on critical AOIs, such as instruments of aircraft attitude, airspeed, altitude, and external cues.
The results indicate clear differences in the importance of pilots’ eye movement features across the three wind conditions. For the conditions of no-wind and crosswind, while the importance rankings of eye movement features in both conditions are similar, a few features, e.g., HI-Tfd, AH-Tfd, EV-Tfd, ASI-Tfd, and ALT-Tfd, are more critical during no-wind approaches than the other features. However, the importance of other eye movement features significantly increases under crosswind conditions. In tailwind conditions, the differences in the importance of eye movement features continue to decrease, which means that the attention allocations are quite different among pilots. This implies that pilots need a more complicated attention allocation by scanning various instruments and the external environment to keep a stable and precise approach.
4.3. Model Performance and Result Explanations
The final landing position deviation is predicted using pilots’ eye movement features with the SVR, RF, GRU, LSTM, CNN-GRU, and CNN-LSTM models. All the models are constructed and executed in Python (Version 3.10.6) using TensorFlow (Version 2.15.1).
4.3.1. Metrics of Models Trained with Ranked Features
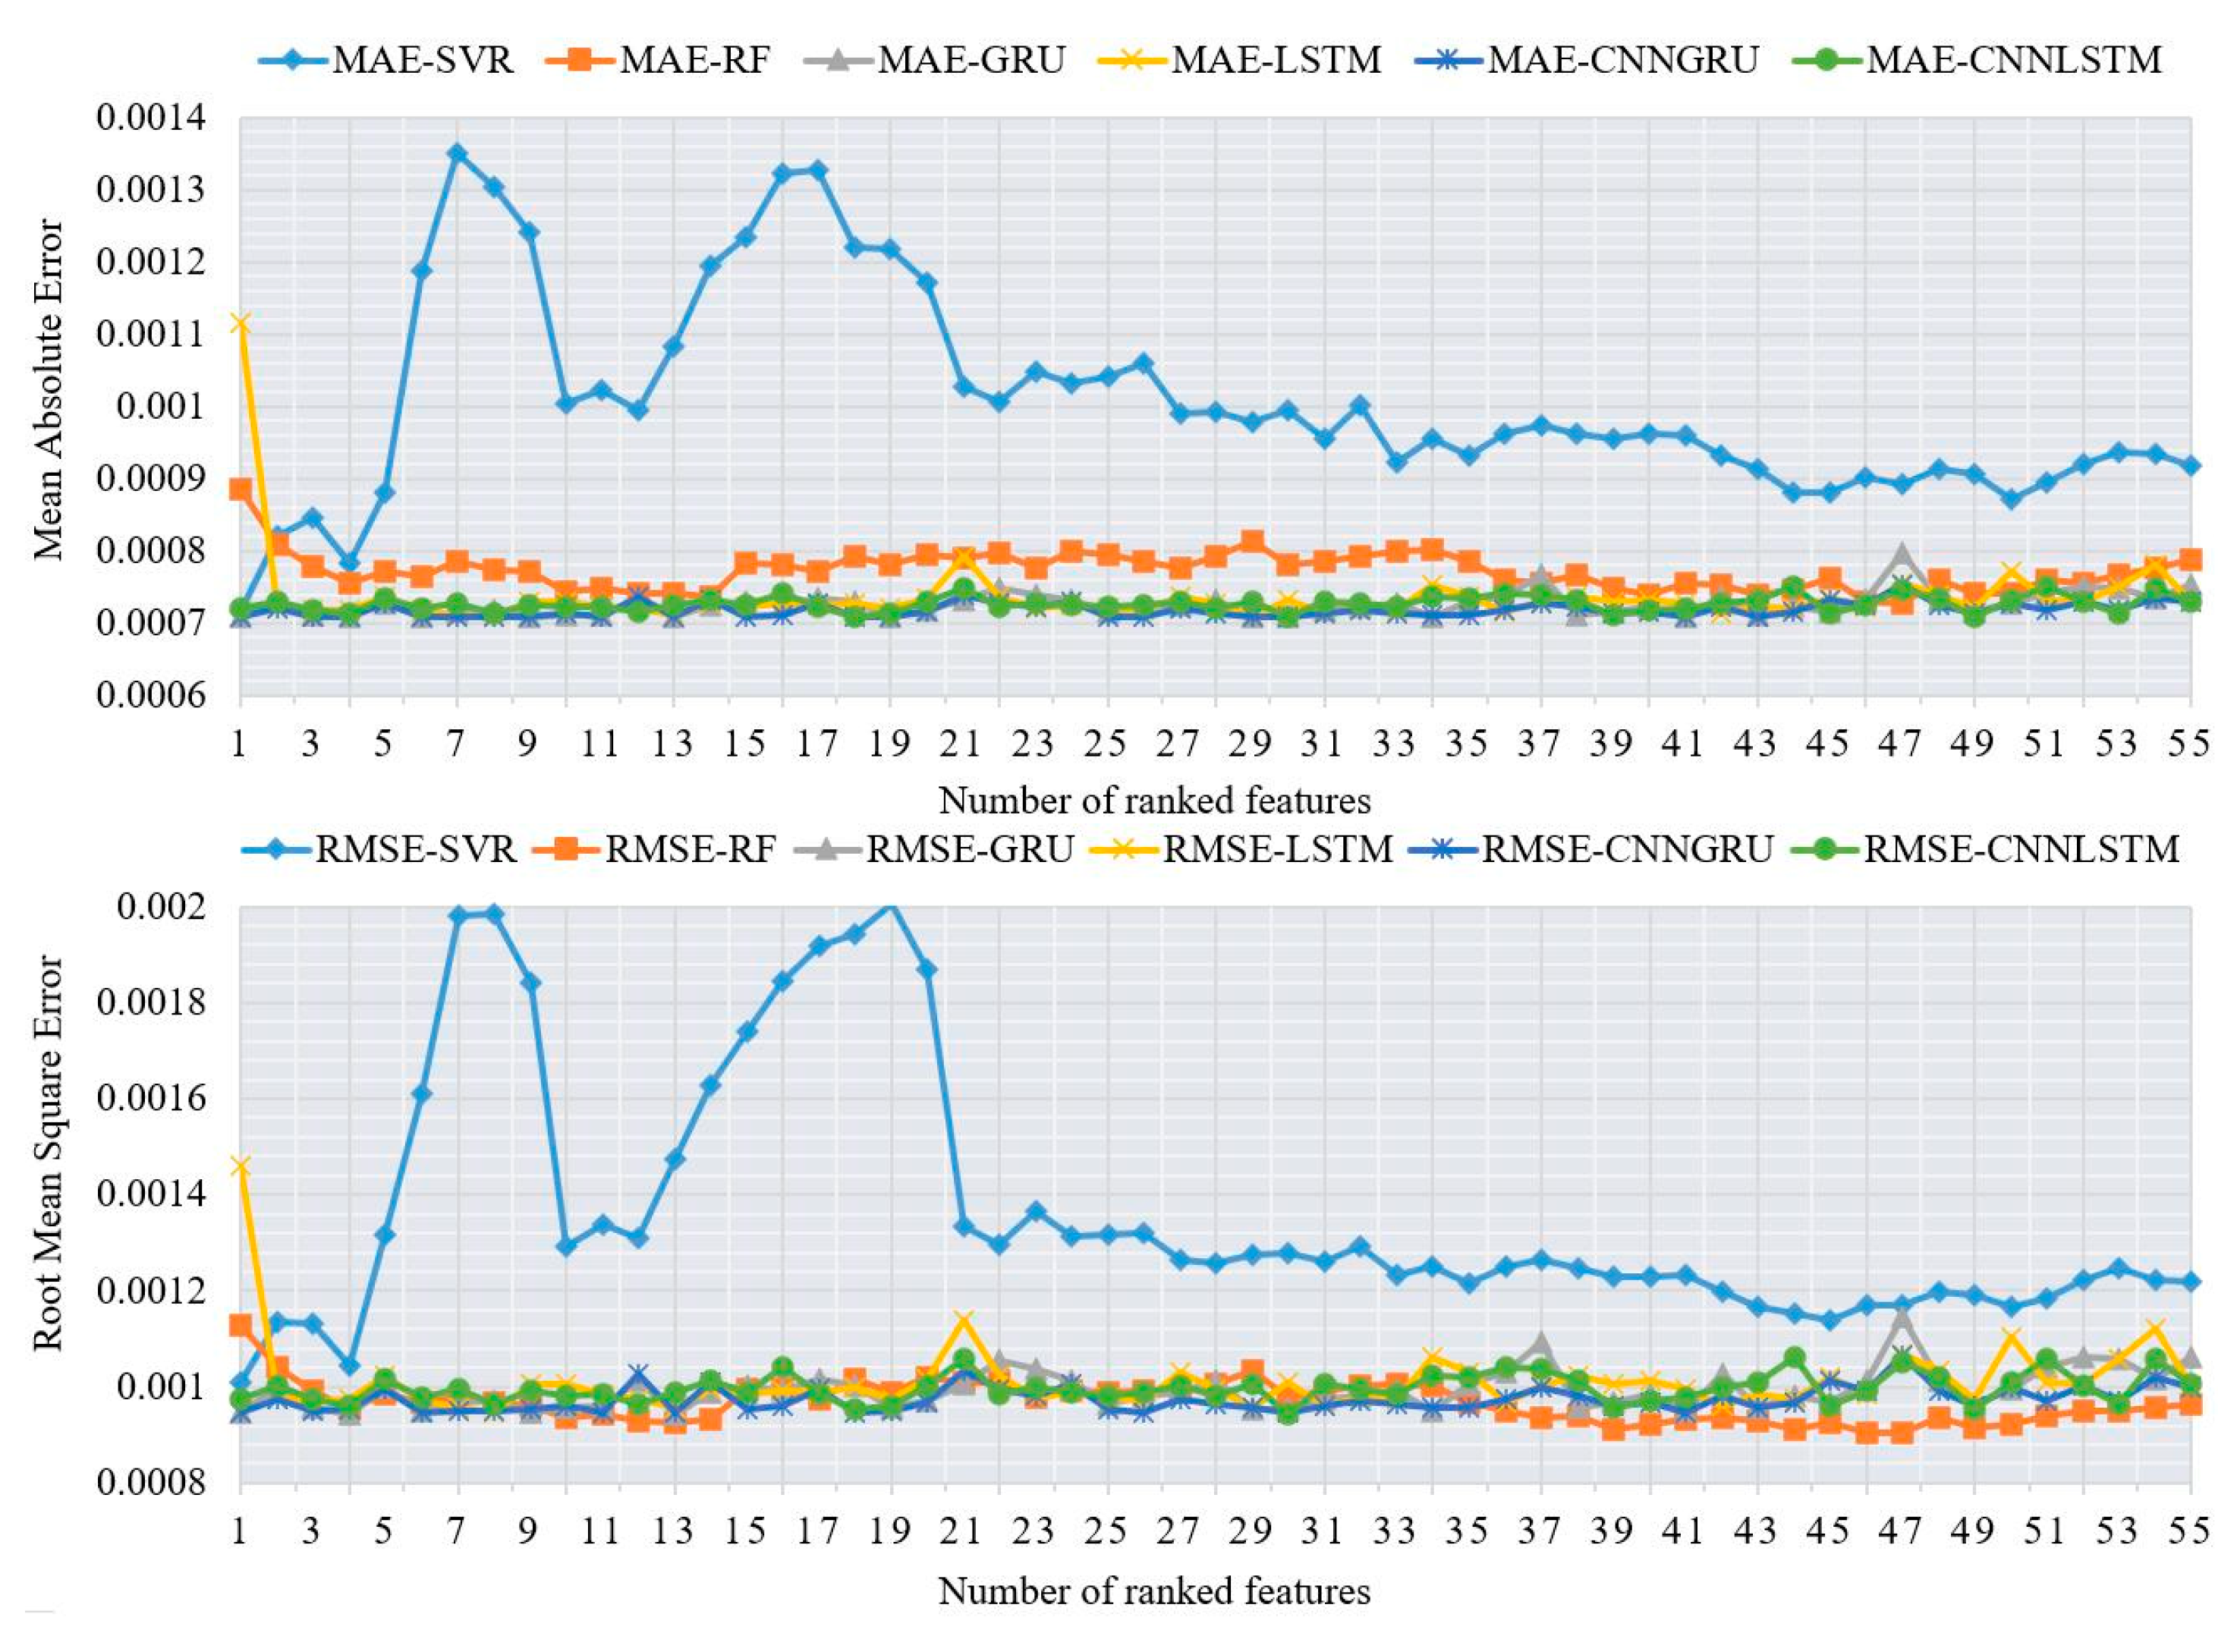
As illustrated in Figure 7, the MAE results under no-wind conditions show that the deep learning models outperform the SVR and RF models, regardless of the number of ranked features included in the training data. However, the RF model exhibits a more stable trend than the deep learning models, as it rarely produces extreme prediction deviations. According to the RMSE results under no-wind conditions, it is found that the RMSE of CNN-LSTM remains stable as more ranked features are added, while the RMSE trends of the GRU-based models, LSTM models, and RF are more unstable. Additionally, CNN-LSTM shows a lower RMSE value than the other models when trained with most feature sets.
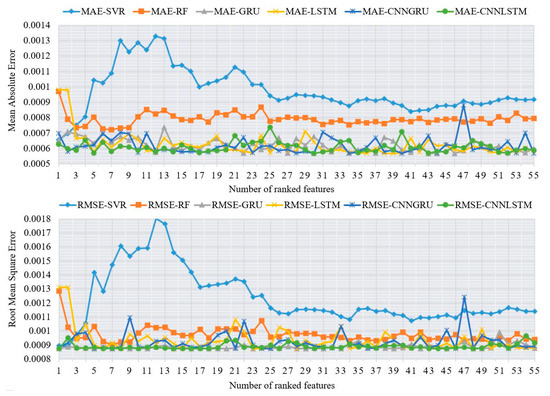
Figure 7.
The RMSE and MAE of the prediction models in approaching under no wind.
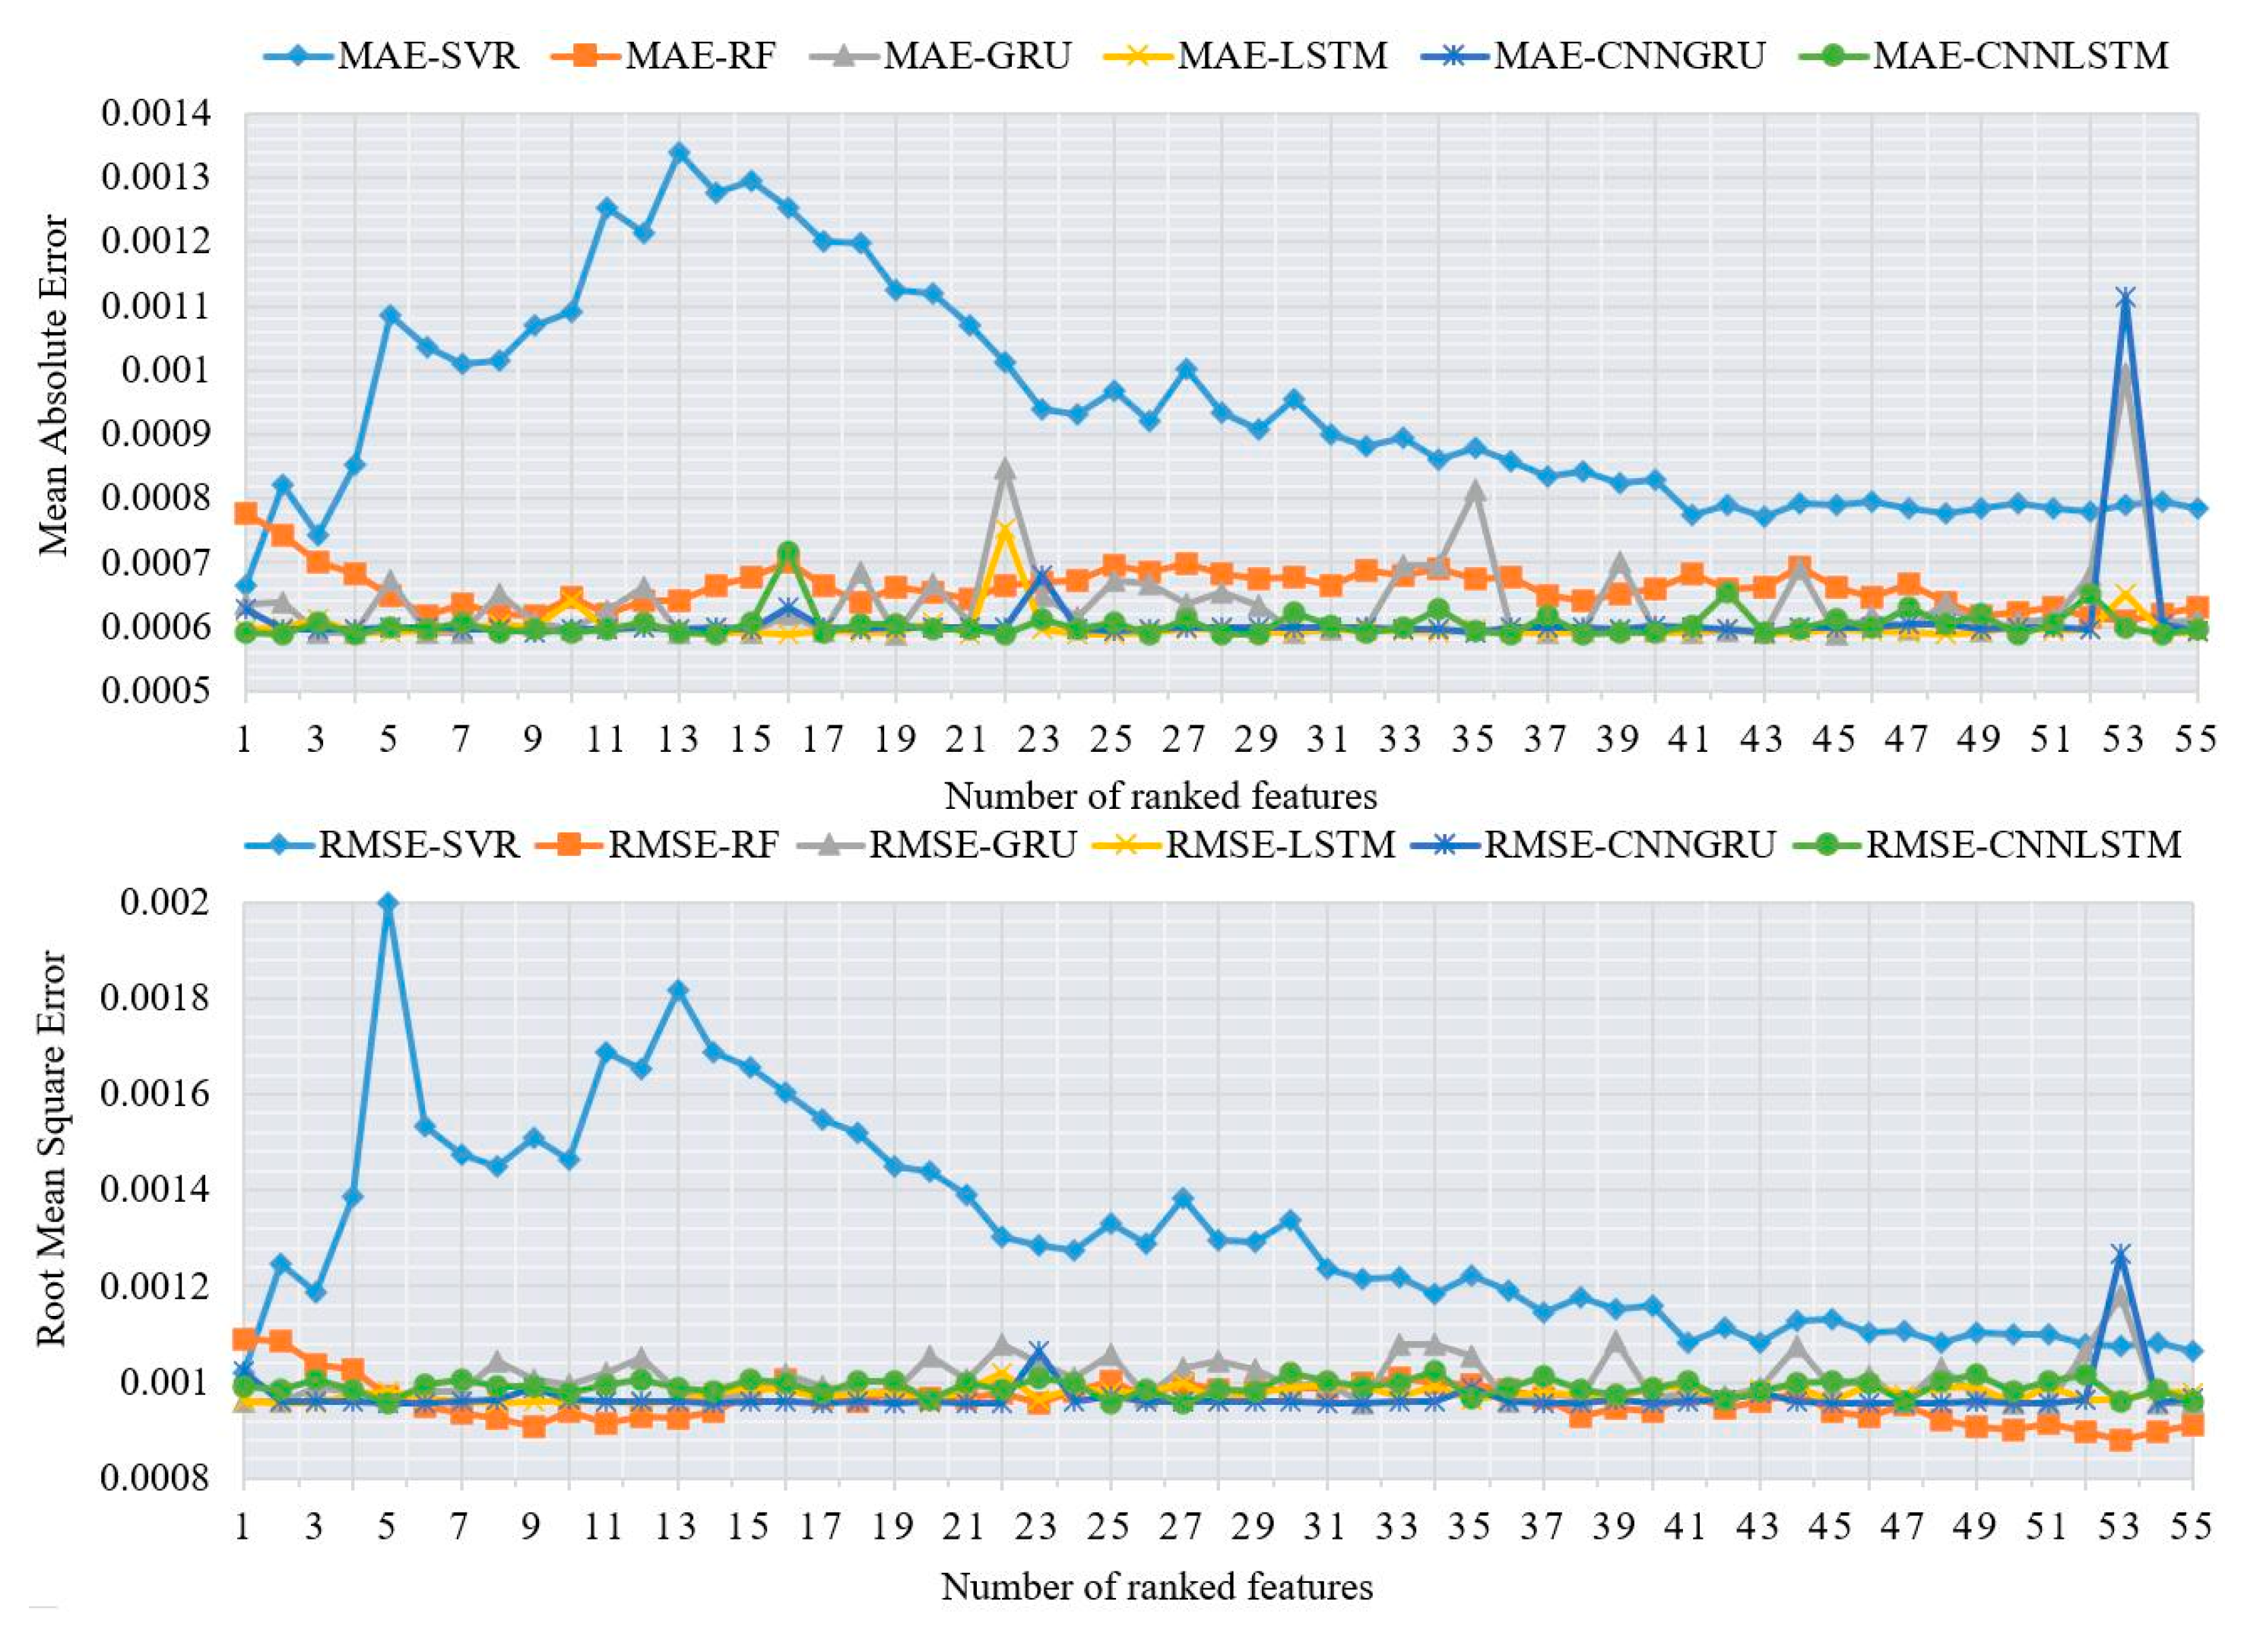
Figure 8 and Figure 9 show the model metrics under crosswind and tailwind conditions. The trends in model metrics differ somewhat from those observed under no-wind conditions. Specifically, as more ranked features are added, CNN-GRU and CNN-LSTM have smaller MAE values and more stable MAE trends than the machine learning models and LSTM or GRU, implying that the incorporation of the CNN structure effectively improves the stability of predictions. However, this is not the case for RMSE. In some feature sets, RF performs better in terms of RMSE than the deep learning models when trained with more features. Among the deep learning models, CNN-GRU exhibits a more stable and lower RMSE across the feature sets, although it shows a large prediction deviation when trained with the feature set containing 53 features.
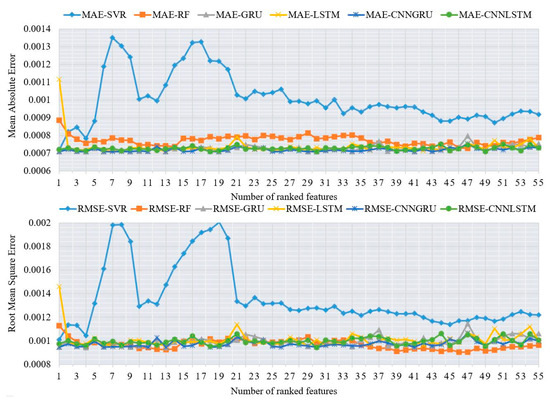
Figure 8.
The RMSE and MAE of the prediction models when approaching under crosswinds.
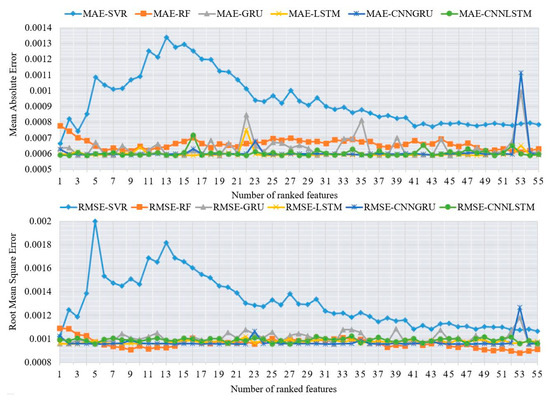
Figure 9.
The RMSE and MAE of the prediction models when approaching under tailwinds.
Comparisons of models using different ranked feature sets show significant differences in the values and trends of the model metrics between no-wind and crosswind/tailwind conditions. The deep learning models generally exhibit more unstable RMSE trends and less favorable RMSE values. This suggests that, for all the eye movement features, it is more challenging to predict landing position deviation under crosswind and tailwind conditions by exploiting temporal correlations (both short-term and long-term).
4.3.2. Best Prediction Models of Various Machine Learning Methods
Table 3, Table 4 and Table 5 present the performance (RMSE and MAE intervals) of the two machine learning models and four deep learning models in predicting landing deviation based on eye movement features under three wind conditions. Additionally, the tables provide the global RMSE and global MAE of the four models when trained with ranked feature sets ranging from the 1st to the 55th, aiming to reduce randomness during model training and prediction. For the models achieving the best performance with a certain feature set, under no-wind conditions (Table 3), both the CNN-GRU and CNN-LSTM models achieve the smallest RMSE (0.00086) and MAE (0.00056). Under crosswind conditions, Table 4 shows that the RF model achieves the lowest RMSE (0.00091), while both CNN-GRU and CNN-LSTM achieve the lowest MAE (0.0007). Under tailwind conditions, the RF model attains the best RMSE (0.00089), whereas the CNN-LSTM model obtains the smallest MAE (0.00058).
Table 3.
Performance and global performance indicators of the no-wind approach model.
Table 4.
Performance and global performance indicators of the crosswind approach model.
Table 5.
Performance and global performance indicators of the tailwind approach model.
The global performance metrics across all models are presented in Table 3, Table 4 and Table 5. Under all three wind conditions, the deep learning models outperform SVR and RF based on the global MAE. Specifically, the best models are CNN-LSTM for no-wind (MAE = 0.0006), CNN-GRU for crosswind (MAE = 0.00071), and CNN-GRU for tailwind (MAE = 0.00059). This implies that deep learning models are more stable when predicting landing position deviations for most samples. However, the deep learning models do not perform as expected in predicting outliers in crosswind and tailwind conditions, as their global RMSE is close to or inferior to that of RF. For example, the RMSE of both RF and CNN-GRU is 0.00097.
The comparisons indicate that GRU-based and LSTM-based deep learning models are significantly superior to machine learning models when predicting landing position deviations under no-wind conditions. Both long-term and short-term temporal correlations between features contribute to more generalized predictions. However, this superiority is diminished when predicting under crosswind and tailwind conditions. This suggests that the temporal correlation between successive time windows weakens because of more complicated attention allocation. Conversely, it highlights the increased importance of attention allocation closer to the landing, such as the importance of eye movement features in the last time window. Moreover, the metrics show that the deep learning models have a larger RMSE than the RF model, possibly because deep learning tends to smooth the temporal trend rather than fitting outliers well.
The comparisons also show that including CNN architectures in pure GRU and LSTM models significantly improves model performance. This demonstrates that capturing the correlations between ranked features is also beneficial for prediction, in addition to capturing temporal correlations. CNN-GRU outperforms CNN-LSTM under crosswind and tailwind conditions, reinforcing the idea that the temporal correlations of eye movement features are weaker in these two windy conditions, as GRU is more effective in capturing short-term correlations.
4.3.3. Interpretation for the Best Models
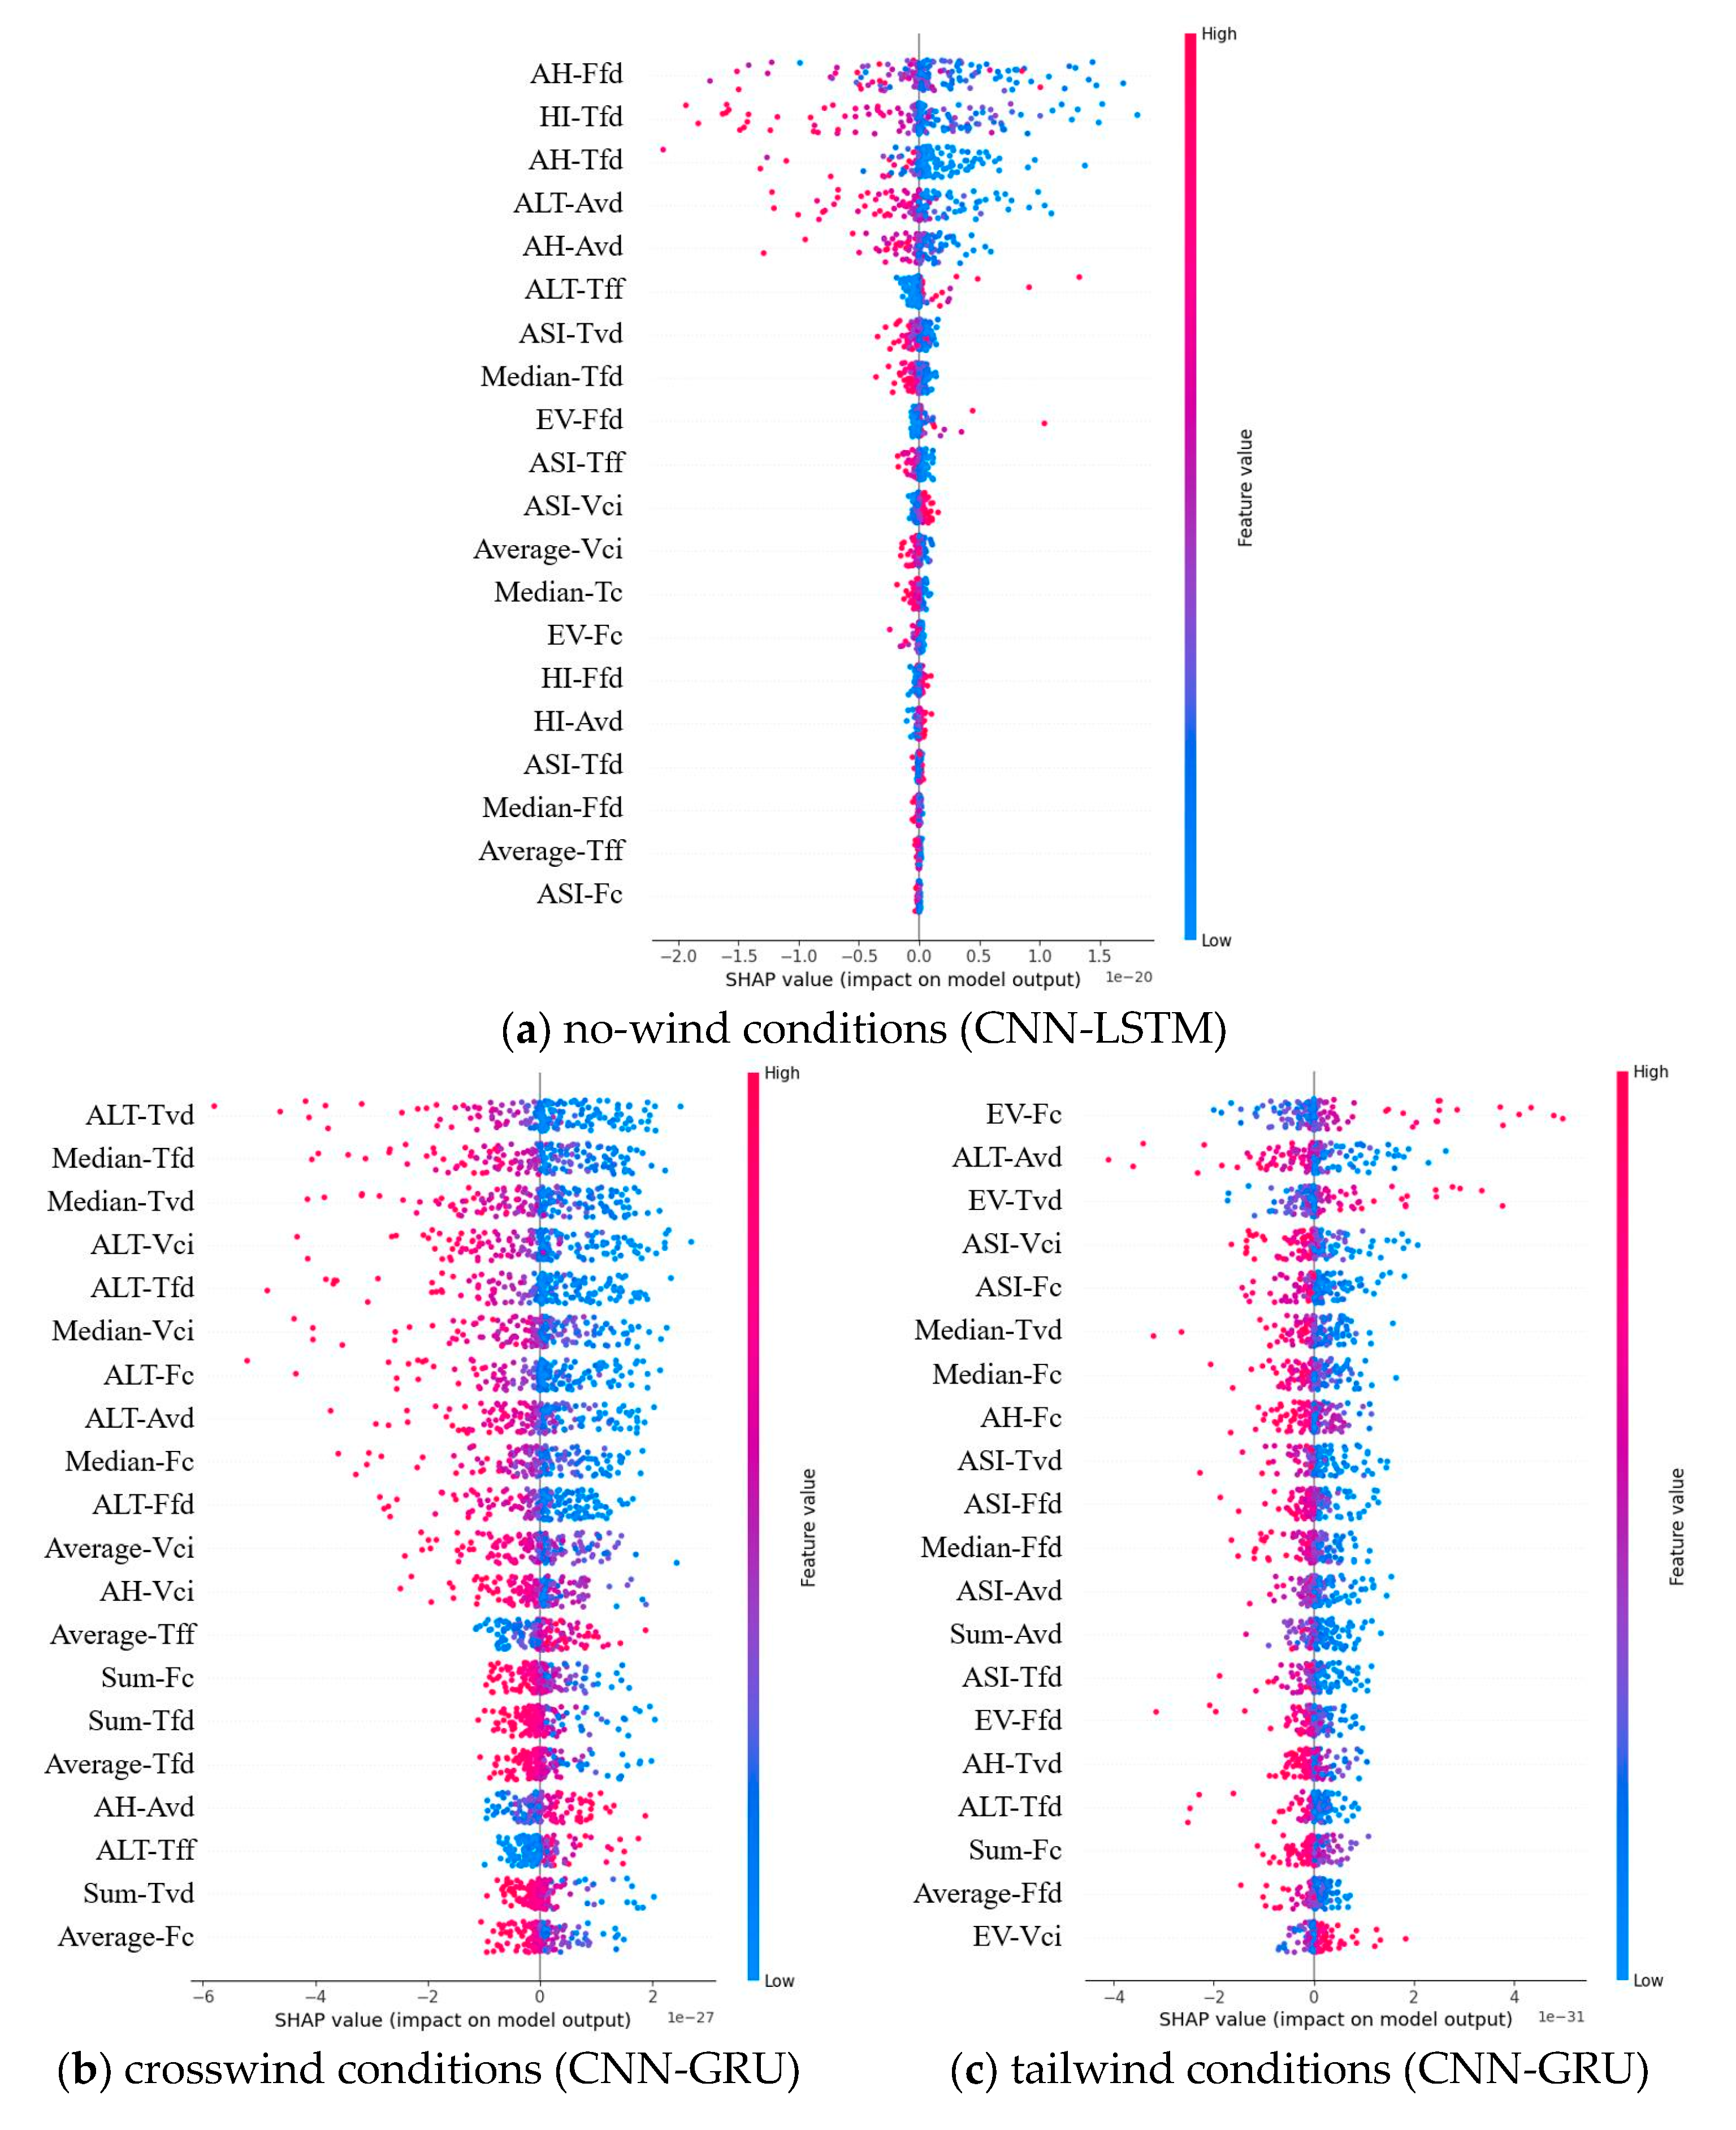
This study also interprets the effects of eye movement features on landing position deviation using the SHAP technique. The SHAP plots are derived from the best prediction model in each landing condition, e.g., CNN-LSTM for no-wind, CNN-GRU for crosswind, and CNN-GRU for tailwind. We present the SHAP values of the top 20 critical features according to their contributions to landing position deviation.
As illustrated in Figure 10, a blue or red point represents a lower or higher value of a feature, respectively. The horizontal axis represents the SHAP value (the feature’s contribution to the model output), with a positive SHAP indicating an increase and a negative SHAP indicating a decrease.

Figure 10.
SHAP of features from the best model under different landing conditions.
Under no-wind landing conditions, it is found that faster fixation on the heading indicator (HI) and longer durations spent fixating on the artificial horizon (AH) and altimeter (ALT) decrease the landing position deviation. This is understandable, as pilots need to maintain a stable attitude of the plane at every height. Meanwhile, checking the heading as soon as possible is also critical for aligning with the runway centerline.
Under crosswind landing conditions, the SHAP values indicate that fixating more on the ALT and spending more time across all instruments can significantly decrease landing position deviation. As mentioned earlier, crosswind landing requires more complicated attention allocation that comprehensively utilizes information from different instruments at every height to establish a stable approach path. Additionally, the results show that pilots should not focus excessively on the artificial horizon, as this instrument may not be effective for ensuring proper heading and stabilizing the glide path under crosswind conditions.
Under tailwind landing conditions, it is found that pilots are not encouraged to continuously fixate on the external environment, even when conducting a visual approach. Conversely, they need to monitor height (ALT instrument) and airspeed (ASI instrument) more during the approach, as tailwinds can significantly reduce lift compared to no-wind conditions.
4.3.4. Recommendations for Pilot Training and Cockpit Design
According to the findings of our study, several recommendations can be considered to improve the pilot training curricula and cockpit interface design.
(1) Pilot training curricula.
According to the findings, training programs may benefit from emphasizing the importance of quick fixation on the HI during no-wind approaches and reinforcing the need for more comprehensive attention allocation across instruments, such as ALT and ASI under, crosswind and tailwind conditions. Additionally, pilots should be trained to reduce reliance on the AH in crosswind scenarios.
(2) Cockpit interface design.
Based on the demands of varied attention for different landing conditions, the cockpit could be enhanced by using a dynamic attention allocation display. To be specific, under crosswind and tailwind conditions, pilots can receive information more quickly from a cockpit interface that highlights key instruments (ALT, ASI, and HI). This improvement may reduce cognitive load by decreasing the time consumption of pilots when reading these instruments, especially during complex approaches.
5. Conclusions
In this paper, several simulated experiments are designed to uncover the eye movement features of pilots as they transition from the instrument approach to the visual approach in low-visibility and windy environments. These experiments also measure the final landing position deviation. Windy environments are categorized as no-wind, crosswind, and tailwind. Pilots’ eye movement features are collected using eye-tracking technology. This study also employs ANOVA to identify differences in pilots’ attention allocation during visual approaches under different wind conditions. Following this, a random forest algorithm is used to rank the eye movement features based on their importance. Subsequently, two machine learning models (SVR and RF) and four deep learning models (GRU, LSTM, CNN-GRU, and CNN-LSTM) are trained using ranked eye movement features, which are sequentially included in the training data to predict landing position deviation.
Based on this analysis, this study reached the following key conclusions:
(1) The approach under no-wind conditions requires relatively low levels of attention allocation. The cumulative fixation duration on the heading indicator, altimeter, airspeed indicator, and external scenery significantly impacts landing position deviation.
(2) The attention allocation required to maintain a stable approach under crosswind and tailwind conditions is more complex compared to no-wind conditions. Notably, under tailwind conditions, there is a higher fixation requirement on the altimeter and airspeed indicator.
(3) All the deep learning models show better performance according to the MAE metric than the machine learning models, indicating that capturing the temporal relations of eye movement features benefits prediction accuracy. However, RF performs well on the RMSE metric, suggesting that it is capable of predicting landing deviations for outliers.
(4) Among the machine and deep learning models, the CNN-LSTM model demonstrates superior prediction performance and stability for landing position deviation in no-wind approaches using different feature sets, while CNN-GRU excels in predicting landing position deviation under crosswind and tailwind conditions.
Some limitations of this study are also discussed. First, since we focus only on predicting landing position deviation using pilots’ eye movement features, the accuracy of the predictions may not be directly comparable to those made using pilots’ manipulations or the aircraft’s trajectory. Additionally, the best models in this study achieve MAE values of 0.0006–0.0007 when predicting landing position deviations, which are relatively weak for use as practical prediction tools. This is because the models are based on data collected from only 30 pilots (90 tasks). While the best models outperform both traditional machine learning and statistical models, we recommend increasing the sample size in future studies to improve model generalization. Furthermore, aircraft types, such as the B787, B737, and A320, which are widely used in commercial aviation, along with corresponding airline pilots, could be considered in future research. Lastly, this study only measures the eye movement features of pilots, ignoring other physiological signals, such as EEG and ECG. In future studies, we recommend including more samples with additional physiological signals and exploring advanced models for predicting landing position deviations.
Author Contributions
Conceptualization, X.L. and Y.Z.; methodology, Z.H. and Y.Z.; software, Z.H. and Y.Z.; writing—original draft preparation, X.L. and Z.H.; writing—review and editing, Y.Z., W.Z., C.F., N.L. and H.X.; formal analysis, Y.Z.; data curation, X.L., Y.Z. and Z.H.; resources, X.L. and H.X.; funding acquisition, X.L. and W.Z.; supervision, Y.Z. and W.Z. All authors have read and agreed to the published version of the manuscript.
Funding
The work was jointly supported by the National Natural Science Foundation of China (U2133209), the Project of Civil Aviation Flight Technology and Safety Research Base (F2024F05C), and the Opening Project of Sichuan Flight Engineering Technology Research Center (GY2024-07B).
Data Availability Statement
The data presented in this study are available on request from the corresponding author.
Conflicts of Interest
The authors of this article declare that they have no conflicts of interest regarding the publication of this manuscript.
References
- Zamreeg, A.O.; Hasanean, H.M. Windshear analysis over six airports in Saudi Arabia. Discov. Sustain. 2024, 5, 233. [Google Scholar] [CrossRef]
- Rahman, H.; Ahmed, M.U.; Barua, S.; Funk, P.; Begum, S. Vision-Based Driver’s Cognitive Load Classification Considering Eye Movement Using Machine Learning and Deep Learning. Sensors 2021, 21, 8019. [Google Scholar] [CrossRef] [PubMed]
- Zhang, X.; Mahadevan, S. Ensemble machine learning models for aviation incident risk prediction. Decis. Support Syst. 2019, 116, 48–63. [Google Scholar] [CrossRef]
- Bartulović, D.; Steiner, S. Predictive Analysis of Airport Safety Performance: Case Study of Split Airport. Aerospace 2023, 10, 303. [Google Scholar] [CrossRef]
- Kumar, M.S.; Neeraja, P.; Amulya, R.; Swarna, K.; Reddy, T.S.P. Severity Level Prediction and Finding Cause in Flight Accidents Using Machine Learning. In Proceedings of the 2023 International Conference on Sustainable Emerging Innovations in Engineering and Technology (ICSEIET), Ghaziabad, India, 14–15 September 2023; pp. 565–568. [Google Scholar]
- Guo, Y.; Sun, Y.; He, Y.; Du, F.; Su, S.; Peng, C. A data-driven integrated safety risk warning model based on deep learning for civil aircraft. IEEE Trans. Aerosp. Electron. Syst. 2022, 59, 1707–1719. [Google Scholar] [CrossRef]
- Mehta, J.; Vatsaraj, V.; Shah, J.; Godbole, A. Airplane crash severity prediction using machine learning. In Proceedings of the 2021 12th International Conference on Computing Communication and Networking Technologies (ICCCNT), Kharagpur, India, 6–8 July 2021; pp. 1–6. [Google Scholar]
- Peysakhovich, V.; Lefrançois, O.; Dehais, F.; Causse, M. The Neuroergonomics of Aircraft Cockpits: The Four Stages of Eye-Tracking Integration to Enhance Flight Safety. Safety 2018, 4, 8. [Google Scholar] [CrossRef]
- Ferrari, F.; Spillmann, K.P.; Knecht, C.P.; Bektaş, K.; Muehlethaler, C.M. Improved pilot training using head and eye tracking system. In Eye Tracking for Spatial Research, Proceedings of the 3rd International Workshop (ET4S); ETH Zurich: Zurich, Switzerland, 2018; pp. 58–63. [Google Scholar]
- Li, W.-C.; Zhang, J.; Le Minh, T.; Cao, J.; Wang, L. Visual scan patterns reflect to human-computer interactions on processing different types of messages in the flight deck. Int. J. Ind. Ergon. 2019, 72, 54–60. [Google Scholar] [CrossRef]
- Allsop, J.; Gray, R. Flying under pressure: Effects of anxiety on attention and gaze behavior in aviation. J. Appl. Res. Mem. Cogn. 2014, 3, 63–71. [Google Scholar] [CrossRef]
- Xue, H.; Chen, X.; Zhang, X.; Ma, Z.; Qiu, K. Pilot Fatigue Evaluation Based on Eye-Movement Index and Performance Index. In Proceedings of the International Conference on Human-Computer Interaction, Gothenburg, Sweden, 26 June–1 July 2022; Springer International Publishing: Cham, Switzerland, 2022; pp. 446–460. [Google Scholar]
- Dehais, F. Study of Pupil Diameter and Eye Movements to Enhance Flight Safety Étude de diametre pupillaire et de mouvements oculaires pour la sécurité aérienne. Ph.D. Thesis, Université Toulouse, Toulouse, France, 2016. [Google Scholar]
- Silagyi, D.V., II; Liu, D. Prediction of severity of aviation landing accidents using support vector machine models. Accid. Anal. Prev. 2023, 187, 107043. [Google Scholar] [CrossRef] [PubMed]
- Wu, X.; Yu, H.; Ren, Y. Civil aircraft hard landing prediction based on PSO-ARIMA model. In Proceedings of the 2022 IEEE 4th International Conference on Civil Aviation Safety and Information Technology (ICCASIT), Dali, China, 12–14 October 2022; pp. 466–470. [Google Scholar]
- Tong, C.; Yin, X.; Li, J.; Zhu, T.; Lv, R.; Sun, L.; Rodrigues, J.J. An innovative deep architecture for aircraft hard landing prediction based on time-series sensor data. Appl. Soft Comput. 2018, 73, 344–349. [Google Scholar] [CrossRef]
- Lu, Y.; Zhu, T. Pre-training of autoregressive model for aircraft hard landing prediction based on QAR data. In Proceedings of the 2019 IEEE 31st International Conference on Tools with Artificial Intelligence (ICTAI), Portland, OR, USA, 4–6 November 2019; pp. 1613–1617. [Google Scholar]
- Zhang, H.; Zhu, T. Aircraft hard landing prediction using LSTM neural network. In Proceedings of the 2nd International Symposium on Computer Science and Intelligent Control, Stockholm, Sweden, 21–23 September 2018; pp. 1–5. [Google Scholar]
- Kong, Y.; Zhang, X.; Mahadevan, S. Bayesian Deep Learning for Aircraft Hard Landing Safety Assessment. IEEE Trans. Intell. Transp. Syst. 2022, 23, 17062–17076. [Google Scholar] [CrossRef]
- Calle-Alonso, F.; Pérez, C.J.; Ayra, E.S. A Bayesian-Network-based Approach to Risk Analysis in Runway Excursions. J. Navig. 2019, 72, 1121–1139. [Google Scholar] [CrossRef]
- Yang, X.; Yang, J.; Zhang, Z.; Ma, J.; Sun, Y.; Liu, H. A review of civil aircraft arresting system for runway overruns. Prog. Aerosp. Sci. 2018, 102, 99–121. [Google Scholar] [CrossRef]
- Zhao, Y.; Zhu, W.; Wei, P.; Fang, P.; Zhang, X.; Yan, N.; Liu, W.; Zhao, H.; Wu, Q. Classification of Zambian grasslands using random forest feature importance selection during the optimal phenological period. Ecol. Indic. 2022, 135, 108529. [Google Scholar] [CrossRef]
- Booth, J.; Margetts, B.; Bryant, W.; Issitt, R.; Hutchinson, C.; Martin, N.; Sebire, N.J. Machine Learning Approaches to Determine Feature Importance for Predicting Infant Autopsy Outcome. Pediatr. Dev. Pathol. 2021, 24, 351–360. [Google Scholar] [CrossRef] [PubMed]
- Brownlee, J. How to Calculate Feature Importance with Python. Machine Learning Mastery. 2020. Available online: https://machinelearningmastery.com/calculate-feature-importance-with-python (accessed on 20 August 2020).
- Ronaghan, S. The Mathematics of Decision Trees, Random Forest and Feature Importance in Scikit-Learn and Spark. Towards Data Science 2018, 11. Available online: https://medium.com/data-science/the-mathematics-of-decision-trees-random-forest-and-feature-importance-in-scikit-learn-and-spark-f2861df67e3 (accessed on 12 May 2018).
- Shen, K.-Q.; Ong, C.-J.; Li, X.-P.; Wilder-Smith, E.P.V. Feature selection via sensitivity analysis of SVM probabilistic outputs. Mach. Learn. 2008, 70, 1–20. [Google Scholar] [CrossRef]
- Basso, F.; Pezoa, R.; Varas, M.; Villalobos, M. A deep learning approach for real-time crash prediction using vehicle-by-vehicle data. Accid. Anal. Prev. 2021, 162, 106409. [Google Scholar] [CrossRef] [PubMed]
- Hochreiter, S.; Schmidhuber, J. Long short-term memory. Neural Comput. 1997, 9, 1735–1780. [Google Scholar] [CrossRef] [PubMed]
- Zhou, Y.; Fu, C.; Jiang, X.; Yu, Q.; Liu, H. Who might encounter hard-braking while speeding? Analysis for regular speeders using low-frequency taxi trajectories on arterial roads and explainable AI. Accid. Anal. Prev. 2024, 195, 107382. [Google Scholar] [CrossRef] [PubMed]
- Elmadjian, C.; Gonzales, C.; da Costa, R.L.; Morimoto, C.H. Online eye-movement classification with temporal convolutional networks. Behav. Res. Methods 2022, 55, 3602–3620. [Google Scholar] [CrossRef] [PubMed]


Disclaimer/Publisher’s Note: The statements, opinions and data contained in all publications are solely those of the individual author(s) and contributor(s) and not of MDPI and/or the editor(s). MDPI and/or the editor(s) disclaim responsibility for any injury to people or property resulting from any ideas, methods, instructions or products referred to in the content. |
© 2025 by the authors. Licensee MDPI, Basel, Switzerland. This article is an open access article distributed under the terms and conditions of the Creative Commons Attribution (CC BY) license (https://creativecommons.org/licenses/by/4.0/).