Abstract
We introduce a refined formulation of the Fragmentation Environmental Index (FEI), designed to assess changes in the Low Earth Orbit (LEO) environment resulting from the fragmentation of a specific mass. The index quantifies this impact by comparing overall LEO criticalities before and after the fragmentation event. To highlight the contribution of smaller debris, we enhance the index by incorporating weighting factors tailored to optical and radar surveillance networks. Testing of the upgraded FEI on a series of simulated fragmentation events shows that it can characterize both the perturbation to the LEO environment and its temporal evolution, providing a more accurate quantification of the short- and medium-term impact of debris clouds compared to the original formulation.
1. Introduction
Space activities have seen a dramatic increase in the last several years. In particular, following the miniaturization of satellites and the advent of large constellations in Low Earth Orbit (LEO), the launch rate in the last five years has reached a level many times higher than the average rate of the first 60 years of space traffic. The large increase in the orbiting population of active spacecraft calls for an efficient Space Traffic Management (STM) based on an advanced Space Surveillance and Tracking (SST) system capable of monitoring the space environment. In addition to cataloging efforts and collision avoidance support, a crucial service offered by the SST is the monitoring of fragmentations. In-orbit fragmentations are responsible for the vast majority of the currently cataloged debris, and environment simulations suggest this kind of event will still represent a significant source of debris in the coming years (e.g., [1,2]). Given the characteristics of these events, which inject a large number of potentially lethal fragments into crowded orbital regions, it is important to quickly characterize the evolution of the resulting cloud of objects to assess the risk for other orbiting assets. Efficient SST networks will have to immediately react to such catastrophic events both by detecting and characterizing the fragmentation (e.g., [3]). It will also be important to quickly assess their impact on the other meshes of the chain of services provided by the SST system, such as the tracking/cataloging and the collision avoidance services. In this context, based on the definition of the Criticality of Spacecraft Index (CSI) [4] and of the Shell Criticality [5], a procedure and a Fragmentation Environmental Index (FEI)—capable of quantifying and visualizing the medium-term effects of fragmentations in LEO—were derived in [6]. The FEI is constructed by comparing the post-fragmentation contributions of the fragments to the original situation, where the entire fragmented mass was contained in the intact object(s). This yields a first assessment of the change in environmental risk. When working within an SST system, assessing a fragmentation event should consider both its potential danger and the actual capability of available sensors. An ideal surveillance network would quickly detect and track all fragments, allowing maneuvering spacecraft to avoid them and reducing the risk. In contrast, a weak surveillance network would only detect a few large fragments, leaving many smaller, undetected, and potentially dangerous ones. Therefore, it is essential that the index reflects the real performance of the sensor network. As detailed in Section 2.1, the original formulation of the FEI adopted a simplified approach by weighting the fragments by means of ad hoc weights based only on the fragment size, irrespective of the characteristics of the SST observing network. To overcome these limitations, we propose a method to incorporate refined network-related weights into the FEI calculation, based on the capabilities of the surveillance network. This paper briefly reviews the original derivation of the Fragmentation Environmental Index (FEI) in Section 2 and introduces the refined network-related weights in Section 2.1. The upgraded FEI formulation is tested on a number of simulated fragmentations in Section 3. The definition of a cumulated index to directly classify and rank different fragmentation events in various regions of the LEO is also given in Section 3.3. Our discussion and conclusions are outlined in Section 4.
2. Materials and Methods
The definition of FEI is based on the CSI definition. The CSI is a simple analytical tool to characterize the environmental risk of objects stranded in LEO. Without repeating details that can be found in [4], the expression of the CSI, , is as follows:
where are the mass, area, and lifetime of the considered object and is the spatial density around the altitude h where the object is found. The last multiplicative factor, , is a quantity dependent on the object’s orbital inclination. are normalizing factors (see [4] for details). In further work, the CSI formulation was expanded and applied to the evaluation of whole regions of space (“shell index”, in [5]) and to the problem of the environmental impact of megaconstellations [7]. It is worth stressing that several formulations of environmental indexes comparable to the CSI have been devised in recent years (see [8], and references therein, for a description and comparison of some of the available indexes). The concept of CSI was then applied to the problem of the characterization of a fragmentation. The FEI was developed having in mind the effects on a space surveillance network (SST) of an event creating a large number of fragments. Most of these fragments will be below the current detection threshold of the SST sensors, making these millimeter- and centimeter-sized objects even more lethal since they will not be trackable and, therefore, not avoidable by the active spacecraft. A multiplicative weight, , was introduced in the expression of the CSI in Equation (1) to enhance the importance of the non-trackable objects on its computation:
where . In particular, indicates completely untrackable debris, while a lower value, e.g., , denotes partially trackable objects.
To obtain the FEI, the weighted shell index can be calculated before and after a fragmentation by summing the values of , from Equation (2), for each fragment, as described in [5]. Finally, the FEI is given by either the absolute difference between the two values, as:
or by the percentage difference:
As shown in [6], the FEI can quickly detect areas in space disrupted by fragmentation events without needing complex long-term analysis. Both the CSI [4] and the FEI are designed to be easy to calculate using a small but sufficient set of parameters. However, the weighting factor in Equation (2) was applied heuristically to the fragment population. As stressed by the authors in [6], further improvements of the FEI would include identifying the best weighting factors for a specific application of this kind of index. In the following section, we present an improvement of the FEI using refined weighting factors derived on the basis of the performances of the sensors in a given SST network.
2.1. Improving the FEI
The weighting factor introduced in Equation (2) is related to the considered sensor network, in particular, to its sensitivity (e.g., expressed in terms of the size of the minimum detectable object at a given altitude). Hence, it is important to understand how a network of sensors is made and what its components are. In particular, we have to estimate the capabilities of both passive (optical) and active (radar) networks in terms of the sensors’ characteristics. This can be done by looking for metrics that describe optical and radar detection performances.
Optical Detection Performance
New optical instruments, having a large field of view (typically larger than 5° of aperture), have proven to be particularly suited for high-volume monitoring of orbital debris (see, e.g., [9] for an exhaustive review of the fundamentals of space debris optical observations). Ongoing research, such as [10], aims at optimizing these sensors’ integration times, and builds upon this idea to determine the detection performance in various orbital regimes of an optical network. For such modern detectors, for which dark noise and other noise sources can be assumed to be negligible within the integration times of interest, the Signal-to-Noise Ratio (SNR) per pixel of a Resident Space Object (RSO) approximated as a sphere is given by:
where
is the signal in photoelectrons, and the terms inside the square root at the denominator represent background, read out, and shot noise variances. is the number of read noise electrons per pixel. The background and shot noises are Poisson noises; thus, their standard deviations (in photoelectrons) are given by the square root of their respective signals, and :
In the above equations, is the object’s irradiance, which ultimately depends on its size, is the detector’s quantum efficiency, and are the optical and atmospheric transmittance, both responsible for some signal loss, and , is the signal integration time (per pixel) of interest, which generally differs from the system integration time t, due to the angular movement of the object during an exposure period. is the background signal in radiometric units. Finally, is a sensor-related quantity, given by the individual detector size, x, divided by the sensor’s focal length, f. Calling and substituting in (9):
corresponding to the unofficially named CCD equation, in the case where dark noise is neglected ([11,12]). We may rewrite (9) as:
The maximum achievable value for is obtained when the fragment moves through the full length of a pixel during an exposure, and recording a detection event translates into choosing a suitable threshold for the SNR above which an RSO can be detected with a low false alarm rate. As noted in [10] (and references therein), an SNR of six already provides good detection performances (an SNR value greater or equal to six is also used in the orbit propagation and observation simulations approach as described in [13], where the efficiency of a network of the new Flyeye telescopes in carrying out HLEO region surveys is addressed.). Moreover, for uncued telescope survey systems considered in this discussion, background noise often prevails due to the requirement for short focal lengths to achieve a wide field of view, resulting in a larger individual pixel angular extent. This is because achieving a wide field of view requires short focal lengths, which cause each detector pixel to subtend a larger angle on the sky. As a result, each pixel collects more background light, increasing the background noise; moreover, shot noise is negligible in the background-level pixels used to establish detection thresholds, namely, [10]. Under these assumptions, Equation (10) becomes:
Therefore, given a specific sensor with its associated , , A, t, and , together with an estimation of the typical , and considering the suitable case where the background radiance dominates the detector read noise, the equation will be proportional to the quantities and . Big, slow fragments will produce higher SNRs. Assuming the SNR to be a performance indicator, we see that the performance of an optical sensor depends both on its capability of detecting the object and on the object’s angular velocity relative to the sensor. When viewed at high elevation angles, lower-altitude LEO objects may exceed angular rates (AR) of one degree per second, corresponding to 3600 arcsec/s. Moreover, as shown in [14], the volume of observable objects increases with decreasing elevation angles, and approximately 90% of debris passes occur at elevations lower than 50 degrees. The drawback is that the range to a specific object increases with decreasing elevation angles, and so does its apparent magnitude. Both [10,15] present studies of simulated angular rates of LEO resident space objects (RSOs) as observed from the ground, analyzed as a function of the elevation angle for various circular orbit altitudes. These studies show that most RSOs at 300 km altitude (LLEO) appear as fast-moving objects: an elevation of 30° corresponds to angular rates of 2000–3000 arcsec/s. At 600 km, the average angular rate decreases and takes values in the interval between 1000 arcsec/s and 2000 arcsec/s. The slowest fragments are those populating the High LEO region: already at around 1500 km, their speed is always below 1000 arcsec/s (note that a variety of factors influence the typical pointing directions of a given telescope, depending also on the minimum allowed angle above the horizon, related to atmospheric disturbances and sensor specifics (e.g., limiting the range of the mounting system).).
As mentioned above, ultimately depends on the size of the fragment and the range to the target: [10]. Assuming a fixed elevation angle for all telescopes, and circular orbits for the targets, it is possible to relate to the corresponding LEO altitude h through the slant range equation:
being the sensor’s elevation angle, being the Earth’s radius, and the target’s slant range. In other words, we can write . On the other hand, can be estimated to be (as an order of magnitude):
where is the object angular rate with respect to the telescope pointing. Note that, assuming this form for , we define it as equal to the maximum transit time through a single pixel on the detector with angular extent . As discussed above, we can argue that the angular rate of an object roughly depends on its altitude. Hence, depends on h, , because ultimately, = .
Therefore, in this work, we define a function of the two parameters size and altitude, :
that is a linear combination of two separate weights: one describing the capability of a telescope to detect faint objects, and the other related to how fast the object transits in a given field of view. In the above equation, A is a network-related coefficient. More specifically, subdividing the LEO region as in Table 1 and referring to the above discussed RSOs angular rates, we can tailor the function to our network capabilities (i.e., we can assign a specific value to A in Equation (14)). It is assumed that only a small percentage of telescopes are going to be able to observe the fastest fragmentations—i.e., those happening in Low LEO (LLEO). In this framework, the coefficient A gives us a feeling of the relative importance of the and contributions: for a fragmentation occurring in LLEO, we set , meaning that we give more importance to the latter. This is because we expect a fragment belonging to such a cloud to be the “brightest it can be”, but also the “fastest it can be”. Applying this reasoning to the other two orbital regimes, we set if the cloud is found in Medium LEO (MLEO), and for a debris cloud in High LEO (HLEO). This latter condition also amounts to effectively shutting down the contribution. The A coefficient will ultimately depend on where in the LEO region the fragmentation has occurred, and its value for the three different regimes is given in Table 2. It is worth stressing that the A coefficient value for each regime was determined heuristically, reflecting what the authors consider representative of current network capabilities. However, these coefficient values are just model parameters and can be easily modified in the source code we have made available (see Supplementary Materials).

Table 1.
LEO partition in altitude zones.

Table 2.
Value of the A coefficient as it appears in the function .
To compute the two weights in Equation (14), we assume the available network to consist of of telescopes, all sharing the same characteristics: every optical sensor can probe the LEO environment up to an altitude km of altitude and is capable of detecting all fragments larger than cm in size. It should be stressed that the above values are input parameters that can be changed according to the performances of the available sensors. It is also worth noting that, presently, radar sensors are mostly used for survey of the LEO population, in particular, below altitudes of ∼1200 km, while telescopes are primarily utilized for observations in MEO and GEO, though their use for SST in LEO is becoming more and more common. Assuming that all telescopes are positioned at an elevation angle of 30°, the range associated with the altitude shell is derived using the slant range equation. This range determines the maximum distance at which objects can be observed. The corresponding limit of detectability, or brightness threshold, is influenced by the smallest detectable size and the calculated range. This threshold in magnitude represents the detectability limit of the network. In the case where we have access to generic knowledge of the target’s range—for instance, given by the first estimates of the orbit coming from the largest observed fragments—we can use Equation (12) to obtain the target’s altitude, and every fragment smaller than 20 cm at the fragmentation altitude has to satisfy:
in order to be detected ( denotes the fragment size). It is important to note that, since the limiting magnitude of a telescope can be approximated by the formula (see [16]):
condition (15) sets the diameter (in centimeters) of an average telescope describing our network. In practical terms, when we establish a detectability limit for the network, we describe it as a telescope with diameter . We define the following weight for the detectable fragments:
where cm and is the fragment altitude, assuming it to be on a circular orbit. This formulation guarantees that the weight is always positive and falls within the range . We associate the fragments for which condition (15) does not hold with maximum risk, while we give a null weight to fragments bigger or equal to 20 cm in size whose collision risk could be easily mitigated by means of collision avoidance maneuvers:
By doing this, we have assigned a weight to the contribution to the function of Equation (14), namely, . As for , we make use of the LEO subdivision in Table 1 and of the above discussion (based on [10,15]) about the simulated RSOs angular rates by assuming:
- arcsec/s;
- arcsec/s;
- arcsec/s.
The separation into these three regions allows us to define the following weight:
Given the telescope’s elevation and diameter, the risk associated with simulated random fragments of various sizes (values of the function) can be computed. We generated object sizes in the interval 0–30 cm and plotted the results to have a better grasp on the different weights associated with different fragments (note that, unlike the results we will show later in Section 3, the current fragments are not representative of an actual cloud, since they do not follow a specific mass distribution.). Figure 1 shows the results for objects in an 800 km (left) and 1000 km (right) altitude shell. For each plot, there are two size regions for which the associated weight takes either maximum or minimum values. The former represents the non-visible fragments, i.e., those fragments for which , because they do not satisfy Equation (15), while the latter is characterized by those fragments greater or equal to in size. For sizes within an intermediate range, takes values in the interval . These values are well approximated by a second-order polynomial fit (red curve), obtained through a least squares method. A linear least squares fit is also possible, though it typically yields larger residuals. In addition to these two fits, a third linear parametrization could also be constructed directly from known parameters. Specifically, a line can be defined by the two points:
where is the smallest fragment size capable of producing the minimum detectable signal at the fragmentation altitude , and is the smallest physically modeled fragment size. This parametrization would then offer a fast and reasonably accurate alternative for evaluating . While a linear parametrization has its limitations, it can still serve as a useful tool to provide the operator with a preliminary estimate of the weight associated with a given fragment, based on the characteristics of the telescope, as illustrated in Figure 1. However, for the purposes of our analysis, we will compute the actual optical weights as previously described, without relying on any parametrization. Specifically, we will evaluate the contribution of each individual fragment and sum these to obtain the total fractional FEI, in accordance with Equation (4).
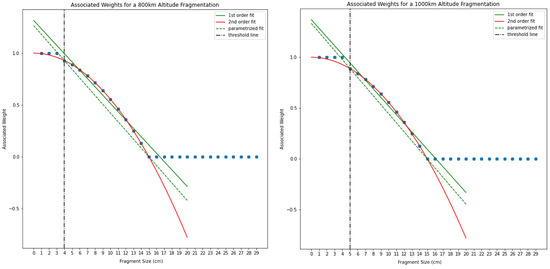
Figure 1.
Simulated optical () weights for fragments up to 30 cm in two different fragmentation cases happening in an 800 km (left panel) and 1000 km (right panel) altitude orbit. The middle part of the plot is well fitted by a second-order polynomial red linel. A first-order fit (green solid line) and the parametrized fit (green dotted line) performed as described above are also displayed.
2.2. Radar Detection Performance
Radar sensors are the main contributors to SST activities in LEO. We describe the radar performance by the following form of the radar range equation, where the ratio between , the signal in the radar receiver, and , the noise signal, is considered:
The interesting dependencies in Equation (18) are the ones on the far right, namely, the and terms, where is the object’s range and is the Radar Cross Section (RCS) All other terms constitute the design parameters, and they depend on the specific radar sensors. Here, we list them:
- , the peak transmit power specified at the output of the transmitter, measured in watts (W) (as a reference, the EISCAT Svalbard Radar (ESR) located in Longyearbyen, Svalbard, has a peak transmit power of 1 M [17]);
- and , the transmit and receive antenna transmitting gains (around 40–50 dBi for EISCAT [17]);
- , the operating radar wavelength in meters (m)
- k, the Boltzmann constant, equal to ×
- , a reference temperature in kelvin (K), usually set to K
- B, the effective noise bandwidth of the radar. It is measured in hertz (Hz) (during beam-park experiments conducted at EISCAT, this amounted to 45 Hz for 10 pulses integrated together [18]).
- , the radar noise figure. It is dimensionless (more information on the radar noise figure can be found in [19]).
- L, a factor that takes into account losses that need to be considered when using the radar range equation, such as the antenna and feed losses. This is dependent on the antenna under consideration.
The RCS, , depends on various factors. Among these, the size of the object plays a significant role. Other factors include the material with which the target is made, the size of the target relative to , the incident and reflected angle, and the polarization of the radiation (both transmitted and received). Modeling the fragments as isotropic re-emitting spheres of size (diameter) s, and assuming that the ratio (optical regime), the following relation holds (this is true for a wide range of applications; for instance, taking cm, the ratio condition holds true for Ka, Ku, X, C, S, and part of the L band.):
while for smaller ratios (Rayleigh regime), we have:
and the radar cross-section value gives us a hint on the fragment size (see [20]). In other words, considering a radar network described by a single radar with given specifics, it can be assumed that . We also have , as in the optical case.
A New Radar Weight
Assuming that all radars in the network are able to detect centimeter-sized objects up to an altitude of km, we can:
- compute the corresponding expected SNR for a given fragment of size at a given fragmentation altitude , ;
- address its detectability, meaning check whether:
- in case the above inequality holds true, compute the weight:
This is somehow analogous to the procedure presented in the optical case. The radar weight associated with each fragment size is shown in Figure 2. Here, it is assumed all radars point at a 30° elevation, and that objects with sizes equal to are detectable at an altitude . Considering all other quantities in the radar SNR equation as constant, this amounts to giving a specific value for and . More specifically, the product of these two quantities gives a practical description of a sensor representing the network.
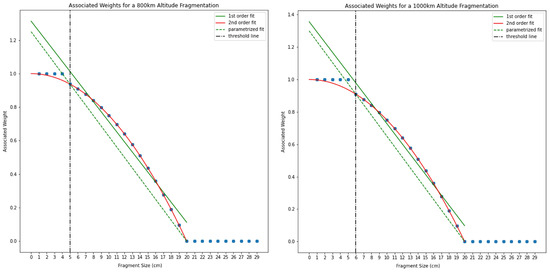
Figure 2.
Simulated weights for fragments up to 30 cm in two different fragmentation cases happening in an 800 km (left panel) and 1000 km (right panel) altitude orbit. A first-order fit (green solid line) and the parametrized fit (green dotted line) performed as described in the text are also displayed.
3. Results
To test the new index formulation, we simulated a collision between a 2000 kg upper stage in a circular orbit of high inclination with = (0.00003, 80.3°) and a 15 kg piece of debris, with a relative velocity of 10 km/s, using the NASA Standard Breakup Model [21] as implemented in the SDM software, Version 4.0 suite [1]. Due to the size and velocity of the projectile, the collision leads to a complete fragmentation of the target. The resulting debris cloud is composed of 41,500 objects with sizes ranging from 0.08 cm to 176 cm. The whole cloud was propagated for up to days. We conducted simulations for four different fragmentation altitudes: km, 800 km, 1200 km, and 1800 km. For the sake of conciseness, we only present and analyze in detail the results obtained for km and km. For our study, we chose to model a network that employs radars to probe the LEO environment up to 1200 km in altitude and telescopes to detect objects at altitudes higher than 1200 km. In accordance with the definition of , this implies setting for our simulations. As mentioned before, this division between radar and optical regimes reflects the current routine of the SST services. Whereas radars demonstrate superior performances compared to telescopes at lower LEO altitudes, optical telescopes offer a cost-effective alternative for higher altitudes, where the use of very powerful (hence expensive) radars would be necessary.
3.1. 450 km Altitude Fragmentation
Figure 3 shows the Gabbard Diagram of the 450 km altitude fragmentation. Since km, it is considered that a pure radar network is in place, with all sensors having an elevation angle of 30°. The minimum detectable size, of a fragment at a given altitude can be taken as a proxy for the network’s capabilities. We considered, respectively: cm, 15 cm, 5 cm at 1200 km for radar sensors (these values may represent the capabilities of currently deployed radars used by various entities and companies worldwide for space surveillance and tracking; however, they are simply input parameters, and the developed model allows users to customize this choice to test any specific network).
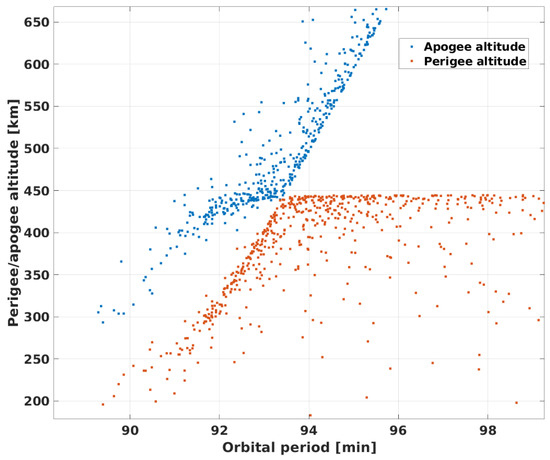
Figure 3.
Gabbard diagram associated with the km fragmentation. Note the fading left branches, due to the atmospheric drag cleaning effect.
3.1.1. Global CSI
In the top panel of Figure 4, the computed effects of different networks on the computation of the overall LEO criticality (Global CSI) value as a function of time are shown. Note that in this and all the following subsections, we will distinguish between “Global CSI” and “Cloud CSI”. The former coincides with the overall LEO criticality definition as described in [5], while the latter represents the fragmentation cloud contribution to the Global CSI. The value of the Global CSI in Figure 4 decreases as the capability of the network increases, transitioning from radars with cm to a sensor characterized by cm. At first glance, it might seem like the Global CSI values remain constant over time. However, the decay of fragments over time, caused by the atmospheric drag given the low altitude of this event, can be noticed looking at the bottom panel of Figure 4, which is a zoom-in on the red curve in the top panel, for the cm curve. The improvement provided by the network with cm over the one with cm is visually captured by Figure 5, showing that the radar network of cm produces a CSI that is lower than the network of cm.
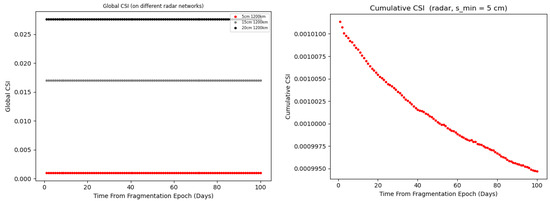
Figure 4.
The left panel shows the Global CSI associated with a km fragmentation as a function of time, for different radar networks (top panel). The right panel shows only the cm case to highlight the decreasing trend.
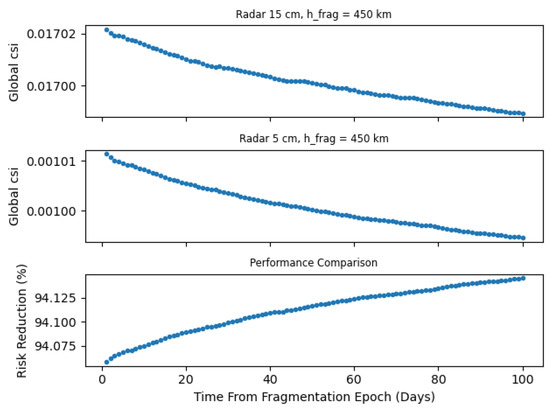
Figure 5.
Comparison of Global CSI values as given by two different networks ( km). Top: network with cm; middle: network with cm; bottom: percentage ratios between the two produced CSIs.
3.1.2. Cloud CSI
It is also interesting to take a look at the cloud’s contribution to the Global CSI described in the previous subsection. In Figure 6, the cloud contributions for the three different networks are compared. For reference, we also plot (blue dots) the cloud’s CSI values in the scenario where no fragment is detectable (i.e., the blue dots correspond to the case where all fragments have ). From Figure 6, it can be noticed how an improvement in network capability results in a reduction in the Cloud’s CSI value, as one would expect. It is worth noticing also that a more advanced network will be more sensitive to changes in the environment, making a specific cloud more noticeable. This is demonstrated in Figure 7, where we observe an approximately 2.5% contribution of the cloud to the overall LEO criticality in the case of a radar network described by cm, one day after the fragmentation event (to be compared with ∼0.4% at cm and ∼0.3% at cm). To further support this statement, notice how the cloud’s contribution to the Global CSI is nearly zero in the case when (represented by the blue dots); in this scenario, the CSI associated with the background is very high, and the cloud’s contribution becomes almost indistinguishable within it.
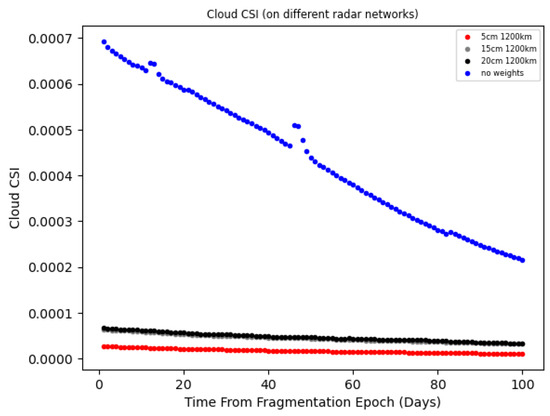
Figure 6.
Cloud’s CSI contribution ( km) as computed using weights associated to different radar networks. The blue dots correspond to the case in which no network is in place, and all fragments are associated with a maximum weight of 1.
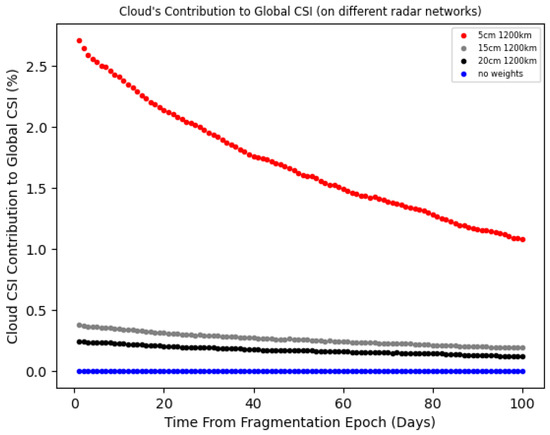
Figure 7.
Debris cloud’s contribution ( km) to the global CSI, for different networks. The blue dots correspond to the case where the same maximum weight of 1 is assigned to all fragments.
3.1.3. FEI
The results of the FEI computation, performed as discussed in Section 2 and Section 2.1, are shown in Figure 8 and Figure 9. Figure 8 displays the percentage FEI given by Equation (4) on the cm network, at 1 (solid line) and 100 days (dotted line) after the fragmentation event, respectively. Although the percentage FEI effectively identifies altitudes experiencing significant stress from fragmentation, it lacks the ability to convey the magnitude of the difference between pre- and post-fragmentation. It is possible for two distinct fragmentations, characterized by different values of and , to result in the same ratio. This similarity arises because the denominator serves as a normalization factor, preventing a clear understanding of the magnitude of the numerator. In order to solve this degeneracy, we also compute the values of as in Equation (3) and plot them in the top panel of Figure 9. In this plot, it is evident that the lowest LEO shells are characterized by a very low FEI, indicating that the difference between the post-fragmentation and pre-fragmentation situations is very small. By multiplying the two functions and , to keep track of the magnitude of the FEI as defined by the differences only, we obtain the Modulated FEI, shown in the right panel of Figure 9, which shows a prominent bump corresponding to the relevant fragmentation altitude. All three images provide an insight into how the FEI evolves over time. A robust environmental index should also effectively capture the overall risk at a specific time, essentially tracking the cloud as it propagates and spreads within the LEO region. Observing the Modulated FEI plot in the right panel of Figure 9, the impact of atmospheric drag, which acts as a sink for all the fragments, is clearly visible.
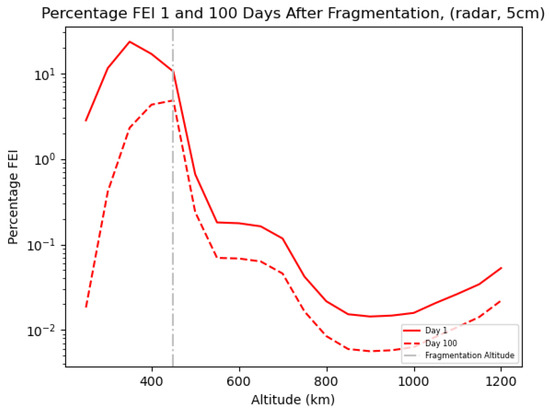
Figure 8.
Percentage FEI as computed on a network characterized by cm at an altitude of km.
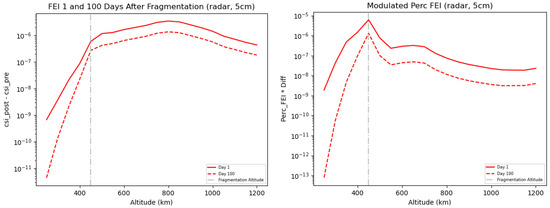
Figure 9.
Left panel: FEI as computed on a network characterized by cm at an altitude of km. Right panel: plot showing the Modulated FEI, namely, the product between the FEI and the Percentage FEI values, as computed on a network characterized by cm at an altitude of km. The Modulated FEI resolves the ambiguity between fragmentations that have similar relative impacts but differ in magnitude by combining normalized and absolute difference measures.
3.2. 1200 km Altitude Fragmentation
We now move to the fragmentation happening at our assumed radar observation limit (we remember that the limiting altitude is a model parameter and we note that in the operational environment within, e.g., the US surveillance network, very powerful radars are used even above this 1200 km limit, used here as a test value.), characterized by km. At this regime, we switch to an optical network. Three different optical sensors, characterized by cm, 15 cm, 5 cm at a maximum altitude of 2000 km were tested. All telescopes are assumed to have an elevation of 30°.
3.2.1. Global CSI
The Global CSI value decreases as the network’s sensitivity increases, transitioning from telescopes with cm to a network characterized by cm. The bottom panel of Figure 10 specifically highlights this behavior for the network with cm, and analogous patterns emerge for the remaining two networks. The Cumulative Cloud CSI plot is remarkably different from the one previously shown for a 450 km fragmentation, as a small increase (of the order ∼) can be observed in the cloud’s CSI up to 40 days after the fragmentation epoch. The behavior depicted in the bottom panel of Figure 10 is most likely a consequence of the complicated interplay between (1) the breakup model used and (2) the evolutionary dynamics of fragments spreading the cloud of fragments over different altitude bands. The enhanced performance of the cm telescope network is again visually captured in Figure 11, indicating a CSI approximately lower than in the case of the cm network.
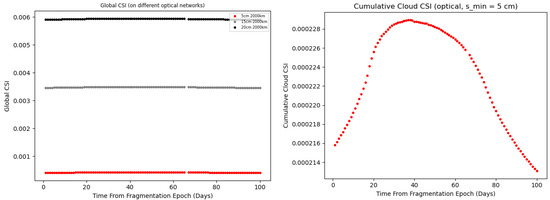
Figure 10.
Left panel: Global CSI associated with a km fragmentation as a function of time, for different optical networks. Right panel: detail for the case (black line in the top panel).
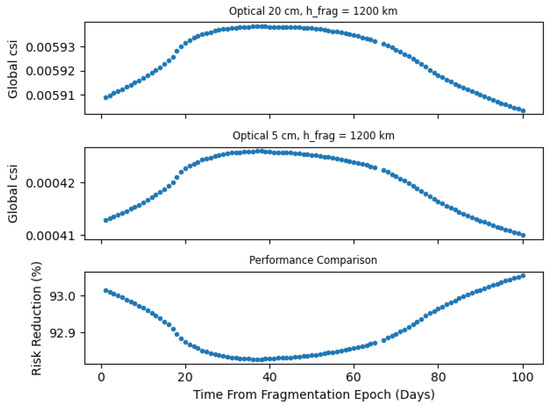
Figure 11.
Comparison of Global CSI values as given by two different optical networks ( km). Top: network with cm; middle: network with cm; bottom: percentage ratios between the two produced CSIs shown in the top panels.
3.2.2. Cloud CSI
The plots depicting the evolution of the CSI exhibit a general pattern consistent with those previously presented for the fragmentation of km. The highest Cloud CSI values are observed when all fragments are given equal weight (), decreasing as the optical network’s performance improves (see Figure 12). However, the most intriguing result is illustrated in Figure 13. In particular, the cm optical network demonstrates remarkable sensitivity, with the cloud accounting for a significant of the globally computed CSI. In contrast, lower values of 10–15% are observed for less powerful networks, with the percentage decreasing as the sensor’s capability diminishes.
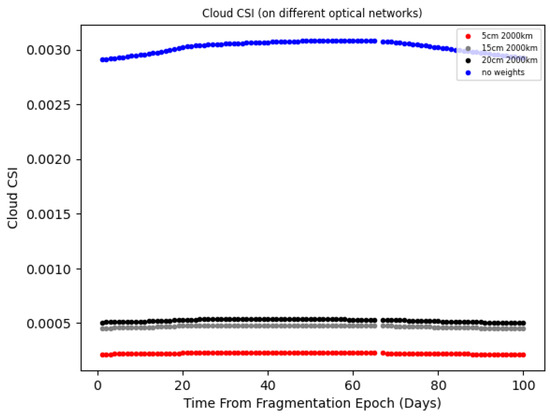
Figure 12.
Cloud’s CSI contribution ( km) as computed using weights associated to different optical networks. The blue dots correspond to the case in which all fragments are associated with a maximum weight of 1.
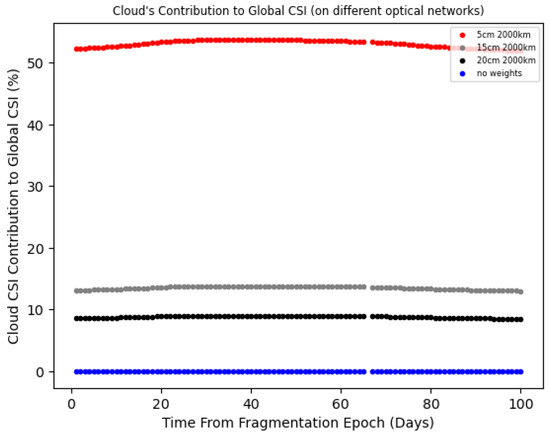
Figure 13.
Cloud’s contribution ( km) to the global CSI, for different networks. The blue dots correspond to the case where the same maximum weight of 1 is assigned to all fragments.
3.2.3. FEI
The FEI plots (Figure 14 and Figure 15) once again show the ability of the index to localize the altitude shells that are of most interest in fragmentation (in this case, km). The atmospheric drag effect at high altitudes is not present. For this reason, no relevant change in the FEI is observed at day 100 with respect to day 1. Similar plots were obtained for the fragmentations at km and km. Given that they basically share the same trends and show the same results as the two cases already discussed, it is not deemed necessary to present them here. Our results show how the improved FEI can be used to characterize the effects on the space environment of a fragmentation, leveraged by the performances of a given network of sensors. Additionally, it identifies specific altitude shells that are expected to be particularly affected by the debris cloud in the short term.
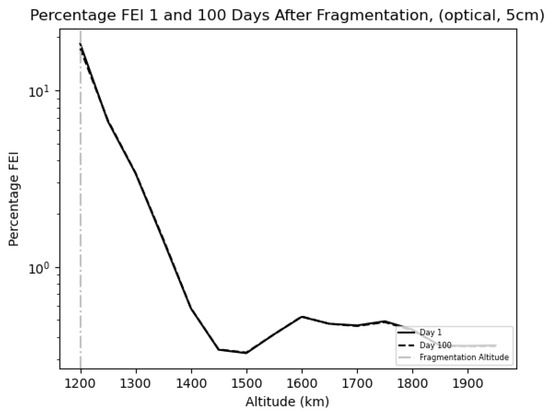
Figure 14.
Percentage FEI as computed on a network characterized by cm at an altitude of km.
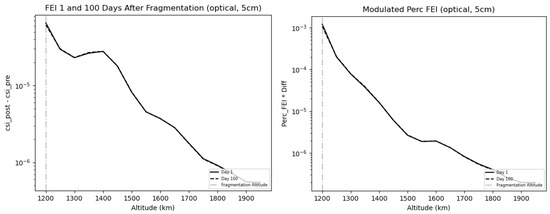
Figure 15.
Left panel: FEI as computed on a network characterized by cm at an altitude of km. Right panel: plot showing the Modulated FEI, namely, the product between the FEI and the Percentage FEI values, as computed on a network characterized by cm at an altitude of km. The Modulated FEI resolves the ambiguity between fragmentations that have similar relative impacts but differ in magnitude by combining normalized and absolute difference measures.
3.3. A Cumulative Index for Fragmentation Ranking
In the same line as performed in [5], by summing up the weighted CSI for all the fragments in a debris cloud, it is possible to obtain a cumulative index, which, once properly normalized, can give a ranking of the danger represented by a given fragmentation leveraged by the observing capabilities of the underlying SST network. The two panels of Figure 16 illustrate the cumulative cloud CSI for fragmentations at altitudes of 450 km and 800 km (left panel, observed by a radar network) and 1200 km and 1800 km (right panel, observed by an optical network). The indices are accumulated over 100 days and normalized to the CSI value in the absence of any network ( for all fragments). For normalization, the reference fragmentation altitude corresponds to the higher altitude in each pair: 800 km for the radar case and 1800 km for the optical case. Note how—for a given fragmentation—the index value increases with both the network’s minimum detectable size, , and the fragmentation altitude, . It is important to note that the normalization factor used here is the cumulative index value in the absence of any network. With this choice, direct comparisons between different fragmentations are not feasible, as the normalization factor depends on the fragmentation itself. However, if the aim is to have a global ranking of fragmentation events for a given network, it is possible to normalize every event relative to a “standard” reference event. This approach would enable the SST system to directly compare different events.

Figure 16.
Left panel: Cumulative Cloud CSI cumulated over 100 days, associated with km and km fragmentations, as a function of the radar network sensitivity. Right panel: same as in left panel, for fragmentations at km, km observed by optical networks with different sensitivity.
4. Discussion and Conclusions
Exploiting the criticality index, previously developed by the authors in [4], a new index, called FEI, was devised in [6]. The focus of the FEI index is to highlight the impact of a given fragmentation on a space surveillance system. This is done by introducing specific weighting factors to increase the importance, in the index computation, of objects not visible from the considered network of sensors. While in [6], the weighting factors were introduced ad hoc, in this work a thorough analysis of the observability of small fragments, given the characteristics of the available SST network (either optical or radar), was presented, leading to an improved index. Results for a few simulated fragmentations show that the index is capable of characterizing the evolution of the fragment clouds and their impact on the environment around the event location. Moreover, the risk associated with a given fragmentation cloud is leveraged with the capabilities of a specific observation network. This can also provide information on the stress posed by the fragmentation event on a given SST system and on the capability of the system to properly monitor the event. Moreover, the use of FEI can improve the performances of an SST fragmentation service by providing timely information to the observing network about the resources to devote to the characterization of a given event, according to the severity of its expected consequences. The same information can help the collision avoidance service in raising the level of alarm in the region of space affected by the fragmentation event, as identified by FEI outcomes such as, e.g., Figure 8 and Figure 9. By summing up the weighted CSI for all the fragments within a cloud and normalizing the resulting values with respect to a reference network performance, a cumulated index over a specific time span can be used to directly classify and rank different fragmentation events on different regions of LEO. Further work is planned for the extension of the index for other regions of the circumterrestrial space above LEO. This also entails additional considerations in the formulation of the CSI index, especially for the lifetime terms, , in Equation (2). Namely, it worth stressing that for all the objects whose lifetime is not affected by air drag (i.e., above ∼1000 km), the CSI lifetime term, , is saturated to the maximum normalized value. Finally, it is worth stressing that the current work is concerned with what can be seen as the first step in the space surveillance process, that is the detection capability of a given network. Determining the orbit of an object requires several intermediate steps following its detection. These steps depend on various factors, such as the sensor distribution, their availability, and the conditions for observation (e.g., weather, lighting, etc.). While these aspects can be studied through network simulation frameworks (see, e.g., [22]), such analysis is beyond the scope of this paper. However, the indexes proposed here are specifically designed for straightforward and effective integration into such comprehensive simulation environments.
Supplementary Materials
The source code for this project is made available on Github at the following link: https://github.com/luigigisolfi/Updated_FEI_Computation (accessed on 22 May 2025).
Author Contributions
Conceptualization, L.G. and A.R.; methodology, L.G.; software, L.G.; validation, L.G.; formal analysis, L.G.; investigation, L.G.; resources, A.R.; data curation, L.G. and A.R.; writing—original draft preparation, L.G.; writing—review and editing, L.G., A.R. and F.M.; visualization, L.G.; supervision, A.R. and F.M.; project administration, A.R. and F.M.; funding acquisition, A.R. All authors have read and agreed to the published version of the manuscript.
Funding
This research was supported by the Agenzia Spaziale Italian (ASI) Contract “Detriti Spaziali—Supporto alle attività IADC e SST 2023–2025”. Open Access costs were supported by Delft University of Technology.
Data Availability Statement
The data presented in this study are available in the article and Supplementary Material.
Acknowledgments
This article is a revised and expanded version of a paper entitled “An Upgraded Environmental Index for the SST Fragmentation Service”, which was presented at the 2nd International Orbital Debris Conference (IOCII) 2023 in Sugar Land, TX, USA [23]. The authors wish to thank the two anonymous reviewers, whose comments helped to improve the paper.
Conflicts of Interest
The authors declare no conflicts of interest.
References
- Rossi, A.; Anselmo, L.; Pardini, C.; Jehn, R.; Valsecchi, G.B. The new space debris mitigation (SDM 4.0) long term evolution code. In Proceedings of the 5th European Conference on Space Debris, Darmstadt, Germany, 30 March–2 April 2009. [Google Scholar]
- Rossi, A.; Petit, A.; McKnight, D. Short-term space safety analysis of LEO constellations and clusters. Acta Astronaut. 2020, 175, 476–483. [Google Scholar] [CrossRef]
- Dimare, L.; Cicalò, S.; Rossi, A.; Alessi, E.; Valsecchi, G.B. In-orbit fragmentation characterization and parent bodies identification by means of orbital distances. In Proceedings of the First International Orbital Debris Conference, Sugar Land, TX, USA, 9–12 December 2019. [Google Scholar]
- Rossi, A.; Valsecchi, G.B.; Alessi, E.M. The Criticality of Spacecraft Index. Adv. Space Res. 2015, 56, 449–460. [Google Scholar] [CrossRef]
- Bombardelli, C.; Alessi, E.M.; Rossi, A.; Valsecchi, G.B. Environmental effect of space debris repositioning. Adv. Space Res. 2017, 60, 28–37. [Google Scholar] [CrossRef]
- Rossi, A.; Vellutini, E.; Alessi, E.M.; Schettino, G.; Ruch, V.; Dolado Perez, J.C. Environmental index for fragmentation impact and environment evolution analysis. J. Space Saf. Eng. 2022, 9, 269–273. [Google Scholar] [CrossRef]
- Rossi, A.; Alessi, E.M.; Valsecchi, G.B.; Lewis, H.; Radtke, J.; Bombardelli, C.; Bastida Virgili, B. A Quantitative Evaluation of the Environmental Impact of the Mega Constellations. In Proceedings of the 7th European Conference on Space Debris, Darmstadt, Germany, 18–21 April 2017. [Google Scholar]
- Letizia, F.; Colombo, C.; Rossi, A.; Muciaccia, A.; Giudici, L.; Harada, R.; Kawamoto, S.; Böttcher, R.; Ruch, V.; Taillan, C. Mission-based and environment-based approaches for assessing the severity of a space debris evolution scenario from a sustainability perspective. In Proceedings of the International Astronautical Congress 2024, Milano, Italy, 14–18 October 2024. [Google Scholar]
- Schildknecht, T. Optical surveys for space debris. Astron. Astrophys. Rev. 2007, 14, 41–111. [Google Scholar] [CrossRef]
- Shell, J. Optimizing Orbital Debris Monitoring with Optical Telescopes. In Proceedings of the Advanced Maui Optical and Space Surveillance Technologies Conference, Maui, HI, USA, 14–17 September 2010. [Google Scholar]
- Howell, S.B. Frontmatter. In Handbook of CCD Astronomy; Cambridge Observing Handbooks for Research Astronomers; Cambridge University Press: Cambridge, UK, 2006; pp. i–vi. [Google Scholar]
- Mortara, L.; Fowler, A. Evaluations of Charge-Coupled Device (CCD) Performance for Astronomical Use. In Solid-State Imagers for Astronomy; Geary, J.C., Latham, D.W., Eds.; International Society for Optics and Photonics, SPIE: Bellingham, WA, USA, 1981; Volume 290, pp. 28–33. [Google Scholar] [CrossRef]
- Pellegrini, R.; Gregori, P.; Cerutti, F.; Dimare, L.; Bernardi, F.; Bracali Cioci, D.; Vellutini, E. SUTED4L-Study for the application of the Flyeye Telescope to the Survey of the High-LEO orbital region. In Proceedings of the 2nd NEO and Debris Detection Conference, Darmstadt, Germany, 24–26 January 2023. [Google Scholar]
- Yurasov, V.; Shargorodskiy, V. Features of space debris survey in LEO utilizing optical sensors. In Proceedings of the 5th European Conference on Space Debris, Darmstadt, Germany, 30 March–2 April 2009. [Google Scholar]
- Sánchez-Ortiz, N.; Nomen Torres, J.; Domínguez-González, R.; Guijarro López, N. Accurate Optical Observation of Space Objects in LEO Regime. In Proceedings of the Advanced Maui Optical and Space Surveillance Technologies Conference, Maui, HI, USA, 11–14 September 2018; Ryan, S., Ed.; p. 59. [Google Scholar]
- Crumey, A. Human contrast threshold and astronomical visibility. Mon. Not. R. Astron. Soc. 2014, 442, 2600–2619. [Google Scholar] [CrossRef]
- Muntoni, G.; Montisci, G.; Pisanu, T.; Andronico, P.; Valente, G. Crowded Space: A Review on Radar Measurements for Space Debris Monitoring and Tracking. Appl. Sci. 2021, 11, 1364. [Google Scholar] [CrossRef]
- Vierinen, J.; Kastinen, D.; Markkanen, J.; Grydeland, T.; Kero, J.; Hesselbach, S.; Krag, H. Beam-park observations of space debris with the EISCAT radars. In Proceedings of the First NEO and Debris Detection Conference, Darmstadt, Germany, 22–24 January 2019. [Google Scholar]
- Doerry, A. Noise and Noise Figure for Radar Receivers; Sandia National Laboratories: Albuquerque, NM, USA, 2016. [Google Scholar] [CrossRef]
- Mie, G. Beiträge zur Optik trüber Medien, speziell kolloidaler Metallösungen. Ann. Phys. 1908, 330, 377–445. [Google Scholar] [CrossRef]
- Johnson, N.; Krisko, P.H.; Liou, J.C.; Anz-Meador, P.D. NASA’s New Breakup Model of EVOLVE 4.0. Adv. Space Res. 2001, 28, 1377–1384. [Google Scholar] [CrossRef]
- Milani, A.; Farnocchia, D.; Dimare, L.; Rossi, A.; Bernardi, F. Innovative observing strategy and orbit determination for Low Earth Orbit space debris. Planet. Space Sci. 2012, 62, 10–22. [Google Scholar] [CrossRef]
- Gisolfi, L.; Rossi, A.; Marzari, F. An Upgraded Environmental Index for the SST Fragmentation Service. In Proceedings of the 2nd International Orbital Debris Conference (IOCII), Sugar Land, TX, USA, 4–7 December 2023. [Google Scholar]
Disclaimer/Publisher’s Note: The statements, opinions and data contained in all publications are solely those of the individual author(s) and contributor(s) and not of MDPI and/or the editor(s). MDPI and/or the editor(s) disclaim responsibility for any injury to people or property resulting from any ideas, methods, instructions or products referred to in the content. |
© 2025 by the authors. Licensee MDPI, Basel, Switzerland. This article is an open access article distributed under the terms and conditions of the Creative Commons Attribution (CC BY) license (https://creativecommons.org/licenses/by/4.0/).