Article

Numerical Investigation of Fuel Cooling in Sudden Expansion Structures of Scramjet Engines

1
School of Chemical Engineering, Sichuan University, Chengdu 610065, China
2
Engineering Research Center of Combustion and Cooling for Aerospace Power, Ministry of Education, Sichuan University, Chengdu 610065, China
*
Author to whom correspondence should be addressed.
Aerospace 2025, 12(6), 456; https://doi.org/10.3390/aerospace12060456
Submission received: 28 April 2025 / Revised: 18 May 2025 / Accepted: 19 May 2025 / Published: 22 May 2025
(This article belongs to the Section Aeronautics)

Abstract

:
Local overheating in cavities seriously threatens the safe operation of scramjet engines. To investigate the formation mechanism and control methods of local overheating, this paper conducts numerical simulations on the cooling process of cavity sudden expansion (S-E) structures. A three-dimensional numerical model coupled with pyrolysis reactions is established and validated through experiments. The effects of thermal pyrolysis reactions and cooling channel parameters on flow distribution are analyzed, and comparative studies with different channel parameters are performed. The results show that S-E structures are prone to uneven fuel flow distribution, leading to local over-temperature phenomena, and thermal pyrolysis reactions will aggravate this phenomenon to a certain extent. Increasing the aspect ratio of the channel can enhance the pressure drop at the inlet of the S-E structure and improve the uniformity of flow distribution. When the aspect ratio increases from one to eight, the mass flow distribution deviation ϕm decreases from 0.954 to 0.181. More uniform flow distribution under a larger aspect ratio avoids local over-temperature in the S-E structure, and reduces the coking risk caused by local excessive pyrolysis. This work reveals the fundamental characteristics of cooling heat transfer in the S-E structure of Scramjet engines and can provide recommendations for the design of cooling channels.

1. Introduction

Supersonic Combustion Ramjet (Scramjet) can serve as the primary power system for air-breathing hypersonic vehicles, enabling the vehicles to achieve flight speeds greater than five times the speed of sound (Ma 5) within the atmosphere. For example, the X-43 and X-51 series technology demonstrators have achieved flight validation at Ma 5–7. As cruise missile engines, although their flight speed is lower than the terminal velocity of some ballistic missiles (Ma > 15), their high maneuverability within the atmosphere gives them strong penetration capability. On the other hand, Scramjet can be combined with turbine engines to form a Turbine-Based Combined Cycle (TBCC) Engine. This can enable a manned aircraft to achieve global reach within two hours, or horizontal takeoff and landing and single-stage orbital insertion. Therefore, Scramjet has attracted extensive attention and research [1,2,3,4,5,6]. When Scramjet flies at high speed, a severe thermal environment can affect the security and stability operation of the engine. Regenerative cooling using endothermic hydrocarbon fuel has been considered as an efficient cooling method [7,8,9,10,11,12]. In regenerative cooling designs, a fuel-cooled plate acts as a plate heat exchanger, and a number of internal mini cooling channels are involved. Both the nonuniformities of geometry and thermal boundary cause a flow maldistribution. A serious maldistribution may result in a high temperature, which destroys the thermal protection and structural safety of Scramjet engines. However, a reasonable distribution of fuel can avoid a local over temperature on engine walls, thereby improving the cooling effect. Hence, the flow distribution of the fuel-cooled plate is a key problem in Scramjet engines.
For a plate heat exchanger with multiparallel channels, the flow distribution in it has garnered significant attention for a long time. Researchers have proposed feasible design schemes for flow distributions. The manifold structure [13,14,15,16] is a key structure for this problem. Enlarging the cross-sectional area of the distribution manifold, varying the cross-sectional areas of the outflow channels, and tapering the cross-sectional area of the distribution manifold will yield positive results [13]. The tree structure [17,18], baffles [19,20,21], and U-type header [22,23] positively affect the flow distribution. In addition, the channel configuration design is another method to improve the flow distribution [24,25]. All the strategies above attempt to balance the resistance encountered by the incoming flow. In the regenerative cooling of Scramjet engines, considering a limited quantity of fuel on board, an additional chemical heat sink of endothermic hydrocarbon fuel is used to increase the cooling capacity. Compared with conventional fluids, the flow distribution of hydrocarbon fuel is different. To avoid system instability caused by fuel phase change, the operational pressure in channels is maintained at the supercritical condition [26]. The coupled relation between the reactions and thermal physical properties make the flow distribution and heat transfer more complicated.
Recently, the fuel flow distribution in multichannels has been investigated by many researchers. Qin et al. indicated that density deviation was the key reason of mass flow rate maldistribution, and deviation amplification mechanisms were found at the pseudocritical and pyrolysis states of hydrocarbon fuel [27,28]. Chen et al. [29] proposed parallel channels controlled by an orifice with choked flow maintaining a uniform flow distribution under a high heat flux. The throttle structure at the inlet of each branch channel could restrain the difference in mass flow rate effectively and avoid local overheating [30,31]. Moreover, the geometry parameters of fuel-cooled plates significantly affected the flow distribution and hence the cooling effect. The effect of geometry parameters on the flow rate distribution has been studied, including the cross-section shapes [32], aspect ratio, rib thickness, and branch channel flow area [33,34]. An applicable control design has been proposed and validated, in which the channel sectional area decreased in a low-temperature zone and increased in a high-temperature zone [35].
Most flow distributions in fuel-cooled plates were based on parallel geometric models with multiple channels. However, as shown in Figure 1, the model of a Scramjet combustor typically exhibits a cavity structure [35], which can assist ignition and stabilize combustion flames. Owing to the cavity structure, the fuel-cooled plate at the side exhibits a suddenly expanded (S-E) structure. Flow maldistribution occurs easily in a S-E structure. In addition, most of the studies on the flow distribution in fuel-cooled plates have neglected the pyrolysis reaction of fuel. Although the cracking reaction of fuel is important to improve the cooling capacity, the thermal cracking reaction complicates the compositional properties of the fuel, thereby further increasing the risk of the flow maldistribution of the fuel-cooled plate. For studying the flow distribution in a S-E structure, the fuel thermal cracking reaction should not be neglected.
In this study, a three-dimensional model for a S-E structure fuel-cooled plate with n-decane considering thermal cracking reactions under a supercritical pressure was established. Subsequently, the model was used to analyze the effects of the thermal cracking reaction of flue and AR of cooling channels on flow distribution.

2. Model Description

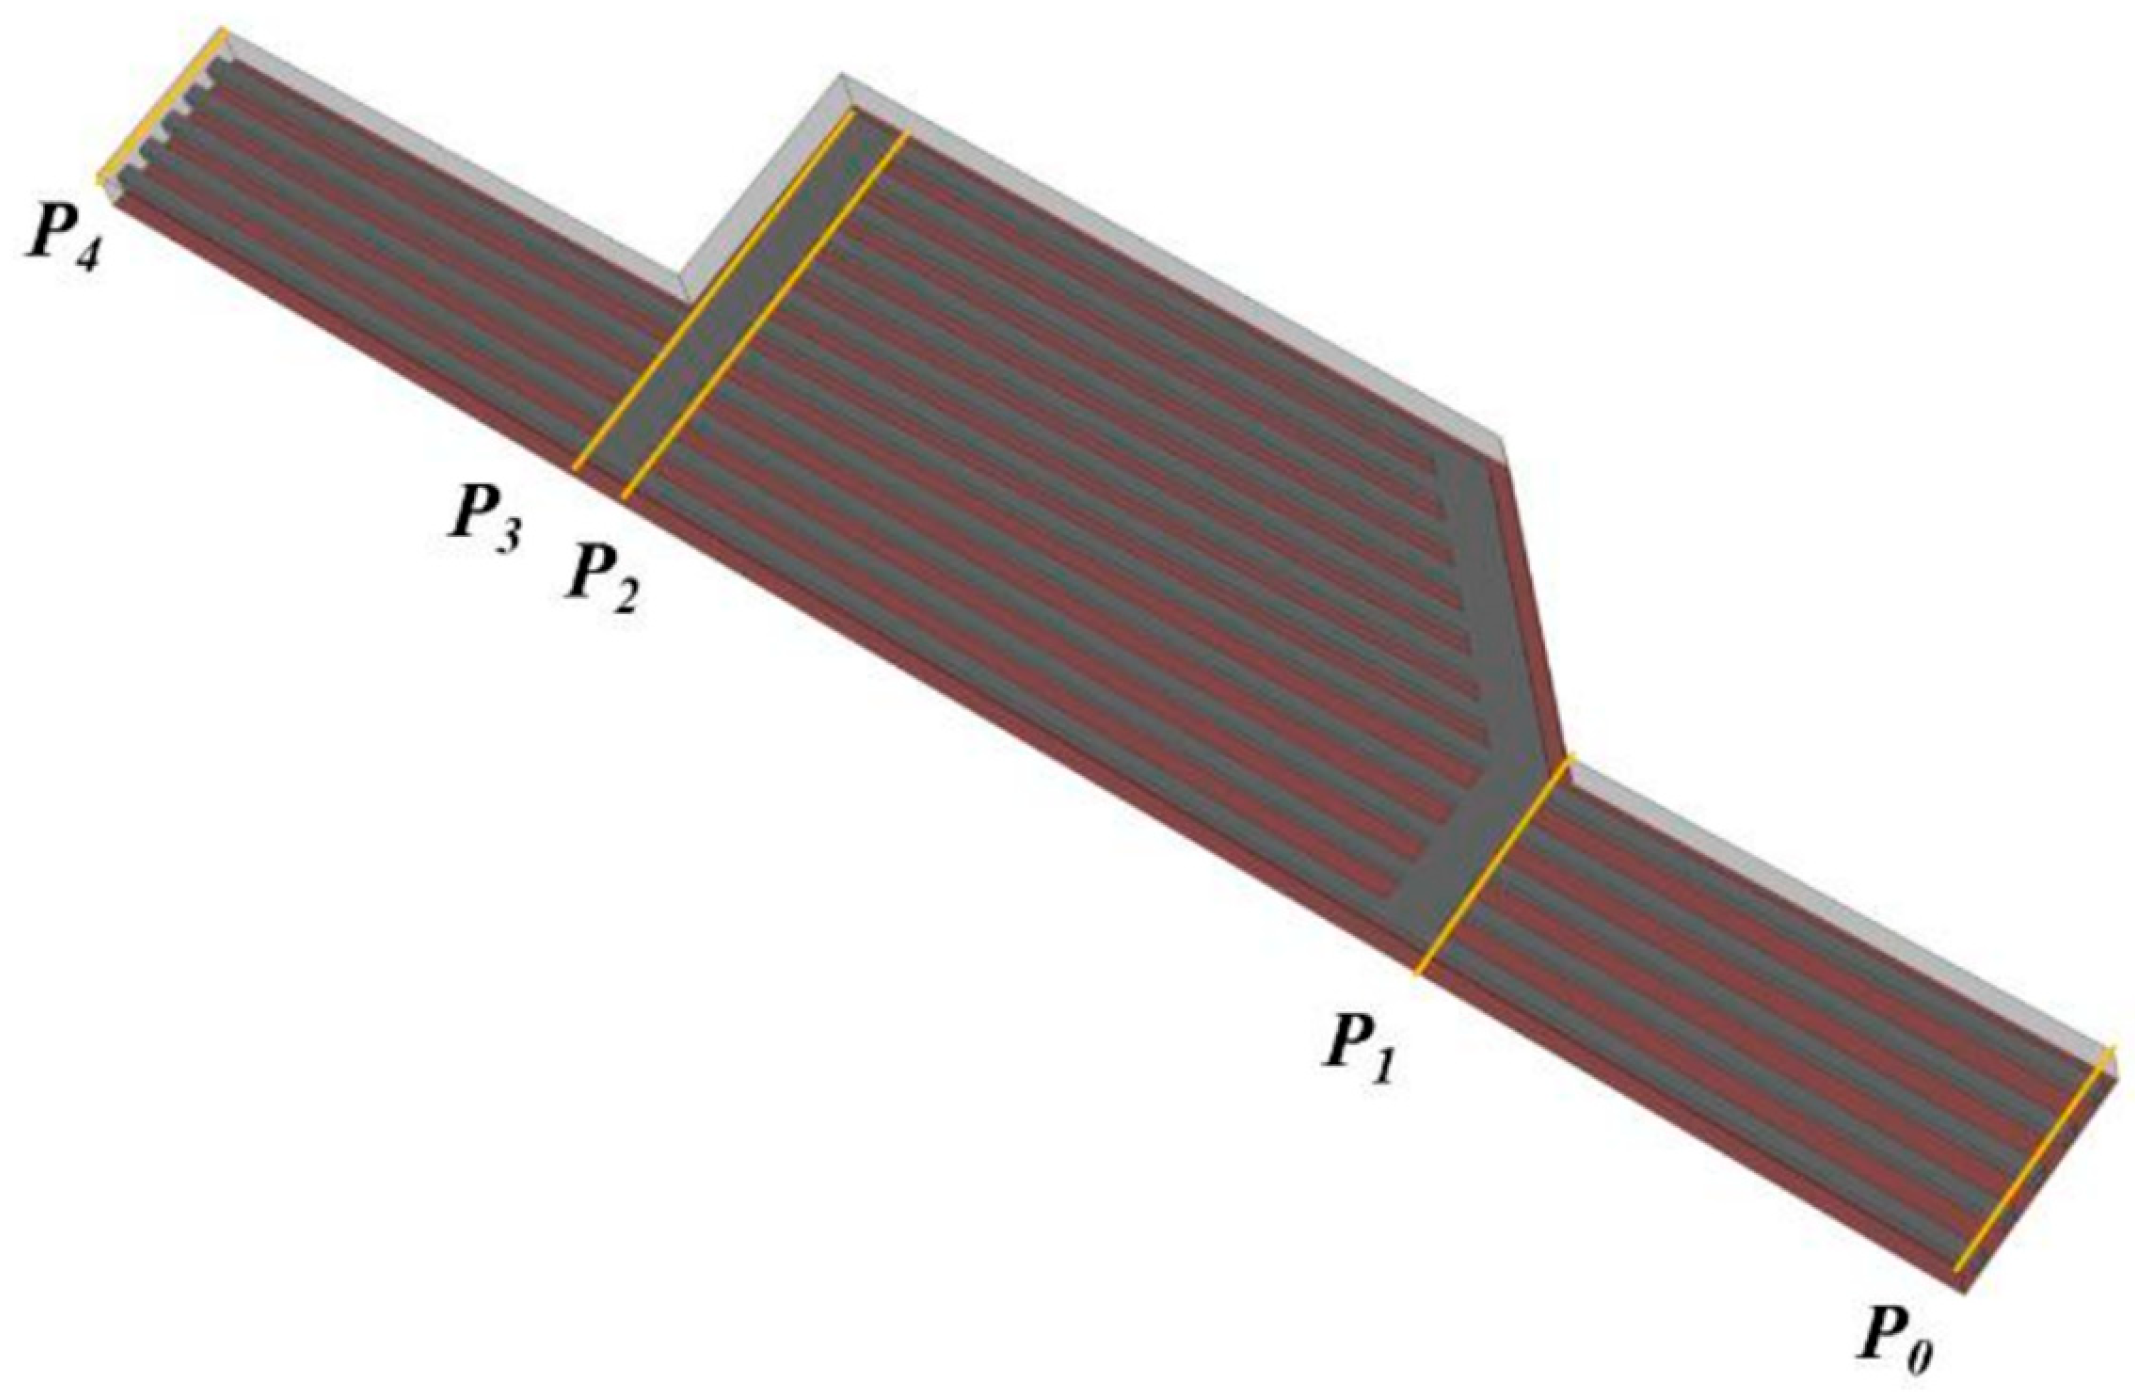
2.1. Geometry Model and Thermal Environment

The schematics of the fuel-cooled plate with a suddenly expanded structure in the Scramjet reported in Refs. [36,37] is shown in Figure 1. The fuel-cooled plate comprises four zones, as shown in Figure 1B. The fuel distribution chamber was set as a connection (Figure 1C); the width, W, was set to be 5 mm.
The cross-section of the cooling channels is described by the channel width (la), channel height (lb), rib thickness (tw), heated wall thickness (Sw = 1 mm), and total height (H = 5 mm) of the fuel-cooled plate. Geometry parameters with different ARs are listed in Table 1.
To perform an AR study on the flow distribution, a rational principle of the parameter configuration was required. In this study, the flow rate was assumed to be uniform in Zone 1. Each channel inlet had the same mass flow rate ms.
The AR can be calculated as follows:
AR = l b / l a
The width of the fuel-cooled plate at the inlet section is constant:
n c l a + ( n c + 1 ) t w = 13.5   mm
The total mass flow rate mf was set to 10.0 g/s and maintained:
m f = n c m s = 10.0   g / s
Owing to the divergence angle in the Scramjet combustion chamber, the cooling channels were not parallel, resulting in a nonconstant tw.
Wall heat transfer occurred by conduction from the nearby boundary layer gas, a process loosely referred to as convective heat transfer because it was strongly coupled to the overall motion of the coolant [38]. The convective heat transfer from the burning gas was absorbed by the fuel that flowed in the cooling channels. Currently, the majority of numerical simulation studies utilize constant heat flux boundary conditions (type-II B.C.), which inherently fail to account for the thermal coupling characteristics between the combustion chamber and cooling structures. In order to simulate the characteristics of the variation in heat flux with different structures, the convection thermal boundary condition (type-III B.C.) was adopted on the heated wall in this work. According to the reference enthalpy theory [39], the type-III BC (Boundary Condition) can be expressed by the following equation:
q w = h G ( T a w T w , s )
where Taw is the adiabatic wall temperature, which represents the surface temperature of the wall heated by the gas under adiabatic conditions; hG is the heat transfer coefficient. These two values are predefined parameters that constitute the type-III B.C. The heat flux density qw and the cooled wall temperature Tw,s are the variables to be determined, which need to be calculated through iterative computations. According to the estimation in Reference [2], the Taw and hG of the combustor wall at Mach 7 flight condition are taken as 3050 K and 535 W/m2K, respectively, which are also adopted in this work.
N-decane was selected as the fuel coolant for this study because it is a typically pure liquid hydrocarbon fuel and its properties are similar to hydrocarbon fuel used in Scramjet engines. The critical temperature and critical pressure of n-decane are 617.7 K and 2.11 MPa, respectively. The significant thermal cracking of n-decane will occur at temperatures above 800 K [40]. In this work, a 16-species 26-step reaction model is adopted to describe the pyrolysis reaction process of n-decane [41,42], as shown in Table 2. Here, k denotes the pre-exponential factor, and Ea represents the activation energy.
The supercritical fuel density can be predicted using the Peng–Robinson equation owing to its wide-range validity [43].
P = R T V b a V 2 + 2 b V b 2
where R is the universal gas constant, and V is the mole volume. The coefficients a and b can be calculated by the following equations:
a = a 0 1 + n 1 T / T c 0.5 2
a 0 = 0.457247 R 2 T c 2 / P c
n = 0.37464 + 1.54226 ω 0.26992 ω 2
b = 0.07780 R T c / P c
where Tc and Pc are the critical temperature and pressure, respectively; ω is the acentric factor.
Additionally, Cpm and Cvm are constant-pressure specific heat and constant-volume specific heat, respectively, which can be calculated as follows:
C p m = C p m , i d e a l R + C v m , d e p T V T 2 P V
C v m = C p m , i d e a l R C v m , d e p
C v m , d e p = T 2 a T 2 2 2 b ln V + b + 2 b V + b 2 b
C p m , i d e a l R = a 1 + a 2 T + a 3 T 2 + a 4 T 3 + a 5 T 4
where the a1a5 are coefficients.
The viscosity and thermal conductivity of the fuel were calculated through the method proposed by Chung et al. [44]. Simultaneously, the solid material was GH3128, of which the thermal conductivity was calculated via a function of temperature.
In the cooling channel, the flow and heat transfer behavior of n-decane was analyzed in a three-dimensional steady state. The SST (Shear Stress Transport) k-ω turbulence model was employed [45]. The conservation equations of mass, momentum, energy, and species can be expressed as follows:
ρ t + ( ρ u ) = 0
ρ u t + ρ u u = p + τ ¯ ¯
ρ H t + u ρ h + p = λ e f f T + τ ¯ ¯ u
( ρ Y i ) t + ( ρ u Y i ) = ( ρ D i Y i ) + ω i
where ρ, u, P, and e denote the density, velocity, pressure, and internal energy of fuel, respectively; Yi and ωi denote the mass fraction and net generation rate of every species, respectively. In the solid region, the energy transport equation without an internal heat source was established.
ρ c T t λ s T = 0
The commercial software ANSYS 15.0 FLUENT was used to obtain the solution of the governing equations. The numerical solution employed a pressure-based solver, and the SIMPLE (Semi-Implicit Method for Pressure Linked Equations) pressure correction algorithm was used to solve the low-speed flow field. All the thermophysical properties were calculated with an in-house Fortran77 code and linked to Fluent software by user define function (UDF). The operating pressure was set to 4 MPa. The type-III thermal boundary condition was used on the heated wall, while other walls were set as adiabatic. Mass flow inlet and pressure outlet conditions were used for the inlet and outlet boundary conditions, respectively, and the inlet temperature was set to 773 K.

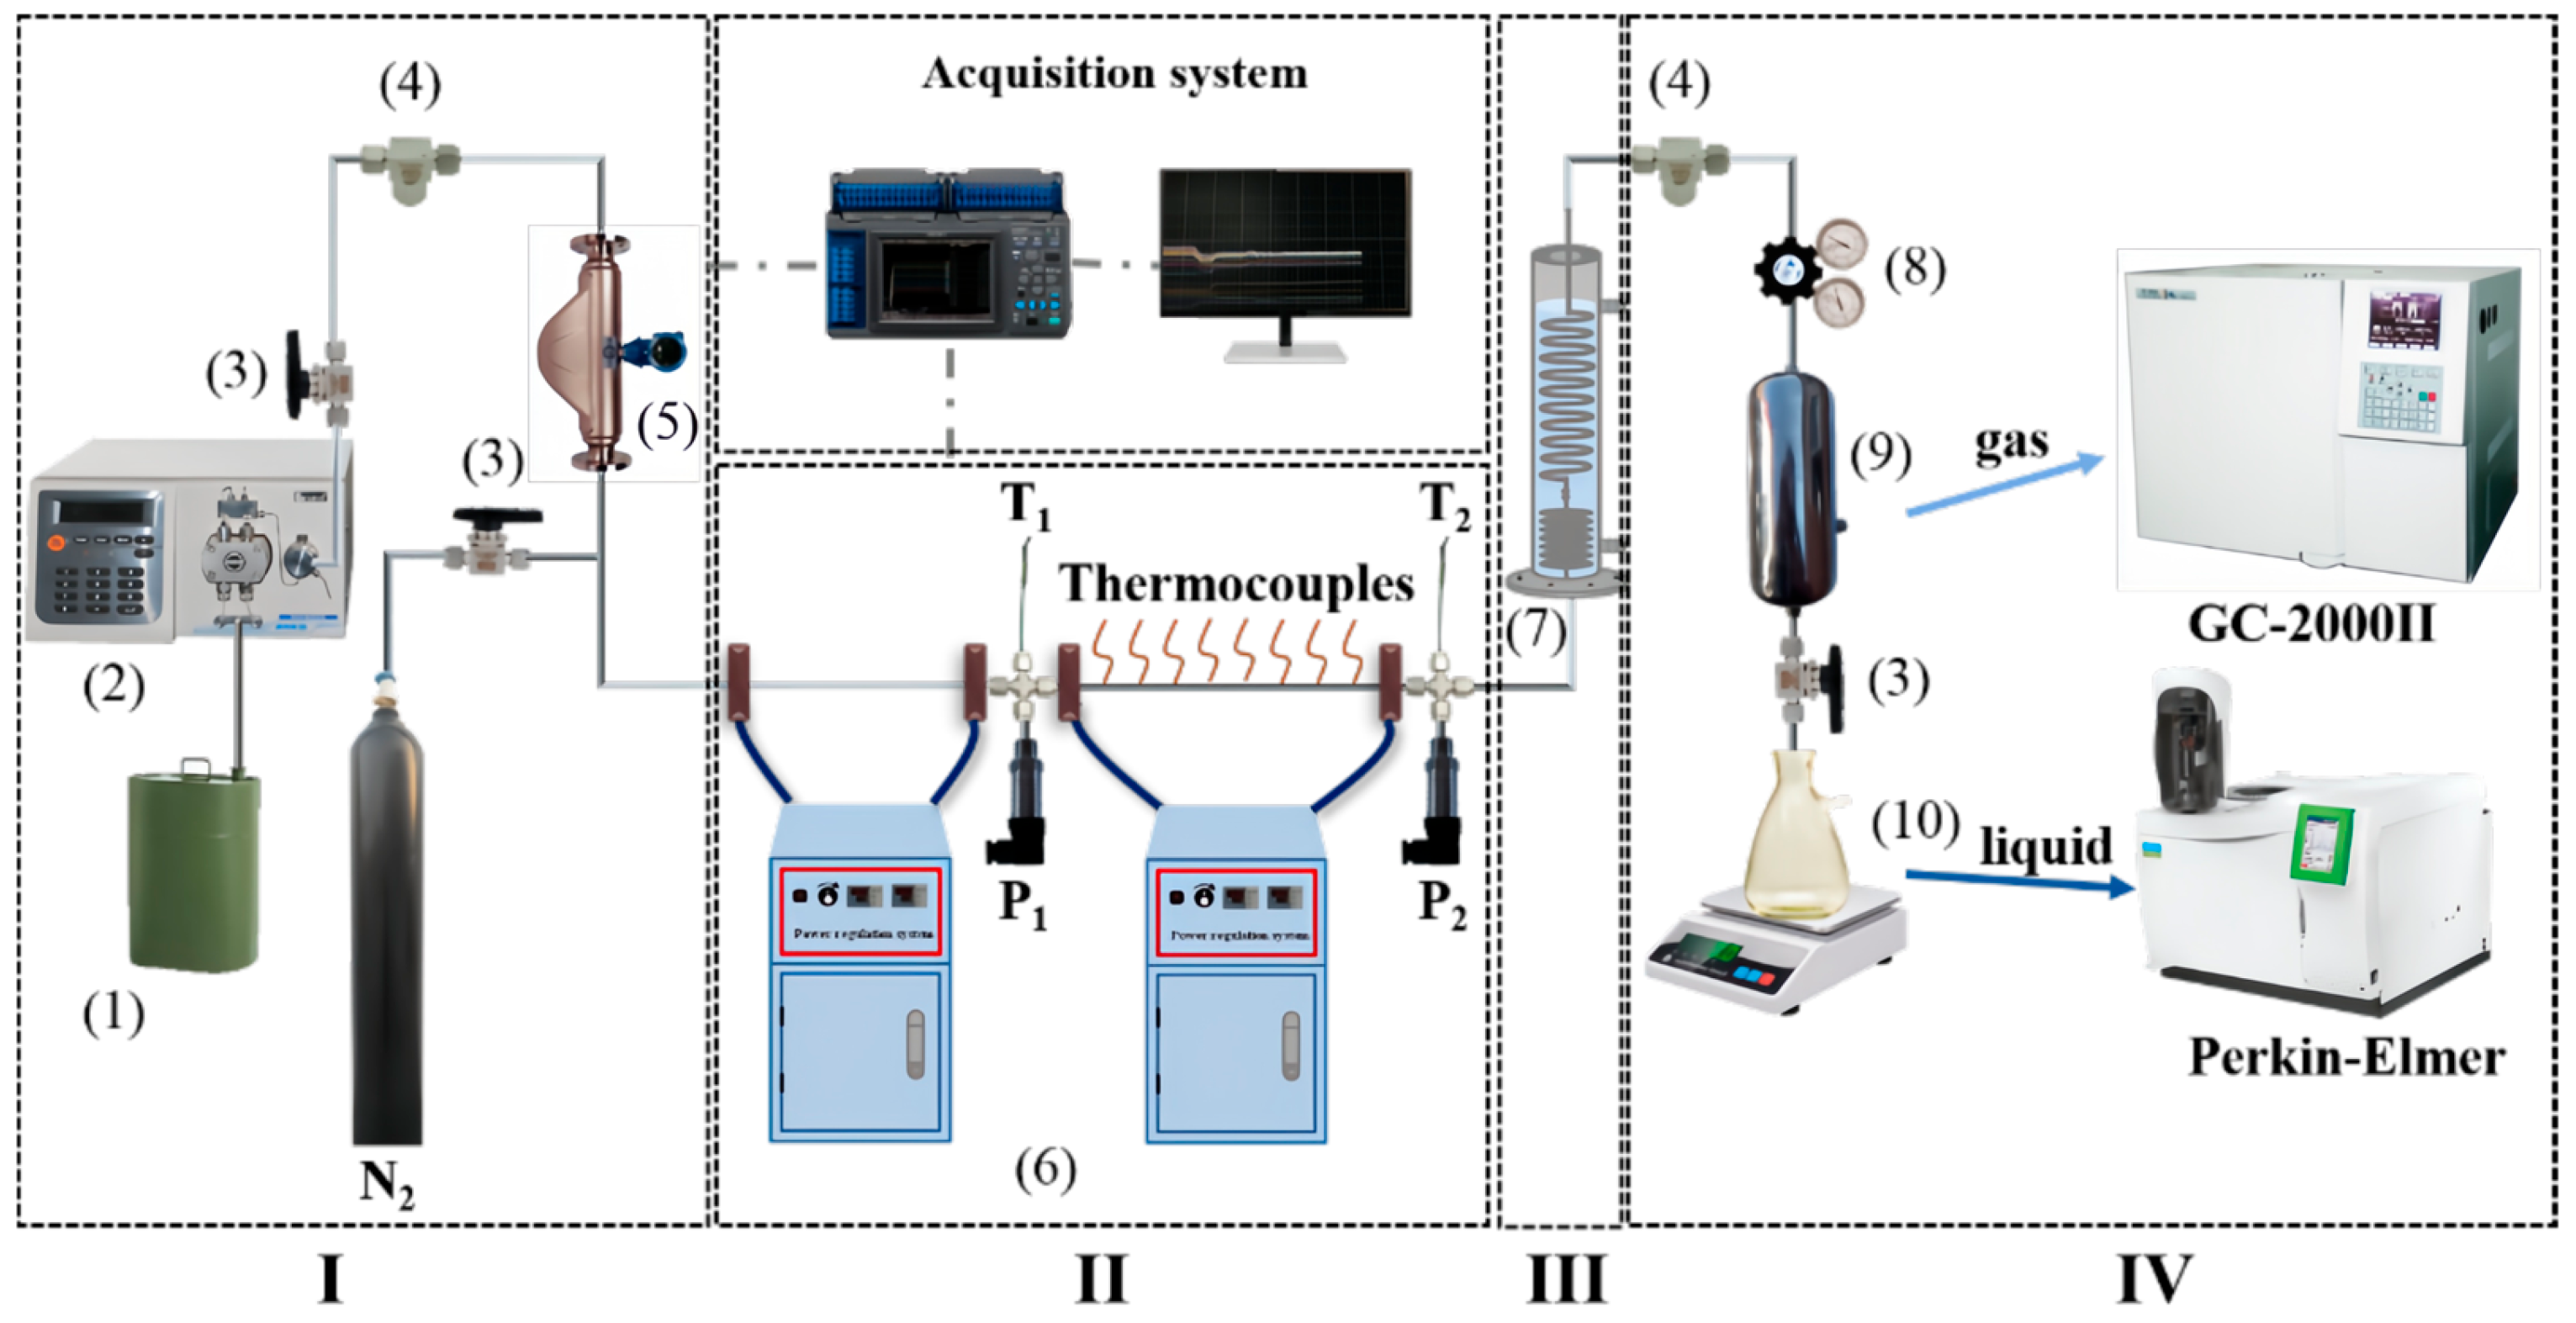
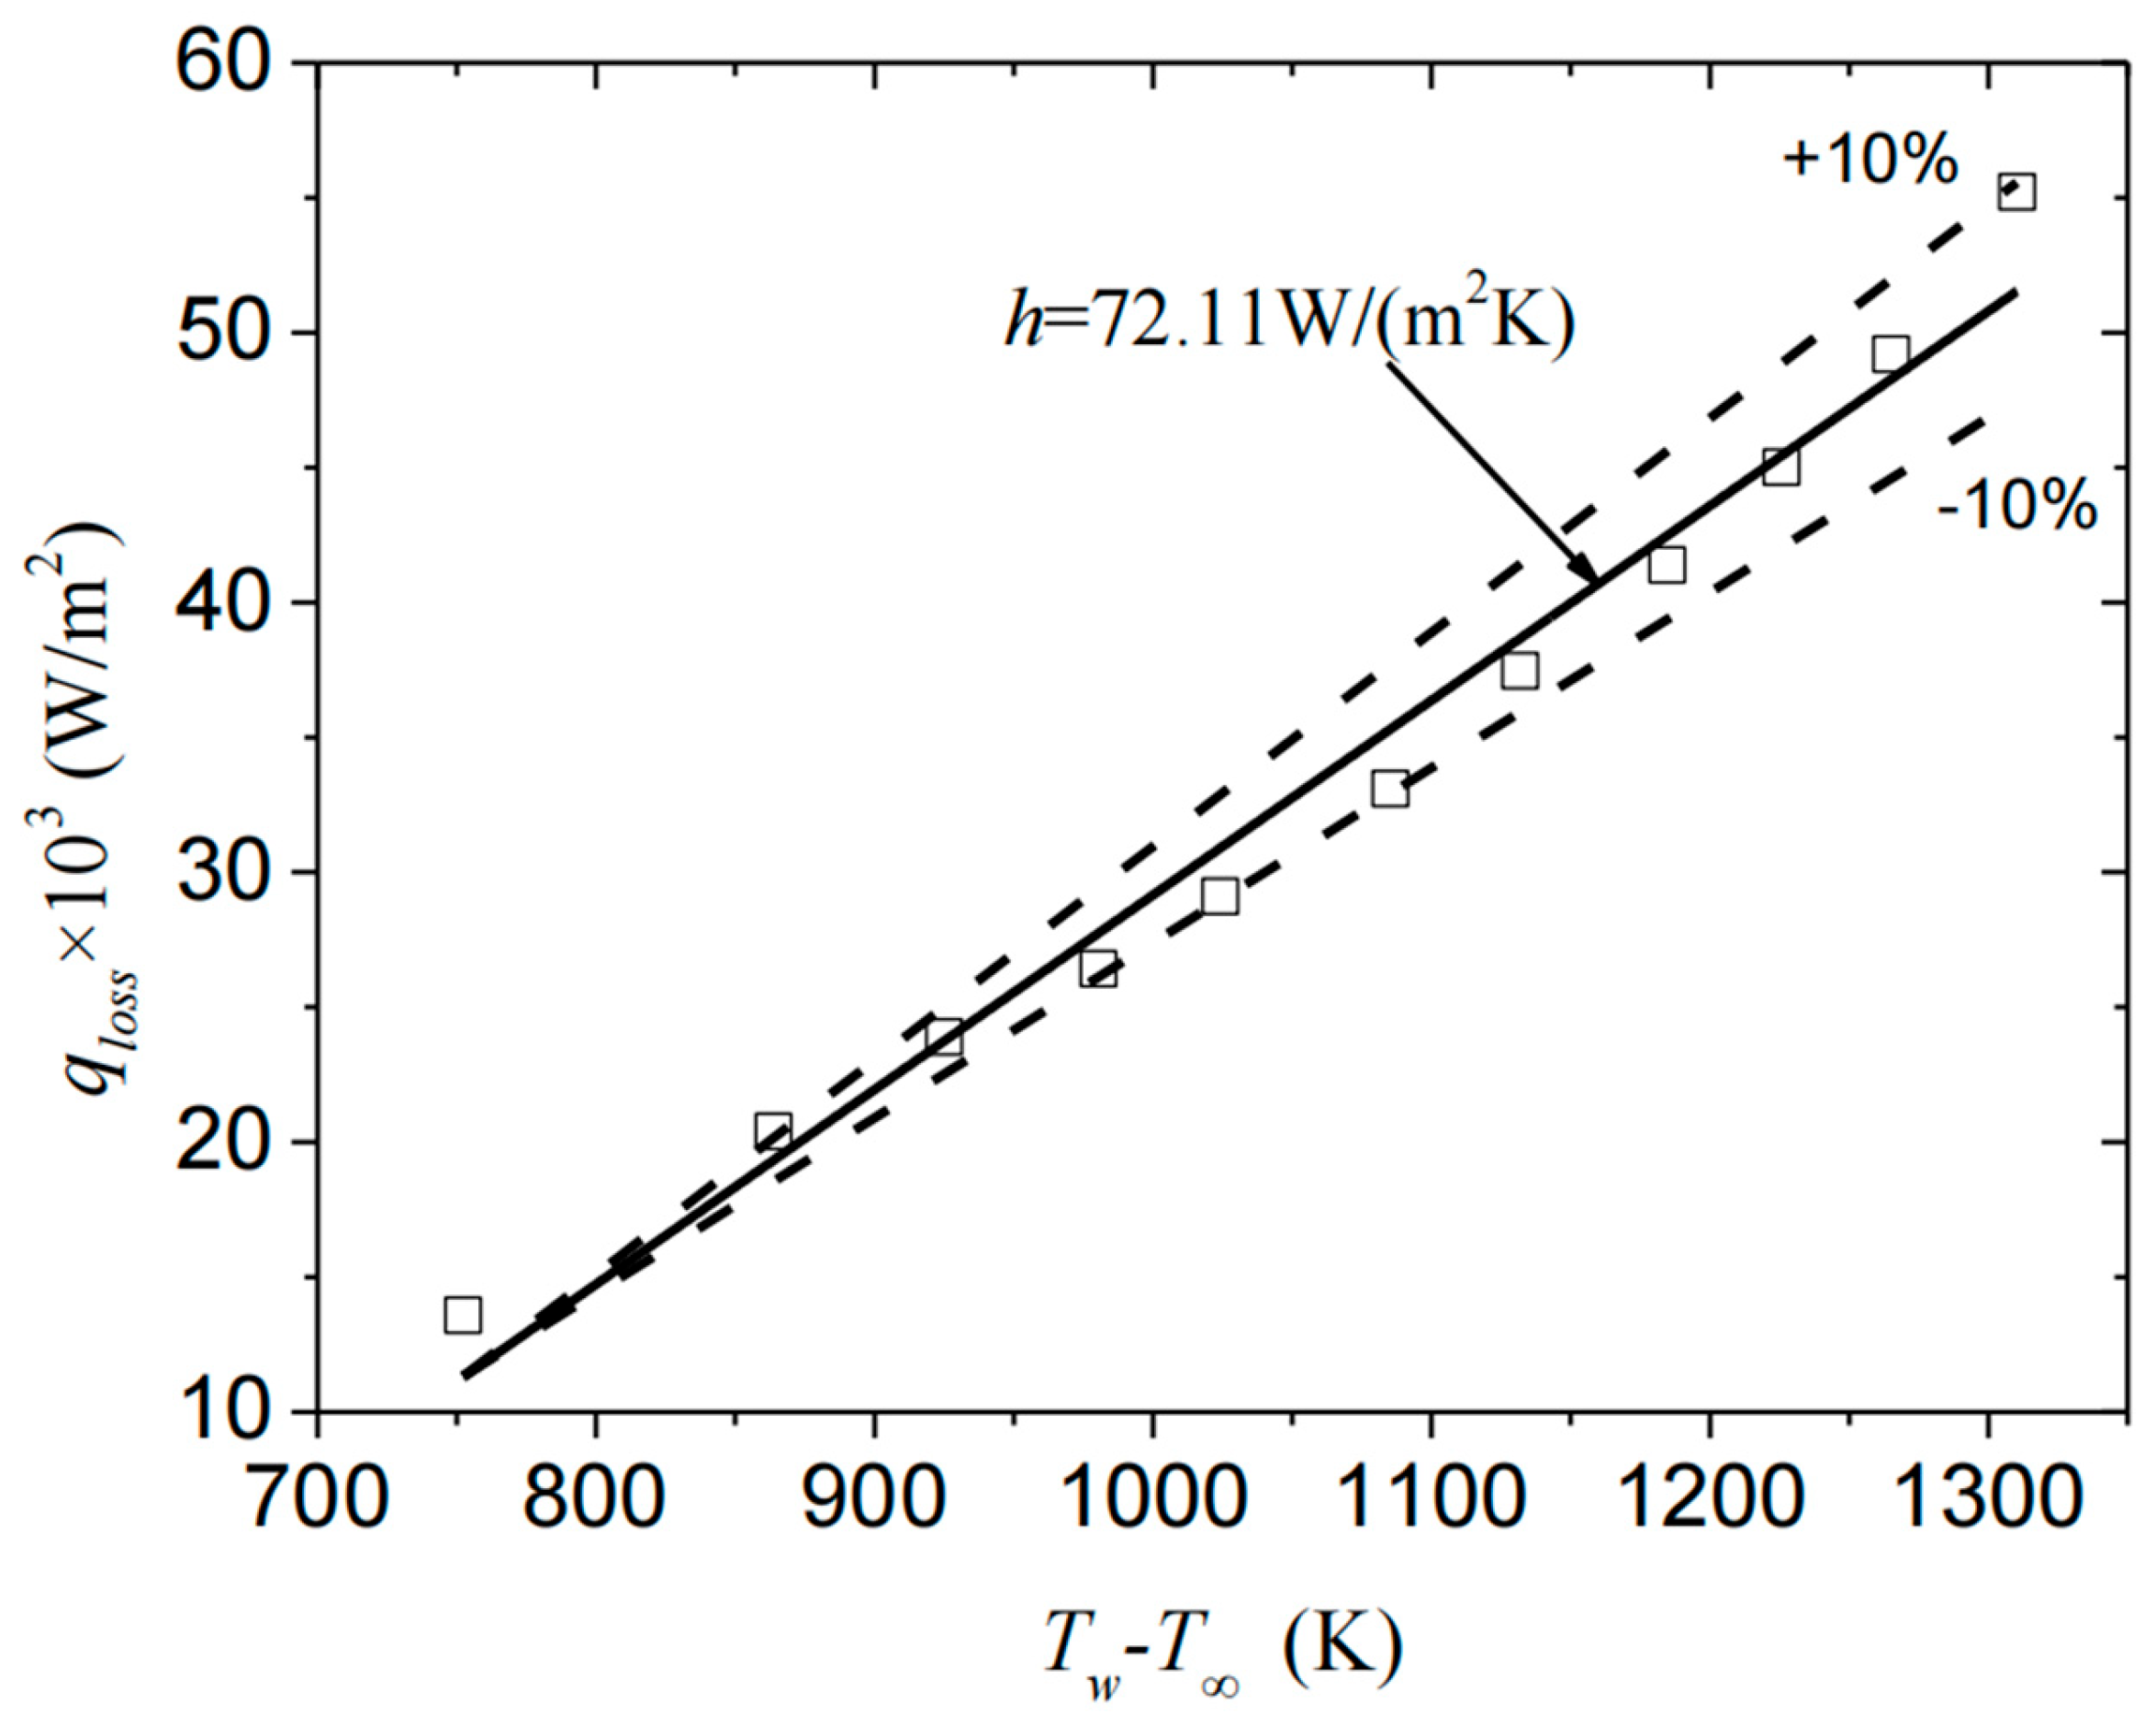
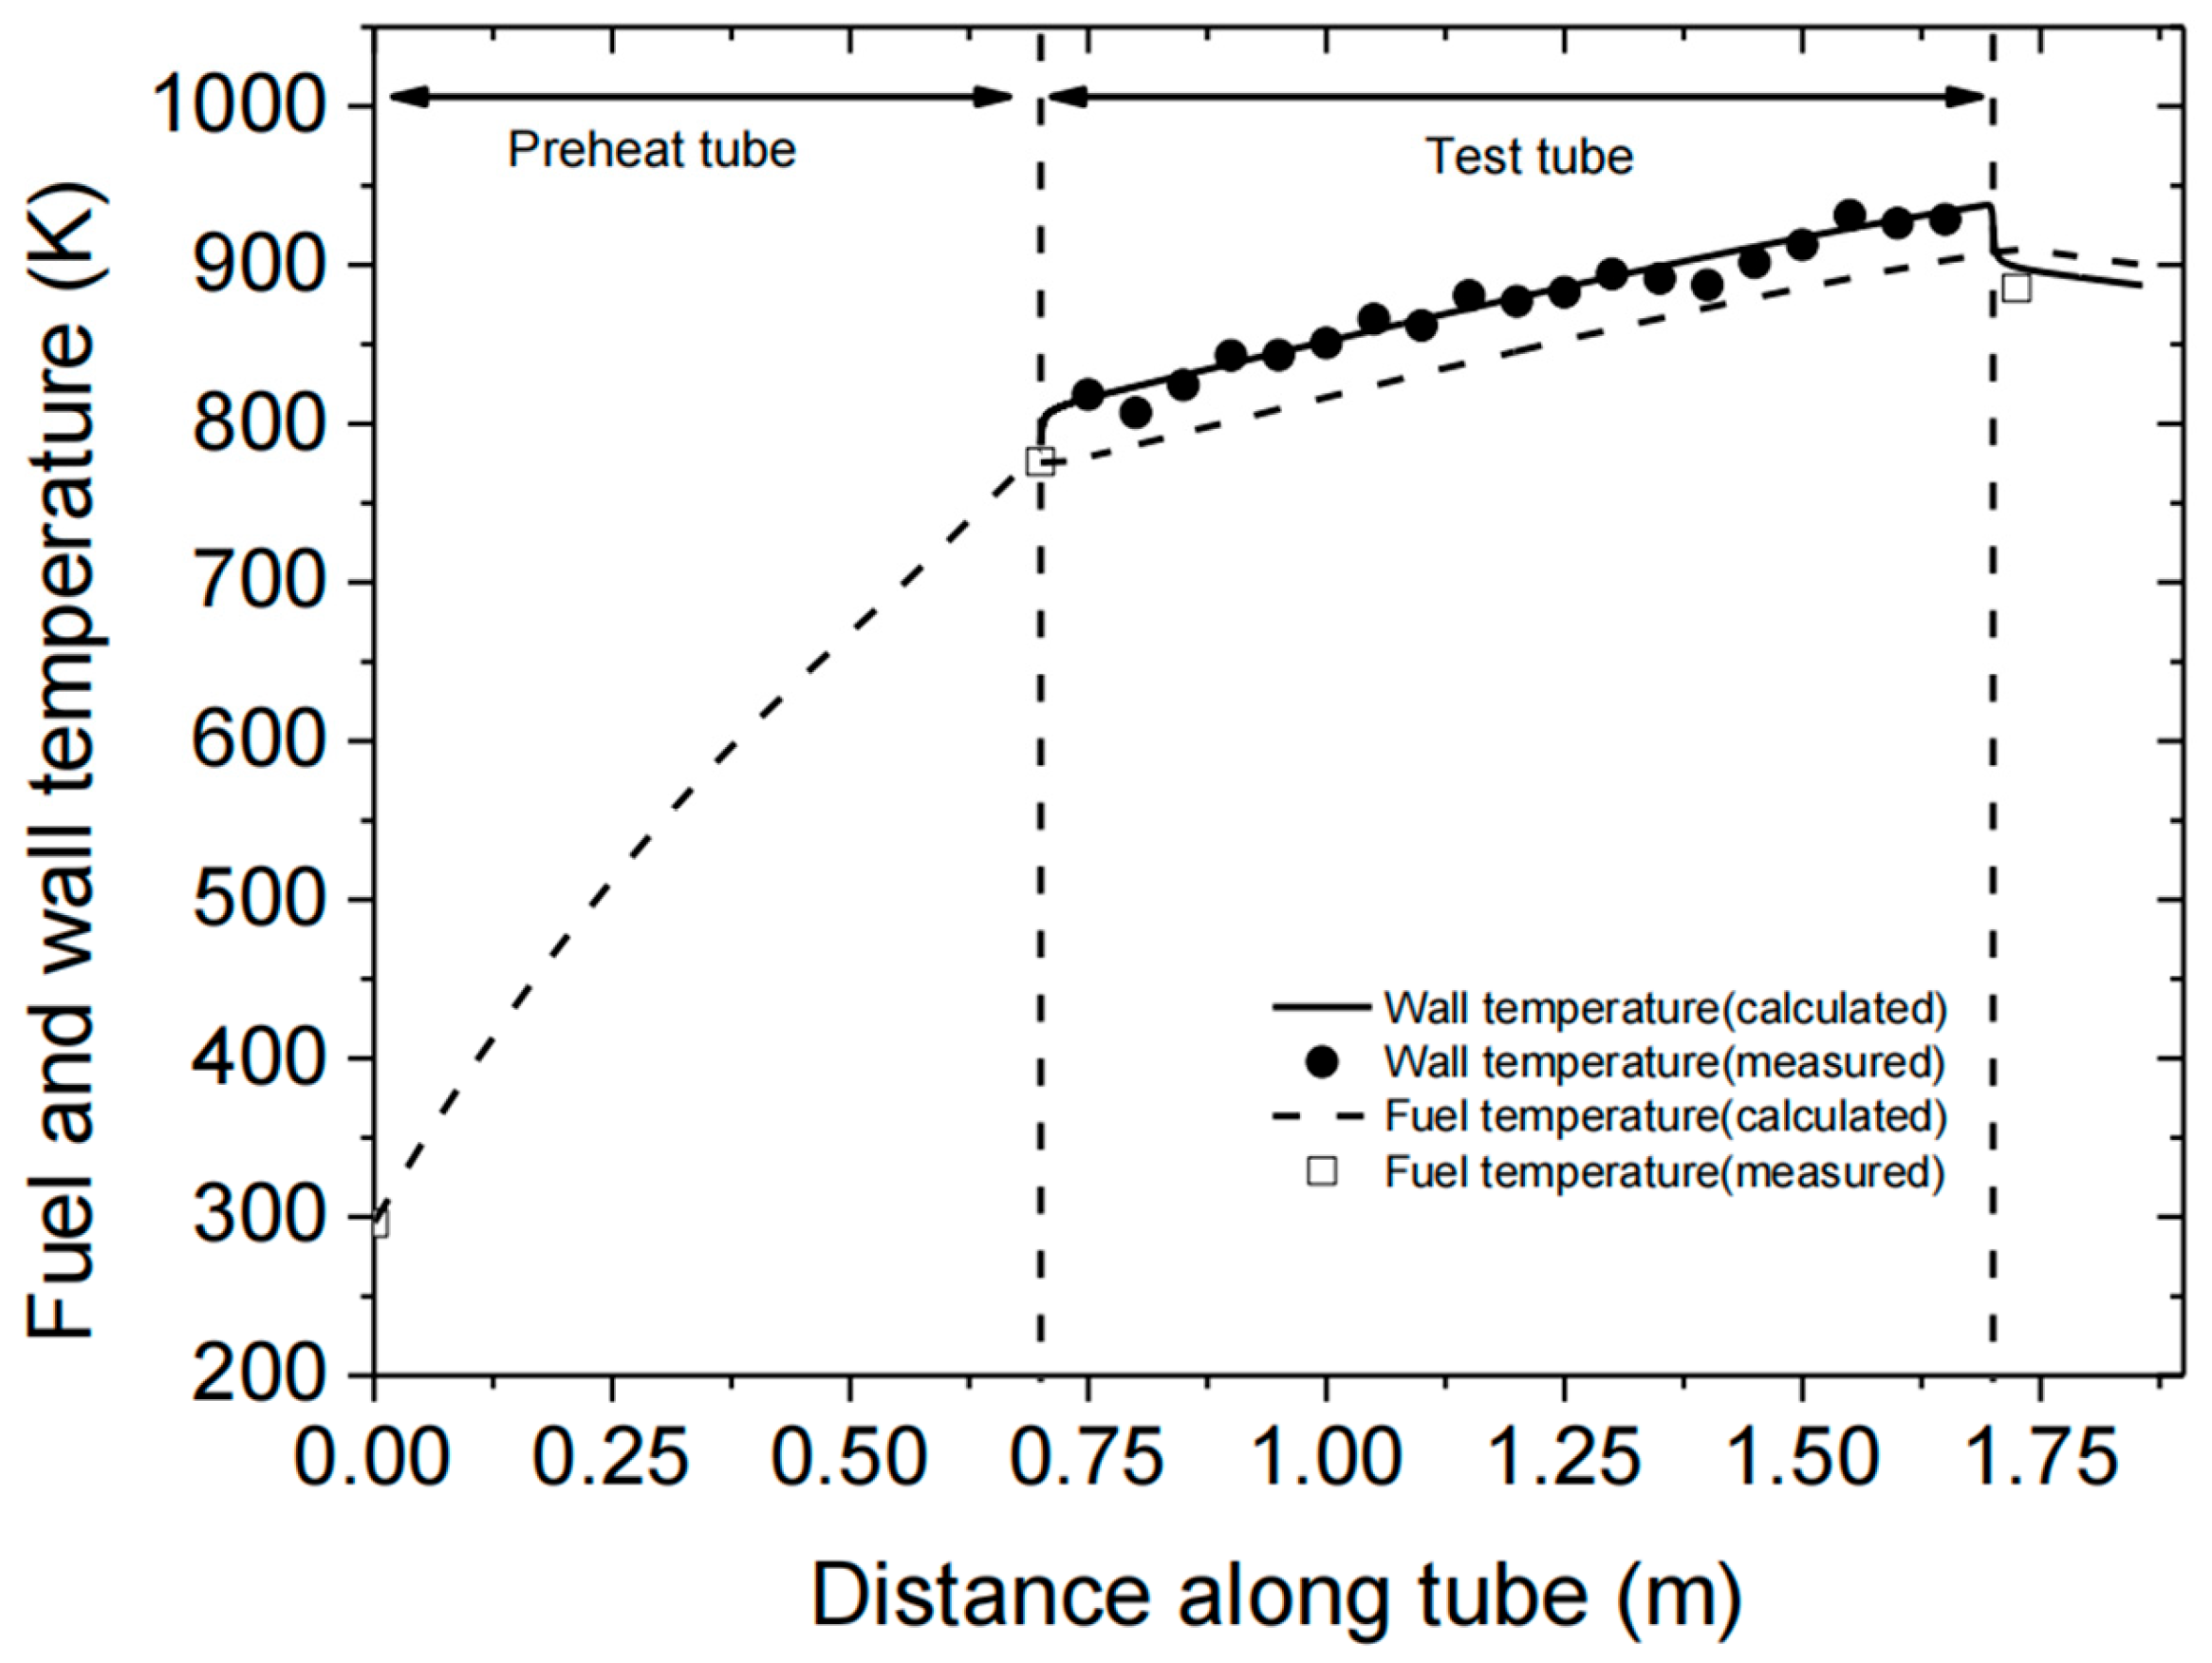
2.2. Validation of the Numerical Model

It is difficult to perform a one-sided heating experiment that precisely controls the type-III thermal boundary condition. Therefore, a series of electric heating experiments were performed to validate the reliabilities of the thermal cracking, turbulent, and thermal property calculation models by comparing the simulated results with the experimental results.
The experimental apparatus comprised four parts: a feeding system, test section, cooling system, and sampling and analysis system, which are shown in Figure 2. In the feeding system, the pump was a constant-flux pump providing a constant and continuous flow. The preheater and test sections were two pipes measuring 700 and 1000 mm in length, 2 mm in inner diameter, and 3 mm in outer diameter. The tube reactor was heated by resistive heating. The fuel temperature was measured using K-type sheathed thermocouples. The surface temperature of the reactor was measured using K-type thermocouples welded on the tube at 5 mm intervals. Gas and liquid products were quantified and identified using PerkinElmer GC Clarus 680. The manufacturer of the PerkinElmer GC Clarus 680 is PerkinElmer, Inc., with its headquarters located in Waltham, MA, USA.
The heat loss of the test section was measured and calibrated before the thermal cracking experiments. The heat loss, which depends on the outer wall temperature, can be calculated as follows:
q l o s s = h ( T w T )
where Tw is the surface temperature of the tube reactor, and T is the temperature at infinity, which can be the ambient temperature. The value of qloss can be obtained experimentally. The heat loss under different temperatures is shown in Figure 3. As shown, h can be considered as a constant.
The operating conditions of the experiments used to validate the model are shown in Table 3. The experimental back pressure was 4 MPa. As shown in Figure 4, the computational model was modeled in two-dimensional asymmetric domains, including the inlet section, test section, and connection pipe. The inlet section was used to obtain a fully developed flow, and the connection pipe was used to consider the cracking reaction of n-decane before being cooled. The “mass-flow-inlet” and “pressure-outlet” conditions were used for the inlet and outlet boundary conditions, respectively. The outer wall of the test section was set as a convection boundary to account for heat loss. Four experimental cases and simulated results are shown in Table 3.
The comparison results of the mass fraction of n-decane at the outlet of the connection pipe between the simulation and experimental results are shown in Table 3. The conversion rate is defined as the mass fraction of n-decane undergoing pyrolysis. The maximum deviation of the outlet temperature is 29 K, and the maximum deviation of the conversion rate is 32.54%. The fuel and wall temperatures along the tube and connection pipe were obtained in case Run 1. As shown in Figure 5, the calculated wall temperature showed an excellent match with the experimental data, and the absolute error was lower than 20 K. The comparison results show that the numerical model can well predict the fuel temperature and wall temperature; the relative error for predicting mass fraction of fuel is acceptable yet. The model’s ability to predict the flow and heat transfer of hydrocarbon fuel under a supercritical pressure was validated.

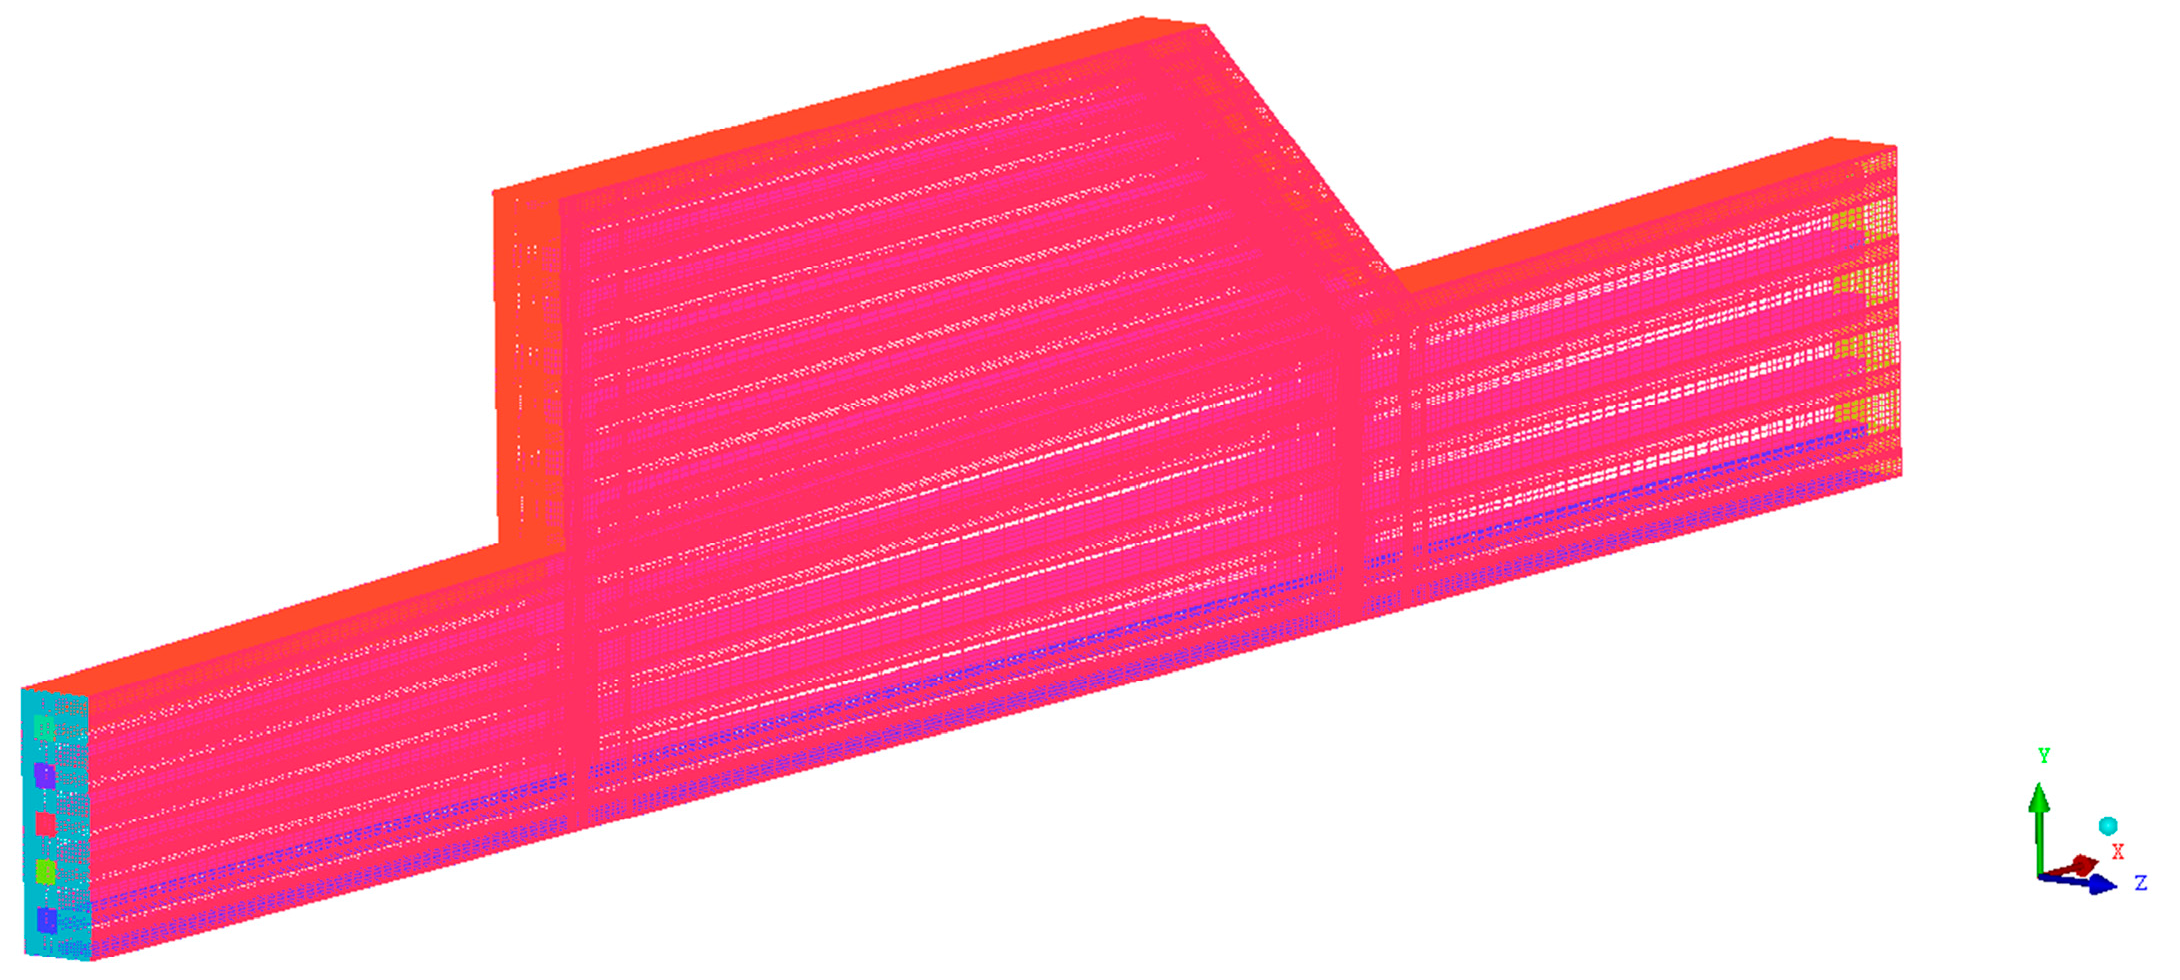
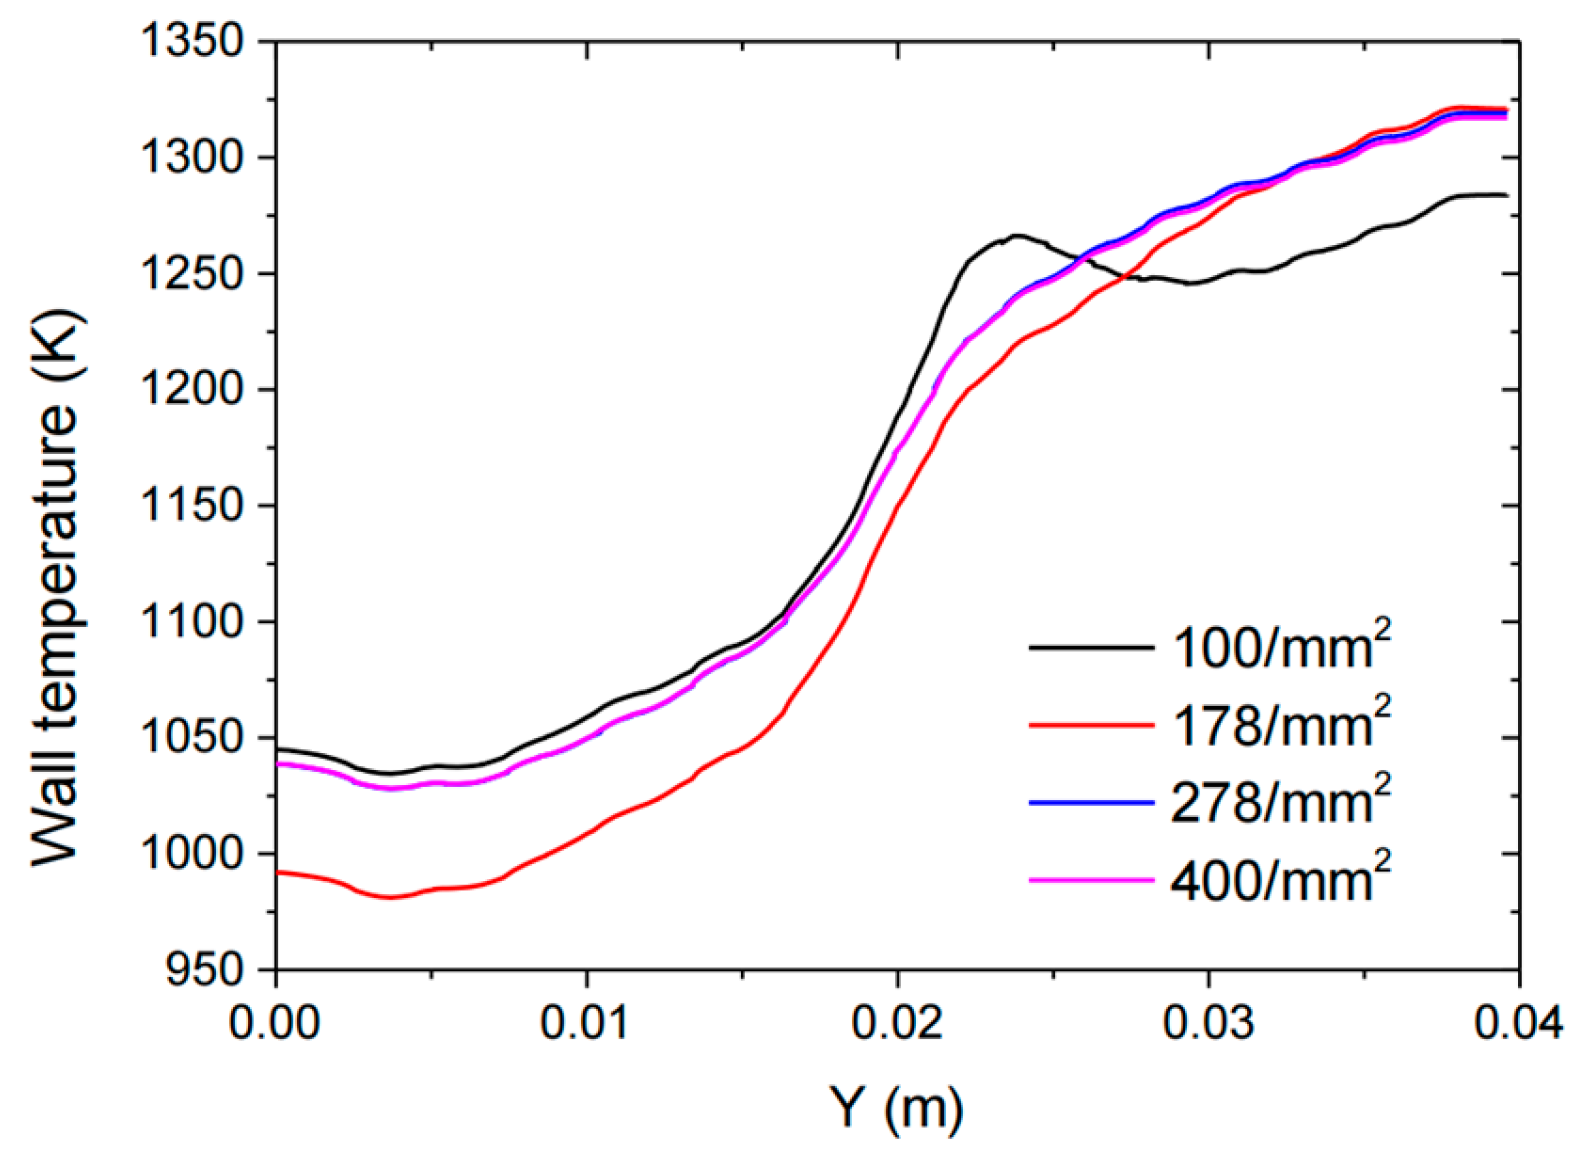
2.3. Grid Convergence

Structured grids were constructed using ICEM-CFD (ANSYS, Inc., Canonsburg, PA, USA, Version 2021 R1). The test case of AR2 was used in the grid-independence study. The structured mesh of the fuel-cooled plate is shown in Figure 6. To ensure the calculation accuracy of the boundary layer, the grid thickness of the first row near the wall region in the fluid domain was set to 0.003 mm, and in all the main regions of the inner wall surface of the cooling channel, the y+ were maintained less than 1. The node density is defined as the ratio of the number of cross-sectional node difference to the area in a single cooling channel.
N D = n n o d e s A s i n g l e
Four cases with different numbers of ND were used to obtain the results. The ND number changed from 100 to 400. The temperature of Line 1 of the heated wall was monitored. As shown in Figure 7, the value of ND = 278/mm2 is sufficient for the requirement. For others, the value of ND is larger than 278/mm2.

3. Results and Discussion

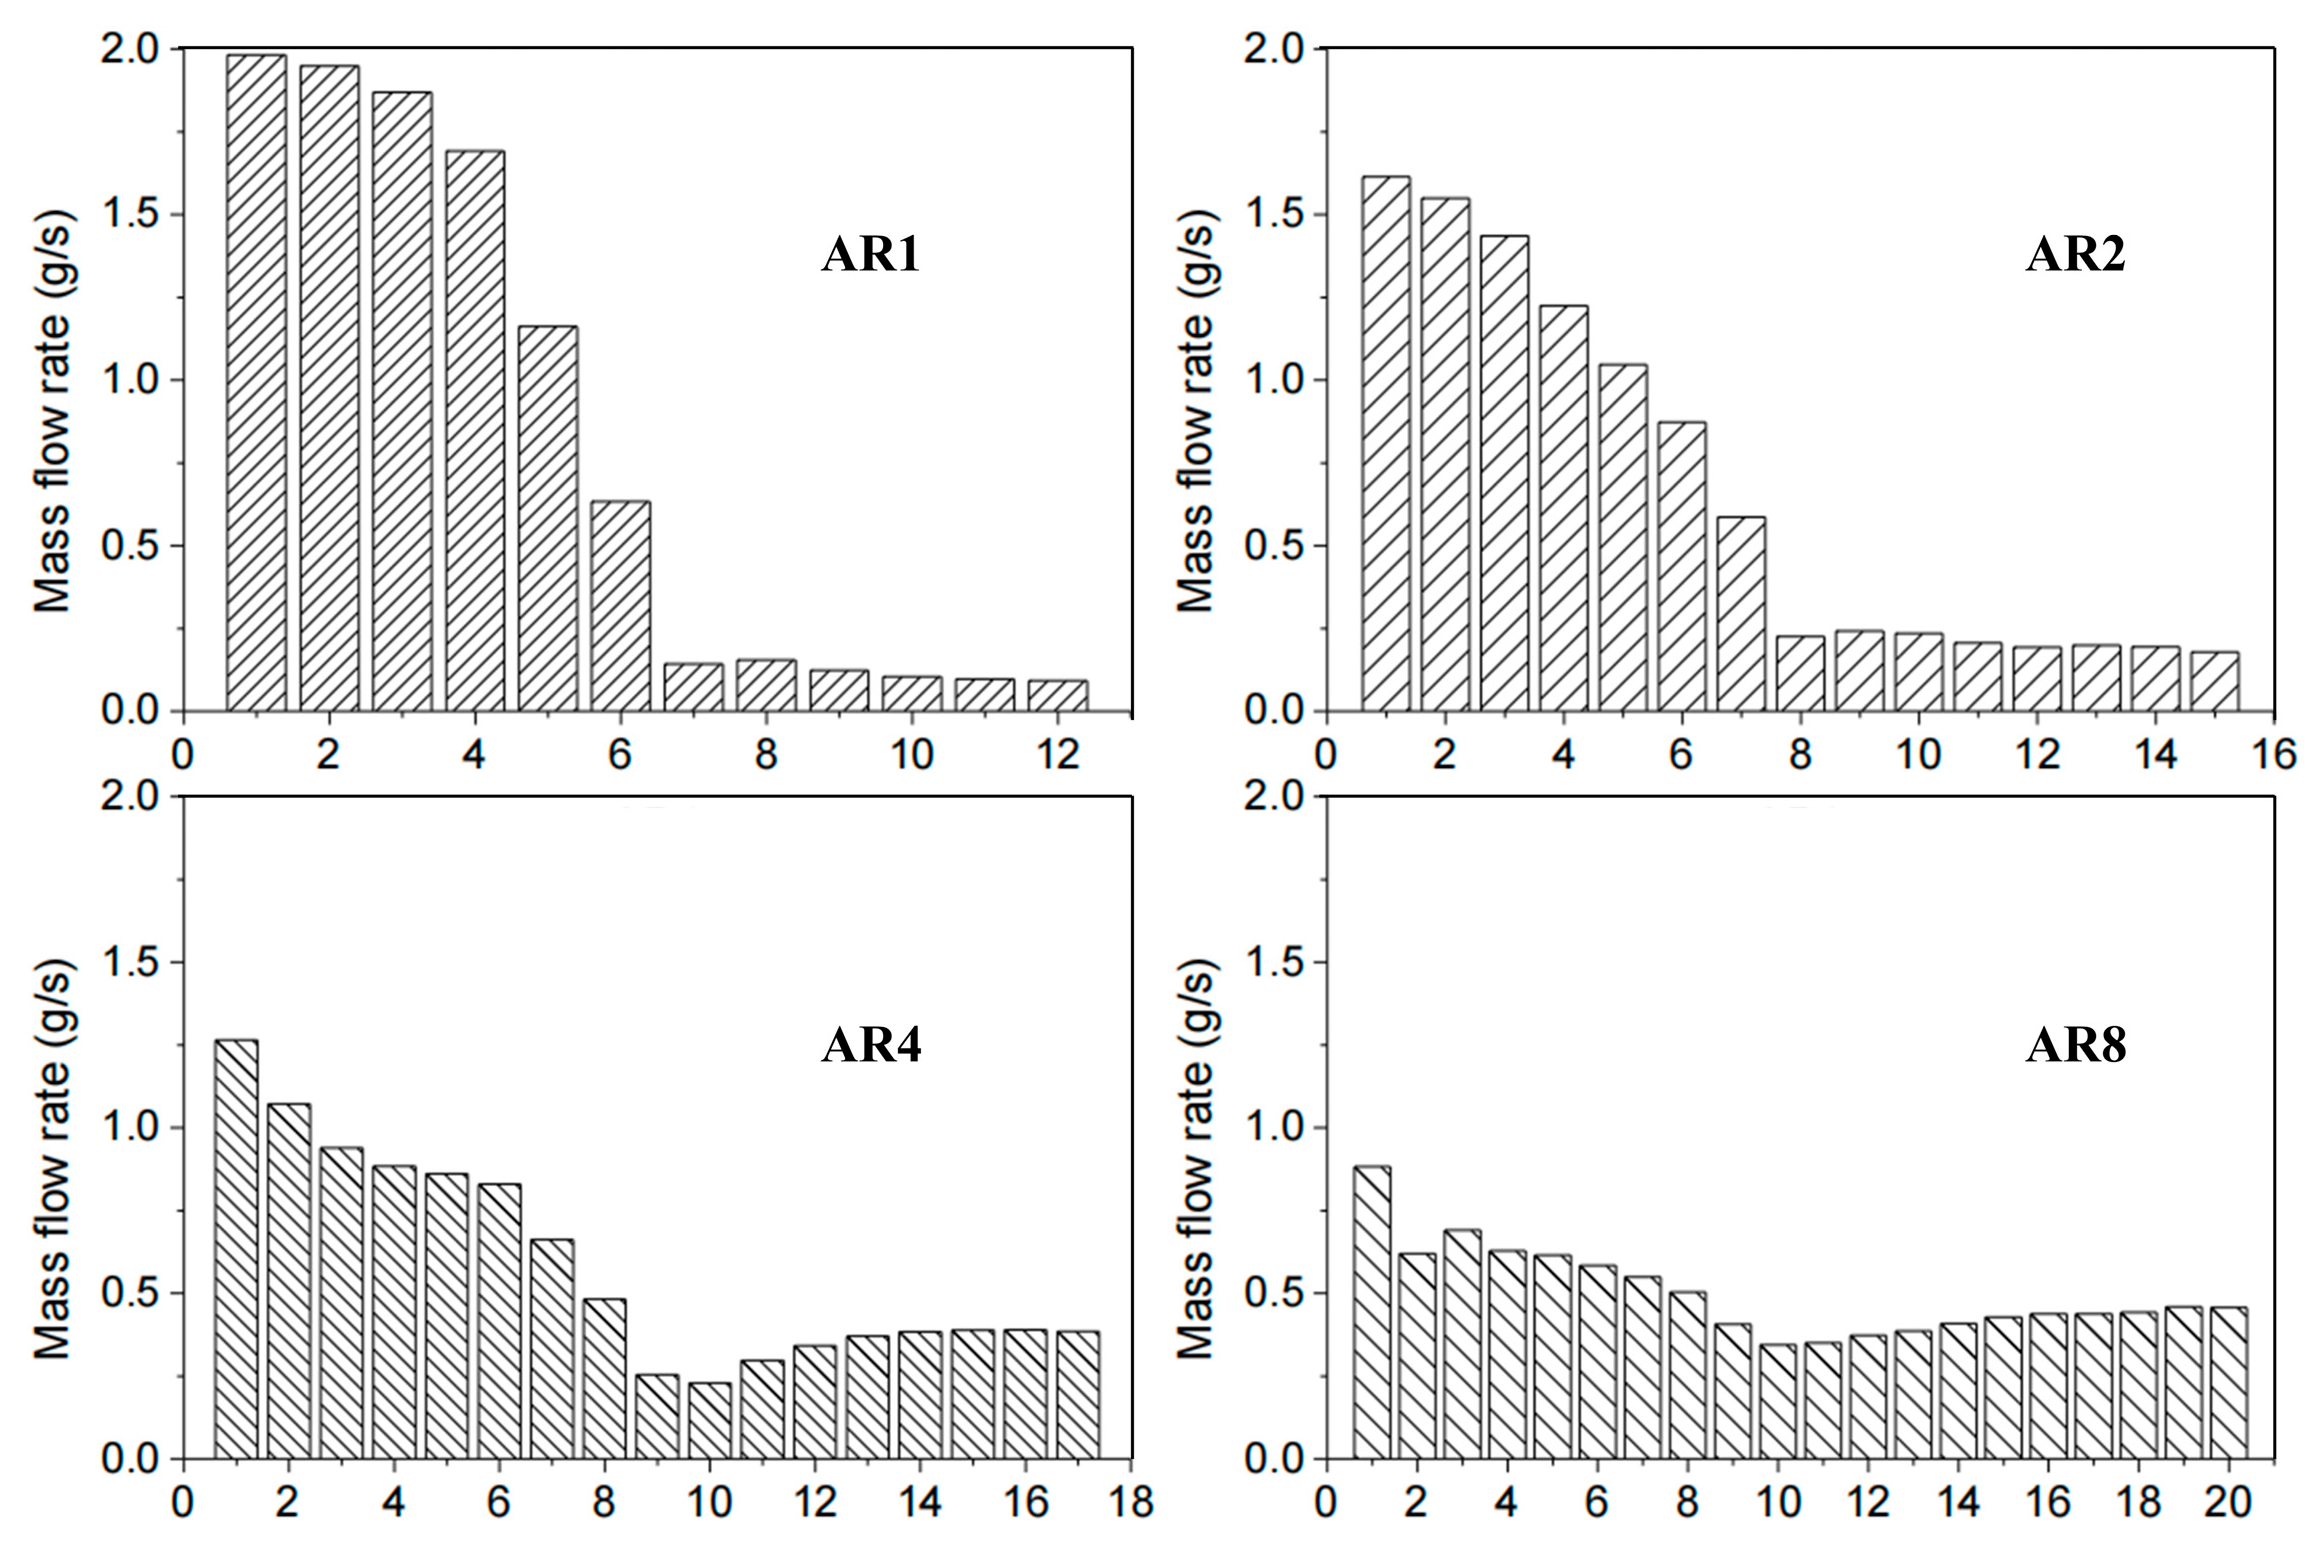
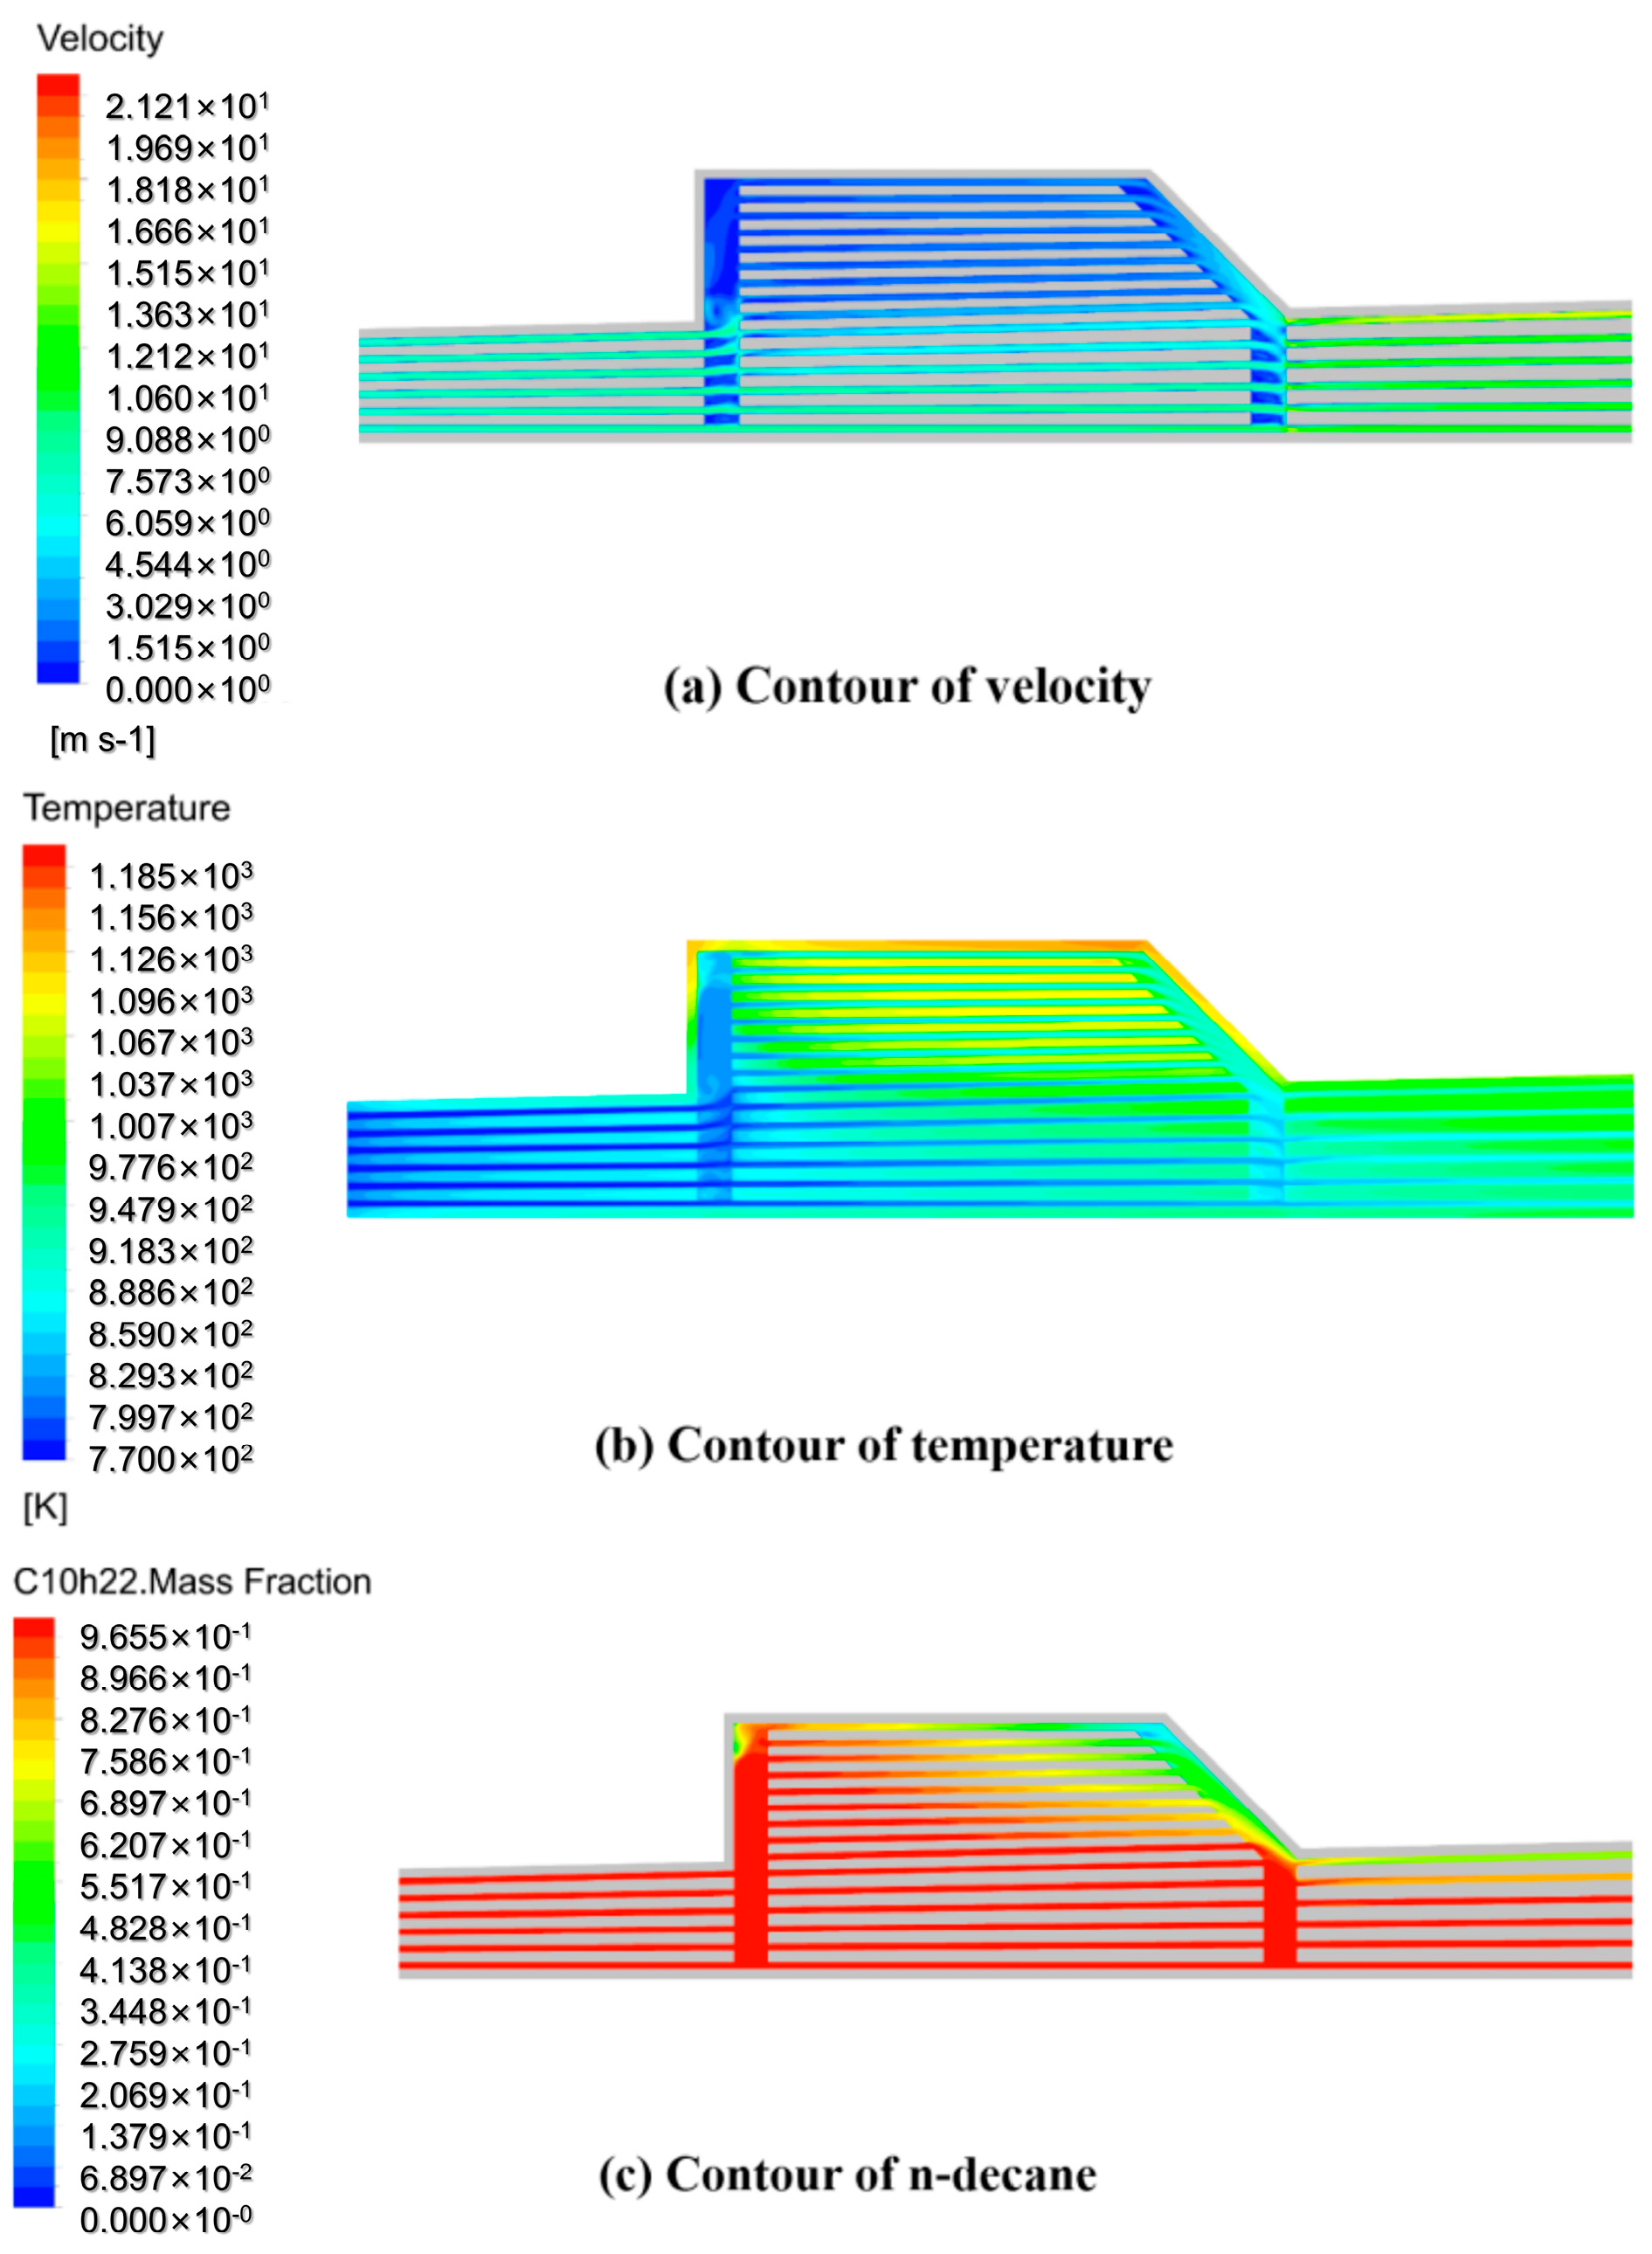
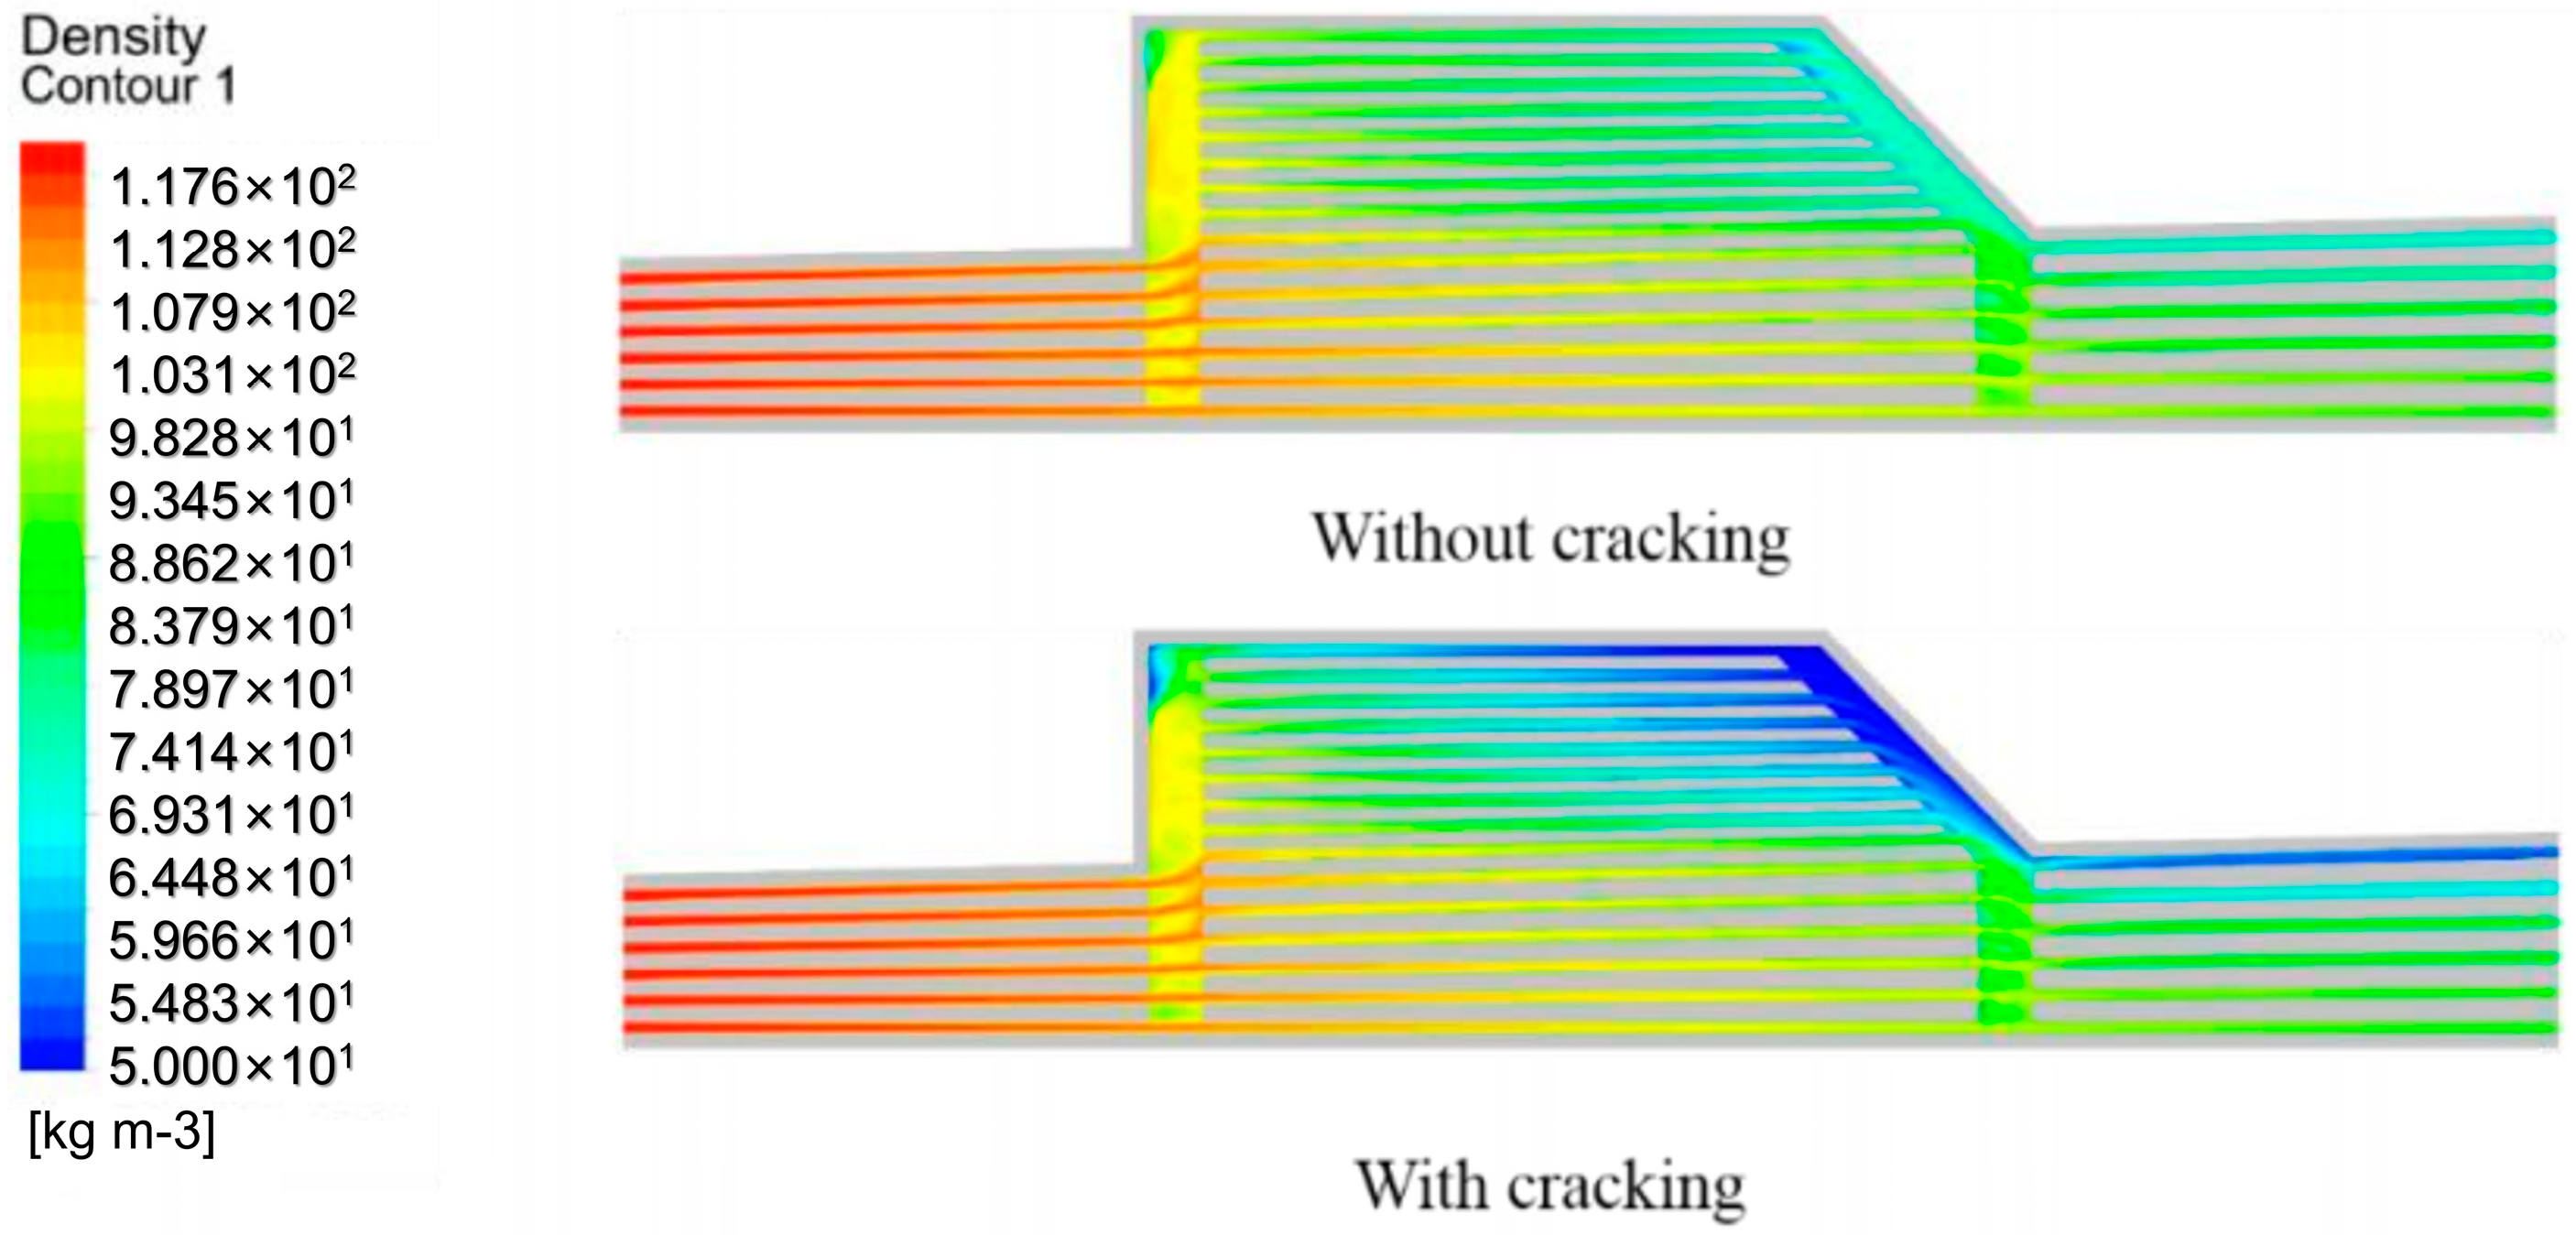
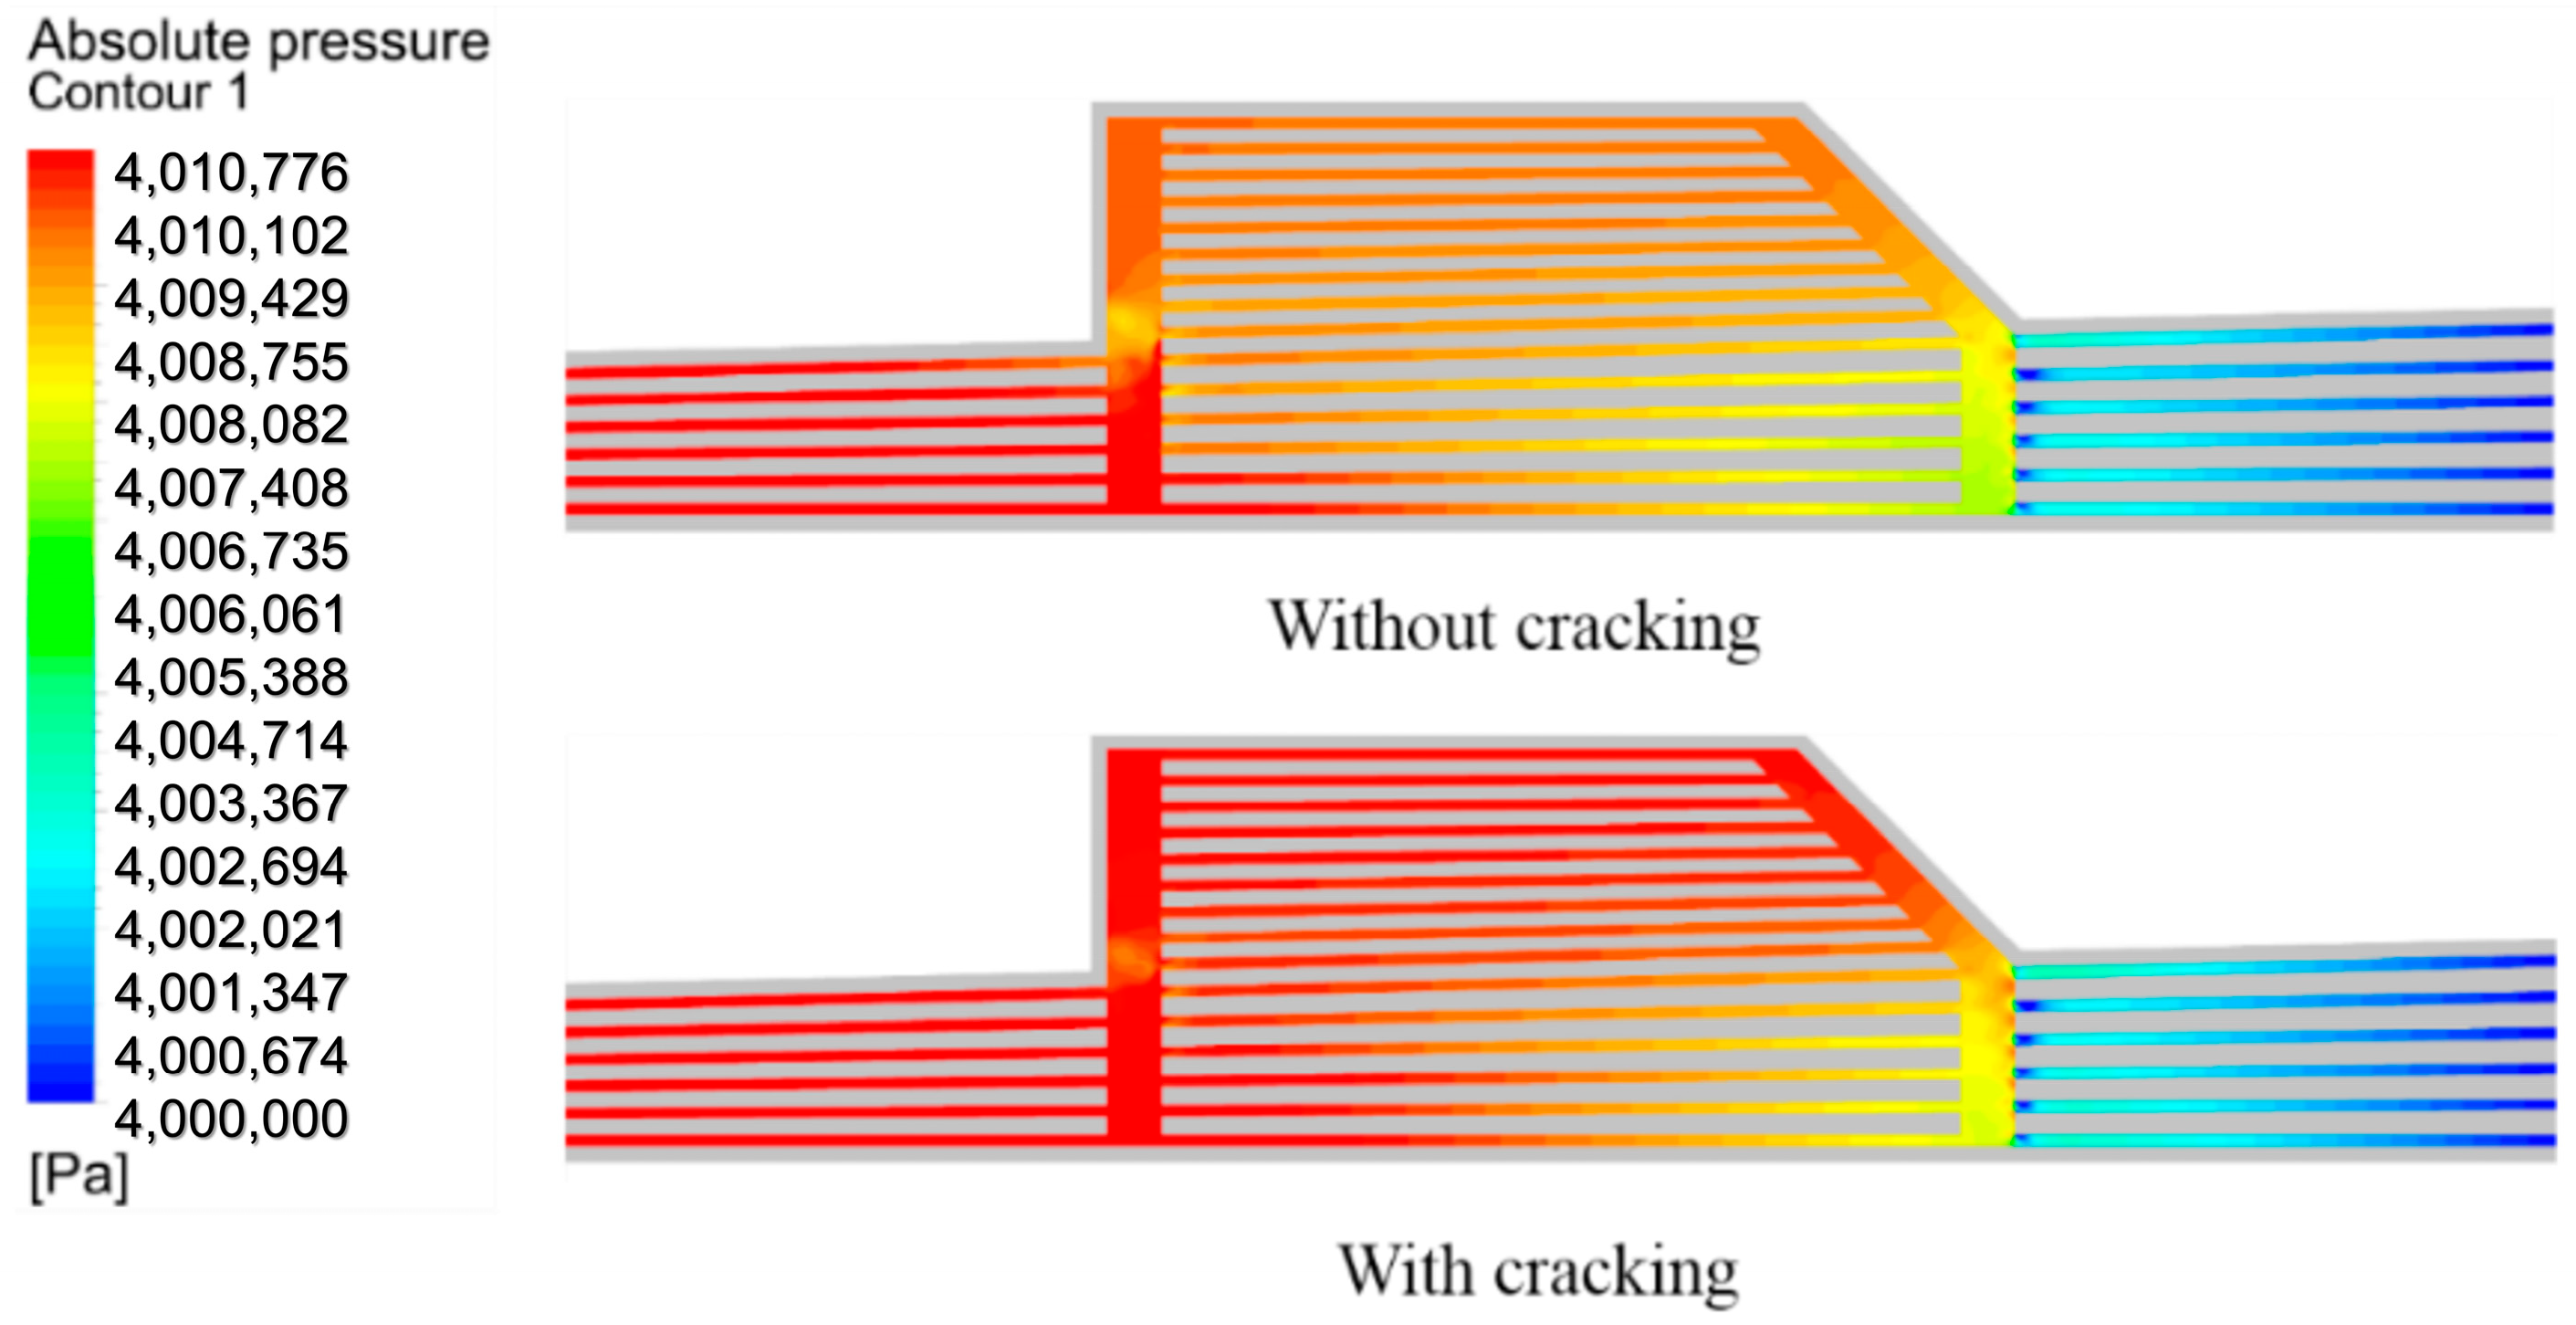
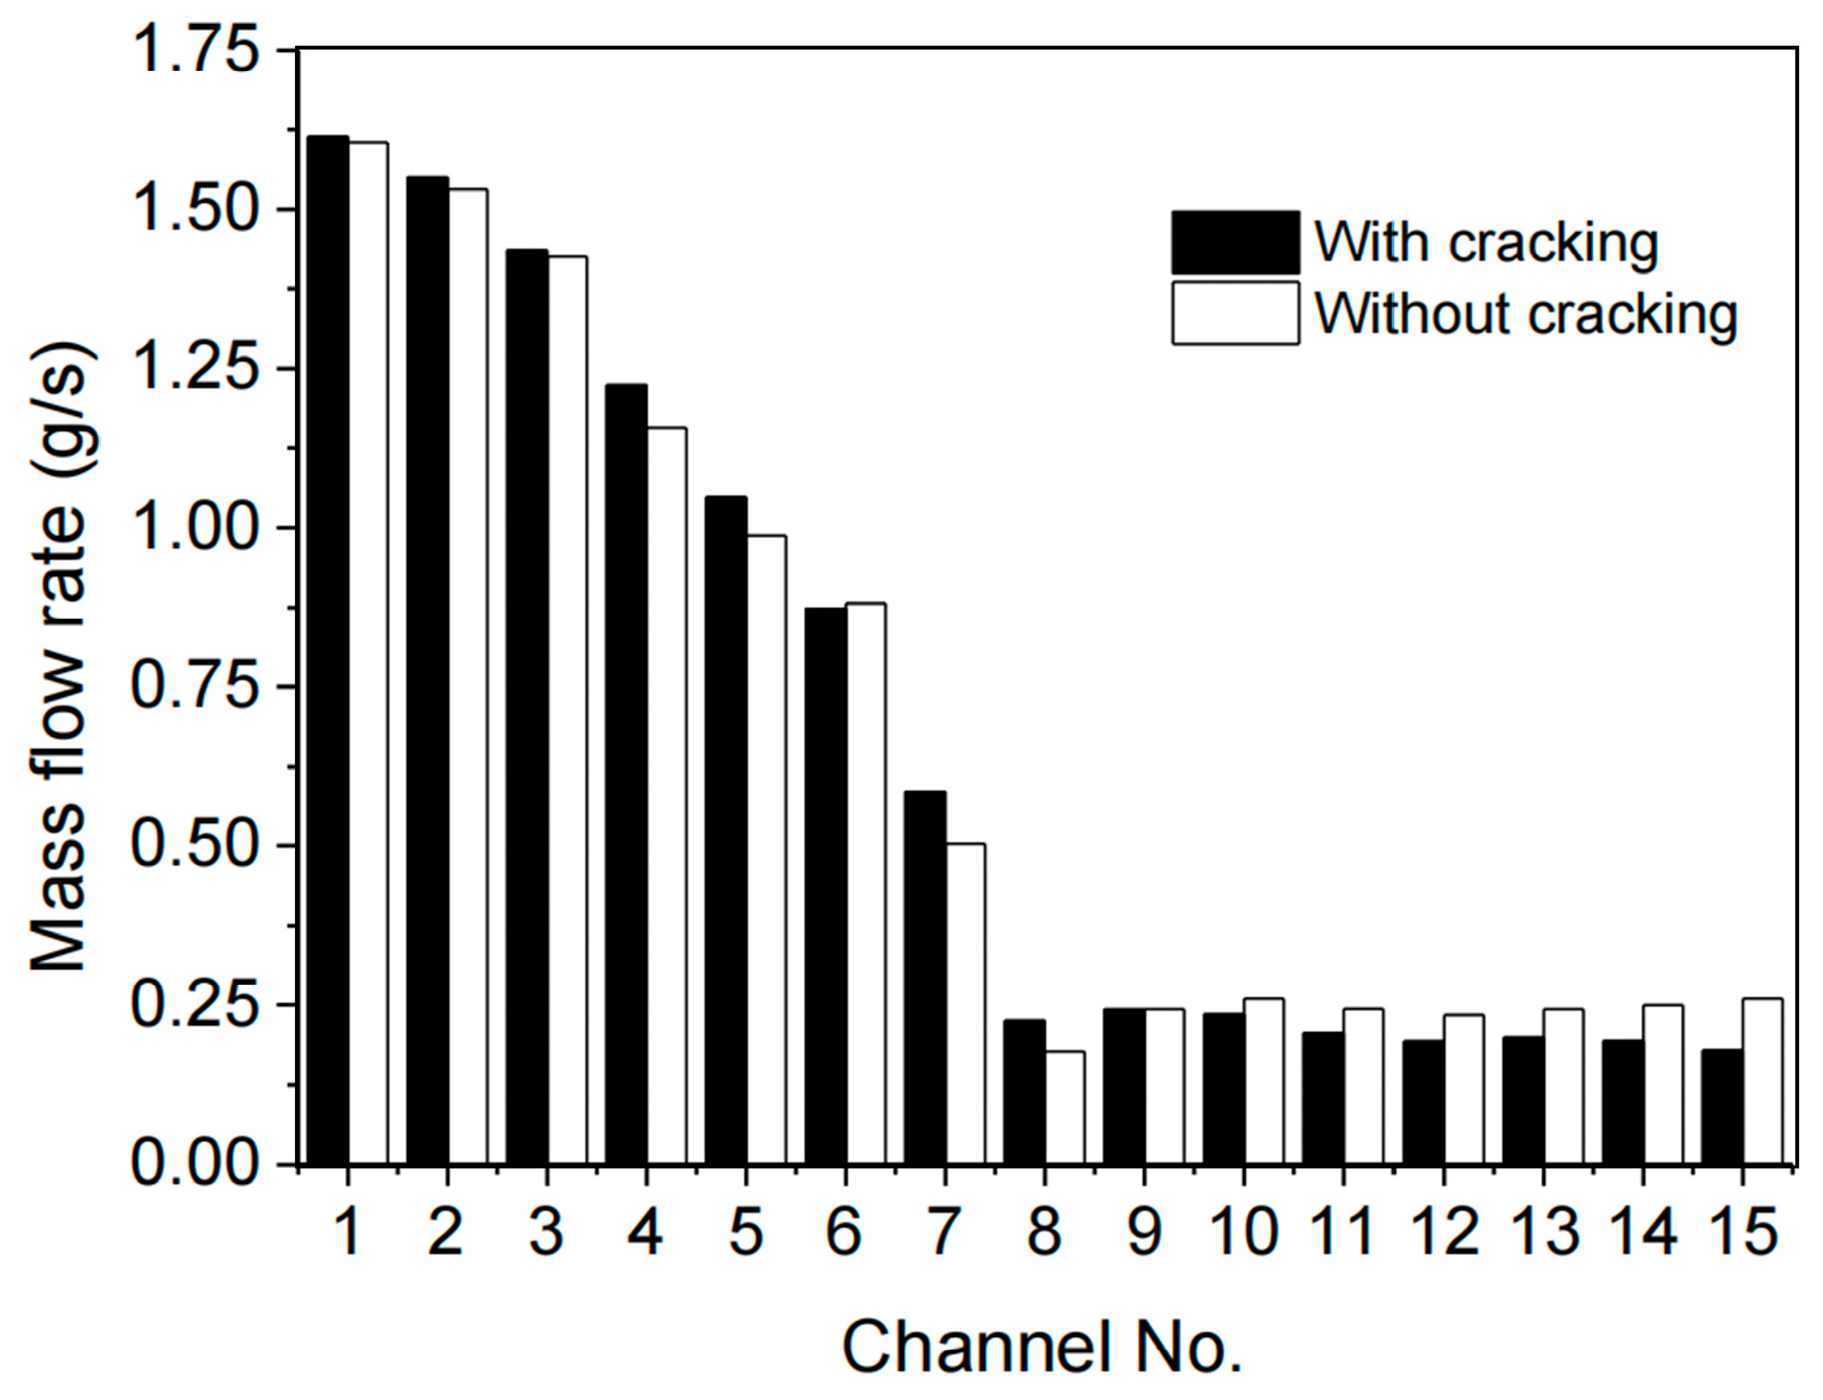
3.1. Main Characteristics of Flow Distribution in Suddenly Expanded Structure

Figure 8 shows the contours of velocity, temperature and mass fraction of fuel for the AR2 case. Owing to the S-E structure, the flow distribution is obviously nonuniform: most of the fuel flows directly into Zone 2, and only 33% (mass flow rate) of the fuel flows into Zone 3; the temperature of Zone 3 is significantly higher than that of other zones; low velocity and high temperature cause the fuel in Zone 3 to be more cracked than that in Zone 2. Although fuel cracking produces a chemical heat sink which can mitigate fuel temperature rise, Zone 3 is obviously still not sufficiently cooled, and then both the base material and the fuel present too high temperatures. These are the main problems of sudden expansion cooling.
The cracking reaction of fuel is a process from heavy molecule to small molecule, which will cause a series of property changes, such as density and viscosity. These changes may further affect the flow distribution among channels. The density and pressure contours are shown in Figure 9 and Figure 10, respectively. When the cracking reaction is not considered, high temperature causes fuel density in Zone 3 to be lower than that in Zone 2. When the cracking reaction is considered, although the cracking reaction reduced the temperature of Zone 3, the density still decreased significantly. Lower density leads high flow resistance and pressure for paths in Zone 3 and further causes a decrease in the split-flow from Zone 1 to Zone 3. Figure 11 shows the mass flow rate of every channel in simulations with and without cracking reaction. The channel closest to the Y-axis is defined as No. 1, with other channels defined sequentially. The mass flow rate distribution deviation is calculated as follows:
ϕ m = 1 n c i = 1 n m i m ¯ m ¯ 2 1 / 2
where mi is the mass flow rate of channel i, and m ¯ is the average mass flow rate of all the channels. For the structure AR2, ϕm equals 0.817 and 0.783, respectively, for the simulated results with and without cracking reaction. It indicates that the cracking reaction intensifies the nonuniformity.

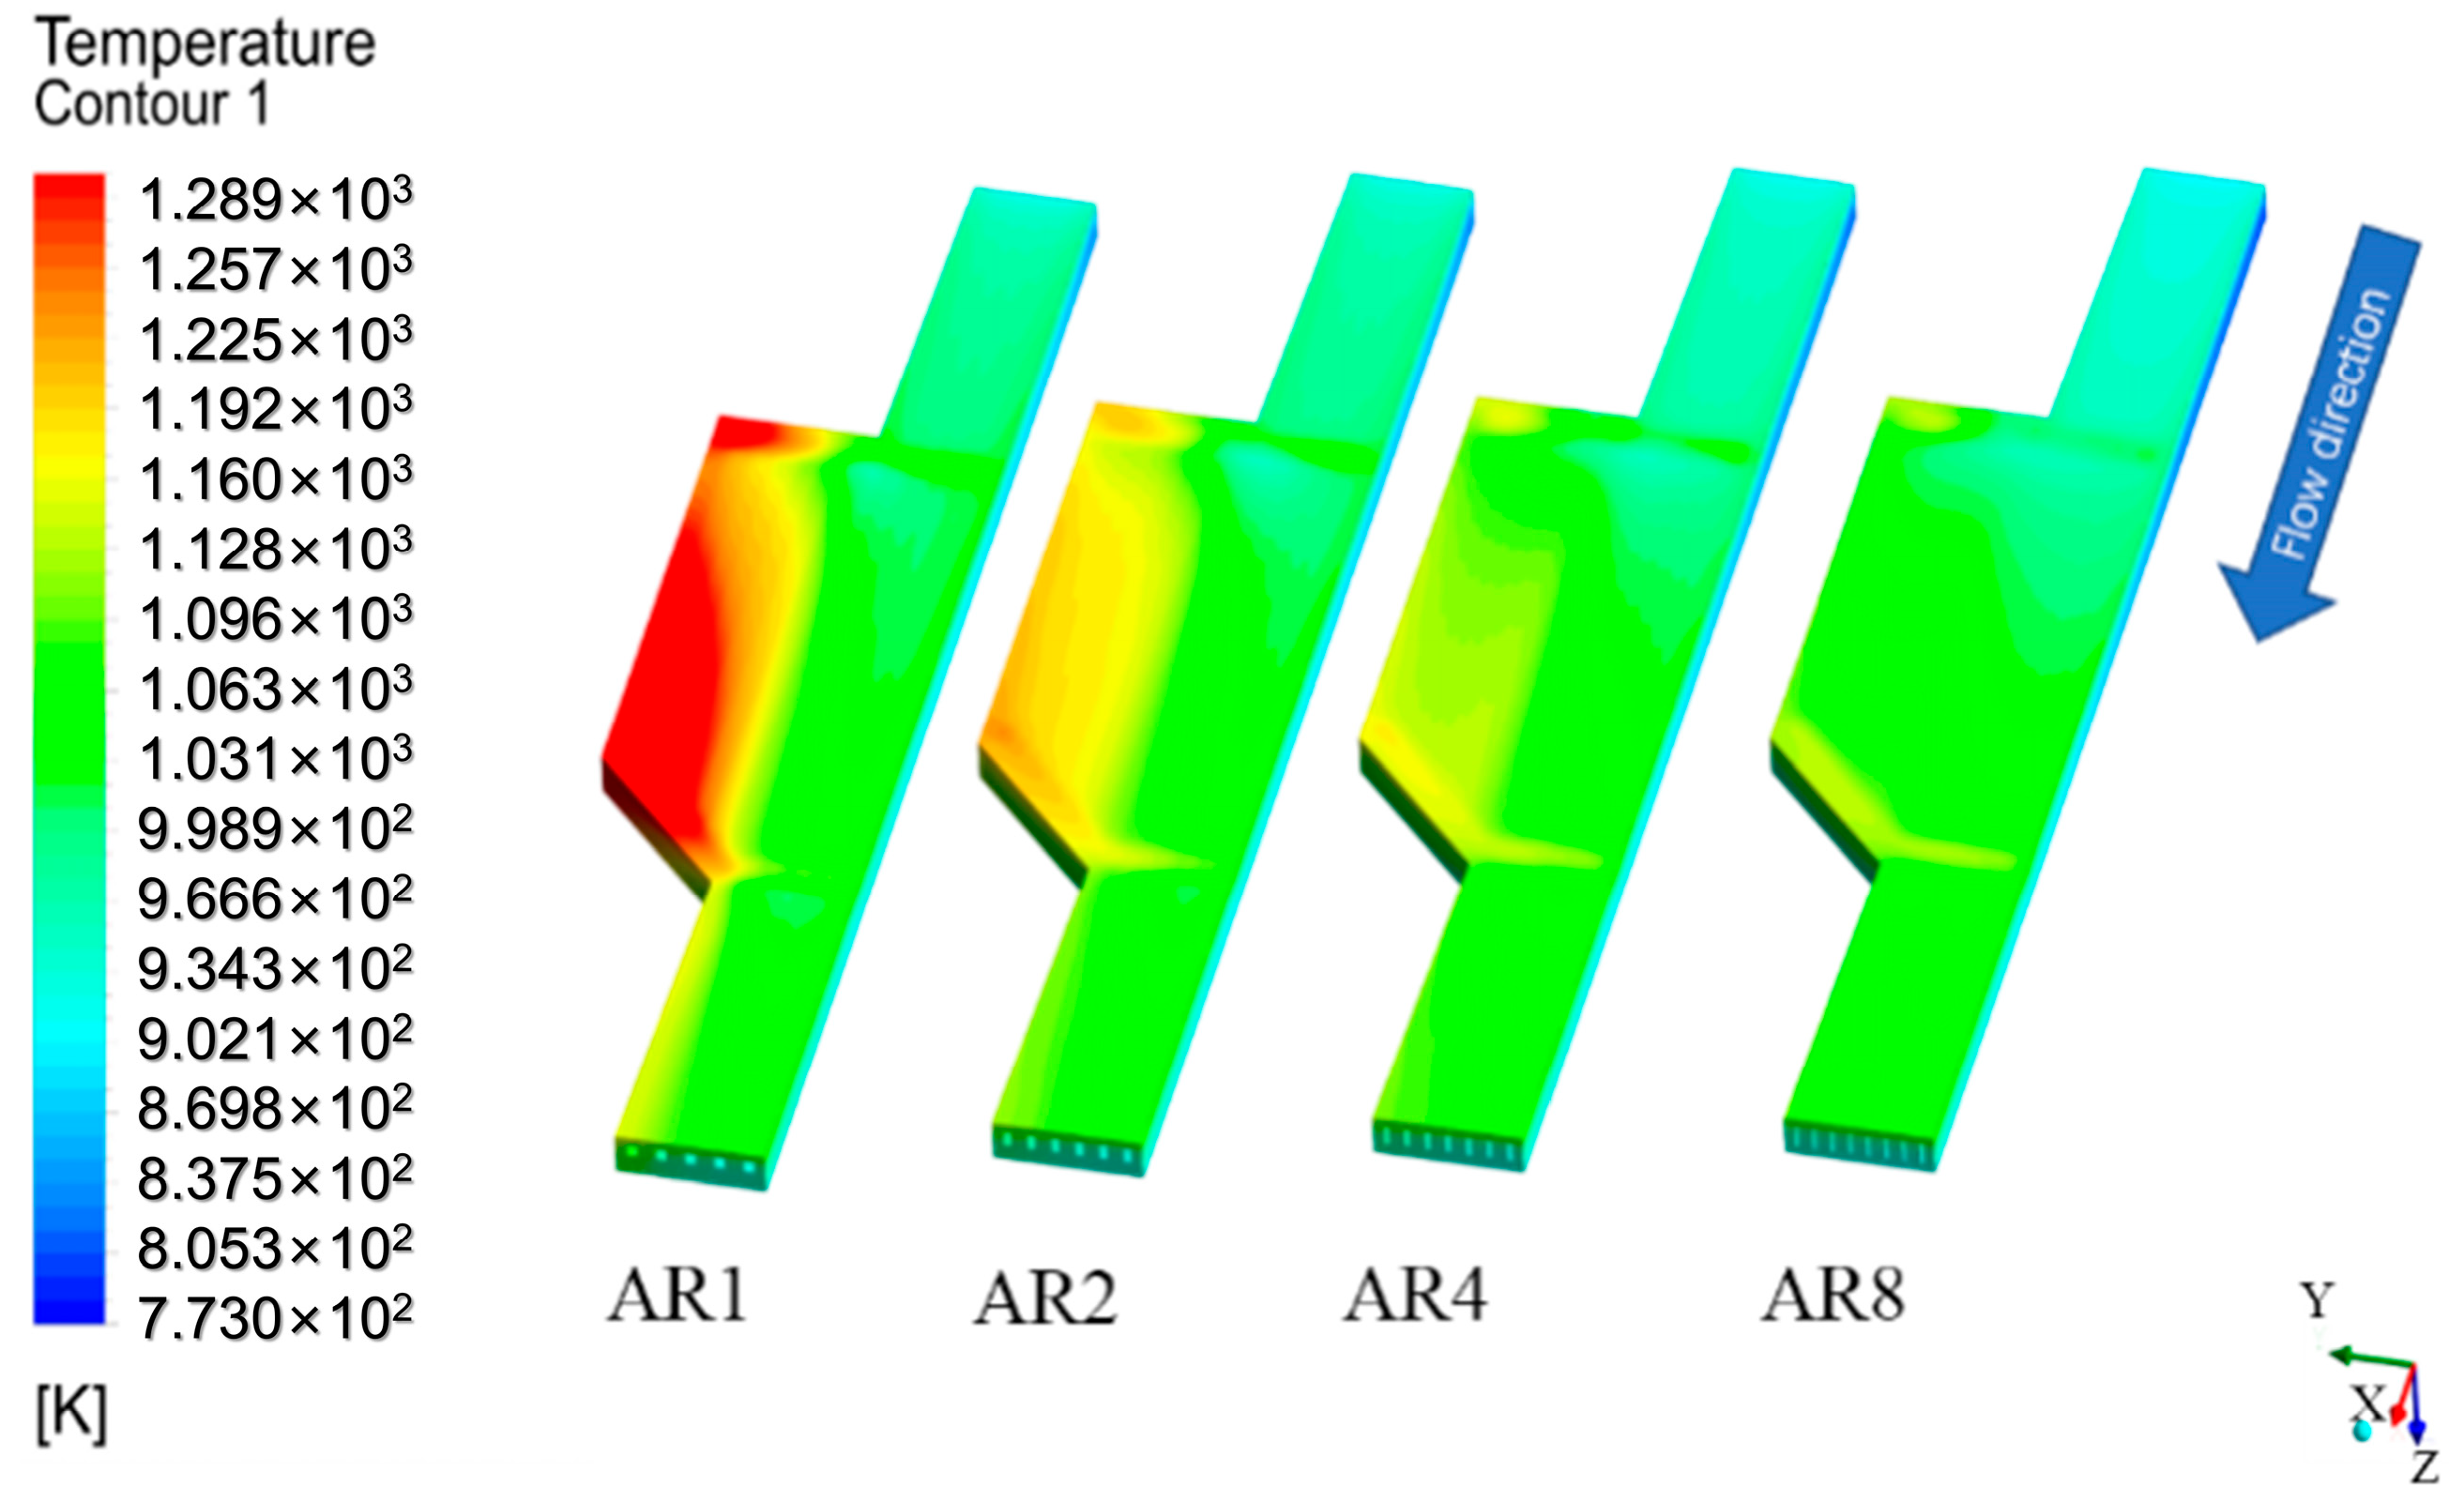
3.2. Effect of Channel Parameters on Flow Distribution

As shown in Figure 12, with an increase in the AR, more fuel flows into Zone 3. As shown in Table 4, ϕm decreases when the AR increases, which means that the flow distribution is more even at a higher AR. As shown in Figure 13, monitor planes were built to analyze the pressure. The average pressure P is calculated as follows:
P = 1 A P d A
The pressure drop ΔP is defined as follows:
Δ P i , k = P i P k
According to [32,33], at the header of Zones 2 and 3, the initial mass flow rate difference is the reason of flow maldistribution. The pressure drop ratio ΔPratio used to partially present this effect between the header and branch channels is defined as follows:
Δ P r a t i o = Δ P 3 , 2 / Δ P 2 , 1
where ΔP3,2 is the pressure drop of the header, and ΔP2,1 is the average pressure drop of the branch channels.
Figure 12. Mass flow rate of each channel under different AR in Zones 2 and 3.
Aerospace 12 00456 g012
Figure 13. Schematics of monitor planes.
Aerospace 12 00456 g013
Table 4. Mass flow rate distribution deviation ϕm for different ARs.
ϕm (Without Cracking)ϕm (With Cracking)
AR10.8430.954
AR20.7830.817
AR40.4090.428
AR80.1810.181
A smaller ΔPratio means that the pressure drop in the headers is less obvious on the initial flow difference, which results in a more uniform flow and temperature distribution. The detailed results of pressure are presented in Table 5. The ϕm is shown in Table 4. Table 4 and Table 5 indicate that with the increase in the AR, the pressure drop of the header ΔP3,2 and the average pressure drop of the branch channels ΔP2,1 increase, while the pressure drop ratio ΔPratio decreases. As shown in Table 1, the hydraulic diameter of the cooling channels Dh decreases with the increase in the AR, which explains the variation in ΔPratio. In summary, when the AR of the cooling channel varies from one to eight, the distribution of flow in Zones 2 and 3 becomes more uniform.
The nonuniform distribution of fuel in the branch channels causes a difference in the cooling effect. The numerical results of wall temperatures with different ARs are shown in Figure 14. The maximum wall temperature appears in Zone 3. For the AR1 structure, an over-temperature occurs in Zone 3. As the AR increases, over-temperature gradually disappears.
There are two main reasons for the over-temperature of the heated wall: firstly, the fuel flow rate in Zone 3 is smaller, and the bulk fuel temperature is higher; secondly, the low velocity of fuel makes the coefficient of convective heat transfer in channels smaller, and the difference between wall and bulk fuel is larger. In the rectangular channels, the Reynolds number is defined as [46] follows:
Re = D h m A μ
As the mass flow rate decreases, the Reynolds number decreases. The Reynolds number correlates positively with the convective heat transfer coefficient [8,47]; therefore, the decrease in the convective heat transfer coefficient results in an increase in the temperature gradient near the inner wall of the channel as well as the temperature difference between the fuel and outside wall. As the AR increases, more fuel flows into Zone 3. The bulk fuel temperature decreases, and the Reynolds number in the channels increases; thus, the over-temperature gradually disappears.
The heat absorption of fuel can be calculated as total heat input from the heated wall:
Q = q d A = q i A i
where qi and Ai denote the heat flux and areas of facets of cells on the heated wall, respectively. According to Newton’s cooling law, when the convective intensity near the wall remains essentially constant, the smaller the difference between the gas temperature and the wall temperature, the lower the wall heat flux density. Therefore, the heat flux from the burning gas to the walls is affected by the wall temperature. As stated previously, the AR of the cooling channels directly affects the walls’ temperature, which can affect the heat flux. As shown in Figure 15, the heat flux in the Zone 3 structure is lower. With increasing AR, the heat flux increases, and its distribution becomes more uniform. From Equation (4), based on analyzing coupling relations, the heat flux decreases with an increase in the wall temperature. The wall temperature is larger in Zone 3, which decreases the heat flux in this area. Furthermore, in Zone 1, the flow distribution is uniform, and the heat transfer improves with the increase in the AR, which results in a lower heated wall temperature. The heat flux increases owing to the decrease in the heated wall temperature. The results of the heat absorption of fuels with different ARs are shown in Figure 16. It can be concluded that the heat absorption increases when the AR varies from one to eight. For the heat transfer process with high heat flux in the engine, when the system reaches a steady state, the heat absorbed by the solid structure through its heat capacity can be neglected, and the temperature gradient caused by heat conduction in metallic materials is small. Since the geometric shape of the cooling structure is fixed and the total fuel mass flow rate remains constant, regardless of the size of the heat transfer area in the cooling channels, all heat transferred through the wall will eventually be carried away by the fuel. Therefore, the reduction in wall heat flux caused by local high temperatures (as shown in Figure 14 and Figure 15) results in a decrease in the total heat absorption by the fuel. However, the reduction in heat absorption comes at the cost of the nonuniform heating of the fuel, with local structures facing a serious risk of overheating.

3.3. Effect of Channel Parameters on Thermal Cracking

The n-decane mass fractions in the section of X = 108 mm (line 1 in Figure 1) are shown in Figure 17. From the calculation results, at smaller ARs, such as one and two, the conversion of n-decane is larger in Zone 3 than that in Zone 2. Furthermore, the fuel conversion decreases with the increase in the AR.
The conversion of fuel was co-decided by the reaction rate and residence time [48,49,50]. The reaction rate was affected by temperature, and the residence time was determined by velocity. According to the Arrhenius equation, the reaction rate constant indicates an exponential relationship with the fuel temperature. A higher temperature and lower velocity can yield a larger reaction rate constant and longer residence time, respectively. As shown in Figure 17, for AR1 and AR2, the higher fuel temperature appears in Zone 3, which can increase the reaction rate. As shown in Figure 18, the fuel velocity at Zone 3 is lower, which can increase the reaction time. The increased reaction rate and time result in the decrease in n-decane mass fractions. A higher conversion of n-decane results in a high coking risk, which will degrade the stability of the cooling system. As shown in Figure 19, at a higher AR, e.g., AR4 and AR8, a higher velocity results in a shorter reaction time and less fuel conversion. For the larger AR structure, although the fuel conversion is mild and the chemical heat sink will not be fully utilized, the temperature of both the base material and fuel meets the cooling requirements of the engine. Therefore, for the cooling of a suddenly expanded structure, priority should be given to the overall cooling performance rather than the utilization rate of chemical heat sink.

4. Discussion

In this study, type III boundary conditions composed of a adiabatic wall temperature and heat transfer coefficient were employed in the numerical simulation. The two values are set as fixed, and the recommended values from Reference [2] are adopted. However, the determination of these values itself is based on many assumptions, such as a gas temperature of 2800 K, a Mach number in the combustor of 1.2, and others. This may differ from the actual combustor, particularly in parts such as Zone 3. In this paper, the reference values of these boundary conditions are used primarily to reflect the fundamental characteristics of heat flux density variations caused by uneven flow distribution. From this perspective, the type III boundary conditions are more suitable than the commonly used type II. Inside the actual combustor, the gas temperature and heat transfer coefficient are not uniformly distributed; however, there is currently a lack of publicly available data for reference. In future work, methods, such as Dirichlet–Robin iteration, will be employed to conduct combustion–cooling coupling simulations, so as to obtain more accurate thermal boundaries.
Hydrocarbon fuel cracking reactions generate substantial chemical heat sinks, but simultaneously, small-molecule cracking products tend to cause coking. The higher the temperature and the longer the operation time, the more coking accumulates. Therefore, chemical endothermy at high temperatures can be regarded as a heat sink with large quantity but “low-quality”. Therefore, the cooling system should prioritize the utilization of the “high-quality” heat sink from the fuel at low temperatures. Currently, there is still a lack of quantitative descriptions for the “quality” of heat sinks, which calls for further research in the future.

5. Conclusions

To study the flow distribution characteristics in the S-E structure of a fuel-cooled plate, a three-dimensional numerical model under the type-III thermal boundary condition was built and verified by experiments. Based on the numerical simulation and analysis, the following conclusions can be made.
Flow maldistribution occurred easily in the S-E structure. The chemical heat sink contributed by the cracking reaction of fuel usually could not eliminate the local over-temperature caused by nonuniform flow distribution. Additionally, the cracking reaction intensified the nonuniformity by reducing the density and increasing the flow resistance of fuel. For the structure AR2, mass flow rate distribution deviation ϕm equaled 0.817 and 0.783, respectively, for the simulated results with and without cracking reaction.
The flow distribution was significantly affected by the cross-section parameters of the cooling channel and then the cooling performance was influenced. The calculation results indicated that as AR increased from one to eight, mass flow rate distribution deviation ϕm decreased from 0.954 to 0.181, and the over-temperature gradually disappeared.
Owing to the type-III boundary condition used on the heated wall, the heat flux distribution characteristics were revealed: the over-temperature caused by flow maldistribution resulted in a reduction in heat flux on the heated wall. Therefore, with the increase in the AR, the flow distribution was improved and the heated wall temperature was reduced, leading to an increase in the total heat absorption of the fuel. However, this approach mitigates the coking risk associated with excessive local fuel cracking. For the S-E structure, the cooling channel design should meet the requirements of flow distribution and overall cooling performance first; then, consider the utilization of chemical heat sink.

Author Contributions

Conceptualization, Q.W. and Z.Q.; methodology, Q.W. and Z.Q.; software, M.H.; validation, Q.W., Z.Q. and M.H.; formal analysis, M.H.; investigation, Q.W. and M.H.; resources, M.H.; data curation, Q.W.; writing—original draft preparation, Q.W.; writing—review and editing, Y.C. All authors have read and agreed to the published version of the manuscript.

Funding

This research received no external funding.

Data Availability Statement

The original contributions presented in this study are included in the article. Further inquiries can be directed to the corresponding author.

Conflicts of Interest

The authors declare no conflicts of interest.

Nomenclature

Achannel cross-sectional area, m2
ARaspect ratio
Cchannel perimeter, m
cpspecific heat, J/(kg·K)
Dhhydraulic diameter, m
Eaactivation energy, J/mol
henthalpy, J/mol
hGheat transfer coefficient, W/(m2·K)
Hplate height, m
lachannel width, m
lbchannel height, m
kpre-exponential factor, s−1
mmass flow rate, g/s
MaMach number
ncchannel number
qheat flux W/m2
Qheat absorption, W
ReReynolds number
StStanton number
Swheated wall thickness
twrib thickness, m
uvelocity of fuel, m/s
Vvelocity of air, m/s
volume of fuel, (m3)
Wdistribution chamber width, m
Ymass fraction
ρdensity, kg/m3
λthermal conductivity, W/(m·K)
μdynamic viscosity, Pa·s
ωacentric factor
ΔPpressure drop, Pa
Subscripts
awAdiabatic
combcombustion chamber
ccritical
effeffective
ispecies
channel number index
idealideal gas
ssolid
single
wwall

References

  1. Curran, E. Scramjet Engines: The First Forty Years. J. Propuls. Power 2001, 17, 1138–1148. [Google Scholar] [CrossRef]
  2. Valdevit, L.; Vermaak, N.; Hsu, K.; Zok, F.; Evans, A. Design of Actively Cooled Panels for Scramjets. In Proceedings of the 14th AIAA/AHI Space Planes and Hypersonic Systems and Technologies Conference, AIAA Meeting Paper 2006-8069, Canberra, Australia, 6–9 November 2006. [Google Scholar]
  3. Jiang, J.; Zhang, R.-L.; Le, J.-L. Calculational tool of thermal structure design for regeneratively cooled scramjet. Shiyan Liuti Lixue/J. Exp. Fluid Mech. 2006, 20, 1–7. [Google Scholar]
  4. Zhang, D.; Yang, S.; Zhang, S.; Qin, J.; Bao, W. Thermodynamic analysis on optimum performance of scramjet engine at high Mach numbers. Energy 2015, 90, 1046–1054. [Google Scholar] [CrossRef]
  5. Yang, Q.; Bao, W.; Chetehouna, K.; Zhang, S.; Gascoin, N. Thermal behavior of an isolator with mode transition inducing back-pressure of a dual-mode scramjet. Chin. J. Aeronaut. 2017, 30, 595–601. [Google Scholar] [CrossRef]
  6. Yang, Q.; Chetehouna, K.; Gascoin, N.; Bao, W. Experimental study on Combustion modes and thrust performance of a staged-combustor of the scramjet with dual-strut. Acta Astronaut. 2016, 122, 28–34. [Google Scholar] [CrossRef]
  7. Feng, Y.; Liu, S.; Qin, J.; Cao, Y.; Jiang, Y.; Zhang, S. Numerical study on the influence of turbulence on the pyrolysis of hydrocarbon fuel in mini-channel. Int. J. Heat Mass Transf. 2018, 119, 768–776. [Google Scholar] [CrossRef]
  8. Wang, L.; Chen, Z.; Meng, H. Numerical study of conjugate heat transfer of cryogenic methane in rectangular engine cooling channels at supercritical pressures. Appl. Therm. Eng. 2013, 54, 237–246. [Google Scholar] [CrossRef]
  9. Taddeo, L.; Gascoin, N.; Fedioun, I.; Chetehouna, K.; Lamoot, L.; Fau, G. Dimensioning of automated regenerative cooling: Setting of high-end experiment. Aerosp. Sci. Technol. 2015, 43, 350–359. [Google Scholar] [CrossRef]
  10. Fry, R. A Century of Ramjet Propulsion Technology Evolution. J. Propuls. Power 2004, 20, 27–58. [Google Scholar] [CrossRef]
  11. Feng, Y.; Cao, Y.; Qin, J.; Hemeda, A.; Ma, Y. The influence of coking on heat transfer in turbulent reacting flow of supercritical hydrocarbon fuels. Int. J. Heat Mass Transf. 2019, 144, 118623. [Google Scholar] [CrossRef]
  12. Zhang, C.; Qin, J.; Yang, Q.; Zhang, S.; Bao, W. Design and heat transfer characteristics analysis of combined active and passive thermal protection system for hydrogen fueled scramjet. Int. J. Hydrogen Energy 2015, 40, 675–682. [Google Scholar] [CrossRef]
  13. Tong, J.; Sparrow, E.; Abraham, J. Geometric strategies for attainment of identical outflows through all of the exit ports of a distribution manifold in a manifold system. Appl. Therm. Eng. 2009, 29, 3552–3560. [Google Scholar] [CrossRef]
  14. Tonomura, O.; Tanaka, S.; Noda, M.; Kano, M.; Hasebe, S.; Hashimoto, I. CFD Based Optimal Design of Manifold in Plate-Fin Microdevices. Chem. Eng. J 2004, 101, 397–402. [Google Scholar] [CrossRef]
  15. Wang, C.-C.; Yang, K.S.; Tsai, J.-S.; Chen, I. Characteristics of flow distribution in compact parallel flow heat exchangers, part II: Modified inlet header. Appl. Therm. Eng. 2011, 31, 3235–3242. [Google Scholar] [CrossRef]
  16. Kumaran, R.; Kumaraguruparan, G.; Sornakumar, T. Experimental and numerical studies of header design and inlet/outlet configurations on flow mal-distribution in parallel micro-channels. Appl. Therm. Eng. 2013, 58, 205–216. [Google Scholar] [CrossRef]
  17. Luo, L.; Fan, Z.; Gall, H.; Zhou, X.; Yuan, W. Experimental study of constructal distributor for flow equidistribution in mini crossflow heat exchanger (MCHE). Chem. Eng. Process. Process Intensif. 2008, 47, 229–236. [Google Scholar] [CrossRef]
  18. Yue, J.; BOICHOT, R.; Luo, L.; Gonthier, Y.; Chen, G.; Yuan, Q. Flow Distribution and Mass Transfer in a Parallel Microchannel Contactor Integrated with Constructal Distributors. AIChE J. 2009, 56, 298–317. [Google Scholar] [CrossRef]
  19. Wen, J.; Li, Y.; Wang, S.; Zhou, A. Experimental investigation of header configuration improvement in plate–fin heat exchanger. Appl. Therm. Eng. 2007, 27, 1761–1770. [Google Scholar] [CrossRef]
  20. Luo, L.; Wei, M.; Fan, Y. Design and optimization of baffled fluid distributor for realizing target flow distribution in a tubular solar receiver. Energy 2017, 136, 126–134. [Google Scholar]
  21. Wei, M.; Boutin, G.; Fan, Y.; Luo, L. Numerical and experimental investigation on the realization of target flow distribution among parallel mini-channels. Chem. Eng. Res. Des. 2016, 113, 74–84. [Google Scholar] [CrossRef]
  22. Wang, J. Pressure drop and flow distribution in parallel-channel configurations of fuel cells: U-type arrangement. Int. J. Hydrogen Energy 2008, 33, 6339–6350. [Google Scholar] [CrossRef]
  23. Bi, W.; Li, J.; Lin, Z. Flow uniformity optimization for large size planar solid oxide fuel cells with U-type parallel channel designs. J. Power Sources 2010, 195, 3207–3214. [Google Scholar] [CrossRef]
  24. Afshari, E.; Ziaei-Rad, M.; Shariati, Z. A study on using metal foam as coolant fluid distributor in the polymer electrolyte membrane fuel cell. Int. J. Hydrogen Energy 2015, 41, 1902–1912. [Google Scholar] [CrossRef]
  25. Hossain, M.S.; Shabani, B.; Cheung, S. Enhanced gas flow uniformity across parallel channel cathode flow field of Proton Exchange Membrane fuel cells. Int. J. Hydrogen Energy 2016, 42, 5272–5283. [Google Scholar] [CrossRef]
  26. Xu, K.; Meng, H. Numerical study of fluid flows and heat transfer of aviation kerosene with consideration of fuel pyrolysis and surface coking at supercritical pressures. Int. J. Heat Mass Transf. 2016, 95, 806–814. [Google Scholar] [CrossRef]
  27. Qin, J.; Jiang, Y.; Feng, Y.; Li, X.; Haowei, L.; Xu, Y.; Bao, W.; Zhang, S.; Han, J. Flow rate distribution of cracked hydrocarbon fuel in parallel pipes. Fuel 2015, 161, 105–112. [Google Scholar] [CrossRef]
  28. Jiang, Y.; Zhang, S.; Feng, Y.; Cao, J.; Qin, J.; Bao, W. A control method for flow rate distribution of cracked hydrocarbon fuel in parallel channels. Appl. Therm. Eng. 2016, 105, 153–536. [Google Scholar] [CrossRef]
  29. Chen, Y.; Lei, Z.; Zhang, T.; Zhu, Q.; Bao, Z.; Zhang, Q.; Li, X.-Y. Flow Distribution of Hydrocarbon Fuel in Parallel Mini-Channels Heat Exchanger. AIChE J. 2018, 64, 2781–2791. [Google Scholar] [CrossRef]
  30. Chen, Y.; Liu, B.; Lei, Z.; Zhang, Q.; Zhu, Q.; Bao, Z.; Li, X.-Y. A control method for flow distribution in fuel-cooled plate based on choked flow effect. Appl. Therm. Eng. 2018, 142, 127–137. [Google Scholar] [CrossRef]
  31. Chen, Y.; Wang, Y.; Bao, Z.; Zhang, Q.; Li, X.-Y. Numerical investigation of flow distribution and heat transfer of hydrocarbon fuel in regenerative cooling panel. Appl. Therm. Eng. 2015, 98, 628–635. [Google Scholar] [CrossRef]
  32. Jiang, Y.; Xu, Y.; Qin, J.; Zhang, S.; Chetehouna, K.; Gascoin, N.; Bao, W. The flow rate distribution of hydrocarbon fuel in parallel channels with different cross section shapes. Appl. Therm. Eng. 2018, 137, 173–183. [Google Scholar] [CrossRef]
  33. Jiang, Y.; Qin, J.; Chetehouna, K.; Gascoin, N.; Bao, W. Parametric study on the hydrocarbon fuel flow rate distribution and cooling effect in non-uniformly heated parallel cooling channels. Int. J. Heat Mass Transf. 2018, 126, 267–276. [Google Scholar] [CrossRef]
  34. Jiang, Y.; Qin, J.; Chetehouna, K.; Gascoin, N.; Bao, W. Effect of geometry parameters on the hydrocarbon fuel flow rate distribution in pyrolysis zone of SCRamjet cooling channels. Int. J. Heat Mass Transf. 2019, 141, 1114–1130. [Google Scholar] [CrossRef]
  35. Jiang, Y.; Qin, J.; Xu, Y.; Yu, W.; Zhang, S.; Chetehouna, K.; Gascoin, N.; Bao, W. The influences of variable sectional area design on improving the hydrocarbon fuel flow distribution in parallel channels under supercritical pressure. Fuel 2018, 233, 442–453. [Google Scholar] [CrossRef]
  36. Niu, J.; Piao, Y. Numerical Simulation of Liquid Kerosene Combustion in a Dual-Mode Scramjet Combustor Using Flamelet/Progress Variable Approach. In Proceedings of the 46th AIAA Fluid Dynamics Conference, Washington, DC, USA, 13–17 June 2016. [Google Scholar]
  37. Yan, Z.; Lin, Y.; Wei, L.; Jianchen, W.; Yongsheng, Z. Numerical Simulation of a Dual-Mode Scramjet Combustor Using Flamelet Scheme. In Proceedings of the 50th AIAA/ASME/SAE/ASEE Joint Propulsion Conference, Cleveland, OH, USA, 28–30 July 2014. [Google Scholar]
  38. Swithenbank, J. Hypersonic Air-Breathing Propulsion; AIAA Education Series; AIAA: Washington, DC, USA, 1994. [Google Scholar]
  39. Eckert, E.R.G. Engineering Relations for Heat Transfer and Friction in High-Velocity Laminar and Turbulent Boundary-Layer Flow Over Surfaces with Constant Pressure and Temperature. Trans. Am. Soc. Mech. Eng. 1956, 78, 1273–1283. [Google Scholar] [CrossRef]
  40. Zhao, Y.; Wang, Y.; Liang, C.; Zhang, Q.; Li, X. Heat transfer analysis of n-decane with variable heat flux distributions in a mini-channel. Appl. Therm. Eng. 2018, 144, 695–701. [Google Scholar] [CrossRef]
  41. Li, Y.; Wang, J.; Xie, G.; Sunden, B. Effect of thermal pyrolysis on heat transfer and upward flow characteristics in a rectangular channel using endothermic hydrocarbon fuel. Chem. Eng. Sci. 2021, 244, 116806. [Google Scholar] [CrossRef]
  42. Zhang, L.; Yin, R.; Wang, J.; Li, X. Numerical Investigations on the Molecular Reaction Model for Thermal Cracking of n-Decane at Supercritical Pressures. ACS Omega 2022, 7, 22351–22362. [Google Scholar] [CrossRef]
  43. Peng, D.Y.; Robinson, D.B. A new two-constant equation of state. Ind. Eng. Chem. Fundam. 1976, 15, 59–64. [Google Scholar] [CrossRef]
  44. TChung, H.; Lee, L.L.; Starting, K.E. Applications of Kinetic Gas Theories and Multiparameter Correlation for Prediction of Dilute Gas Viscosity and Thermal Conductivity. Ind. Eng. Chem. Fundam. 1984, 23, 8–13. [Google Scholar] [CrossRef]
  45. Menter, F. Influence of Freestream Values on k-omega Turbulence Model Predictions. AIAA J. 1992, 30, 1657–1659. [Google Scholar] [CrossRef]
  46. Sparrow, E.; Tong, J.; Abraham, J. Fluid Flow in a System with Separate Laminar and Turbulent Zones. Numer. Heat Transf. Part A Appl. 2008, 53, 341–353. [Google Scholar] [CrossRef]
  47. Ruan, B.; Meng, H. Supercritical Heat Transfer of Cryogenic-Propellant Methane in Rectangular Engine Cooling Channels. J. Thermophys. Heat Transf. 2012, 26, 313–321. [Google Scholar] [CrossRef]
  48. Qin, J.; Zhang, S.; Bao, W.; Zhou, W.; Yu, D. Thermal management method of fuel in advanced aeroengines. Energy 2013, 49, 459–468. [Google Scholar] [CrossRef]
  49. Zhang, S.; Qin, J.; Bao, W.; Feng, Y.; Xie, K. Thermal management of fuel in advanced aeroengine in view of chemical recuperation. Energy 2014, 77, 201–211. [Google Scholar] [CrossRef]
  50. Feng, Y.; Qin, J.; Zhang, S.; Bao, W.; Cao, Y.; Huang, H. Modeling and analysis of heat and mass transfers of supercritical hydrocarbon fuel with pyrolysis in mini-channel. Int. J. Heat Mass Transf. 2015, 91, 520–531. [Google Scholar] [CrossRef]
Figure 1. Schematics of fuel-cooled plate and S-E structure.
Aerospace 12 00456 g001
Figure 2. Schematics of the experimental apparatus: 1—fuel reservoir; 2—piston pump; 3—globe valve; 4—filter; 5—mass flow meter; 6—tranformer; 7—condenser; 8—pressure regulating valve; 9—gas-liquid separator; 10—liquid collector.
Aerospace 12 00456 g002
Figure 3. Heat loss under different wall temperatures.
Aerospace 12 00456 g003
Figure 4. Computational domains of the validation.
Aerospace 12 00456 g004
Figure 5. Comparison of predicted fuel and outer wall temperature with experimental data (Run 1).
Aerospace 12 00456 g005
Figure 6. Structured mesh of fuel-cooled plate.
Aerospace 12 00456 g006
Figure 7. Temperature of Line 1 of heated wall with different node densities.
Aerospace 12 00456 g007
Figure 8. Contours of velocity, temperature, and mass fraction of n-decane with AR2.
Aerospace 12 00456 g008
Figure 9. Distributions of density of central section in Z-direction with AR2.
Aerospace 12 00456 g009
Figure 10. Distributions of pressure of central section in Z-direction with AR2.
Aerospace 12 00456 g010
Figure 11. Mass flow rate of each channel in simulations with and without cracking reaction in Zones 2 and 3.
Aerospace 12 00456 g011
Figure 14. Wall temperature contours with different ARs.
Aerospace 12 00456 g014
Figure 15. Contours of heat flux on heated wall.
Aerospace 12 00456 g015
Figure 16. Heat absorbed by fuel at different ARs.
Aerospace 12 00456 g016
Figure 17. Contours of distribution of n-decane mass fractions.
Aerospace 12 00456 g017
Figure 18. Contours of fuel temperature.
Aerospace 12 00456 g018
Figure 19. Contours of fuel velocity.
Aerospace 12 00456 g019
Table 1. Geometry parameters of fuel-cooled plates.
ARla (mm)lb (mm)ncDh (mm)A (mm2)C (mm)ms (g/s)mf (g/s)
11.51.55-12-51.52.2562.010.0
2126-15-61.333261.667
40.6252.57-17-711.5636.251.429
80.37538-20-80.6671.1256.751.25
Table 2. Mechanism of n-decane 26-step cracking reaction.
No.Reaction Equationk, 1/s or m3/mol·sEa, kcal/mol
1 C 10 H 22   0.415H2 + 0.2CH4 + 0.39C2H4 + 0.3C2H6
+ 0.37C3H6 + 0.10C3H8 + 0.16C4H8 + 0.04C4H10
+ 0.04C4H6 + C6H12 + 0.005C10H14
6.21 × 101559,350.29
2 C 2 H 6   H2 + C2H44.65 × 101350,250.83
3 2 C 2 H 6   CH4 + C3H83.75 × 101865,203.15
4 C 2 H 4 + C 2 H 2   C4H61.02 × 101841,260.84
5 C 2 H 4 + C 2 H 6   C3H6 + CH47.08 × 101960,430.21
6 C 3 H 8   C2H4 + CH4 4.69 × 101050,600.71
7 C 3 H 8   C3H6 + H25.89 × 101051,290.47
8 C 3 H 8 + C 2 H 4   C2H6 + C3H62.54 × 101959,060.50
9 C 3 H 6   0.12C10H14 + 0.24C6H12 + 0.36CH41.42 × 101354,490.63
10 2 C 3 H 6   3C2H47.39 × 101759,390.26
11 C 3 H 6   C2H2 + CH47.28 × 101355,800.46
12 C 3 H 6 + C 2 H 6   C4H8 + CH41.00 × 102256,200.17
13 C 4 H 10   C3H6 + CH47.00 × 101259,640.79
14 C 4 H 10   2C2H4 + H27.00 × 101470,680.03
15 C 4 H 10   C2H4 + C2H64.10 × 101461,631.14
16 C 4 H 10   C4H8 + H21.64 × 101262,060.48
17 C 4 H 8   H2 + C4H61.00 × 101050,000.26
18 C 4 H 8   0.1C10H14 + 0.5C6H12 + 0.3H21.11 × 101153,560.59
19 C 2 H 4 + C 4 H 6   C6H6 + 2H21.08 × 102036,600.43
20 C 4 H 6 + C 3 H 6   C7H8 + 2H29.74 × 101936,900.81
21 C 4 H 6 + C 4 H 8   C8H10 + 2H21.36 × 102152,200.32
22 C 6 H 12   0.094H2 + 0.3CH4 + 0.1C2H2 + 0.4C2H4 + 0.2C2H6 + 0.3C3H6
+ 0.1C3H8 + 0.2C4H8 + 0.04C4H10 + 0.04C4H6 + 0.198C10H14
1.80 × 101344,080.21
23 C 6 H 12   C2H4 + C4H82.35 × 101255,071.11
24 C 6 H 12 + H 2   CH4 + C2H4 + C3H64.00 × 101855,071.23
25 C 6 H 12   2C3H61.00 × 101257,066.42
26 C 4 H 10   C2H2 + 2CH47.00 × 101659,640.25
Table 3. Cases and results for comparison.
Case NumberRun 1Run 2Run 3Run 4
Mf (g/s)2.001.510.970.48
Tin (K)776781776780
Tout, exp (K)885896902925
Tout, cal (K)910916931947
Relative error2.75%2.18%3.11%2.23%
Yn-decane, exp85.18%77.88%63.09%27.64%
Yn-decane, cal94.64%90.93%76.61%40.97%
Relative error9.99%14.41%17.65%32.54%
Table 5. Detailed results of pressure.
Average Pressure (×103 Pa)
AR1AR2AR4AR8
P04000400040004000
P14003.544003.724005.984013.70
P24010.304010.904015.974029.57
P34011.194011.794017.134031.05
P44014.174014.984021.774041.58
ΔP2,16.677.189.9915.87
ΔP3,20.890.891.161.48
ΔPratio0.1330.1240.1160.093
Disclaimer/Publisher’s Note: The statements, opinions and data contained in all publications are solely those of the individual author(s) and contributor(s) and not of MDPI and/or the editor(s). MDPI and/or the editor(s) disclaim responsibility for any injury to people or property resulting from any ideas, methods, instructions or products referred to in the content.

