Article

Study on Plasma-Chemical Mode of Pulsed Coaxial Dielectric Barrier Discharge Plasma Based on Mass Spectrometry

State Laboratory of Advanced Space Key Propulsion, Department of Aerospace Science and Technology, Space Engineering University, Beijing 101416, China
*
Authors to whom correspondence should be addressed.
Aerospace 2025, 12(5), 433; https://doi.org/10.3390/aerospace12050433
Submission received: 10 March 2025 / Revised: 27 April 2025 / Accepted: 7 May 2025 / Published: 13 May 2025
(This article belongs to the Section Astronautics & Space Science)

Abstract

This study systematically investigates the dynamic evolution of chemical regimes in pulsed coaxial dielectric barrier discharge (DBD) plasma under atmospheric pressure using mass spectrometry. An innovative real-time mass spectrometric monitoring methodology was established, enabling the dynamic tracking of the formation and consumption processes of key reactive species such as ozone (O3) and nitrogen oxides (NOx). Energy density was the critical parameter governing the evolution of gaseous chemical components, with a quantitative elucidation of the regulatory mechanisms of air flow rate and control voltage on plasma chemical regime transition kinetics. Experimental results revealed significant parametric correlations: Under a constant control voltage of 140 V, increasing the gas flow rate from 0.5 to 5.5 L/min prolonged the transition duration from O3-NOx coexistence regime to a NOx-dominant regime from 408 s to 1210 s. Conversely, at a fixed flow rate of 3.5 L/min, elevating the control voltage from 120 V to 140 V accelerated this transition, reducing the required time from 2367 s to 718 s. Parametric sensitivity analysis demonstrated that control voltage exerts approximately 3.3 times greater influence on transition kinetics than flow rate variation. Through comprehensive analysis of the formation and consumption mechanisms of N, O, O3, and NOx species, we established a complete plasma chemical reaction network. This scheme provides fundamental insights into reaction pathways while offering practical optimization strategies for DBD systems. For aerospace applications, this work holds particular significance by demonstrating that the identified control parameters can be directly applied to plasma-assisted treatment of propellant wastewater at launch sites, where the efficient removal of nitrogen-containing pollutants is crucial. These findings advance both the fundamental understanding of atmospheric-pressure plasma chemistry and the engineering applications of plasma-based environmental remediation technologies in aerospace operations.

1. Introduction

Dielectric barrier discharge (DBD) is widely recognized as an effective means of generating low-temperature plasma (LTP) at atmospheric pressure and has emerged as a prominent research focus in the field of plasma science and technology globally [1]. Compared with other plasma source, the advantages of DBD [2] are as follows: it can generate low-temperature plasma with high energy and high density in a large space, and under mild reaction conditions, it can non-selectively break the chemical bonds of large-molecule pollutants into non-toxic small molecular substances with high reaction efficiency and low energy consumption. What’s more, the DBD is stable and scalable from small laboratory reactors to large industrial plants with megawatt pulse power [3,4]. Therefore, atmospheric pressure DBD has unique technical advantages and broad application prospects in the field of pollutant degradation [5] and decontamination [6,7].
NOx and O3 are the main active substances of atmospheric pressure DBD [8]. As a powerful disinfectant and oxidant, O3 has a wide range of applications, such as water and air purification [9,10], material preparation and modification [11,12,13], food processing [14], pollutant degradation [15,16], and energy conversion [17]. NOx has wide applications in sterilization [18,19], tumor cell apoptosis [20,21], wound healing [22,23], etc., but it is also a pollutant [24]. The measurement methods of O3 mainly include traditional chemical methods [25], sensor measurement [26], absorption spectroscopy [27], and mass spectrometry (MS) [28,29]. The detection methods of NOx products mainly include Fourier transform infrared absorption spectrometry [23] and MS [28,29]. However, the chemical method is difficult to measure O3 continuously in real time, and the reaction process is complicated. Although O3 can be detected by the sensor measurement method in the gas discharging state, this state can only be realized in a specific experimental environment [26]. In cases with more complicated plasma constituents, a large wavelength range is required to simultaneously measure these plasma active substances, which places extremely high demands on the performance and resolution of the optical diagnostic system [30], thereby increasing the cost of the detection system. To study the chemical model, it is necessary to measure the concentration of various components such as NOx and O3 in real time with high precision over a long period of time and their variation with time. The above methods cannot meet this requirement. MS [31] has been commercialized worldwide as an instrument for trace element analysis. The information of different compounds or elements is obtained by measuring the ion mass-charge ratio, which can provide rich species information in one analysis. The high specificity and sensitivity of MS, make it a widely used analytical technique in research. MS technology is mainly as a measurement and diagnostic technique for low pressure discharge plasmas [32], where the plasma is generated at atmospheric pressure and reduced to low pressure by differential exhaust to perform mass analysis of elements in the plasma. However, reports on the measurement of reactive species in atmospheric pressure plasmas using this device remain scarce.
UV/IR spectroscopy has been used by Matthew Pavlovich [33] to study the content of O3 and NOx in atmospheric pressure and air surface micro-discharge plasma excited by high voltage sinusoidal AC It is pointed out that the O3 mod dominates at low power conditions, and the NOx mode is led at high power conditions. UV absorption spectroscopy was used by Shimizu et al. [34] to study the dynamic behavior of O3 in air surface micro-discharge plasma excited by sinusoidal alternating current amplified by a high-voltage amplifier at atmospheric pressure and the change of O3 density at constant power density. In-situ absorption spectroscopy was used by Sanghoo Park [8] to study the time evolution of O3 and NOx when the control parameters of the surface dielectric barrier discharge reactor excited by the output voltage of the traditional neon transformer are temperature. Pierotti [35] analyzed and summarized the experimental equipment of SDBD. They proposed a new 0D model to evaluate the production of O3 and NO2 by SDBD. The model’s accuracy was verified by comparing it with the experimental data of the absorption spectrum. The relationship between the production rate of O3 and NO2 and the pulse power of the SDBD reactor was calculated using the model. Malik et al. [36] reported the steady-state concentrations of O3, NO and NO2 in a non-equilibrium sliding discharge plasma reactor excited by a pulsed power supply based on magnetic pulse compression under atmospheric pressure air. By remotely monitoring the gas sampling in commercial O3 and NOx analyzers, the products were monitored by the two instruments, and it was difficult to control the spatial and temporal consistency. Liu [37] created a chemical kinetic model for atmospheric-pressure DBD, using the FTIR method to study and accurately describe the mode transition process of plasma products in a coaxial dielectric barrier discharge reactor driven by AC power, based on real energy density parameters. However, the experiment did not measure transient species such as N and O. Based on the above literature, the maximum detection time is found to be less than 20 min, and no additional studies have reported a longer detection time. M. Simek [38] measured the electrical and optical properties, as well as the concentration of ozone and nitrogen oxides produced in the dielectric barrier discharge on the surface of the air source. The measurements for ozone and nitrogen oxide lasted for 250 min. However, the measurement process used four instruments to monitor the product, making it difficult to control for time and space consistency. Additionally, it failed to measure transient species such as N and O.
This study investigates the fundamental mechanisms of plasma-chemical reactions in a dielectric barrier discharge (DBD) system utilizing high-purity air as the working medium. The research aims to establish a theoretical framework for optimizing DBD-based technologies, with a specific focus on addressing the critical environmental challenge of unsymmetrical dimethylhydrazine (UDMH) wastewater degradation at aerospace launch sites. Through a comprehensive analysis of reactive species generation and dynamics, particularly O3 and NOx, this work bridges the gap between fundamental plasma chemistry and its practical applications in environmental remediation. The experimental approach employs a pulsed high-voltage power supply to excite the DBD device, generating low-temperature plasma that effectively breaks chemical bonds in macromolecular pollutants, converting them into non-toxic small molecules such as carbon dioxide and water. Previous research conducted by Rocket Force Engineering University [1] and Aerospace Engineering University [39] has demonstrated the efficacy of DBD technology in UDMH wastewater treatment. These studies not only confirmed the technology’s potential but also identified a critical limitation: the chemical oxygen demand (COD) ceases to show significant decomposition in the later stages of degradation. This research addresses the pressing need to enhance the degradation rate of UDMH wastewater by systematically investigating the variation patterns of plasma generated during the DBD process. This study provides both theoretical insights and practical methodologies for improving the efficiency of UDMH wastewater treatment, offering significant contributions to the field of plasma-based environmental remediation technologies.
Various complex types of metastable particles are produced in the plasma, and the trends in their variation with time are of great significance to the study of plasma-chemical models. In this study, the online measurement of plasma components over a long time period was carried out by mass spectrometry. By controlling the airflow rate and the discharge voltage in the plasma reaction zone to regulate the energy density, the chemical interactions between air-based plasma source O3 and NOx were investigated and the rapid changes in the plasma-chemical mode associated with O3 and NOx were demonstrated.

2. Experimental Device and Measurement Method

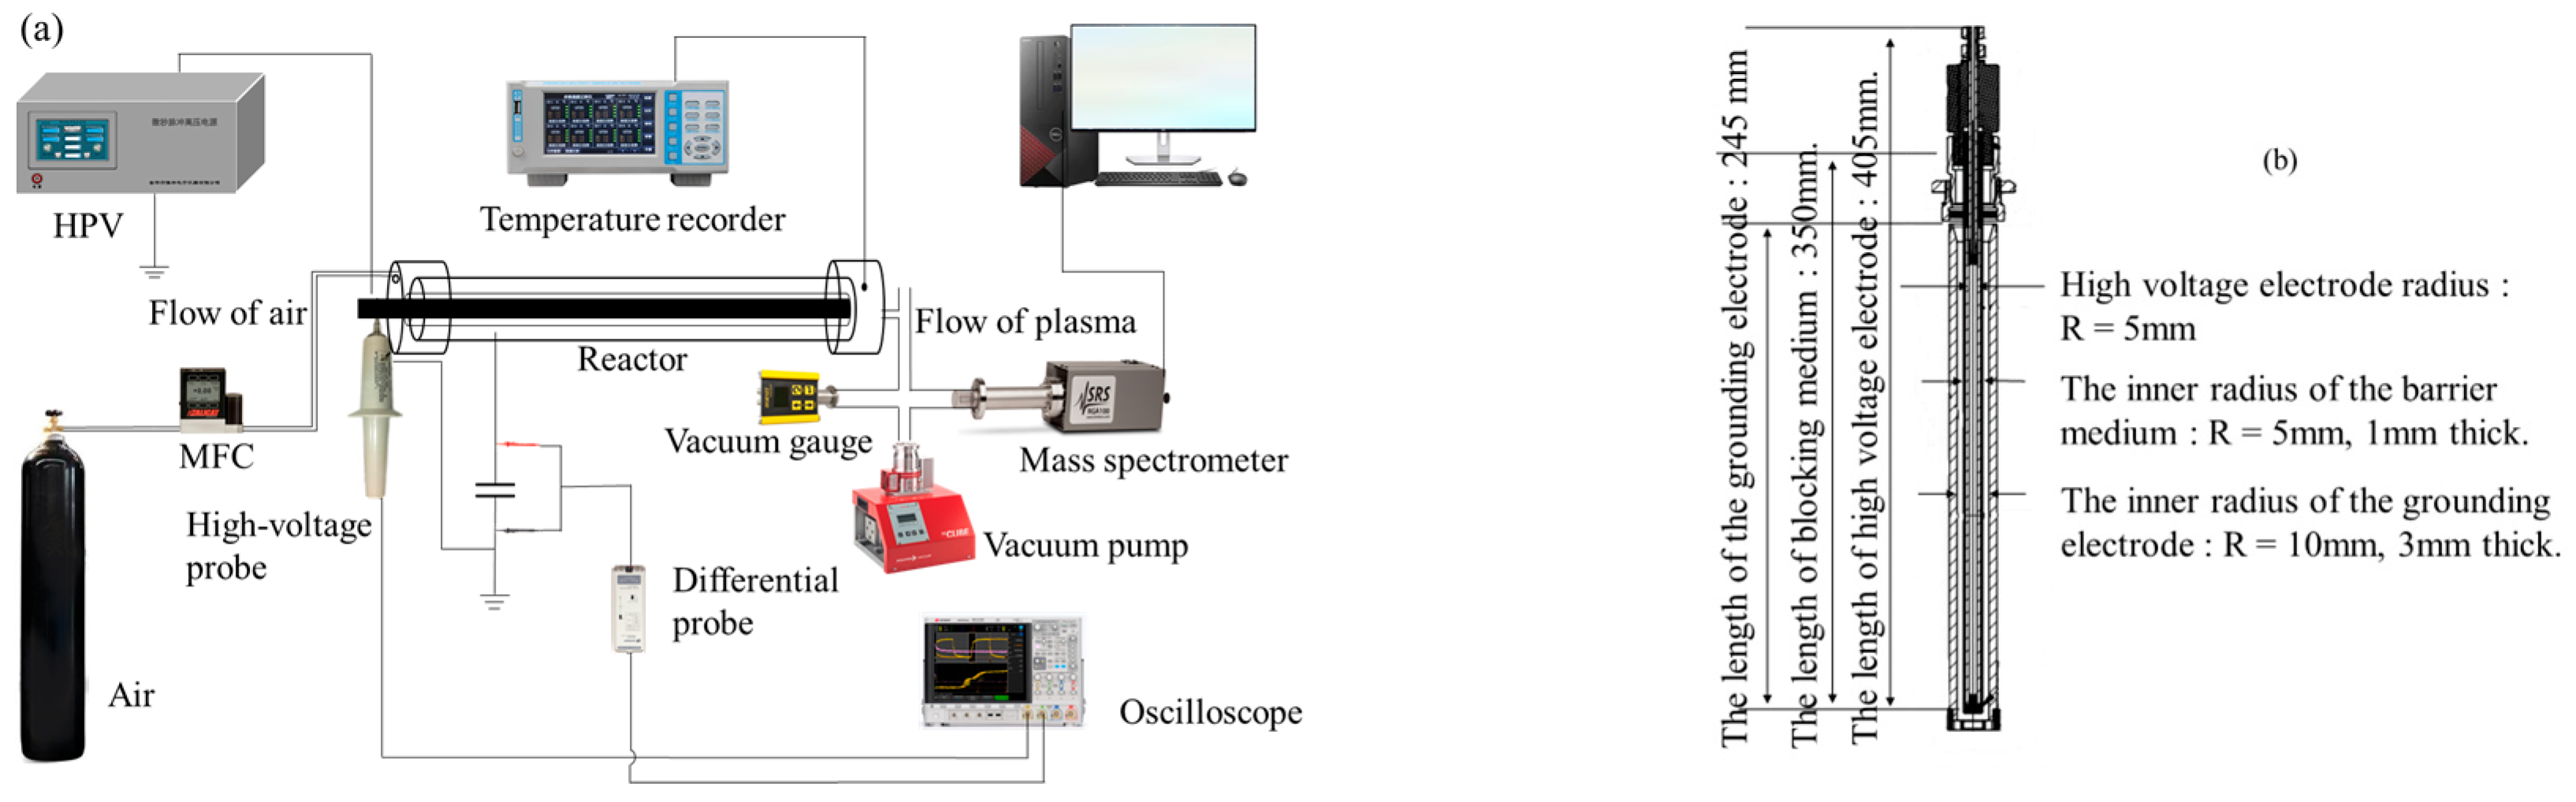
2.1. Coaxial DBD Device and Diagnostic System

The experimental setup, as illustrated in Figure 1a, consists of a coaxial DBD device. Figure 1b provides a detailed cross-sectional view of the DBD device. The apparatus consisted of three main parts: a discharge system, a gas system, and a measurement system. The high-voltage electrode is a stainless steel cylinder with a radius of 5 mm and a length of 405 mm. The earth electrode is a hollow stainless steel cylinder with an inner radius of 10 mm, a length of 245 mm, and a thickness of 3 mm. The barrier medium was a hollow cylinder of tubular quartz glass with an internal radius of 5 mm, a thickness of 1 mm, and a length of 350 mm. The air gap was 4 mm, and a positioning sleeve ensured that the high and low voltage electrodes were coaxial. The high-voltage electrode, ground electrode, and barrier medium were connected by stainless steel components. The actual output voltage corresponding to the input voltage values of 120, 130 and 140 V in the experiment is shown in Table 1. The voltage between the output end of the high-voltage power supply and the ground electrode is sampled by a Tektronix P6015A high-voltage probe with an attenuation coefficient of 1000, and the voltage at both ends of an 8.4 nF lossless capacitor in series between the reactor and the ground potential is sampled by a Tektronix N2971A high-voltage differential probe with an attenuation coefficient of 100, both measured by an MSOX4104A mixed-signal oscilloscope. The high-purity air (79% N2 and 21% O2 and other negligible pollutants) is supplied by Huairou Branch of Beijing Huaiquanhe Gas Co., Ltd. (Beijing, China), and the airflow rate is controlled by an ALICAT gas flow controller. The mass flow controller control range is 0–10 L/min. The active substances are measured using the SRS RGA100 MS, which can simultaneously measure the partial pressure of O3 and various NOx and the change of each partial pressure with time. The K-type thermocouple was placed at the discharge gas outlet to measure. The thermocouple test probe is spherical, the diameter of the ball is 1 mm and the measurement temperature range is −50–200 °C. The plasma gas temperature was recorded in real time by the Ruixi CTR-390 temperature recorder.
Figure 2 presents the output characteristics of the microsecond-pulsed high-voltage power supply operated at a control voltage of 130 V. The power supply generates bipolar pulses with peak voltages of +13.22 kV (positive pulse) and −12.05 kV (negative pulse) at a repetition period of 1 ms. As evident from the expanded waveform in Figure 2b, the discharge pulse exhibits a full width at half maximum (FWHM, τ0.5) of 3.6 μs and a total pulse width (τ) of 6 μs, confirming the microsecond-scale temporal characteristics of the discharge.
MS is mainly composed of electron bombardment ion source, quadrupole mass analyzer and ion detector, the value displayed by the vacuum gauge is the inlet pressure calibrated by nitrogen. The mass scanning range is m/z 1~100, and the resolution is better than 0.5 at 10% peak height. In the Faraday cup mode, the sensitivity of the instrument is 1.5 × 10⁻⁶ A/Pa, the minimum detectable partial pressure is 6.67 × 10⁻⁹ Pa, and the working pressure is 1.33 × 10⁻² Pa up to the ultra-high vacuum range (10−6~10−12 Pa); Under the multi-channel continuous multiplier tube electron multiplier, the sensitivity of the instrument is less than 1.50 A/Pa, the minimum detectable partial pressure is 6.67 × 10⁻¹² Pa, and the working pressure is 1.33 × 10⁻⁴ Pa up to the ultra-high vacuum region (10−6~10−12 Pa) [40]. The quadrupole mass spectrometer used in this paper uses an electron bombardment ion source and uses electron collision ionization. The probability of the two-body collision rate of the molecular beam under high vacuum conditions is very low, and the molecules and free radicals in the plasma can be effectively retained after sampling [41].

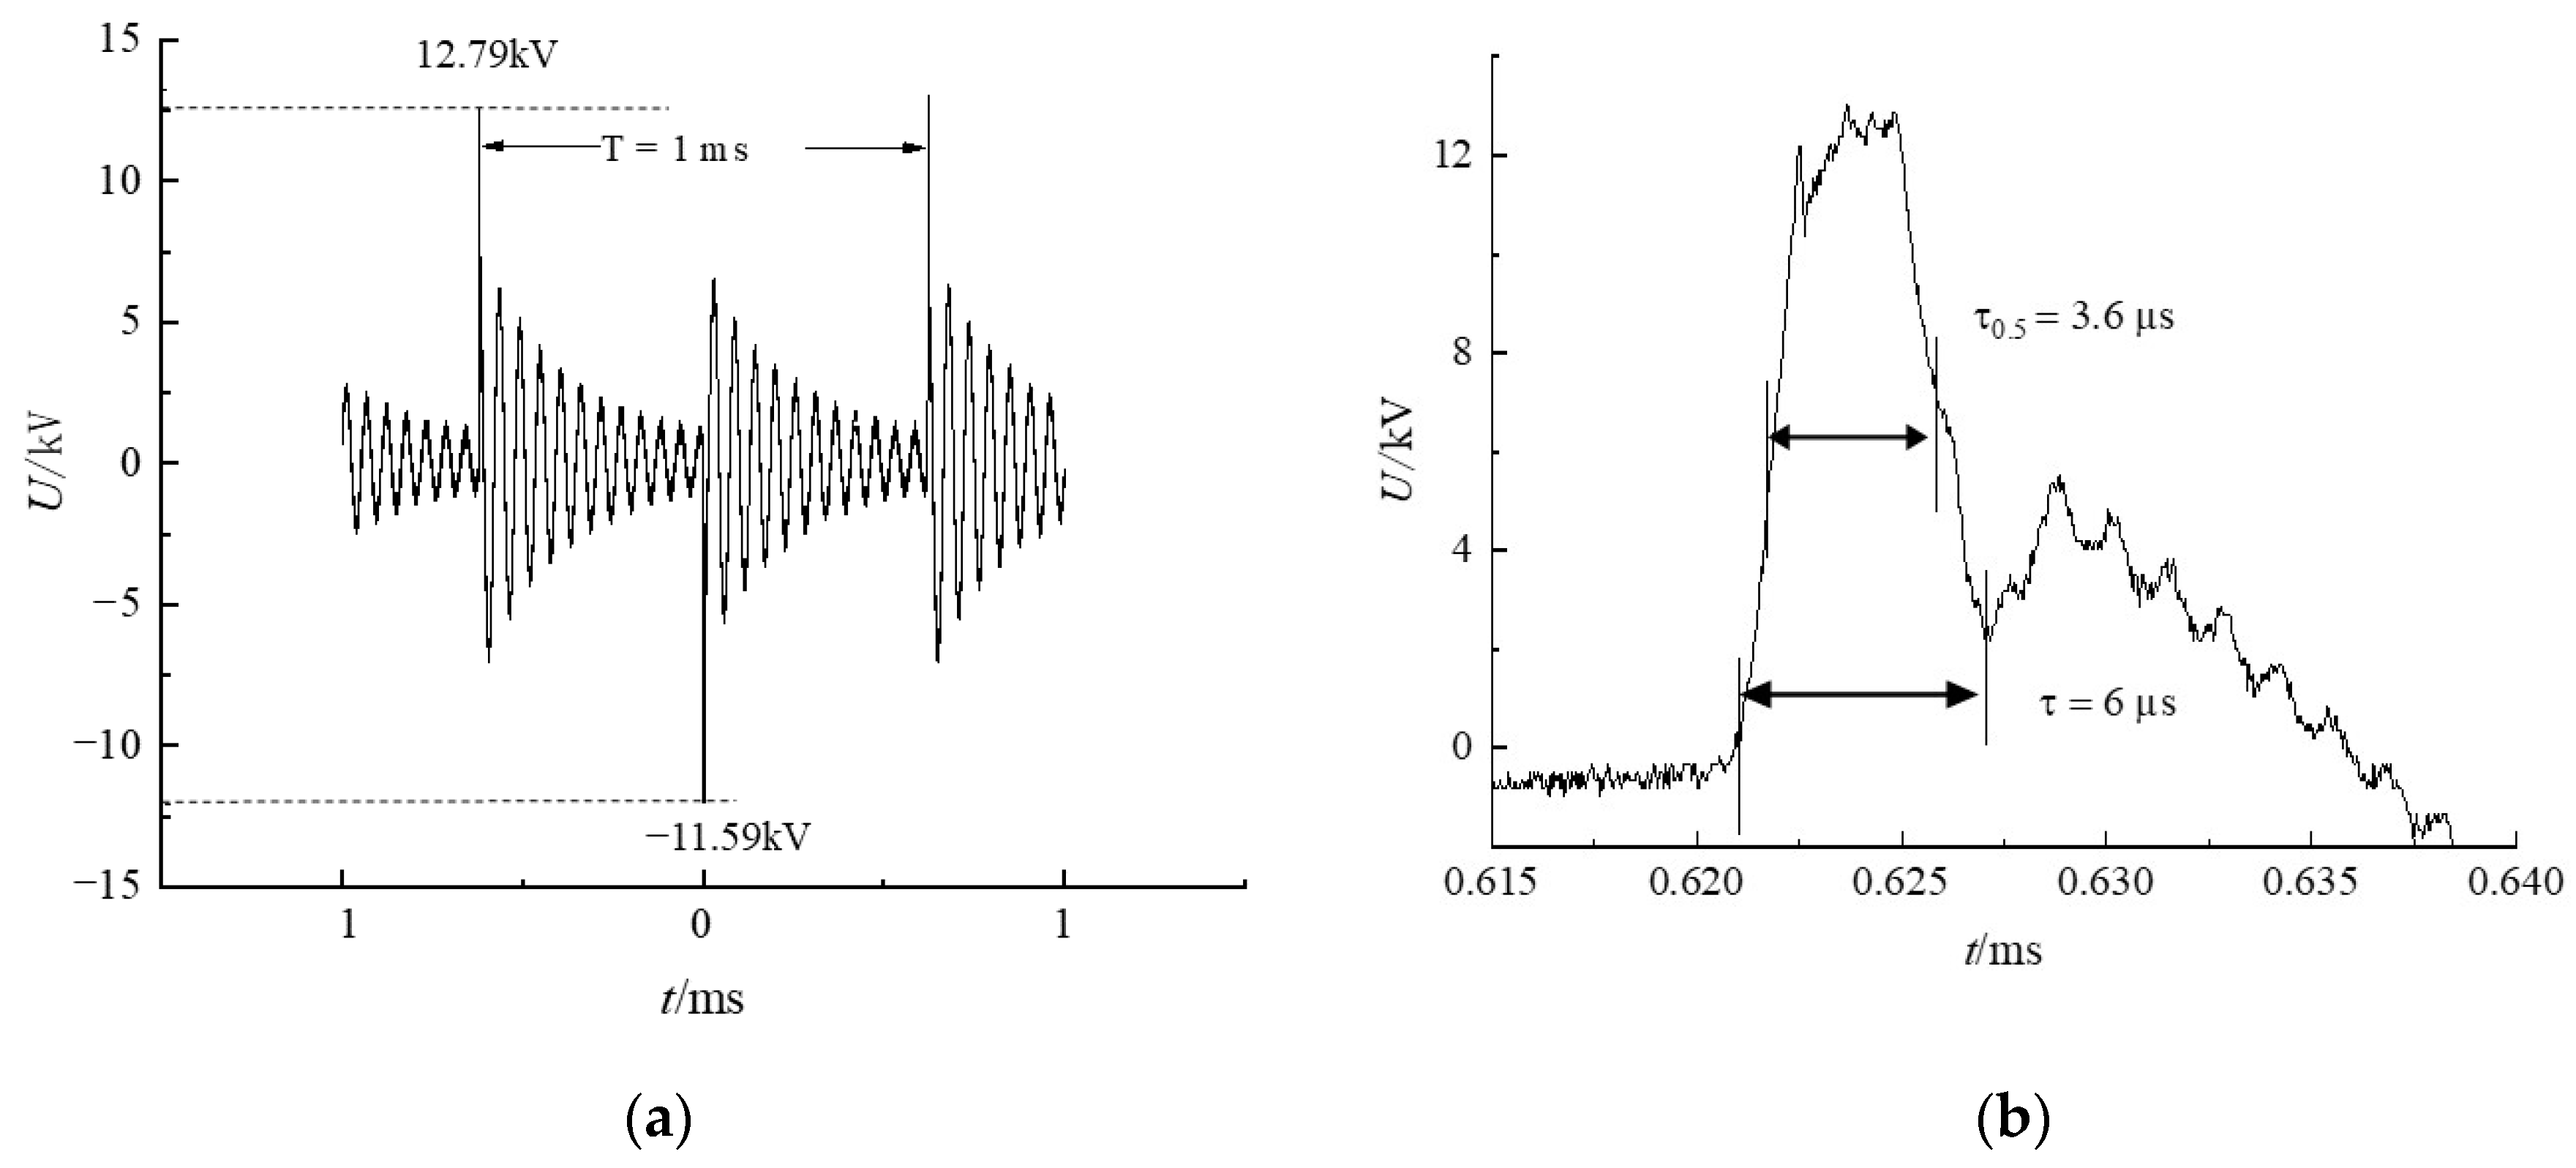
2.2. Measurements of Lissajous Figure and Active Substances

The discharge power was calculated using the Lissajous method [39,42,43], which integrates the voltage-charge characteristics to provide an accurate measure of energy input. Wang and Zhang [42] comprehensively studied the influence of measuring elements on the stability of the DBD system, clearly pointing out that when studying the electrical characteristics of DBD, priority should be given to the use of measuring elements with large resistance and small capacitance to ensure the accuracy of measurement results and the stability of the system. Wang et al. [43] further verified the applicability of the Lissajous method in calculating the discharge power of pulsed plasma, and pointed out that the nF level capacitor is more suitable for the calculation of discharge power under high voltage conditions. This finding provides a significant foundation for the selection of the appropriate measurement capacitance. Huang et al. [39] is directly employed as the theoretical foundation for the capacitance selection of the measurement method in this study, thereby providing a robust theoretical basis for our experimental design and data analysis.
In view of the problem that the working pressure of the mass spectrometer is usually 0.1 Pa, which cannot be directly used to measure and analyze the various metastable particles produced in the plasma of the DBD at atmospheric pressure. In this paper, the key components such as the low-pass tube, turbine pump and needle valve are integrated into the mass spectrometer, which realizes the high-precision adjustment of the working pressure in a wide range and can be stabilized at a suitable working pressure value. The problem of strong interference from the pulsed high-voltage power supply used to generate the plasma to the mass spectrometer is solved by using an insulated silicone tube between the mass spectrometer and the reactor.
To determine the partial pressure value of the various metastable particles produced in the plasma, the SRS RGA100 MS was used to scan and obtain the mass-to-charge ratio in the range 0 to 50. The inlet pressure was set at 3.4  ×  10−3 Pa, the airflow rate of high purity air is controlled by the flow controller, and the plasma is generated by ionization in the discharge chamber of the dielectric barrier discharge. The various metastable particles produced in the plasma then flows out of the chamber and is injected into the vacuum tube to measure the change in partial pressure of the various metastable particles produced in the plasma, as shown in Figure 1a. The MS was set in the multi-channel continuous multiplier tube mode, and the minimum detectable partial pressure was 6.67 × 10⁻¹² Pa, which was sufficient to measure the resulting various metastable particles produced in the plasma. All MS data were automatically recorded by a computer.
The travel time of the exhaust gas expelled from the reactor of the experimental system to the test point was 3.4 s, and the decomposition half-life of O3 at room temperature is 15 to 30 min [44]. At room temperature, the chemical bond of NO2 is relatively stable. However, it decomposes when the temperature exceeds 150 °C [45]. It decomposes completely to NO and O2 at 650 °C [45]. N2O is relatively stable at room temperature but begins to decompose when heated above 300 °C [45]. In low temperature plasma applications, especially in DBD, NO has a single-electron paramagnetic free radical, and its reactivity is relatively low. It is relatively stable at room temperature but is easily oxidized to NO2 in the air [45]. The partial pressure values of the four various metastable particles produced in the plasma mentioned above were measured by MS in this experiment. However, the partial pressure of NO3, N2O3, N2O4, and N2O5 cannot be measured by MS, due to their short-live chemical property in the experimental conditions.

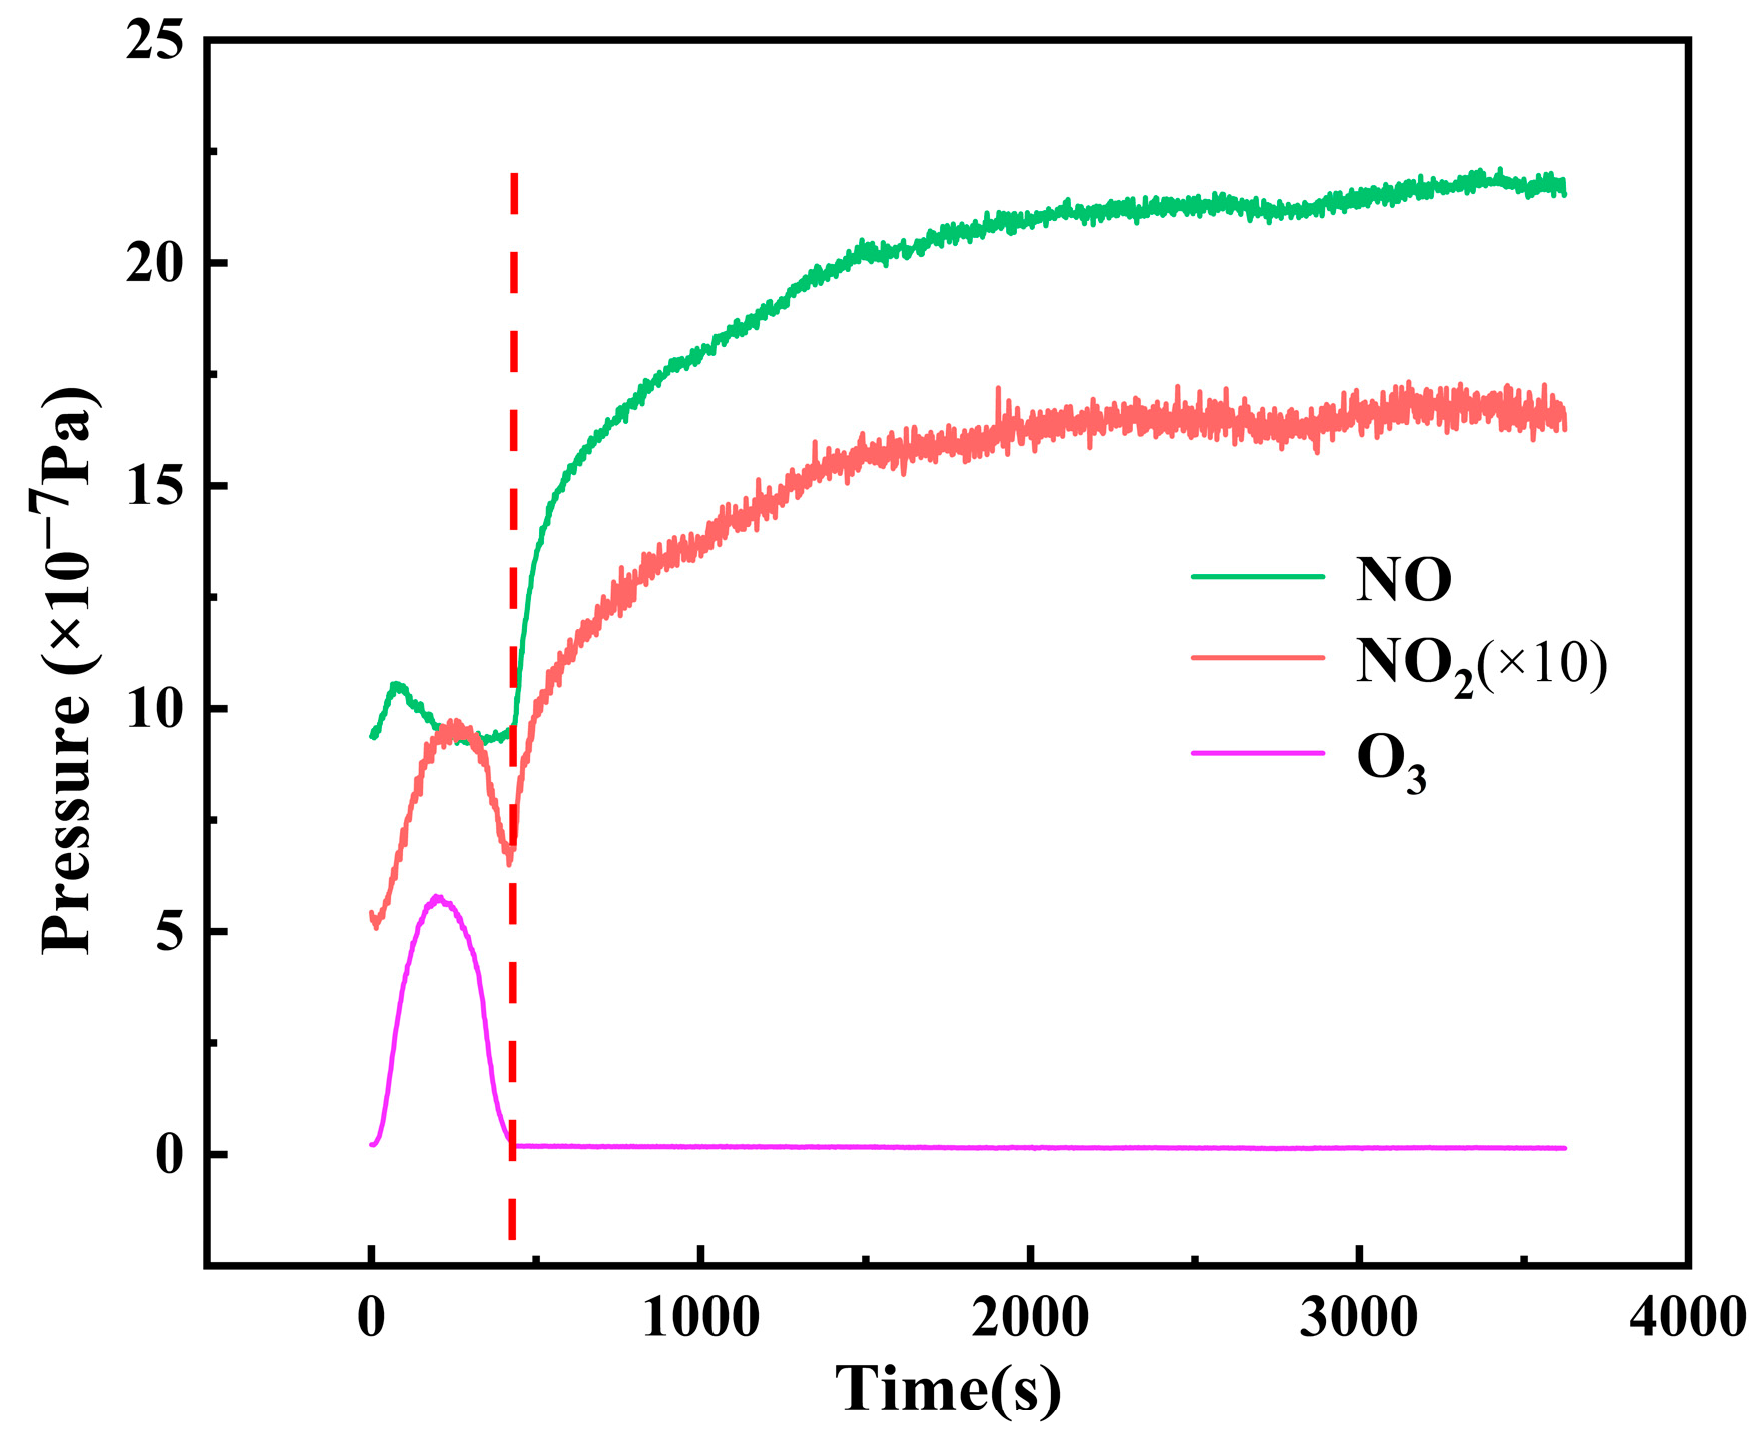
3. Experimental Results and Analysis

The present study employs the pressure-time (P-T) model to real-time monitor the partial pressure changes of key species. Specifically, the temporal evolution of species concentrations, as determined by their characteristic mass-to-charge ratios (m/z), enables the precise tracking of reaction pathways and the elucidation of the competition mechanism between O3 and NOx species. The findings provide experimental and theoretical insights for the optimization of parameters and the regulation of mechanisms in plasma chemical processes, including for nitrogen (N, m/z = 14), oxygen (O, m/z = 16), nitric oxide (NO, m/z = 30), nitrous oxide (N2O, m/z = 44), nitrogen dioxide (NO2, m/z = 46), and ozone (O3, m/z = 48), using mass spectrometry. The experiments were conducted under conditions of a control voltage of 140 V and a gas flow rate of 0.5 L/min, with a focus on elucidating the kinetic characteristics of the transition from an O3-NOₓ-d ominated regime to a NOₓ-dominated regime in plasma chemistry.
As illustrated in Figure 3, during the continuous discharge process over approximately one hour, the partial pressures of O3 and NOx exhibited significant time-dependent variations. An analysis of the temporal profiles of NO, NO2, and O3 partial pressures revealed a distinct kinetic transition point at t = 417 s. This transition point is defined as the critical time point, demarcating two distinct plasma chemical regimes: the transitional period characterized by the presence of O3 partial pressure before the transition, and the subsequent phase marked by a rapid increase in NO and NO2 partial pressures accompanied by the disappearance of O3 partial pressure. The “t = 0” is actually the first detection time point after the discharge is initiated (not the absolute zero point), and a trace amount of active species have been generated at the moment of the discharge.
The underlying mechanism of this kinetic behavior can be explained as follows: during the initial activation phase of the dielectric barrier discharge (DBD) reactor, the high-voltage power supply induces extensive dissociation of N2 and O2 molecules, generating highly reactive N and O atoms, which rapidly form O3 and NOx species. As the reaction proceeds, the system reaches a quasi-steady state, and the concomitant temperature rise leads to a reduction in the rate of particle generation, manifesting as a gradual decline in partial pressures. This experimental observation is in excellent agreement with the results reported in reference [8], thereby robustly validating the reliability of mass spectrometry in plasma chemical kinetics research.
Based on the evolution of plasma partial pressures depicted in Figure 3, the onset of the second significant rise in NO2 partial pressure was identified as the critical time. This time point corresponds to the transition in plasma chemical regimes and holds clear physicochemical significance, thus being selected as the characteristic temporal parameter for regime transition.
As depicted in Figure 4a, with the control voltage maintained at 140 V, the transition times of the plasma-chemical mode for airflow rates ranging from 0.5 to 5.5 L/min were determined to be 408, 524, 614, 712, 778, and 1210 s, respectively. Oxygen flow rate range: 0.5–5.5 L/min, increasing in 1.0 L/min increments. This shows that the airflow rate affects the chemical interaction between O3 and NOx. In Figure 4a, the partial pressure of NO2 at different airflow rates first increased briefly by a small amount and then dropped. After the critical time, the partial pressures increased again at different rates, but the partial pressure for an airflow of 0.5 L/min eventually became stable, whereas the partial pressures for airflow rates of 1.5–5.5 L/min all decreased with time. At 0.5 L/min–1.5 L/min, as the gas flow increases, the NO2 partial pressure shows a downward trend. The partial pressure results in Figure 4b show that after the formation of a discharge channel in the DBD reactor, O3 was immediately actively generated, and its partial pressure increased sharply. And the partial pressures at airflow rates of 0.5–5.5 L/min reached their respective peaks with almost the same growth rate. The peaks were 5.79 × 10⁻⁷, 5.14 × 10⁻⁷, 4.58 × 10⁻⁷, 3.78 × 10⁻⁷, 3.33 × 10⁻⁷, and 2.91 × 10⁻⁷ Pa. Oxygen flow rate range: 0.5–5.5 L/min, increasing in 1.0 L/min increments. which means the higher the airflow rate, the lower the peak value of the partial pressure of O3. At the same time, the active power changed very small (50.3, 51.2, 51.6, 50.6, 51.7, and 50.6 W respectively). Subsequently, the partial pressure of O3 began to decrease with time until after reaching the critical time, it can be assumed that no O3 is formed when the mass spectrometer detects a pressure below the minimum threshold. It can be observed that with the airflow rates increased, the residence time of O3 was prolonged, but the peak value of the partial pressure of O3 was reduced. As shown in Figure 4c, the macroscopic temperature of the plasma gas did not change much when the airflow rate was 1.5–5.5 L/min but changed when the airflow rate was 0.5 L/min and was significantly lower than that at the high airflow rate of N2 and O2. This indicates that the decomposition of O3 was not caused by pure thermal decomposition. As the airflow rate increased, the residence time of the gas in the discharge space decreased; that is, the collisions between electrons and O2 and the collisions between O2 and excited oxygen atoms decreased, thereby reducing the partial pressure of O3 and affecting the transition speed of the plasma-chemical mode.
Figure 4d illustrates the temporal evolution of NO2 generation in the plasma under a constant airflow rate of 3.5 L/min and control voltages of 120, 130, and 140 V. The transition times were 2367, 1066, and 718 s, respectively, and the order of the transition time was TU=120 V ˃ TU=130 V ˃TU=140 V, where U is the control voltage. The useful power was 38.3, 44.8, and 50.6 W, respectively, and the order of the active power was pU=120 V ˂ pU=130 V ˂ pU=140 V, where U is the control voltage. These results show that the Transition mode (the coexistence of O3 and NO) changed to the NOx mode faster as the voltage increased. With an increase in the applied voltage on the electrode, the intensity of the Laplace electric field [46,47,48] increases, the energy injected into the plasma changed the chemical reaction rate between atoms and molecules in the air gap of the reactor, resulting in the change of the concentration of the various metastable particles produced in the plasma and a decrease in the transition time. When the control voltage was increased from 120 to 140 V, the macroscopic temperature change in the plasma gas was more obvious, as shown in Figure 4e. The increase in temperature destroys O3 and then promotes the formation of NOx.
Using Equation (1), the energy densities at different airflow rates were calculated to be 6037.2, 2048.8, 1237.9, 867.8, 689.7, and 552.1 J/L, respectively. The energy densities followed the order: The SIE values decreased sequentially from 0.5 to 5.5 L/min in 1.0 L/min steps. The energy densities at control voltages of 120, 130, and 140 V were 656.6, 767.1, and 867.8 J/L respectively, with the order SIEU=120 V ˂ SIEU=130 V ˂ SIEU=140 V, where U is the control voltage, indicating that changing the airflow rate of N2 and O2 and the control voltage can regulate the energy density. According to Figure 4f, changing the control voltage has a greater effect on the transit time than changing in the airflow rate.
S I E = 60 P Q
where SIE is the energy density in J/L, P is the active power in W, and Q is the gas flow rate in SL/min.
During the initial discharge phase, neutral gas molecules (N2 and O2) undergo electron-impact dissociation (e + N2 → e + N + N) to form atomic nitrogen and oxygen species. As the discharge progresses, ion-molecule reactions emerge as the predominant reaction pathway [49]. The elevated energy density substantially increases both electron temperature and ion density, thereby accelerating Penning ionization and charge transfer processes. This enhancement leads to a significant reduction in the transition time required for ozone decomposition and nitrogen oxide formation.

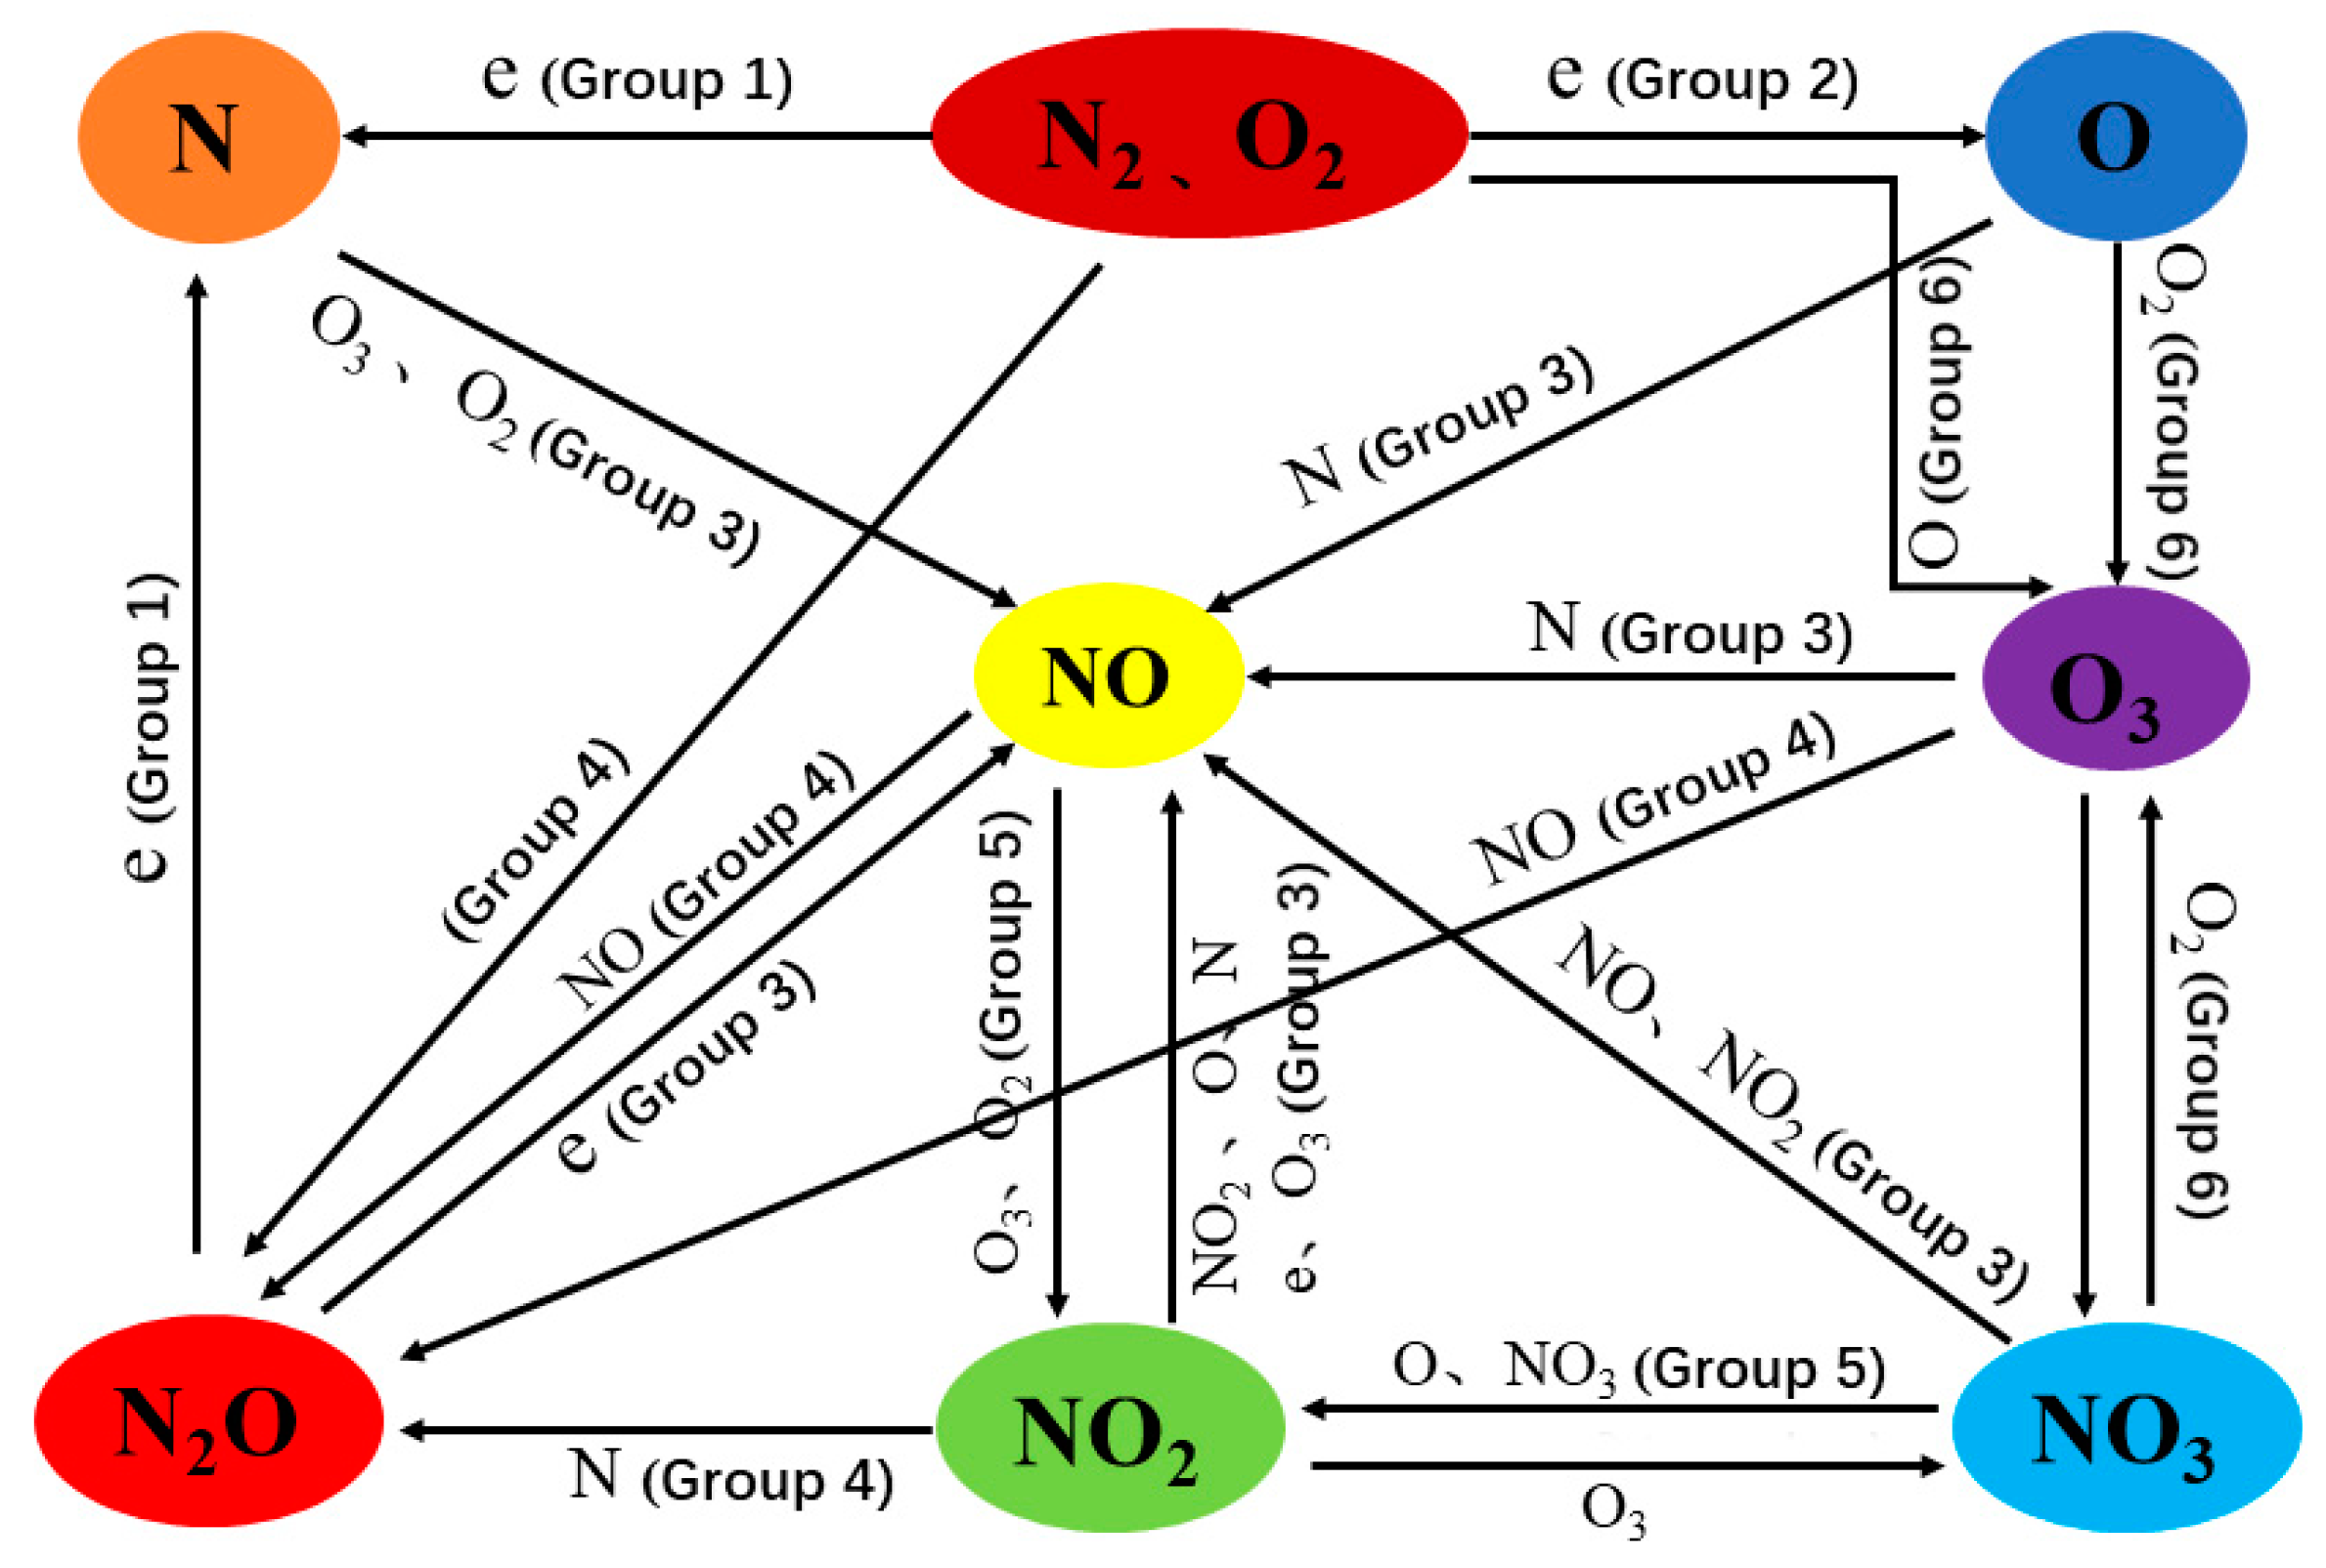
4. Investigation of the Chemical Reaction Mechanism in the Nitrogen-Oxygen System Using Mass Spectrometry

In this work, MS measurements were performed on N, O, NO, N2O, NO2, and O3. Key chemical reactions were analyzed by their partial pressure changes with time. In a dry airflow rate of N2 and O2, there were mainly 74 chemical reactions [23]. They were divided into 12 groups according to the production and consumption of N atoms, O atoms, O3, and NOx, see Appendix A for detailed grouping. Figure 5 shows the chemical reaction mechanism diagram of DBD at the airflow rate of nitrogen and oxygen. Due to the differences in experimental equipment such as reactors and power supplies used by different researchers, the chemistry in the air gap of the reactor has a highly non-linear property [3,37,50,51,52,53,54,55].
Figure 6 shows the changes in the chemical reaction of N, O, O3 and NOx in the plasma over time when the control voltage is 130 V and the airflow rate is 4.5 L/min. As the control voltage increased, the gas decomposed and N2 and O2 dissociated, producing large quantities of N and O atoms. The main chemical reactions were e + N2 → e + N +N and e+ O2 → e + O + O, then a large amount of O3 and NOx. As time progressed, the number of N atoms and O atoms continued to decrease owing to the consumption of the generation of O3 and NOx products as the plasma evolved. However, once the critical time past, it was mainly NOx that was produced and no more O3. In the time evolution of the plasma, the main product of O3 was formed first, and the change trends of NO and NO2 were consistent with those of O3. This is mainly because the ability to produce O atoms exceeds the ability to produce O3. For example, N2O, NO2 and other NOx are formed when O atoms are captured by N atoms. However, when the partial pressure of NOx exceeds the transition time as time progresses, O3 and O atoms may be quickly consumed in the reactions. The main chemical reactions are groups 8 and 12. While NOx, i.e., Groups 3, 4, and 5, may consume the main component O atoms produced by O3. The main products are therefore NO2, N, and N2O. At a certain moment after the critical time, the partial pressures of N2O and NO will reach another peak value, and then the production and consumption of NOx will reach an equilibrium state. After this partial pressure peak, the partial pressure value will show a decreasing trend. This is mainly due to the increase in the macroscopic temperature of the plasma; an increase in temperature causes the gas to expand, which reduces the total amount of gas entering the mass spectrometer and therefore reduces the partial pressure.

5. Conclusions

This study investigated a coaxial cylindrical atmospheric pressure dielectric barrier discharge (DBD) system powered by a microsecond pulsed high-voltage source. An innovative mass spectrometry-based methodology was developed for the quantitative measurement of metastable species generated in atmospheric pressure DBD plasma. By systematically varying both gas flow rate and control voltage to modulate energy density, we elucidated the chemical interactions between O3 and NOx species in air-based plasma.
Key findings include:
(1)
Gas flow rate and control voltage significantly influence the O3-NOx chemical equilibrium. Higher flow rates prolong the transition from O3-NOx coexistence to NOx-dominant mode, while increased control voltage accelerates this transition.
(2)
At fixed 140 V control voltage with flow rates ranging from 0.5 to 5.5 L/min, the corresponding energy densities (6037.2–552.1 J/L) yielded transition times from 408 s to 1210 s.
(3)
At constant 3.5 L/min flow rate, control voltages of 120–140 V (energy densities 656.6–867.8 J/L) produced transition times from 2367 s to 718 s, demonstrating greater sensitivity to voltage variation.
These findings provide fundamental insights into plasma-chemical processes in coaxial DBD systems and offer practical guidance for optimizing DBD-based wastewater treatment technologies. Under the condition of improving the coexistence state of O3-NOx, Future research should focus on:
(1)
System scale-up while maintaining reaction characteristics
(2)
Practical implementation studies addressing environmental factors and parameter optimization for enhanced treatment efficiency
The developed methodology and obtained results significantly advance the understanding of atmospheric pressure plasma chemistry and its environmental applications.

Author Contributions

Author Contributions: Conceptualization, D.W., T.Z. and M.W.; methodology, all authors; validation, T.Z.; formal analysis, T.Z.; investigation, T.Z.; resources, all authors; data curation, T.Z.; writing—original draft preparation, T.Z.; writing—review and editing, B.D., Y.Z. and J.H.; visualization, T.Z.; supervision, D.W.; project administration, D.W. All authors have read and agreed to the published version of the manuscript.

Funding

This research was funded by Independent Research Project of the State Key Laboratory under Grant, grant number SKLLPA-202205.

Data Availability Statement

Dataset is available on request from the authors.

Conflicts of Interest

The authors declare no conflicts of interest.

Appendix A

Grouped according to chemical reactions that produce and consume N, O, O3, and NOx atoms:
Group 1: The main chemical reactions to generate N are:
O + NO O 2 + N e + NO e + O + N e + N 2 e + N + N e + N 2 O e + NO + N
Group 2: The main chemical reactions to generate O are:
e + O 2 e + O + O e + N 2 O e + O + N 2 e + NO 2 e + O + NO N 2 + O 3 O + O 2 + N 2 O 2 + O 3 O + O 2 + O 2 O 3 + O 3 O + O 2 + O 3 N + NO 2 N 2 O + O NO + NO N 2 O + O N + NO N 2 + O N + O 2 NO + O N 2 + O 2 N 2 O + O NO + O 2 NO 2 + O NO + e e + N + O
Group 3: The main chemical reactions to generate NO are:
e + NO 2 e + O + NO e + N 2 O e + N + NO O + N + N 2 N 2 + NO O + N + O 2 O 2 + NO O + N + O 3 O 3 + NO O + NO 2 O 2 + NO NO + NO 3 O 2 + NO + NO NO 2 + NO 2 O 2 + NO + NO NO 2 + NO 2 NO 3 + NO NO 2 + NO 3 NO 2 + O 2 + NO M + N 2 O 3 NO 2 + M + NO O + NO 2 NO + NO N + O 2 O + NO N + O 3 O 2 + NO NO 2 + O 3 O 2 + O 2 + NO N + NO 2 NO + NO NO + NO 3 O 2 + NO + NO NO 2 + NO 2 O 2 + NO + NO NO 2 + NO 2 NO 3 + NO
Group 4: The main chemical reactions to generate N2O are:
N + NO 2 O + N 2 O NO + NO O + N 2 O NO + NO 2 + N 2 N 2 + N 2 O NO + NO 2 + O 3 O 3 + N 2 O O 2 + N 2 O + N 2 O
Group 5: The main chemical reactions to generate NO2 are:
NO 3 + NO 3 O 2 + NO 2 + NO 2 N 2 O 3 + M M + NO + NO 2 N 2 O 4 + M M + NO 2 + NO 2 N 2 O 5 + M M + NO 3 + NO 2 NO 3 + NO 2 O 2 + NO + NO 2 O + NO 3 O 2 + NO 2 NO + O 2 O + NO 2 NO + NO + O 2 NO 2 + NO 2 NO 3 + O 2 O 3 + NO 2 O 3 + NO O 2 + NO 2
Group 6: The main chemical reactions to generate O3 are:
O + O + O 3 O 2 + O 3 O + O 2 + O 2 O 2 + O 3 O + N 2 + O 2 N 2 + O 3 O + O 2 + O 3 O 3 + O 3 O 3 + O 3 O + O 2 + O 3 O + N + O 3 NO + O 3 O + NO + O 3 NO 2 + O 3 NO 3 + O 2 NO 2 + O 3 NO + NO 2 + O 3 N 2 O + O 3 NO 2 + NO 2 + O 3 N 2 O 4 + O 3 NO 3 + NO 2 + O 3 N 2 O 5 + O 3
Group 7: The main chemical reactions that consume N are:
N + O 3 NO + O 2 N + NO O + N 2 N + NO 2 N 2 + O 2 N + NO 2 NO + NO N + NO 2 N 2 O + O N + N + N 2 N 2 + N 2 N + N + O 2 N 2 + O 2 N + N + O 3 N 2 + O 3 N + O + N 2 N 2 + NO N + O + O 2 O 2 + NO N + O + O 3 O 3 + NO
Group 8: The main chemical reactions that consume O are:
O + N + N 2 N 2 + NO O + N + O 2 O 2 + NO O + N + O 3 O 3 + NO O + NO O 2 + N O + NO + N 2 N 2 + NO 2 O + NO + O 2 O 2 + NO 2 O + NO + O 3 O 3 + NO 2 O + NO 2 O 2 + NO O + NO 2 + N 2 N 2 + NO 3 O + NO 2 + O 2 O 2 + NO 3 O + NO 2 + O 3 O 3 + NO 3 O + N 2 O N 2 + O 2 O + O + N 2 N 2 + O 2 O + O + O 2 O 2 + O 2 O + O + O 3 O 3 + O 2 O + O 2 + O 2 O 2 + O 3 O + N 2 + O 2 N 2 + O 3 O + O 2 + O 3 O 3 + O 3 O + O 3 O 2 + O 2 O + N 2 O NO + NO O + NO 3 NO 2 + O 2 O + N 2 O 5 + O 3 N 2 + O 2 + O 2 + O 2
Group 9: The main chemical reactions that consume NO are:
NO + NO N 2 O + O NO + NO N 2 + O 2 NO + NO 2 + O 2 NO 3 + O 2 NO + NO 2 + N 2 N 2 O + N 2 NO + NO 2 + O 3 N 2 O + O 3 NO + N 2 O NO 2 + N 2 NO + NO 3 NO 2 + NO 2 NO + NO 3 NO + NO + O 2 NO + N O + N 2 NO + O 2 NO 2 + O NO + NO + O 2 NO 2 + NO 2 NO + e e + N + O NO + O O 2 + N NO + O + N 2 NO 2 + N 2 NO + O + O 2 NO 2 + O 2 NO + O + O 3 NO 2 + O 3
Group 10: The main chemical reactions that consume N2O are:
N 2 O + NO NO 2 + N 2 N 2 O + O NO + NO N 2 O + e NO + N + e N 2 O + e N 2 + O + e N 2 O + O N 2 + O 2
Group 11: The main chemical reactions that consume NO2 are:
NO 2 + NO 2 + O 2 N 2 O 4 + O 2 NO 2 + NO 2 + N 2 N 2 O 4 + N 2 NO 2 + NO 2 + O 3 N 2 O 4 + O 3 NO 2 + NO 3 NO + NO 2 + O 2 NO 2 + NO 3 + N 2 N 2 O 5 + N 2 NO 2 + NO 3 + O 2 N 2 O 5 + O 2 NO 2 + NO 3 + O 3 N 2 O 5 + O 3 NO 2 + NO + N 2 N 2 O + N 2 NO 2 + NO + O 2 NO 3 + O 2 NO 2 + NO + O 3 N 2 O + O 3 NO 2 + NO 2 NO + NO + O 2 NO 2 + NO 2 NO 3 + NO NO 2 + O 3 NO + O 2 + O 2 NO 2 + O 3 NO 3 + O 2 NO 2 + N N 2 + O 2 NO 2 + N NO + NO NO 2 + O NO + O 2 NO 2 + O + O 2 O 2 + NO 3 NO 2 + O + N 2 N 2 + NO 3 NO 2 + O + O 3 O 3 + NO 3 NO 2 + e NO + O + e
Group 12: The main chemical reactions that consume O3 are:
O 3 + NO 2 + NO 2 O 3 + N 2 O 4 O 3 + NO 2 + NO 3 O 3 + N 2 O 5 O 3 + N + O O 3 + NO O 3 + NO + O O 3 + NO 2 O 3 + NO 2 + O O 3 + NO 3 O 3 + O + O O 3 + O 2 O 3 + O O 2 + O 2 O 3 + O 3 O 2 + O 2 + O 2 O 3 + N 2 O + N 2 + O 2 O 3 + O 2 O + O 2 + O 2 O 3 + O 3 O + O 2 + O 3 O 3 + N NO + O 2 O 3 + NO NO 2 + O 2 O 3 + NO 2 NO 3 + O 2 O 3 + NO 2 NO + O 2 + O 2

References

  1. Mu, X.G.; Wang, X.J.; Zhang, Y.; Liu, B.; Yang, J.J. Major products and their formation and transformation mechanism through degrading UDMH wastewater via DBD low temperature plasma. Environ. Technol. 2021, 42, 2709. [Google Scholar] [CrossRef] [PubMed]
  2. Kogelschatz, U. Fundamentals and Applications of Dielectric Barrier Discharges; ABB Corporate Research Ltd.: Baden, Switzerland, 2003. [Google Scholar]
  3. Eliasson, B.; Kogelschatz, U. Modeling and applications of silent discharge plasmas. IEEE Trans. Plasma Sci. 1991, 19, 309. [Google Scholar] [CrossRef]
  4. Du, Z.H.; Lin, X. Research Progress in Application of Low Temperature Plasma Technology for Wastewater Treatment. IOP Conf. Ser. Earth Environ. Sci. 2020, 512, 012031. [Google Scholar] [CrossRef]
  5. Kogelschatz, U. Dielectric-barrier discharges: Their history, discharge physics, and industrial application. Plasma Chem. Plasma Process. 2003, 23, 1–46. [Google Scholar] [CrossRef]
  6. Nascimento, F.D.; Stancampiano, A. Plasma Electrode Dielectric Barrier Discharge: Development, Characterization and Preliminary Assessment for Large Surface Decontamination. Plasma Chem. Plasma Process. 2023, 46, 1791–1817. [Google Scholar] [CrossRef]
  7. Nascimento, F.D.; Graça Sampaio, A.D. A Low Cost, Flexible Atmospheric Pressure Plasma Jet Device with Good Anti-microbial Efficiency. IEEE Trans. Radiat. Plasma Med. Sci. 2023, 8, 307–322. [Google Scholar] [CrossRef]
  8. Sanghoo, P.; Wonho, C.; Cheorun, J. Interplay among ozone and nitrogen oxides in air plasmas: Rapid change in plasma chemistry. Chem. Eng. J. 2018, 352, 1014–1021. [Google Scholar] [CrossRef]
  9. Glaze, W.H. Drinking-water treatment with ozone. Environ. Sci. Technol. 1987, 21, 224. [Google Scholar] [CrossRef]
  10. Gott, R.P.; Moller, S.D.; Hodges, J.C.; Xu, K.G. Plasma-Based water purification for crewed space missions: Laboratory experimental comparisons for on-board applicability. Adv. Space Res. 2021, 68, 1591–1600. [Google Scholar] [CrossRef]
  11. Di, L.; Zhang, J.; Zhang, X. A review on the recent progress, challenges, and perspectives of atmospheric-pressure cold plasma for preparation of supported metal catalysts. Plasma Process. Polym. 2018, 15, 1700234. [Google Scholar] [CrossRef]
  12. Zhang, C.; Ma, Y.Y.; Kong, F.; Wang, R.X.; Ren, C.Y.; Shao, T. Surface charge decay of epoxy resin treated by AP-DBD deposition and direct fluorination. IEEE Trans. Dielectr. Electr. Insul. 2019, 26, 768–775. [Google Scholar] [CrossRef]
  13. Fang, Z.; Wang, X.; Shao, T.; Zhang, C. Influence of oxygen content on argon/oxygen dielectric barrier discharge plasma treatment of polyethylene terephthalate film. IEEE Trans. Plasma Sci. 2017, 45, 310–317. [Google Scholar] [CrossRef]
  14. Pascual, A.; Llorca, I.; Canut, A. Use of ozone in food industries for reducing the environmental impact of cleaning and disinfection activities. Trends Food Sci. Technol. 2007, 18, 29–35. [Google Scholar] [CrossRef]
  15. Ivanov, M. Effects of high voltage electrical discharge plasma on olive mill wastewater treatment. Sustainability 2021, 13, 1552. [Google Scholar] [CrossRef]
  16. Lobna, M.; Chedly, T.; Sven-Uwe, G.; Latifa, B. A comparative study on ozone, hydrogen peroxide and UV based advanced oxidation processes for efficient removal of diethyl phthalate in water. J. Hazard. Mater. 2019, 363, 401–411. [Google Scholar] [CrossRef]
  17. Ashford, B.; Tu, X. Non-thermal plasma technology for the conversion of CO2. Curr. Opin. Green Sustain. Chem. 2017, 3, 45–49. [Google Scholar] [CrossRef]
  18. Pecchillo, C.T.; Ammendola, R.; Cattaneo, F.; Esposito, G. NOx Dependent ROS Generation and Cell Metabolism. Int. J. Mol. Sci. 2023, 24, 2086. [Google Scholar] [CrossRef]
  19. Kevil, C.G.; Lefer, D.J. Review focus on inorganic nitrite and nitrate in cardiovascular health and disease. Cardiovasc. Res. 2011, 89, 489. [Google Scholar] [CrossRef]
  20. Ratovitski, E.A.; Cheng, X.Q.; Yan, D.Y.; Sherman, J.H.; Canady, J.; Trink, B.; Michael, K. Anti-Cancer Therapies of 21st Century: Novel Approach to Treat Human Cancers Using Cold Atmospheric Plasma. Plasma Process. Polym. 2014, 11, 1128. [Google Scholar] [CrossRef]
  21. Tanaka, H.; Mizuno, M.; Ishikawa, K.; Takeda, K.; Nakamura, K.; Utsumi, F.; Kajiyama, H.; Kano, H.; Okazaki, Y.; Toyokuni, S.; et al. Plasma Medical Science for Cancer Therapy: Toward Cancer Therapy Using Nonthermal Atmospheric Pressure Plasma. IEEE Trans. Plasma Sci. 2014, 42, 3760–3764. [Google Scholar] [CrossRef]
  22. Kong, M.G.; Kroesen, G.; Morfill, G.; Nosenko, T.; Shimizu, T.; Van Dijk, J.; Zimmermann, J.L. Plasma medicine: An introductory review. New J. Phys. 2009, 11, 115012. [Google Scholar] [CrossRef]
  23. Bansemer, R.; Schmidt-Bleker, A.; Van Rienen, U.; Weltmann, K.D. Investigation and control of the O-3- to NO-transition in a novel sub-atmospheric pressure dielectric barrier discharge. Plasma Sources Sci. Technol. 2017, 26, 065005. [Google Scholar] [CrossRef]
  24. Yu, H.J.; Xia, W.W.; Wang, L.; Wang, Y.; Xu, S.Y.; Yao, L. Research of kinetics and anharmonicity for related reactions of NOx + H2O and cracking NOx. Chem. Phys. Lett. 2022, 798, 139580. [Google Scholar] [CrossRef]
  25. Abou Saoud, W.; Assadi, A.A.; Guiza, M.; Loganathan, S.; Bouzaza, A.; Aboussaoud, W.; Ouederni, A.; Rtimi, S.; Wolbert, D. Synergism between non-thermal plasma and photocatalysis: Implications in the post discharge of ozone at a pilot scale in a catalytic fixed-bed reactor. Appl. Catal. B Environ. 2019, 241, 227–235. [Google Scholar] [CrossRef]
  26. Catto, A.C.; Oliveira, M.C.; Ribeiro, R.A.P.; Avansi, W.; Longo, E. Hematite rhombuses for chemiresitive ozone sensors: Experimental and theoretical approaches. Appl. Surf. Sci. 2021, 563, 150209. [Google Scholar] [CrossRef]
  27. Gao, K.; Gong, D.D.; Liu, R.J.; Su, Z.H.; Jia, P.P.; Li, X.C. Measurement of ozone concentration in Atmospheric Pressure Air Barrier Discharge by Optical Absorption Spectroscopy. Spectrosc. Spectr. Anal. 2020, 40, 461–464. [Google Scholar] [CrossRef]
  28. Glascock, M.S.; Rovey, J.L.; Williams, S.; Thrasher, J. Plume Characterization of Electric Solid Propellant Pulsed Microthrusters. J. Propuls. Power 2017, 33, 870–880. [Google Scholar] [CrossRef]
  29. Große-Kreul, S.; Hübner, S.; Schneider, S.; Ellerweg, D.; Keudell, A.; Matejčík, S.; Benedikt, J. Mass spectrometry of atmospheric pressure plasmas. Plasma Sources Sci. Technol. 2015, 24, 044008. [Google Scholar] [CrossRef]
  30. Engeln, R.; Klarenaar, B.; Guaitella, O. Foundations of optical diagnostics in low-temperature plasmas. Plasma Sources Sci. Technol. 2020, 29, 063001. [Google Scholar] [CrossRef]
  31. Grill, A. Cold Plasma in Materials Fabrication: Form Fundamentals to Applications; IEEE Press: New York, NY, USA, 1994. [Google Scholar]
  32. Hippler, R. Low Temperature Plasma Physics: Fundamental Aspects and Applications; WILEY-VCH: Berlin, Germany, 2021. [Google Scholar]
  33. Pavlovich, M.J.; Clark, D.S.; Graves, D.B. Quantification of air plasma chemistry for surface disinfection. Plasma Sources Sci. Technol. 2014, 23, 065036. [Google Scholar] [CrossRef]
  34. Shimizu, T.; Sakiyama, Y.; Graves, D.B.; Zimmermann, J.L.; Morfill, G.E. The dynamics of ozone generation and mode transition in air surface micro-discharge plasma at atmospheric pressure. New J. Phys. 2012, 14, 103028. [Google Scholar] [CrossRef]
  35. Pierotti, G.; Piferi, C.; Popoli, A.; Cavedon, M.; Cristofolini, A.; Martines, E.; Riccardi, C. A novel two-stage kinetic model for surface DBD simulations in air. Plasma Sources Sci. Technol. 2023, 32, 064005. [Google Scholar] [CrossRef]
  36. Malik, M.A.; Jiang, C.Q.; Heller, R. Ozone-free nitric oxide production using an atmospheric pressure surface discharge—A way to minimize nitrogen dioxide co-production. Chem. Eng. J. 2016, 283, 631–638. [Google Scholar] [CrossRef]
  37. Liu, K.; Hu, Y.; Lei, J. The chemical product mode transition of the air DBD driven by AC power: A plausible evaluation parameter and the chemical behaviors. Phys. Plasma 2017, 24, 103513. [Google Scholar] [CrossRef]
  38. Simek, M.; Peka’rek, S.; Prukner, V. Ozone Production Using a Power Modulated Surface Dielectric Barrier Discharge in Dry Synthetic Air. Plasma Chem. Plasma Process. 2012, 32, 743–754. [Google Scholar] [CrossRef]
  39. Huang, L.C.; Ye, J.F.; Wang, D.K.; Zheng, Y.Z. Experimental Study on Degradation of Unsymmetrical Dimethylhydrazine Wastewater by Low Temperature Plasma. Chin. J. Energetic Mater. 2022, 30, 1013–1021. [Google Scholar] [CrossRef]
  40. Stanford Research Systems. Available online: http://www.thinksrs.com/downloads/pdfs/manuals/RGAm.pdf (accessed on 1 May 2024).
  41. Zhou, Z.Y.; Du, X.; Yang, J.; Wang, Y.; Li, C.; Wei, S.; Du, L.; Li, Y.; Qi, F.; Wang, Q. The vacuum ultraviolet beamline/endstations at NSRL dedicated to combustion research. J. Synchrotron Radiat. 2016, 23, 1035–1045. [Google Scholar] [CrossRef]
  42. Wang, C.Q.; Zhang, G.X. Effect of Measurement Elements on Discharge Characteristics of Dielectric Barrier Discharge. Phys. Procedia 2012, 32, 664–668. [Google Scholar] [CrossRef]
  43. Wang, R.X.; Yang, Y.; Chen, S.; Jiang, H.; Martin, P. Power Calculation of Pulse Power-Driven DBD Plasma. IEEE Trans. Plasma Sci. 2021, 49, 2210–2216. [Google Scholar] [CrossRef]
  44. Crounse, J.D.; Nielsen, L.B.; Jorgensen, S.; Kjaergaard, H.G.; Wennberg, P.O. Autoxidation of organic compounds in the atmosphere. J. Phys. Chem. Lett. 2013, 4, 3513–3520. [Google Scholar] [CrossRef]
  45. Available online: https://www.chembk.com/cn/chem/ (accessed on 1 May 2024).
  46. Robert, E.; Darny, T.; Dozias, S.; Iseni, S.; Pouvesle, J.M. New insights on the propagation of pulsed atmospheric plasma streams: From single jet to multi jet arrays. Phys. Plasmas 2015, 22, 122007. [Google Scholar] [CrossRef]
  47. Bourdon, A.; Darny, T.; Pechereau, F.; Pouvesle, J.-M.; Viegas, P.; Iséni, S.; Robert, E. Numerical and experimental study of the dynamics of a μs helium plasma gun discharge with various amounts of N2 admixture. Plasma Sources Sci. Technol. 2016, 25, 035002. [Google Scholar] [CrossRef]
  48. Obradovic, B.M.; Cvetanović, N.; Ivković, S.S.; Sretenović, G.B.; Kovačević, V.V.; Krstić, I.B.; Kuraica, M.M. Methods for spectroscopic measurement of electric field in atmospheric pressure helium discharges. Eur. Phys. J. Appl. Phys 2017, 77, 30802. [Google Scholar] [CrossRef]
  49. Alexandra, P.; Oliver, J.S. Dielectric barrier discharge in mass spectrometry—An overview over plasma investigations and ion sources applications. Trends Anal. Chem. 2024, 170, 117420. [Google Scholar] [CrossRef]
  50. Yagi, S.; Tanaka, M. Mechanism of Ozone Generation In Air-Fed Ozonizers. J. Phys. D-Appl. Phys. 1979, 12, 1509–1520. [Google Scholar] [CrossRef]
  51. Eliasson, B.; Kogelschatz, U.; Baessler, P. Dissociation of O2 in N2/O2 Mixtures. J. Phys. B At. Mol. Phys. 1984, 17, L797–L801. [Google Scholar] [CrossRef]
  52. Kossyi, I.A.; Kostinsky, A.Y.; Matveyev, A.A.; Silakov, V.P. Kinetic scheme of the non-equilibrium discharge in nitrogen-oxygen mixtures. Plasma Sources Sci. Technol. 1992, 1, 207–220. [Google Scholar] [CrossRef]
  53. Stefanovic, I.; Bibinov, N.K.; Deryugin, A.A.; Vinogradov, I.P.; Napartovich, A.P.; Wiesemann, K. Kinetics of ozone and nitric oxides in dielectric barrier discharges in O2/NOx and N2/O2/NOx mixtures. Plasma Sources Sci. Technol. 2001, 10, 406–416. [Google Scholar] [CrossRef]
  54. Van Gaens, W.; Bogaerts, A. Kinetic modelling for an atmospheric pressure argon plasma jet in humid air. J. Phys. D Appl. Phys. 2013, 46, 275201. [Google Scholar] [CrossRef]
  55. Shkurenkov, I.; Burnette, D.; Lempert, W.R. Kinetics of excited states and radicals in a nanosecond pulse discharge and afterglow in nitrogen and air. Plasma Sources Sci. Technol. 2014, 23, 065003. [Google Scholar] [CrossRef]
Figure 1. (a) Coaxial DBD pulse discharge experimental device and (b) The cross-section of the DBD device.
Aerospace 12 00433 g001
Figure 2. Output voltage and peak pulse waveform of microsecond pulse high-voltage power supply: (a) output voltage and (b) peak pulse waveform.
Aerospace 12 00433 g002
Figure 3. Transition diagram of plasma chemical mode.
Aerospace 12 00433 g003
Figure 4. The influence of the gas flow rate on the partial pressure of NO2 (a), O3 (b) and the macroscopic temperature of the plasma gas (c), the influence of the control voltage on the transition time (d) and the macroscopic temperature of the plasma gas (e), and the influence of the energy density (f) on the transition time under control voltage and air flow rate.
Aerospace 12 00433 g004
Figure 5. Chemical reaction mechanism diagram of DBD at the airflow rate of nitrogen and oxygen.
Aerospace 12 00433 g005
Figure 6. Time evolution of N, O, O3 and NOx in the plasma partial pressure at control voltage 130 V.
Aerospace 12 00433 g006
Table 1. The actual positive and negative pulse peaks corresponding to the control voltage.
Control Voltage/V120130140
Actual positive pulse peak/kV11.9012.7914.33
Actual negative pulse peak/kV−11.13−11.57−12.71
Disclaimer/Publisher’s Note: The statements, opinions and data contained in all publications are solely those of the individual author(s) and contributor(s) and not of MDPI and/or the editor(s). MDPI and/or the editor(s) disclaim responsibility for any injury to people or property resulting from any ideas, methods, instructions or products referred to in the content.

