Article

The Three-Dimensional Transient Simulation of Cross-Shaped Grains in Hybrid Rocket Motors

1
College of Astronautics, Nanjing University of Aeronautics and Astronautics, Nanjing 211106, China
2
School of Astronautics, Beihang University, Beijing 100191, China
*
Author to whom correspondence should be addressed.
Aerospace 2025, 12(5), 429; https://doi.org/10.3390/aerospace12050429
Submission received: 13 April 2025 / Revised: 6 May 2025 / Accepted: 9 May 2025 / Published: 12 May 2025
(This article belongs to the Section Astronautics & Space Science)

Abstract

:
The process of spacecraft entry, deceleration, landing, and ascent requires high specific impulse, high reliability, and high-precision thrust adjustments for the power system. The new hybrid rocket motor adopts a complex-shaped grain and high-energy propellant, offering high-energy characteristics, continuously adjustable thrust, a relatively simple oxidant delivery system, and high reliability, making it an ideal power choice for the above systems. However, due to changes in the characteristic structure of the three-dimensional complex flame surface degradation process, it is difficult to accurately predict the motor performance. In this study, changes in the flow field structure and performance parameters during the operation of the cross-shaped grain hybrid rocket motor are presented using fuel surface reconstruction technology based on a dynamic mesh. The spatial distribution of the fuel surface is analyzed, and the accuracy of the model is verified via firing tests. The results show that the deviations of combustion chamber pressure and thrust are less than 0.6% and 1.7%, respectively. After the test, the deviation between the simulated port area and the CT-scanned port area is less than 3.5%. The accuracy of this model is verified in terms of the above two aspects, establishing a solid foundation for predicting the performance of future hybrid rocket motors with more complex-shaped grains.

1. Introduction

The entry, descent, landing, and ascent (EDLA) stages of a spacecraft necessitate stringent requirements for the power system, which involves the comprehensive consideration of various factors such as environmental adaptability, reliability, and precise control. Generally speaking, the power system must have high reliability, precise thrust-adjustment capability, and high-energy characteristics [1]. Hybrid rocket motors (HRMs), with high levels of energy, continuously adjustable thrust, and multiple startups [2,3,4], have emerged as an ideal choice for the propulsion systems of EDLA spacecraft.
The fuel flow rate of HRMs is relatively low because of their non-premixed diffusion combustion characteristics, which restrict the development of high-thrust HRMs [5,6]. Increasing the combustion surface area is a commonly used method to improve the fuel flow rate and regression rate. Currently, there are three main methods used to increase the combustion surface area: the first is to increase the number of fuel grains, although it is difficult to maintain structural strength; the second approach is to increase the number of channels in the grains, although this also carries the risk of poor mechanical performance; and the third method is to use complex-shaped grains in single-port configurations, such as cross-shaped, star-shaped, wheel-shaped, and spiral-shaped grains, among others [7,8,9]. As combustion only occurs on the inner hole surface, the mechanical performance during the working process is better. Therefore, this remains the most widely used structural form in the field of HRMs.
However, the flow field of complex-shaped grains in HRMs exhibits intensely transient characteristics and the highly nonlinear variation in parameters makes performance prediction challenging. Dynamic numerical simulation is a promising method for predicting the performance of hybrid rocket motors [10,11]. Antoniu and Akyuzla [12] presented the first simulation of the fuel surface’s dynamic regression process, laying the foundation for dynamic numerical simulation. Tian and Zhang [13,14] conducted dynamic numerical simulations of hybrid rocket motors using hydroxyl-terminated polybutadiene (HTPB) as fuel, using a dynamic mesh technique for simulations up to 10 s. The results illustrated that the dynamic mesh technique is suitable for modeling the movement of combustion surfaces. Di Martino and Gallo [15,16] investigated the combustion characteristics of paraffin-based fuels and carried out dynamic numerical simulations of hybrid rocket motors using paraffin-based fuels, showing good agreement for a simulation time of about 9 s. The gas–surface interaction and entrainment models are developed in this study based on the 200 N and 1 kN HRMs. Migliorino [17] compared the simulations modeling the change in fuel shape in 1 kN paraffin–oxygen HRMs with those performed using a uniform duct radius. The results demonstrated that the fuel shape change simulations improved the accuracy of performance prediction. However, the thrust in the above simulation of HRMs is relatively small and no long-term simulation has been conducted. In previous research by one of the current authors, a 200 s simulation was performed for 3 kN HTPB-based HRMs that simultaneously considered the movement of both the combustion surface and nozzle erosion [18,19]. Notably, the above studies are all two-dimensional simulations, and there is little research on three-dimensional simulations. To the best of the authors’ knowledge, Motoe and Betelin [20,21,22] carried out millisecond-level three-dimensional dynamic numerical simulation of HRMs where the movement of the combustion surface was not considered due to very small levels of deformation. For hybrid rocket motors, the regression rate is uneven along both the axial and circumferential directions, making it difficult to predict fuel shape change. Although a previous study by one of the current authors [23] involved a three-dimensional numerical simulation of a hybrid rocket motor using cylindrical-shaped grains for up to 20 s, no three-dimensional dynamic numerical simulation of complex-shaped grains in HRMs is currently available.
Therefore, in this study, a three-dimensional transient model of cross-shaped grains in HRMs is developed to predict performance and fuel shape, with HRMs adopting 98% hydrogen peroxide and polyethylene (PE) as propellants. A simplified and updated method for the combustion surface of three-dimensional cross-shaped grains based on the dynamic mesh technique is proposed. The changes in flow field structure and performance parameters of HRMs are obtained, laying a good foundation for the dynamic numerical simulation of more complex-shaped grains.

2. Transient Model Construction Process

The model construction process involves an introduction to the motor structure, numerical modeling, and operating conditions.

2.1. Introduction to the Motor Structure

For the simulation of regression in grains, this study focuses on the combustion chamber of this hybrid rocket motor, which generally consists of the following parts, a catalytic bed, an injector plate, pre-combustion and post-combustion chambers, a solid fuel grain, and a nozzle, as shown in Figure 1. The 98% hydrogen peroxide primarily decomposes into oxygen and steam with a 1220 K temperature after flowing through the catalytic bed. The catalytic products provide heat and an oxidizer to ignite the HRMs. The solid fuel grain consists of medium-density PE with a density of 0.935 g·cm−3.

2.2. Numerical Modeling

In this study, numerical modeling was conducted using Ansys Fluent v2022 R1 software based on Reynolds-averaged Navier–Stokes (RANS) equations. The following sections detail the governing equations, turbulent model, regression rate model, chemical reaction model, computational grids, and simplified and updated model for the combustion surface based on the dynamic mesh technique used in this study.

2.2.1. Governing Equations

The governing equations for fluid flow and heat transfer include continuity, momentum, energy, and species equations, which can be expressed as [24,25]:
ρ t + x i ρ u i = S ρ
t ρ u j + x i ρ u i u j + p t δ i j = x i τ i j + S u
t e + x i e + p t u i = x i u j τ i j + λ T x i + S e
t ρ Y m + x i ρ u i Y m = x i ρ D m Y m x i + S Y
where Sρ, Su, Se, and SY are the mass, momentum, energy, and species source terms, respectively; pt refers to effective pressure; τij represents the stress tensor; Dm denotes the diffusivity for species m; ρ represents the density; t is the time; xi refers to x, y, z; u refers to the velocity, δij is the Kronecker delta; λ refers to the thermal conductivity; e represents the energy; T is the temperature; and Ym is the mass fraction for species m.

2.2.2. Turbulent Model

The realizable k-ε model introduces a new turbulence viscosity calculation model where the proportional coefficient is no longer treated as a constant but is instead obtained by considering the flow field strain and rotation effects [26]. Therefore, this model provides superior performance for boundary layer flow and is adopted in this study. The transport equations for k and ε are as follows:
t ( ρ k ) + x j ( ρ k u j ) x j ( μ + μ t σ k ) k x j = G k + G b ρ ε 2 ρ ε k a 2 + S k
t ( ρ ε ) + x j ( ρ ε u j ) x j ( μ + μ t σ ε ) ε x j = ρ C 1 S ε ρ C 2 ε 2 k + ν ε + C 1 ε ε k C 3 ε G b + S ε
where μ is viscosity; μt is turbulent viscosity; Gk and Gb represent the generation of turbulence kinetic energy caused by mean velocity gradient and buoyancy, respectively; v denotes the kinematic viscosity; Sk and Sε refer to the source term for the turbulence kinetic energy and dissipation rate, respectively; C2 = 1.9; C1ε = 1.44; C3ε = 0; and σk and σε represent the Prandtl number for the turbulence kinetic energy and dissipation rate, respectively. The enhanced wall treatment function is used in the study, which generally requires the y+ value to be approximately 1.

2.2.3. Regression Rate Model

The regression rate model includes a fluid–solid coupling and a fuel pyrolysis model. The conservation of mass and energy is maintained on the combustion surface, and the fluid–solid coupling model can be represented as follows [27,28]:
ρ g u = ρ f r ˙
λ g T r g = ρ f r ˙ h g h s
where ρg and ρf represent the density of the gas and fuel, respectively; hg and hs represent the enthalpy of the gas and solid, respectively; and r ˙ is the regression rate, which is affected by the temperature on the combustion surface. The pyrolysis model is usually in the form of the Arrhenius formula and is as follows [29]:
r ˙ = A exp ( E a / R T )
where A represents the pre-exponential, A = 2678.1 m/s, Ea is the activation energy, and Ea = 125.604 kJ/mol [25].
After the heat transfer of the combustion surface is calculated, the combustion surface temperature is obtained by iteratively solving Equations (8) and (9); thereby, r ˙ at this temperature can be obtained.

2.2.4. Chemical Reaction Model

This HRM adopts 98% hydrogen peroxide and PE as propellants, with the chemical reaction simplified to a three-step combustion of O2 and C2H4 [30], as shown in Table 1.
The chemical reaction rate calculation model adopts the eddy-dissipation model, highlighting the role of turbulent mixing in the control of reaction rate. It has good efficiency and accuracy for the non-premixed flame. The reaction rate is obtained by [31,32]:
R i , r = ν i , r M i A ρ ε k min min R Y R ν i , r M R , B P Y P j N ν j , r M j
where R i , r is the reaction rate for species i in reaction r; ν i , r and ν j , r refer to the stoichiometry of reactant i and production j in reaction r, respectively; A = 4.0; B = 0.5; Mi and Mj are the molar mass of species i and j, respectively; YR and YP are the mass fraction of reactant R and product P, respectively; and MR is the molar mass of reactant R.

2.2.5. Computational Grids

A cross-shaped grain is used in this hybrid rocket motor. The main structural parameters of this HRM are shown in Table 2. The cross-shaped grain profile is shown in Figure 2. The value of R3 is 3 mm.
The 1/8 cross-shaped combustion chamber in this HRM is used as the computational domain in this simulation, as shown in Figure 3. The number of computational grids is 393,802, in which unstructured tetrahedral grids with a boundary layer are used near the combustion surface to meet the requirements of the dynamic mesh technique. The hexahedral structured grids are used for the other positions to increase calculation speed. Symmetry-1 is the Y-Z plane, and Symmetry-2 is a plane perpendicular to the X-Y plane and at an angle of 45° to the Y-Z plane.

2.2.6. Simplified and Updated Model for the Combustion Surface Based on the Dynamic Mesh Technique

This study adopts the dynamic mesh technique based on smoothing and local remeshing. The dynamic mesh technique flow chart was described in detail in a previous study [23]. The vector of the nodes (dx, dy) can be obtained as follows:
d x = r ˙ cos θ d t d y = r ˙ sin θ d t
where θ is the angle between the r ˙ and the X-axis.
The number of boundary nodes cannot be changed in the traditional dynamic mesh technique. Thus, problems arise when the border gradually shortens or disappears. For example, the arc ( D F ) is gradually shortened to a point (O3), as shown in Figure 4, which cannot be realized by the traditional dynamic mesh technique since nodes cannot be merged. Therefore, a new method for simplifying and updating the combustion surface is proposed in this study. For ease of understanding, Figure 4 illustrates the change in the combustion surface during the parallel regression process. In the practical regression process, the magnitude and direction of the regression rate at the nodes are obtained from simulations. Notably, the process involves moving an arc ( D F ). There is a point (E) on the arc ( D F ) that will gradually converge to Symmetry-2. When the distance between the point (E) and Symmetry-2 is less than 0.01 mm, the point should be on the symmetrical plane, prompting its X-axis coordinate to be adjusted to the corresponding coordinate on the symmetrical plane. For this simulation, the X-axis coordinate of E is updated to the X-axis coordinate of E , which has the same Y-axis coordinate as E. At this time, the arc ( D F ) is updated to the arc ( D E ) and straight line ( E F ¯ ). Notably, the straight line ( E F ¯ ) is positioned on the symmetrical plane, and its adjacent grid no longer has the function of adding source terms. The straight line ( E F ¯ ) is only retained as a line on the symmetrical plane. Therefore, the partial grid function near the combustion surface is simplified and updated to a new location. Hence, the method is termed the simplified and updated model for the combustion surface (SUMCS). The arc ( D E ) will become a straight line ( O 3 E ¯ ) over time. By further extending the working time, the straight line ( C O 3 ¯ ) will become a straight line ( C O 3 ¯ ), and so forth.

2.3. Operating Conditions

The inlet of the combustion chamber contains a mixture of gaseous 46.1% O2 and 53.9% H2O, with a mass flow rate of 160 g/s. The boundary condition on the combustion surface is defined by the temperature condition described by the user-defined function (UDF) using the regression rate model. The pressure of the nozzle outlet is about 1 atm. The time in this simulation is about 5 s. First, steady-state simulations are conducted to verify grid independence. Then, the dynamic numerical simulation is carried out based on these steady-state results over 5 s.

3. Setup for Validation Experiment

3.1. Supplying System for Hydrogen Peroxide

The schematic of the supplying system for hydrogen peroxide in this HRM is shown in Figure 5. It consists of valves, an H2O2 tank, a N2 tank, a regulator, a venturi tube, and a flowmeter. The hydrogen peroxide enters the combustion chamber through the valve, flowmeter, and venturi tube under the upstream pressure controlled by the regulator. The nitrogen purge is used to remove residual H2O2 after the test. The valves and regulator are controlled by a PLC. The measurement ranges for the pressure sensor and thrust sensor are 0–10 MPa and ±1.0 kN, respectively. The error of both pressure and thrust sensors is 0.2%.

3.2. Test Platform of This Hybrid Rocket Motor

Figure 6 illustrates the test platform for this hybrid rocket motor. The components of this hybrid rocket motor are described above. The catalytic bed uses a silver–palladium alloy as the catalyst, offering good decomposition efficiency and temperature resistance. The nozzle adopts tungsten copper infiltration material as the throat material. Its outlet is covered by the nozzle plug cap to ensure a tightness check before the test.

4. Results and Discussions

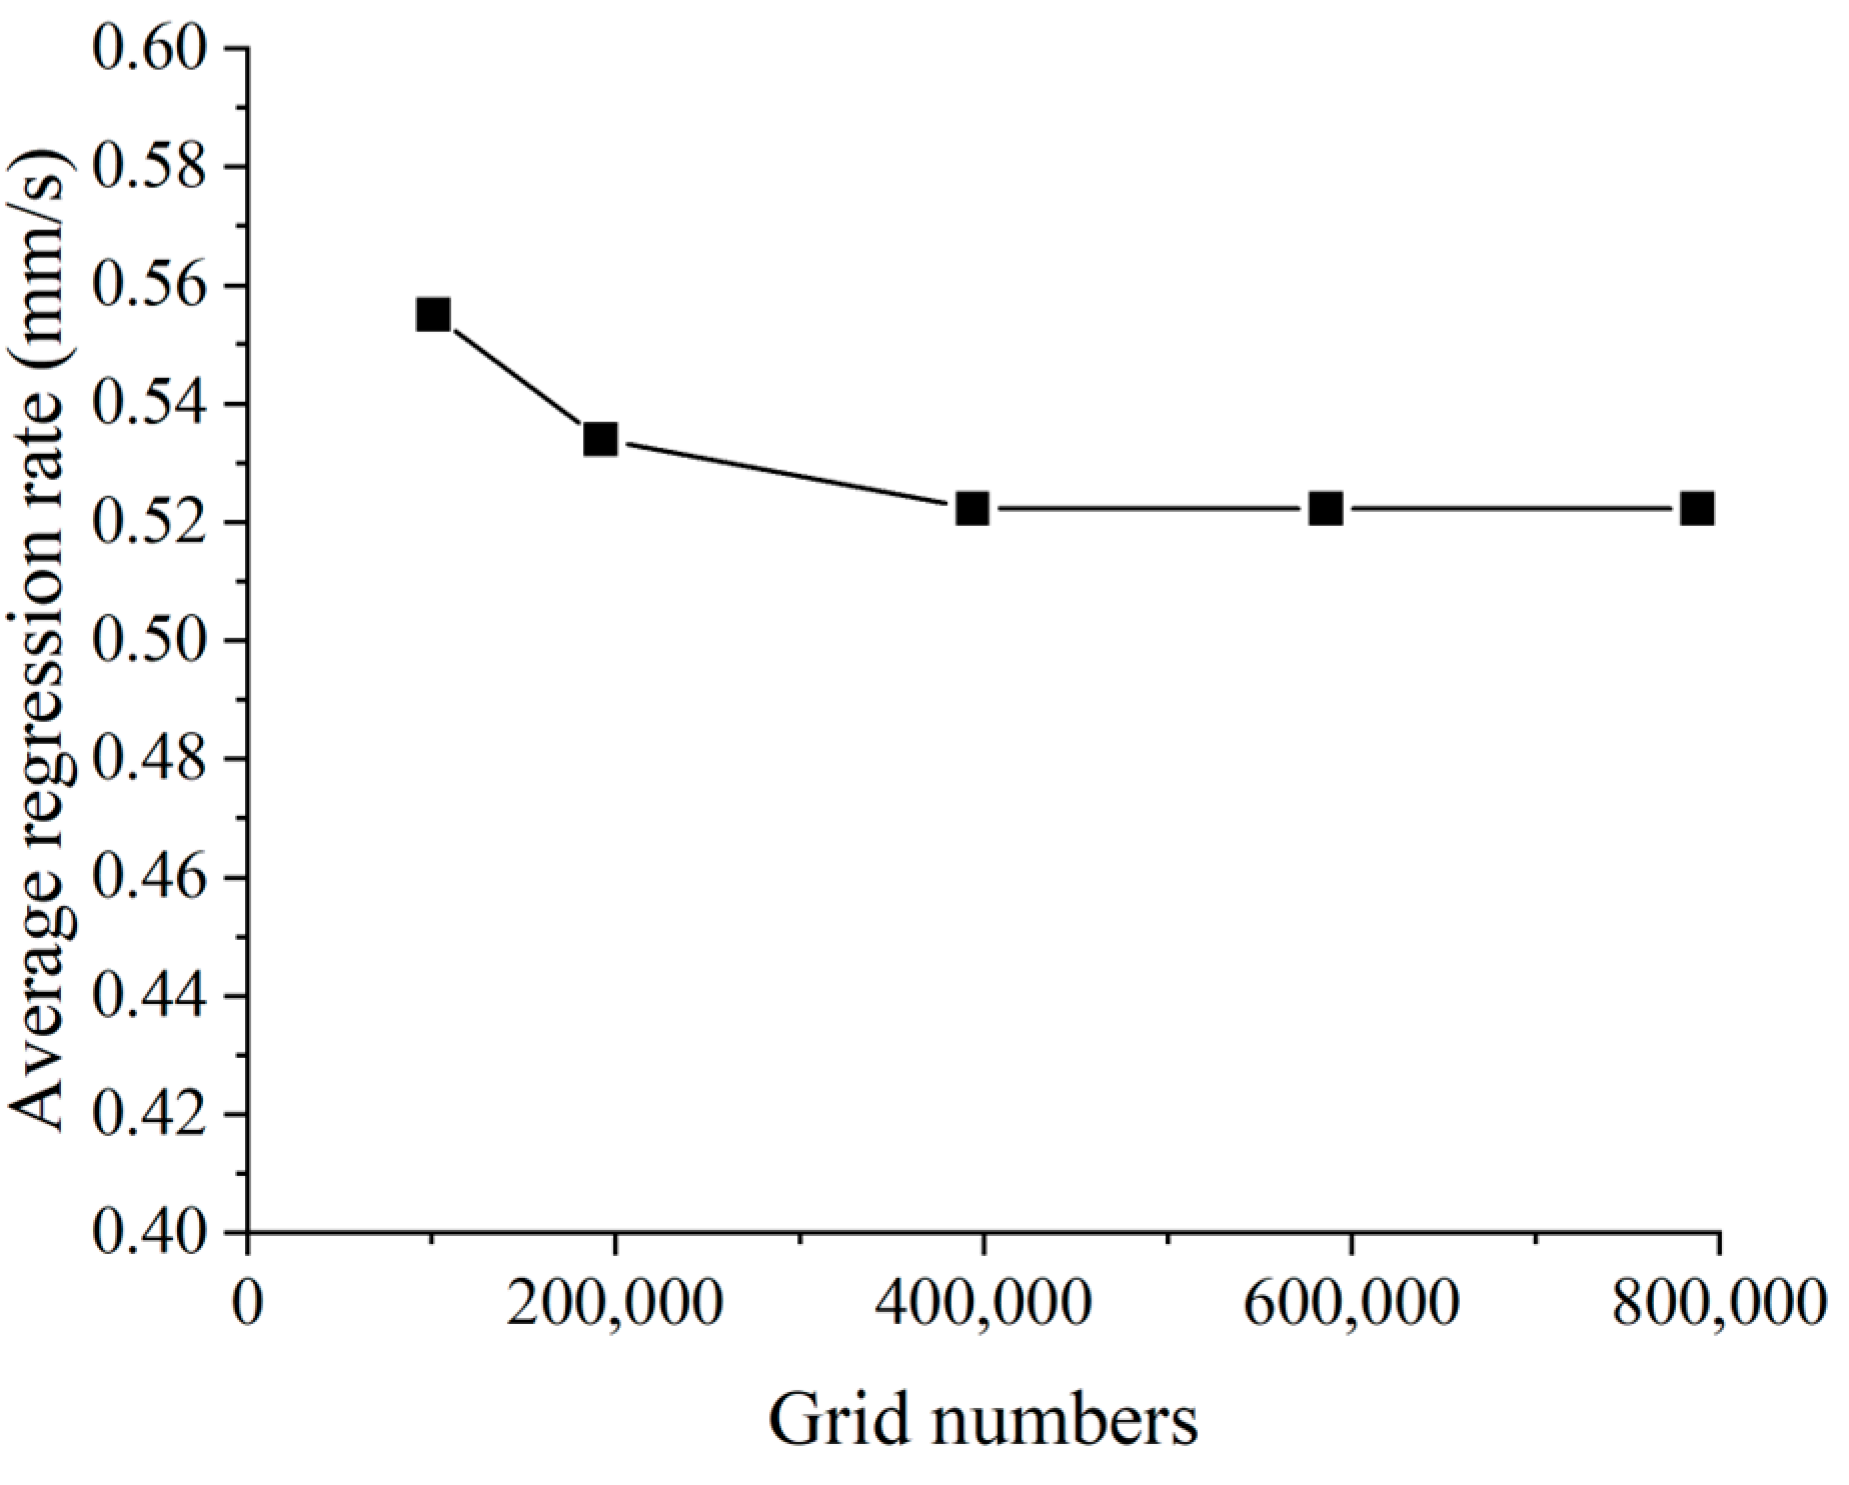
4.1. Grid Independence Verification

To balance computational speed and accuracy, grid independence verification is carried out. Steady-state simulations using five different grid configurations are conducted to obtain the spatially averaged regression rate, as shown in Figure 7. When the grid number is greater than or equal to 393,802, the average regression rate deviation is relatively small; therefore, a computational domain with 393,802 grids is selected in this simulation to improve computational speed.

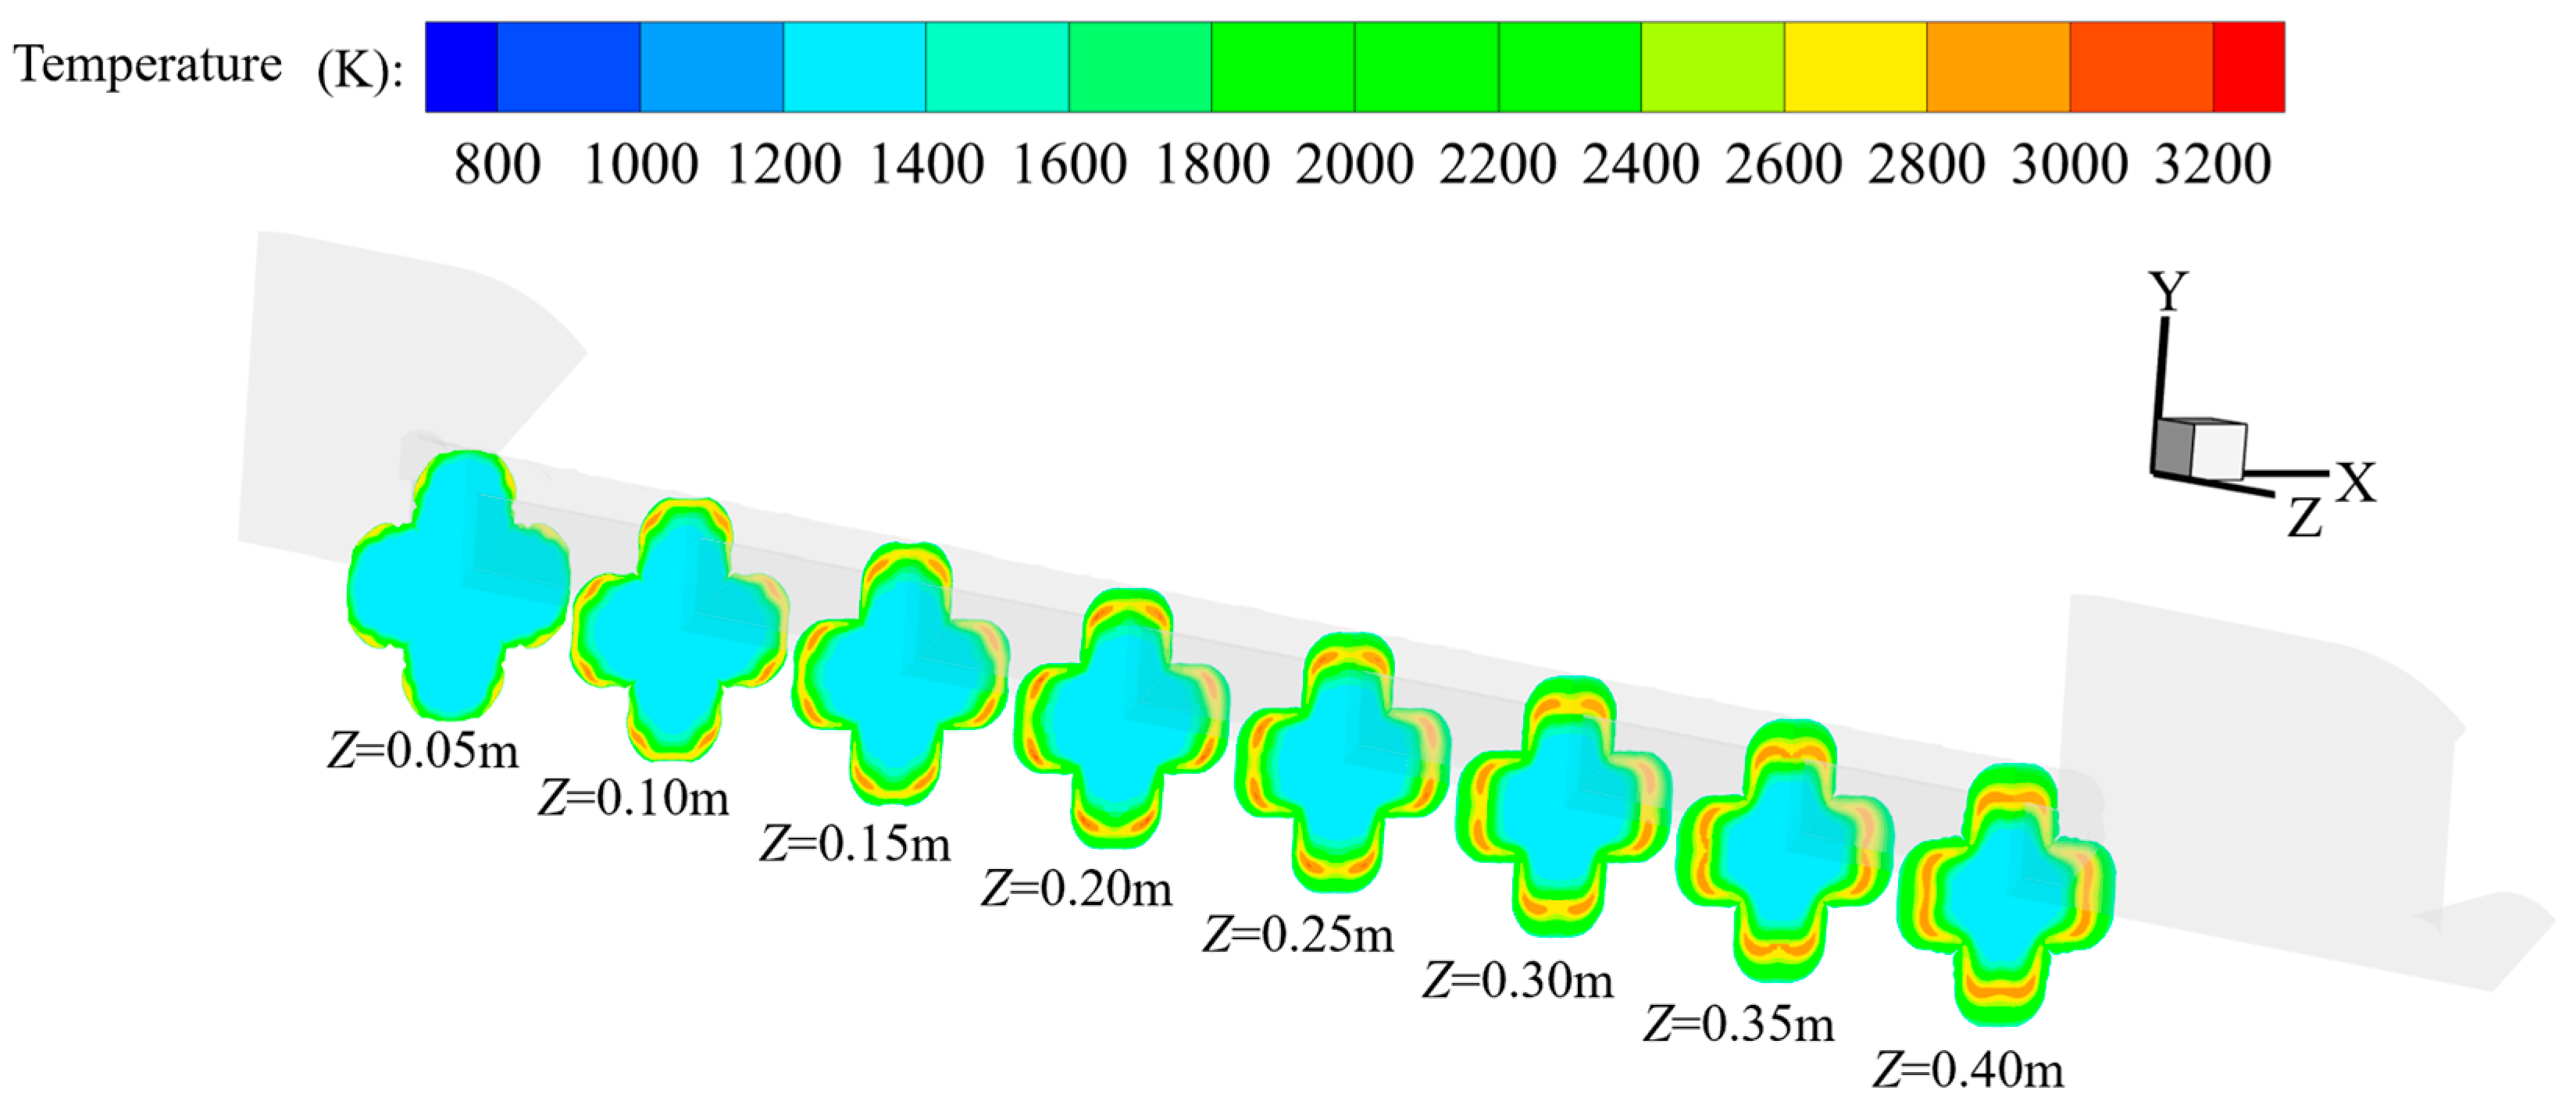
4.2. Flow Field Analysis of Cross-Shaped Grain

The temperature distributions along the axial section at the initial moment and 5 s into the simulation are shown in Figure 8 and Figure 9, respectively. The high-temperature flame layer exists in the flow field and gradually moves away from the combustion surface. This is mainly due to the consumption of oxidizer along the Z-axial direction, causing the mixing and combustion positions of the fuel and oxidizer to gradually move away from the combustion surface. Notably, there is a peak in the temperature distribution near the symmetry plane (Y-Z plane) at the initial moment, mainly due to the flow being restricted by the channel wall. Further analysis of the temperature distribution at 5 s shows no peak in the temperature distribution at the same position. The main reason is that as the grain port expands, the limitation on the flow restricted by the channel wall gradually reduces. This phenomenon will be explained in detail in the subsequent simulation analysis.
The Z = 0.1 m section is selected to analyze the change in temperature distribution over time in the simulation, as shown in Figure 10. The inner envelope circle of the port at the initial time is marked for convenience to compare the regression process of the fuel surface. As the simulation time increases, the peak temperature distribution near the symmetry plane (Y-Z plane) gradually decreases with port expansion and the high-temperature zone inside the port changes from an “m” shape to an “n” shape. To analyze the reasons for this, the variation in velocity distribution at Z = 0.1 m of the 1/4 port in the simulation is shown in Figure 11. It is found that the distance between the vortices on both sides of the symmetry plane gradually increases, indicating that as the grain port expands, the limitation of the flow restricted by the channel wall gradually reduces.
The distributions of C2H4 and O2 mass fractions at Z = 0.1 m over time in the simulation are shown in Figure 12 and Figure 13, respectively. C2H4, as the main pyrolysis product of PE, is mainly distributed near the combustion surface. It can be seen that the mass fraction of C2H4 near the 45° line (Symmetry-2) remains basically zero, indicating that no source term is added to the mesh on Symmetry-2, and the partial grid function near the combustion surface is simplified and updated. The mass fraction distribution of O2 is basically the opposite to that of C2H4, with more O2 present in the center of the port. The main reason for this is that O2 and C2H4 near the combustion surface undergo combustion reactions and are consumed, while the mass fraction of C2H4 near the center of the port is very low and O2 is barely consumed.
The temperature distributions at X = 0 m (Symmetry-1) and Y = X (Symmetry-2) over time in the simulation are shown in Figure 14 and Figure 15, respectively. The thickness of the flame layer gradually increases along the axis, mainly due to the continuous pyrolysis of the fuel along the axis and its addition to the flow field, which aligns with the previous analysis. Further assessment of the regression rate distribution along the axial direction at X = 0 m (Symmetry-1) and Y = X (Symmetry-2) is shown in Figure 16. The regression rate first decreases along the axial direction and then gradually stabilizes, consistent with the theory of non-premixed diffusion combustion. In addition, it can be seen that the regression rate gradually decreases over time, mainly because the oxidizer mass flow rate is constant. Hence, the oxidizer flux (Go) gradually decreases as the port expands. At the initial moment, the regression rate near Symmetry-2 is higher than that of Symmetry-1. The main reason for this is that this position is closer to the oxidizer at the center of the port, while the flame layer is closer to the combustion surface. Therefore, the heat transfer is greater, resulting in a higher regression rate.

4.3. Verification and Performance Parameters Analysis

A firing test was conducted to verify the simulation results based on the experimental conditions described above, as shown in Figure 17. The duration of the test was 5 s. During the test, the combustion chamber pressure is relatively stable. The rear end face of this grain, before and after the test, is shown in Figure 18. The regression of the combustion surface is relatively uniform, and the combustion surface after the test exhibits a certain degree of symmetry, which is consistent with the simulation results.
The comparisons of combustion chamber pressure and thrust between the simulation and test are shown in Figure 19 and Figure 20, respectively. It is found that the simulation results fit well with the experimental results. The average errors of combustion chamber pressure and thrust in the simulation and test are 0.6% and 1.7%, respectively. Through the above comparison, it can be found that the three-dimensional dynamic model of cross-shaped grains has good accuracy in performance parameters. During the working process, the combustion chamber pressure and thrust gradually decrease due to the rapid decrease in regression rate.

4.4. Comparison of the Combustion Surface After Test and Simulation Results

This grain was scanned using computed tomography (CT) after the test. The scanning result is divided into four cross sections along the axial direction according to the distance from the inlet of the combustion chamber, as shown in Figure 21. MATLAB R2018b software was used to process the scanned images, and the pixels inside the port were counted to obtain the port area, as shown in Table 3. The port area deviations of the four cross sections are 2.2%, 3.5%, 3.1%, and 2.7%, respectively. The deviation of the port area is less than 3.5%, indicating that the three-dimensional dynamic model of cross-shaped grains has good accuracy in combustion surface distribution, laying a solid foundation for the three-dimensional dynamic numerical simulation of more complex grains.

5. Conclusions

In this study, the transient simulation of cross-shaped grains in HRM was performed. A novel model, known as the simplified and updated model on the combustion surface, was proposed. Then, a firing test was performed to verify the model. The dynamic model demonstrated good accuracy in simulating cross-shaped grains in HRMs, establishing a solid foundation for the three-dimensional dynamic numerical simulation of more complex grains. The main conclusions are as follows:
(1)
A new, simplified, and updated model for the combustion surface based on the dynamic mesh technique was proposed. When the distance between the nodes on the combustion surface and the symmetrical plane is less than 0.01 mm, the nodes shift to the symmetrical plane, negating the function of adding source items to adjacent grids.
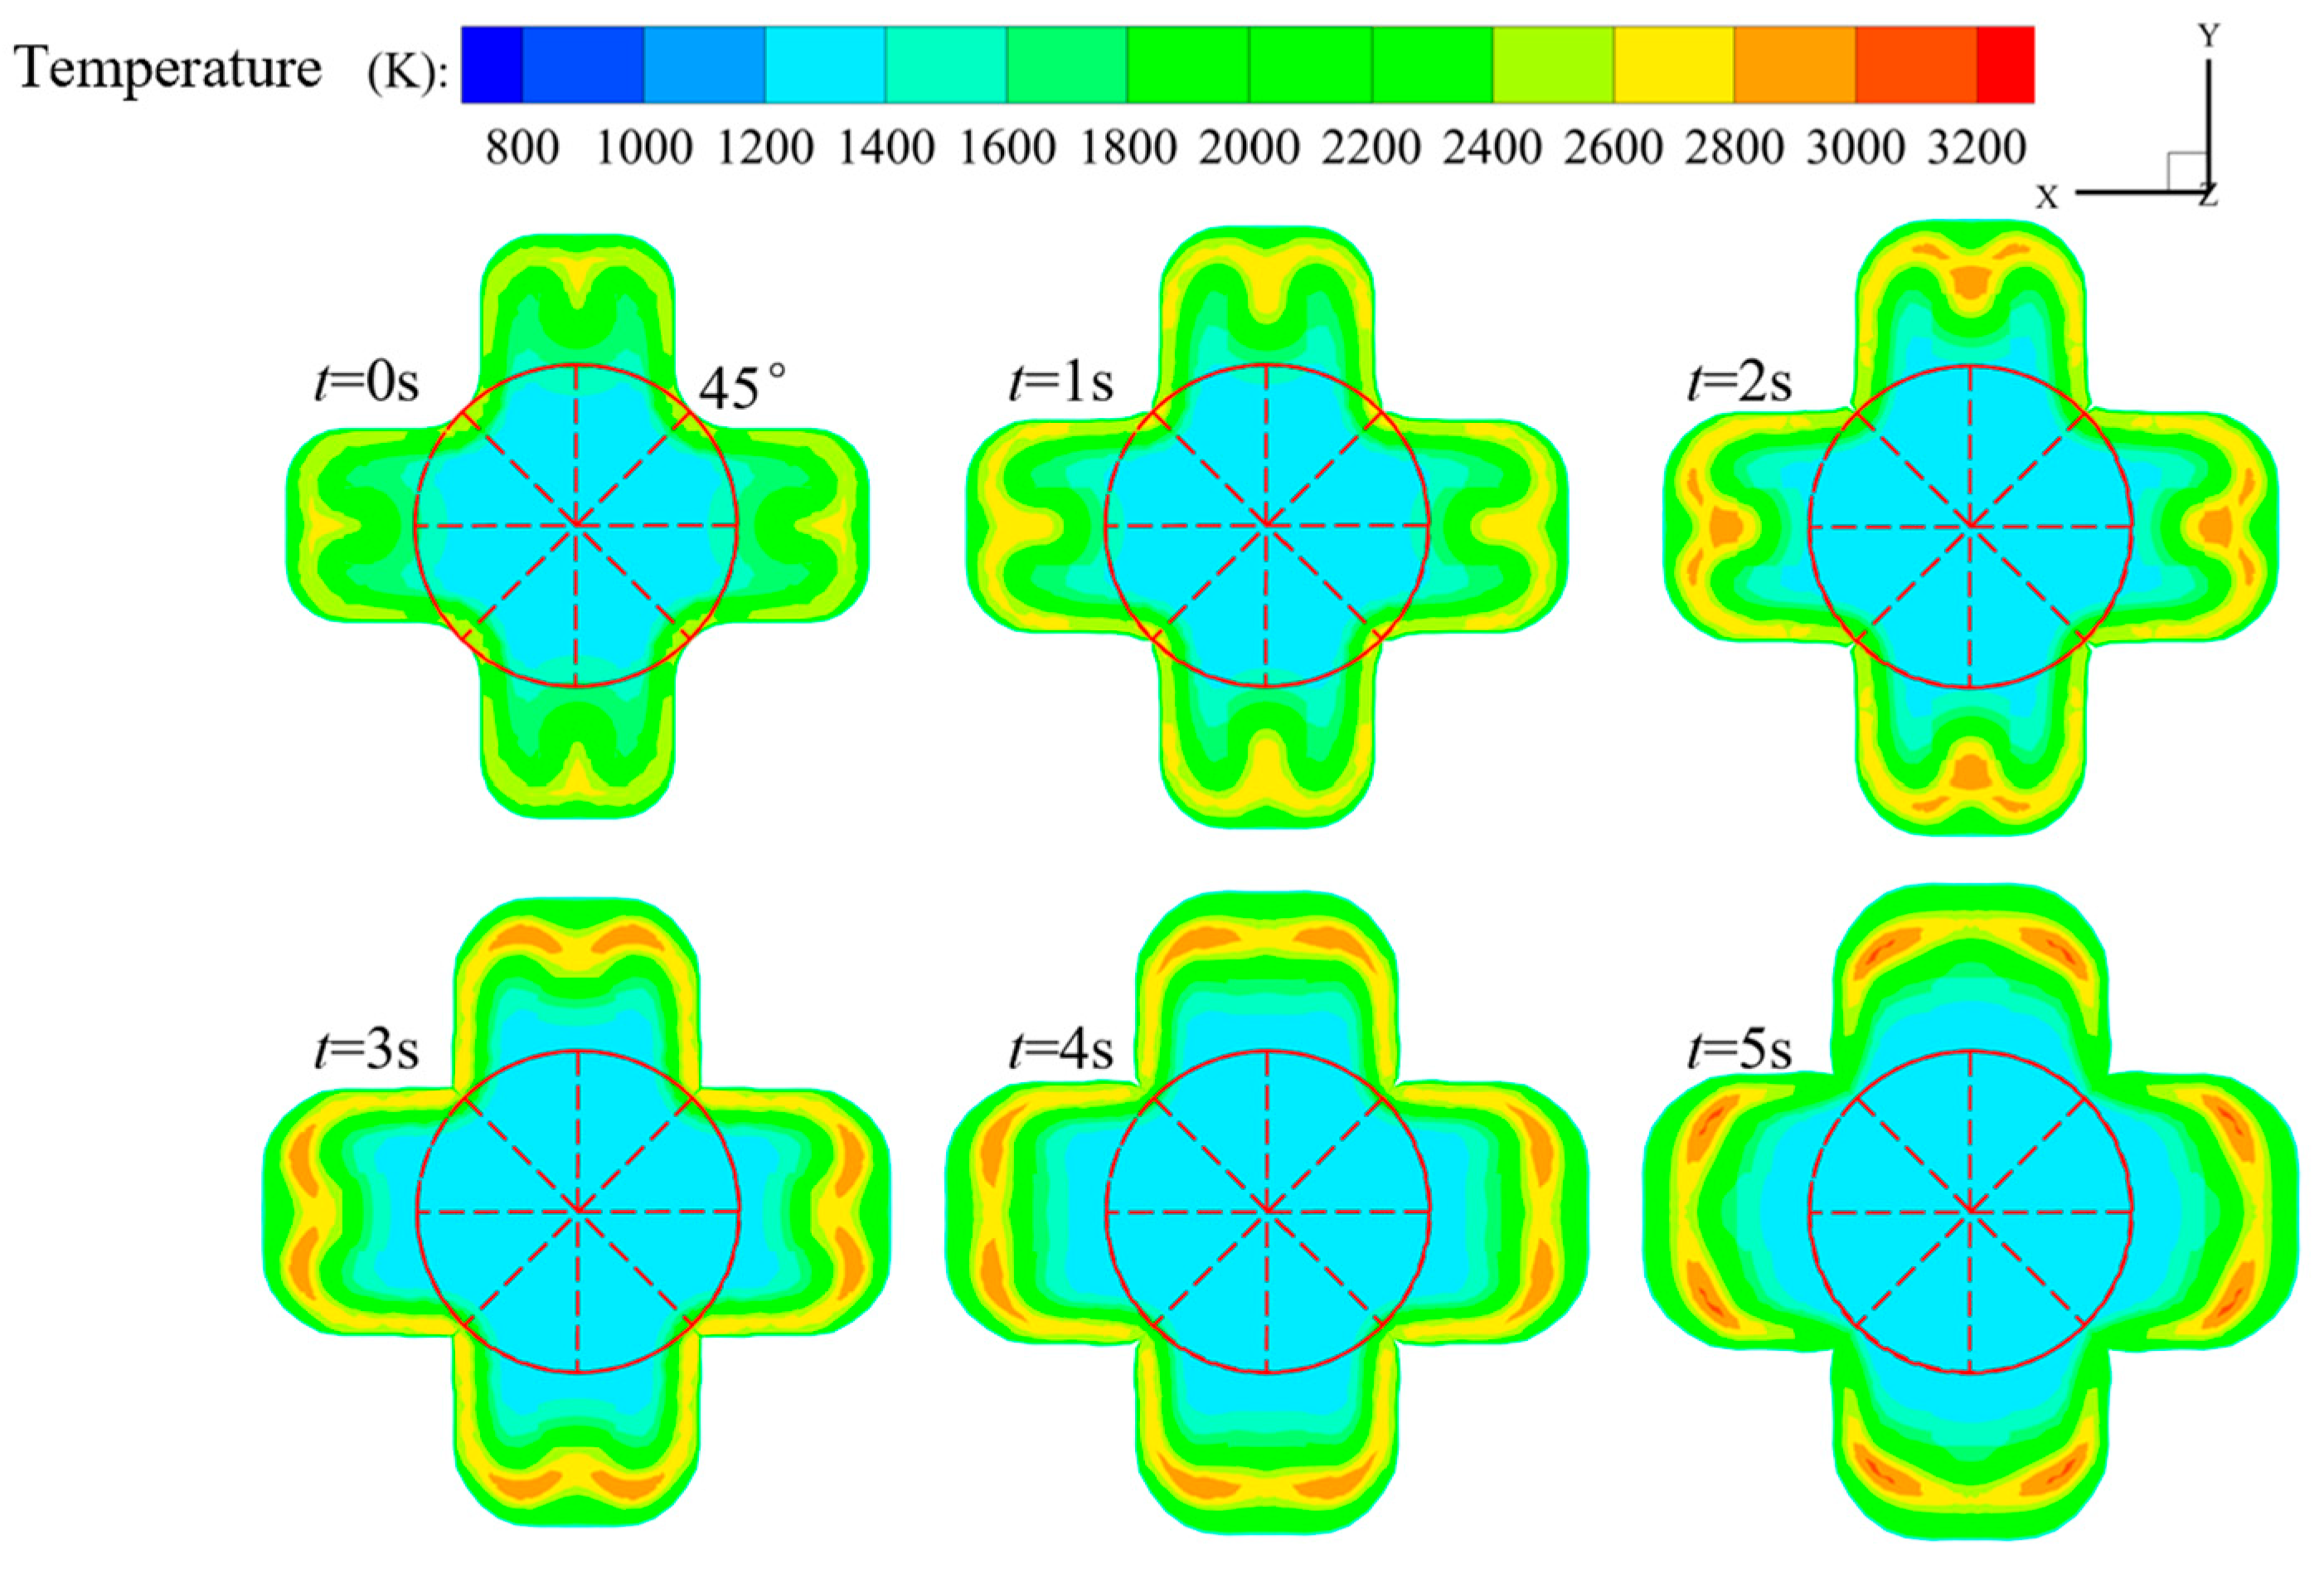
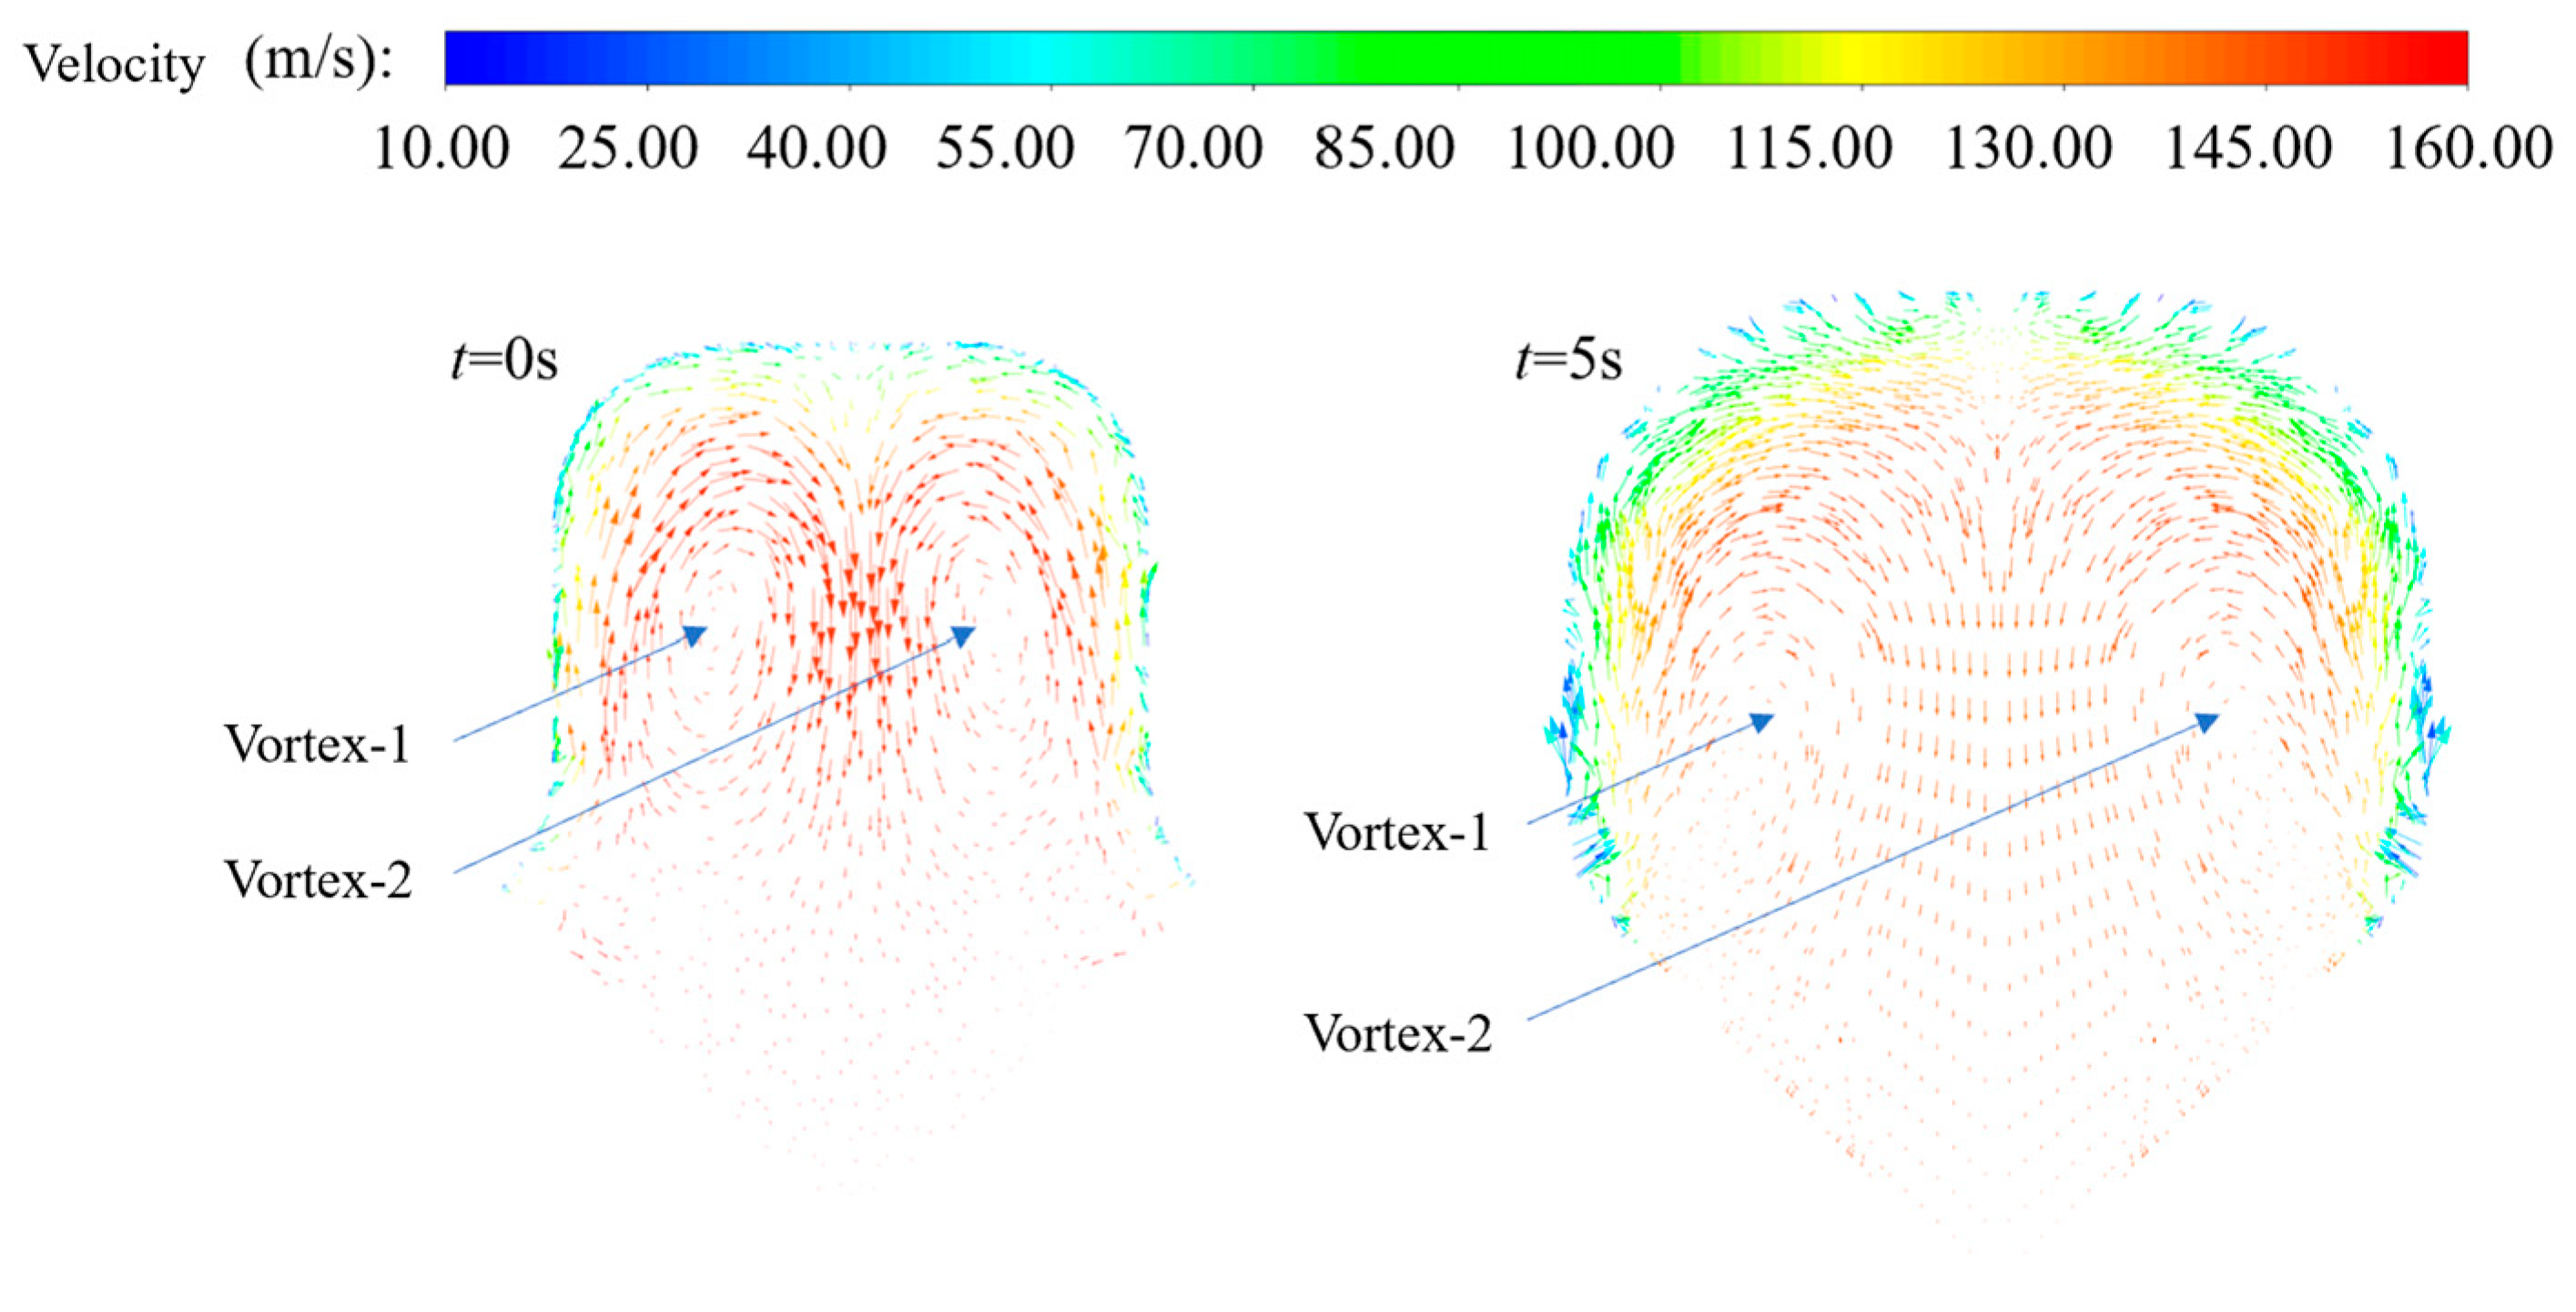
(2)
The changes in the flow field structure and performance parameters during the operation of a cross-shaped grain in hybrid rocket motors were obtained. Notably, as the port expands, the high-temperature zone inside it changes from an “m” shape to an “n” shape. This occurs because the distance between the vortices on both sides of the symmetry plane gradually increases.
(3)
The deviations in chamber pressure and thrust from the simulation and test were less than 0.6% and 1.7%, respectively. The deviation between the simulated port area and the CT-scanned port area after the test was less than 3.5%. This indicates that the three-dimensional dynamic model of cross-shaped grains demonstrates good accuracy in performance parameters and combustion surface distribution.

Author Contributions

Conceptualization, X.M.; methodology, H.H.; validation, Y.C.; formal analysis, H.H.; investigation, H.H. and Y.C.; resources, J.W.; writing—original draft preparation, X.M.; writing—review and editing, X.M.; visualization, M.Y.; supervision, J.W.; funding acquisition, H.T. All authors have read and agreed to the published version of the manuscript.

Funding

This research was funded by the Nanjing University of Aeronautics and Astronautics and Beihang University.

Data Availability Statement

The original contributions presented in the study are included in the article, further inquiries can be directed to the corresponding author.

Acknowledgments

The authors would like to express their gratitude to Nanjing University of Aeronautics and Astronautics, which supported the hybrid technology development.

Conflicts of Interest

The authors declare no conflicts of interest.

References

  1. Zhang, B.N. Understanding and outlook on EDLA technology. Aerosp. Return Remote Sens. 2018, 39, 36–44. [Google Scholar]
  2. Cai, G.B. Development and Application of Hybrid Rocket Motor Technology: Overview and Prospect. J. Propuls. Technol. 2012, 33, 831. [Google Scholar]
  3. Sutton, O.G.P. Biblarz, Rocket Propulsion Elements, 9th ed.; John Wiley & Sons: New York, NY, USA, 2016. [Google Scholar]
  4. Taylor, T.S. Introduction to Rocket Science and Engineering; CRC Press: Boca Raton, FL, USA, 2017. [Google Scholar]
  5. Karp, A.C.; Jens, E.T. Hybrid Rocket Propulsion Design Handbook; Academic Press: London, UK, 2023. [Google Scholar]
  6. Newlands, R.M. The Science and Design of the Hybrid Rocket Engine; Lulu.com: Raleigh, NC, USA, 2017. [Google Scholar]
  7. Luo, J.X.; Zhang, Z.L.; Lin, X.; Wang, Z.Z.; Kun, W.; Zhou, G.X.; Zhang, S.H.; Li, F.; Yu, X.L.; Wu, J. Flame Dynamics in the Combustion Chamber of Hybrid Rocket Using Multiangle Chemiluminescence. J. Propuls. Power 2023, 39, 482–491. [Google Scholar] [CrossRef]
  8. Wang, R.; Lin, X.; Wang, Z.; Wu, K.; Zhang, Z.; Luo, J.; Li, F.; Yu, X. Combustion Characteristics of a Swirl-Radial-Injection Composite Fuel Grain with Applications in Hybrid Rockets. Aerospace 2023, 10, 759. [Google Scholar] [CrossRef]
  9. Wei, T.; Cai, G.; Tian, H.; Jiang, X. Experiment and Numerical Research on Regression Rate of Hybrid Rocket Motor with Single-port Wagon Wheel Fuel Grain. Acta Astronaut. 2023, 207, 265–282. [Google Scholar] [CrossRef]
  10. Meng, X.; Gao, J.; Tian, H.; Niu, X.; Chen, R.; Cai, G. Study on the dynamic numerical simulation of flow and combustion in hybrid rocket motors based on a discrete phase model. Acta Astronaut. 2014, 215, 156–167. [Google Scholar] [CrossRef]
  11. Meng, X.; Tian, H.; Chen, X.; Jiang, X.; Wang, P.; Wei, T.; Cai, G. Numerical simulation of combustion surface regression based on Butterworth filter in hybrid rocket motor. Acta Astronaut. 2023, 202, 400–410. [Google Scholar] [CrossRef]
  12. Antoniu, A.; Akyuzlu, K.M. A physics based comprehensive mathematical model to predict motor performance in hybrid rocket propulsion systems. In Proceedings of the 41st AIAA/ASME/SAE/ASEE Joint Propulsion Conference, Tucson, AZ, USA, 10–13 July 2005; p. 3541. [Google Scholar]
  13. Tian, H.; Li, Y.; Zeng, P. Transient Simulation of Regression Rate on Thrust Regulation Process in Hybrid Rocket Motor. Chin. J. Aeronaut. 2014, 27, 1343–1351. [Google Scholar] [CrossRef]
  14. Zhang, S.; Hu, F.; Wang, D.; Okolo, N.P.; Zhang, W. Numerical Simulations on Unsteady Operation Processes of N2O/HTPB Hybrid Rocket Motor with/without Diaphragm. Acta Astronaut. 2017, 136, 115–124. [Google Scholar] [CrossRef]
  15. Di Martino, G.D.; Mungiguerra, S.; Carmicino, C.; Savino, R.; Cardillo, D.; Battista, F.; Invigorito, M.; Elia, G. Two-Hundred-Newton Laboratory-Scale Hybrid Rocket Testing for Paraffin Fuel-Performance Characterization. J. Propuls. Power 2019, 35, 224–235. [Google Scholar] [CrossRef]
  16. Gallo, G.; Carmicino, C.; Mungiguerra, S.; Di Martino, G.D.; Savino, R. An Improvement of the Gas-surface Interaction and Entrainment Models for Paraffin-based Fuels in Hybrid Rocket Engines. In Proceedings of the AIAA Propulsion and Energy 2020 Forum, Online, 17 August 2020; p. 3760. [Google Scholar]
  17. Migliorino, M.T.; Gubernari, G.; Bianchi, D.; Nasuti, F.; Cardillo, D.; Battista, F. Numerical Simulations of Fuel Shape Change in Paraffin-Oxygen Hybrid Rocket Engines. In Proceedings of the AIAA AVIATION 2022, Chicago, IL, USA, 27 June–1 July 2022; p. 3563. [Google Scholar]
  18. Meng, X.; Tian, H.; Niu, X.; Zhu, H.; Gao, J.; Cai, G. Long-Duration Dynamic Numerical Simulation of Combustion and Flow in Hybrid Rocket Motors Considering Nozzle Erosion. Aerospace 2024, 11, 318. [Google Scholar] [CrossRef]
  19. Meng, X.; Tian, H.; Jiang, X.; Wei, T.; Cai, G. Experimental and numerical investigation on thermochemical erosion and mechanical erosion of carbon-based nozzles in hybrid rocket motors. Aerosp. Sci. Technol. 2024, 148, 109097. [Google Scholar] [CrossRef]
  20. Motoe, M.; Shimada, T. Numerical Simulations of Combustive Flows in a Swirling-Oxidizer-Flow-Type Hybrid Rocket. In Proceedings of the 52nd Aerospace Sciences Meeting, National Harbor, MD, USA, 13–17 January 2014; p. 0310. [Google Scholar]
  21. Betelin, V.; Kushnirenko, A.; Smirnov, N.; Nikitin, V.; Tyurenkova, V.; Stamov, L. Numerical Investigations of Hybrid Rocket Engines. Acta Astronaut. 2018, 144, 363–370. [Google Scholar] [CrossRef]
  22. Smirnov, N.; Betelin, V.; Nikitin, V.; Stamov, L.; Altoukhov, D. Accumulation of Errors in Numerical Simulations of Chemically Reacting Gas Dynamics. Acta Astronaut. 2015, 117, 338–355. [Google Scholar] [CrossRef]
  23. Meng, X.; Tian, H.; Yu, R.; Lu, Y.; Gu, X.; Tan, G.; Cai, G. Three-dimensional numerical simulation of hybrid rocket motor based on dynamic mesh technology. Aerosp. Sci. Technol. 2023, 141, 108573. [Google Scholar] [CrossRef]
  24. Li, X.; Tian, H.; Yu, N.; Cai, G. Three-dimensional Numerical Simulation of Two-phase Flow in Hybrid Rocket Motor. In Proceedings of the 49th AIAA/ASME/SAE/ASEE Joint Propulsion Conference, San Jose, CA, USA, 14–17 July 2013; p. 3893. [Google Scholar]
  25. Li, C.; Cai, G.; Tian, H. Numerical analysis of combustion characteristics of hybrid rocket motor with multi-section swirl injection. Acta Astronaut. 2016, 123, 26–36. [Google Scholar] [CrossRef]
  26. Shih, T.-H.; Liou, W.W.; Shabbir, A.; Yang, Z.; Zhu, J. A New k-ε Eddy Viscosity Model for High Reynolds Number Turbulent Flows: Model Development and Validation. Comput. Fluids 1995, 24, 227–238. [Google Scholar] [CrossRef]
  27. Zou, X.; Wang, N.; Han, L.; Bai, T.; Xie, K. Numerical Investigation on Regression Rate and Thrust Regulation Behaviors of a Combined Solid Rocket Motor with Aluminum-based Fuel. Aerosp. Sci. Technol. 2021, 119, 107102. [Google Scholar] [CrossRef]
  28. Shan, F.; Hou, L.; Piao, Y. Combustion Performance and Scale Effect from N2O/HTPB Hybrid Rocket Motor Simulations. Acta Astronaut. 2013, 85, 1–11. [Google Scholar] [CrossRef]
  29. Durand, J.; Raynaud, F.; Lestrade, J.-Y.; Anthoine, J. Turbulence Modeling Effects on Fuel Regression Rate in Hybrid Rocket Numerical Simulations. J. Propuls. Power 2019, 35, 1127–1142. [Google Scholar] [CrossRef]
  30. Baurle, R.A.; Eklund, D.R. Analysis of Dual-Mode Hydrocarbon Scramjet Operation at Mach 4-6.5. J. Propuls. Power 2002, 18, 990–1002. [Google Scholar] [CrossRef]
  31. Zhang, S.; Hu, F.; Zhang, W. Numerical Investigation on the Regression Rate of Hybrid Rocket Motor with Star Swirl Fuel Grain. Acta Astronaut. 2016, 127, 384–393. [Google Scholar] [CrossRef]
  32. Gurunadhan, M.D.P.; Baran, A.; Menon, S.K. Numerical Simulation of Combustion in a Hybrid Rocket with Liquefying Fuels. In Proceedings of the AIAA Propulsion and Energy 2019 Forum, Indianapolis, IN, USA, 19–22 August 2019; p. 4415. [Google Scholar]
Figure 1. Schematic of the structure of the combustion chamber in this hybrid rocket motor [23].
Aerospace 12 00429 g001
Figure 2. Cross-shaped grain profile.
Aerospace 12 00429 g002
Figure 3. Computational domain of the cross-shaped hybrid rocket motor.
Aerospace 12 00429 g003
Figure 4. Change in the combustion surface during the parallel regression process.
Aerospace 12 00429 g004
Figure 5. Schematic of the supplying system.
Aerospace 12 00429 g005
Figure 6. Test platform of this hybrid rocket motor.
Aerospace 12 00429 g006
Figure 7. Schematic of a hybrid rocket motor annular igniter.
Aerospace 12 00429 g007
Figure 8. The temperature distribution along the axial section at the initial moment in the simulation.
Aerospace 12 00429 g008
Figure 9. The temperature distribution along the axial section at 5 s in the simulation.
Aerospace 12 00429 g009
Figure 10. Temperature distribution at Z = 0.1 m over time in the simulation.
Aerospace 12 00429 g010
Figure 11. Variation in velocity distribution at Z = 0.1 m of the 1/4 port in the simulation.
Aerospace 12 00429 g011
Figure 12. Mass fraction of C2H4 distribution at Z = 0.1 m over time in the simulation.
Aerospace 12 00429 g012
Figure 13. Mass fraction of O2 distribution at Z = 0.1 m over time in the simulation.
Aerospace 12 00429 g013
Figure 14. Temperature distribution at X = 0 m over time in the simulation.
Aerospace 12 00429 g014
Figure 15. Temperature distribution at Y= X over time in the simulation.
Aerospace 12 00429 g015
Figure 16. Regression rate at characteristic positions along the axial direction in the simulation.
Aerospace 12 00429 g016
Figure 17. Firing test in this hybrid rocket motor.
Aerospace 12 00429 g017
Figure 18. The rear end face of this grain before and after the test.
Aerospace 12 00429 g018
Figure 19. Comparison of combustion chamber pressure between simulation and test.
Aerospace 12 00429 g019
Figure 20. Comparison of motor thrust between simulation and test.
Aerospace 12 00429 g020
Figure 21. Comparison of the scanned cross section after the test and the simulated port cross section.
Aerospace 12 00429 g021
Table 1. The 3-step, 6-species ethylene kinetic model.
No.ReactionParameters
AbTa
1 C 2 H 4 + O 2 2 CO + 2 H 2 2.10 × 10140.018,015.3
2 2 CO + O 2 2 CO 2 3.48 × 10112.010,134.9
3 2 H 2 + O 2 2 H 2 O 3.00 × 10²⁰−1.00
Table 2. Main structural parameters of this hybrid rocket motor.
ParameterValue
Inner diameter of pre-chamber/mm80
Length of pre-chamber/mm35
Length of grain/mm375
Length of post-chamber/mm50
Diameter of nozzle throat/mm15
Expansion area ratio of nozzle3
Table 3. Port area between simulation and test.
Position (mm)Area in Simulation (mm2)Area in Test (mm2)Error (%)
100719.7736.12.2
200720.1746.73.5
300739.3763.33.1
400745.5766.42.7
Disclaimer/Publisher’s Note: The statements, opinions and data contained in all publications are solely those of the individual author(s) and contributor(s) and not of MDPI and/or the editor(s). MDPI and/or the editor(s) disclaim responsibility for any injury to people or property resulting from any ideas, methods, instructions or products referred to in the content.

