Article

Spectroscopic Quantification of Metallic Element Concentrations in Liquid-Propellant Rocket Exhaust Plumes

by
Siyang Tan
1,
Song Yan
2,
Xiang Li
1,
Tong Su
1,
Qingchun Lei
1,3,* and
Wei Fan
1,3
1
School of Power and Energy, Northwestern Polytechnical University, Xi’an 710072, China
2
National Key Laboratory of Aerospace Liquid Propulsion, Xi’an 710100, China
3
National Key Laboratory of Science and Technology on Advanced Light-Duty Gas-Turbine, Xi’an 710072, China
*
Author to whom correspondence should be addressed.
Aerospace 2025, 12(5), 427; https://doi.org/10.3390/aerospace12050427
Submission received: 3 April 2025 / Revised: 8 May 2025 / Accepted: 9 May 2025 / Published: 11 May 2025
(This article belongs to the Section Astronautics & Space Science)

Abstract

:
Accurate quantification of metallic contaminants in rocket exhaust plumes serves as a critical diagnostic indicator for engine wear monitoring. This paper develops a hybrid method combining atomic emission spectroscopy (AES) theory with a genetic algorithm (GA) optimized backpropagation (BP) network to quantify the metallic element concentrations in liquid-propellant rocket exhaust plumes. The proposed method establishes linearized intensity–concentration mapping through the introduction of a photon transmission factor, which is derived from radiative transfer theory and experimentally calibrated via AES measurement. This critical innovation decouples the inherent nonlinearities arising from self-absorption artifacts. Through the use of the transmission factor, the training dataset for the BP network is systematically constructed by performing spectral simulations of atomic emissions. Finally, the trained network is employed to predict the concentration of metallic elements from the measured atomic emission spectra. These spectra are generated by introducing a solution containing metallic elements into a CH4-air premixed jet flame. The predictive accuracy of the method is rigorously evaluated through 32 independent experimental trials. Results show that the quantification error of metallic elements remains within 6%, and the method exhibits robust performance under conditions of spectral self-absorption, demonstrating its reliability for rocket engine health monitoring applications.

1. Introduction

The spectroscopic signatures of liquid-propellant rocket exhaust plumes serve as a high-fidelity diagnostic medium for engine condition monitoring [1,2]. For example, plume emission spectroscopy has emerged as the predominant technique for liquid-propellant rocket engine health monitoring, owing to its unique capability to detect metallic contamination signatures [3]. Metallic constituents from components undergoing degradation processes such as aging, ablation, or wear are transported into the exhaust plume, where high-temperature environments (i.e., 1800–3500 K) thermally excite these elements to produce element-specific atomic emission signatures detectable at parts-per-million (ppm) concentration levels [4,5]. This phenomenon enables precise identification of component-specific failure modes through a spectral line intensity analysis of metals, establishing a non-invasive, real-time anomaly detection framework with millisecond-level temporal resolution for critical engine subsystems [6,7,8,9].
In related research, Arnold et al. from NASA’s Ames Research Center (ARC) developed the Line-by-Line (LBL) program for atomic emission spectroscopy simulations. Later, the Stennis Space Center (SSC) enhanced it to better suit the high-temperature exhaust plume environment [10]. This program calculates the contributions of each atomic line to generate a complete spectrum. In 1987, NASA’s Marshall Space Flight Center (MSFC) conducted an analysis of failure reports from the Space Shuttle Main Engine (SSME) test firings, which revealed that anomalous plume spectral data had been consistently recorded during numerous ground test anomalies, providing early evidence of metallic emission signatures correlated with component degradation events [11,12]. During the same year, Cikanek et al. [12] at MSFC identified characteristic emission signatures of OH radicals, potassium (K), sodium (Na), and calcium hydroxide (CaOH) in the SSME exhaust plumes, though the limited spectral resolution of first-generation Optical Multichannel Analyzers (OMAs) prevented definitive detection of metallic constituents like iron and nickel [13].
Building upon these findings, both NASA’s MSFC and SSC initiated the development of an Optical Plume Anomaly Detection (OPAD) system for the SSME, establishing the first dedicated optical diagnostics framework for liquid-propellant rocket engine health monitoring. This initiative implemented comprehensive spectral surveillance across 220–1500 nm wavelengths during SSME hot-fire tests to capture both atomic metal emissions and molecular band structures critical for early fault detection [14]. For example, Gardner D.G. et al. [15] conducted spectroscopy measurement on a subscale SSME test article, identifying iron and chromium emission lines indicative of baffle ablative erosion, while notably failing to detect copper signatures despite the component’s copper matrix. Complementing this, Powers W.T. et al. [16] detected characteristic spectra of Fe, Co, Cr, and Ni in the exhaust plume, which were linked to wear on the SSME combustion chamber panel. To systematically characterize metallic atomic emission in rocket plumes, Tejwani G.D. et al. [13] at NASA developed a laboratory-scale bipropellant engine with integrated metal salt injection capabilities, enabling precise doping of aqueous metal nitrate solutions into the combustion chamber.
The advent of high-resolution OMAs with 0.05 nm spectral resolution across UV-VIS-NIR (200–1100 nm) enabled NASA to conduct hyperspectral characterization of rocket plumes, not only resolving metallic emission features but also achieving the quantitative determination of nickel concentrations [17]. Subsequently, Benzing D.A. [18,19] implemented neural network algorithms to analyze rocket exhaust plume spectra, achieving diagnostic identification of engine component anomalies through advanced spectral pattern recognition and machine learning techniques. The SSC later integrated the OPAD system into the Engine Diagnostics Console (EDC) [20], correlating exhaust plume alloys with engine hardware components. The EDC system demonstrated its critical safety value during a January 1996 SSME hot-fire test at NASA SSC [20].
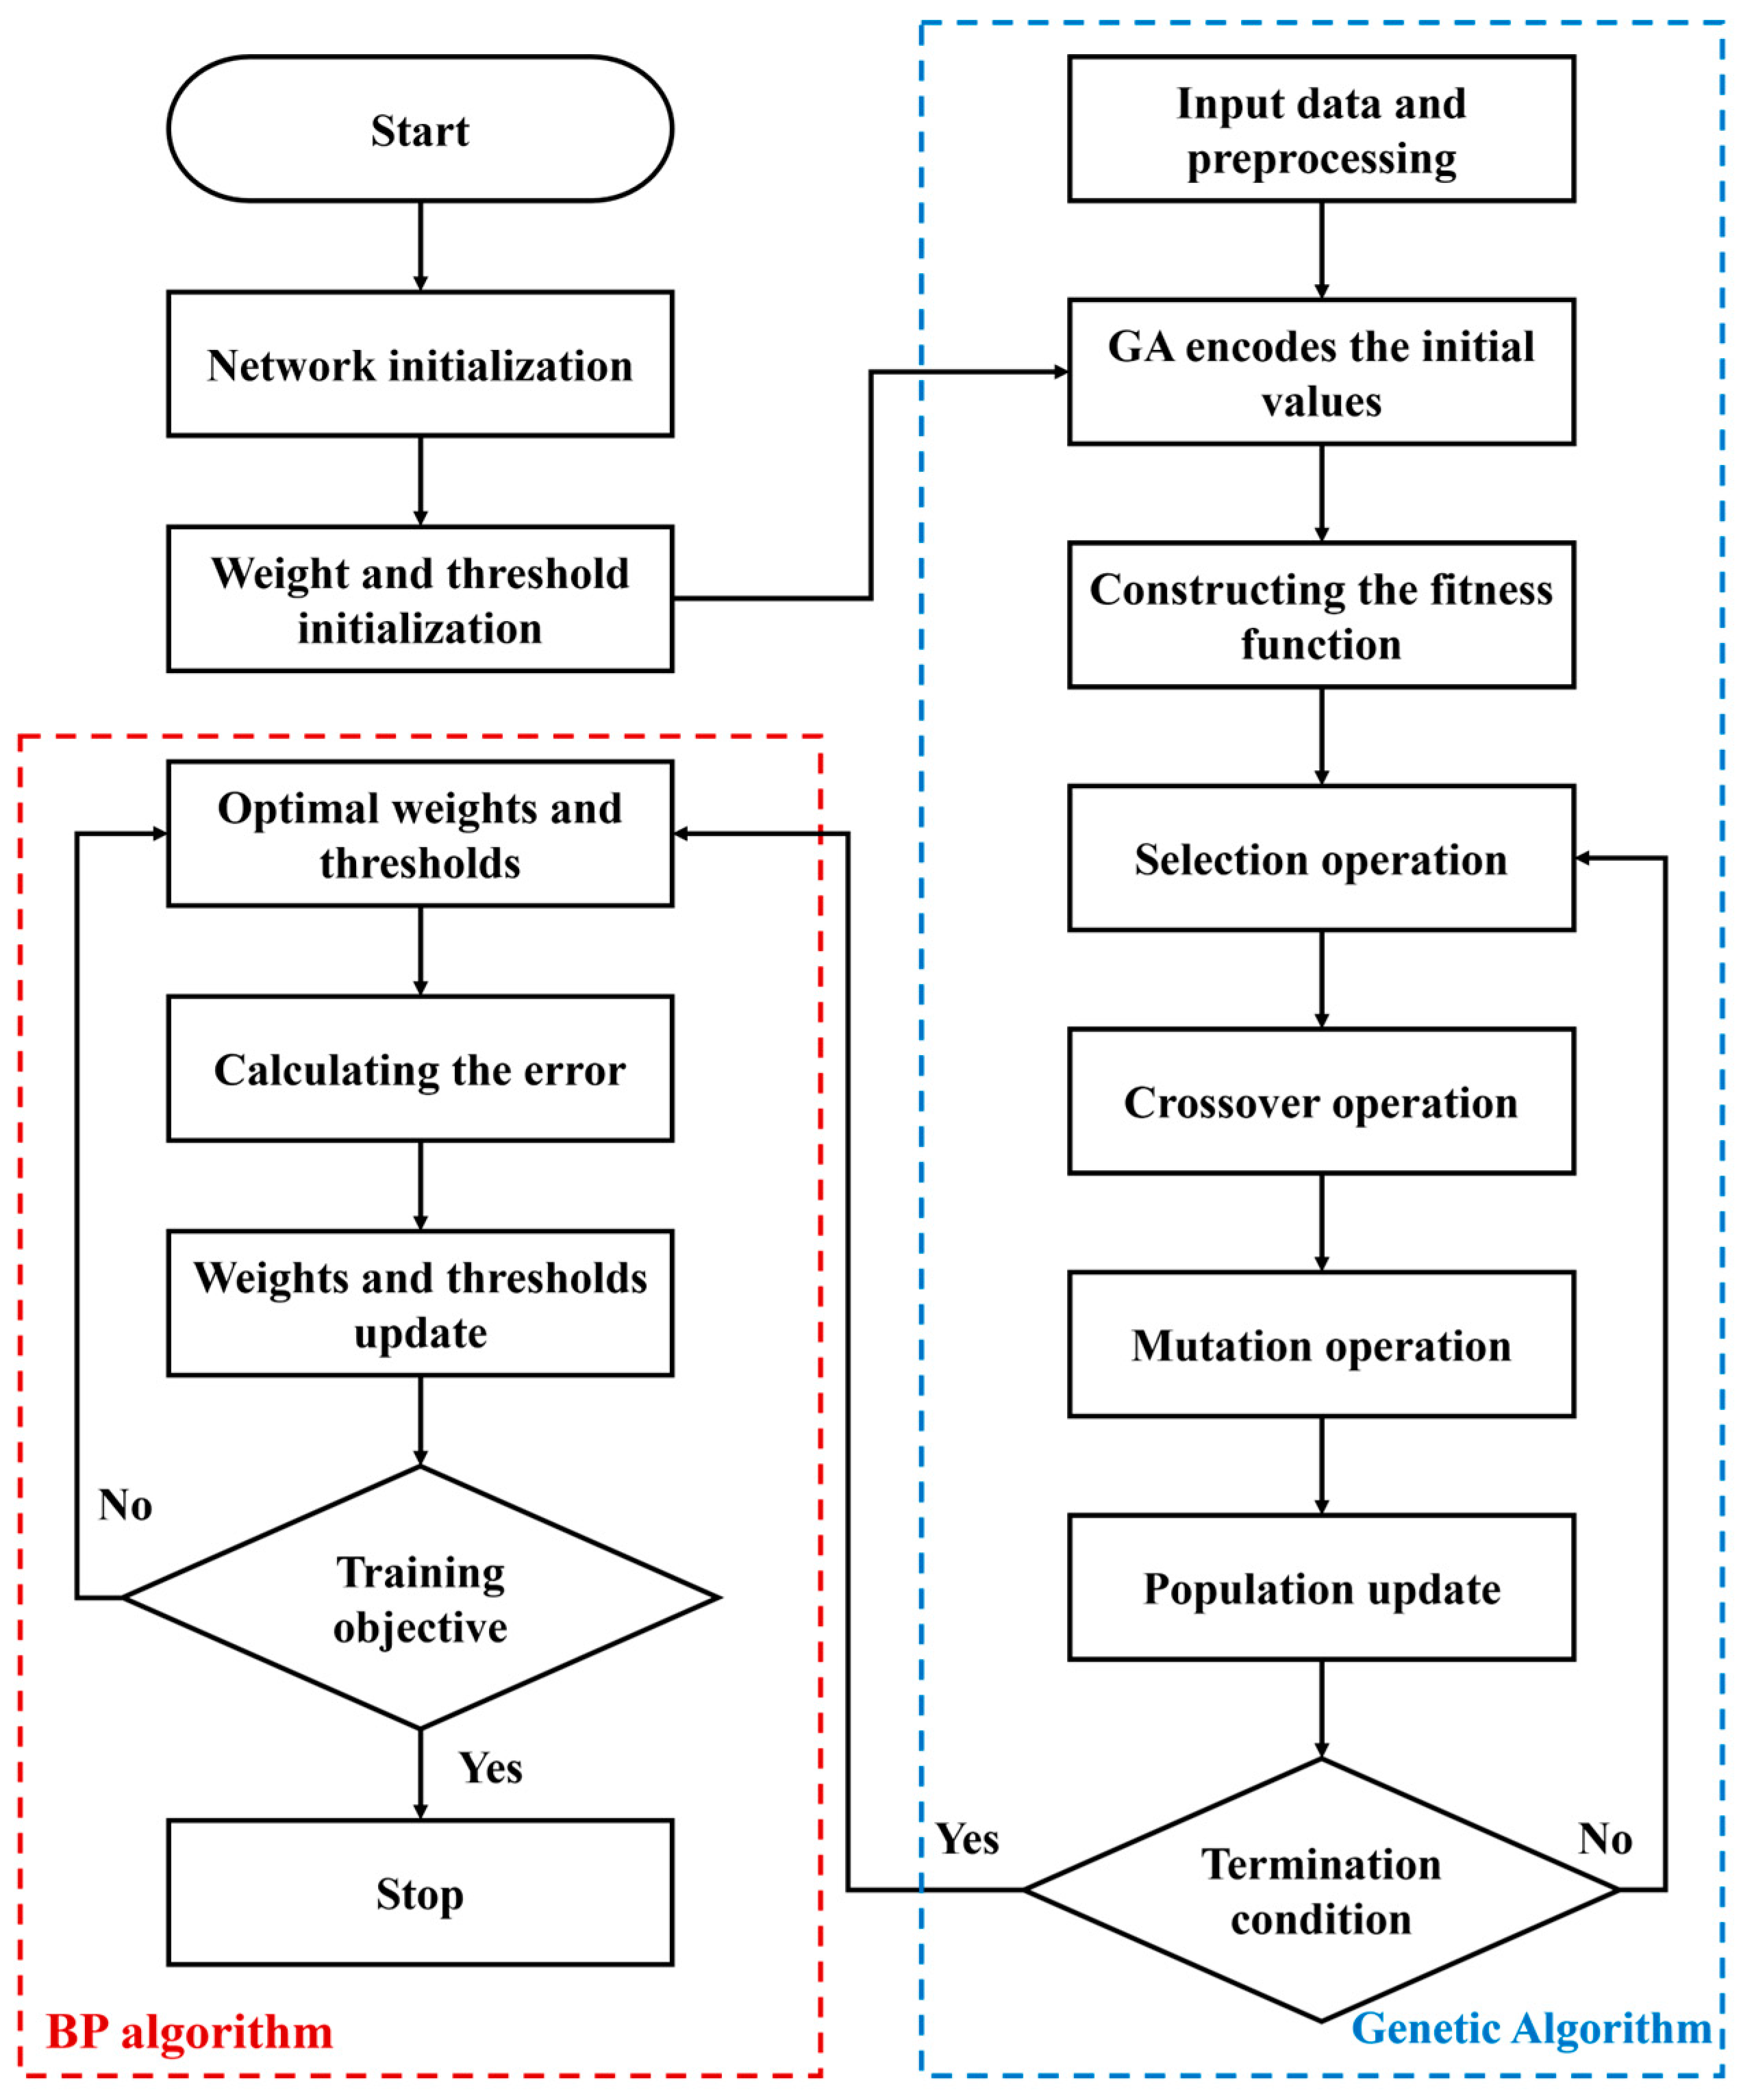
With the above understandings, a critical step in plume-spectra-based engine fault diagnosis is accurately quantifying metallic element concentrations from measured spectra. To address this challenge, this study introduces a quantification model based on a backpropagation (BP) neural network optimized by a genetic algorithm (GA), extending prior research [21]. The model linearizes the inherently nonlinear relationship between spectral intensity and metal concentration by incorporating a photon transmission factor. This factor is derived from radiative transfer theory and experimentally calibrated through AES measurements. Using this calibrated factor, high-accuracy spectral simulations of atomic emission are performed to systematically construct a training dataset for the BP network. Finally, a series of experiments is conducted to validate the model’s effectiveness.

2. Atomic Emission Spectroscopy

During thermal excitation processes in high-temperature flames, metallic atoms undergo electronic transitions from ground states to excited states, followed by radiative decay that produces characteristic atomic emission spectra. In a local thermal equilibrium system, the number density of atoms at different states obeys Boltzmann’s law:
N i N 0 = g i g 0 e E i k T
where T is the adiabatic temperature in the local volume element, Ni is the number density at ith excited state, and N0 is the number density at the ground state. gi and g0 represent the degeneracies of ith excited state and ground state, respectively. Ei is the excitation energy, and k is the Boltzmann constant.
The total number density (N) is:
N = N 0 + N 1 + N 2 + N i = N 0 g 0 i = 0 i g i e E i k T = N 0 g 0 Q
where Q is the partition function, which is dependent on the elemental properties (electron configuration, ionization potentials) and temperature.
Considering the line broadening, the spectral line radiant energy intensity can be expressed through the following radiative transfer equation:
I λ = h c 4 π λ A k i N Q g i e E i k T × V ( λ , T , P )
where the right-hand side of the equation includes the atomic emission term and the Voigt line broadening term (V). c is the speed of light, h is the Planck constant, λ is the spectral wavelength, and Aki is the Einstein coefficient for spontaneous emission.
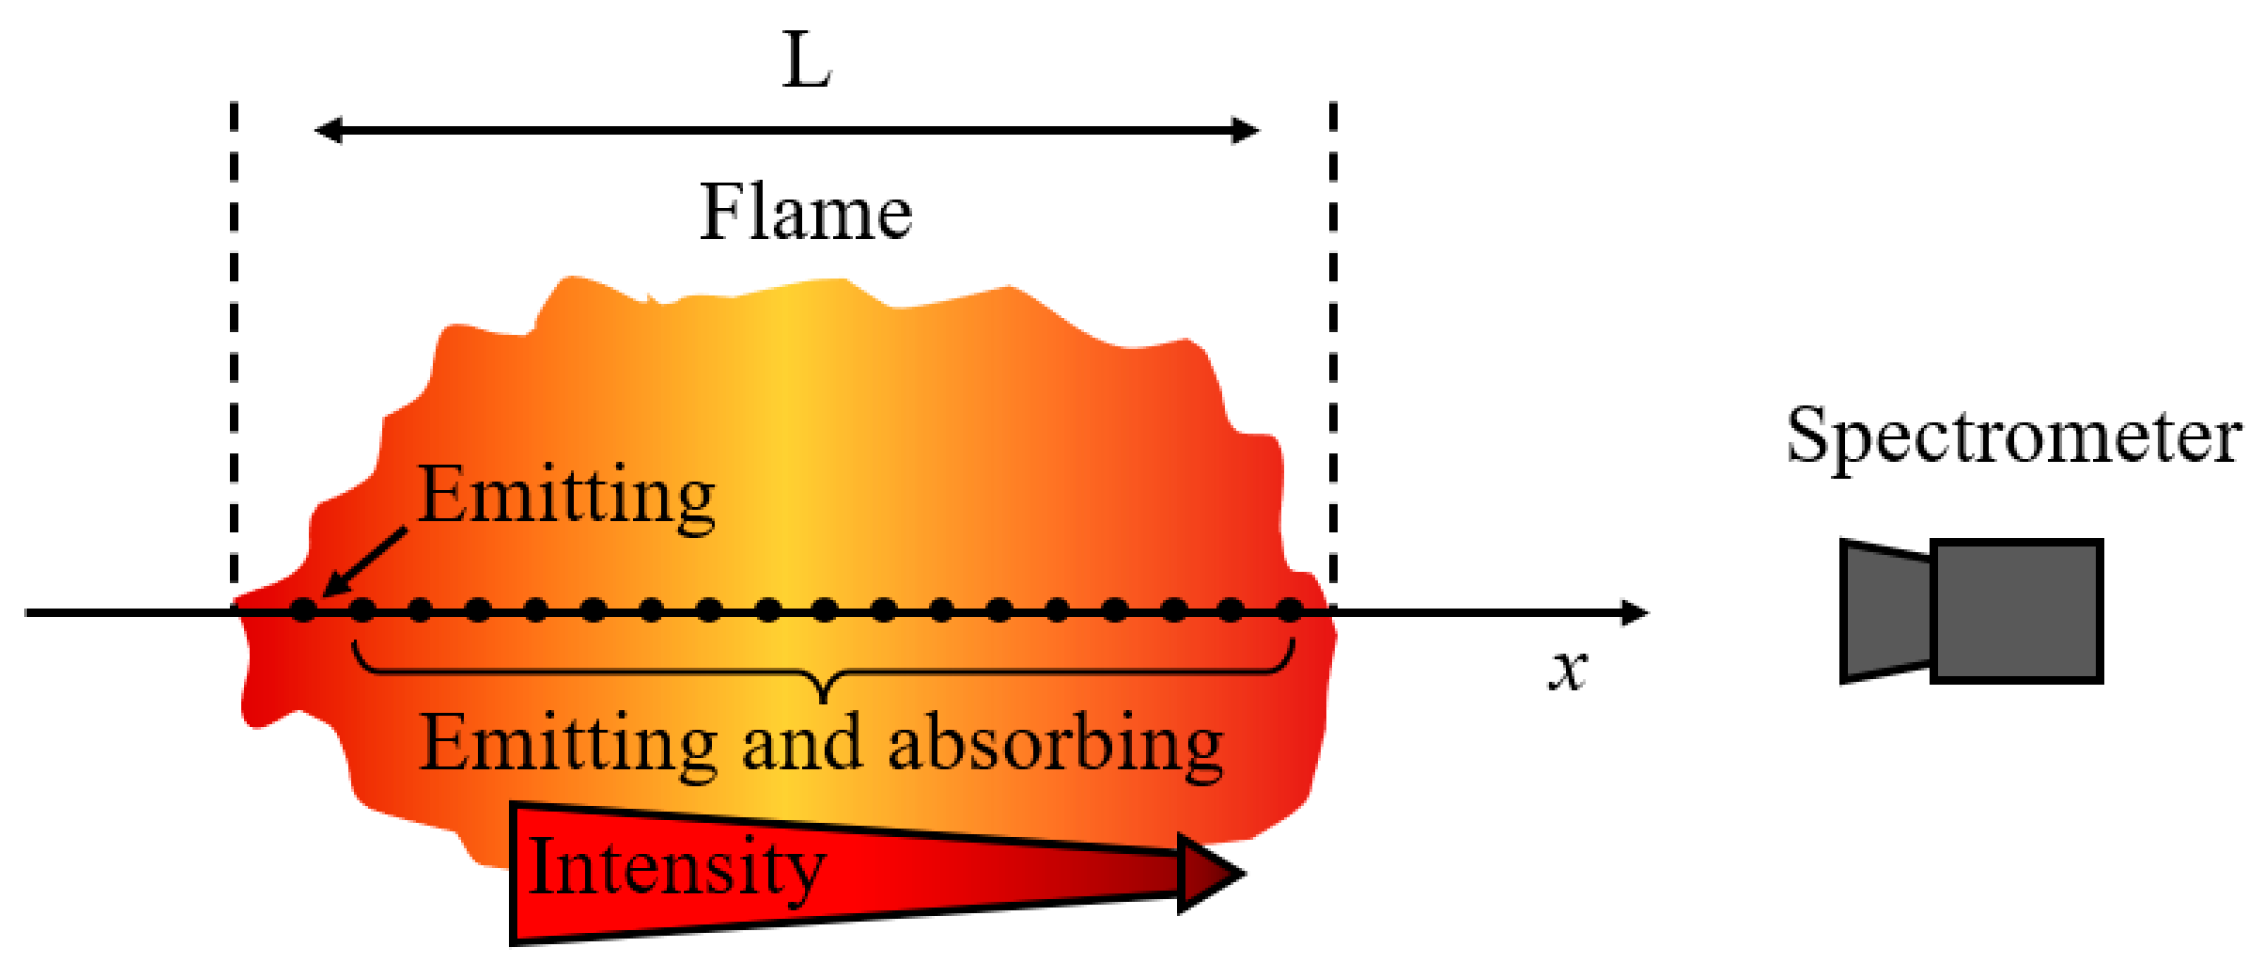
Under elevated concentrations of metallic species, self-absorption effects become significant, necessitating modification of the atomic emission equation, as shown in Figure 1. Considering the coupled emission and self-absorption, the revised form of the radiative transfer equation is expressed as:
I λ = h c 4 π λ A k i N Q g i e E i k T × V ( λ , T , P ) × [ 1 e x p ( α L ) ] α L
where α is the absorption coefficient, L is the optical path length, and   1 α L is the absorption term, dependent on element properties and elemental concentration. α is proportional to the ground-state atom number density. When α L ≪ 1 (low density), self-absorption is negligible, corresponding to the optically thin model. While α L ≫ 1 (high density), self-absorption is significant, corresponding to the optically thick model.
The spectral intensity–concentration relationship can be finally expressed as:
I λ = h c 4 π λ A k i n Q g i e E i k T × V ( λ , T , P ) × [ 1 e x p ( α L ) ] α
where n = N/L is the atomic concentration. The absorption coefficient α encapsulates inherent nonlinear dependencies arising from coupled radiative transfer phenomena. Specifically, the concentration-dependent absorption coefficient α = σ N 0 (where σ 
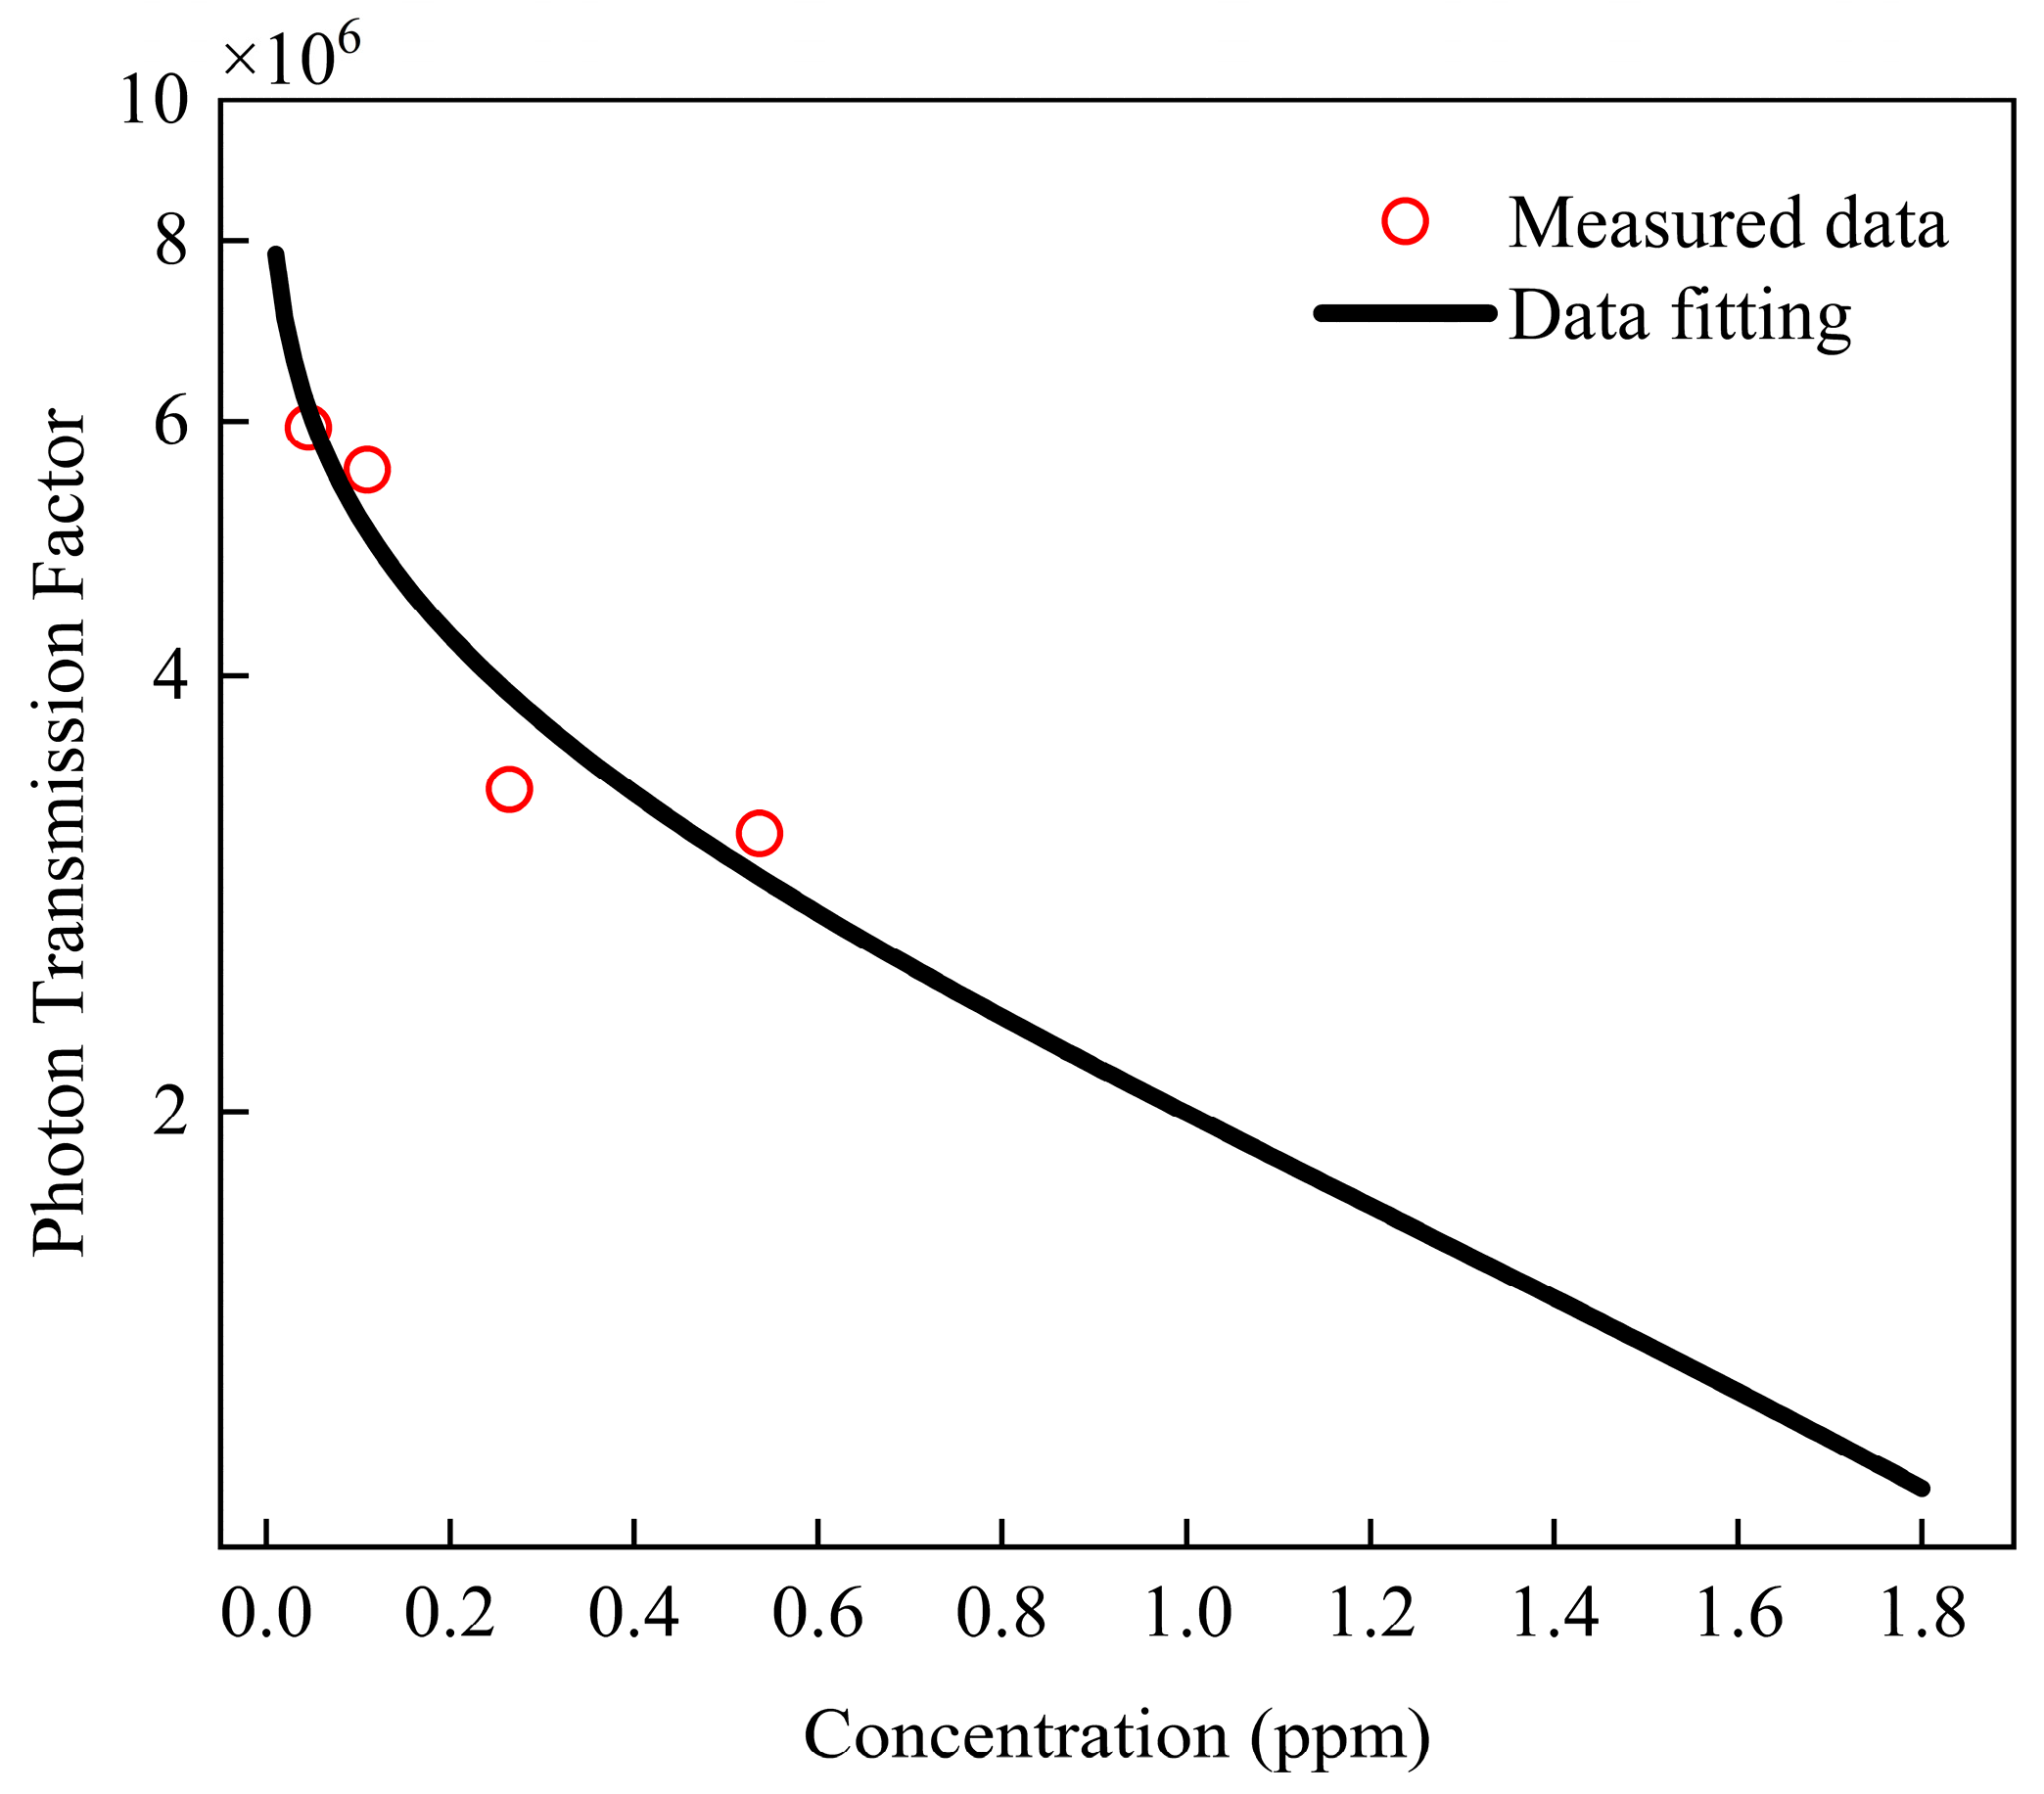
denotes the absorption cross-section from NIST databases) is governed nonlinearly by the unknown atom concentration. This nonlinear coupling creates analytically intractable transcendental relationships requiring numerical solutions through radiation transport codes combined with experimentally calibrated scaling laws for practical implementation. To decouple the nonlinear interdependencies in radiation transport modeling, we introduce a photon transmission factor ( φ ):
φ = 1 α L α
The photon transmission factor exhibits a primary dependence on the absorption coefficient, which is intrinsically governed by the number density of metallic atoms (i.e., concentration) rather than the metallic species. This dimensionless factor linearizes the intensity–concentration mapping by inherently compensating for self-absorption artifacts:
I λ = h c 4 π λ A k i n Q g i e E i k T × V ( λ , T , P ) × φ

3. Spectroscopic Quantification Model

3.1. Genetic-Algorithm-Optimized BP Neural Network

The BP neural network [22,23,24], a prevalent artificial neural network architecture, excels in addressing nonlinear problems through its multilayered structure comprising an input layer, multiple hidden layers, and an output layer. The BP algorithm operates through two interdependent computational phases: forward propagation, where input data undergo successive nonlinear transformations via weighted connections and activation functions across hidden layers to generate predictions, and backward propagation, where discrepancies between outputs and ground truth are minimized through gradient-based error backpropagation. This is achieved by systematically adjusting connection weights using optimization methods like stochastic gradient descent with momentum terms to enhance convergence stability. This iterative process continues until network parameters converge to an optimal state that minimizes the loss function (typically MSE or cross-entropy), enabling robust nonlinear mapping between spectral inputs and metallic concentration outputs in rocket plume diagnostics.
However, the stochastic initialization of BP neural network parameters introduces significant performance variability, compounded by gradient descent’s susceptibility to local minima entrapment [25,26]. To address these limitations, a hybrid GA-BP framework is used to implement parallel multi-point exploration through an 80-member population evolving over 120 generations, employing tournament selection, simulated binary crossover, and polynomial mutation to optimize both network architecture (hidden layers: 1–2, nodes: 4–10) and connection weights [27,28]. Figure 2 shows the general scheme of the hybrid GA-BP framework.

3.2. Evaluation of Neural Network Configuration

While the universal approximation theorem theoretically guarantees that a single hidden layer neural network with sufficient nodes (4–10 neurons in this study) can model arbitrary nonlinear functions, our systematic comparison of BP network configurations evaluates both single-layer (SLP: 1 hidden layer) and multi-layer (MLP: 2 hidden layers) configurations. Through 1000 training epochs on NIST-calibrated spectral datasets (5000 samples), the prediction results of two configurations are shown in Table 1 and Table 2, respectively. Root Mean Square Error (RMSE) is used as a performance metric quantifying the difference between the predicted and true data in the test dataset.
The results demonstrate that while a single-hidden-layer network achieves satisfactory prediction variance (RMSE of 0.1013 observed with 10 nodes), the dual-hidden-layer configuration yields significantly enhanced performance, reducing prediction RMSE by an order of magnitude from 10−1 to 10−2, with the optimal [6,10] node architecture (6 nodes in first hidden layer, 10 nodes in second) achieving a remarkable RMSE of 0.0170, representing an 83.2% improvement over the best single-layer performance. Consequently, the final BP neural network architecture was determined to employ this dual-hidden-layer configuration (6–10 topology), establishing this structure as the optimal balance between model complexity and prediction accuracy for metallic element quantification in rocket plume diagnostics.

3.3. Generation of Training Dataset

In neural-network-based concentration quantification methods, the acquisition of extensive and precise spectral datasets for network training presents two distinct approaches: (1) conducting numerous multi-concentration experiments to gather empirical spectral data—a process that is prohibitively expensive in both the temporal and financial dimensions, or (2) generating synthetic spectra through atomic emission simulations calibrated by limited experimental measurements. This study adopts the latter approach, implementing a hybrid data generation framework where simulated atomic spectra (incorporating Doppler/Stark broadening and self-absorption effects) are statistically validated against laboratory potassium-vapor-seeded CH4-air flame measurements.

3.3.1. Experimental Measurement

The experimental setup for atomic emission spectroscopy measurement (Figure 3) integrates four modular subsystems: (1) a pneumatic atomization chamber generating monodisperse K2CO3 spray, (2) a turbulent mixing chamber ensuring stoichiometric CH4/air/K+ vapor homogenization, (3) a water-cooled McKenna burner maintaining stable flat-flame conditions (1320 ± 15 K via thermocouple measurement), and (4) a high-resolution spectrometric chain featuring an Ocean Insight FLAME-T-XR1-ES spectrometer (0.1 nm FWHM resolution, 200–850 nm range). Potassium (K) was selected for experimental validation in this study due to its efficient excitation characteristics at laboratory-scale flame temperatures (1300–1500 K), as evidenced by its strong resonant emission lines even under relatively low-energy combustion conditions. This approach allowed rigorous methodology verification while maintaining experimental practicality.
While pneumatic atomization nozzles enable controlled introduction of metallic elements (via K2CO3 solution sprays) into CH4-air jet flames, the actual atomic concentration in the flame cannot be directly measured—only the initial solution concentration (nsol) is precisely known. Conventional approaches that equate nsol with flame metal nflame exhibit significant limitations, as this correlation remains valid solely under identical operating conditions. Variations in atomization parameters (e.g., fluctuations up to ±15%) disrupt the relationship, introducing >25% measurement errors. To overcome this, we propose a method to accurately measure the nflame:
nflame = mme/m0
where mme is the mass flow rate of the metal salt entering the flame, and m0 is the total mass flow rate at the outlet of the burner jet nozzle, which can be expressed as:
m0 = mfuel + mair + msol
where mfuel represents the mass flow rate of the fuel, mair denotes the mass flow rate of air, and msol is the mass flow rate of the metal salt solution transported by atomizing air.
In the above equations, the mfuel can be directly read from the flowmeter, while the specific values of mair and mme need to be calculated:
mair = ma1 + ma2
mme = msol · nsol
where ma1 represents the mass flow rate of the mainstream air. ma2 is the mass flow rate of the atomizing gas. Both of them are directly readable from the flowmeter in g/min.
Thus, the only unknown parameter in the above equations is the msol. This study establishes a msol-ma2 correlation through a calibrated experimental protocol: (1) initially sealing the capillary inlet of the pneumatic atomizing nozzle to stabilize the air flowmeter reading, (2) connecting a collection vessel to the gas line terminus, unsealing the liquid inlet, and performing a 1 min liquid collection to measure msol by a weighing balance, and (3) repeating this procedure across different ma2 to construct the msol-ma2 relationship. The results of msol calibration are presented in Table 3.

3.3.2. Spectral Simulation and Calibration

Leveraging this calibrated methodology, the metal atom concentration within the flame (nflame, ppm) is precisely quantified through operational parameters (i.e., mfuel, ma1, ma2, and nsol). Spectral intensity (I) and flame temperature (T) measured at different concentrations nflame, as shown in Table 4, enable rigorous calibration of the photon transmission factor (φ) based on Equation (7). Figure 4 shows the calibrated results between φ and nflame. The quantitative relationship between the photon transmission factor and concentration is established through nonlinear least-squares regression, yielding the following expression:
φ = 630,581 × e x p ( 1.616 n f l a m e )
The exponential functional form in Equation (12) was adopted to maintain mathematical consistency with the derivation of the photon transmission factor in Equation (6). The horizontal axis range in Figure 4 was intentionally extended beyond the fitted data range to visually demonstrate the characteristic exponential trend.
It should be emphasized that the calibration of the photon transmission factor–concentration relationship serves to establish consistency between spectral simulations and experimental measurements. To validate the fitting accuracy, an independent experimental dataset (excluded from the initial calibration) was employed: for given metallic atom concentrations, spectral simulations were performed by substituting Equation (12) into Equation (7), with the computational results then compared against corresponding experimental measurements (see Figure 5). Quantitative analysis revealed exceptional agreement, with merely 1.94% deviation in spectral integrated area and 0.66% discrepancy in double-peak intensity ratios, demonstrating the model’s predictive capability across different spectral features while maintaining physical interpretability through the constrained nonlinear regression framework. Our previous work [21] also validated the spectral simulation model through comparative analysis with literature data.
Through the aforementioned experimental calibration and validation procedures, the training dataset for the BP neural network was systematically generated by incorporating 4000 spectral simulation cases. The trained network architecture allowed for a spectral-concentration quantification model capable of metallic element quantification in hot-combusted plumes.

4. Experimental Validation of the Spectroscopic Quantification Model

The developed model was rigorously evaluated through a series of controlled combustion experiments. The experimental protocol employed four distinct atomization gas flow rates (ma2) while maintaining constant global combustion conditions, ensuring a total air mass flow of 10.3 g/min and a methane (CH4) flow of 0.65 g/min with 3 MPa atomization backpressure. Thermocouple measurements (Type K, ±5 K accuracy) at the spectrometer detection zone revealed temperature variations of 10–40 K (
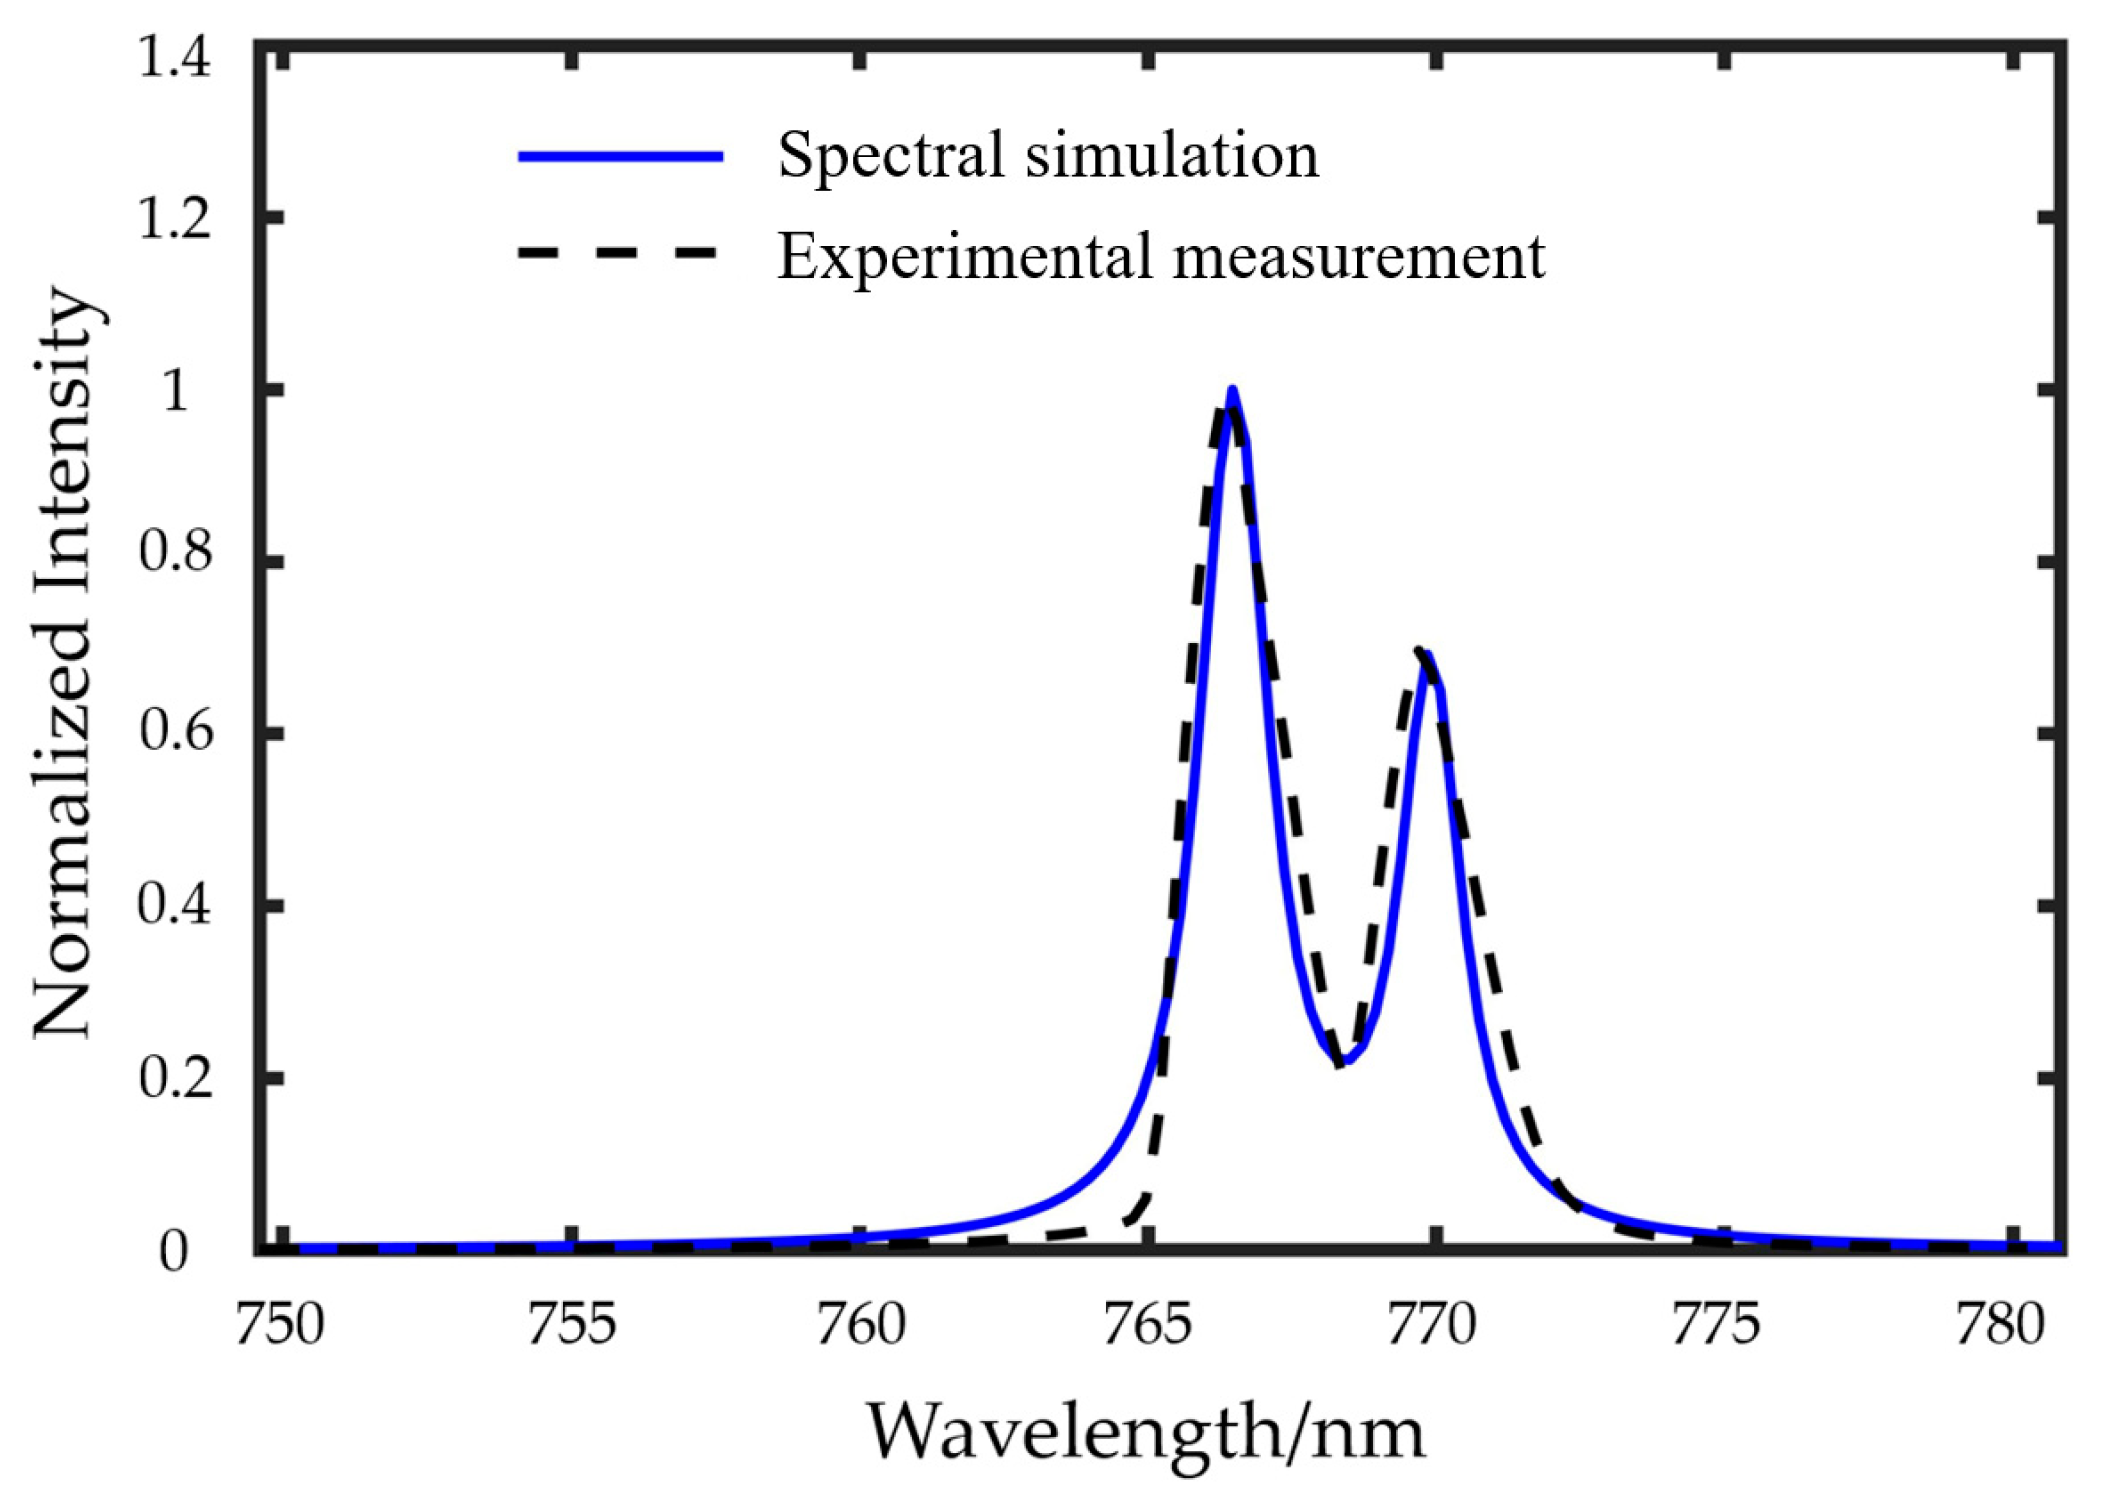
Table 5) across different solution injection rates, attributable to evaporative cooling effects, with the maximum observed temperature depression representing 0.3% of the mean flame temperature (1320 ± 15 K). Given that such minor thermal fluctuations induce <1% variation in atomic emission intensities (confirmed via NIST spectral simulations), all concentration inversions were performed using the line-of-sight averaged temperature of 1320 K.
The experiments comprised 32 test cases (4 atomization gas flow rates × 8 metal salt solution concentrations), with Figure 6 displaying the normalized peak intensities of the corresponding atomic emission spectra, revealing two key observations: (1) within each flow rate group, the spectral intensity exhibited a direct monotonic relationship with the solution concentration, and (2) at fixed concentrations, the relative spectral intensities across groups followed D > C > B > A, precisely correlating with the atomization gas flow rates due to increased metal vapor delivery efficiency. Concentration inversion accuracy was quantified through relative error between measured and predicted values (Table 6, Table 7, Table 8 and Table 9), demonstrating that the method achieves a mean absolute percentage error of 3.21% across all test conditions, with 84.4% of predictions falling within 5% of reference values. Error sources were systematically categorized as: (i) instrumental uncertainties (±2.1% from spectrometer calibration drift), and (ii) operational variabilities including liquid feed line occlusions, nebulizer efficiency degradation (15% reduction after prolonged use), and ambient background interference (accounting for 0.5–1.8% intensity variation).
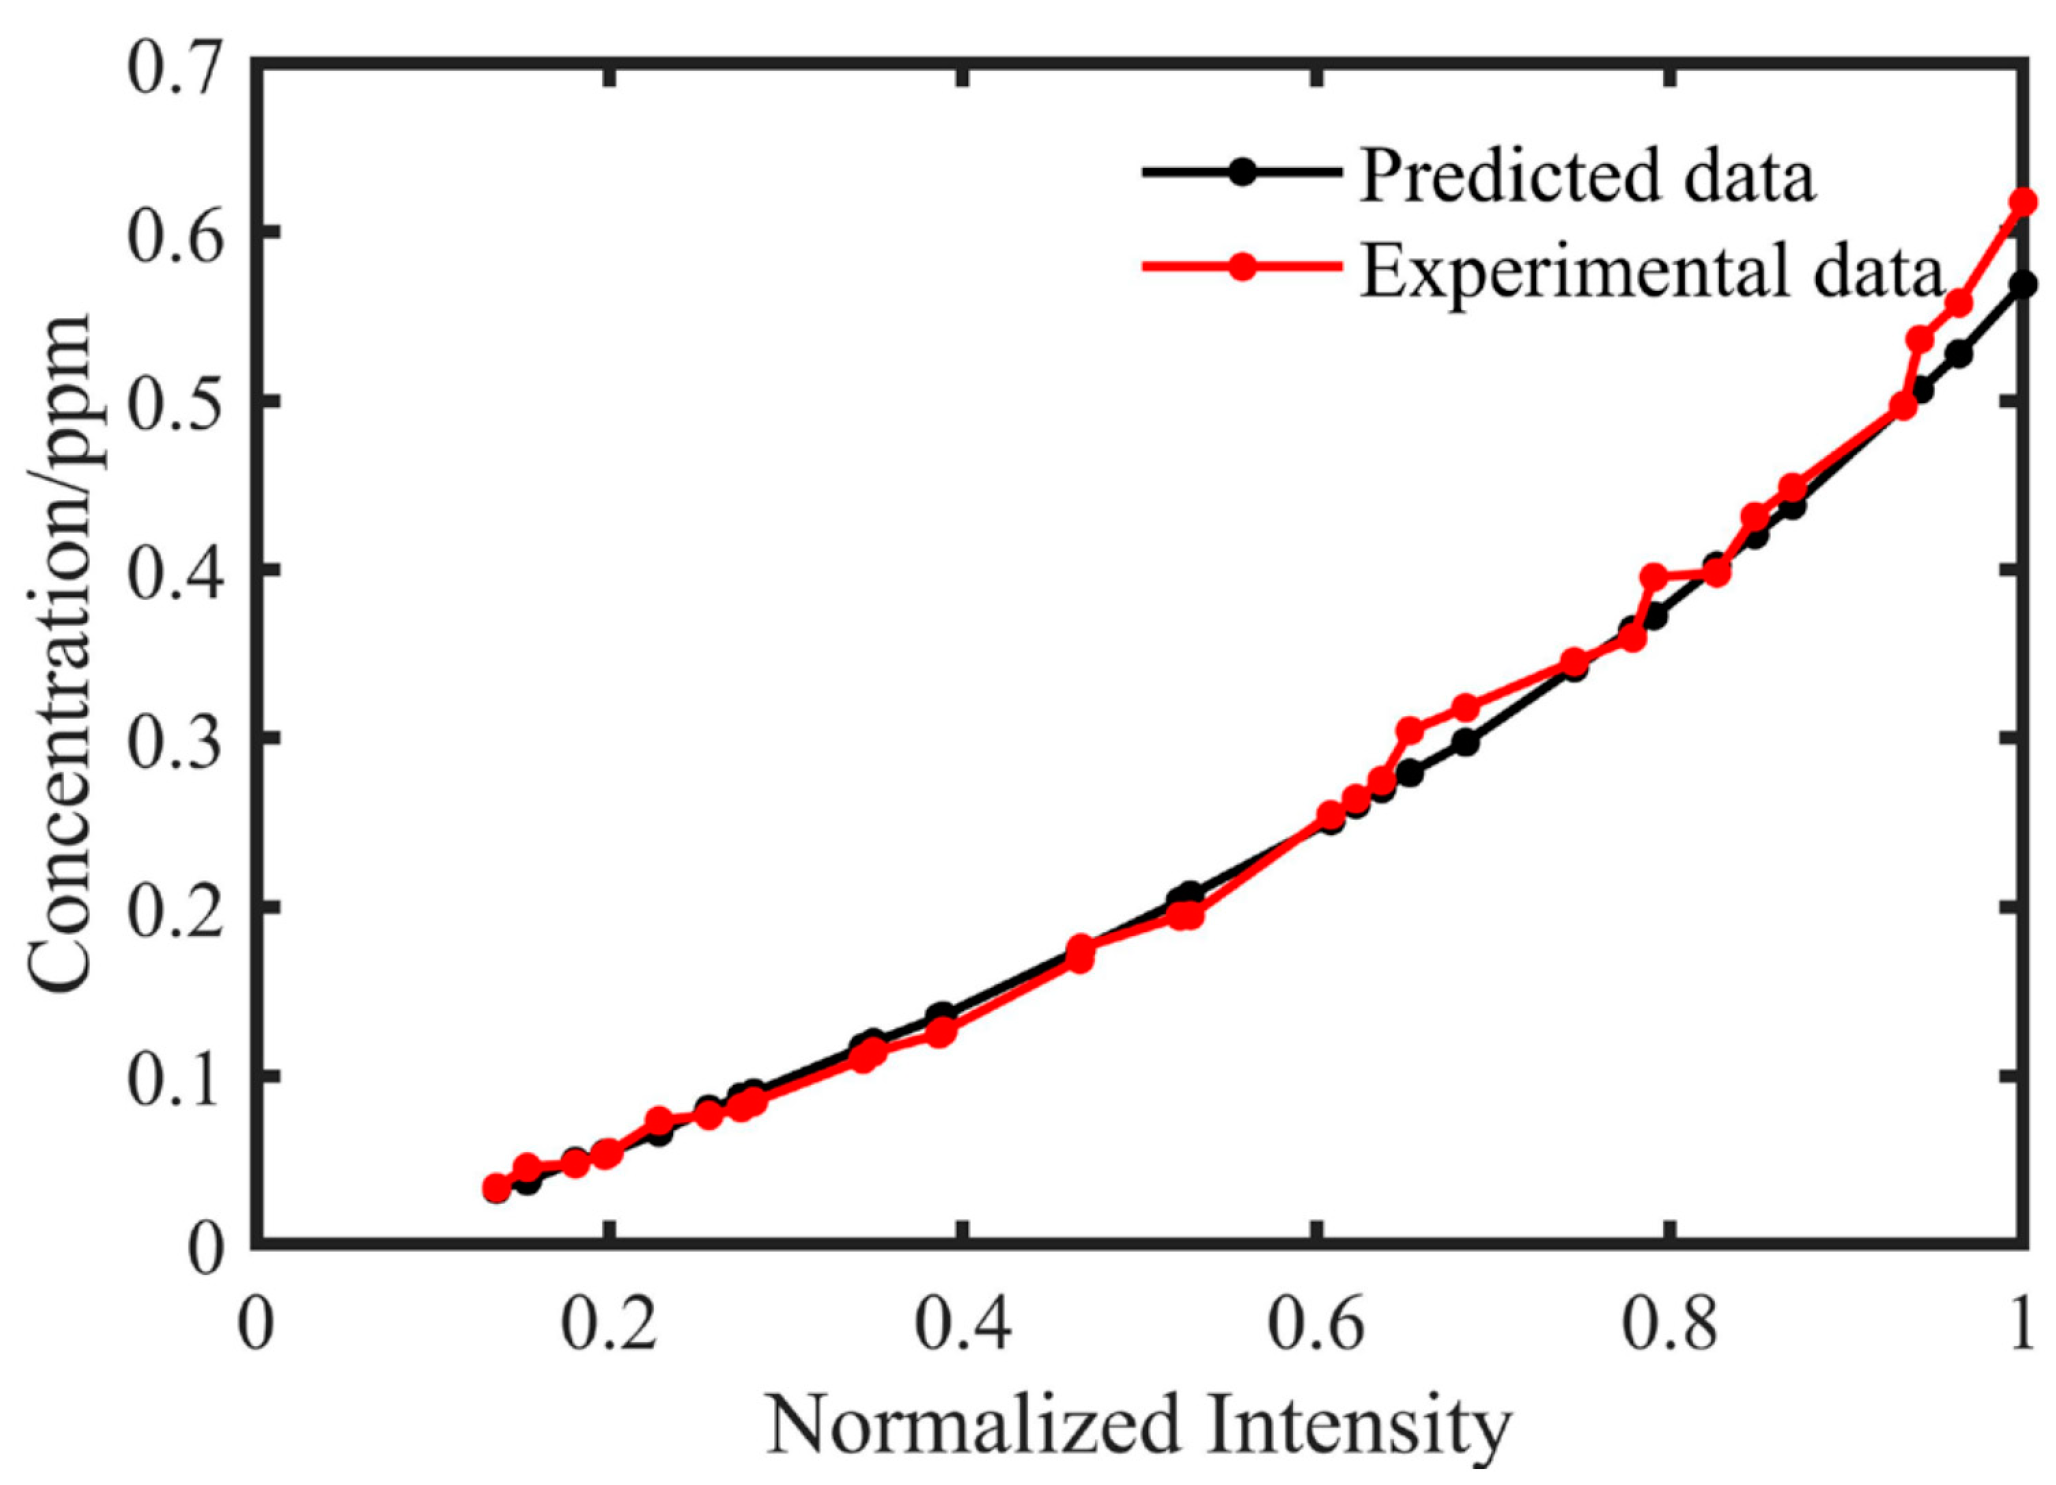
Figure 7 demonstrates the intensity–concentration correlation, validating the method’s ability to accurately determine elemental concentrations in doped flames despite significant self-absorption effects. The nonlinear relationship clearly shows that: (1) within the tested concentration range, the spectral intensities deviate from linear proportionality, indicating complete breakdown of traditional emission spectroscopy methods due to severe self-absorption, yet our neural-network-based approach maintains 94.3% prediction accuracy; and (2) the characteristic saturation trend aligns perfectly with radiative transfer theory—while intensity monotonically increases with concentration, its growth rate decreases. As can be seen, the concentration of metallic components can be determined without presupposing initial values, where prediction accuracy is primarily governed by the optical absorption effects analyzed in this study. The specific metal species do not significantly influence prediction accuracy if appropriate spectral lines are selected. The results demonstrate the technical feasibility of real-time, plume-spectroscopy-based engine health monitoring.

5. Conclusions

This study addresses a critical problem in liquid-propellant rocket engine plume-spectroscopy-based health monitoring: accurate metallic element concentration inversion from spectral intensity measurements. We developed an inversion method centered on a genetically optimized neural network architecture. Through a combination of simulations and experiments, the following conclusions can be drawn:
  • This study develops a metallic element concentration assessment approach for flame environments, utilizing a methane-premixed jet flame as the excitation source and a potassium carbonate (K2CO3) solution as the doping medium. The proposed approach establishes a quantitative conversion framework between solution concentration and thermofluidic environmental concentration.
  • This study develops a genetic-algorithm-optimized BP neural network approach incorporating a photon transmission factor to bridge spectral simulations and experimental measurements, significantly enhancing training dataset generation efficiency.
  • The proposed concentration inversion method was rigorously evaluated through 32 experimental test cases covering various atomization flow rates and metallic element concentrations. These results confirm that the proposed method not only achieves high inversion accuracy but also remains effective under strong self-absorption conditions.
These results demonstrate the technical feasibility of real-time, plume-spectroscopy-based engine health monitoring. Future work includes the investigation of the quantitative relationship between metallic concentrations in the plume and specific rocket engine fault modes or health states (e.g., turbine erosion, combustion chamber degradation, or nozzle wear).

Author Contributions

Conceptualization, Q.L.; formal analysis, S.T. and S.Y.; investigation, T.S.; data curation, X.L.; writing—original draft preparation, S.T.; writing—review and editing, Q.L.; supervision, W.F.; All authors have read and agreed to the published version of the manuscript.

Funding

This research received no external funding.

Data Availability Statement

The original contributions presented in this study are included in the article. Further inquiries can be directed to the corresponding author.

Conflicts of Interest

The authors declare no conflicts of interest.

References

  1. Li, J.; Chen, Y.; Li, J.; Bai, L. Investigation on the Ultraviolet Spectral Radiation Characteristics of Two-Phase Flow Plume Based on OH and Alumina Particles. Opt. Express 2023, 31, 32227. [Google Scholar] [CrossRef] [PubMed]
  2. Zhu, T.; Sun, Y.; Niu, Q.; He, Z.; Dong, S. Research on Flow and Radiation Similar Characteristics of Rocket Exhaust Plumes in Continuous-Flow Regime. Int. J. Heat Mass Transf. 2024, 229, 125663. [Google Scholar] [CrossRef]
  3. Kore, R.; Vashishtha, A. Combustion Behaviour of ADN-Based Green Solid Propellant with Metal Additives: A Comprehensive Review and Discussion. Aerospace 2025, 12, 46. [Google Scholar] [CrossRef]
  4. Toscano, A.M.; De Giorgi, M.G. Study of the Effect of Particles on the Two-Phase Flow Field and Radiation in Aluminized Rocket Engine Plumes; EUCASS: Rome, Italy, 2022; 15p. [Google Scholar] [CrossRef]
  5. Whitmore, S.A.; Frischkorn, C.I.; Petersen, S.J. In-Situ Optical Measurements of Solid and Hybrid-Propellant Combustion Plumes. Aerospace 2022, 9, 57. [Google Scholar] [CrossRef]
  6. Hawman, M. Health Monitoring System for the SSME—Program Overview. In Proceedings of the 26th Joint Propulsion Conference, Orlando, FL, USA, 16 July 1990; American Institute of Aeronautics and Astronautics: Reston, VA, USA, 1990. [Google Scholar]
  7. Tejwani, G.; Bircher, F.; Van Dyke, D.; Thurman, C.; Tejwani, G.; Bircher, F.; Van Dyke, D.; Thurman, C. SSME Health Monitoring at SSC with Exhaust Plume Emission Spectroscopy. In Proceedings of the 33rd Joint Propulsion Conference and Exhibit, Seattle, WA, USA, 6 July 1997; American Institute of Aeronautics and Astronautics: Reston, VA, USA, 1997. [Google Scholar]
  8. Srivastava, A.; Buntine, W. Predicting Engine Parameters Using the Optical Spectrum of the Space Shuttle Main Engine Exhaust Plume. In Proceedings of the 10th Computing in Aerospace Conference, San Antonio, TX, USA, 28 March 1995; American Institute of Aeronautics and Astronautics: Reston, VA, USA, 1995. [Google Scholar]
  9. Toscano, A.M.; Lato, M.R.; Fontanarosa, D.; De Giorgi, M.G. Optical Diagnostics for Solid Rocket Plumes Characterization: A Review. Energies 2022, 15, 1470. [Google Scholar] [CrossRef]
  10. Wallace, T.; Powers, W.; Cooper, A. Simulation of UV Atomic Radiation for Application in Exhaust Plume Spectrometry. In Proceedings of the 29th Joint Propulsion Conference and Exhibit, Monterey, CA, USA, 28 June 1993; American Institute of Aeronautics and Astronautics: Reston, VA, USA, 1993. [Google Scholar]
  11. Cikanek, H., III. Characteristics of Space Shuttle Main Engine Failures. In Proceedings of the 23rd Joint Propulsion Conference, San Diego, CA, USA, 29 June 1987; American Institute of Aeronautics and Astronautics: Reston, VA, USA, 1987. [Google Scholar]
  12. Cikanek, H., III.; Powers, W.; Eskridge, R.; Phillips, W.; Sherrell, F. Space Shuttle Main Engine Plume Spectral Monitoring Preliminary Results. In Proceedings of the 23rd Joint Propulsion Conference, San Diego, CA, USA, 29 June 1987; American Institute of Aeronautics and Astronautics: Reston, VA, USA, 1987. [Google Scholar]
  13. Tejwani, G.; Van Dyke, D.; Bircher, F. Approach to SSME Health Monitoring. III—Exhaust Plume Emission Spectroscopy: Recent Results and Detailed Analysis. In Proceedings of the 29th Joint Propulsion Conference and Exhibit, Monterey, CA, USA, 28 June 1993; American Institute of Aeronautics and Astronautics: Reston, VA, USA, 1993. [Google Scholar]
  14. Gardner, D.G.; Tejwani, G.D.; Bircher, F.E.; Loboda, J.A.; Van Dyke, D.B.; Chenevert, D.J. Stennis Space Center’s Approach to Liquid Rocket Engine Health Monitoring Using Exhaust Plume Diagnostics; SAE International: Warrendale, PA, USA, 1991; p. 911192. [Google Scholar]
  15. Gardner, D.; Bircher, F.; Tejwani, G.; Van Dyke, D. A Plume Diagnostic Based Engine Diagnostic System for SSME. In Proceedings of the 26th Joint Propulsion Conference, Orlando, FL, USA, 16 July 1990; American Institute of Aeronautics and Astronautics: Reston, VA, USA, 1990. [Google Scholar]
  16. Powers, W.T.; Cooper, A.E.; Wallace, T.L. OPAD Status Report: Investigation of SSME Component Erosion; SAE International: Warrendale, PA, USA, 1992; p. 921030. [Google Scholar]
  17. Hudson, M.K.; Shanks, R.B.; Snider, D.H.; Lindquist, D.M.; Luchini, C.; Rooke, S. UV, Visible, and Infrared Spectral Emissions in Hybrid Rocket Plumes. Int. J. Turbo Jet Engines 1998, 15, 71–87. [Google Scholar] [CrossRef]
  18. Benzing, D.; Whitaker, K.; Hopkins, R.; Benzing, D.; Whitaker, K.; Hopkins, R. Experimental Verification of Neural Network-Based SSME Anomaly Detection. In Proceedings of the 33rd Joint Propulsion Conference and Exhibit, Seattle, WA, USA, 6 July 1997; American Institute of Aeronautics and Astronautics: Reston, VA, USA, 1997. [Google Scholar]
  19. Benzing, D.; Whitaker, K.; Moore, D.; Benzing, D.; Whitaker, K.; Moore, D. A Neural Network Approach to Anomaly Detection in Spectra. In Proceedings of the 35th Aerospace Sciences Meeting and Exhibit, Reno, NV, USA, 6 January 1997; American Institute of Aeronautics and Astronautics: Reston, VA, USA, 1997. [Google Scholar]
  20. Benzing, D.A.; Whitaker, K.W. Approach to Space Shuttle Main Engine Health Monitoring Using Plume Spectra. J. Spacecr. Rocket. 1998, 35, 830–836. [Google Scholar] [CrossRef]
  21. Su, T.; Lei, Q.; Fan, W. Numerical and experimental investigations of metal emission spectrum in liquid rocket engine plume. J. Propuls. Technol. 2024, 45, 110–118. [Google Scholar] [CrossRef]
  22. Rogers, T.T.; McClelland, J.L. Parallel Distributed Processing at 25: Further Explorations in the Microstructure of Cognition. Cogn. Sci. 2014, 38, 1024–1077. [Google Scholar] [CrossRef] [PubMed]
  23. Werbos, P.J. The Roots of Backpropagation: From Ordered Derivatives to Neural Networks and Political Forecasting. In Adaptive and Learning Systems for Signal Processing, Communications, and Control; Wiley: New York, NY, USA, 1994; ISBN 978-0-471-59897-8. [Google Scholar]
  24. Chen, M.J. An Improved BP Neural Network Algorithm and Its Application. Metall. Min. Ind. 2014, 543–547, 2120–2123. [Google Scholar] [CrossRef]
  25. He, G.; Huang, C.; Guo, L.; Sun, G.; Zhang, D. Identification and Adjustment of Guide Rail Geometric Errors Based on BP Neural Network. Meas. Sci. Rev. 2017, 17, 135–144. [Google Scholar] [CrossRef]
  26. Fuh, K.-H.; Wang, S.-B. Force Modeling and Forecasting in Creep Feed Grinding Using Improved Bp Neural Network. Int. J. Mach. Tools Manuf. 1997, 37, 1167–1178. [Google Scholar] [CrossRef]
  27. Ke, L.; Wenyan, G.; Xiaoliu, S.; Zhongfu, T. Research on the Forecast Model of Electricity Power Industry Loan Based on GA-BP Neural Network. Energy Procedia 2012, 14, 1918–1924. [Google Scholar] [CrossRef]
  28. Tian, L.; Noore, A. Short-Term Load Forecasting Using Optimized Neural Network with Genetic Algorithm. In Proceedings of the 2004 International Conference on Probabilistic Methods Applied to Power Systems, Ames, IA, USA, 12–16 September 2004; pp. 135–140. [Google Scholar]
Figure 1. Coupled emission and self-absorption processes.
Aerospace 12 00427 g001
Figure 2. General scheme of the hybrid GA-BP framework.
Aerospace 12 00427 g002
Figure 3. Schematic of the experimental setup.
Aerospace 12 00427 g003
Figure 4. Calibrated results between photon transmission factor and concentration.
Aerospace 12 00427 g004
Figure 5. Comparison between measured and simulated spectra.
Aerospace 12 00427 g005
Figure 6. Normalized spectral intensities for 32 sets of spectral data.
Aerospace 12 00427 g006
Figure 7. Relationship between measured/predicted spectral peak intensities and concentration.
Aerospace 12 00427 g007
Table 1. Results of a single hidden layer.
Number of Hidden Layer NeuronsRMSENumber of Hidden Layer NeuronsRMSE
40.189290.2266
50.2715100.1013
60.1259110.1895
70.1110120.1807
80.1571130.1767
Table 2. Results of a double hidden layer.
Number of Hidden Layer NeuronsRMSENumber of Hidden Layer NeuronsRMSE
660.031610100.0597
6100.01701070.0286
670.0767
Table 3. Results of msol calibration.
Casema2 (g/min)msol (g/min)
A4.10.0746
B5.60.1055
C6.10.1097
D6.80.1167
Table 4. Data from the calibration groups.
Casensol (g/L)nflame (ppm)I × 104 (a.u.)T (K)
A14.80.04584.08311324
A211.50.10974.26421324
A327.70.26434.41471324
A456.20.53634.17421324
Table 5. Operating conditions.
Casema2 (g/min)T (K)
A4.11334
B5.61324
C6.11316
D6.81302
Table 6. Inversion results and errors of Group A.
Casema2 (g/min)nsol (mg/L)nture (ppm)nPredicted (ppm)Error
A14.14.80.03380.03244.14%
A27.70.05420.05684.80%
A311.60.08090.08555.69%
A417.70.12460.12782.57%
A527.70.19490.20736.36%
A636.20.25470.25171.12%
A745.20.31810.30773.27%
A856.20.39550.37485.23%
Table 7. Inversion results and errors of Group B.
Casema2 (g/min)nsol (mg/L)nture (ppm)nPredicted (ppm)Error
B15.64.80.04580.04462.62%
B27.70.07350.07004.76%
B311.60.10970.11303.01%
B417.70.16890.17413.08%
B527.70.26430.26121.17%
B636.20.34540.34121.21%
B745.20.43130.42012.60%
B856.20.53630.51573.84%
Table 8. Inversion results and errors of Group C.
Casema2 (g/min)nsol (mg/L)nture (ppm)nPredicted (ppm)Error
C16.14.80.04770.04994.74%
C27.70.07650.07731.10%
C311.60.11420.11813.45%
C417.70.17580.17430.84%
C527.70.27510.27041.69%
C636.20.35940.37384.02%
C745.20.44880.43862.26%
C856.20.55790.52945.11%
Table 9. Inversion results and errors of Group D.
Casema2 (g/min)nsol (mg/L)nture (ppm)nPredicted (ppm)Error
D16.84.80.05280.05422.65%
D27.70.08460.08510.59%
D311.60.12640.13113.72%
D417.70.19460.20354.57%
D527.70.30450.29971.58%
D636.20.39790.40160.93%
D745.20.49680.48771.83%
D856.20.61770.56758.13%
Disclaimer/Publisher’s Note: The statements, opinions and data contained in all publications are solely those of the individual author(s) and contributor(s) and not of MDPI and/or the editor(s). MDPI and/or the editor(s) disclaim responsibility for any injury to people or property resulting from any ideas, methods, instructions or products referred to in the content.

