Abstract
This paper presents the development of a novel aerodynamic model tailored for the Bio-Inspired Rotating Empennage (BIRE), a non-traditional fixed-wing aircraft empennage inspired by avian flight. The BIRE replaces the conventional vertical stabilizer with an extra degree of freedom for the horizontal stabilizer, which is allowed to rotate about the body-fixed x axis. This empennage is similar to the tail of a bird, and allows control of both longitudinal and lateral moments. However, such a design introduces complex nonlinear longitudinal and lateral aerodynamic interactions, not typically accounted for in most fixed-wing aircraft aerodynamic models below stall. This work presents a nonlinear sinusoidal aerodynamic model that can be used for fixed-wing aircraft with this type of empennage. Although the aerodynamic model is constructed to accurately capture the degrees of freedom of this particular empennage design, similar methods could be used to develop other aerodynamic models for non-traditional control effectors. A large dataset of low-fidelity aerodynamic data was generated using a modern numerical lifting-line algorithm, and these data were fit to the nonlinear sinusoidal aerodynamic model. A method for fitting the data is demonstrated, and the results show that the nonlinear sinusoidal aerodynamic model can be fit to the data with an accuracy of less than 10% of the maximum deviation of the aerodynamic coefficients in root-mean-square error. The underlying physics of many of the longitudinal and lateral nonlinear sinusoidal aerodynamic properties of the aircraft are discussed in detail. The methodology presented here can be extended to other non-traditional control effectors, encouraging innovative approaches in aerodynamic modeling and aircraft design. In contrast, choosing to model control effectors using the traditional, linear approach can obscure key aerodynamic behaviors key for trim and control analyses. The study’s findings underscore the importance of developing adaptable aerodynamic models to support the advancement of next-generation aircraft designs and control systems.
1. Introduction
The landscape of next-generation aircraft is continually developing as novel aircraft designs incorporate innovative control systems. The aerodynamics of these unconventional configurations remain a critical factor in optimizing efficiency while balancing mission-specific constraints such as maneuverability, payload capacity, and structural considerations. To effectively characterize these designs, aerodynamic models must be capable of capturing complex flow phenomena across low-, mid-, and high-fidelity simulations [,].
In many scenarios, the aerodynamic model for a given aircraft is based upon the interpolation and surrogate modeling of a large aerodynamic database, which is produced by varying flight conditions and control actuations []. These models can be costly to generate in terms of time and computational power and are generally not well-suited for initial performance analysis or design-space exploration. For initial analysis efforts, there is a strong case for using simple methodologies to quickly identify promising designs. There are also benefits to modeling aerodynamic coefficients continuously in areas such as flight mechanics and control design, where the discontinuities that are present in an aerodynamic database can unduly influence trim or stabilization.
In addition to the complexity–time argument, many aerodynamic models focus on traditional control actuation methods [,,,,,,,,], while emerging technologies demand additional flexibility and adaptable modeling approaches. Unconventional control mechanisms have also been studied and modeled, such as those focused on bio-inspired aircraft design and analysis, to which this work is applied. The aerodynamic models for these methods have varied from experimental methods, such as wind tunnel and flight tests (including system identification) [,,,,,,,,], to numerical simulations such as lifting-line theory [,] or CFD [,,,,], or even analytical approaches []. These methods have primarily focused on modeling the aerodynamic forces and moments directly based upon the fitting of experimental or numerical data. These fittings often take the form of nonlinear models for the aerodynamic forces and moments, which aligns with the methodology that will be presented in this work.
Research into avian-inspired flight control has demonstrated the feasibility of achieving stability and maneuverability without conventional empennage control structures [,,,]. These insights motivate the need for new aerodynamic modeling frameworks that extend beyond classical approaches.
This paper introduces a novel aerodynamic modeling approach for a non-traditional control system: the Bio-Inspired Rotating Empennage (BIRE) [,,,,]. Inspired by the natural flight dynamics of birds, this system replaces a conventional vertical stabilizer with a rotating empennage, offering potential advantages in terms of control authority and drag reduction [,]. Unlike fixed or conventionally actuated surfaces, the BIRE introduces nonlinear aerodynamic interactions, which require a different approach to the modeling of its aerodynamics. The approach given in the work is applied specifically to the BIRE; however, the principles are extendable to other nonlinear, non-traditional aircraft control models.
The following sections will first introduce a traditional nonlinear aerodynamic model using sensitivity coefficients. This model will include nonlinear effects identified through analytical methods such as lifting line theory, but could theoretically be adapted for any type of sensitivity-based model. After outlining the nonlinear model, the unconventional control system of the BIRE is introduced and the novel modeling of this system is described. Finally, the model coefficients are calculated and discussed in some detail to motivate the strength of this novel form of aerodynamic modeling on this novel aircraft design.
2. A Traditional Nonlinear Aerodynamic Model
The aerodynamic forces and moments of a traditional aircraft are generally considered to be functions of the orientation of the aircraft with respect to the wind, given by
where u is the body-fixed x-axis velocity component and w is the body-fixed z-axis velocity, and
where v is the body-fixed y-axis velocity component and V is the velocity magnitude. The forces and moments are also modeled as functions of the body-fixed nondimensional rotation rates, which are given by
and
where p, q, and r are the body-fixed x-, y-, and z-axis rotation rates and and are the lateral and longitudinal reference rates, respectively. Finally, the control actuators of the aircraft have a substantial effect on the aerodynamic forces and moments. For a traditional aircraft, the common actuators are an elevator, , ailerons, , and a rudder . These parameters are shown graphically in Figure 1.
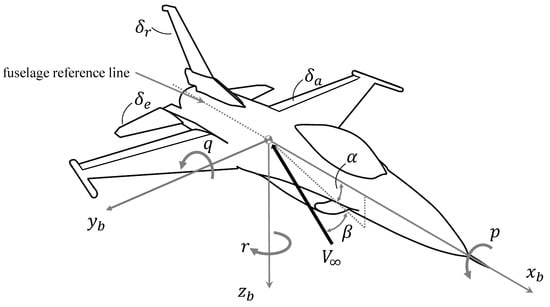
Figure 1.
The parameters used in an aerodynamic model for traditional aircraft.
Consider the aerodynamic forces and moments acting on an traditional aircraft flying directly into the wind () with zero body-fixed rotation rates () and control deflections (). The forces acting on the aircraft in this condition are the lift , side force , and drag . The moments in this condition are the pitching moment , rolling moment , and yawing moment . The nominal values for each of these forces and moments will be denoted with a subscript 0. Assuming that the disturbances from this condition are small, the relationship between the forces and moments and the aerodynamic modeling parameters can be modeled linearly. Applying the linearization about this point to the aerodynamic forces in the wind coordinate system gives
The aerodynamic moments in the body-fixed coordinate system are given as
Equations (6)–(11) constitute a linear aerodynamic model for the aerodynamic forces and moments.
The aerodynamic model given in Equations (6)–(11) is accurate only for small aerodynamic angles, nondimensional rotation rates, and control surface deflections; therefore, capturing relevant aerodynamics over a larger range of angles below stall requires that some additional, nonlinear relationships be included. The nature of these relationships can be understood by applying the results of analytical studies and familiarization with the aerodynamics of an aircraft. For simplicity in the following analysis, let the contribution of lift from the nominal condition of the aircraft and the angle of attack be given by
From lifting-line theory, it can be shown that the effects of rolling rate and aileron deflection on the yawing moment can each be approximated as a linear function of lift [,]. Hence, the influence of rolling rate on yawing moment given in Equation (11), can be approximated as . Likewise, the influence of aileron deflection on yawing moment, , can be approximated as . Additionally, an analytic approximation by Phillips [] shows that the change in rolling moment, with respect to yawing rate, depends in a linear fashion on the lift coefficient of the main wing. Thus, the influence of yawing rate on the rolling moment, , can be written as .
Additional nonlinear terms are aircraft-specific, and the motivation for their inclusion is based upon familiarity with wind tunnel data from the baseline aircraft model. These terms are given by Bolander et al. [], and the full nonlinear model of aerodynamic forces and moments is given by
and
as well as
and
In many cases, this aerodynamic model can be simplified, using assumptions such as symmetry and coefficients that are nearly zero.
3. Modeling Aerodynamics for a Non-Traditional Control System
The BIRE aircraft is shown in detail in Figure 2. The aerodynamic model used for the BIRE differs from that of traditional aircraft in several ways. Most significantly, the rotation of the empennage by the angle is an unconventional control mechanism, as it is not a flap deflection. If only small deflections for were needed, it could be treated as an additional first-order Taylor series term in the same way as the control surface deflections Equations (13)–(18). Since the empennage will be rotated to produce yaw control for the BIRE [,], it is expected that will be large in some cases where significant yawing moments are necessary. To account for large values of , the aerodynamic coefficients instead are allowed to vary with the empennage rotation angle .
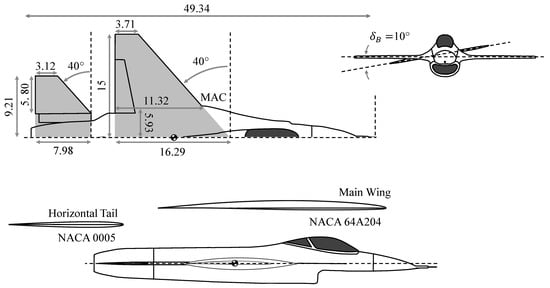
Figure 2.
A detailed geometric description of the BIRE aircraft.
Allowing each of the sensitivity coefficients to vary with the BIRE rotation angle produces an aerodynamic model of the form given in Equations (6)–(11) for each value of . Removing the dependence on the rudder and letting the hats over the coefficients represent each coefficient’s dependence on the BIRE rotation angle, the aerodynamic model in Equations (13)–(18) is rewritten as
and
with
Changes in the coefficients in Equations (19)–(24) due to changes in BIRE rotation angle can be reasonably assumed to be periodic of the form
In some cases, this function is not an exact fit for the aerodynamic coefficients observed numerically, but this model could be adapted to fit the trends observed in aerodynamic data easily. The exact value of these coefficients will be explored in further detail in the next section.
4. Evaluation and Discussion of Model Coefficients
The physical intuition used to develop the coefficient form in Equation (26), in part, is supported by aerodynamic data from MachUpX (https://aerolab.usu.edu/tools/aerodynamics (accessed on 7 May 2025)), an open-source numerical lifting-line tool, which is used to estimate the coefficients in the nonlinear aerodynamic model for both aircraft geometries.
MachUpX requires a planform model of the aircraft, whose component parameters are given by Bolander et al. [] and replicated in Table 1. Likewise, airfoil data can be estimated using thin airfoil theory [] and X-foil (https://web.mit.edu/drela/Public/web/xfoil/ (accessed on 7 May 2025)) [], as shown in Table 2. The nondimensional rotation rates, given in Equations (3)–(5), require that the reference lengths be specified. As is generally the case, these are given as the semispan of the main wing () for the lateral reference length and the mean aerodynamic chord () for the longitudinal reference length. These lengths are the same for both aircraft.

Table 1.
Geometric characteristics of the lifting surfaces on the BIRE aircraft. Reproduced from Bolander [] with permission.

Table 2.
Linear airfoil models for the NACA airfoils used in modeling the BIRE aircraft. Reproduced from Bolander [] with permission.
The sensitivity coefficients for both aircraft were evaluated by creating a database of aerodynamic coefficients using MachUpX. The aerodynamic database for both aircraft was constructed by evaluating the aerodynamic force and moment coefficients from MachUpX by running the cases in Table 3. This database is available in full in Bolander [].

Table 3.
Limits for each degree of freedom in the baseline fighter aircraft and BIRE aerodynamic database.
Estimating the sensitivity parameters for the baseline aircraft and at any given empennage rotation angle for the BIRE was accomplished using least-squares polynomial fits and centered difference approximations. For example, across a range of angles of attack, and are the intercept and slope of the line given with along the abscissa and the lift coefficient along the ordinate. The coefficients , , and , and can likewise be used to approximate the intercepts and slopes of their respective relationships. The terms of the drag polar in lift, , , and , and the terms of the drag polar in side force and , were estimated using a least-squares quadratic fit of the drag as a function of lift and side force, respectively.
Many of the component coefficients in the aerodynamic model are also a slight function of the angle of attack or sideslip angle. These changes are likely due to changes in downwash and sidewash. To better account for these slight changes, the results of the centered difference approximations were averaged across a series of angles of attack and sideslip angles.
For example, the coefficient changes slightly as a function of angle of attack due to the effects of downwash. From the database in Table 3, the values of for all angles of attack and stabilator deflections ( data points in total) were taken. Then, a centered difference for each angle of attack was calculated as
Taking the average of this set of 15 centered difference approximations gives a better approximation of the value of , which takes into account changes in downwash.
Coefficients in the nonlinear model that varied with lift (e.g., ) required a combination of the centered difference scheme and a least-squares linear fit. After performing the centered difference approximation across the range of angles of attack or sideslip angle, a linear least-squares polynomial fit was performed on the resulting derivatives. In our example above, is evaluated using centered differencing at each angle of attack. A line is then fit through the coefficients to find a y-intercept ( and slope () of the versus curve.
After the sensitivity coefficient at each BIRE rotation angle was calculated, the resultant data were fit to the form given in Equation (26) or left as a constant if the variance was deemed sufficiently small. The amplitude of the sine wave, A, its frequency, , the phase shift, , and the coefficient shift, , are each given for the aerodynamic force coefficients in Table 4 and for the aerodynamic moment coefficients in Table 5. Details on how the baseline aircraft coefficients were produced are included in Bolander [].

Table 4.
Fit parameters for the baseline aircraft and BIRE aerodynamic force coefficients.

Table 5.
Fit parameters for the baseline and BIRE aerodynamic moment coefficients.
The discussion here will be limited to the coefficients for lift, pitching moment, and yawing moment. An in-depth discussion of all coefficients can be found in Bolander []. Note also that the coefficient for the baseline (non-BIRE) aircraft is included for reference in each figure. The analysis of the baseline aircraft is given in Bolander [] and Bolander et al. [].
4.1. Modeling of the Lift Coefficient
The longitudinal lift coefficients are shown in Figure 3 with the root-mean-square error (RMSE) of the sinusoidal BIRE fit included in the caption for each figure. Note that each of these coefficients is an even function of the BIRE rotation angle. The coefficients and follow a trend that will be seen often in the rest of the coefficients; they reach a maximum when the rotating tail is horizontal and a minimum when . This trend explicitly shows the trade-off between longitudinal and lateral stability and control produced by rotating the horizontal tail. This is the first demonstration of the value of including nonlinear terms in the aerodynamic model. While one would inherently recognize the decrease in lift generation by the tail through terms such as and , these effects would be entirely neglected by traditional methods.
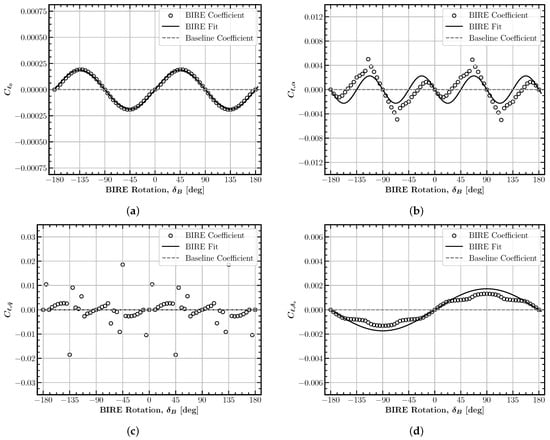
Figure 3.
Longitudinal BIRE lift coefficient fits: (a) (RMSE: 0.0006), (b) (RMSE: 0.0313), (c) (RMSE: 0.0313), (d) (RMSE: 0.0057).
The only coefficient with noticeable discrepancies between the fit and data (accompanied by higher RMS error) in this set of coefficients is . Higher-frequency terms could be added to better represent the pattern shown in . However, the RMSE is currently about 10% of the maximum deviation of this parameter, and is well within the range that could be accurately predicted by MachUpX.
The change in lift coefficient with elevator deflection represents another trend that is seen commonly with elevator sensitivities when rotating the horizontal tail. Note that reaches a maximum with a horizontal tail and a minimum when the tail is reversed at , crossing zero at approximately . The trends in the three longitudinal coefficients examined thus far are intuitive aerodynamically. However, shows a trend that may, at first, appear counter-intuitive, since one would assume that the lift should attain a maximum when the tail is oriented horizontally. The effects of downwash are key to understanding this trend, as the downwash from the horizontal tail will produce a negative lift coefficient on the horizontal tail that is gradually rotated out of the downwash region until only the lift from the main wing is considered. This understanding makes the trend in Figure 3a understandable and appropriate.
Inherent in each of the BIRE coefficient data points in Figure 3 is an error from fitting the original aerodynamic data. Figure 4 shows the RMS error for each of the BIRE sensitivity coefficients as a function of BIRE rotation angle. Note that the error for the coefficients and are shown under alone, since these fits were a linear fit of both coefficients together. The same will be true in later fits throughout this work that employ a linear approximation to estimate the coefficients.
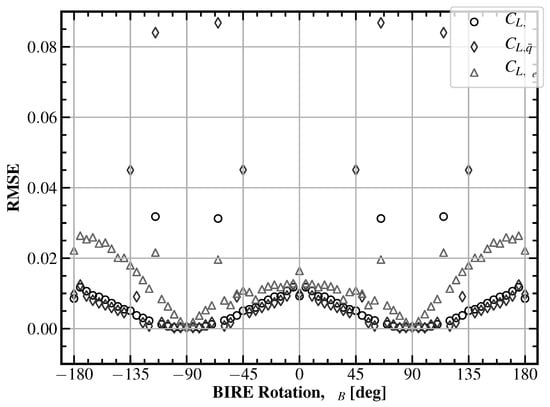
Figure 4.
The root-mean-square error for the longitudinal lift BIRE fit coefficients in Figure 3. The maximum error is shown: 0.0868.
Figure 5 shows the lateral BIRE lift coefficients (and fit RMSE), which are all odd functions of the BIRE rotation angle. The coefficients and all vary so little with tail rotation that they are considered constant at their average values. Thus, the RMS errors in these set of coefficients do not describe the goodness of fit, but rather the choice to neglect their effects of empennage rotation in the aerodynamic model. Coefficients and represent another common trend with the BIRE fits, achieving a maximum magnitude at and crossing zero when the tail is horizontal or vertical. This is logical, since these coefficients represent coupling between a longitudinal coefficient and a lateral aerodynamic parameter.
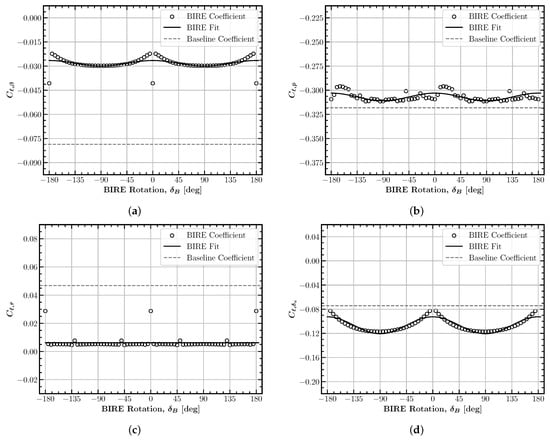
Figure 5.
Lateral BIRE lift coefficient fits: (a) (RMSE: 0.0063), (b) (RMSE: 0.0077), (c) (RMSE: 0.0192), (d) (RMSE: 0.0049).
For example, the coefficient does not influence the lift at , since changes in sideslip produce equivalent changes in lift, regardless of the direction. When the horizontal tail is rotated to the vertical position, the same is true; however, at , the sideslip angles produce a maximum change in the lift coefficient due to the change in lift developed by the tail at the positive and negative sideslip angles. The difference in sign between Figure 5a,c is simply a matter of the definition of positive and negative sideslip and yaw rotation rate.
The magnitude of the contributions of coefficients such as and to lift are not negligible. In fact, these represent approximately 17% of the contribution given by the angle of attack at their maxima. In this case, using linear methods to model these terms would result in large discrepancies, but only at BIRE rotation angles of . Thus, in many situations, a linear model would suffice for these particular coefficients; however, large values of BIRE rotation would be necessary for demanding trimmed flight.
Fit errors for the sensitivity coefficients in Figure 5 are shown in Figure 6. The maximum RMS error is found in the fit of the sensitivity coefficient at . Examining the coefficient value, we see that , and the fit error here is from a non-physical discontinuity from intersecting vortices of streamwise surfaces in MachUpX.
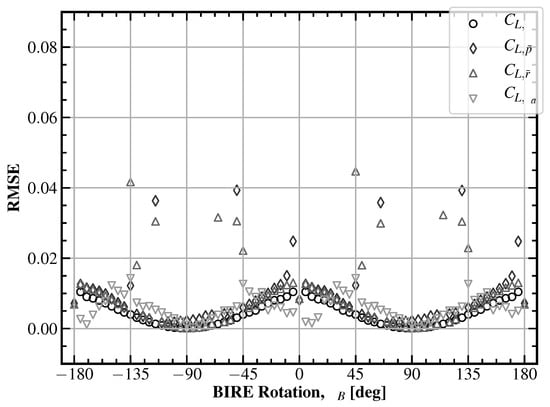
Figure 6.
The root-mean-square error for the lateral lift BIRE fit coefficients in Figure 5: 3.649.
4.2. Modeling of the Pitching Moment Coefficient
The pitching and yawing moments are perhaps the most important to the aircraft in terms of the effects of a rotating tail. Both are dominated by tail effects and play crucial roles in stability and control. Figure 7 shows the longitudinal components of the pitching moment coefficient and the RMS error of each BIRE fit. They are each even functions of the BIRE rotation angle, with only varying in its trends. The nominal pitching moment coefficient, represented by , attains a maximum when the tail is horizontal and a minimum when vertical. A positive nominal pitching moment is produced by the aircraft when the tail is horizontal due to the positive lift produced by the main wing forward of the center of gravity and the downwash on the tail producing a further positive moment. Rotating the horizontal tail out of the way removes its effect and lowers the nominal pitching moment accordingly. This allows the nominal pitching moment to even sink below that of the baseline aircraft, since the effects of downwash no longer push the pitching moment in the positive direction from that of the main wing.
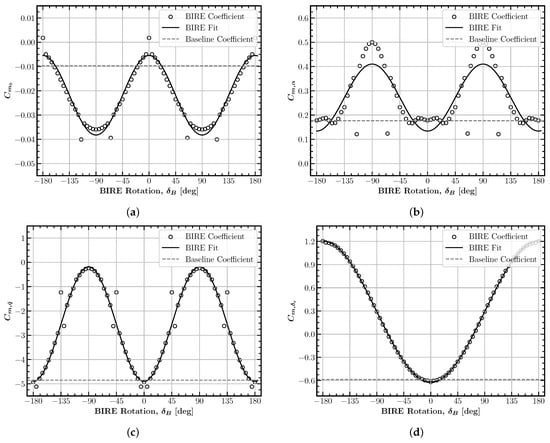
Figure 7.
Longitudinal BIRE pitching moment coefficient fits: (a) (RMSE: 0.0031), (b) (RMSE: 0.1128), (c) (RMSE: 0.3881), (d) (RMSE: 0.0134).
In contrast, the pitching moment slope, pitch damping derivative, and pitch control derivative each have a minimum when the tail is horizontal and increase to a maximum when vertical. In the case of , this results in an aircraft configuration at that is unstable in pitch () due to a lack of the contributions from a horizontal tail []. This cross-over point occurs at approximately , indicating that tail rotation could be an interesting way to adjust aircraft stability mid-flight. The interesting behavior of this coefficient near the horizontal position suggests that further research may be fruitful in uncovering additional understanding of the physics of a rotating tail. Recall also that produced the largest RMS error in its set of coefficients and could be improved by adding high-frequency terms to the sinusoidal model. The same case is given here in , though the RMS error is considerably higher in proportion to the deviation of coefficient value across empennage rotation.
Since the horizontal tail contributes primarily to pitch damping in an aircraft, rotating the tail causes large changes in the pitch damping derivative, as shown in Figure 7c. This illustrates another intuitive trade-off for the BIRE aircraft, which is that rotating the tail produces a decrease in the pitch damping of the aircraft, essential for favorable characteristics in the short-period and phugoid dynamic modes of the aircraft [,]. This also highlights the challenges inherent in modeling this type of control system using linear techniques, since the change in pitch damping becomes large very quickly.
The final longitudinal component of the pitching moment coefficient is the pitch control derivative, which follows a very intuitive pattern in its change with the BIRE rotation angle. The difference in its minimum value when compared to the baseline aircraft is likely due entirely to the lack of dihedral in the BIRE design. This allows the stabilators to be even more effective at generating a pitching moment through deflection. Passing through a vertical orientation causes the pitch control coefficient to become completely ineffective at generating a pitching moment in this linear model, which becomes a concerning trade-off in terms of control authority for the BIRE design.
The RMSE for the coefficients in Figure 7 are shown in Figure 8. These follow very similar trends to the longitudinal lift RMSE values in Figure 4 and do not have the same numerical disturbances noted in the lateral coefficient fits.
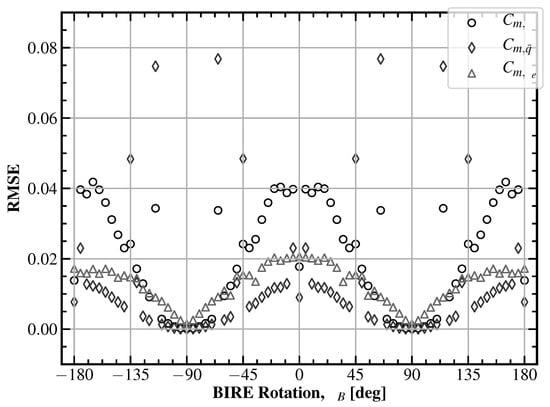
Figure 8.
The root-mean-square error for the longitudinal pitching moment BIRE fit coefficients in Figure 7. The maximum error is shown: 0.0768.
The lateral components of the pitching moment model shown in Figure 9 are each odd functions of the BIRE rotation angle. When rotated in the positive direction, the horizontal tail in sideslip will generate lift and side force in the negative direction, causing a nose-up pitching moment, as shown in Figure 9a. As with its lift equivalent, modeling as a linear contribution to the BIRE would substantially change the behavior of the aircraft past . Similarly oriented, the coefficient barely contributes to the overall pitching moment, as detailed in Bolander []. Its variation with the BIRE rotation angle is likely due to the effects of downwash from the main wing, since it is unclear how aileron deflections would affect the pitching moment otherwise. Though the overall effect on trim of these coefficients is low, there are interesting patterns in the fits that could be explored in future work to drive down the RMS error of each coefficient.
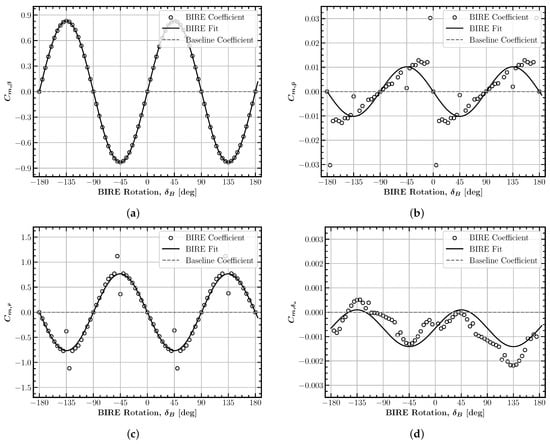
Figure 9.
Lateral BIRE pitching moment coefficient fits: (a) (RMSE: 0.0034), (b) (RMSE: 0.0043), (c) (RMSE: 0.1181), (d) (RMSE: 0.9181).
The sensitivity of the pitching moment to roll rate is shown in Figure 9b. The resulting fit shows an interesting coupling between changes in roll rate and the pitching moment. It is likely that the lowered tail semispan in rotation generates more lift (creating a nose-down pitching moment) due to the combined effects of downwash and a larger perceived angle of attack to the flow. This would explain the negative pitching moment generated by a positive roll rate with the tail at . When rotated vertically, the tail contributes nothing to the pitching moment, as noted in as well. The sensitivity of pitching moment to yawing rate follows the same pattern as that given by , with only a change in sign. This results from the definition of positive yaw rate and the movement of the flow, which is in the opposite direction to the flow incidence seen by the tail under conditions of sideslip.
Similar to the lateral lift coefficients, the pitching moment sensitivity coefficients shown in Figure 10 have localized numerical asymptotes near and . This is to be expected, as the pitching moment experienced by the aircraft is directly tied to the lift of each of its composite surfaces. In this configuration, the aircraft will certainly have its lateral pitching moment coefficients equal to zero; as such, these non-physical spikes can be ignored.
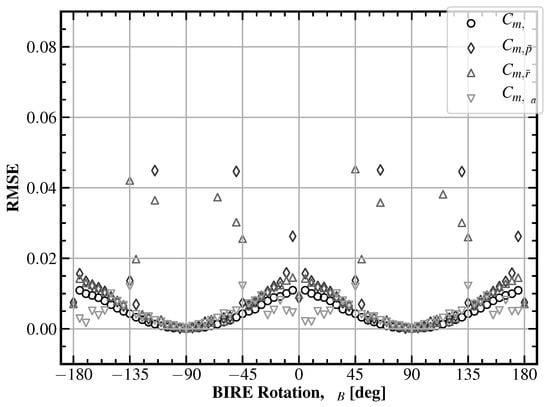
Figure 10.
The root-mean-square error for the lateral pitching moment BIRE fit coefficients in Figure 9. The maximum error is not shown: 3.7766.
4.3. Modeling of the Yawing Moment Coefficient
The final aerodynamic moment coefficient is the yawing moment, whose longitudinal components are shown in Figure 11. As expected at this stage of the analysis, these cross-coupled terms are odd functions of the BIRE rotation angle. Due to the similar effect exerted by the angle of attack and pitching rate, the terms and follow identical patterns and reach a minimum at . Yet again, this demonstrates a trade-off between longitudinal and lateral control offered by the BIRE rotation. When rotated through an angle of attack or experiencing a pitching rate, a positively rotated horizontal tail generates a positive side force behind the center of gravity, which, in turn, generates a negative yawing moment. The RMS error of each of the fits over the BIRE rotation angle is within reasonable bounds compared to maximum deviation of each coefficient. As a result, this model can be approved as capturing the effects of this control system well.
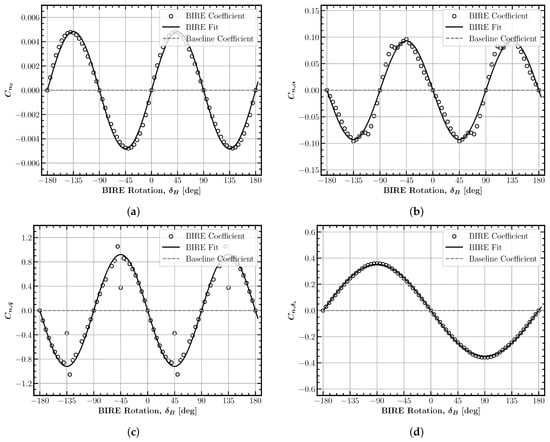
Figure 11.
Longitudinal BIRE yawing moment coefficient fits: (a) (RMSE: 0.0002), (b) (RMSE: 0.0109), (c) (RMSE: 0.2637), (d) (RMSE: 0.0036).
The nominal yawing moment, , can be assumed to vary with the BIRE rotation angle purely based on downwash and sidewash from the main wing. Thus, when rotated in the positive direction, the lowered right-half semispan of the tail would produce a negative side force, thus creating a positive yawing moment due to its position behind the center of gravity. Perhaps one of the most important control derivatives of the BIRE is , since it has effectively replaced rudder control in the BIRE design. Unsurprisingly, it has its maximum effect on the yawing moment when the tail is oriented vertically. Using the information in Table 5 and the baseline value for the yaw control derivative , the BIRE can achieve an equivalent control derivative with only 14 degrees of BIRE deflection. This provides a positive benchmark for the BIRE as a control concept, since one concern is the rate at which the BIRE would need to rotate to be able to control the aircraft in yaw.
The RMS error in Figure 12 for the longitudinal yawing moment BIRE sensitivity coefficients is noticeably lower than that given in Figure 4 and Figure 8. This is likely due to the yawing moment coefficients being much smaller than the lift or pitching moment coefficients. Nevertheless, this indicates that the individual data points in Figure 11 are accurate to the physics given by MachUpX for this aircraft.
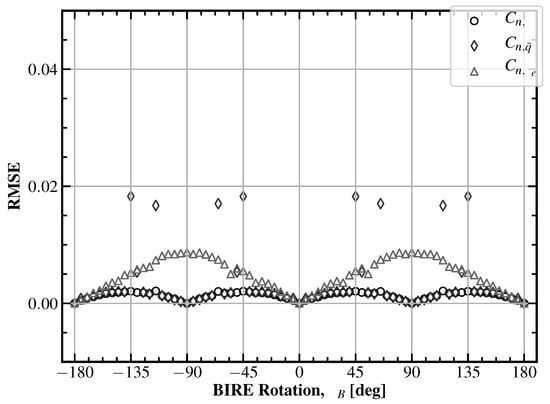
Figure 12.
The root-mean-square error for the longitudinal yawing moment BIRE fit coefficients in Figure 11. The maximum error is shown: 0.0183.
The lateral components of the yawing moment coefficient can be seen in Figure 13. The coefficients and are not modeled due to their low contribution to the total yawing moment, but are both nearly zero. is an important coefficient component, since it is generally used to describe the adverse yaw characteristics of an aircraft. Adverse yaw is generally an unfavorable characteristic for an aircraft. In this case, the BIRE produces even a small amount of proverse yaw and is not a significant function of the BIRE rotation angle. This is an assumption that will need to be verified with further testing, though the lack of a vertical tail may mitigate some of the adverse yaw.
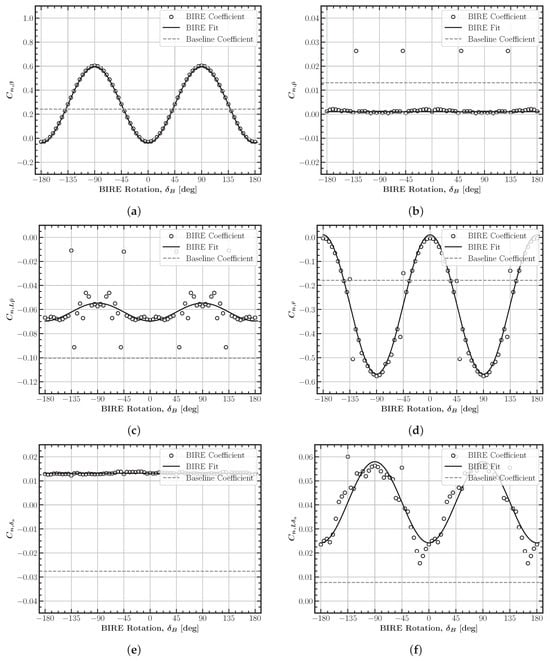
Figure 13.
Lateral BIRE yawing moment coefficient fits: (a) (RMSE: 0.0049), (b) (RMSE: 0.0057), (c) (RMSE: 0.0044), (d) (RMSE: 0.0382), (e) (RMSE: 0.0010), (f) (RMSE: 0.0134).
The yaw stability coefficient, unsurprisingly, increases from zero when horizontal to above the value of the baseline aircraft when vertical. Again, Table 5 shows that the BIRE rotation angle required to produce the same yaw stability present in the baseline aircraft is approximately []. Referring back to the pitch stability in Figure 7b, we see that this still represents an aircraft with “relaxed” longitudinal stability. Also, the pitch control derivative at this BIRE rotation angle is approximately on par with that given by the baseline aircraft according to Figure 7d. Again, this indicates that the BIRE should be able to maintain its yaw stability, pitch stability, and control in a similar manner to that of the baseline aircraft.
The nonlinear effect of lift and roll rate on the yawing moment is increased in magnitude slightly from the baseline aircraft with a horizontal tail. This is likely due to the fact that the horizontal tail generates more lift without the dihedral, which in turn is combined with roll rate to induce a negative yawing moment. When rotated vertically, the lift produced by the tail decreases, thus decreasing the magnitude of the coefficient . Also dependent on lift is the coefficient , which follows the same pattern as for similar reasons.
Each of these coefficients has high-frequency content that is not captured by the simple sinusoidal fit used in this model. Additionally, the RMS error is between 25% and 40% of the total deviation of each coefficient. Further study will be necessary to completely understand the aerodynamics here and how to model them precisely.
The yaw damping derivative, , is another important derivative of the dynamics of the aircraft as well as its control capabilities [,]. It is again insightful to calculate the BIRE rotation angle required to match the damping of the baseline aircraft. Using the values from Table 5, a BIRE rotation angle of approximately will give the BIRE an equivalent yaw damping derivative as the baseline aircraft []. These angles have not been prohibitive thus far, and could allow the BIRE to match exactly the damping and control derivatives achieved by the baseline aircraft when necessary with a reasonable actuation device.
As mentioned previously when discussing the fit of the lift slope and nominal lift coefficient ( and , respectively), the coefficients and are represented in Figure 14 as a single fit RMS error. This likewise applies to and . Any numerical instability present in these RMS values for fits can likely be attributed to the intersection of trailing vortices as well. The spikes in RMSE are for both and , which are the coefficients in which lift is being introduced as a sensitivity parameter through and . As the aircraft is provided a change in lift through the angle of attack, the rotation of the tail can easily cause the intersection of trailing vortices from the main wing with the lifting line of the tail section.
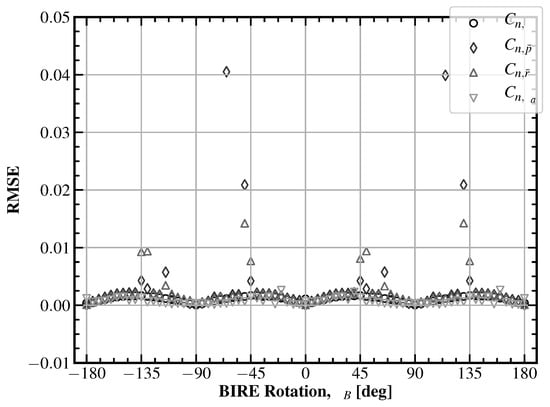
Figure 14.
The root-mean-square error for the lateral yawing moment BIRE fit coefficients in Figure 13. The maximum error is shown: 0.0405.
In conclusion, several consistent patterns can be found from examining Figure 3, Figure 4, Figure 5, Figure 6, Figure 7, Figure 8, Figure 9, Figure 10, Figure 11, Figure 12 and Figure 13. The first is that nearly all of the sensitivity coefficients dealing with the aerodynamic angles, rotation rates, and aileron deflection have the same frequency when measuring their variation with tail rotation, although there is a reason to include higher-frequency terms to model several coefficients more precisely. This is an interesting pattern that could provide insight into the underlying physics connecting each of the coefficients. Each of the nominal coefficients also shares this frequency of variation. In contrast, the variation frequency of all sensitivity coefficients in stabilator deflection is half of that given to the other coefficients. Modeling these coefficients in the traditional linear form would keep them constant at all BIRE rotation angles, which has clear consequences to the stability and control of the aircraft.
Second, coefficients representing cross-coupling (e.g., a longitudinal aerodynamic coefficient sensitivity with respect to a lateral parameter) are each modeled best, in terms of the form given in Equation (26), by un-shifted sine waves. This makes them odd functions of the BIRE rotation angle, usually passing through zero when the tail is horizontal. In addition to these observations, note that the coefficients that reach a maximum magnitude at are those that represent small trade-offs between longitudinal and lateral stability and control. Choosing not to model these coefficients to include their nonlinear effects has large impacts to the overall aerodynamics of the aircraft at BIRE rotation angles of . In contrast, those that reach a maximum magnitude when vertical or horizontal dominate the stability and control characteristics of the aircraft. Lastly, it will again be emphasized that there are several coefficients that are not represented exactly by a sine wave. There remains much work to be done in terms of understanding these patterns and the physical mechanisms which control their variation with tail rotation angle.
5. Conclusions
This paper introduced a novel aerodynamic modeling method applied to a novel, bio-inspired aircraft design. A traditional, sensitivity-based linear model was augmented with various nonlinear relationships based on aerodynamic theory in Section 2. While this particular model was developed for this study, any sensitivity-based model could be used and explored with the method of accounting for non-traditional control systems given in Section 3. This method includes treating each sensitivity coefficient in the aerodynamic model as a function of an independent variable: the control input. In the case of the bio-inspired aircraft design given here, the control input was empennage rotation, which introduces nonlinear trade-offs between longitudinal and lateral stability and control. Based upon this relationship, the form of the sensitivity coefficient function was effectively modeled as a sinusoid.
Values for the sensitivity coefficients were found using MachUpX, an open-source numerical lifting-line solver. Identifying the coefficients at each empennage rotation angle allows for the identification of a sinusoidal fit with parameters of amplitude, frequency, phase shift, and offset. These parameters were tabulated for all sensitivity coefficients for the aerodynamic forces and moments of the aircraft. Detailed discussions of the data and fit of each coefficient were included for the lift, pitching moment, and yawing moment coefficient sensitivities.
The results show that the BIRE aircraft aerodynamic coefficients were well-approximated by allowing the sensitivity coefficients to vary sinusoidally with the BIRE rotation angle. The RMS error of most of the fits were within about 10% of the maximum deviation of the coefficient from its nominal value. For those coefficients with a more substantial fit error, the majority could be better fit by including higher-order frequency terms to the sinusoidal model.
It was also shown that there are substantial benefits to using the BIRE control system from an aerodynamic perspective, such as the presence of proverse yaw and greater yaw control authority. These benefits are joined by trade-offs, such as the reduction in pitch control when higher yawing moments are required and vice-versa. Applying this methodology to other non-traditional control systems, especially at the preliminary design phase, can encourage and enable novel approaches to the future of aircraft design. However, choosing to model this kind of control effector in the traditional way, with constant sensitivity terms, has large impacts on the level of stability and control predicted for these types of aircraft. This work demonstrates that such simplifications can obscure essential aerodynamic behavior, particularly for unconventional configurations where control input and aerodynamic response are inherently nonlinear.
Author Contributions
Conceptualization, C.R.B. and D.F.H.; methodology, C.R.B. and D.F.H.; software, C.R.B.; validation, C.R.B. and D.F.H.; formal analysis, C.R.B.; investigation, C.R.B.; resources, D.F.H.; data curation, C.R.B.; writing—original draft preparation, C.R.B.; writing—review and editing, C.R.B. and D.F.H.; visualization, C.R.B.; supervision, D.F.H.; project administration, D.F.H.; funding acquisition, D.F.H. All authors have read and agreed to the published version of the manuscript.
Funding
This work was funded by the Air Force Office of Scientific Research (AFOSR) Lab Task 20RQCOR028 with Dr. Les Lee as the program manager. This paper has been cleared for public release, Case Number: AFRL-2022-2204.
Data Availability Statement
The raw data supporting the conclusions of this article will be made available by the authors on request.
Conflicts of Interest
The authors declare no conflicts of interest.
Abbreviations
The following abbreviations are used in this manuscript:
| BIRE | Bio-Inspired Rotating Empennage; |
| DoD | Department of Defense; |
| DDR&E(R&T) | Directorate of Defense Research and Engineering for Research and Technology. |
References
- Bravo-Mosquera, P.D.; Catalano, F.M.; Zingg, D.W. Unconventional aircraft for civil aviation: A review of concepts and design methodologies. Prog. Aerosp. Sci. 2022, 131, 100813. [Google Scholar] [CrossRef]
- Simon, J.; Blake, W.; Multhopp, D. Control Concepts for a Vertical Tailless Fighter. In Proceedings of the Aircraft Design, Systems, and Operations Meeting, Monterey, CA, USA, 9–11 August 1993. [Google Scholar] [CrossRef]
- Alderete, T.S. Simulator Aero Model Implementation; NASA Ames Research Center: Moffett Field, CA, USA, 1995; Volume 21.
- Phillips, W.F. Mechanics of Flight, 2nd ed.; John Wiley & Sons, Inc.: Hoboken, NJ, USA, 2010. [Google Scholar]
- Duke, E.L.; Antoniewicz, R.F.; Krambeer, K.D. Derivation and Definition of a Linear Aircraft Model; Number 1207 in NASA Reference Publication; NASA: Washington, DC, USA, 1988; p. 101.
- Drela, M. Development of the D8 transport configuration. In Proceedings of the 29th AIAA Applied Aerodynamics Conference, Honolulu, HI, USA, 27–30 June 2011; p. 3970. [Google Scholar]
- Mueller, J.; Paluszek, M.; Zhao, Y. Development of an aerodynamic model and control law design for a high altitude airship. In Proceedings of the AIAA 3rd “Unmanned Unlimited” Technical Conference, Workshop and Exhibit, Chicago, IL, USA, 20–23 September 2004; p. 6479. [Google Scholar]
- Dean, J.; Morton, S.; McDaniel, D.; Clifton, J.; Bodkin, D. Aircraft stability and control characteristics determined by system identification of CFD simulations. In Proceedings of the AIAA Atmospheric Flight Mechanics Conference and Exhibit, Galveston, TX, USA, 27–31 January 2008; p. 6378. [Google Scholar]
- Morelli, E.A. Global nonlinear parametric modelling with application to F-16 aerodynamics. In Proceedings of the 1998 American Control Conference, ACC (IEEE Cat. No. 98CH36207), Philadelphia, PA, USA, 26–26 June 1998; Volume 2, pp. 997–1001. [Google Scholar]
- Sequeira, C.; Willis, D.; Peraire, J. Comparing aerodynamic models for numerical simulation of dynamics and control of aircraft. In Proceedings of the 44th AIAA Aerospace Sciences Meeting and Exhibit, Reno, Nevada, 9–12 January 2006; p. 1254. [Google Scholar]
- Stevens, B.L.; Lewis, F.L. Modeling the Aircraft. In Aircraft Control and Simulation: Dynamics, Control Design, and Autonomous Systems, 3rd ed.; John Wiley & Sons, Inc.: Hoboken, NJ, USA, 2015; Chapter 2; pp. 63–137. [Google Scholar]
- Nguyen, L.; Ogburn, M.; Gilbert, W.; Kibler, K.; Brown, P.; Deal, P. Simulator Study of Stall/Post-Stall Characteristics of a Fighter Airplane with Relaxed Longitudinal Static Stability; NASA TR-1538; NASA: Washington, DC, USA, 1979. [Google Scholar]
- Evans, M.R. Birds’ tails do act like delta wings but delta-wing theory does not always predict the forces they generate. Proc. R. Soc. Lond. Ser. B Biol. Sci. 2003, 270, 1379–1385. [Google Scholar] [CrossRef] [PubMed]
- Hummel, D. Aerodynamic investigations on tail effects in birds. Z. Flugwiss. Weltraumforsch. 1992, 16, 159–168. [Google Scholar]
- Gamble, L.L.; Inman, D.J. Bioinspired pitch control using a piezoelectric horizontal tail for rudderless UAVs. In Proceedings of the Bioinspiration, Biomimetics, and Bioreplication VIII, Denver, CO, USA, 5–7 March 2018; Lakhtakia, A., Ed.; SPIE: Bellingham, WA, USA, 2018; p. 2. [Google Scholar] [CrossRef]
- Han, J.S.; Kim, J.K.; Chang, J.W.; Han, J.H. An improved quasi-steady aerodynamic model for insect wings that considers movement of the center of pressure. Bioinspiration Biomim. 2015, 10, 046014. [Google Scholar] [CrossRef] [PubMed]
- Bhatti, M.Y.; Lee, S.G.; Han, J.H. Dynamic stability and flight control of biomimetic flapping-wing micro air vehicle. Aerospace 2021, 8, 362. [Google Scholar] [CrossRef]
- Shehata, H. Unsteady Aerodynamic/Hydrodynamic Analysis of Bio-Inspired Flapping Elements at Low Reynolds Number. Ph.D. Thesis, Virginia Tech, Blacksburg, VA, USA, 2020. [Google Scholar]
- Asaro, S.; Vos, R. Synthesis of the Aerodynamic Model of a Flying Wing Aircraft. In Proceedings of the AIAA Scitech 2025 Forum, Orlando, FL, USA, 6–10 January 2025; p. 0852. [Google Scholar]
- Hofmann, R.; Hosseini, S.; Holzapfel, F. Parameter Estimation of a Multi-Point Aerodynamic Model based on Flight Data. In Proceedings of the AIAA SCITECH 2025 Forum, Orlando, FL, USA, 6–10 January 2025; p. 2175. [Google Scholar]
- Løw-Hansen, B.; Hann, R.; Gryte, K.; Johansen, T.A.; Deiler, C. Modeling and identification of a small fixed-wing UAV using estimated aerodynamic angles. CEAS Aeronaut. J. 2025, 16, 501–523. [Google Scholar] [CrossRef]
- Hodson, J. Numerical Analysis and Spanwise Shape Optimization for Finite Wings of Arbitrary Aspect Ratio. Doctoral Dissertation, Utah State University, Logan, UT, USA, 2019. [Google Scholar] [CrossRef]
- Gamble, L.L.; Pankonien, A.M.; Inman, D.J. Stall Recovery of a Morphing Wing via Extended Nonlinear Lifting-Line Theory. AIAA J. 2017, 55, 2956–2963. [Google Scholar] [CrossRef]
- Gamble, L.L.; Moosavian, A.; Inman, D.J. Effects of Speed on Coupled Sweep and Camber in Morphing Wings. In Proceedings of the 55th AIAA Aerospace Sciences Meeting, Grapevine, TX, USA, 9–13 January 2017. [Google Scholar] [CrossRef]
- Ruiz, C.; Acosta, J.; Ollero, A. Aerodynamic reduced-order Volterra model of an ornithopter under high-amplitude flapping. Aerosp. Sci. Technol. 2022, 121, 107331. [Google Scholar] [CrossRef]
- Kim, J.K.; Han, J.S.; Lee, J.S.; Han, J.H. Hovering and forward flight of the hawkmoth Manduca sexta: Trim search and 6-DOF dynamic stability characterization. Bioinspiration Biomim. 2015, 10, 056012. [Google Scholar] [CrossRef] [PubMed]
- Biswal, S.; Mignolet, M.; Rodriguez, A.A. Modeling and control of flapping wing micro aerial vehicles. Bioinspiration Biomim. 2019, 14, 026004. [Google Scholar] [CrossRef] [PubMed]
- Hunsaker, D.F.; Montgomery, Z.S.; Joo, J.J. Adverse-Yaw Control During Roll for a Class of Optimal Lift Distributions. AIAA J. 2020, 58, 2909–2920. [Google Scholar] [CrossRef]
- Harvey, C.; Gamble, L.L.; Bolander, C.R.; Hunsaker, D.F.; Joo, J.J.; Inman, D.J. A review of avian-inspired morphing for UAV flight control. Prog. Aerosp. Sci. 2022, 132, 100825. [Google Scholar] [CrossRef]
- Bolander, C.R. Aerodynamic Implications of a Bio-Inspired Rotating Empennage Design for Control of a Fighter Aircraft. Ph.D. Thesis, Utah State University, Logan, UT, USA, 2023. [Google Scholar]
- Moulton, B.; Harris, M.; Hunsaker, D.F.; Joo, J. Evaluation of First-Order Actuator Dynamics and Linear Controller for a Bio-Inspired Rotating Empennage Fighter Aircraft. In Proceedings of the AIAA SciTech 2024 Forum, Orlando, FL, USA, 8–12 January 2024; p. 2649. [Google Scholar]
- Moulton, B.C.; Harris, M.W.; Hunsaker, D.F. Stabilizing a Bio-Inspired Rotating Empennage Fighter Aircraft in Multiple Trim Scenarios. J. Guid. Control. Dyn. 2025, 48, 3. [Google Scholar] [CrossRef]
- Ives, C.; Myszka, D.H.; Joo, J.; Bolander, C.R.; Hunsaker, D.F. Using a Topology Optimization Results Interpreter on the Frame of an Aircraft with a Bio-Inspired Rotating Empennage. In Proceedings of the AIAA AVIATION 2022 Forum, Chicago, IL, USA, 27 June–1 July 2022; p. 3373. [Google Scholar]
- Bolander, C.R.; Hunsaker, D.F.; Myszka, D.; Joo, J.J. Attainable Moment Set and Actuation Time of a Bio-Inspired Rotating Empennage. In Proceedings of the AIAA SCITECH 2022 Forum, San Diego, CA, USA, 3–7 January 2022; p. 1670. [Google Scholar]
- Phillips, W.F.; Alley, N.R.; Goodrich, W.D. Lifting-Line Analysis of Roll Control and Variable Twist. J. Aircr. 2004, 41, 1169–1176. [Google Scholar] [CrossRef]
- Phillips, W.F. Force and Moment Derivatives. In Mechanics of Flight, 2nd ed.; John Wiley & Sons, Inc.: Hoboken, NJ, USA, 2010; Chapter 7; pp. 768–788. [Google Scholar]
- Bolander, C.R.; Kohler, A.; Hunsaker, D.F.; Myszka, D.; Joo, J.J. Static Trim of a Bio-Inspired Rotating Empennage for a Fighter Aircraft. In Proceedings of the 2023 AIAA SciTech Forum. American Institute of Aeronautics and Astronautics, National Harbor, MD, USA, 23–27 January 2023. [Google Scholar]
- Phillips, W.F. Incompressible Flow over Airfoils. In Mechanics of Flight, 2nd ed.; John Wiley & Sons, Inc.: Hoboken, NJ, USA, 2010; Chapter 1; pp. 26–39. [Google Scholar]
- Drela, M. XFOIL: An Analysis and Design System for Low Reynolds Number Airfoils. In Proceedings of the Low Reynolds Number Aerodynamics, Notre Dame, IN, USA, 5–7 June 1989; Mueller, T.J., Ed.; Springer: Berlin/Heidelberg, Germany, 1989; pp. 1–12. [Google Scholar] [CrossRef]
- Phillips, W.F. Simplified Pitch Stability Analysis for a Wing-Tail Combination. In Mechanics of Flight, 2nd ed.; John Wiley & Sons, Inc.: Hoboken, NJ, USA, 2010; Chapter 4; pp. 384–400. [Google Scholar]
- Phillips, W.F. Short-Period Approximation. In Mechanics of Flight, 2nd ed.; John Wiley & Sons, Inc.: Hoboken, NJ, USA, 2010; Chapter 8; pp. 847–854. [Google Scholar]
- Phillips, W.F. Long-Period Approximation. In Mechanics of Flight, 2nd ed.; John Wiley & Sons, Inc.: Hoboken, NJ, USA, 2010; Chapter 8; pp. 854–871. [Google Scholar]
- Phillips, W.F. Spiral Approximation. In Mechanics of Flight, 2nd ed.; John Wiley & Sons, Inc.: Hoboken, NJ, USA, 2010; Chapter 9; pp. 897–905. [Google Scholar]
- Phillips, W.F. Dutch Roll Approximation. In Mechanics of Flight, 2nd ed.; John Wiley & Sons, Inc.: Hoboken, NJ, USA, 2010; Chapter 9; pp. 906–919. [Google Scholar]
Disclaimer/Publisher’s Note: The statements, opinions and data contained in all publications are solely those of the individual author(s) and contributor(s) and not of MDPI and/or the editor(s). MDPI and/or the editor(s) disclaim responsibility for any injury to people or property resulting from any ideas, methods, instructions or products referred to in the content. |
© 2025 by the authors. Licensee MDPI, Basel, Switzerland. This article is an open access article distributed under the terms and conditions of the Creative Commons Attribution (CC BY) license (https://creativecommons.org/licenses/by/4.0/).