Abstract
Efficient and adaptive mission planning for Earth Observation Satellites (EOSs) remains a challenging task due to the growing complexity of user demands, task constraints, and limited satellite resources. Traditional heuristic and metaheuristic approaches often struggle with scalability and adaptability in dynamic environments. To overcome these limitations, we introduce AEM-D3QN, a novel intelligent task scheduling framework that integrates Graph Neural Networks (GNNs) with an Adaptive Exploration Mechanism-enabled Double Dueling Deep Q-Network (D3QN). This framework constructs a Directed Acyclic Graph (DAG) atlas to represent task dependencies and constraints, leveraging GNNs to extract spatial–temporal task features. These features are then encoded into a reinforcement learning model that dynamically optimizes scheduling policies under multiple resource constraints. The adaptive exploration mechanism improves learning efficiency by balancing exploration and exploitation based on task urgency and satellite status. Extensive experiments conducted under both periodic and emergency planning scenarios demonstrate that AEM-D3QN outperforms state-of-the-art algorithms in scheduling efficiency, response time, and task completion rate. The proposed framework offers a scalable and robust solution for real-time satellite mission planning in complex and dynamic operational environments.
1. Introduction
Earth Observation Satellites (EOSs) are artificial satellites equipped with advanced sensors and instruments designed to monitor and collect data on the Earth’s surface from orbit [1]. With continuous advancements in space technology, EOSs have become the primary tool for Earth observation. By utilizing infrared, electronic, and other specialized payloads, these satellites provide high-resolution, high-precision imaging and monitoring across various domains, including forest fire detection, disaster response, urban planning, maritime surveillance, and counterterrorism efforts [2].
Mission planning for EOSs focuses on optimizing the allocation of limited satellite resources based on task priority, urgency, and importance. This involves selecting optimal observation times, angles, and sensor settings while ensuring adequate power supply and storage capacity. The goal is to maximize resource efficiency and effectively meet observation requirements [3]. The schematic representation of the Task–Satellite–Time Window–Constraint structure is shown in Figure 1. Consequently, research on mission planning that enhances user-centric resource allocation is of critical importance. Therefore, this paper aims to develop an intelligent and adaptive scheduling framework for EOSs that addresses the challenges of dynamic task demands, complex constraints, and resource limitations. Specifically, the objectives of this study are to (1) construct a DAG atlas to represent task dependencies, (2) employ GNNs to extract spatial–temporal features, and (3) integrate these features into a deep reinforcement learning (DRL) framework to optimize mission planning policies. The proposed method seeks to enhance scheduling efficiency, responsiveness, and resource utilization in dynamic operational environments.
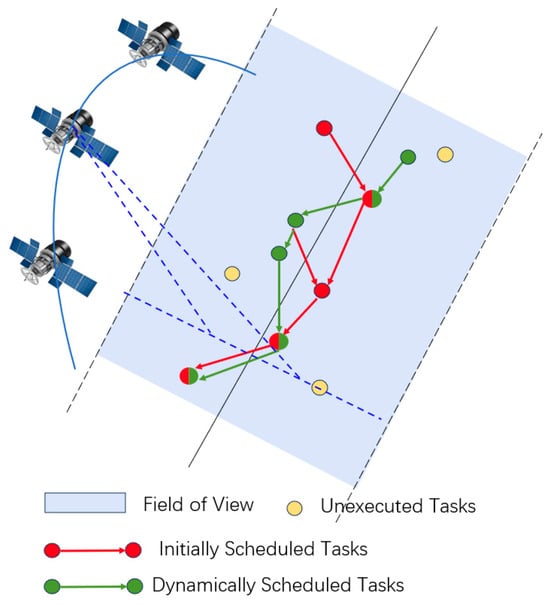
Figure 1.
Schematic representation of the Task–Satellite–Time Window–Constraint structure.
The rapid advancement of Earth observation technology brings both significant opportunities and substantial challenges [4]. These challenges include (1) a sharp increase in the number of users and the complexity of their demands; (2) the growing fleet of EOSs, which complicates orbital management and resource coordination, requiring more precise planning and optimization; (3) the expansion of satellite applications across diverse fields, each with distinct observation data needs; (4) the urgency of real-time tasks, such as moving target tracking, battlefield intelligence, and disaster response, which demand rapid and adaptive observation capabilities; and (5) the high computational complexity of mission planning, where rising user demand introduces numerous interdependent variables and constraints, exponentially increasing the problem scale. In the early stages of EOS applications, optimization techniques were commonly used to address mission planning challenges. Schiex et al. [5] employed exhaustive search techniques for small-scale observation tasks, while Pember et al. [6] developed an iterative approach to group task sequences before applying an exhaustive search for optimal scheduling. However, research indicates that such methods are only feasible for small-scale satellite scheduling. The presence of complex constraints and nonlinear optimization objectives significantly amplifies computational complexity [7]. As a combinatorial optimization problem, the solution space for satellite mission planning expands exponentially with the number of satellites and observation demands, as represented by Equation (1):
where represents the number of observation demands, while denotes the number of satellites. For example, with 10 Earth observation satellites and 30 observation demands, the solution space consists of possible scheduling schemes. This illustrates the immense challenges that traditional optimization methods encounter when tackling complex planning problems, as they may become trapped in local optima and fail to determine the globally optimal solution. To overcome this limitation, more advanced intelligent optimization algorithms are necessary. Intelligent optimization algorithms encompass heuristic and metaheuristic approaches, both of which exhibit strong global search capabilities and efficient optimization performance in mission planning. Li et al. [8] proposed a genetic algorithm based on ground station encoding, introducing a novel chromosome encoding scheme with single-point and multi-point crossover operators to address the satellite distance scheduling problem under priority constraints. Habet et al. [9] developed a tabu search algorithm that incorporates sampling configurations and combines systematic search with partial enumeration. To improve solution quality, their approach optimizes the sequence of strip acquisition and adjusts acquisition directions through exchange processing. Zheng [10] introduced an enhanced algorithm integrating ant colony optimization and genetic algorithms, significantly improving scheduling performance for agile satellite imaging tasks. Yuan et al. [11] proposed a genetic algorithm based on a hybrid stochastic heuristic strategy, focusing on the rapid generation of high-quality initial solutions. Their method employs four-generation strategies, analyzes the effects of operator parameter settings, and integrates a heuristic rule to determine the optimal satellite observation start time. Wang et al. [12] developed two intelligent optimization algorithms for EOS scheduling. The first algorithm iteratively inserts tasks in ascending order of priority by modifying the schedule through task insertion and deletion. The second algorithm employs a four-step process: direct insertion, shift insertion, deletion insertion, and direct reinsertion for task scheduling. Xin et al. [13] introduced an adaptive pheromone update method and an improved ant colony optimization algorithm that enhances local pheromone updates, preventing stagnation in local optima and strengthening global search performance. Sangeetha V et al. [14] proposed an energy-efficient gain-based dynamic green ant colony optimization metaheuristic algorithm. Their approach reduces total energy consumption in path planning through a gain-function-based pheromone enhancement mechanism and employs an octree-based memory-efficient workspace representation. He [15] integrated an improved particle swarm optimization algorithm with an enhanced symbiotic organism search, formulating a novel hybrid optimization model.
In the EOS mission planning, intelligent optimization algorithms can efficiently handle routine scheduling tasks in specific scenarios. However, they face significant challenges when tackling more complex problems [16]. First, as the number of tasks, constraints, or satellites increases, the iterative nature of these algorithms makes it difficult to find feasible solutions within a reasonable time frame. Second, these algorithms often require extensive modifications tailored to specific scenarios, making model construction complex and limiting their adaptability to new problems. Changes in problem conditions or operational environments may necessitate algorithm redesign and retraining, leading to reduced flexibility and limited autonomous learning and optimization capabilities. Finally, these algorithms require multiple recompilations for each instance, consuming substantial computational resources and increasing the overall workload.
To overcome the high computational complexity and intricate constraints of the EOS mission planning, supervised learning techniques in artificial intelligence offer promising solutions. Peng et al. [17] developed a sequential decision model and introduced a deep learning-based planning method to address the SOOTP problem. Their approach features an encoding network based on long short-term memory (LSTM) for feature extraction and a classification network for decision-making.
In artificial intelligence algorithms, traditional supervised learning methods face certain limitations compared to reinforcement learning. Due to the uncertainty in task sequence lengths in the EOS mission planning, supervised learning struggles to generate labeled outputs for all possible scenarios, particularly in large-scale and dynamic environments. Reinforcement learning (RL) offers several advantages over supervised learning in training EOS decision-making models. Unlike supervised learning, which requires precise labeling, RL optimizes decision-making through a reward mechanism, allowing models to improve their performance via continuous trial and error. In practical applications, RL-based models consistently outperform those generated by supervised learning. Zhao et al. [18] introduced a neural combinatorial optimization and reinforcement learning approach to select a set of possible acquisitions and determine their optimal sequence. They further applied a deep deterministic policy gradient-based RL algorithm to schedule acquisition start times under time constraints, demonstrating its efficiency through experiments. Wei et al. [19] developed a reinforcement learning and parameter transfer-based approach (RLPT) to enhance the efficiency of non-iterative remote sensing satellite mission planning. RLPT decomposes the problem into multiple scalarized subproblems using a weighted sum method, formulating each as a Markov decision process. An encoder–decoder structured neural network, trained via deep RL, then generates high-quality schedules for each subproblem. Ma et al. [20] leveraged a reinforcement learning-trained graph pointer network to tackle mission planning challenges. Their hierarchical RL training approach enabled the model to learn hierarchical policies and optimize task sequences under constraints. Sun et al. [21] proposed a novel search evolution strategy, where their PL agent significantly outperformed expert-designed branching rules and state-of-the-art RL-based branching methods in terms of both speed and effectiveness. Experimental results confirmed the superior performance of their RL algorithm. Li et al. [22] integrated deep neural networks with deep reinforcement learning for mission planning, demonstrating that their approach surpassed various heuristic and local search methods. In a separate study, Li et al. [23] introduced a data-driven scheduling method that combines RL with polynomial-time heuristics. Their framework utilized historical observation request data and genetic algorithm-based optimization to develop an offline learning classification model for assigning scheduling priorities. Experiments validated the efficiency of this data-driven approach for remote sensing mission planning.
A Directed Acyclic Graph (DAG) atlas refers to a structured collection of multiple DAGs, each encoding observation task dependencies for different satellites. In this framework, nodes represent individual tasks or events, and directed edges indicate scheduling dependencies or temporal constraints [24]. This structure plays a crucial role in optimizing resource allocation and task coordination. Moreover, a DAG atlas enhances the flexibility and adaptability of mission planning. When the satellite mission environment changes, such as the dynamic addition or removal of tasks, the DAG atlas can be quickly reconstructed and updated to reflect new conditions, ensuring efficient scheduling and resource utilization.
Graph Neural Networks (GNNs) are deep learning models specifically designed to process graph-structured data and have been widely applied in domains such as transportation networks, biochemistry, and social networks. Compared to conventional neural network architectures such as Convolutional Neural Networks (CNNs) and Recurrent Neural Networks (RNNs), Graph Neural Networks (GNNs) are inherently better suited for modeling the complex and non-Euclidean structures present in satellite task scheduling. CNNs are primarily designed for grid-like structured data (e.g., images) and assume spatial locality and fixed-size neighborhoods, which are not applicable to irregular and dynamic task dependency graphs. RNNs, while effective for sequential data, are limited in capturing the multi-relational, non-sequential dependencies among tasks. In contrast, GNNs can naturally model arbitrary relationships and dependency structures between tasks, enabling more accurate extraction of spatial–temporal features critical for dynamic mission planning. A key strength of GNNs lies in node representation learning, which generates vector representations that encapsulate both the structural and semantic properties of a graph [25]. Graph convolution is an operation that aggregates and transforms feature information from a node’s neighbors within a graph structure. Unlike traditional convolutional neural networks, GNNs perform graph convolutional operations that update node feature representations by aggregating weighted information from neighboring nodes. This enables convolutional processing directly on graph structures, allowing information to propagate through weighted summation. As a result, each node can effectively incorporate information from its adjacent nodes, enhancing its contextual understanding within the graph. Existing algorithms struggle to handle the nonlinear relationships and complex constraints in satellite mission planning, resulting in low computational efficiency and challenges in meeting real-time requirements. Deep reinforcement learning (DRL)-based approaches also face limitations, such as poor model adaptability and difficulty in capturing the intricate interdependencies between tasks. To address the challenges posed by large-scale satellite task demands and long response times, this paper proposes an intelligent agent framework based on GNNs. Despite the promising results achieved by RL in satellite mission planning, existing RL-based approaches still face notable limitations. First, conventional RL models often struggle to capture complex inter-task dependencies, as they treat tasks as independent actions without explicitly modeling task relationships. Second, they exhibit limited adaptability in dynamic and large-scale environments due to the difficulty of generalizing across varied task structures. Third, standard RL methods may suffer from sample inefficiency and slow convergence when the state-action space becomes highly complex. These challenges motivate the integration of GNNs with DRL, where GNNs can effectively model task dependencies and structural information, enhancing the agent’s decision-making capability and learning efficiency. By integrating GNNs with DRL, the proposed method utilizes a DAG to construct a graph atlas that satisfies constraint conditions. The graph-structured data processing capabilities of GNNs enable effective identification of complex task relationships, while DRL allows the agent to interact with the environment and learn optimal mission planning strategies. This approach improves the efficiency of satellite mission scheduling and enhances resource utilization.
2. Satellite Mission Planning Framework Based on GNNs and Deep Reinforcement Learning
Each observation task is executed by a remote-sensing satellite within its designated visible time window. During the satellite mission planning phase, an initial observation plan is created at the start of scheduling. However, as the satellite operates, it continuously receives real-time observation requests for dynamic tasks. To optimize satellite resource utilization and enhance the efficiency of emergency task observations, this paper explores the problem of dynamic satellite mission planning. As illustrated in Figure 2, Tasks and can be observed by satellite during time windows and , respectively. Tasks and are also observable by satellite within the same time window ; but due to the satellite’s field-of-view limitations, they cannot be executed simultaneously. Moreover, under constraints such as limited onboard storage and energy capacity, the joint observation of a large number of static targets may exceed the satellite’s resource limits. Therefore, it is necessary to incorporate these constraints into the task scheduling model and solve the problem accordingly.
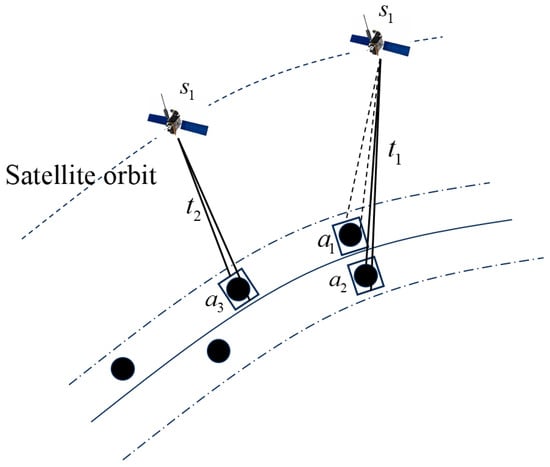
Figure 2.
The schematic diagram of task execution conflict.
2.1. Problem Definition
Imaging mission planning for Earth observation satellites is a highly complex process. It must account for traditional constraints such as energy availability, time window limitations, satellite storage capacity, payload restrictions, task priority levels, and satellite attitude maneuverability. Additionally, the planning process must optimize the overall effectiveness of the scheduling scheme to ensure the efficient utilization of satellite resources. An observation requirement is treated as an observation task, and the task set is defined as , where represents the sum of periodic planning subtasks and real-time planning subtasks. Each subtask . consists of six elements:
: The spatiotemporal grid where the observation subtask is located. Through the grid name, the required observation location and size can be determined.
: The unique identifier of the spatiotemporal grid subtask used for task identification and management in satellite mission planning. Under the spatiotemporal grid-based planning framework, a single satellite’s indivisible observation activity is assigned a unique task number.
: The priority of the spatiotemporal grid subtask, an attribute used to evaluate and differentiate the importance and urgency of various subtasks in satellite mission planning.
: The effective observation time window. and represent the earliest and latest valid observation times for the subtask, respectively. Each task must be completed within time window . ∈ []: Continuous variable representing the start time of task. ∈ ℝ: Continuous variable representing the end time of the task.
: The satellite identifier determines the visibility of each satellite concerning the subtask. The variable (discrete variable, where q is the number of satellites).
: The effective roll angle range, where and represent the minimum and maximum roll angles required for the satellite , observes the subtask area. Each observation’s roll angle must be within range . The variable (continuous variable).
: The observation execution time for satellite , where and represent the start and end times of the satellite’s observation task execution.
: Cloud cover, elevation, and meteorological information, which are pre-stored in the corresponding spatiotemporal grid at regular intervals. These include elevation, cloud cover, temperature, pressure, humidity, wind speed, wind direction, and solar radiation for the target area. The meteorological conditions of the planned region can be accessed as needed.
During satellite operations, different satellites have varying parameters, leading to the definition of satellite types as :
: The satellite’s maximum energy storage capacity imposes a critical constraint on mission planning. The variable energy , which is a continuous variable representing energy consumed by a task. Each task’s power consumption must be maintained within a specified range to prevent excessive energy depletion. During scheduling, the energy required for each task must be estimated to ensure that the cumulative power consumption of all tasks does not exceed the satellite’s available energy reserves. Here, denotes the energy consumed per unit time while executing a task.
: The satellite’s maximum storage capacity serves as a key constraint in mission planning. The variable storage , which is a continuous variable representing storage consumed by the task. Each task’s storage requirement must be kept within a defined limit to avoid exceeding the available capacity. During scheduling, the storage needed for each task must be estimated to ensure that the total storage consumption remains within the satellite’s reserves. Here, represents the storage capacity consumed per unit time while executing a task.
: Satellite payload, referring to the sensor equipment used by imaging satellites for capturing images of ground targets. Common payloads include panchromatic, multispectral, infrared, and synthetic aperture radar (SAR).
: The minimum time interval between two consecutive tasks for a satellite. This ensures smooth mission execution, extends the lifespan of the satellite and its payload, and improves mission success rates and data quality.
: The synthesized strip from to for the subtasks of satellite .
: The solution space that consists of all Earth observation satellite imaging mission planning schemes that satisfy various constraints, such as energy constraints, time window constraints, satellite storage capacity constraints, payload constraints, and satellite attitude maneuverability constraints. Each mission planning scheme, represented by , includes decisions for all subtasks in the task set, specifying which subtasks will be executed, their execution order, execution time, corresponding satellite attitude, and the parameters of the satellite payload used.
2.2. Problem Assumptions
In practical applications, satellite operations are influenced by various factors, such as atmospheric drag and the Earth’s gravity field. To enhance the efficiency of mission planning algorithm research, the problem is simplified by focusing on the most significant constraints while disregarding secondary ones. Based on engineering considerations and real-world application scenarios, the following reasonable assumptions and simplifications are made:
- Only point targets are considered, with polygonal targets treated as multiple independent point targets.
- Each observation task is completed in a single imaging attempt.
- Each observation task is executed at most once, without considering multiple repetitions.
- Satellites are assumed to function normally during task execution.
- The data transmission process is not taken into account.
2.3. Modeling
This article establishes a mathematical model for real-time planning task scheduling problems, which is described as follows:
- Objective Function
The primary goal of Earth observation satellite mission planning is to maximize the total mission benefit while operating within the constraints of limited satellite resources. By optimizing resource allocation and task scheduling, the objective is to meet user observation demands as effectively as possible. The objective function serves as a key metric for evaluating the effectiveness of a given solution. In real-world applications, the problem is formulated as a single-objective optimization problem, where the objective function, denoted as F, represents the maximization of the total mission benefit. Since tasks have varying levels of urgency, they yield different reward values upon completion. The aim is to maximize the cumulative benefit obtained from all completed tasks—an approach commonly used in remote sensing satellite mission planning. In its basic form:
where (i.e., ) represents whether the subtask is scheduled for execution. Let be a binary decision variable. If the task constraints are met and satellite performs the observation, then, ; otherwise, if the observation task is abandoned, . represents the priority corresponding to task when executing task :
- Satellite Storage Capacity Constraint
The total storage space required for all scheduled tasks assigned to satellite must not exceed its available storage capacity, constraints (1):
- Satellite Energy Capacity Constraint
The total energy consumption for all scheduled tasks assigned to satellite must not exceed its available energy capacity, constraints (2):
- Each Target Can Be Observed Only Once
Binary variable representing the task is assigned to the satellite . When scheduling tasks, once task is assigned to satellite for execution, it cannot be reassigned to another satellite. That is, each task can only be executed by one satellite, constraints (3):
- Composite Task Angular Constraint
The composite task angular constraint refers to the restrictions on the satellite’s attitude angles when executing multiple interrelated tasks as a composite task. This constraint ensures that the satellite’s attitude adjustments comply with mission requirements when performing a sequence of interrelated tasks. denotes the at which the satellite performs its mission. denotes the at which the satellite performs its mission. denotes the roll angle when performing the task , constraints (4):
- Task Time Constraint
When satellite performs an imaging task, the actual start time plus the execution duration must be less than the actual task end time , constraints (5):
- Task Visibility Constraint
The execution time of task must fall within its feasible observation time window. The actual start and end times of satellite during mission planning must be within the task’s observable time window. represents the actual start of the mandate, represents the earliest possible start of the mandate, and represents the actual end of the mandate, constraints (6):
3. Deep Reinforcement Learning Algorithm Based on Graph Neural Network
This section presents a comprehensive overview of the task planning algorithm that integrates spatiotemporal grids with graph neural networks. It begins by outlining the overall framework of DRL, followed by the construction of the DAG set. Next, it details the network architecture and defines the state space. Finally, the model’s training and updating processes are explained.
3.1. Overall Framework
In the dynamic and complex landscape of Earth observation satellite task scheduling, Figure 3 illustrates the overall process of DRL-based satellite task planning using GNNs. The process begins with generating a set of subtasks through global spatiotemporal grids and task visibility analysis. A DAG set is then constructed to represent task node attributes, connections, and dependencies. Next, the network model structure is designed, incorporating a reinforcement learning framework to enable intelligent decision-making. An experience replay mechanism is integrated to enhance learning efficiency, and model performance is optimized through fine-tuned parameter adjustments. Ultimately, task feature vectors are processed through a model that includes fully connected layers, pooling layers, and graph convolution layers, forming an intelligent scheduling agent for satellite mission planning. This approach efficiently manages large-scale periodic tasks and enables the rapid generation of emergency task plans.
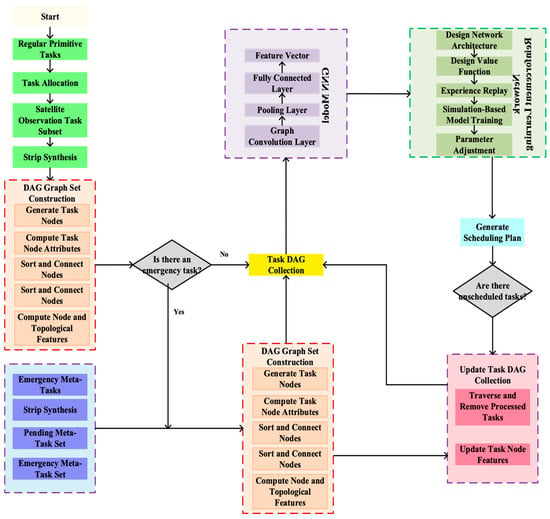
Figure 3.
Overall flowchart.
3.2. Strip Synthesis
The spatiotemporal grid facilitates task visibility retrieval by aggregating point target tasks into spatiotemporal grid tasks. For Earth observation satellites, the final executable task is a strip task, which represents a complete observation process, including satellite attitude adjustments and camera operations. By assigning different point target tasks to grids, point target tasks are transformed into grid tasks, while area target tasks are decomposed into multiple grid tasks. These grids can then be further aggregated to form strip tasks. Figure 4 illustrates how grid tasks are combined into strip tasks for satellite observation, optimizing satellite operations and improving observation efficiency. Among them, the red box represents the synthetic strip.
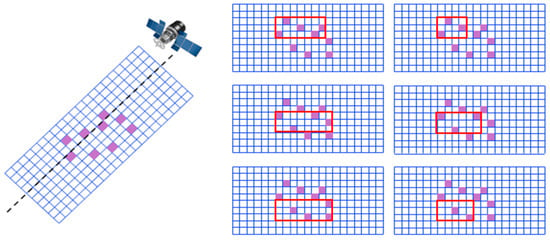
Figure 4.
Synthetic strip map.
The aggregation steps are as follows:
The process of aggregating grid tasks into strip tasks for satellite observation involves the following steps:
- First, sort all subtasks for each satellite in ascending order based on their earliest time window to generate the sequence , where represents the subtask of satellite (, m is the total number of satellites).
- Traverse each subtask in chronological order, setting as . Nest a loop through the remaining subtasks, setting as . Compare whether the time difference between the two subtasks is less than the maximum activation duration and whether their inclination angle ranges overlap. If the conditions are met, generate a strip with the two subtasks as the start and end points, indicating that satellite generates bands starting and ending at points and .
- Generate strip , where the start time of the composite strip’s visibility is time, the end time is time, and the composite strip’s effective inclination angle is the average of the two subtasks’ inclination angles, while the task priority is the sum of their priorities.
- Generate strip from subtask to (). Traverse all subtasks in between. If any subtask’s inclination angle intersects, it is included in the strip, and the strip task priority is increased. Repeat until all subtasks are processed.
- Set as and repeat Step (2) until becomes .
- Set as and repeat Step (2) until becomes .
- The satellite task sequence is transformed into ( represents the total number of satellites). Repeat Step (2) until all satellites are traversed, generating all observable task strips , where and .
3.3. Graph Structure Construction
Using the spatiotemporal grid as a foundation, a graph structure is constructed to model the satellite mission planning problem. Each Earth observation satellite is assigned its own DAG set, where observation tasks are represented as nodes. These tasks are arranged in chronological order, with directed edges indicating sequence dependencies and operational constraints. By organizing tasks based on their valid time windows, a DAG set is generated for each satellite, encompassing all feasible observation task plans. This structured representation effectively captures task relationships and constraints, enabling efficient processing using GNN and DRL for optimized mission planning.
The steps for constructing the DAG set in Figure 5 are as follows:
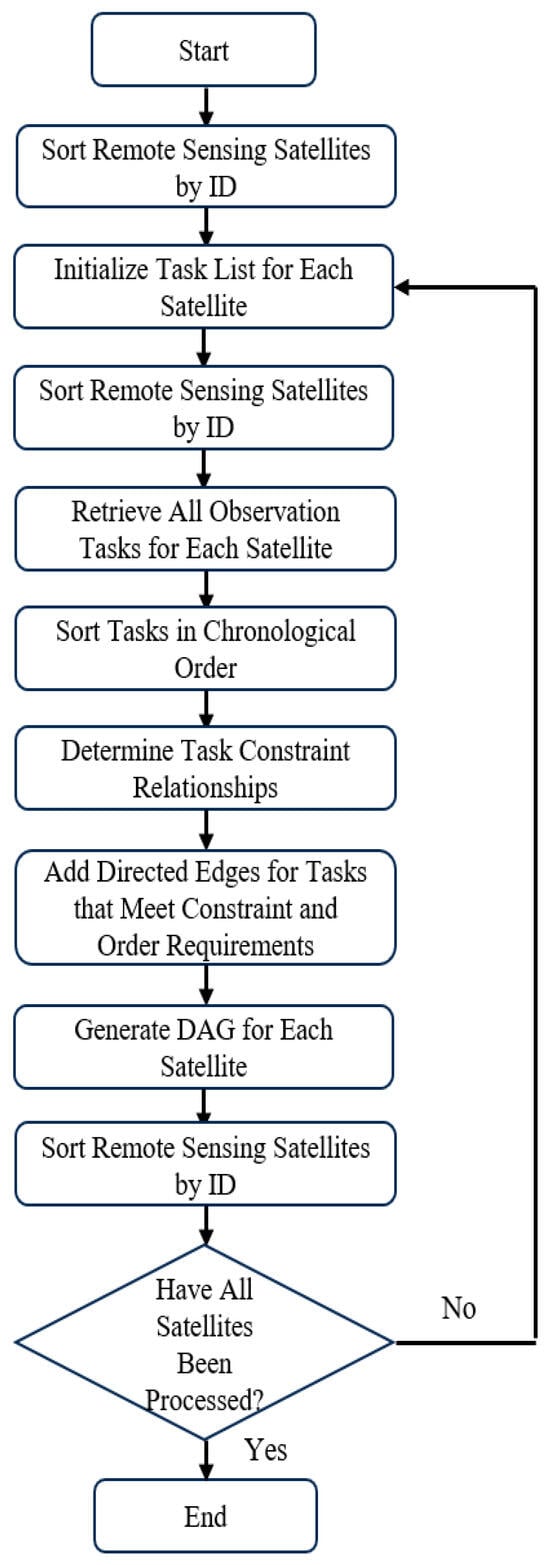
Figure 5.
DAG construction flowchart.
- Filter observable tasks based on each satellite’s visibility for each task. Establish a virtual node A as the starting point for the current time step. Arrange all tasks in chronological order and eliminate those that do not satisfy observation constraints through constraint verification. This approach reduces computational complexity, as shown in Figure 6.
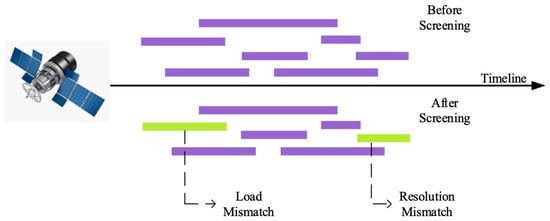 Figure 6. Strip selection construction.
 - Using the sorted sequence from the previous step, begin at the virtual node A and arrange all nodes according to the specified constraints. Identify valid child nodes and sort them chronologically. Since Tasks 1, 2, and 3 overlap in observation time, they cannot form a sequential observation sequence. In contrast, Tasks 4, 5, 6, and 7 exist as a continuous sequence and can be observed consecutively. Therefore, only Tasks 1, 2, and 3 qualify as child nodes of virtual node A, while Tasks 4, 5, 6, and 7 do not. Following this principle, child nodes for each node are identified and linked to construct all possible observation plans for each satellite. Figure 7 illustrates this node structure, which is further visualized in Figure 8. The purple boxes labeled with numbers are synthetic observation bands.
 Figure 7. Example of task connections in the DAG collection.
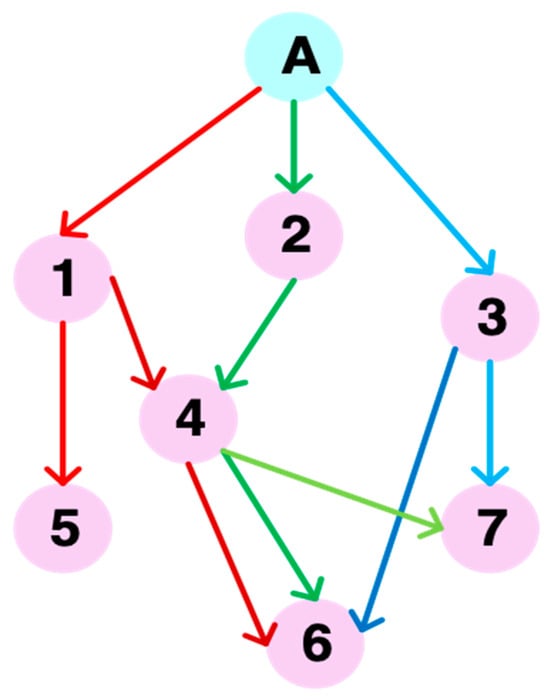 Figure 8. Task connection example.
The graph construction algorithm described in the previous section is designed for static scenarios, where the positions of satellites and targets are fixed at a specific time. Under such conditions, the algorithm can be used to construct an instantaneous DAG that models the scheduling environment. However, in real-world remote sensing satellite scheduling applications, the environment is continuously changing, and thus, the graph atlas must evolve into a dynamic time-varying structure.
There are two primary situations that trigger updates to the DAG atlas:
- (1)
- execution of an existing task;
- (2)
- arrival of new observation requests.
The following explains how the DAG is modified under these two scenarios:
- Task execution.
At the initial moment, all observation tasks are assigned to observable satellites according to visibility and constraints, resulting in a task graph for each satellite. A single task may appear in multiple satellites’ DAGs. Once a task is executed by one satellite, the corresponding task node must be removed from the DAGs of other satellites.
The removal process is as follows: First, the parent and child nodes of the executed task are identified. A parent node has an outgoing edge to the current task, indicating temporal precedence; a child node receives an edge from the current task, indicating it depends on the current task’s completion. For each parent node, the sibling nodes of the executed task are determined. Then, for each parent node, if a child node is shared by all sibling nodes, a new edge is created between that child node and the parent node to maintain graph consistency.
- Emergency task insertion.
When new emergency tasks arise, task nodes are generated based on visibility analysis and inserted into the DAGs of all observable satellites. The process is as follows: A new task node is created and added to the task graph. The algorithm then traverses its successor tasks and establishes edges following the static construction rules.
Next, its predecessor tasks are checked. If a predecessor’s child node set completely overlaps with the new task, a directed edge is added from the predecessor to the new task to establish precedence.
When multiple new tasks are introduced simultaneously, they are first sorted by task start time and then inserted into the corresponding DAGs in chronological order.
In the constructed DAG, nodes represent observation subtasks, each associated with a satellite–target–time triple. The edges represent precedence constraints, such as:
- (1)
- Temporal dependency: Task A must be executed before Task B due to time window alignment.
- (2)
- Resource conflict: Task A and Task B cannot be scheduled simultaneously due to limited imaging field-of-view or onboard energy.
- (3)
- Priority-based substitution: Task A and Task B target similar areas, but B has higher priority (e.g., emergency tasks), thus dominating the scheduling of A.
Thus, the DAG set inherently captures the complex relationships between tasks, facilitating feature extraction using GNN. Moreover, it seamlessly integrates with deep reinforcement learning algorithms to develop an intelligent scheduling agent. This enables efficient mission planning for EOSs, optimizes resource utilization, and enhances overall planning efficiency.
3.4. GNN Model Design
The GNN is responsible for transforming node features, represented by the DAG set, into feature vectors that serve as inputs for the deep reinforcement learning model. The GNN module consists of graph convolution layers, pooling layers, feature summation, and feature embedding. To construct the graph representation learning model, a deep residual network from the image domain is incorporated to preserve lower-layer feature information at higher levels. To ensure effective aggregation of information across nodes, multiple graph convolution layers are stacked. Additionally, dense connections are applied to the output of each convolution layer. Finally, the graph pooling layer extracts the final representational features of the graph. The graph residual representation learning framework is illustrated in Figure 9. Here, A represents the input graph node feature matrix, N denotes the total number of nodes, Embedding refers to the embedded features, MLP stands for Multilayer Perceptron, Gconv represents the Graph Convolution Layer, and Gpool signifies the Graph Pooling Layer.

Figure 9.
GNN model structure.
The GNN takes task nodes with features such as priority, visibility, and emergency status and encodes edge dependencies (e.g., temporal or conflict). It outputs task-level embeddings that guide the RL agent’s scheduling decisions.
The GNN model converts DAG sets into a string-based representation that can be processed by deep reinforcement learning models. The conversion process involves three key steps. First, feature values are computed and assigned to each node. Next, the DAG offset is calculated to ensure correct node indexing when merging multiple DAGs. Finally, DAG node features and edge connection information are generated, facilitating efficient storage and processing. The graph convolution layer incorporates the Graph Attention Network (GAT) to automatically determine the importance weights of neighboring nodes. Unlike traditional models that apply equal weighting to all neighboring nodes, GAT dynamically assigns attention weights based on node relationships. The integration of GAT is expected to enhance the model’s capability to capture the heterogeneous importance of neighboring tasks in the DAG structure. In particular, GAT is known to be more effective in scenarios with highly dynamic task dependencies or heterogeneous task priorities, where the relevance of neighboring nodes varies significantly. By dynamically weighting neighbor contributions, GAT allows the model to better prioritize critical observation tasks and optimize scheduling decisions. Moreover, the GAT dynamically adjusts attention weights during training in response to variations in task priorities, satellite visibility windows, and real-time task insertions, enabling adaptive learning of scheduling relevance under changing conditions. It first calculates the attention coefficient between each neighboring node and the current node and then performs a weighted summation of the neighboring node features. This process takes node features as input and produces attention coefficients as output, refining the learned representations.
The convolution formula can be expressed as follows:
where represents the feature of node at layer , is the set of neighboring nodes of node , denotes the attention coefficient between node and its neighboring node at layer , is the weight matrix at layer , and is the activation function. By leveraging the attention mechanism, GAT can effectively capture the structural information of the graph and exhibit stronger adaptability to different nodes and graph structures.
The pooling layer utilizes the Top-K method to process data with sequence and set structures. It establishes an edge importance evaluation criterion to identify critical dependencies in task planning. Specifically, if an edge links two observation subtasks where one must be completed before the other, and this dependency significantly affects overall scheduling; the edge is considered highly important. While edge importance captures structural dependencies, the GAT mechanism ensures that task priority and global reward impact are incorporated through node-level feature learning. A neural network-based approach computes edge importance scores using node features and task relationship types. For instance, if an edge signifies a high-priority task’s dependency on another, it receives a higher importance score. Finally, the edges and nodes with the top K importance scores are selected for joint pooling, with graph edges updated to maintain connectivity.
In the forward propagation function, node features are first normalized, followed by initial embedding generation using the GATConv (Graph Attention Convolution) layer. Residual blocks iteratively update node embeddings, and after each update, the new embeddings are concatenated into the node feature matrix.
The architecture of the GNN-based DRL model is summarized in Table 1. The input layer maps the 12-dimensional raw node features to a 32-dimensional embedding. This is followed by 3 graph attention layers with hidden dimensions of 32, which perform message passing and feature transformation between neighboring nodes. The output features from the input layer and each GAT layer are concatenated along the feature dimension. A Top-K pooling layer selects the most informative node, producing a global graph-level representation. Finally, the pooled feature vector is passed through a fully connected network. This output provides the Q-value (or action probability) distribution for the reinforcement learning agent.

Table 1.
GAT network structural parameters.
To reinforce the alignment between scheduling logic and the model structure, we explicitly define how raw task features are mapped to model inputs and how the model outputs are interpreted into scheduling actions.
- (1)
- Input Encoding: Each task is represented by a feature vector containing: (i) observation priority (normalized between 0 and 1), (ii) visible time window length, (iii) task type (emergency or periodic), (iv) satellite identifier (one-hot encoded), and time urgency (derived from deadline proximity). These vectors form the node features of the input task graph, resulting in an input tensor of shape , where is the number of tasks and is the feature dimension.
- (2)
- Edge Encoding: Pairwise dependencies are encoded in an adjacency matrix , with each element representing the existence and type of dependency (temporal, conflict, or priority-based) between task pairs. This matrix guides the message passing in the GNN layer.
- (3)
- Intermediate Representation: During training, the GAT-based model dynamically updates node embeddings by aggregating neighborhood information, where attention coefficients reflect changing scheduling constraints—especially under fluctuating task urgency or satellite resource availability. Each node embedding captures contextual dependencies and is passed to the reinforcement learning agent.
- (4)
- Output Decoding: The final output is a scheduling action vector of length , where each element denotes the estimated Q-value of executing a specific task at a given time. These outputs are decoded into a ranked task list or an execution schedule via a greedy or softmax sampling strategy, which is compatible with satellite onboard planners.
3.5. Deep Reinforcement Learning Model Design
By utilizing the GNN model, graph-structured data are converted into low-dimensional state representations, functioning as state encoders within the DRL framework. DRL allows an agent to interact with its environment and continuously learn optimal strategies. Deep learning handles perception and learning, while reinforcement learning enhances deep learning through scoring mechanisms that provide high-reward templates. Based on the traditional DQN (Deep Q-Network) [26], the improved D3QN (Double Dueling Deep Q-Network) [27] algorithm is constructed.
To define satellite operations, an action space is designed to facilitate task execution. When observation tasks dynamically arrive, an Earth observation satellite determines whether to execute them and receives an immediate reward upon completion. However, in remote sensing satellite mission planning, traditional fixed exploration rate strategies—such as ε-greedy—encounter several limitations. Random exploration under resource constraints (e.g., low power, limited storage) can lead to inefficient resource use, as high-energy-consuming tasks may be selected, resulting in resource depletion. Additionally, inefficient convergence occurs when high-priority tasks are frequently overlooked due to inadequate exploration, reducing emergency response efficiency. Fixed exploration rates also hinder adaptability, preventing real-time strategy adjustments based on task urgency or environmental changes.
To overcome these challenges, the Adaptive Exploration Mechanism (AEM) dynamically adjusts the exploration rate, balancing exploration and exploitation. Adaptive pheromone refers to dynamically adjusted heuristic signals that guide the agent’s exploration-exploitation balance during reinforcement learning, inspired by ant colony optimization principles. It prioritizes urgent tasks by assigning higher exploration weights to emergency missions, ensuring rapid response. It also optimizes resource allocation, enabling strategic decision-making under resource constraints. Furthermore, it provides real-time resource awareness, dynamically modifying exploration intensity based on the satellite’s remaining energy and storage capacity.
The adaptive exploration mechanism consists of a basic exploration decay term, a task urgency weighting term, and a resource penalty term. The basic exploration decay is to gradually reduce the exploration rate over time to accelerate the convergence speed, where ε is the current exploration rate, is the minimum value of exploration, is the maximum initial value of exploration, and k is the decay coefficient that controls the rate of exponential decay, and the formula is as follows:
where = 1.0, , and is the decay coefficient.
The task urgency weighting is to dynamically increase the exploration weight according to the task priority:
where is the urgency-adjusted exploration probability, is the base value, represents the task priority and represents the current number of candidate tasks, and is the urgency weight of task , reflecting its temporal urgency.
The resource penalty term is used to suppress the intensity of exploration when resources are in short supply, and the formula is as follows:
where is the resources consumed in the current period, is the total energy budget, and is the penalty intensity factor. Finally, based on the dynamic exploration rate , an improved greedy strategy is adopted:
At the beginning of the mission, the exploration rate (ε) is set to a relatively high value to ensure the agent thoroughly explores the environment and considers a wide range of possible actions and strategies. This high exploration rate increases the likelihood of selecting random actions, allowing the agent to investigate various possibilities in remote sensing satellite mission planning. As the mission progresses and the agent gains a deeper understanding of the environment, it begins to develop effective strategies. During this phase, ε gradually decreases, enabling the agent to strike a balance between exploration and exploitation. While it continues exploring new strategies and actions, it also leverages previously learned policies to execute tasks more efficiently. In the later stages of the mission, or as the model nears convergence, the agent has largely acquired stable and near-optimal strategies. At this stage, ε is reduced to a very low value, minimizing random exploration. However, a small degree of exploration is maintained to prevent the agent from becoming trapped in local optima.
In most cases, the agent selects the current optimal action based on the .
Finally, a deep learning module is designed specifically for AEM-D3QN to manage experience replay buffer storage and sampling, define training frequency and update mechanisms, and establish performance metrics for evaluating and validating the model in a simulated environment. Once trained, the model is integrated into the satellite platform, enabling real-time mission planning and continuous online learning optimization.
- State Space
In the AEM-D3QN model, the state space represents the information the agent gathers from the environment, enabling it to assess the current system state. For Earth observation satellite mission planning, the state space must comprehensively capture the satellite’s operational status and the constraints associated with pending tasks.
Based on the mission planning context, the state S at time T is defined as the which consists of the following elements:
Satellite Orbital State (): It represents the position and orbital information of the satellite at time .
Task Visibility Window (): It defines the time window during which a satellite can observe a given task , specifically including the start time () and end time ().
Satellite Resource State (): It includes the satellite’s battery energy () and storage capacity (), which constrain the satellite’s ability to execute tasks.
Task Information (): It includes relevant information for all pending tasks, such as task priority (), task deadline (), and the spatiotemporal grid () that the task requires for observation.
Task Execution Status (): It indicates if a task has been completed (1) or not (0).
- Action Space
In the AEM-D3QN-based satellite mission planning model, the action space () represents the decision-making process of the imaging satellite. When an observation task dynamically arrives, the satellite must determine in real time whether to execute the task based on its current available resources. This decision can be represented as follows:
- Reward Function
The reward function () directly affects the convergence speed and decision-making strategy of the AEM-D3QN model. Let denote the reward obtained by the agent at time . The task completion reward is designed such that when the agent successfully completes a task, it receives a positive reward based on the task priority (). The reward value is positively correlated with the task priority and can be formulated as follows:
- Loss Function
The AEM-D3QN model updates its neural network parameters by minimizing the error between the target Q-value and the estimated Q-value. Let be the target Q-value, and Q be the estimated Q-value. The loss function (L) is defined as follows:
The target Q-value () is computed using the Bellman equation:
where is the discount factor, which determines the importance of future rewards. is the target network parameter used to stabilize learning.
By precisely designing the state space, action space, and reward function, the AEM-D3QN model effectively adapts to complex satellite mission planning environments. Through continuous learning, it optimizes satellite resource allocation and task execution sequences, ultimately maximizing mission rewards.
4. Experiment Design and Result Analysis
4.1. Experimental Parameter Settings
All experiments were conducted on a workstation equipped with a 5218 CPU Nvidia GV100 GPU, an Intel Xeon Gold 5218 CPU, and 128 GB RAM. The model was implemented using PyTorch 1.12, Pytorch_geometric2.5.2 with CUDA acceleration. For large-scale experiments (over 1000 tasks), training was parallelized across batches using GPU-based mini-batch sampling to reduce memory overhead.
The parameter settings for agent model training are shown in Table 2.

Table 2.
Training parameter settings for the agent model.
- Periodic Task Planning
Periodic task planning refers to the scenario where a remote sensing satellite performs observations at predetermined intervals when there is no immediate demand for emergency or sudden tasks. To study periodic task planning, scheduling schemes with low, medium, and heavy loads are analyzed. Four experimental scenarios are set within the time range from 00:00:00 to 12:00:00 on 1 October 2024. The observation demand is distributed across globally significant and high-priority regions, such as Japan and Russia, as detailed in Table 3.

Table 3.
Setting table of periodic task planning scenarios.
- Emergency mission planning
Emergency mission planning focuses on addressing sudden, high-priority situations that demand rapid response. Given the strict real-time requirements, multiple constraints—such as time, resources, and environmental factors—must be considered. By employing scientific methods and strategies, the system systematically arranges and coordinates task execution, optimizing resource allocation and generating observation plans in the shortest possible time to ensure an effective emergency response. For emergency mission scheduling, four experimental scenarios were designed, each corresponding to a different number of emergency tasks. The experiments evaluated four cases where the ratio of emergency tasks to total observation tasks was set at 10%, 20%, and 50%, resulting in 12 test cases in total. Each test scenario was labeled accordingly, where one component represents the periodic planning of scheduled observation tasks, and the other indicates the number of emergency subtasks.
The value ranges for task elements in the agent task planning sequence are listed in Table 4.

Table 4.
Task element value range table.
The task planning algorithms compared in this paper include the following:
LSTM-DQN [28], a randomly initialized scheduling algorithm proposed by Li.
LSTM-D3QN [29], a task planning model established by using a reinforcement learning model algorithm proposed by Zhao.
IGA, an improved genetic algorithm (IGA) based on DAG graph sets.
4.2. Experiment and Analysis
The AEM-D3QN scheduling model was trained in a simulation environment consisting of 8 satellites and 2000 tasks over a 6 h duration. The training reward curve, shown in Figure 10, illustrates the model’s learning progress. From 0 to 400 episodes, the total reward steadily increases. Between 400 and 700 episodes, the reward growth slows down, and after 700 episodes, the model approaches its maximum reward value of approximately 68, eventually stabilizing over time.
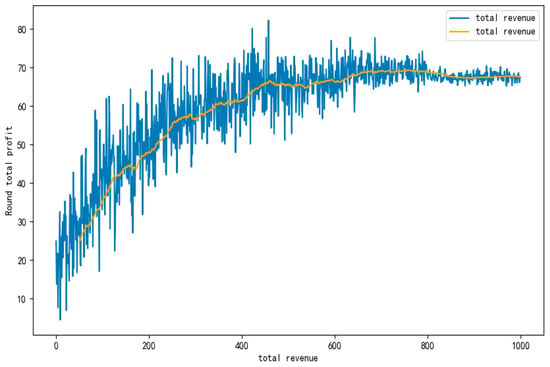
Figure 10.
Deep reinforcement learning model flowchart.
The following metrics were computed and analyzed in the experiments:
- Total Profit (F): It is defined as the ratio of the actual valid observation frequency of all emergency tasks to the required observation frequency. represents the set of completed tasks.
- Response Time (Latency): The time elapsed from the invocation of the algorithm to the generation of the schedule or decision. represents the algorithm invocation time, and represents the schedule generation time.
- Scheduling Rate (Task Completion Rate): It is defined as the ratio of the actual valid observation frequency of all emergency tasks to the required observation frequency.
4.2.1. Periodic Task Planning
In this paper, overall revenue, algorithm runtime, and the number of task plans are used as evaluation indicators. The results are presented in Table 5 and Figure 11. As the number of periodic task planning tasks increases from 500 to 4000, the execution time of all algorithms shows an increasing trend. The AEM-D3QN algorithm experiences a time increase from 2.34 s (for 500 tasks) to 39.57 s (for 4000 tasks)—approximately 16 times the initial value. In contrast, the MODMSA-INI algorithm sees a significant rise from 5.18 s to 381.34 s, an increase of about 73 times. This demonstrates that the time consumption growth of the proposed model remains relatively low.

Table 5.
Time consumption of each algorithm for periodic task planning.
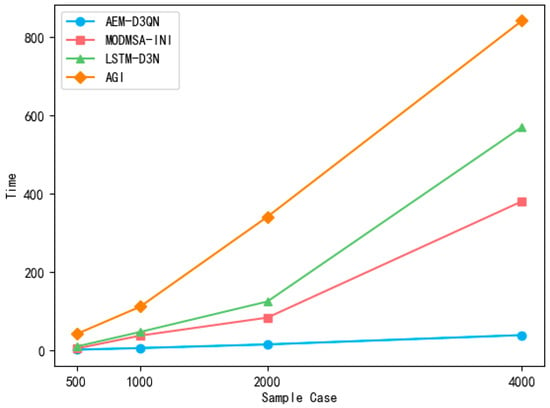
Figure 11.
Comparison of time for periodic task planning.
Compared to the MODMSA-INI algorithm, the AEM-D3QN algorithm improves time efficiency by over 9 times, and when compared to the AGI algorithm, the improvement exceeds 21 times. Across different task scales, AEM-D3QN consistently has the shortest planning time among the four algorithms, proving its high efficiency in periodic task planning for remote sensing satellites.
For smaller task scales, the runtime gap between MODMSA-INI and AEM-D3QN is relatively small. However, as task scales increase, the efficiency gap widens significantly, indicating that MODMSA-INI struggles with large-scale tasks. The MODMSA-INI and AGI algorithms consistently exhibit high time consumption, particularly in large-scale scheduling. This is because the AGI algorithm searches for an optimal solution by exhaustively traversing different schemes through crossover and mutation in each generation. Meanwhile, the MODMSA-INI algorithm suffers from a slow model-building process and lacks a fast adaptive exploration mechanism, preventing it from effectively balancing exploration and exploitation.
The scheduling rates for periodic planning in remote sensing satellites are presented in Table 6 and Figure 12. As the number of tasks increases, the completion rates of all four algorithms exhibit a gradual decline. Across different task scales, the AEM-D3QN algorithm consistently demonstrates a relatively high task completion rate, either outperforming or closely matching other algorithms. When the number of tasks is 500, the AEM-D3QN algorithm achieves a completion rate of 73.18%, surpassing the other three algorithms. Although its completion rate decreases as the task load increases, it remains 5% to 10% higher than the MODMSA-INI, LSTM-DQN, and AGI algorithms. This indicates that AEM-D3QN maintains strong task completion performance and stability across varying task scales. The MODMSA-INI and AGI algorithms perform relatively stably when the number of tasks is below 2000. However, at 4000 tasks, their completion rates drop significantly, indicating that their performance deteriorates when the task scale surpasses a certain threshold. When satellite resources remain fixed, the task scheduling rate stays relatively high or fluctuates slightly as task numbers increase. However, once the task volume exceeds the satellite’s capacity, the scheduling rate begins to decline, highlighting the impact of resource limitations on task execution.

Table 6.
Scheduling rate of periodic task planning.
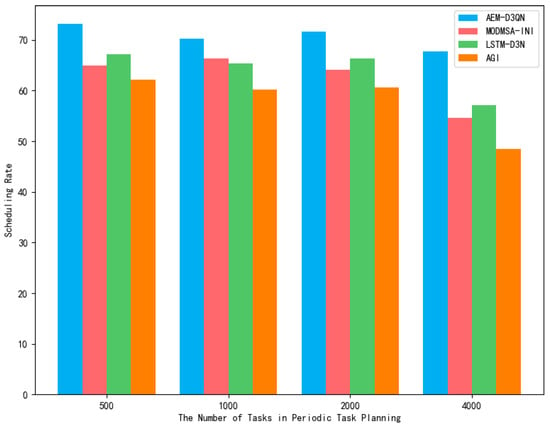
Figure 12.
A comparison of scheduling rates for periodic task planning.
In conclusion, in terms of periodic task planning, the algorithm proposed in this paper has significant advantages over other algorithms in both planning time and scheduling rate, and it can accomplish periodic task planning quite well.
4.2.2. Emergency Mission Planning
The task scheduling rates in emergency scheduling scenarios were evaluated for the proposed AEM-D3QN algorithm alongside comparison algorithms, with results detailed in Table 7 and Figure 13. Across all task scales, the AEM-D3QN algorithm consistently achieved the shortest scheduling time for emergency task planning. For instance, in the case2000_1000 scenario, the AEM-D3QN algorithm completed scheduling in 18.35 s, while the MODMSA-INI algorithm required 79.16 s, and the AGI algorithm took 574.61 s. This demonstrates that AEM-D3QN improves scheduling efficiency by a factor of 4 to 30 compared to the other methods, underscoring its capability for real-time remote sensing satellite task planning. Its ability to rapidly generate scheduling results makes it particularly suitable for time-sensitive applications. Conversely, the LSTM-DQN and AGI algorithms showed a significant increase in computational time as the task scale grew, revealing the computational complexity challenges of intelligent optimization algorithms in large-scale scheduling. This limitation makes it difficult for these algorithms to meet real-time requirements in emergency scenarios.

Table 7.
Comparison of task scheduling rates of different algorithms in emergency task planning.
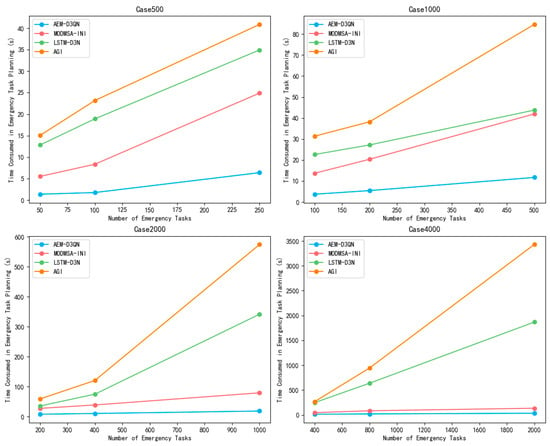
Figure 13.
Comparison of task scheduling rates of different algorithms in emergency task planning.
The efficiency of emergency task planning for each algorithm is presented in Table 8 and Figure 14. The results indicate that as the total number of planned tasks remains constant, the disturbance rate of all algorithms increases with the number of emergency tasks. However, the AEM-D3QN algorithm consistently achieves a higher scheduling rate than the other algorithms, maintaining an improvement of over 4% and reaching a maximum improvement of 10% over the AGI algorithm. This demonstrates that AEM-D3QN can allocate resources more effectively when handling remote sensing satellite task scheduling, leading to a higher task execution success rate and overall superior performance.

Table 8.
Comparison of planning response time of different algorithms in emergency task planning.
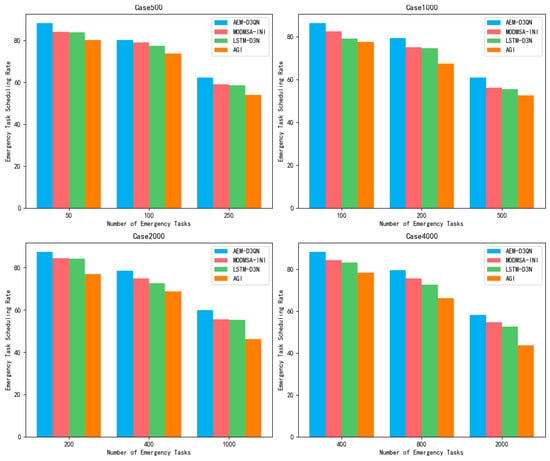
Figure 14.
Planning time of different algorithms in emergency scenarios.
When the number of pre-planned tasks remains unchanged, the disturbance rate of all algorithms increases as the number of emergency tasks grows. However, the AEM-D3QN algorithm consistently outperforms other algorithms, achieving a scheduling rate improvement of over 5%, with a maximum gain of 10% over the AGI algorithm. This highlights the AEM-D3QN algorithm’s superior ability to coordinate resources efficiently in remote sensing satellite task scheduling, enhancing the success rate of task execution and demonstrating exceptional performance. Quantitative evaluations demonstrate that the proposed AEM-D3QN framework consistently outperforms baseline methods in dynamic satellite scheduling tasks. Across scenarios with 10–50% emergency tasks, AEM-D3QN achieves success rates ranging from 58.16% to 88.23%, with up to 89% completion for high-priority tasks. In large-scale cases involving over 4000 tasks, the model reduces scheduling latency to less than 10% of that required by traditional methods, while maintaining resource utilization above 70%.
Overall, the method proves most effective in the vast majority of dynamic scheduling scenarios tested, particularly those featuring real-time constraints, high task density, or frequent emergency insertions. These results confirm the model’s adaptability and robustness under complex, dynamic planning conditions.
5. Conclusions
This paper addresses the challenge of Earth observation satellite mission planning by optimizing both time and efficiency through an advanced deep reinforcement learning algorithm based on graph neural networks (AEM-D3QN). The proposed AEM-D3QN framework introduces a directed acyclic graph (DAG)-based modeling approach tailored to dynamic task scheduling, enabling real-time updates of the satellite DAG structure. Reinforcement learning is utilized to construct the satellite task scheduling decision model, with a Markov decision process formulated to guide scheduling decisions. To enhance optimization, an improved AEM-D3QN algorithm is developed, ensuring a comprehensive and efficient scheduling strategy. Finally, comparative experiments are conducted between the AEM-D3QN scheduling model and other algorithms under both periodic and emergency task planning scenarios. The results demonstrate that the proposed model consistently outperforms intelligent optimization algorithms, offering significant improvements in scheduling efficiency across various scenarios.
Author Contributions
Conceptualization, S.L.; Methodology, G.W. and J.C.; Software, G.W.; Formal analysis, J.C.; Investigation, J.C.; Resources, S.L.; Data curation, S.L.; Writing—review & editing, S.L. and G.W. All authors have read and agreed to the published version of the manuscript.
Funding
This research received no external funding.
Data Availability Statement
Currently, we cannot disclose the dataset due to ongoing follow-up research. After its completion, we will make the data publicly available.
Conflicts of Interest
The authors declare no conflict of interest.
References
- Zhang, J. Earth Observation and Air Surveillance, 1st ed.; Science Press: Beijing, China, 2001. [Google Scholar]
- Li, G.; Xing, L.; Chen, Y. A hybrid online scheduling mechanism with revision and progressive techniques for autonomous Earth observation satellite. Acta Astronaut. 2017, 140, 308–321. [Google Scholar] [CrossRef]
- Jiang, B.T. Development and Prospect of China’s Space Earth—Observation Technology. Acta Geod. Cartogr. Sinica 2022, 51, 7. [Google Scholar] [CrossRef]
- Liao, X. Scientific and Technological Progress and Development of Earth Observation in China over the Past 20 Years. J. Remote Sens. 2021, 25, 267–275. [Google Scholar] [CrossRef]
- Schiex, T. Solution reuse in dynamic constraint satisfaction problems. In Proceedings of the Twelfth National Conference on Artificial Intelligence, Seattle, DC, USA, 31 July–4 August 1994. [Google Scholar]
- Pemberton, J.C. A constraint-based approach to satellite scheduling. In Proceedings of the DIMACS Workshop on Constraint Programming and Large Scale Discrete Optimization, Piscataway, NJ, USA, 14–17 September 2000. [Google Scholar]
- Dai, S. Research on Key Technologies of Spacecraft Autonomous Operation. Ph.D. Dissertation, Center for Space Science and Applied Research, Chinese Academy of Sciences, Beijing, China, 2002. [Google Scholar]
- Li, Y.; Wang, R.; Liu, Y.; Xu, M. Satellite range scheduling with the priority constraint: An improved genetic algorithm using a station ID encoding method. Chin. J. Aeronaut. 2015, 28, 789–803. [Google Scholar] [CrossRef]
- Habet, D.; Vasquez, M.; Vimont, Y. Bounding the Optimum for the Problem of Scheduling the Photographs of an Agile Earth Observing Satellite. Comput. Optim. Appl. 2010, 47, 307–333. [Google Scholar] [CrossRef]
- Sun, K.; Yang, Z.; Wang, P.; Chen, Y. Mission Planning and Action Planning for Agile Earth-Observing Satellite with Genetic Algorithm. J. Harbin Inst. Technol. 2013, 20, 51–56. [Google Scholar]
- Yuan, Z.; Chen, Y.; He, R. Agile earth observing satellites mission planning using genetic algorithm based on high quality initial solutions. In Proceedings of the 2014 IEEE Congress on Evolutionary Computation (CEC), Beijing, China, 6–11 July 2014; IEEE: New York, NY, USA, 2014. [Google Scholar] [CrossRef]
- Wang, M.; Dai, G.; Vasile, M. Heuristic Scheduling Algorithm Oriented Dynamic Tasks for Imaging Satellites. In Mathematical Problems in Engineering; Wiley: Hoboken, NJ, USA, 2014; pp. 1–11. [Google Scholar] [CrossRef]
- Xin, C.; Luo, Q.; Wang, C.; Yan, Z.; Wang, H. Research on Route Planning based on improved Ant Colony Algorithm. J. Phys. Conf. Ser. 2021, 1820, 012180. [Google Scholar] [CrossRef]
- Sangeetha, V.; Krishankumar, R.; Ravichandran, K.S.; Kar, S. Energy-efficient green ant colony optimization for path planning in dynamic 3D environments. Soft Comput. 2021, 25, 4749–4769. [Google Scholar] [CrossRef]
- He, W.; Qi, X.; Liu, L. A novel hybrid particle swarm optimization for multi-UAV cooperate path planning. Appl. Intell. 2021, 51, 7350–7364. [Google Scholar] [CrossRef]
- Yang, X.; Hu, M.; Huang, G.; Lin, P.; Wang, Y. A Review of Multi-Satellite Imaging Mission Planning Based on Surrogate Model Expensive Multi-Objective Evolutionary Algorithms: The Latest Developments and Future Trends. Aerospace 2024, 11, 793. [Google Scholar] [CrossRef]
- Peng, S.; Chen, H.; Du, C.; Li, J.; Jing, N. Onboard Observation Task Planning for an Autonomous Earth Observation Satellite Using Long Short-Term Memory. IEEE Access 2018, 6, 65118–65129. [Google Scholar] [CrossRef]
- Zhao, X.; Wang, Z.; Zheng, G. Two-Phase Neural Combinatorial Optimization with Reinforcement Learning for Agile Satellite Scheduling. J. Aerosp. Inf. Syst. 2020, 17, 1–12. [Google Scholar] [CrossRef]
- Wei, L.; Chen, M.; Chen, Y. Deep reinforcement learning and parameter transfer based approach for the multi-objective agile earth observation satellite scheduling problem. Appl. Soft Comput. 2021, 110, 107607. [Google Scholar] [CrossRef]
- Ma, Q.; Ge, S.; He, D.; Thaker, D.; Drori, I. Combinatorial Optimization by Graph Pointer Networks and Hierarchical Reinforcement Learning. arXiv 2019, arXiv:1911.04936. [Google Scholar] [CrossRef]
- Sun, H.; Chen, W.; Li, H.; Song, L. Improving learning to branch via reinforcement learning. In Proceedings of the 1st Workshop on Learning Meets Combinatorial Algorithms, Vancouver, BC, Canada, 11–12 December 2020; pp. 1–12. [Google Scholar]
- Li, K.; Zhang, T.; Wang, R.; Wang, L. Deep Reinforcement Learning for Online Routing of Unmanned Aerial Vehicles with Wireless Power Transfer. arXiv 2022, arXiv:2204.11477. [Google Scholar] [CrossRef]
- Li, C.; Chen, Y.; Lang, J. Data-driven onboard scheduling for an autonomous observation satellite. In Proceedings of the 27th International Joint Conference on Artificial Intelligence, AAAI, Stockholm, Sweden, 13–19 July 2018; p. 20108. [Google Scholar]
- Wu, Y.L. Research on DAG Task Partitioning and Scheduling Algorithm for Multicore Real—Time Systems. Ph.D. Thesis, Harbin Institute of Technology, Harbin, China, 2024. [Google Scholar] [CrossRef]
- Gilmer, J.; Schoenholz, S.S.; Riley, P.F.; Vinyals, O.; Dahl, G.E. Neural message passing for quantum chemistry. In International Conference on Machine Learning; PMLR: Sydney, Australia, 2017; pp. 1263–1272. [Google Scholar]
- Mnih, V.; Kavukcuoglu, K.; Silver, D.; Graves, A.; Antonoglou, I.; Wierstra, D.; Riedmiller, M. Playing Atari with Deep Reinforcement Learning. arXiv 2013, arXiv:1312.5602. [Google Scholar] [CrossRef]
- Gk, M. Dynamic path planning via Dueling Double Deep Q-Network (D3QN) with prioritized experience replay. Appl. Soft Comput. 2024, 158, 17. [Google Scholar] [CrossRef]
- Li, H.; Li, Y.; Liu, Y.; Zhang, K.; Li, X.; Li, Y.; Zhao, S. A Multi-Objective Dynamic Mission-Scheduling Algorithm Considering Perturbations for Earth Observation Satellites. Aerospace 2024, 11, 643. [Google Scholar] [CrossRef]
- Zhao, S.J. Research and Implementation of Satellite Autonomous Task Planning Method Based on Reinforcement Learning. Master’s Thesis, East China Normal University, Shanghai, China, 2023. [Google Scholar]
Disclaimer/Publisher’s Note: The statements, opinions and data contained in all publications are solely those of the individual author(s) and contributor(s) and not of MDPI and/or the editor(s). MDPI and/or the editor(s) disclaim responsibility for any injury to people or property resulting from any ideas, methods, instructions or products referred to in the content. |
© 2025 by the authors. Licensee MDPI, Basel, Switzerland. This article is an open access article distributed under the terms and conditions of the Creative Commons Attribution (CC BY) license (https://creativecommons.org/licenses/by/4.0/).