Article

Optimization of Flight Scheduling in Urban Air Mobility Considering Spatiotemporal Uncertainties

1
Air Traffic Control and Navigation College, Air Force Engineering University, Xi’an 710051, China
2
National Key Laboratory of Air Traffic Collision Prevention, Xi’an 710051, China
3
Unit 95920 of the PLA, Hengshui 053000, China
4
Unit 91422 of the PLA, Yantai 265200, China
*
Author to whom correspondence should be addressed.
Aerospace 2025, 12(5), 413; https://doi.org/10.3390/aerospace12050413
Submission received: 26 March 2025 / Revised: 29 April 2025 / Accepted: 5 May 2025 / Published: 7 May 2025
(This article belongs to the Section Air Traffic and Transportation)

Abstract

:
The vigorous development of urban air mobility (UAM) is reshaping the urban travel landscape, but it also poses severe challenges to the safe and efficient operation of dense and complex airspace. Potential conflicts between flight plans have become a core bottleneck restricting its development. Traditional flight plan adjustment and management methods often rely on deterministic trajectory predictions, ignoring the inherent temporal uncertainties in actual operations, which may lead to the underestimation of potential risks. Meanwhile, existing global optimization strategies often face issues of inefficiency and overly broad adjustment scopes when dealing with large-scale plan conflicts. To address these challenges, this study proposes an innovative flight plan conflict management framework. First, by introducing a probabilistic model of flight time errors, a new conflict detection mechanism based on confidence intervals is constructed, significantly enhancing the ability to foresee non-obvious conflict risks. Furthermore, based on complex network theory, the framework accurately identifies a small number of “critical flight plans” that play a core role in the conflict network, revealing their key impact on chain reactions of conflicts. On this basis, a phased optimization strategy is adopted, prioritizing the adjustment of spatiotemporal parameters (departure time and speed) for these critical plans to systematically resolve most conflicts. Subsequently, only fine-tuning the speeds of non-critical plans is required to address remaining local conflicts, thereby minimizing interference with the overall operational order. Simulation results demonstrate that this framework not only significantly improves the comprehensiveness of conflict detection but also effectively reduces the total number of conflicts. Additionally, the proposed phased artificial lemming algorithm (ALA) outperforms traditional optimization algorithms in terms of solution quality. This work provides an important theoretical foundation and a practically valuable solution for developing robust and efficient UAM dynamic scheduling systems, holding promise to support the safe and orderly operation of large-scale urban air traffic in the future.

1. Introduction

Electric vertical takeoff and landing (eVTOL) aircraft and large-scale drones are reshaping urban transportation systems through the advancement of urban air mobility (UAM) [1,2,3,4]. However, high-density three-dimensional airspace operations present severe challenges to flight safety and operational efficiency [5]. Ensuring safe and orderly UAM operations while avoiding mid-air conflicts remains a critical issue for advancing future air transportation quality.
The multi-layered conflict management system proposed by the Federal Aviation Administration (FAA) for unmanned aircraft system traffic management (UTM) establishes a dual safeguard mechanism for dynamic airspace resource allocation and risk mitigation. This is achieved by integrating pre-flight four-dimensional trajectory planning (incorporating 3D spatial coordinates and time dimensions) with real-time sense-and-avoid technologies [6]. Real-time sensing and avoidance systems based on deep reinforcement learning and multi-sensor fusion (such as ADS-B, lidar, and computer vision) have been widely applied in ground transportation [7], offering high levels of safety and comfort. However, in the free airspace environment of urban air mobility, while such real-time sensing and avoidance strategies can enhance the capacity density of low-altitude airspace [8], their safety margins face significant limitations in mixed manned–unmanned operational scenarios. In particular, compound risk factors—including airspace traffic flow reaching critical density, sudden meteorological disturbances, aircraft trajectory prediction errors, and communication delays—can degrade the safety and stability of conflict resolution [9], which is unacceptable for manned aircraft. Therefore, during the initial development phase of urban air mobility, adopting a fixed route network with predefined takeoff/landing points and waypoints—by specifying information such as departure/arrival locations, takeoff times, and waypoints in flight plans to track aircraft positions at any moment—can effectively enhance flight safety. Proactively adjusting predetermined flight plans can preemptively avoid numerous conflicts, preventing mid-air collisions during aircraft operations and providing technical support for the safe and orderly development of urban air traffic.
Specifically, in the initial development stage, a three-stage regulatory paradigm of “filing-approval-dynamic monitoring” remains essential to ensure flight safety. Regulatory authorities conduct unified optimization and adjustment based on filed flight plans to improve the operational efficiency and safety of urban air mobility. Current research on flight plan scheduling in civil aviation has made significant advancements, primarily focusing on reducing air delays, enhancing operational efficiency, and improving airline profitability [10,11,12,13]. Unlike traditional civil aviation optimization, urban air mobility (UAM) scenarios involve significantly increased airspace complexity and higher vehicle density. Electric vertical takeoff and landing (eVTOL) aircraft and large cargo drones, in particular, feature shorter flight paths with flexible departure times and speeds. Therefore, proactive flight plan adjustments hold greater practical significance for mitigating mid-air conflicts and safety risks in UAM systems.
In this domain, D. Sacharny et al. [14] have developed a comprehensive traffic management solution for large-scale unmanned aircraft systems (UAS), addressing both conflict resolution and route network planning while providing insights into proactive and dynamic scheduling. Oliveira et al. [15] advanced a stochastic optimization method integrating weather forecasts and payload data to improve flight efficiency. Su et al. [16] investigated risk assessment and optimization methods for UAM flight plans, incorporating both aerial and ground risks to generate low-risk operational recommendations. Regarding optimization models, Pang et al. [17] proposed an urban-specific flight plan framework that successfully avoided pre-flight conflicts through strategic coordination and decision variable optimization. Dai W et al. [18] developed a conflict-free A* algorithm (CFA) based on four-dimensional trajectory planning to address high-conflict scenarios in route optimization. Haba D et al. [19] applied quantum annealing algorithms to optimize UAM route and schedule planning, achieving significant airspace efficiency improvements through traffic flow optimization. Additionally, Shihab et al. [20] explored innovative on-demand, scheduled, and hybrid scheduling approaches for future eVTOL operations. Zhang Wei [21] introduced an enhanced flight plan adjustment method using grid technology to dynamically coordinate existing and newly added plans, further improving scheduling flexibility and efficiency. Furthermore, in ref. [22], a novel task scheduling algorithm framework is proposed, which explicitly incorporates “proportional fairness” as a key optimization objective when making scheduling decisions. This is particularly important under conditions of limited resources or uneven load, ensuring more reasonable service allocation. Such a fairness-oriented scheduling paradigm, when faced with dynamic imbalances between urban airspace carrying capacity and aircraft operational demands, can achieve optimal matching between limited resources and differentiated service requirements through intelligent scheduling algorithms. This holds significant methodological reference value for the construction of smart urban air traffic management systems.
While current research on flight plan conflict optimization has made significant advancements, several challenges persist. Existing conflict detection methods primarily rely on deterministic four-dimensional position data, neglecting the impacts of aerial uncertainties [23]. Aircraft may deviate from their intended positions due to various errors and failing to account for such uncertainties can lead to undetected latent conflicts. Moreover, most optimization strategies focus on global adjustments without fully recognizing the disproportionate influence of certain critical flight plans on overall conflict patterns. In UAM environments with fixed takeoff/landing points and waypoints, flight path overlaps increase the likelihood of individual ill-scheduled plans triggering cascading conflicts [24]. These particularly impactful plans are termed critical flight plans. Adjusting departure times and speeds can resolve most conflicts with minimal disruption to other operations. Finally, traditional optimization algorithms often employ single-stage global optimization strategies for multi-objective mixed nonlinear problems. Such strategies lead to significant overall changes in plans and are prone to falling into local optima, failing to guarantee the quality of solution sets.
To address these challenges, this paper proposes a novel flight plan conflict detection and optimization model. The model incorporates a 4D trajectory confidence interval model for the first time, integrating the probabilistic distribution of time errors into conflict detection. This solves the problem of the insufficient adaptability of traditional deterministic methods to dynamic uncertain scenarios and significantly enhances robustness. Meanwhile, by constructing a conflict complex network and fusing multi-dimensional centrality metrics, the model accurately identifies structurally critical flight plans from the perspective of network topology stability [25], overcoming the limitations of traditional experience-driven priority classification. It also aims to achieve optimal adjustment effects by modifying the minimum number of critical plans. To balance the efficiency and quality of multi-objective solving, the proposed phased optimization strategy and innovative application of the artificial lemming algorithm (ALA) [26] are introduced: the first phase optimizes the departure time and flight speed of critical flight plans, while the second phase resolves remaining conflicts by only adjusting speeds, thereby avoiding unnecessary impacts on all flight plans. This approach can also flexibly perform targeted adjustments based on the characteristics of different flight plans, effectively reducing conflicts between them.
The research flowchart of this paper is shown in Figure 1:

2. Conflict Identification Model Incorporating Flight Uncertainty

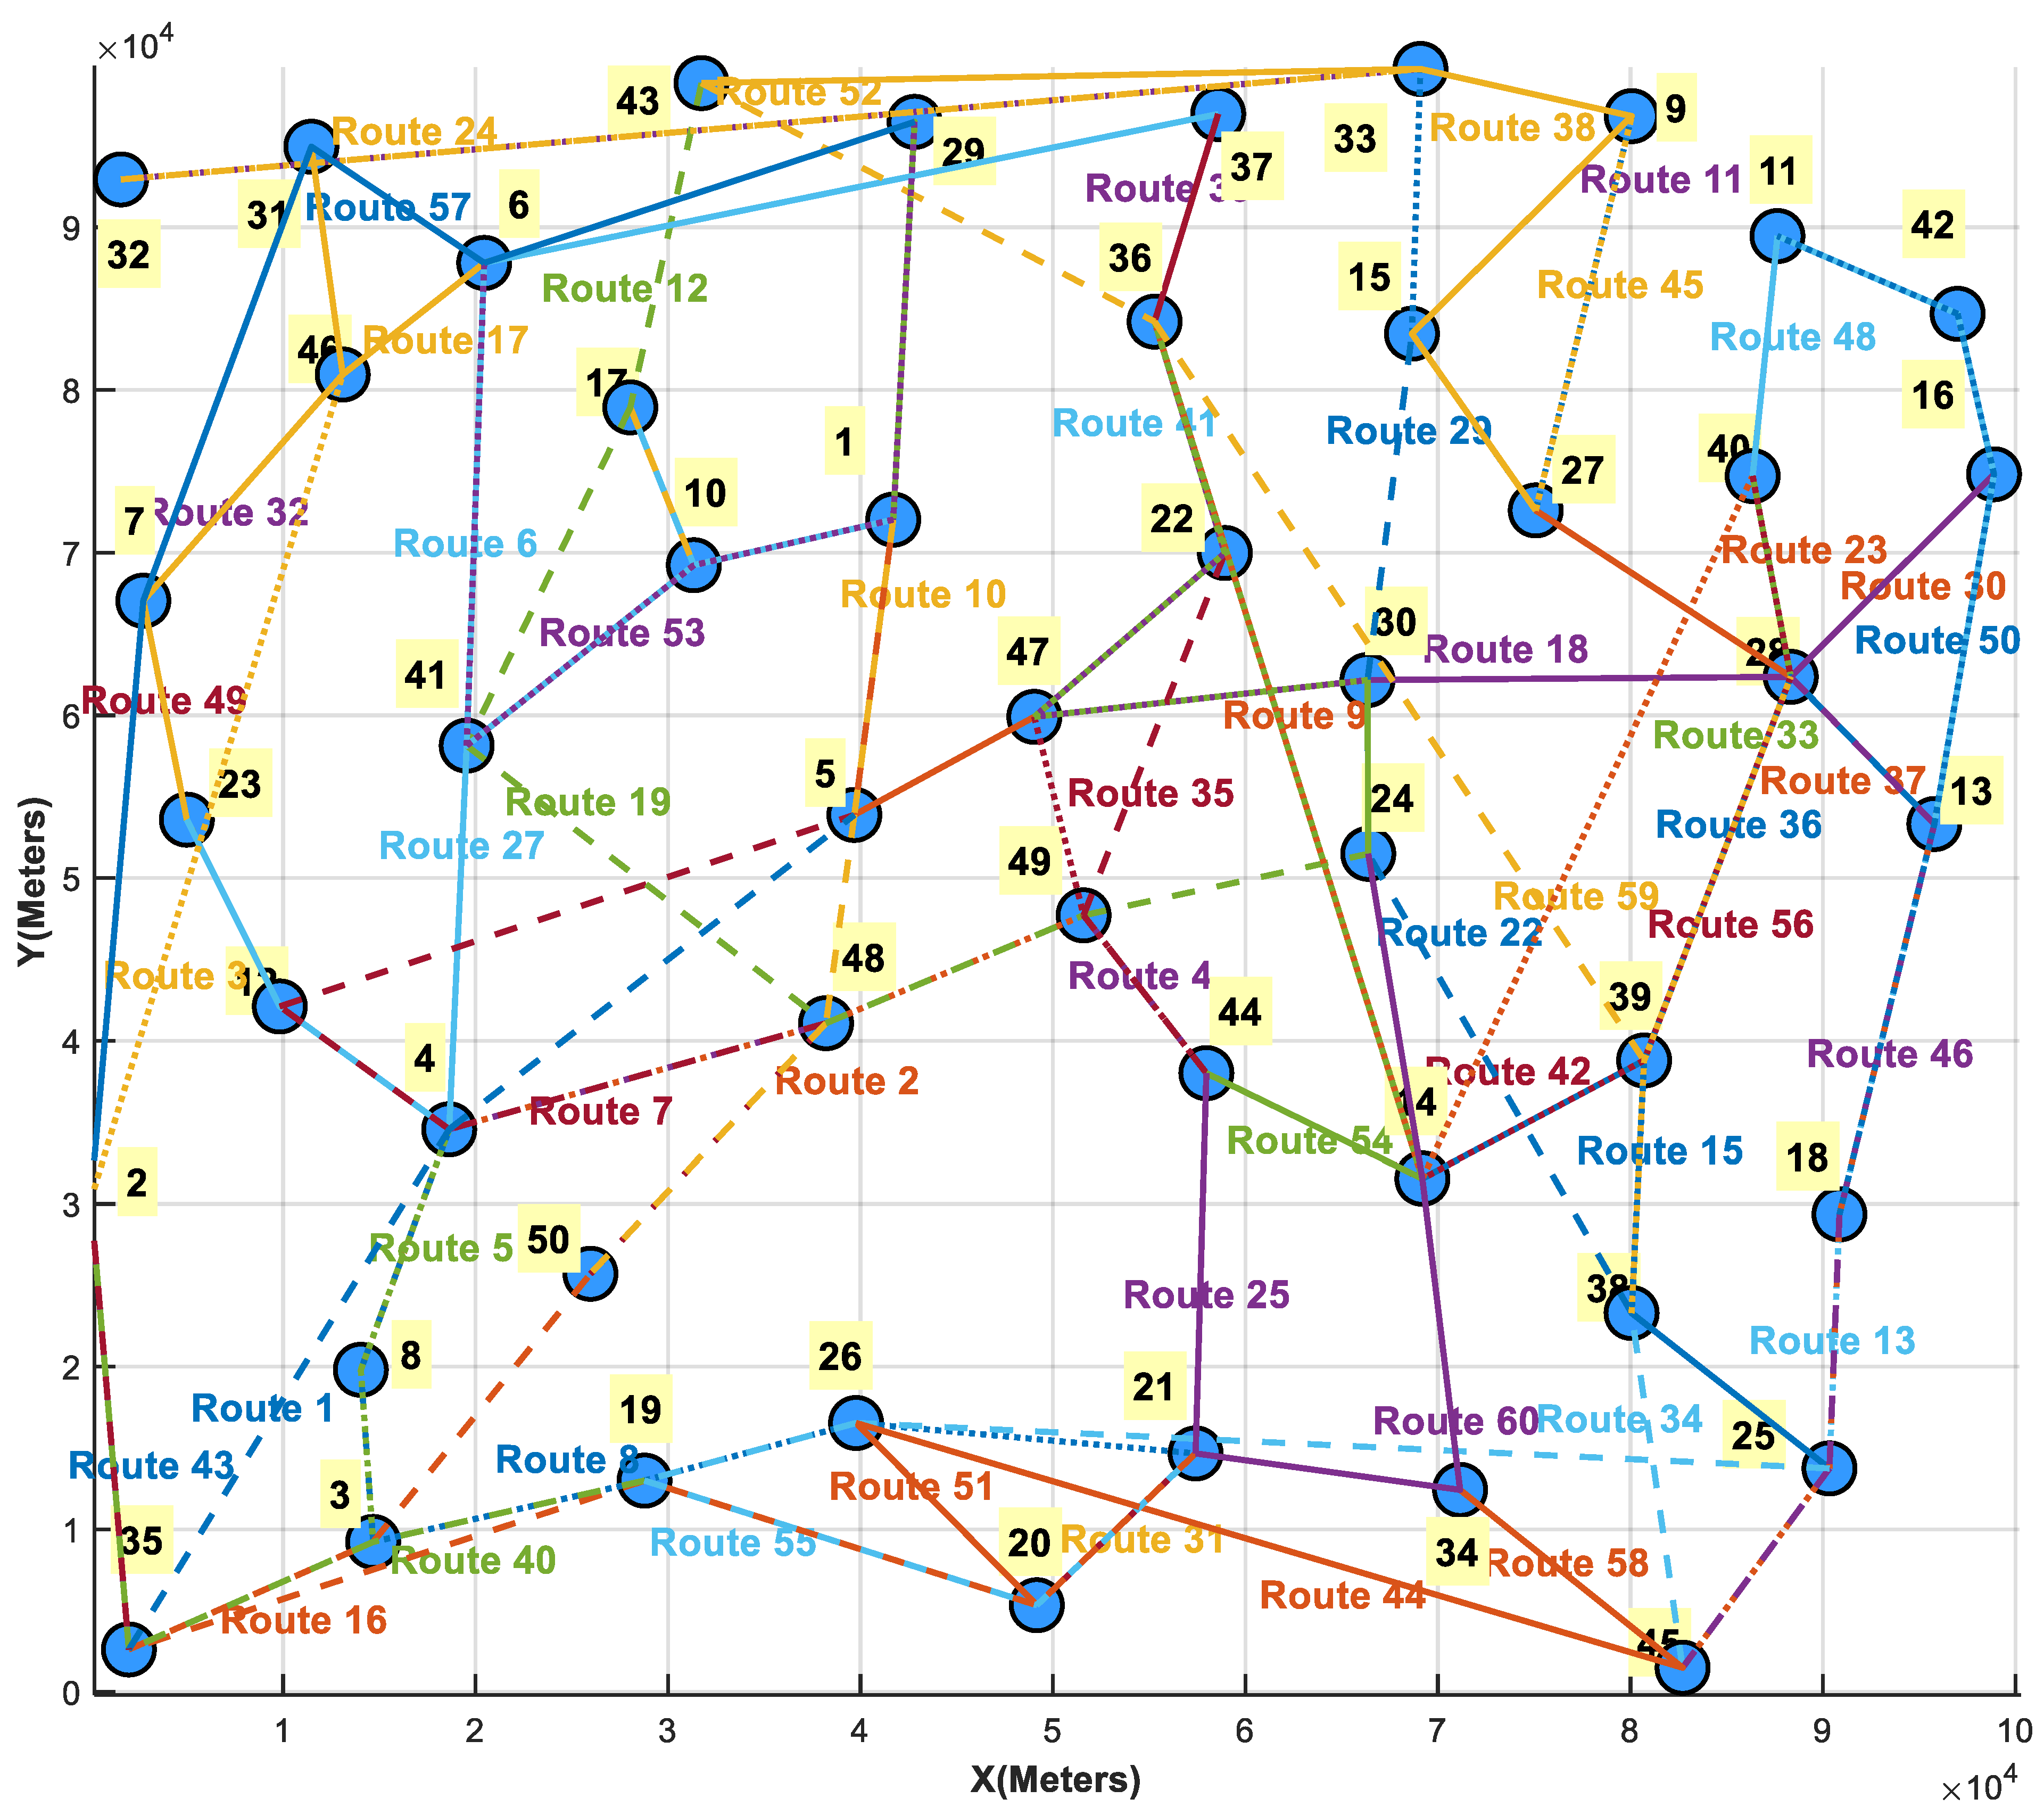
2.1. Initial Flight Plan Generation

To optimize eVTOL flight paths in dynamic UAM airspace, this study models the aerial transportation network. Given the current operational context, urban scenarios are assumed to follow fixed route networks.
Flight plans in air traffic represent four-dimensional constructs, where each aircraft’s spatiotemporal position is defined by the four-dimensional coordinate w = ( x , y , z , t ) , with ( x , y , z ) denoting spatial coordinates and t representing the time dimension. This ensures deterministic position and motion state representation for all aircraft. A flight plan r can be mathematically expressed as follows:
r = w 1 , w 2 , , w n
The set of daily flight plans is denoted as r 1 , r 2 , , r m .

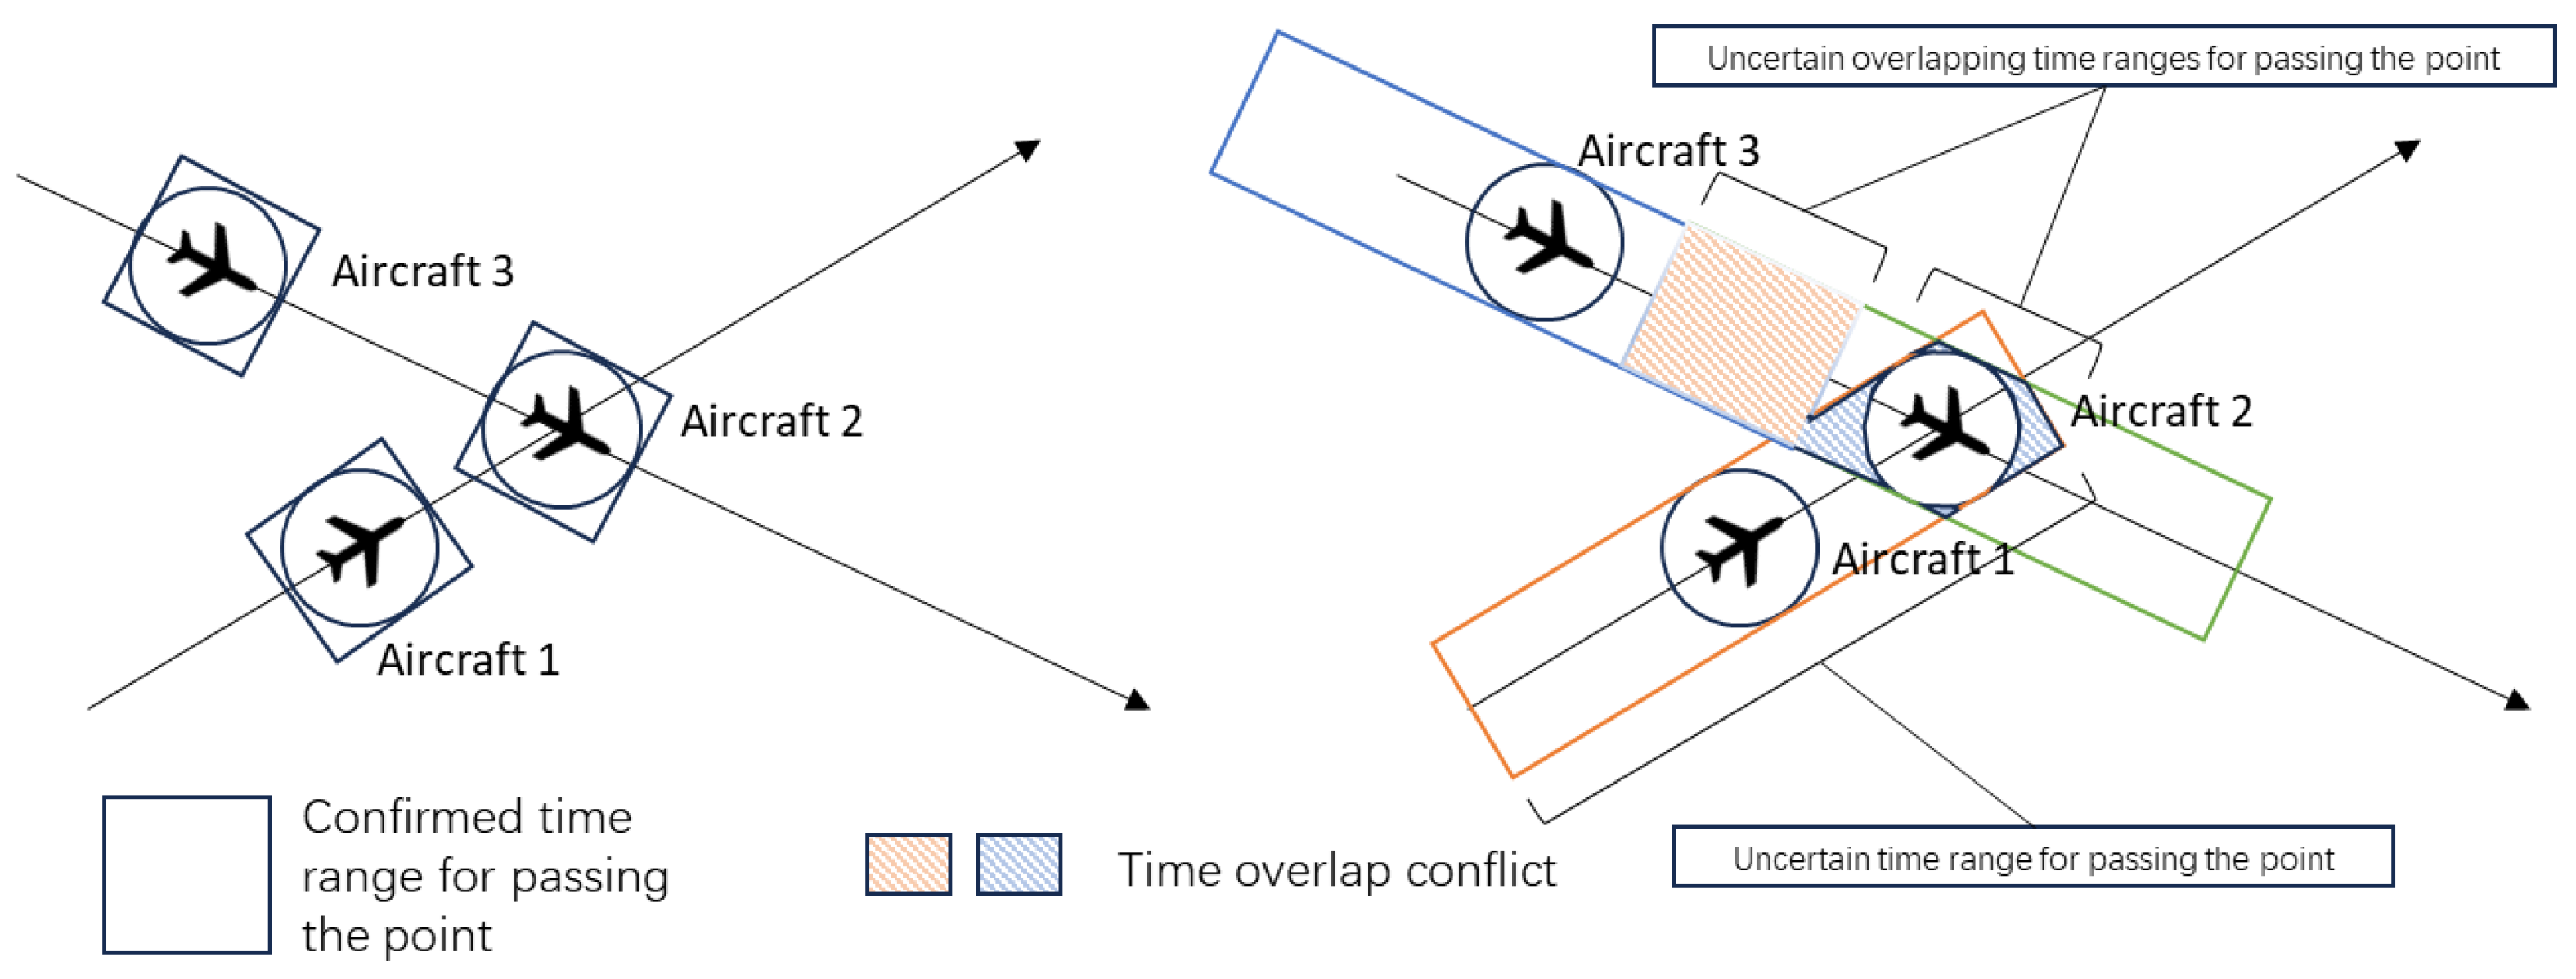
2.2. Uncertainty Principle

Flight conflict detection represents a critical step in flight plan optimization, typically determined by whether multiple aircraft occupy the same spatial position simultaneously. The prevailing approach involves establishing aircraft protection zones [27], where incursion into another aircraft’s protected area constitutes a conflict. Traditional methods require precise position data, but operational uncertainties such as adverse weather, temporary airspace restrictions, and human perturbations can cause deviations from planned speeds, particularly in high-density environments. These deviations introduce positional uncertainty, creating potential conflict zones around nominal trajectories. This study focuses on time-over-point (TOP) errors as the primary source of positional uncertainty for conflict detection.
Simply adding fixed TOP errors throughout flight operations insufficiently addresses error accumulation. Previous research [28] on temporal uncertainty distributions provides theoretical foundations for dynamic TOP error modeling. The core concept posits that an aircraft’s estimated TOP time t n o r m follows a one-dimensional normal distribution.
The estimated time-over-point (TOP) of an aircraft t n o r m follows a one-dimensional normal distribution due to uncertainty, as follows:
t n o r m ~ N μ t , δ 2
where
μ t = t n o r m + μ d e v t
t n o r m : nominal TOP time in the flight plan (ideal error-free time);
μ d e v t : Mean cumulative temporal deviation;
δ 2 : Variance representing TOP time volatility, typically increasing with flight duration.
Suppose two aircraft, A and B, are planned to fly near an intersection. According to air traffic control requirements, the two aircraft must maintain a minimum safe time interval of T s a f e = 2 min (under error-free conditions). Due to wind speed variations and human operation influences, their passage times at the intersection are uncertain, requiring a probabilistic model to assess potential conflicts.
The nominal passage time of Aircraft A is t n o r m A = 10 : 00   A M , with a mean cumulative time deviation μ A = 0 , and variance δ A 2 = ( 1   m i n ) 2 (accumulated over time);
The nominal passage time of Aircraft B is t n o r m B = 10 : 03   A M , with a mean cumulative time deviation μ B = 0 , and variance δ B 2 = ( 1.5   m i n ) 2 ;
The actual passage times follow normal distributions: t A ~ N t n o r m A + μ A , δ A 2 = N ( 10 : 00 , 1 ) ; t B ~ N t n o r m B + μ A , δ B 2 = N ( 10 : 03 , 2.25 )
(1)
Confidence Interval and Temporal Boundaries
To quantify uncertainty ranges, define the confidence interval for estimated TOP time, as follows:
P t e a r l y t n o r m t l a t e = 1 α
t e a r l y = F 1 α 2 , t l a t e = F 1 1 α 2
where
t e e a r l y and t e l a t e are temporal boundaries at confidence level 1 α ;
α is the significance level (e.g., 0.05 for 95% confidence);
F 1 denotes the inverse cumulative distribution function (e.g., F 1 ( 0.025 ) = 1.96 for standard normal distribution).
For example, in this case, when using α = 0.05 the corresponding quantile of the standard normal distribution is F 1 ( 0.975 ) = 1.96 .
Calculate the time bounds for Aircraft A:
t e a r l y A = 10 : 00 1.96 · 1 = 9 : 58.04 t l a t e A = 10 : 00 + 1.96 · 1 = 10 : 01.96
Calculate the time bounds for Aircraft B:
t e a r l y B = 10 : 03 1.96 · 1.5 = 10 : 00.06 t l a t e B = 10 : 03 + 1.96 · 1.5 = 10 : 05.94
(2)
Preceding and Succeeding Interval Bounds
Define interval boundaries representing time error ranges, as follows:
t = t n o r m t e a r l y ,   t + = t l a t e t n o r m
where t denotes the interval from the earliest passage time to the nominal time, and t + denotes the interval from the nominal time to the latest passage time. When μ d e v t = 0 the distribution is symmetric, the two intervals are equal:
t = t +
Error ranges for Aircraft A:
t A = t n o r m A t e a r l y A = 1.96   m i n ; t A + = t l a t e A t n o r m A = 1.96   m i n ;
Error ranges for Aircraft B:
t B = t n o r m B t e a r l y B = 2.94   m i n t B + = t l a t e B t n o r m B = 2.94   m i n
The error ranges are symmetrically distributed around the nominal time.
(3)
Latent Conflict Detection Model
Conflict determination between two UAVs, A and B, is based on time a difference that exceeds safety thresholds:
P t n o r m B t n o r m A t r e q α
t r e q T s a f e + t A + + t B +
where T s a f e denotes the minimum safe interval under error-free conditions t A + ,   t B + represents the time error bounds of the two aircraft, and t r e q denotes the minimum safe interval time considering uncertainty.
The time interval considering uncertainty is calculated as follows:
t r e q = T s a f e + A + + B + = 2 + 1.96 + 2.94 = 6.9   m i n
The actual nominal time difference is as follows:
t = t n o r m B t n o r m A = 3   m i n
Conflict determination: If t < T s a f e , a potential conflict exists.
(4)
Mathematical Derivation of Conflict Probability
Assuming that time difference t = t n o r m A t n o r m B follows a normal distribution, as follows:
Δ t ~ N μ a μ b , δ a 2 + δ b 2
The conflict probability is calculated as follows:
P | Δ t | t req = Φ t req ( μ a μ b ) δ a 2 + δ b 2 Φ t req ( μ a μ b ) δ a 2 + δ b 2
where Φ denotes the standard normal cumulative distribution function. A conflict is declared if P > β .
In this case t = t n o r m A t n o r m B ~ N 3 , δ A 2 + δ B 2 = N 3,3.25 , and the conflict condition is as follows:
t < T s a f e = 2 ;
P t < 2 = Φ 2 3 3.25 Φ 2 3 3.25 0.289 = 28.9 %
Assuming a threshold of 10% is set, since 28.9% > 10%, a potential conflict is determined.
As illustrated in Figure 2, although three aircrafts’ nominal flight plans show no conflicts under deterministic conditions, their TOP time intervals overlap when considering uncertainty, creating mutual conflicts. This necessitates flight plan adjustments to resolve these latent conflicts.

3. Critical Flight Plan Identification

Urban air mobility (UAM) flight plans exhibit high complexity and interdependencies due to dense traffic, where individual plans often conflict with multiple others. Adjusting these critical plans can significantly reduce overall conflicts. Given this complexity, macroscopic approaches struggle to identify critical plans, whereas complex network theory provides an effective tool. A conflict network G = V , E   is constructed with flight plans as nodes V = 1,2 , 3 , N and edges E representing conflicts. For plans a and b we find the following:
E a b = 1 E x i s t i n g   c o n f l i c t 0 N o   e x i s t i n g   c o n f l i c t

3.1. Critical Flight Plan Identification Methodology

The flight plan conflict network enables importance assessment and critical plan identification. Understanding interdependencies and individual-plan-to-collective relationships provides theoretical guidance for flight plan adjustments.
(1)
Eigenvector Centrality
Eigenvector centrality [29] posits that a node’s importance depends not only on its own degree but also on the importance of its connected nodes. The eigenvector centrality C e v i is defined as follows:
C e v i = 1 γ j = 1 n A j , i C e v j
where γ is a constant. Assuming C e = ( C e v 1 ,   C e v 2 ,   , C e v n ) T represents the centrality vector of all vertices, the equation can be rewritten as follows:
γ C e = A T C e
Here, C e serves as the eigenvector of the transposed adjacency matrix A T , with γ being the corresponding eigenvalue.
(2)
PageRank Algorithm
The PageRank algorithm developed by Google evaluates webpage importance in search engines [30]. The formula is as follows:
P R a i + 1 = i = 0 n P R T i i L T i
P R T i : PageRank value of nodes pointing to node a
L T i : Number of outgoing links from nodes pointing to node a ;
i : Iteration index
Initialization sets all nodes to 1/N (where N is total node count). Multiple iterations are required to reach convergence.
(3)
Degree Centrality
Degree centrality represents the most straightforward metric for quantifying node centrality in network analysis. A node with a higher degree centrality indicates greater importance within the network. The formula is as follows:
D C i = k i N 1
where
k i : Number of edges connected to node i ;
N 1 : Maximum possible edges from other nodes.
This normalized value ranges from 0 to 1, with higher values indicating stronger network engagement.
(4)
Betweenness Centrality
Betweenness centrality measures a node’s “intermediacy” in graph theory, reflecting its role as a bridge for information/resource flow. Nodes lying on many shortest paths between other node pairs exhibit higher betweenness. Normalized betweenness centrality is calculated by dividing C B v by ( n 1 ) ( n 2 ) 2 , yielding values between 0 and 1, as follows:
C B v = 2 / n 1 n 2 s v t V σ s t v / σ s t
where
σ s t : Total number of shortest paths from node s to t ;
σ s t v : Number of shortest paths from s to t passing through node v .

3.2. Critical Flight Plan Identification Methodology Validation

To further evaluate the practical impact of critical flight plans identified by different methods on conflict complex networks, global network metrics are calculated to validate node importance recognition accuracy. A degree-based attack sequential removal approach is adopted for structural analysis, where nodes (flight plans) are ranked by importance based on each metric and top-ranked nodes are progressively removed. By analyzing changes in remaining network connectivity, the structural disruption caused by critical node removal is quantified. This method provides an intuitive reflection of nodes’ core roles in conflict networks, effectively validating the reliability of critical flight plan identification results.

4. Flight Plan Optimization Strategy

4.1. Development of Flight Plan Optimization Model

4.1.1. Optimization Objective

The primary optimization objective of this study is to resolve latent conflicts arising from multi-aircraft operations. The first priority is minimizing the number of conflicts, calculated using the uncertainty-aware latent conflict detection method described in Section 2.2: The Objective Function is as follows:
m i n f T , V = i = 1 n 1 j = i + 1 n C p i , p j , t i , t j , v i , v j
where C p i , p j , t i , t j , v i , v j represents a binary conflict indicator between aircraft p i and p j (0 = no conflict, 1 = conflict exists).

4.1.2. Adjustment Strategies

Optimizing flight plans through departure time and speed adjustments exerts distinct impacts on four-dimensional aircraft trajectories (3D spatial coordinates + time dimension):
  • Speed-Only Adjustment
Modifying flight speed dynamically alters travel time and arrival schedules. Reducing speed increases flight duration, delaying arrival times; conversely, accelerating shortens travel time. Departure times remain unchanged while spatial positions shift along the time dimension.
  • Departure Time-Only Adjustment
Shifting departure times results in time–axis translation of entire flight plans. Delaying takeoff shifts the four-dimensional trajectory backward, maintaining total flight duration but causing arrival delays. Advanced takeoffs similarly advance the entire trajectory.
  • Joint Departure Time and Speed Adjustment
This combined optimization introduces complex spatiotemporal trajectory changes. For example:
Delayed departure + reduced speed → significant arrival delay
Advanced departure + increased speed → potential total time reduction
Such multi-variable adjustments require balancing temporal shifts and speed changes to optimize conflict mitigation while maintaining operational coordination.
These differentiated adjustment strategies provide optimization flexibility but necessitate precise modeling of dynamic trajectory changes to ensure accurate conflict detection and resolution.

4.1.3. Model Constraints

P = p 1 , p 2 , , p n
W = w 1 , w 2 , , w m
T = t 1 , t 2 , , t n ,   t i [ 1 , 120 ] min
V = v 1 , v 2 , , v n ,   v i [ 60 , 150 ] km / h
t D t D m a x
t z t z m a x
P : Set of waypoints or takeoff/landing points, with waypoints evenly distributed across urban airspace.
W : Set of valid flight routes following realistic network structures, connecting at least two waypoints/takeoff–landing points. Routes must not contain head-on flight plans (i.e., no unsolvable conflicts).
( t D t D , max = 2   h ) : Maximum allowable departure delay;
( t z t z , max = 2   h ) : Maximum allowable airborne duration;
( T min T T max ) : Departure time window;
( V min V V max ) : Speed envelope constraint.

4.2. Staged Optimization Solution

In uncertainty-aware flight conflict detection, the inclusion of probabilistic position intervals significantly increases detection conservatism, leading to both surging conflict counts and strong conflict interdependencies. Traditional pairwise conflict resolution strategies suffer from exponentially increasing computational complexity, causing a prolonged algorithm runtime. Additionally, global adjustments force all flight plans to undergo spatiotemporal changes, exacerbating system coordination challenges. Further analysis reveals that the conflict detection phase represents the core bottleneck in algorithm efficiency. Each optimization iteration requires simulating all four-dimensional aircraft trajectories and performing full conflict pair checks. Exploration of multi-dimensional solution spaces involving different departure times and speed combinations creates a dual-growth problem (conflict counts × decision variables), making convergence difficult.
To address this challenge, this paper proposes a staged optimization strategy to enhance algorithm efficiency, as follows:
(1)
Critical Plan Prioritization
Focus first on critical flight plans identified through complex network theory. Proactive adjustments to their departure times and speeds systematically eliminate cascading conflicts. By targeting high-impact nodes with minimal decision variable dimensions (optimizing only key nodes), this approach avoids inefficient global searches across all plans.
(2)
Non-Critical Plan Local Optimization
Subsequent local conflict resolution for remaining non-critical plans involves only speed adjustments, further reducing computational complexity.
This hierarchical optimization strategy not only controls decision variable dimensions but also achieves significant conflict reduction through high-impact node prioritization. The result is a balanced solution combining algorithm efficiency and solution quality.

4.3. Optimization Solution Based on Artificial Lemming Algorithm

Xiao et al. [26] (January 2025) proposed a novel bio-inspired algorithm, the artificial lemming algorithm (ALA), inspired by four natural lemming behaviors: long-distance migration, burrowing, foraging, and predator evasion. This algorithm features strong exploration capability and fast convergence speed, making it suitable for solving flight plan conflict optimization in urban air mobility. Key algorithmic steps include the following:
Suppose we have three initial flight plans ( F P 1 ,   F P 2 ,   F P 3 ) , with scheduled departure times T and speeds V , as follows:
F P 1 :   T 1   = 10 : 00 : 00 ,   V 1 = 60   k m / h F P 2 :   T 2   = 10 : 05 : 00 ,   V 2 = 70   k m / h F P 3 :   T 3   = 10 : 10 : 00 ,   V 3 = 80   k m / h
Simulation results show that this parameter set causes a conflict between F P 1 and F P 2 in one airway segment, and a conflict between F P 2 and F P 3 in another segment, resulting in a total of 2 conflicts.
Initialization: Generate NL “lemmings” (search agents). Each lemming represents a complete solution, i.e., a set of parameters for all flight plans. For example, the position X i of lemming i can be expressed as a vector, as follows:
X i = [ T 1 i ,   V 1 i ,   T 2 i , V 2 i , T 3 i ,   V 3 i ]
Randomly initialize the T and V values for each lemming within the constraint range. Determine the optimal solution Z b e s t in the initial population (the solution with the fewest conflicts). Assume the initial optimal solution Z b e s t still has one conflict.
(1)
Long-Distance Migration (Global Exploration via Brownian Motion)
Z i t + 1 = Z b e s t t + F · B M · R · Z b e s t t Z i t + 1 R · Z i t Z a t
f B M x ;   0 ,   1   =   1 2 π   ·   exp x 2 2
R = 2 · rand 1 , Dim 1
F = 1 i f   2 · r a n d + 1 = 1 1 i f   2 · r a n d + 1 = 2
where Z i t + 1 represents the position of the i t h search agent at iteration ( t + 1 ) ;   Z best t represents the current optimal solution; F represents the directional change factor to avoid local optima and enhance problem domain exploration; B M represents a Brownian motion random vector with step sizes derived from a normal distribution (mean = 0, variance = 1); R represents a random vector generated using Equation (27); and ( . ) represents a floor function for downward rounding. This behavior mimics lemming seasonal migrations, enabling global search through probabilistic exploration while leveraging current best solutions for directional guidance.
When lemming i executes migration, its entire solution vector X i = [ T 1 i ,   V 1 i ,   T 2 i , V 2 i , T 3 i ,   V 3 i ] undergoes large, random changes. These changes are attracted by the current optimal solution Z b e s t but also include significant random exploration components (see Equations (25) and (26)). For example, this might involve drastically advancing or delaying the departure time T 1 i of FP1 while adjusting the speed V 2 i of FP2, attempting a scheduling strategy that could be completely different from the current Z b e s t . This process aims to search for entirely new, potentially conflict-free (T, V) combination patterns across a wide range.
(2)
Burrowing (Local Refinement Toward Global Optimum)
Z i t + 1 = Z i t + F · L · Z b e s t t Z b t
L = rand · 1 + sin t 2
where the following apply:
L : Random number correlated with current iteration count;
Z b t : Randomly selected search agent from the population;
b : Random integer index between 1 and N L .
When lemming i executes burrowing, its solution moves toward the current optimal Z b e s t solution but is influenced by another randomly selected lemming Z b . This means lemming I attempts to adjust its T and V values to better approximate the current best (least-conflict) T and V combinations found. For instance, if Z b e s t has a slightly later T 2 and a faster V 1 compared with X i , the T 2 and V 1 in X i will be adjusted toward Z b e s t ’s values. However, the adjustment magnitude is perturbed by the position of Z b and a random factor b , which introduces diversity and prevents all lemmings from directly converging to Z b e s t .
(3)
Foraging (Spiral Search Strategy)
Z i t + 1 = Z b e s t t + F · s p i r a l · r a n d · Z i t
s p i r a l = r a d i u s · sin 2 · π · rand + cos 2 · π · rand
r a d i u s = j = 1 D i m z b e s t , j t z i , j t 2
where ( radius ) represents the Euclidean distance between the current position and the optimum.
This behavior models lemming food search patterns, combining directed movement toward the optimum with spiral-shaped random exploration to balance exploitation and exploration.
When lemming i executes foraging (which is more likely to occur in later iteration stages when the parameter E is small), it performs a fine-grained local search around the current optimal solution Z b e s t . It calculates the distance D in the solution space between itself and Z b e s t (representing the comprehensive difference in T and V), then updates its position through a spiral equation. This is equivalent to performing fine-tuning on the (T, V) combination represented by Z b e s t .
(4)
Predator Evasion (Flight Exploration)
Z i t + 1 = Z b e s t t + F · G · L e v y D i m · Z b e s t t Z i t
G = 2 · 1 t T m a x
L e v y x = 0.01 × u · σ ν 1 β , σ = Γ 1 + β · sin π β 2 Γ 1 + β 2 · β × 2 β 1 2 1 β
where the following apply:
G: Lemming escape coefficient;
T max : Maximum number of iterations;
Levy : Lévy flight functio defined by: ( Levy β = u v 1 / β ,   u , v U 0,1 , β = 1.5 ) .
When lemming i executes predator avoidance (which is also more critical in later iteration stages or when trapped in a local optimum), it performs a jump using Lévy flight. Lévy flight is characterized by short-distance movements and occasional long-distance jumps. G is an escape coefficient that increases with the number of iterations. This means lemming i will make a random jump based on the difference between its own solution and the optimal solution Z b e s t , with the jump’s distance and direction following Lévy distribution properties (potentially very large). This serves as a mechanism to escape local optimum traps. For example, if the algorithm remains stuck near a solution Z b e s t with one conflict for a long time without improvement, a lemming executing this operation might drastically change the speed V 3 i or departure time T 3 i of FP3, breaking out of the current search region and testing an extreme parameter combination that was previously unexplored but could lead to zero conflicts.
(5)
Energy Factor for Behavioral Transition
An energy factor E t is introduced to facilitate smooth transitions between burrowing and foraging behaviors. Early iterations prioritize global exploration (long-distance migration), while later stages emphasize exploitation (foraging/predator evasion). This adaptive mechanism prevents premature convergence to local optima by dynamically balancing exploration-exploitation trade-offs, as follows:
E t = 4 · arctan 1 t T m a x · ln 1 rand
In the early stages of iteration (when t is small), the energy factor E is large, and the algorithm tends to perform highly exploratory behaviors (long-distance migration, burrowing) to extensively search the possible solution space. As the number of iterations t increases, E gradually decreases, and the algorithm is more inclined to perform highly exploitative behaviors (foraging, predator avoidance) to conduct a fine-grained search in the relatively optimal regions that have been discovered. This ensures that the algorithm does not prematurely get trapped in a local optimum in the early stage (for example, only resolving the conflict between FP1 and FP2 while ignoring the conflict between FP2 and FP3), but instead first searches widely for various possible (T, V) combinations.
This algorithm does not optimize existing algorithms but instead creates a novel framework by mathematically modeling four distinct lemming behaviors with integrated applications. Unlike previous methods relying on velocity updates and differential mutation, ALA’s energy-driven strategy enables dynamic parameter adjustments during optimization tasks. Traditional search behaviors often use static/linear schedules prone to premature convergence.
Algorithm Advantages: Particularly suitable for multi-dimensional flight plan optimization (speed, time). ALA’s adaptive exploration-exploitation balance enables efficient high-dimensional search, demonstrating superior convergence and robustness compared with traditional algorithms (PSO, GA). This provides an optimization tool balancing computational efficiency and solution quality for UAM conflict resolution.

5. Simulation Experiments

5.1. Design of the Simulation Experiment Environment

In this simulation experiment, a low-altitude urban area spanning 100 km × 100 km horizontally at a fixed altitude of 1000 m is selected. Waypoints and takeoff/landing points are generated through a combination of grid layout and random points. This approach is used to mimic the typical topological structure of an urban air traffic network, with an approximate spacing of 10 km between these points (as shown in Figure 3). Based on these waypoints, 60 fixed aircraft routes are created (as depicted in Figure 4). Each route consists of takeoff/landing points, a sequence of waypoints, and a heading.
Sixty flight plans are developed according to the generated routes, with one plan assigned to each aircraft. The takeoff times of all flight plans are randomly generated within a time window of 0–180 min. The flight speed of the aircraft is set within the range of 60–150 km/h. The minimum conflict time interval t c is 5 min. To avoid significant deviations from the original plans, the maximum allowable adjustment for the takeoff time t d is 2 h. The total flight time of a single aircraft, from takeoff to landing, should not exceed t m = 2 h.
Directional constraints are applied to the waypoints to guarantee that aircraft on the same route have consistent headings, thus preventing counter-directional flights. Only two types of conflicts are retained in the simulation: intersection conflicts, which occur at the convergence points of different routes, and intra-route overtaking conflicts, which happen when the distance between consecutive aircraft on the same route is insufficient.

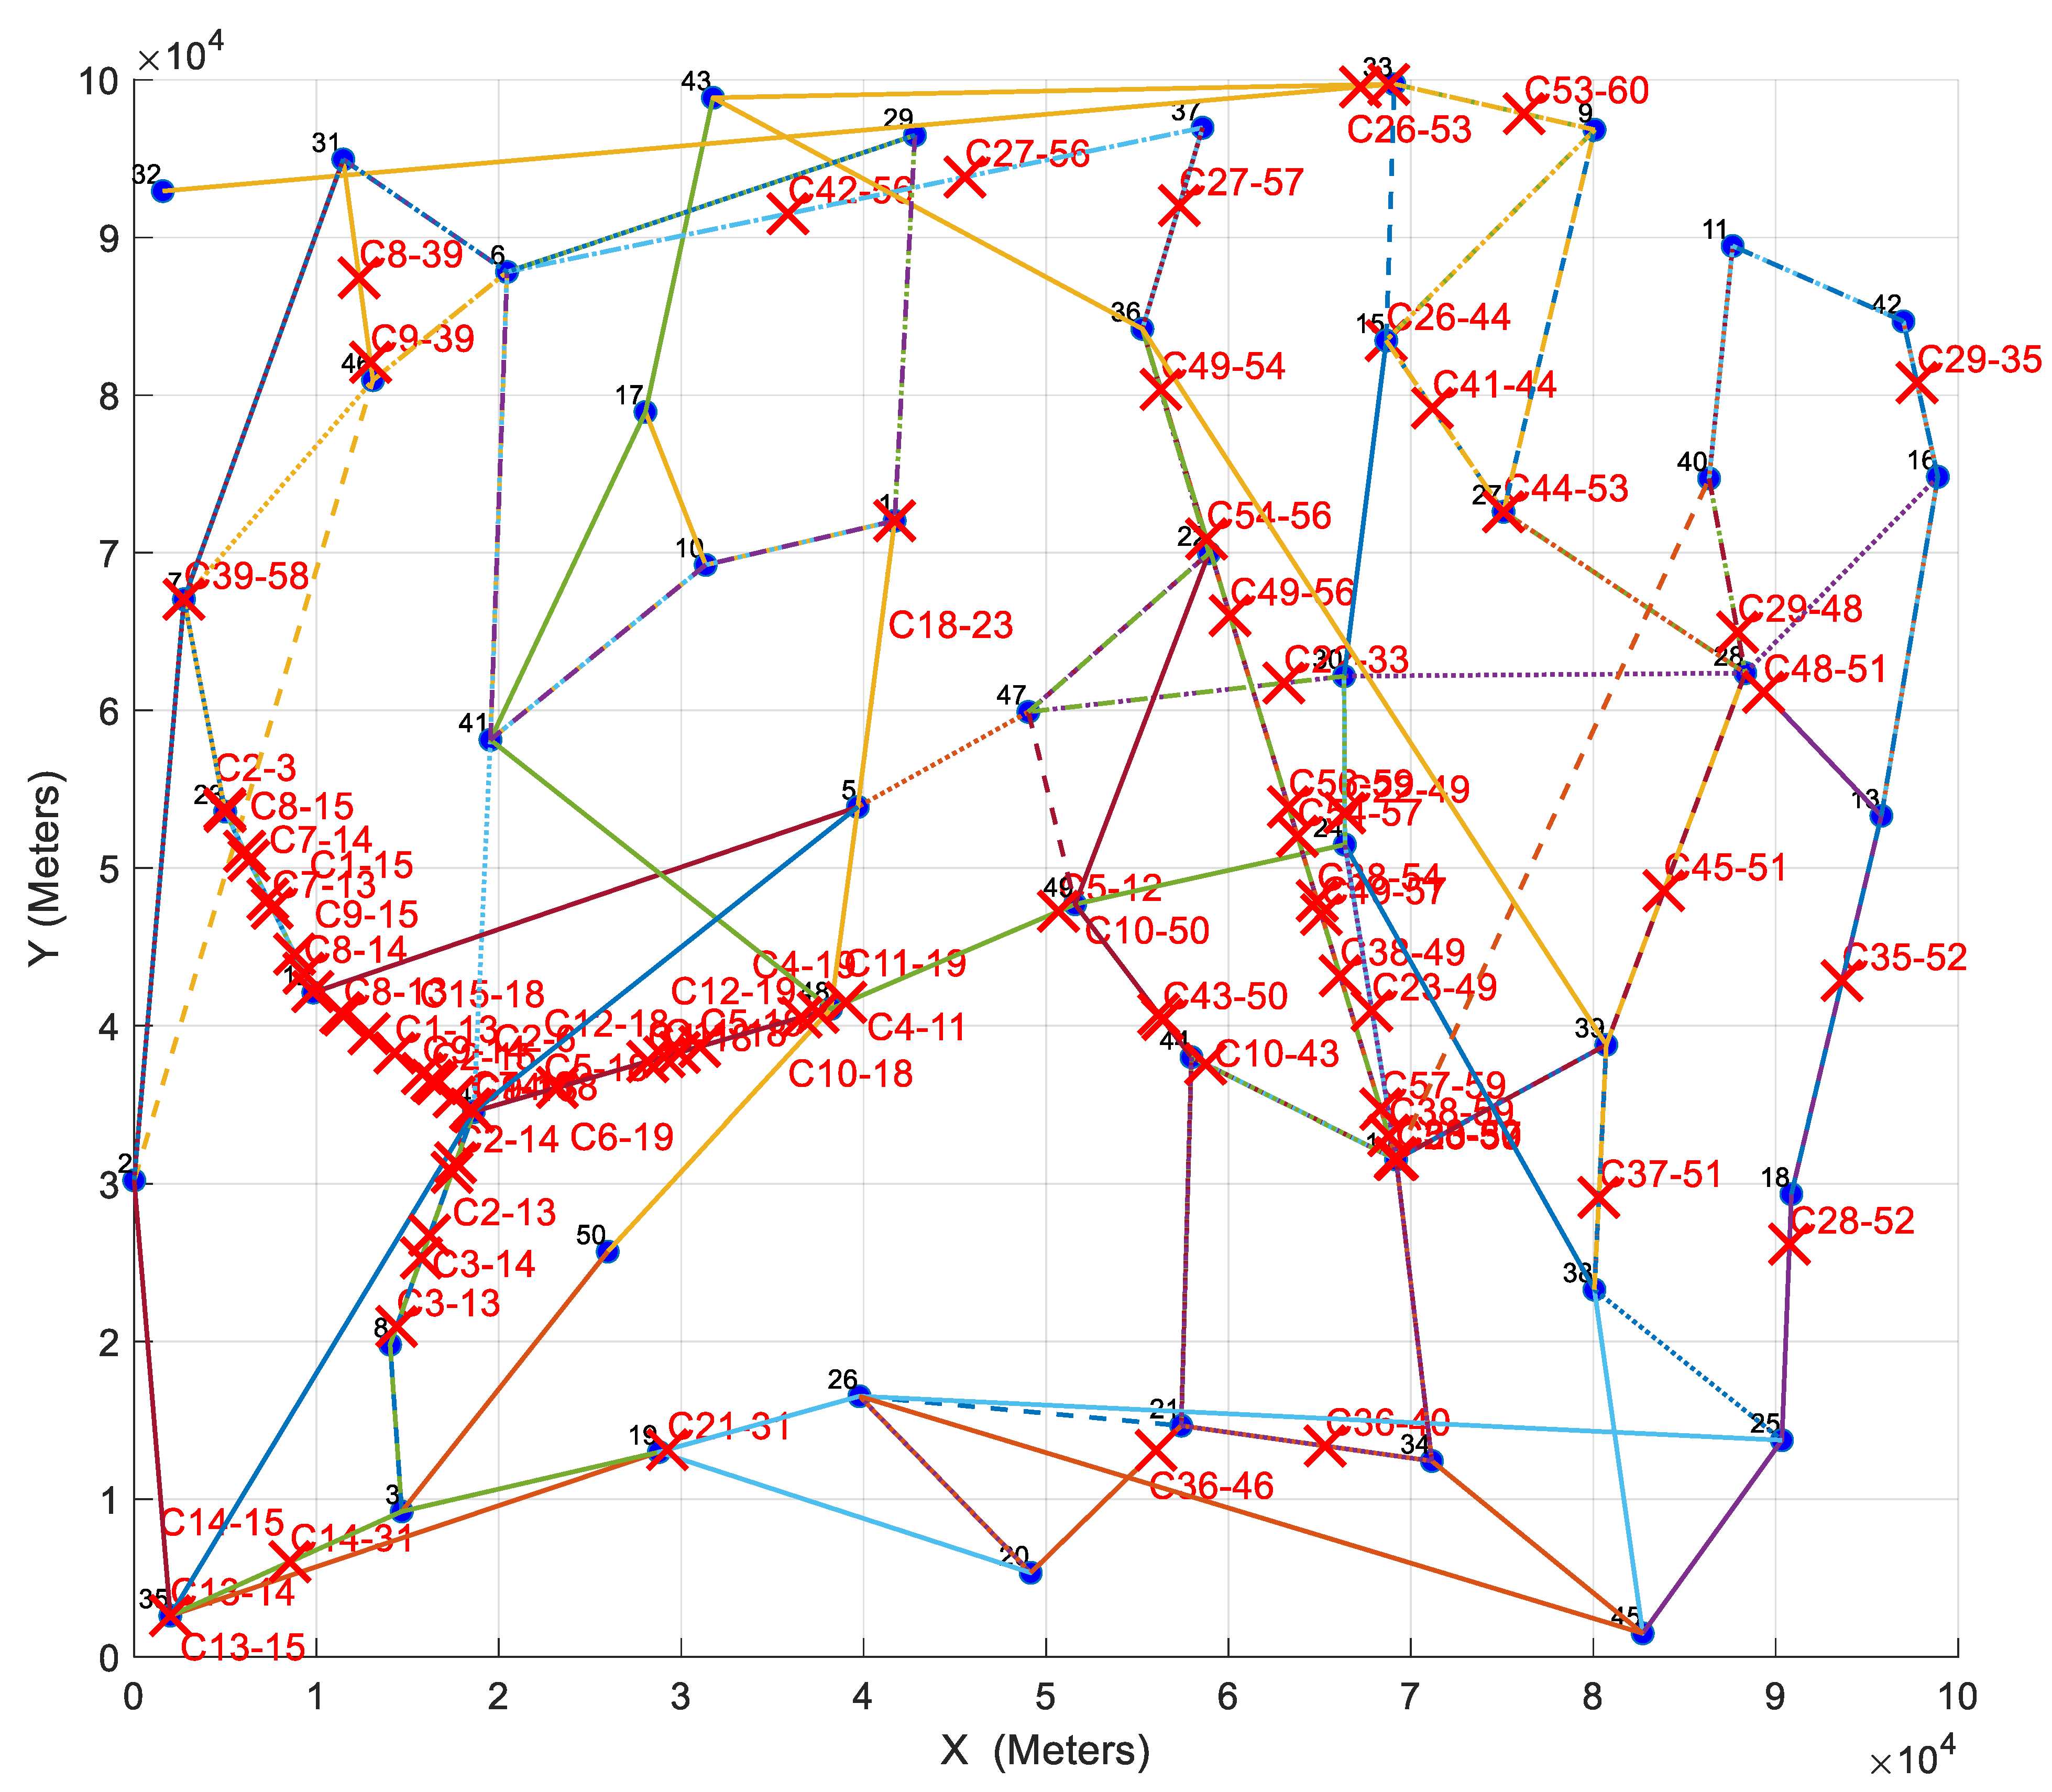
5.2. Conflict Identification Based on Uncertainty Principle

Using the uncertainty-aware conflict detection method described in Section 2.2, four-dimensional trajectory conflict analysis was performed on the generated flight plans. The results are shown in Figure 5. The simulation scenario identified 86 conflict points, marked with conflicting flight plan numbers. The analysis reveals clustered conflict zones in certain segments, primarily caused by multiple flight plans sharing common waypoints/segments, significantly increasing spatiotemporal trajectory overlap probabilities. This also highlights that shared-route plans exhibit stronger path dependencies, making their trajectory deviations or scheduling delays prone to triggering cascading conflicts, thus becoming system vulnerability nodes. These findings validate the effectiveness of critical plan identification methods while providing data support for subsequent optimization priority setting.
The traditional conflict detection method based on a deterministic time interval t c = 5 min (Figure 6) only identified 11 conflict points. However, after adopting the uncertainty principle model described in Section 2.2, the number of detected conflicts increased to 86 (Figure 5). This significant difference in magnitude (approximately 7.8 times) clearly shows that the traditional method only identifies conflicts with definite position overlaps within a fixed time window. In contrast, the uncertainty model can identify potential conflict-risk areas in advance by calculating the overlapping probability of the confidence intervals of the aircraft’s four-dimensional trajectories, thus providing the system with more sufficient safety redundancy. This result validates the effectiveness of the uncertainty principle in enhancing the comprehensiveness of conflict detection in the complex urban airspace environment.

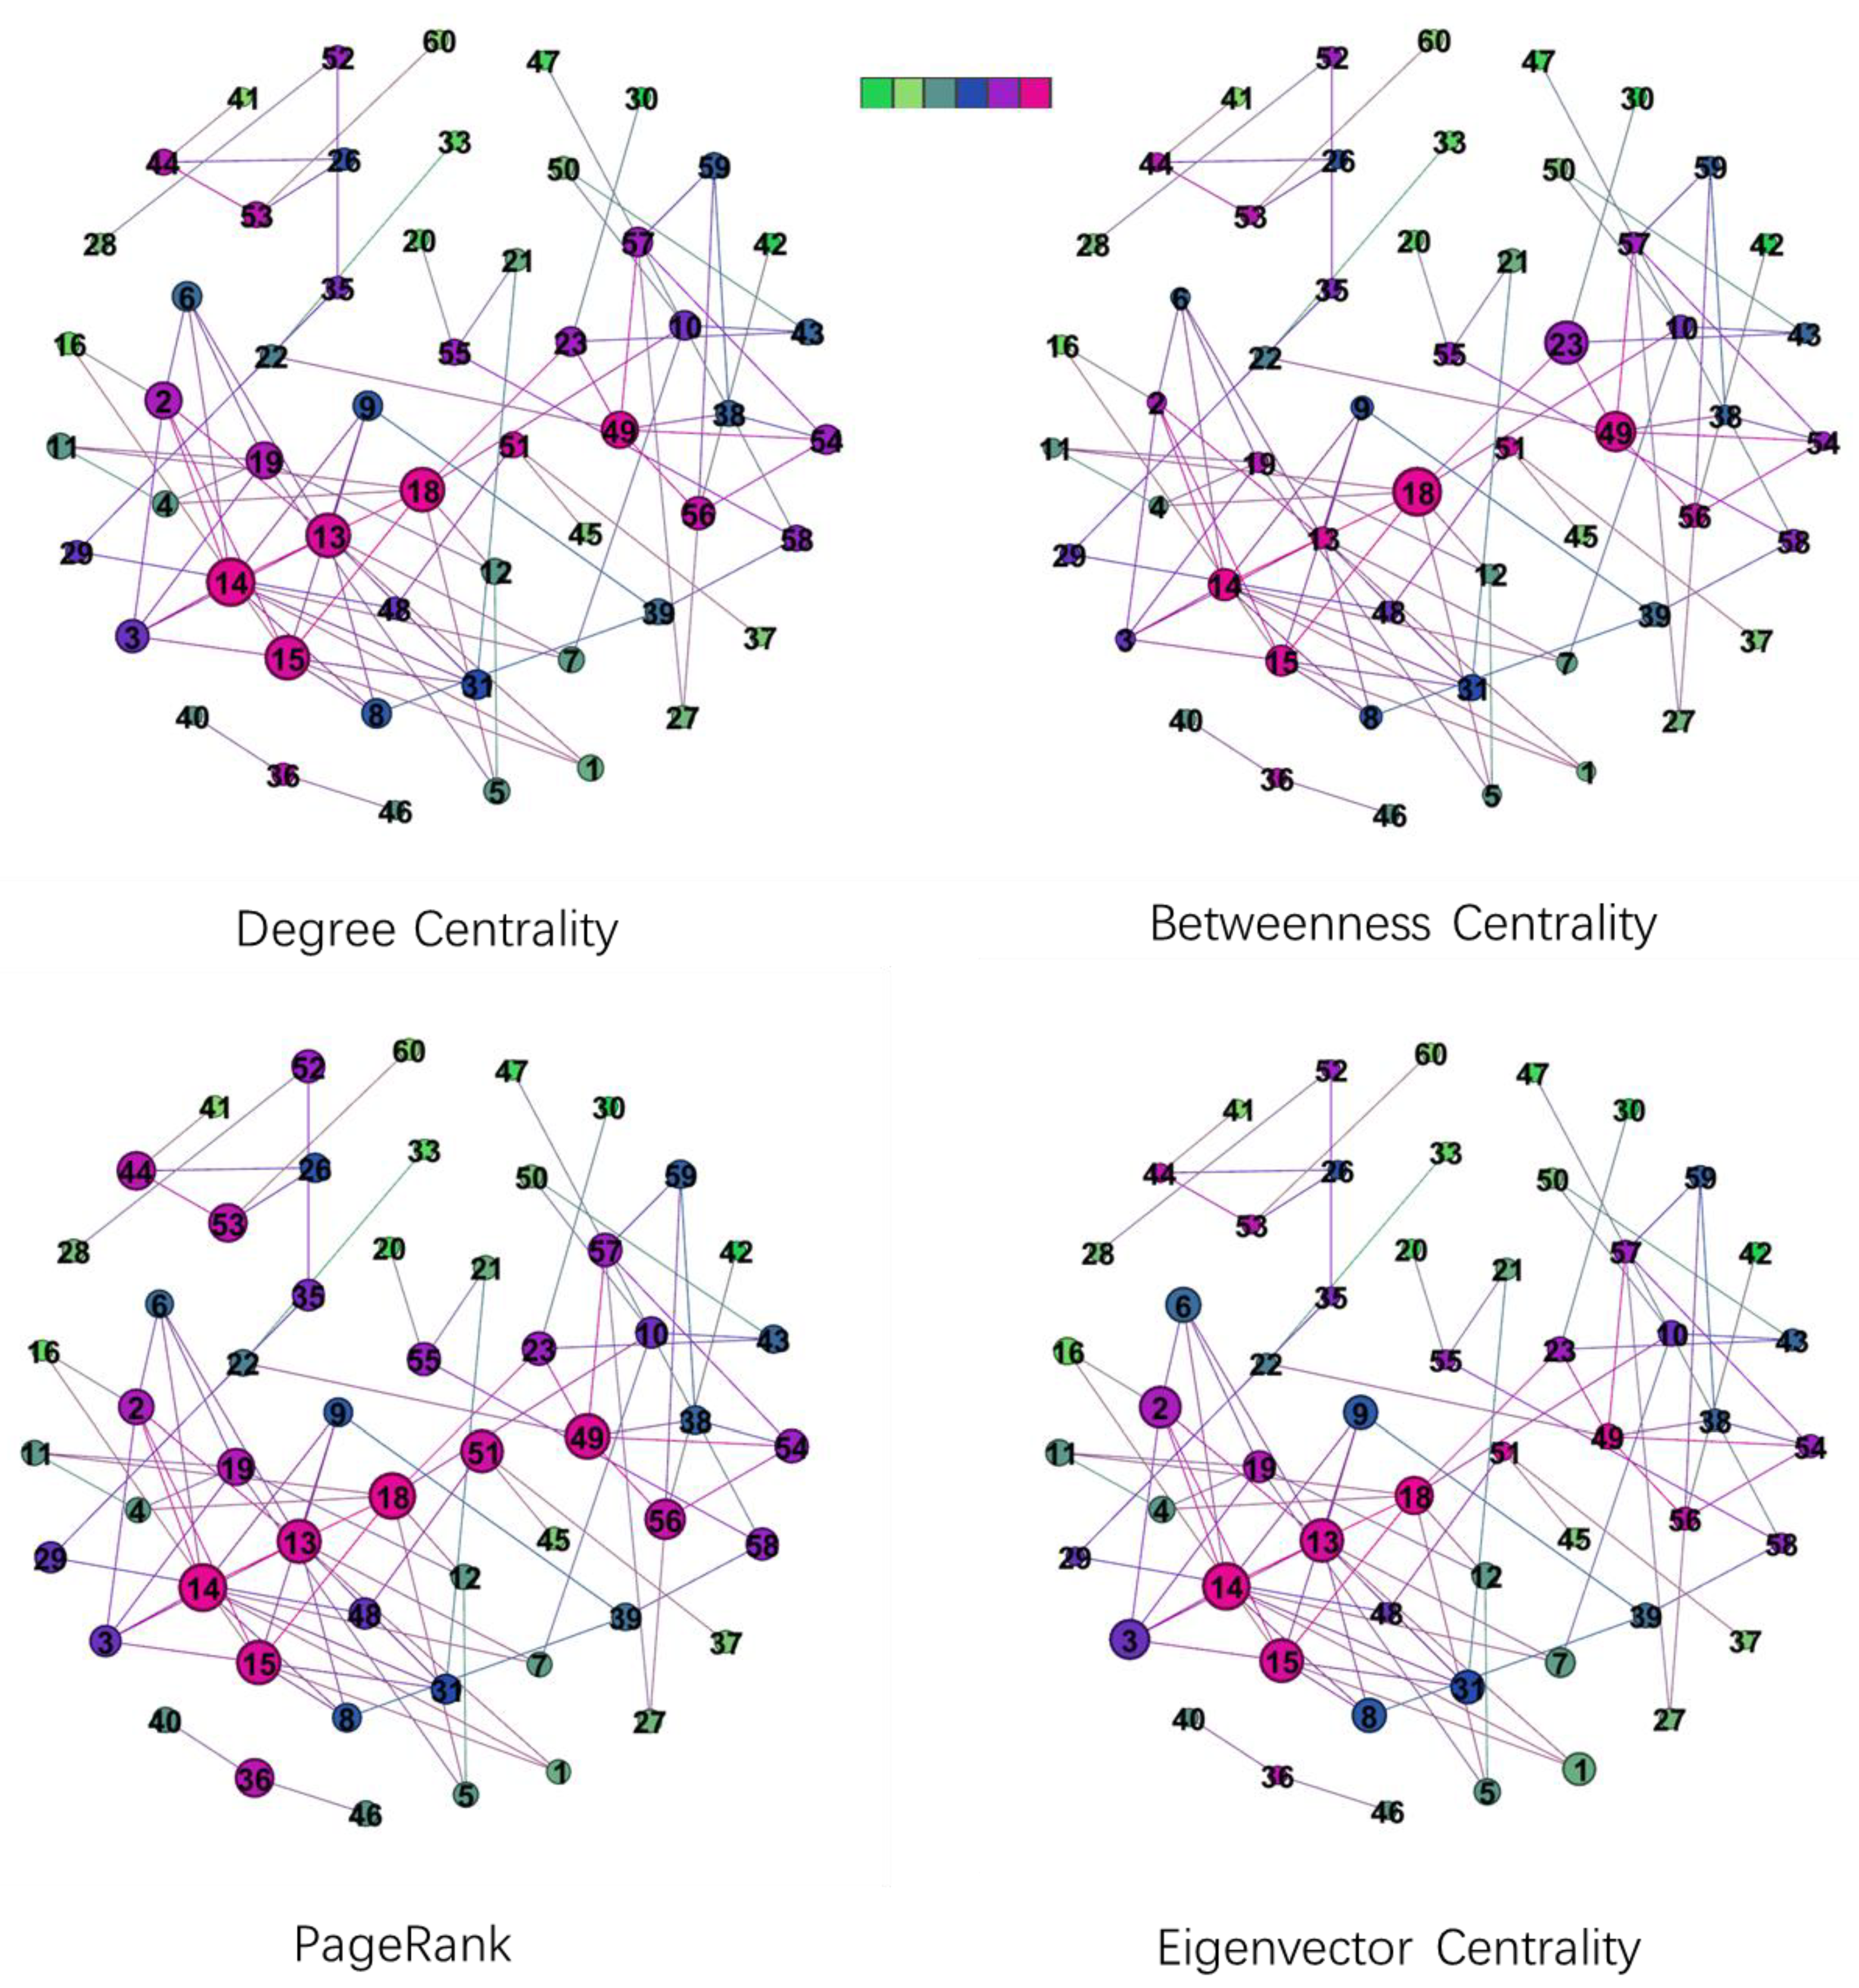
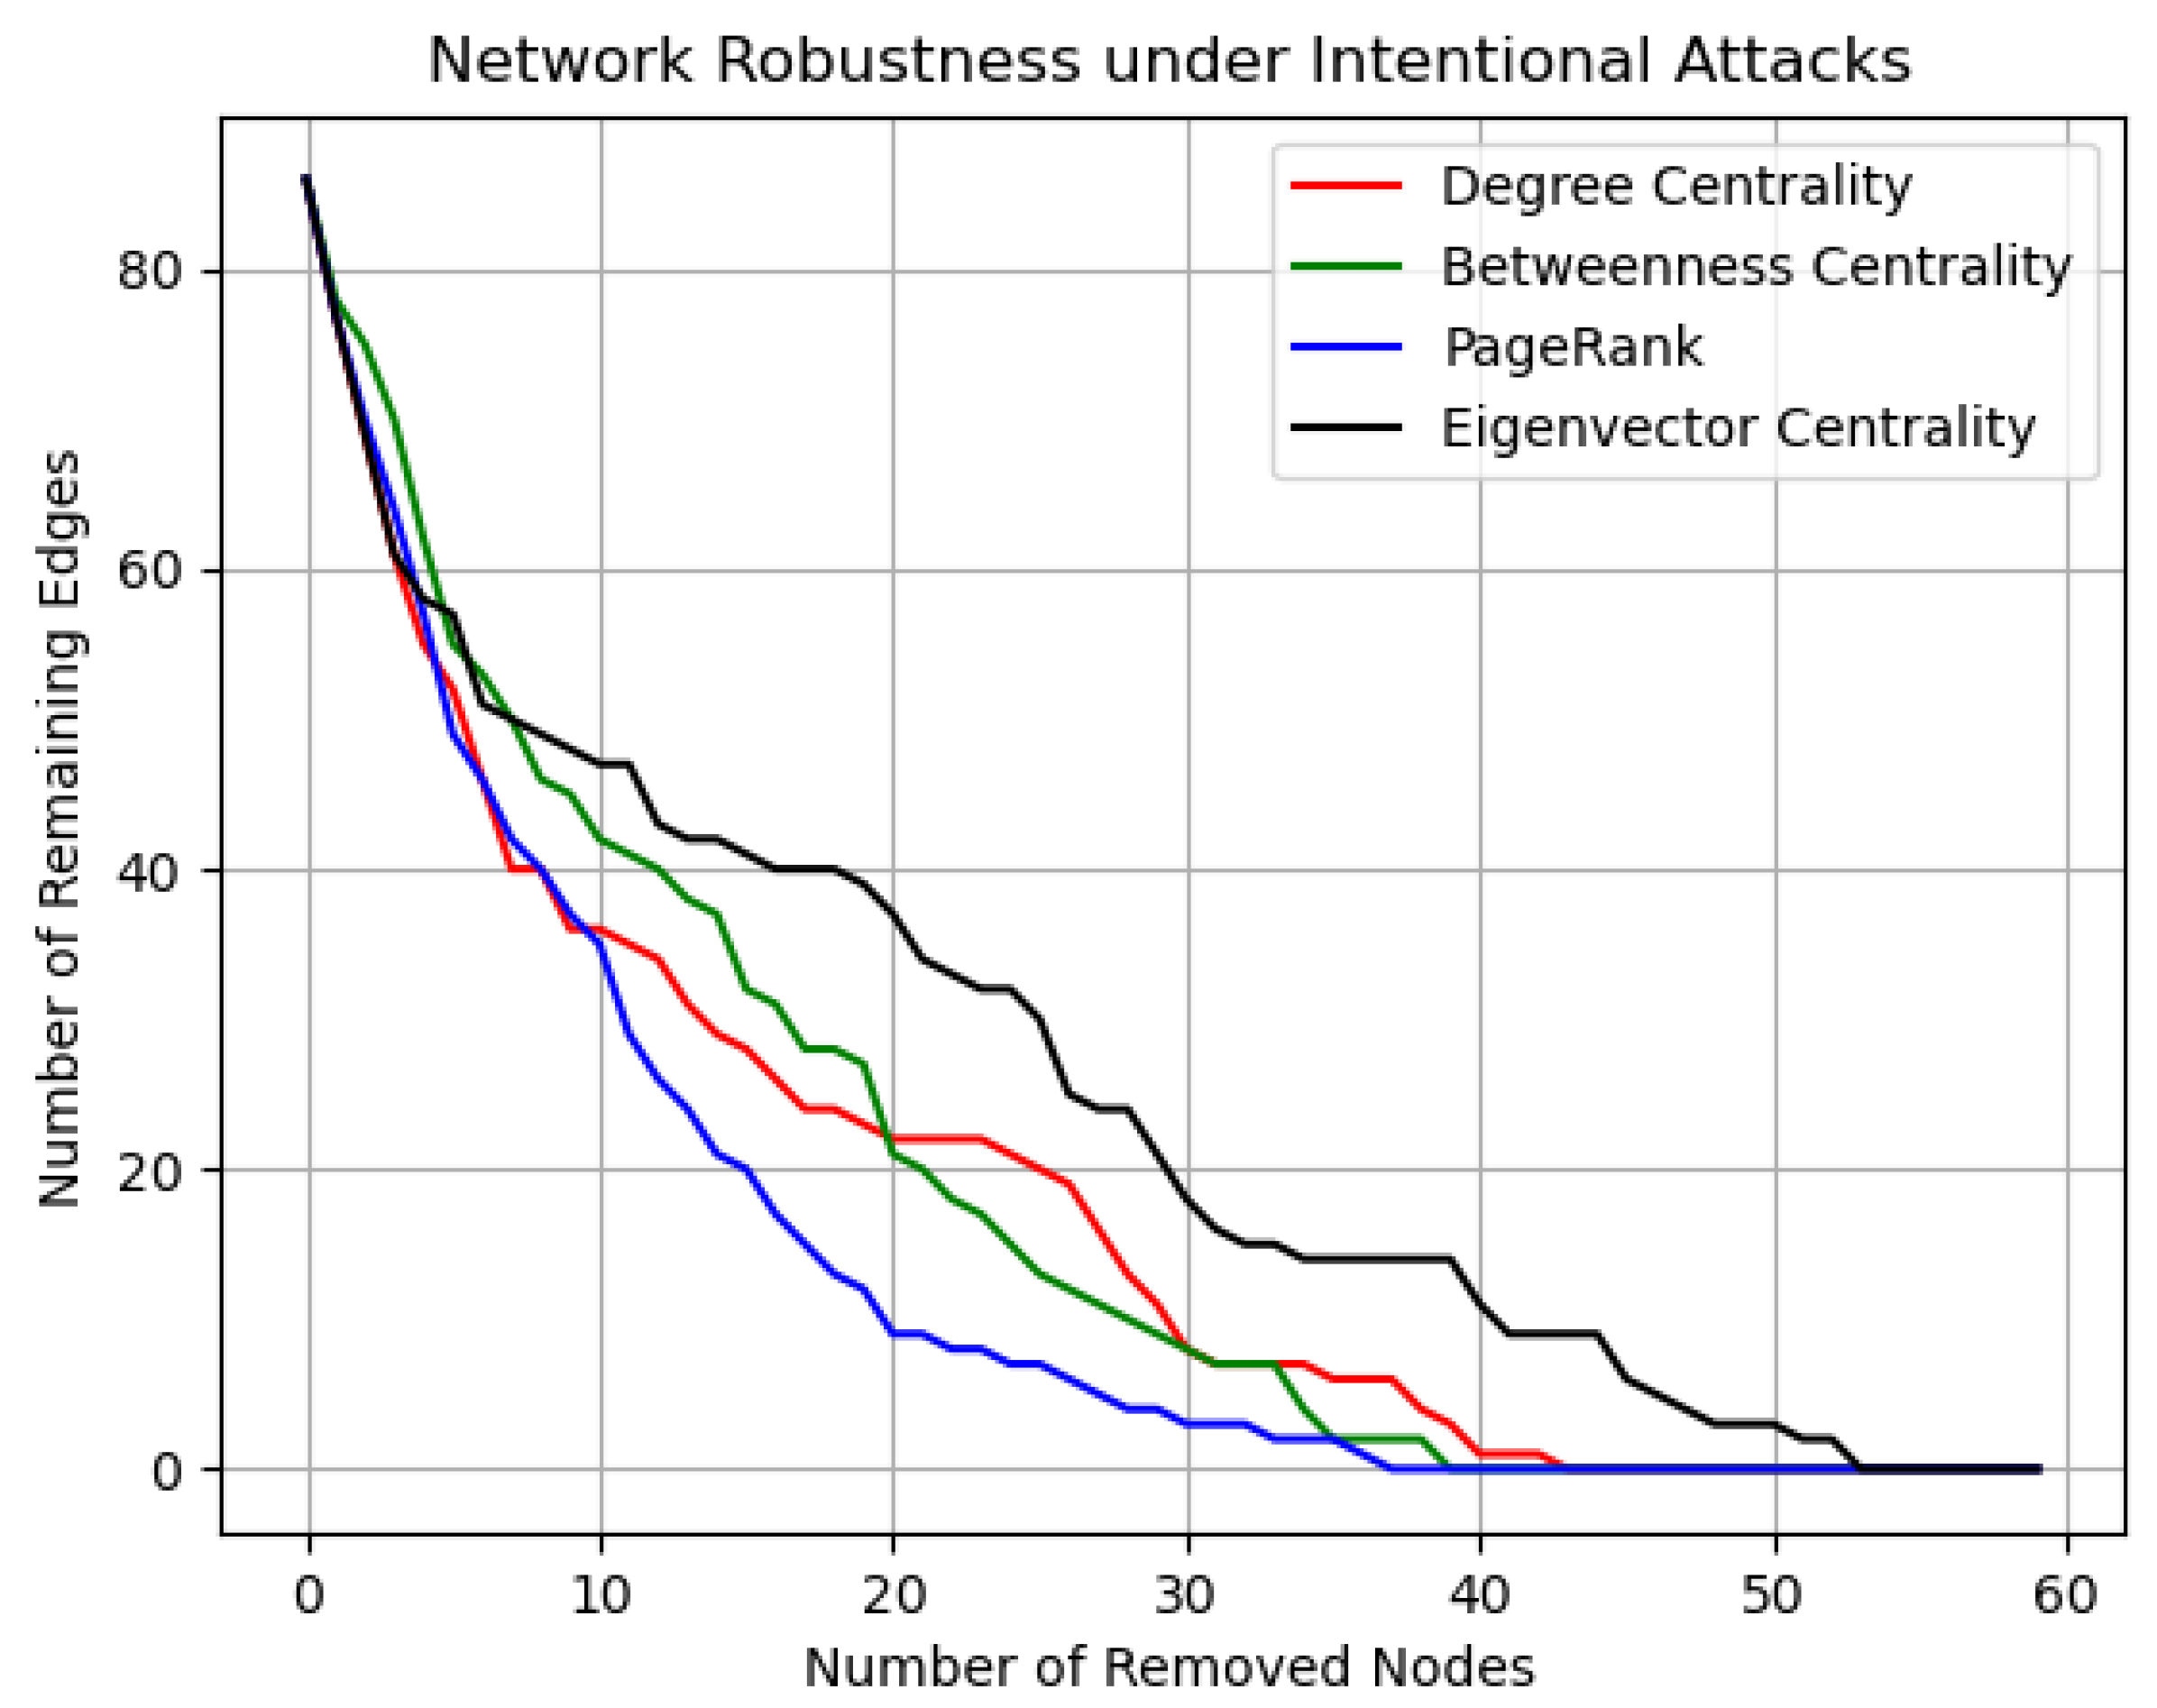
5.3. Critical Flight Plan Identification

To identify critical flight plans, this paper constructs a flight plan conflict network model based on uncertainty-aware conflict relationships. Nodes represent flight plans, with undirected weighted edges established between nodes if their four-dimensional trajectories exhibit a confidence interval overlap (Figure 7). The network is visualized using the Fruchterman–Reingold (FR) force-directed layout algorithm, which simulates particle physics principles, as follows:
Nodes = charged particles repelling each other (avoiding overlaps)
Edges = spring forces maintaining topological connections
This minimizes global network energy to reveal conflict intensity and community structures.
Node importance is evaluated using eigenvector centrality, betweenness centrality, degree centrality, and PageRank. Darker node colors indicate higher importance (Figure 7).
Based on the comparative analysis of the node importance rankings in Table 1, it can be seen that, although different centrality indicators vary in quantifying node priorities, some core nodes (such as Plans 14, 18, and 15) rank among the top 10 in all methods. To systematically evaluate the adaptability of each indicator to the conflict network, this paper conducts experimental verification using the sequential attack method proposed in Section 3.2. By gradually removing the nodes with the highest importance rankings under each indicator and recording the decay curves of the remaining number of edges in the network, the efficiency of different methods in destroying the network structure is quantified (Figure 8). The experimental results show that PageRank centrality demonstrates the optimal network deconstruction ability in the node removal experiment. The decline slope of the remaining number of edges in the network is higher than that of other indicators, indicating that it has a stronger destructive effect on the topological vulnerability of the conflict network.
This result validates the unique advantage of PageRank centrality in the conflict network. Through its global information dissemination mechanism, it can not only capture the direct connection strength of nodes but also quantify the indirect influence of nodes in complex paths, thereby more accurately identifying the critical flight plans that play a decisive role in the stability of the overall conflict network. Therefore, PageRank centrality is selected as the core indicator for identifying critical flight plans in this paper, providing a theoretical basis for the priority division of subsequent optimization strategies.
Select the top 10 flight plans ranked by PageRank as the critical plans. Mark the flight paths of the critical plans in the route network diagram, where thick lines represent the routes of the critical plans, thin lines represent the routes of other flight plans, and the conflict locations are marked as crosses in the diagram. From this diagram, it can be found that there are 68 route conflicts for the critical flight plans, accounting for 79.1% of the total number of conflicts. Therefore, resolving the conflicts of the critical plans helps to reduce the number of conflicts in the entire route network. Meanwhile, it can improve the running efficiency of the algorithm and reduce the running time. The flight paths of the critical flight plans are shown in Figure 9.

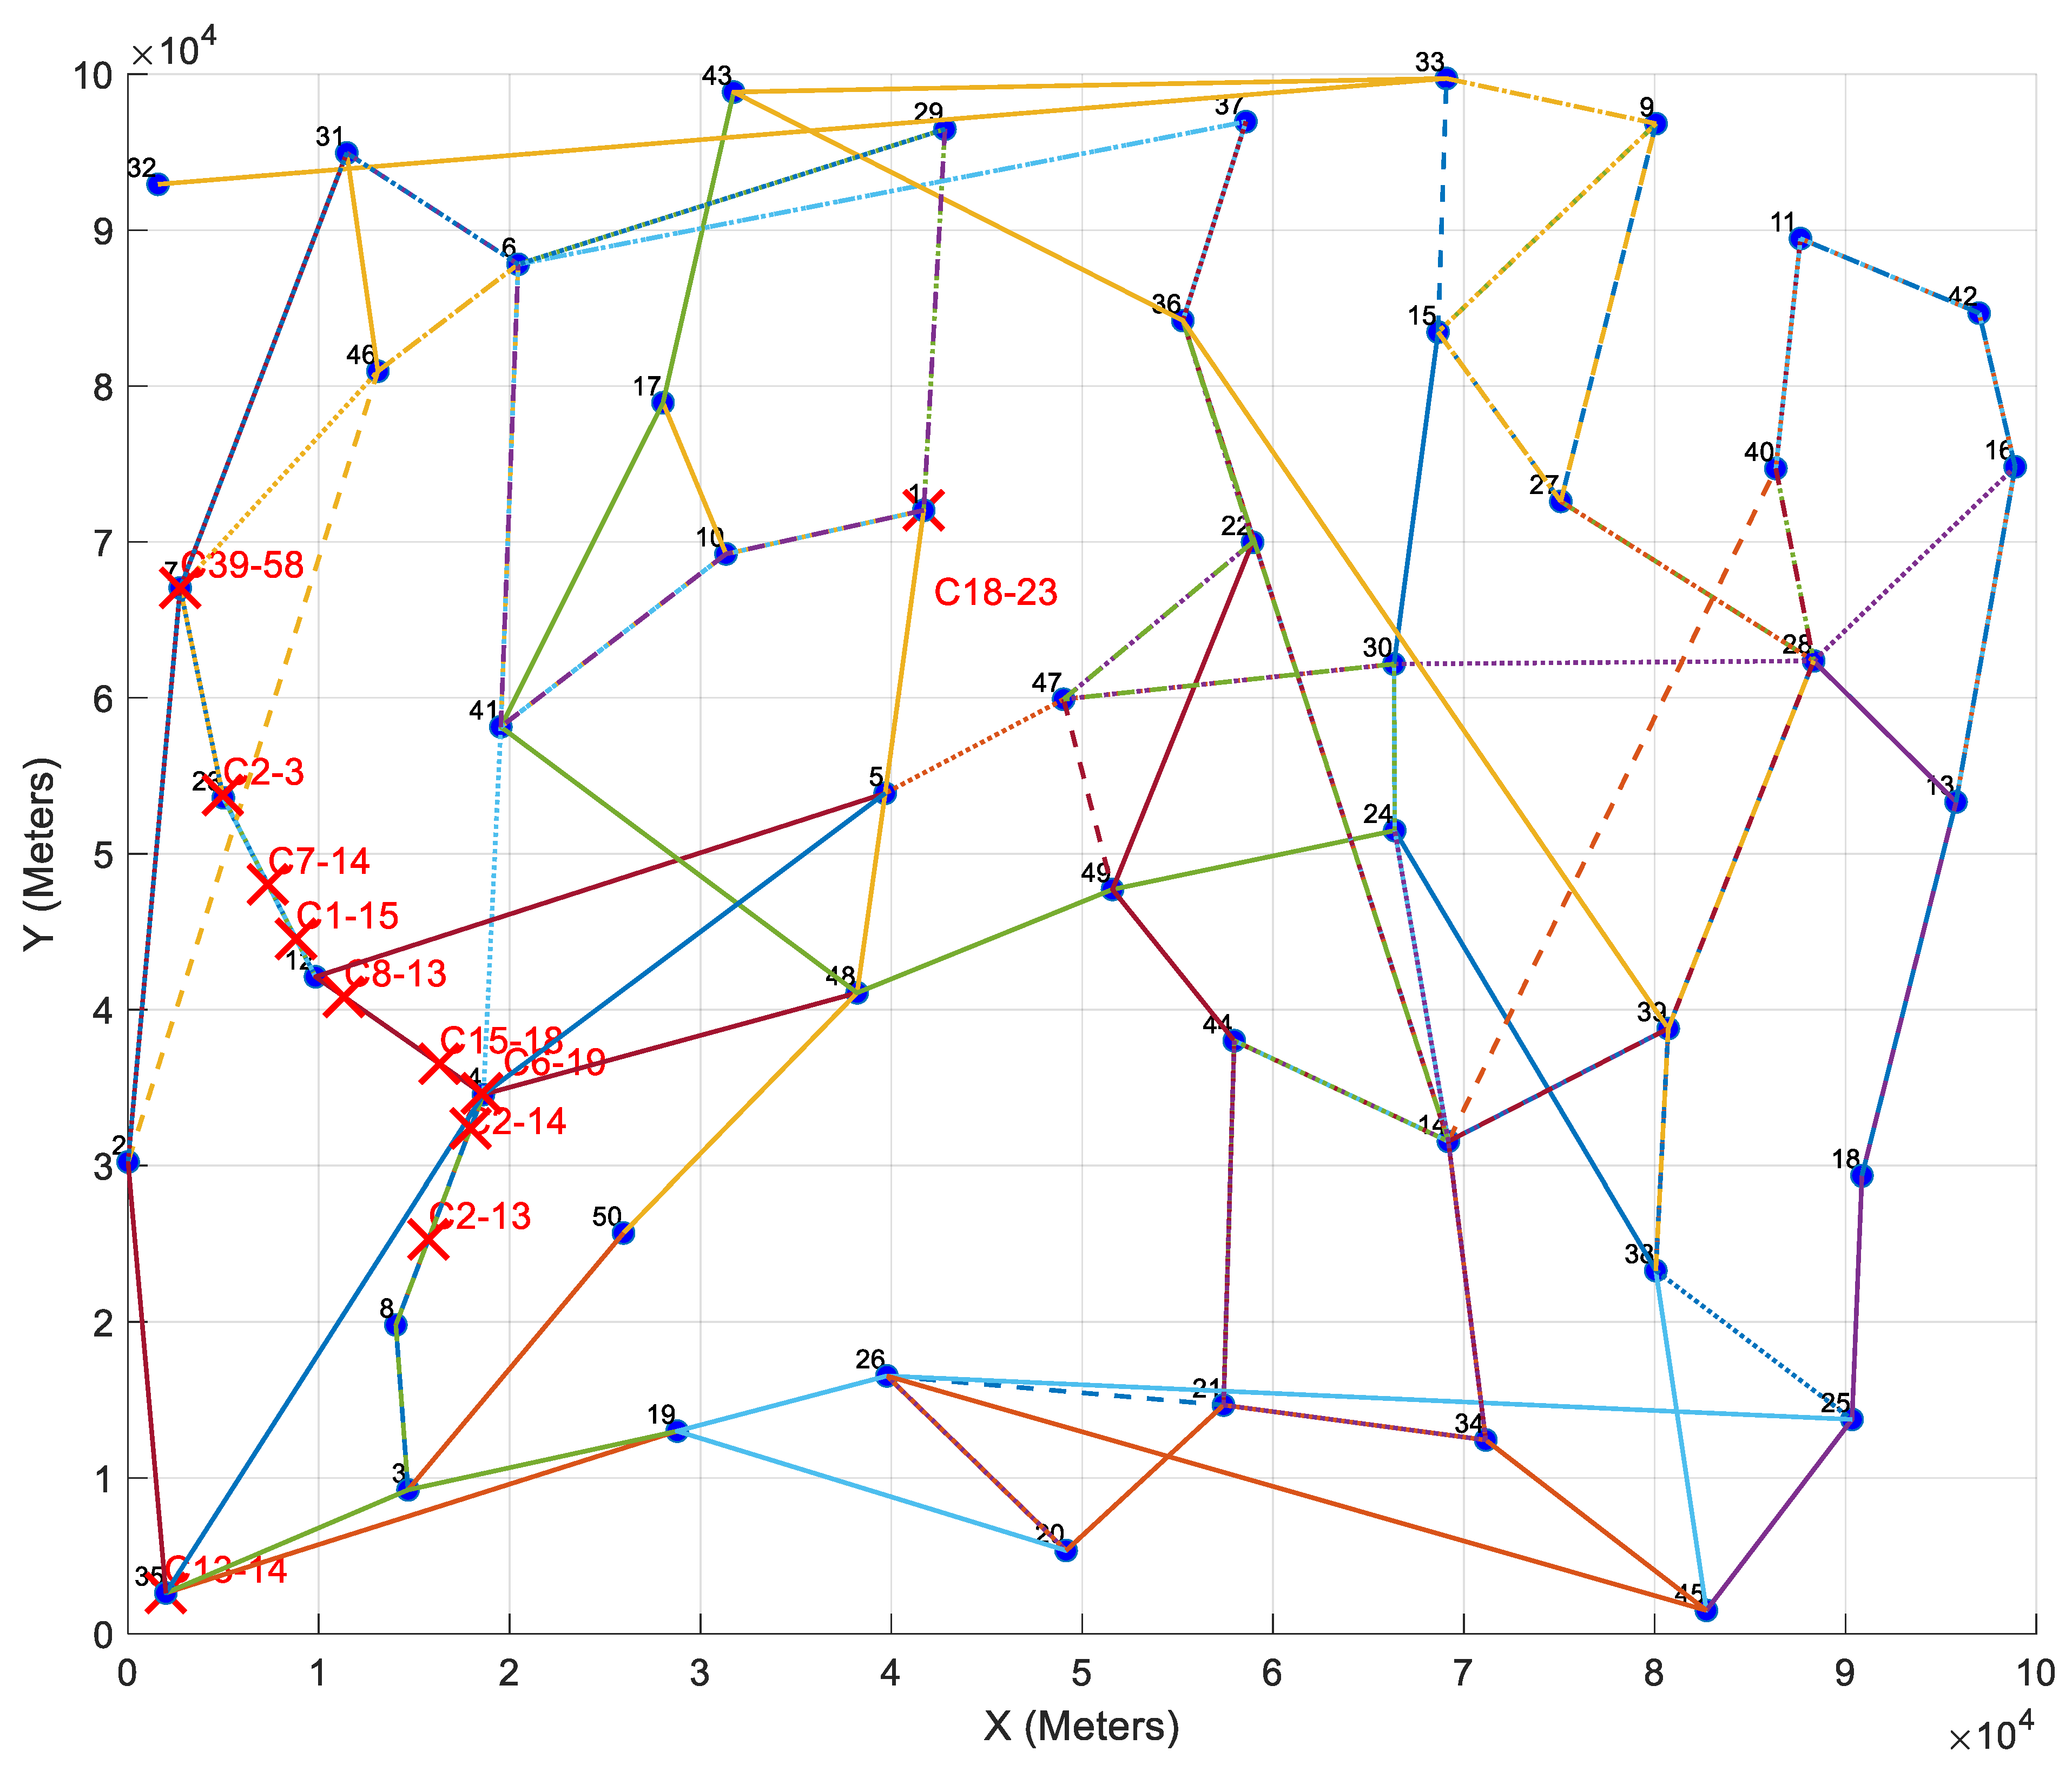
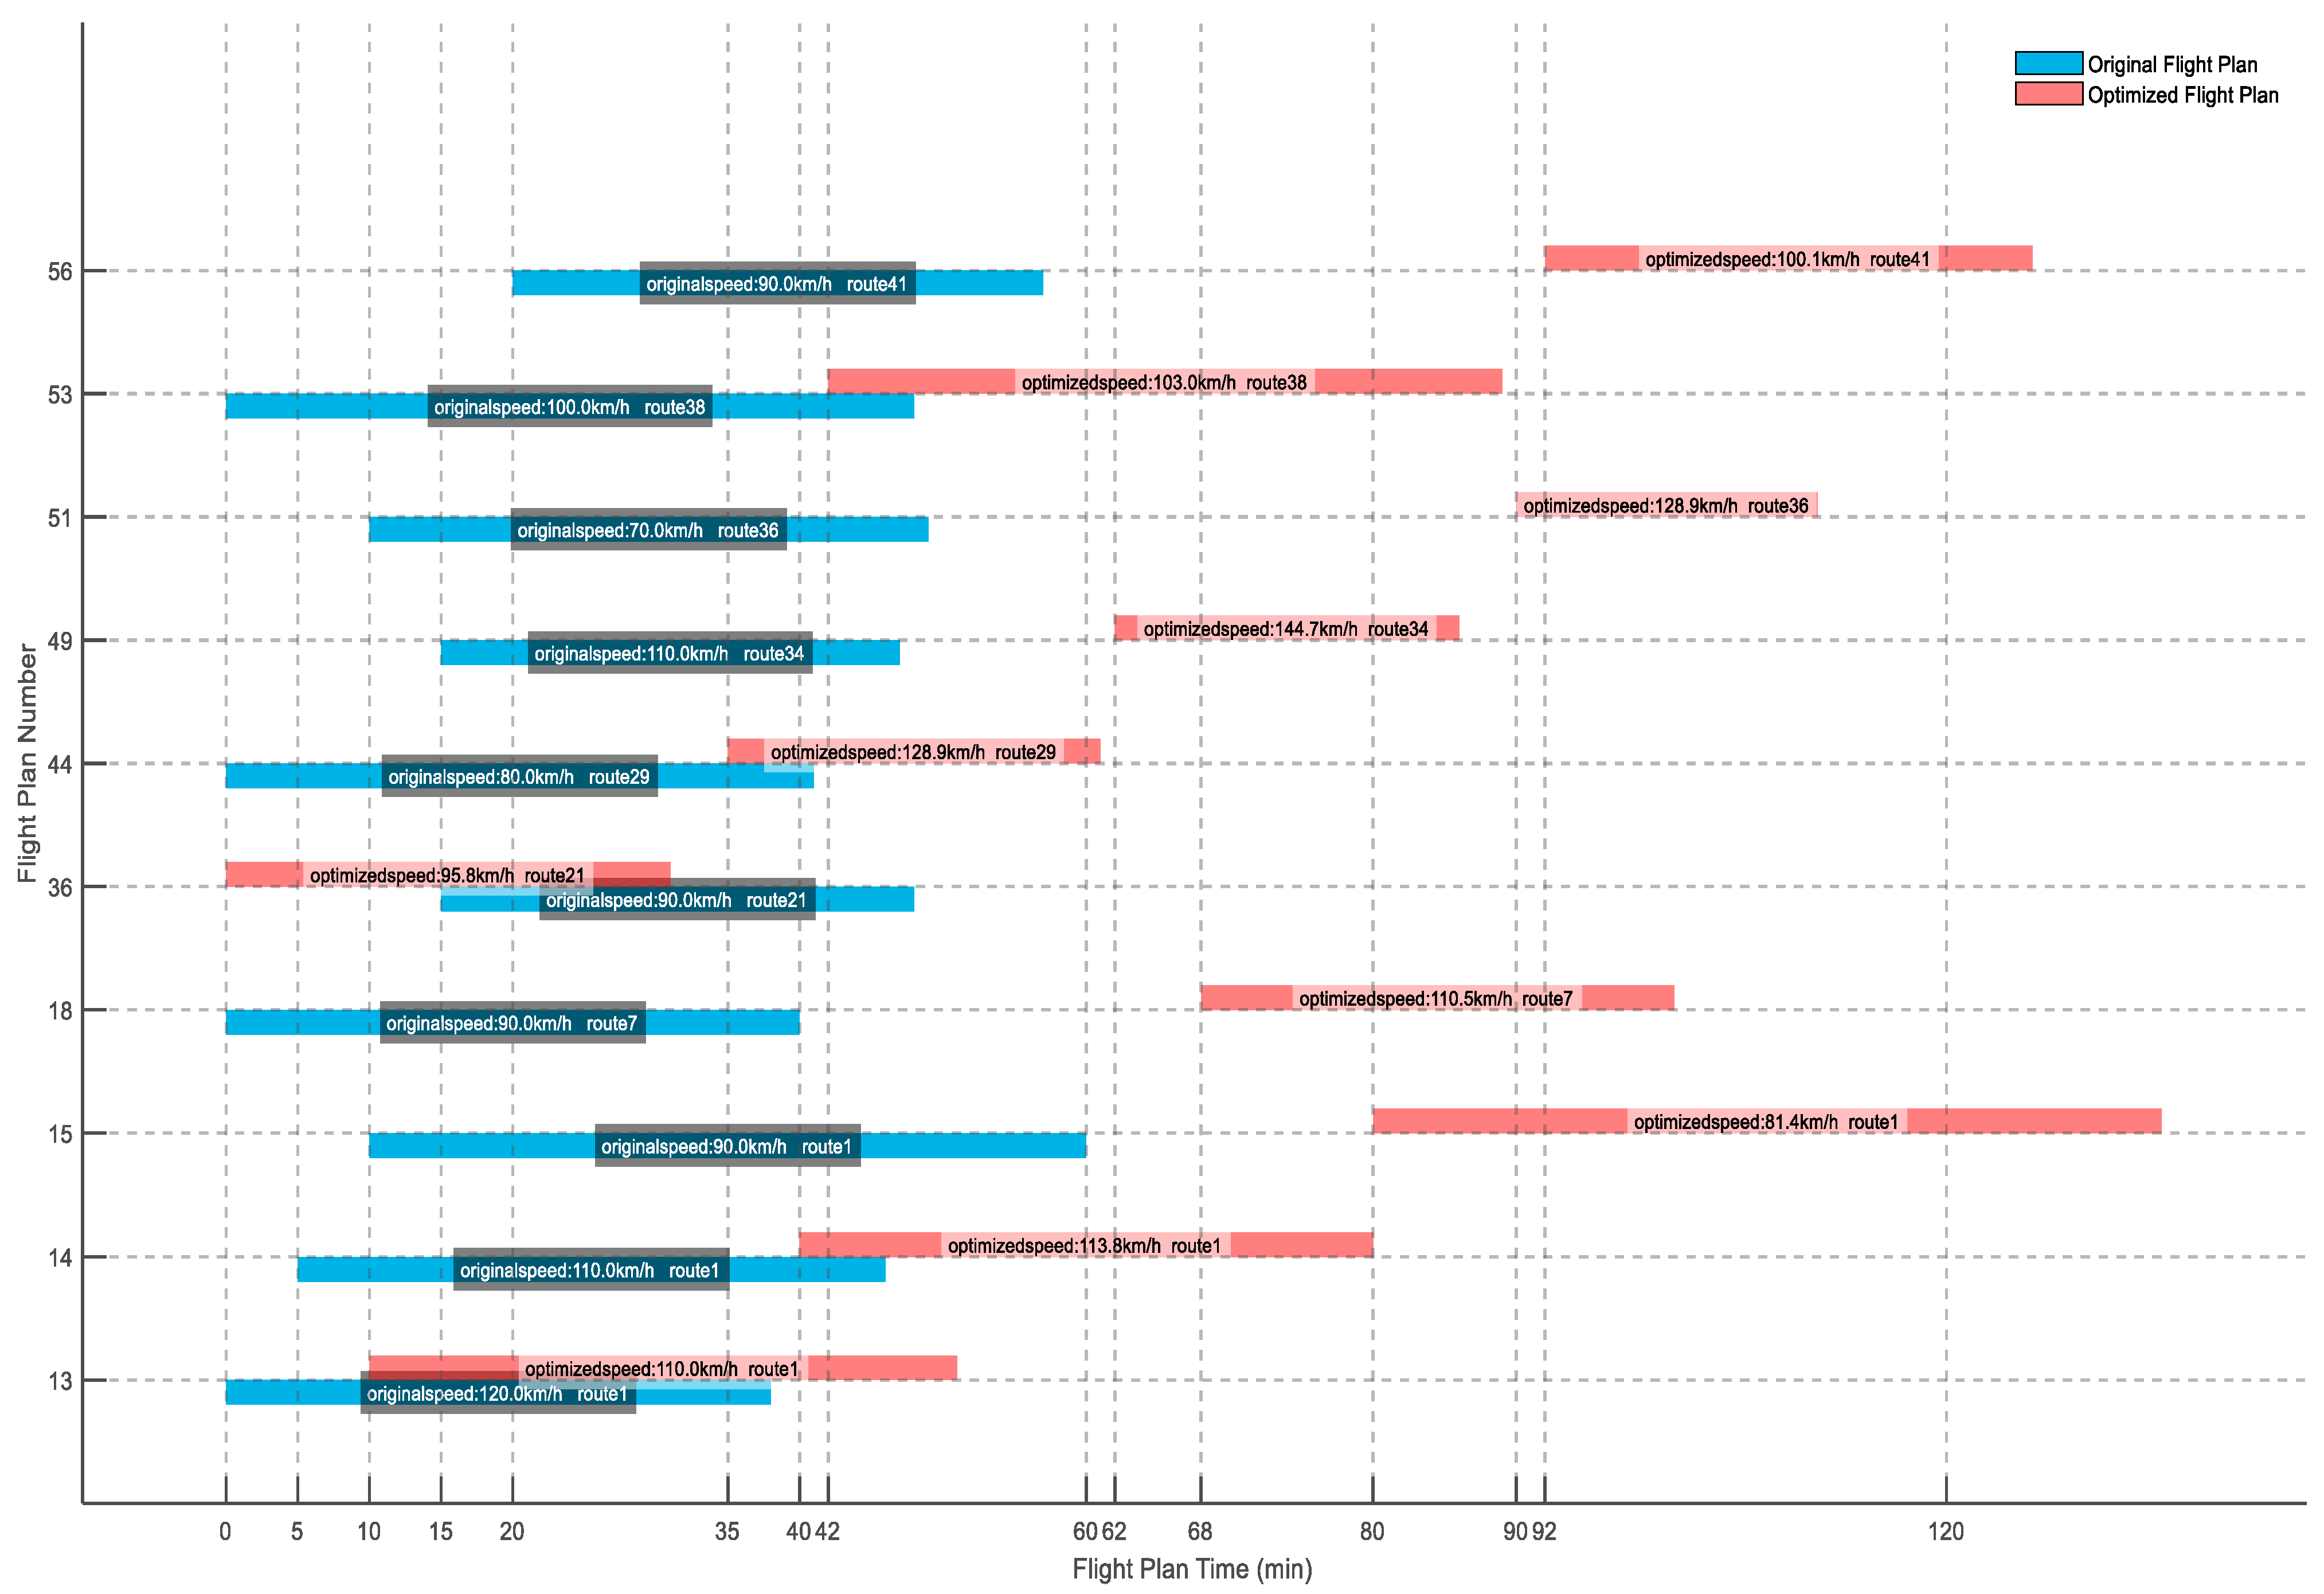
5.4. Staged Flight Plan Optimization

Optimization Algorithm Parameter Settings

The ALA optimization algorithm is configured with a population size of 50 and a maximum iteration count of 300. Simulations are conducted in MATLAB R2024a on an AMD Ryzen 9 7945HX with a Radeon Graphics (2.50GHz) platform featuring 16GB RAM. The two-stage optimization process is visualized in Figure 10 and Figure 11, with detailed steps as follows:
Stage 1: Spatiotemporal Co-Optimization of Critical Plans. For the 10 critical flight plans identified via PageRank, both departure times and flight speeds are synchronized to reconstruct four-dimensional trajectories. Dynamic time window constraints (departure time adjustment ≤ maximum delay threshold t d = 2   h ) and speed limits systematically resolve critical plan conflicts. This stage eliminates most of the 68 conflicts involving critical plans (Figure 10).
Stage 2: Speed-Priority Optimization for Remaining Conflicts. Non-critical flight plans undergo velocity-only adjustments without altering departure times to avoid secondary disruptions to schedule punctuality. Local speed regulation (60–150 km/h adjustment range) further resolves remaining conflicts. By fixing departure times, this stage significantly reduces decision variable dimensions while minimizing aircraft ground waiting time and improving airspace utilization (Figure 11).
The phased implementation effects of the optimization strategy are shown in Figure 12 and Figure 13.
Stage 1: Spatiotemporal Co-Optimization of Critical Plans (Figure 12)
Synchronized adjustments to departure times and flight speeds of critical plans reconstruct four-dimensional trajectories. The core mechanisms include the following:
Flexible spatiotemporal resource allocation: Leveraging large adjustment ranges (±2 h for departure times, 60–150 km/h for speeds), the artificial lemming algorithm (ALA) searches optimal spatiotemporal combinations for critical plans (14, 18, 49, 15, 13, 51, 56, 36, 44, 53). This flexibility resolves 65.1% of conflicts (56/86) (Figure 12).
Stage 2: Speed-Priority Optimization for Remaining Conflicts (Figure 13)
A single-variable velocity optimization strategy addresses scattered conflicts (30 remaining points) in non-critical plans, as follows:
Conflicts are distributed discretely and do not involve critical paths, eliminating the need for global spatiotemporal adjustments.
Speed adjustments minimally impact schedule punctuality, aligning with urban air mobility (UAM) operational constraints on ground waiting time. Only three conflicts remain after velocity optimization.
In the first stage, for the 10 critical flight plans in total, the departure times and flight speeds were adjusted synchronously. By expanding the departure time window (with an average delay of 44 min and a maximum delay of 80 min) and increasing the flight speed (for example, flight plan 51 was accelerated by 80%), 65.1% of the conflicts (56 out of 86) were systematically resolved. At the same time, by extending the minimum departure time interval between critical plans, the risk of trajectory overlap was significantly reduced.
In the second stage, for the remaining scattered conflicts, only the speeds of non-critical plans were adjusted. Among these, 15 plans were accelerated (for example, plan 24 increased its speed by 20% and saved 15 min), and 14 plans were decelerated (for example, plan 47 reduced its speed by 18%, resulting in a 32 min delay). The overall delay increased by only 17.5 min, and the maximum single delay was restricted to non-critical plans, without triggering a chain reaction.
Through the hierarchical control of spatiotemporal joint optimization and velocity-priority adjustment, this strategy reduces the running time of the algorithm while ensuring the safety redundancy of the critical path. At the same time, it meets the maximum delay threshold (2 h) and aircraft performance constraints, achieving an optimal balance between conflict resolution efficiency and operation cost.

6. Optimization Algorithm Comparative Analysis

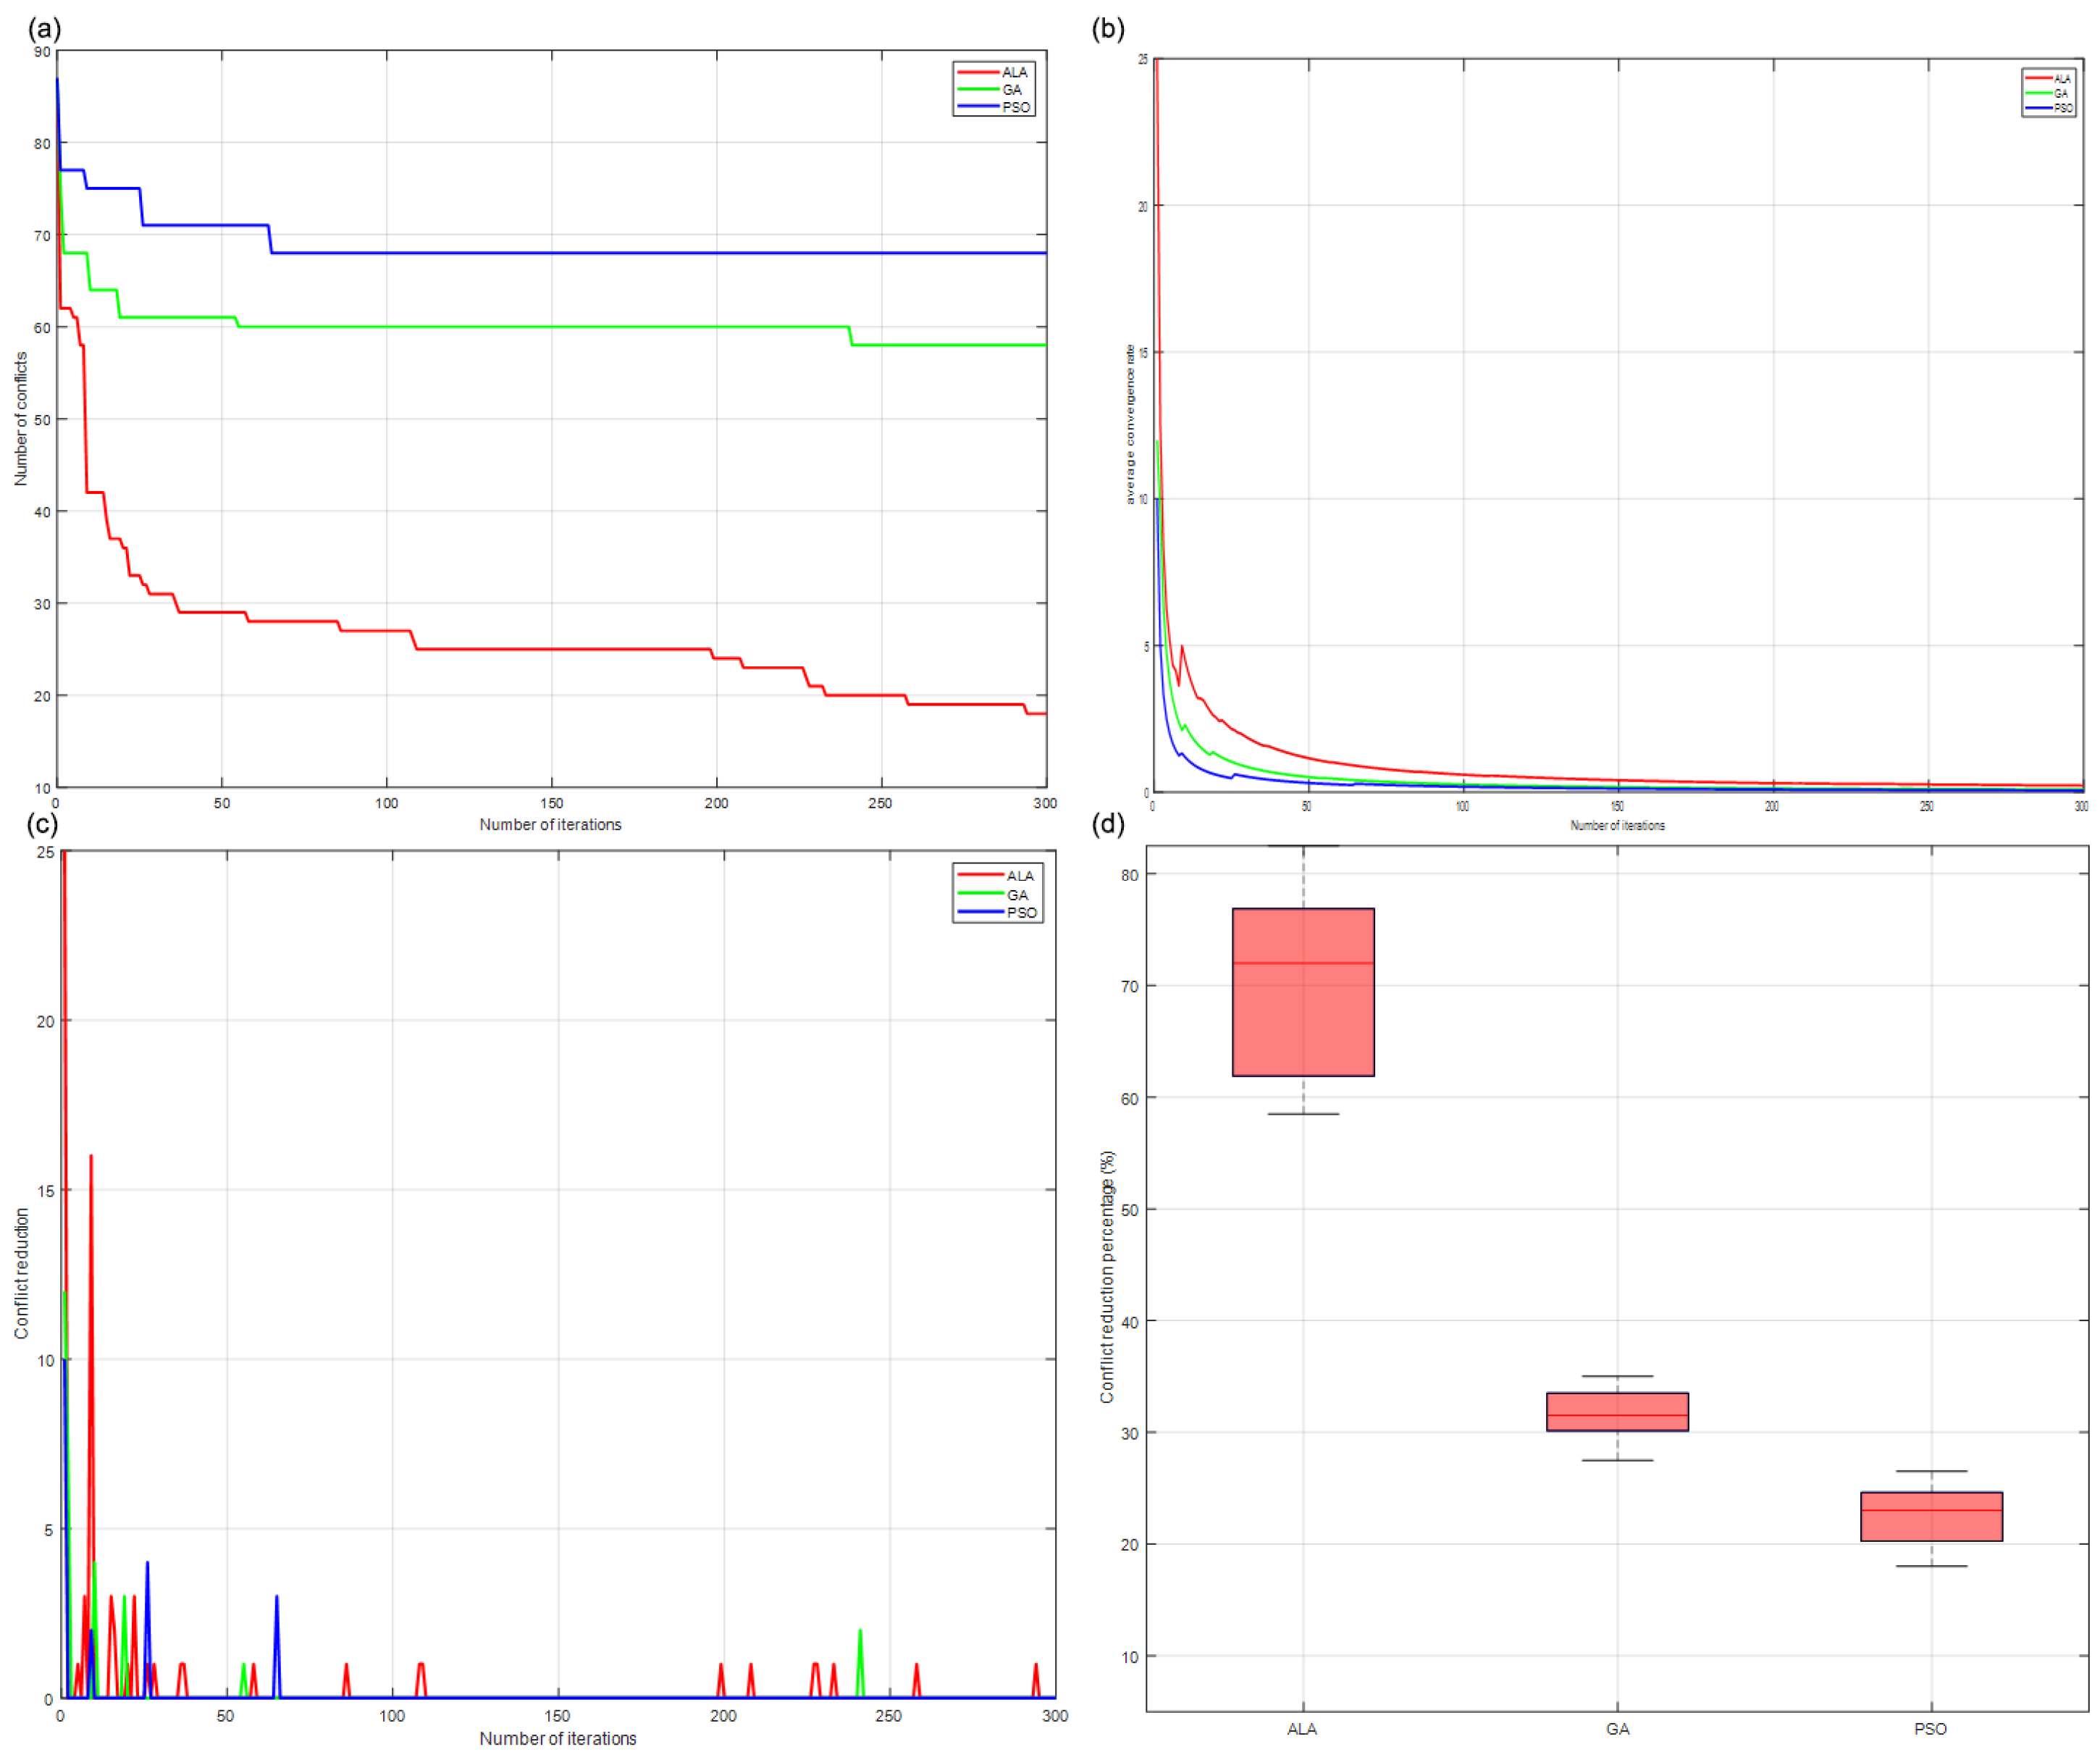
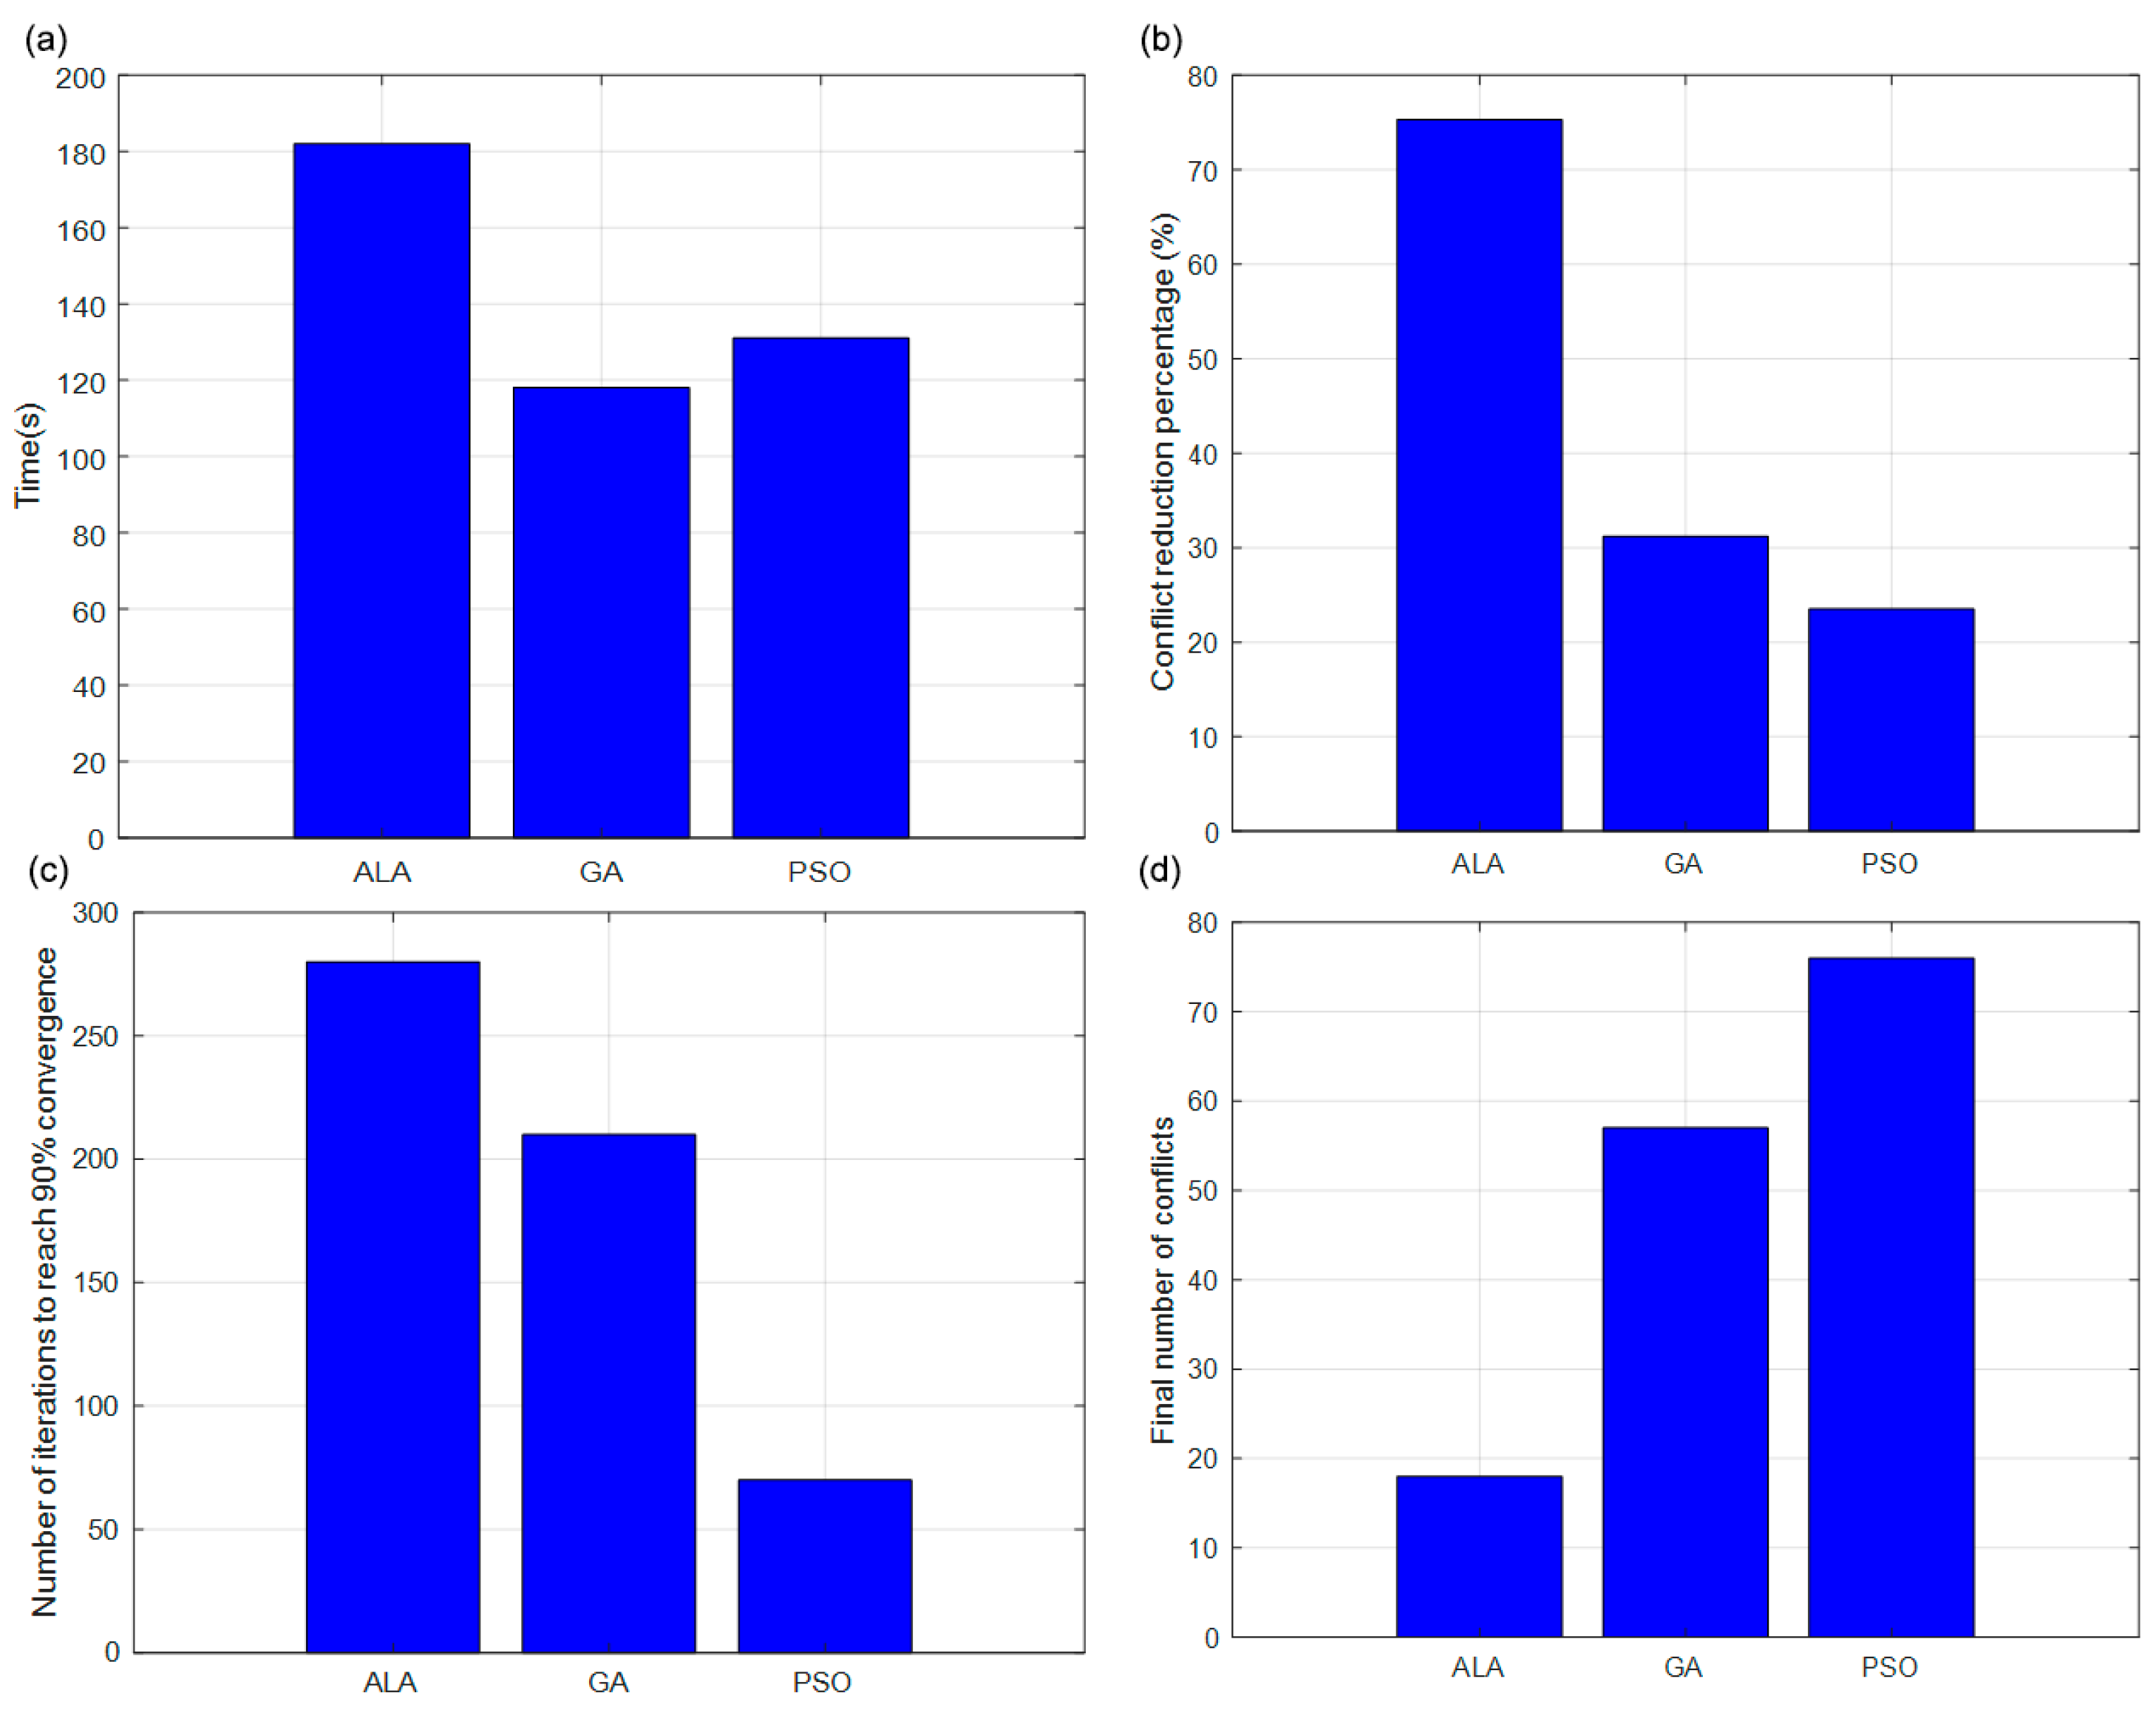
6.1. ALA Algorithm Comparison

Because flight plan conflicts primarily concentrate in critical flight plans, this section conducts comparative studies on critical plan conflict resolution algorithms in the first stage. To investigate the applicability of the staged ALA algorithm for solving flight plan conflicts, comparisons are designed between ALA, particle swarm optimization (PSO), and genetic algorithm (GA) during the first optimization stage. Figure 14 presents the results comparing conflict resolution capabilities and algorithm convergence rates.
A comprehensive analysis of the four sub-figures in Figure 14 reveals the following regarding the convergence performance:
In Figure 14a, with an initial conflict value of 86, after 300 iterations of the ALA algorithm, the remaining conflicts are 18, and there is a further downward trend. The reduction rate reaches 79%, which is significantly better than the final stable value of 58 (a reduction rate of 34.9%) of the GA algorithm and 67 (a reduction rate of 22.1%) of the PSO algorithm. This is because its efficient global search mechanism can quickly find the optimal solution.
In Figure 14b, the comparison of the algorithm convergence rates shows that in the first 50 iterations, the convergence rate of ALA is significantly higher than that of the other two algorithms, demonstrating a strong ability to resolve flight plan conflicts.
Figure 14c, the convergence stability graph, indicates that, after 100 iterations, ALA fluctuates seven times, far exceeding GA (which fluctuates one time) and PSO (which has zero fluctuations). Due to the presence of an energy factor in the optimization algorithm, the algorithm continuously switches between local search and global search. During the continuous exploration, the optimization result cannot be stably maintained, resulting in larger fluctuations.
In the box plot of Figure 14d, the median of the conflict reduction percentage of ALA reaches 72%, and the box range is 14%. Its optimization ability far exceeds that of GA (with a median of 31% and a box range of 3%) and PSO (with a median of 24% and a box range of 5%). However, its robustness is inferior to the other two algorithms. The reason for this phenomenon is its stronger global search ability. Each iteration focuses on the global search, but it is not stable enough during the local optimization process. The performance comparison can be found in Figure 15.
In Figure 15a, in terms of running time, ALA takes approximately 181 s, GA takes about 120 s, and PSO takes 130 s. ALA has the longest running time, which is determined by the complexity of its algorithm. Considering the convergence situation, the longer iteration time is accompanied by the optimal solution, indicating that the algorithm has a relatively high computational efficiency.
In Figure 15b, the comparison of the conflict reduction percentage shows that ALA reduces conflicts by more than 70%, GA reduces by about 30%, and PSO reduces by about 25%. ALA has a significant effect on optimizing conflict issues and can reduce conflicts more thoroughly. GA and PSO have insufficient conflict reduction capabilities due to the limitations of their search strategies (such as the premature convergence of GA and the tendency of PSO to converge to local optima).
In Figure 15c, the graph of the number of iterations to reach 90% convergence shows that PSO has the least number of iterations (about 70 times), GA has about 210 times, and ALA has about 290 times. PSO quickly reaches 90% convergence in the early stage, but its convergence stays at the local optimum. Although ALA has more iterations, as shown in Figure 15b, its final optimization accuracy is higher, indicating that ALA pays more attention to global search and sacrifices part of the iteration speed to obtain a higher-quality solution. GA performs moderately, with limited balancing ability. ALA, although having more iterations, obtains a better global solution, reflecting the optimization strategy of “precision first”.
In Figure 15d the final number of conflicts for ALA is approximately 18, GA is 58, and PSO is 77. The reduced remaining conflicts as a result of ALA’s optimization verify its thoroughness in optimization. GA and PSO cannot fully eliminate conflicts, leaving more unresolved issues.
Overall, ALA has a significant lead in terms of the conflict reduction percentage and the final number of conflicts. Although it is not advantageous in terms of the number of iterations required to reach 90% convergence and running time, it exchanges higher-precision global search for the optimal result. GA performs moderately, and although PSO converges quickly in the early stage, due to falling into local optima, its final optimization effect is the worst.
The core advantage of the artificial lemming algorithm (ALA) lies in its innovative multi-behavior fusion mechanism and dynamic, non-linear exploration-exploitation balance strategy. This enables it to outperform traditional genetic algorithms (GAs) and particle swarm optimization (PSO) in avoiding premature convergence, handling complex multi-modal problems, and achieving a better balance between global exploration and local exploitation. However, ALA requires sequentially executing four behaviors (migration, burrowing, foraging, predator avoidance) in a single iteration, involving complex computations such as Brownian motion, random perturbation, spiral search, and Lévy flight—resulting in significantly longer single-iteration times when compared with GA and PSO. When the number of aircraft increases or additional optimization objectives (e.g., path optimization) are added, the sharp rise in the dimensionality of the solution space can degrade search efficiency, potentially failing to meet real-time response requirements. Therefore, the algorithm is more effective in the preprocessing phase of flight plan adjustments.

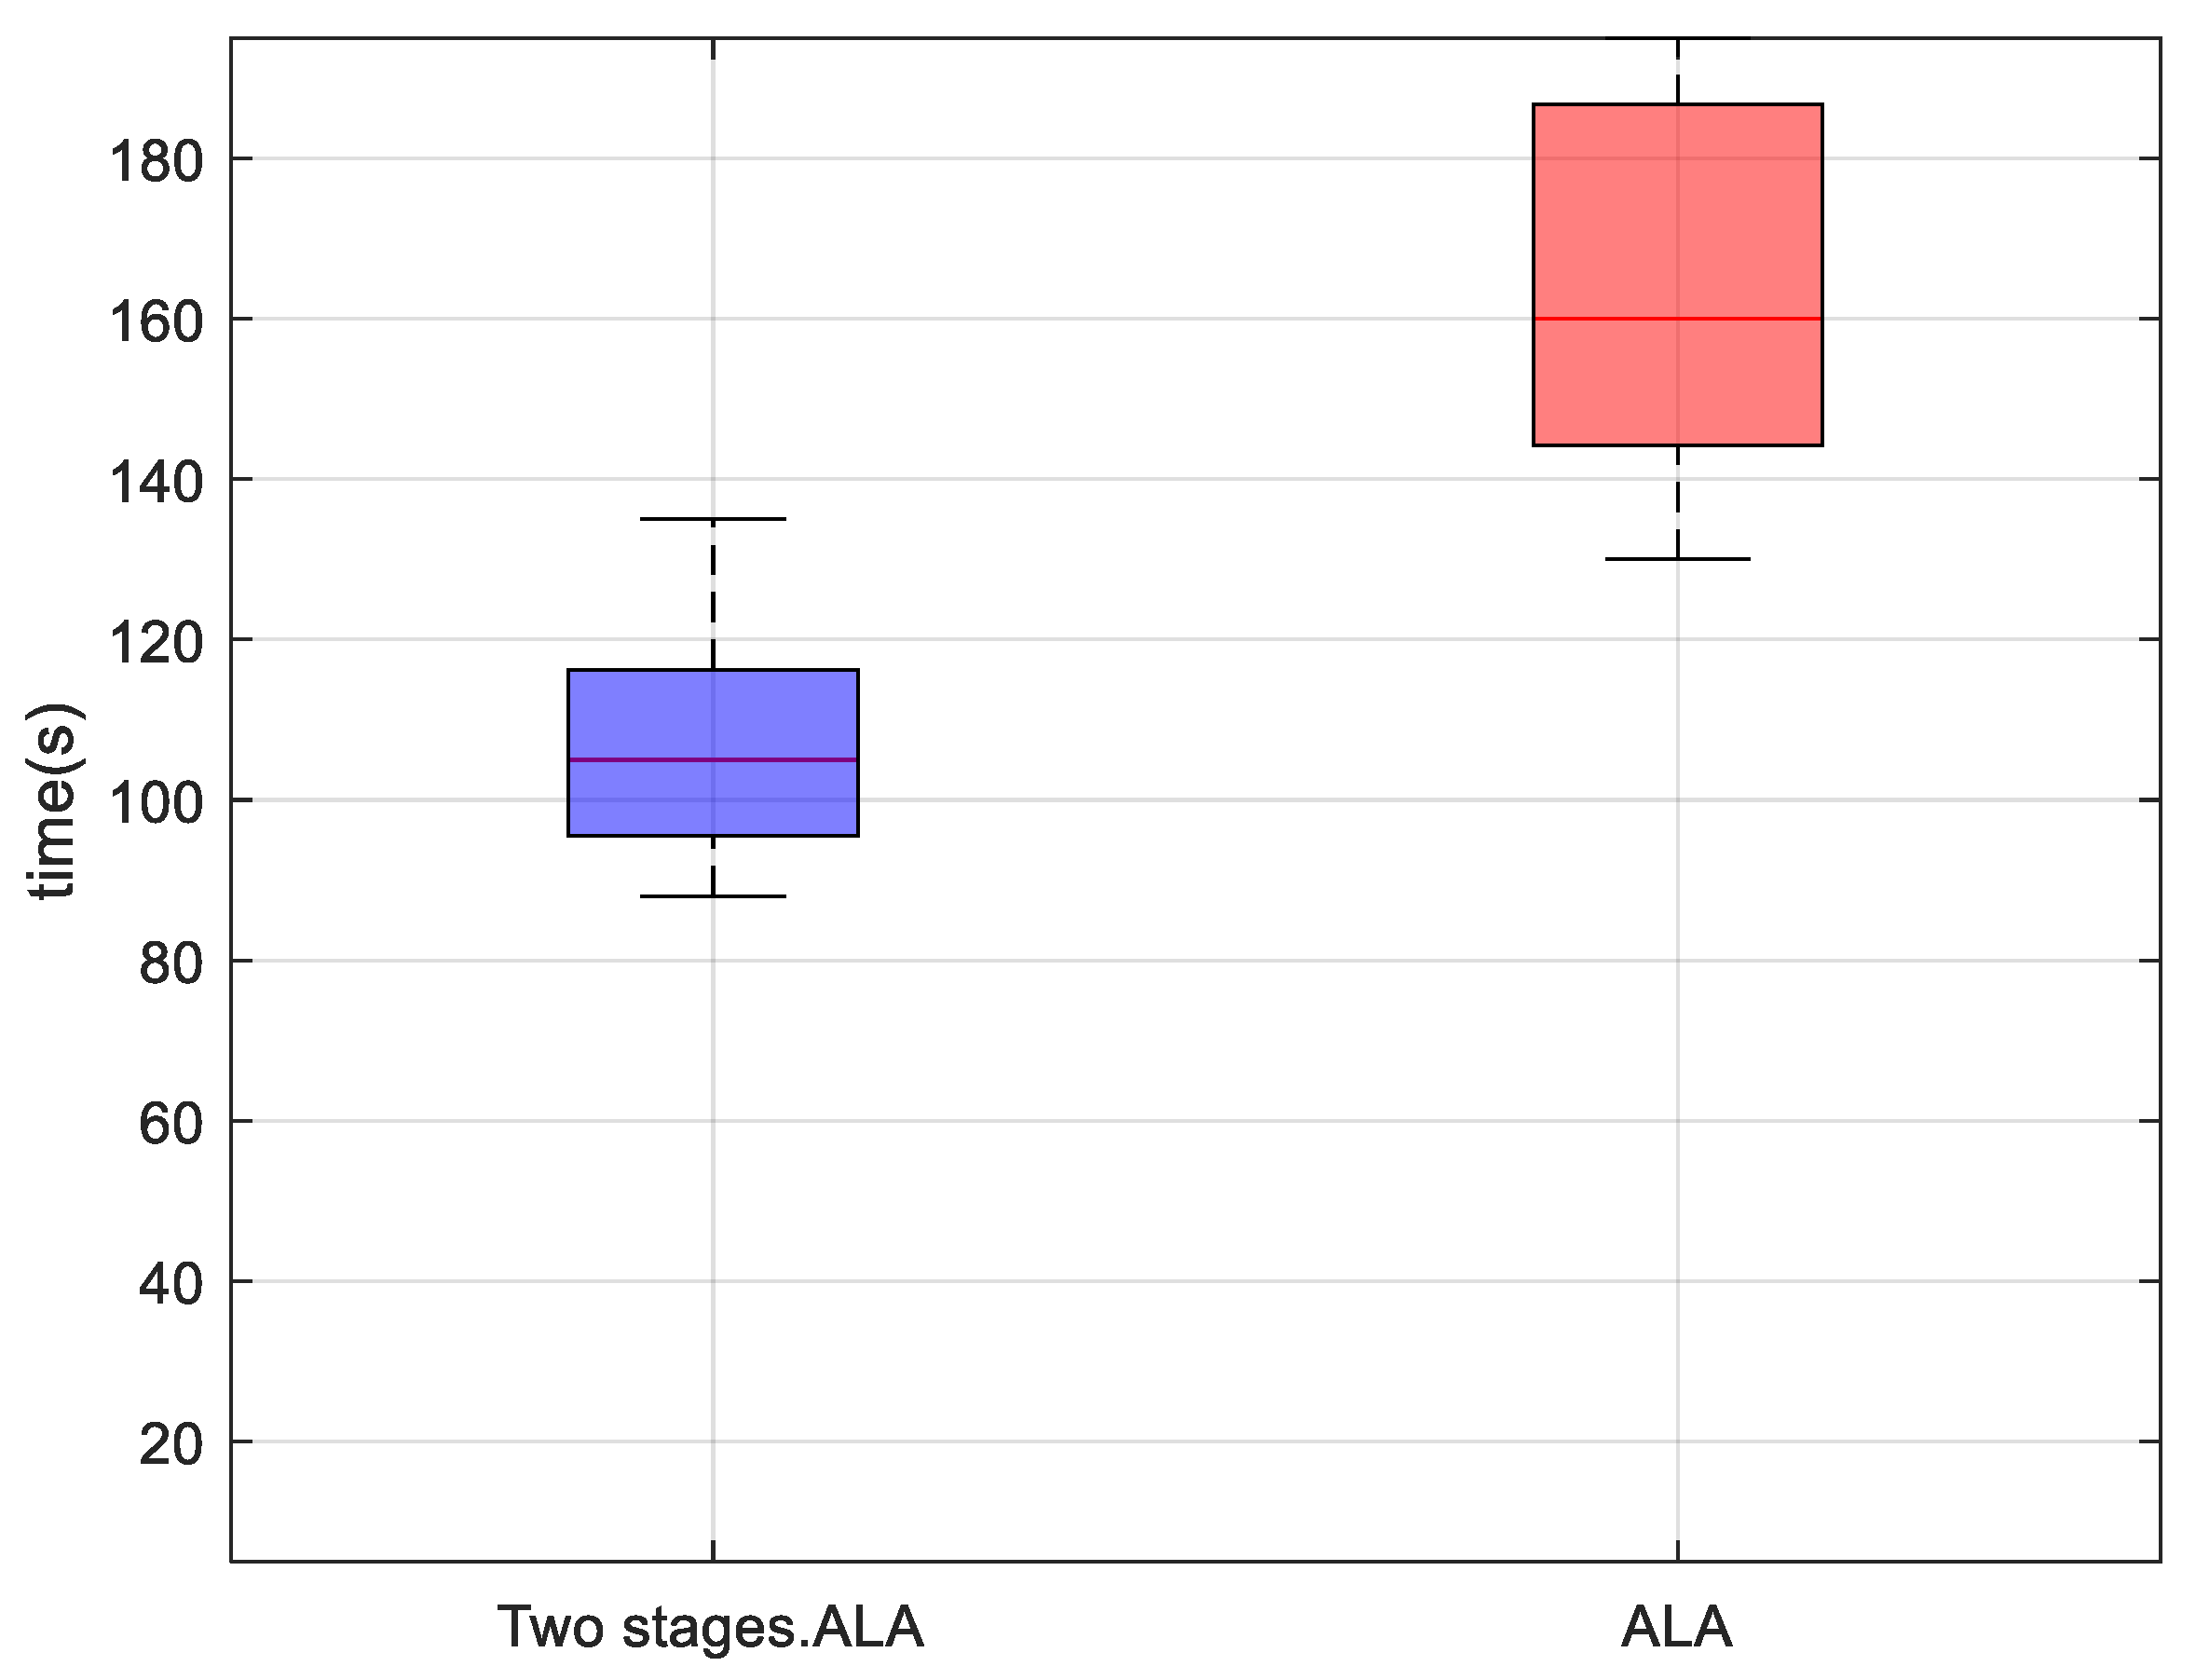
6.2. Analysis of the Effects of the Two-Stage Algorithm

In order to study the specific effects of the two-stage ALA algorithm, this design compares the computational efficiency between the two-stage algorithm and the ALA algorithm used alone. After 20 iterations, the statistical results are as follows (Figure 16):
As can be seen from this box plot, the staged optimization algorithm has smaller fluctuations and shorter running time. This is because the two-stage algorithm significantly reduces the computational complexity through hierarchical parameter optimization. In the first stage, it focuses on 10 critical flight plans, and only needs to synchronously optimize two dimensions, namely the departure time and flight speed. In the second stage, only the speed parameters of non-critical plans are adjusted. The overall parameter dimension is reduced from 2N (N = 60) to 2K + (NK) (K = 10), and the calculation scale is reduced by 58%. This parameter space compression strategy increases the convergence speed of the algorithm. At the same time, the two-stage strategy achieves the controllability of the optimization process through staged constraints. By controlling the critical flight plans, precise control of the flight plans can be achieved according to need.

6.3. Analysis of the Influence of Critical Plans

The number of selected critical plans will affect the optimization effect in the second stage. The following details the analysis of the influence of the selection of different numbers of critical plans on the optimization results. Simulations and comparisons are carried out by selecting 4, 6, 10, 12, and 15 critical flight plans. As shown in Figure 17:
As can be seen from Figure 17, the number of selected critical flight plans is closely related to the resolution rate in the second stage. An increase in the number of selected critical flight segments means that more conflicts can be resolved in the first stage. This not only significantly improves the resolution rate in the second stage but also effectively reduces the resolution pressure in the second stage, thereby accelerating the convergence rate of the curve and ultimately reducing the number of conflicts.
However, an increase in the number of selected critical plans also brings about certain negative impacts. On the one hand, the computational pressure in the first stage will increase accordingly. On the other hand, as the number of plans for which both the departure time and speed need to be adjusted simultaneously increases, the adjustment range for the overall flight plans becomes larger, which is unacceptable in actual operations and does not conform to the adjustment range required in real-world scenarios.
Therefore, in the process of selecting critical flight plans, it is necessary to find the best balance point between the number of adjusted plans and the optimization rate, so as to determine the number of critical plans that is more in line with actual needs. In this way, on the premise of ensuring flight safety, the efficient optimization of flight plans can be achieved.

7. Conclusions

This paper proposes solutions for the conflict detection and resolution of manned aircraft flight plans in urban air mobility (UAM) environments, achieving the following innovative results:
(1)
Uncertainty-Driven Conflict Detection Model: By incorporating probabilistic distribution characteristics of aircraft time-over-point errors, a conflict detection model based on four-dimensional trajectory confidence interval overlap is constructed. This model significantly enhances the ability to identify latent conflicts in real-world operations, expanding detection scope and improving flight plan robustness when compared with traditional deterministic methods (fixed time interval checks).
(2)
Critical Plan Identification Using Complex Network Theory: A conflict complex network is established with flight plans as nodes and conflict relationships as edges. Multi-dimensional indicators including PageRank centrality and degree centrality are integrated to accurately identify critical flight plans that decisively impact network stability. This method is validated through node removal experiments, providing a quantitative basis for optimization strategy prioritization.
(3)
Staged Optimization Strategy and ALA Algorithm Application: A two-stage conflict resolution algorithm is proposed:
  • First stage: Synchronous optimization of departure times and speeds for critical plans (spatiotemporal co-optimization).
  • Second stage: Velocity-only adjustments for non-critical plans (single-variable optimization) to avoid cascading delays from departure time perturbations.
  • This strategy reduces algorithm runtime by 59% when compared with single-stage global optimization. The artificial lemming algorithm (ALA)-based multi-objective optimization algorithm demonstrates significant advantages, including fast convergence and superior solution quality, effectively solving multi-objective hybrid nonlinear programming problems.
  • Flight plan optimization for urban air mobility (UAM) can better balance the limited airspace resources against the surge in flight plans, enabling as many flight plans as possible to be implemented as required. The proposed phased optimization strategy allows targeted adjustments to flight plans—for example, minimizing changes to high-priority plans (e.g., search and rescue, emergency relief), thus providing theoretical support and solutions for dynamic scheduling in high-density airspace scenarios.
However, several areas for improvement remain in this research, as follows:
  • Development Stage and Route Constraints: The core of this study is designed for the initial development phase of UAM, under the key assumption that autonomous flight technologies are not yet fully mature, requiring operations within a fixed, pre-defined route network. While this simplifies conflict prediction and management, it limits the algorithm’s direct applicability to more free-flight environments.
  • Limitations in Optimization Dimensions: Current optimization methods primarily focus on adjusting flight plan departure times and aircraft speeds, excluding the optimization of flight paths themselves. When conflicts are predicted, integrating path planning capabilities—such as executing local route diversions or altitude layer adjustments in conflict-prone areas—would offer more diverse and flexible conflict resolution means. Collaborative optimization across multiple dimensions (time, speed, spatial path) is expected to enable more precise, less disruptive conflict solutions, thereby accommodating safer and more efficient operations for a larger number of flight plans.
  • Needs for Future Enabling Technologies: With technological advancements, future UAM will trend toward flexible, non-fixed-route free-flight modes. In such scenarios, achieving efficient plan optimization and dynamic adjustment (especially with path optimization) will require more than just pre-planning. It will depend on the mature application of real-time on-board or ground-based conflict detection and resolution (CD&R) systems, as well as advanced airspace dynamic surveillance technologies (e.g., more precise positioning, communication, and data sharing capabilities) to address rapidly changing air traffic conditions.
  • Limitations in Validation Methods: The effectiveness of the proposed optimization method is currently validated primarily at the theoretical and simulation levels, using a small-scale flight plan dataset. While MATLAB and other simulation software were used to test the algorithm’s feasibility and basic performance, real urban traffic flow data or real-world scenario experiments have not yet been employed. The complexity of the real world—including communication delays, navigation errors, sudden weather conditions, and non-cooperative targets—may significantly impact the algorithm’s practical performance, especially after introducing path optimization, where sensitivity to environmental factors is likely to increase.

Author Contributions

Conceptualization, L.M. and X.W.; methodology, L.M. and M.W.; software, L.M. and Z.Z.; validation, X.W. and Q.T.; formal analysis, M.W.; investigation, X.W.; data curation, X.W.; writing—original draft preparation, L.M. and Z.Z.; writing—review and editing, X.W. and M.W.; visualization, L.M. and Q.T. All authors have read and agreed to the published version of the manuscript.

Funding

This research was funded by The National Natural Science Foundation of China, grant number 71801221. The National Social Science Fund of China, grant number 22XGL001.

Data Availability Statement

The data presented in this study are available from the corresponding author upon request.

Conflicts of Interest

The authors declare no conflicts of interest.

Abbreviations

The following abbreviations are used in this manuscript:
ALAArtificial lemming algorithm
UAMUrban air mobility
eVTOLElectric vertical takeoff and landing
UTMUnmanned aircraft system traffic management
ADS-BAutomatic dependent surveillance broadcast system
UASUnmanned aircraft systems
TOPTime-over-point
PSOParticle swarm optimization
GAGenetic algorithm

References

  1. Rajendran, S.; Srinivas, S. Air taxi service for urban mobility: A critical review of recent developments, future challenges, and opportunities. Transp. Res. Part E Logist. Transp. Rev. 2021, 143, 102090. [Google Scholar] [CrossRef]
  2. The Future of Vertical Mobility: Sizing the Market for Passenger, Inspection, and Goods Services Until 2035. Available online: https://www.readkong.com/page/the-future-of-sizing-the-market-for-passenger-inspection-5278425 (accessed on 26 March 2025).
  3. Urban Air Mobility Flying Cars: Investment Implications of Autonomous Urban Air Mobility. Available online: https://www.morganstanley.com/ideas/autonomous-aircraft (accessed on 26 March 2025).
  4. Swadesir, L.; Bil, C. Urban air transportation for Melbourne metropolitan area. In Proceedings of the AIAA Aviation 2019 Forum, Dallas, TX, USA, 17–21 June 2019; p. 3572. [Google Scholar]
  5. Bai, C.Y.; Guo, Y.Z.; Liu, X.C.; Wang, Y.F.; Wang, J.Z.; Qin, Q.H. Research progress of collsion safety characteristics of civil light and small UAVs. Acta Aeronaut. Astronaut. Sin. 2022, 43, 137–153. [Google Scholar]
  6. UTM Concept of Operations Version 2.0. Available online: https://www.faa.gov/researchdevelopment/trafficmanagement/utm-concept-operations-version-20-utm-conops-v20 (accessed on 26 March 2025).
  7. Liang, J.; Yang, K.; Tan, C.; Wang, J.; Yin, G. Enhancing High-Speed Cruising Performance of Autonomous Vehicles Through Integrated Deep Reinforcement Learning Framework. IEEE Trans. Intell. Transp. Syst. 2025, 26, 835–848. [Google Scholar] [CrossRef]
  8. Wu, P.; Yang, X.; Wei, P.; Chen, J. Safety Assured Online Guidance with Airborne Separation for Urban Air Mobility Operations in Uncertain Environments. IEEE Trans. Intell. Transp. Syst. 2022, 23, 19413–19427. [Google Scholar] [CrossRef]
  9. Zhang, J.F.; Ge, T.T.; Chen, Q.; Wang, F. 4D Trajectory Prediction and Uncertainty Analysis for Departure Aircraft. J. Southwest Jiaotong Univ. 2016, 51, 800–806. [Google Scholar]
  10. Liang, Z.; Chaovalitwongse, W.A.; Elsayed, E.A. Sequence assignment model for the flight conflict resolution problem. Transp. Sci. 2014, 48, 334–350. [Google Scholar] [CrossRef]
  11. Zuo, J.P.; Xie, H.P.; Zhou, H.W.; Peng, S.P. Research on scheduling problem of intersection flight considering priority. Aeronaut. Comput. Tech. 2014, 181, 593–603. [Google Scholar]
  12. Takeichi, N. Nominal flight time optimization for arrival time scheduling through estimation/resolution of delay accumulation. Transp. Res. Part C Emerg. Technol. 2017, 77, 433–443. [Google Scholar] [CrossRef]
  13. Zhang, Y.; Su, R.; Li, Q.; Cassandras, C.G.; Xie, L. Distributed flight routing and scheduling for air traffic flow management. Trans. Intell. Transp. Syst. 2017, 18, 2681–2692. [Google Scholar] [CrossRef]
  14. Sacharny, D.; Henderson, T.C.; Marston, V.V. Lane-Based Large-Scale UAS Traffic Management. IEEE Trans. Intell. Transp. Syst. 2022, 23, 18835–18844. [Google Scholar] [CrossRef]
  15. De Oliveira, Í.R.; Altus, S.; Tiourine, S.; Neto, E.C.P.; Leite, A.; De Azevedo, F.C. Stochastic Flight Plan Optimization. In Proceedings of the 2023 IEEE/AIAA 42nd Digital Avionics Systems Conference (DASC), Barcelona, Spain, 1–5 October 2023; pp. 1–8. [Google Scholar] [CrossRef]
  16. Su, Y.; Xu, Y.; Inalhan, G. A comprehensive flight plan risk assessment and optimization method considering air and ground risk of UAM. In Proceedings of the 2022 IEEE/AIAA 41st Digital Avionics Systems Conference (DASC), Portsmouth, VA, USA, 18–22 September 2022; pp. 1–10. [Google Scholar] [CrossRef]
  17. Pang, B.; Low, K.H.; Lv, C. Adaptive conflict resolution for multi-UAV 4D routes optimization using stochastic fractal search algorithm. Transp. Res. Part C Emerg. Technol. 2022, 139, 103666. [Google Scholar] [CrossRef]
  18. Dai, W.; Pang, B.; Low, K.H. Conflict-free four-dimensional path planning for urban air mobility considering airspace occupancy. Aerosp. Sci. Technol. 2021, 119, 107154. [Google Scholar] [CrossRef]
  19. Haba, R.; Mano, T.; Ueda, R.; Ebe, G.; Takeda, K.; Terabe, M.; Ohzeki, M. Routing and scheduling optimization for urban air mobility fleet management using quantum annealing. Sci. Rep. 2025, 15, 4326. [Google Scholar] [CrossRef] [PubMed]
  20. Shihab, S.A.M.; Wei, P.; Ramirez, D.S.J.; Mesa-Arango, R.; Bloebaum, C. By schedule or on demand?—A hybrid operation concept for urban air mobility. In Proceedings of the AIAA Aviation 2019 Forum, Dallas, TX, USA, 17–21 June 2019; p. 3522. [Google Scholar]
  21. Wei, Z. Research of an Improved Flight Plan Adjustment Method. Informatiz. Res. 2018, 44, 13–17. [Google Scholar]
  22. Sun, G.; Wang, Y.; Yu, H.; Guizani, M. Proportional Fairness-Aware Task Scheduling in Space-Air-Ground Integrated Networks. IEEE Trans. Serv. Comput. 2024, 17, 4125–4137. [Google Scholar] [CrossRef]
  23. Kim, J.; Nam, G.; Min, D.; Kim, N.M.; Lee, J. Safety Risk Assessment Based Minimum Separation Boundary for UAM Operations. In Proceedings of the 2023 IEEE/AIAA 42nd Digital Avionics Systems Conference (DASC), Barcelona, Spain, 1–5 October 2023. [Google Scholar] [CrossRef]
  24. Shi, M.T. Research on the Flight Delay Propagation in Aviation Network Under Uncertainty Factor. Master’s Thesis, Nanjing University of Aeronautics and Astronautics, Nanjing, China, 2017. [Google Scholar]
  25. Sallan, J.M.; Lordan, O. Air Route Networks Through Complex Networks Theory; Elsevier: Amsterdam, The Netherlands, 2019. [Google Scholar]
  26. Xiao, Y.; Cui, H.; Khurma, R.A.; Castillo, P.A. Artificial lemming algorithm: A novel bionic meta-heuristic technique for solving real-world engineering optimization problems. Artif. Intell. Rev. 2025, 58, 84. [Google Scholar] [CrossRef]
  27. Wu, M.; Wang, Z.; Gan, X.; Yang, G.; Wen, X. Identification of key flight conflict nodes based on complex network theory. J. Northwestern Polytech. Univ. 2020, 38, 279–287. [Google Scholar] [CrossRef]
  28. Pang, B.; Low, K.H.; Duong, V.N. Chance-constrained UAM traffic flow optimization with fast disruption recovery under uncertain waypoint occupancy time. Transp. Res. Part C Emerg. Technol. 2024, 161, 104547. [Google Scholar] [CrossRef]
  29. Solá, L.; Romance, M.; Criado, R.; Flores, J.; García del Amo, A.; Boccaletti, S. Eigenvector centrality of nodes in multiplex networks. arXiv 2013, arXiv:1305.7445. [Google Scholar] [CrossRef] [PubMed]
  30. Langville, A.N.; Meyer, C.D. Deeper inside pagerank. Internet Math. 2004, 1, 335–380. [Google Scholar] [CrossRef]
Figure 1. Research process flowchart.
Aerospace 12 00413 g001
Figure 2. Conflict illustration under the uncertainty principle.
Aerospace 12 00413 g002
Figure 3. Airborne waypoint and takeoff/landing point distribution.
Aerospace 12 00413 g003
Figure 4. Airborne route network.
Aerospace 12 00413 g004
Figure 5. Conflict display considering the uncertainty principle (86 flight conflicts).
Aerospace 12 00413 g005
Figure 6. Conflict display without uncertainty principle (11 flight conflicts).
Aerospace 12 00413 g006
Figure 7. Node importance network diagram under different metrics.
Aerospace 12 00413 g007
Figure 8. Number of remaining edges when nodes are deleted.
Aerospace 12 00413 g008
Figure 9. Critical flight plan identification (68 flight conflicts).
Aerospace 12 00413 g009
Figure 10. First-stage optimization (focusing only on optimizing key flight plans).
Aerospace 12 00413 g010
Figure 11. Second-stage optimization (resolving remaining flight conflicts by only adjusting flight speed).
Aerospace 12 00413 g011
Figure 12. Critical flight plan optimization (adjusting speed and departure time).
Aerospace 12 00413 g012
Figure 13. Remaining flight plan adjustments (velocity only).
Aerospace 12 00413 g013
Figure 14. Convergence performance comparison of three optimization algorithms.
Aerospace 12 00413 g014
Figure 15. Performance comparison of three optimization algorithms.
Aerospace 12 00413 g015
Figure 16. Comparison of algorithm running times.
Aerospace 12 00413 g016
Figure 17. Convergence situations under different numbers of critical flight plans.
Aerospace 12 00413 g017
Table 1. Node importance rankings under different evaluation methods.
Degree CentralityBetweenness CentralityPageRankEigenvector Centrality
114181414
218231815
315494913
41314152
54915133
619315118
7239566
85656368
9321449
1023105331
Disclaimer/Publisher’s Note: The statements, opinions and data contained in all publications are solely those of the individual author(s) and contributor(s) and not of MDPI and/or the editor(s). MDPI and/or the editor(s) disclaim responsibility for any injury to people or property resulting from any ideas, methods, instructions or products referred to in the content.

