1. Introduction
Aviation is changing, as increasing environmental concerns and climate change force aviation to lower its emissions [
1,
2]. To achieve this, engineers are working on novel concepts that promise to reduce the environmental impact, including carbon dioxide emissions, non-carbon emissions such as nitrogen oxides, contrails, and noise pollution. Available tools and methods oftentimes do not support unconventional concepts like distributed propulsion, boundary layer ingestion, and/or hybrid-electric powertrains from the start. Therefore, methods and tools need to be extended and calibrated to known aircraft and detailed simulations to achieve a meaningful comparison [
3,
4,
5].
Due to the increasing interest in aircraft with reduced environmental impact, the number of case studies focusing on novel aircraft concepts is steadily increasing [
6,
7]. However, as highlighted by Finger et al. [
8], these studies generally lack validation of the obtained results. This can mainly be attributed to the lack of reference data. So far, only a few unconventional aircraft with distributed [
9] or hybrid-electric propulsion [
10,
11,
12,
13] have flown with little public data available. Finger et al. [
8] therefore used a comparison of two different sizing methods to validate the results. This still leaves some uncertainties, as it cannot rule out a common error in both approaches. Trainelli et al. [
14] compared the results of a preliminary sizing tool with the data of the hybrid-electric Panthera from the Mahepa project. However, this was only done for the masses of the aircraft, with no comparison of actual flight data.
The study presented here addresses this gap in the current research by comparing the results obtained from a preliminary sizing tool with real-world flight data for a small serial hybrid-electric aircraft. Challenges include simplifying the actual mission so that explicit mission segments can be defined along with finetuning and calibrating the models. The underlying research question is two-fold; (i) How accurately can a digital-twin utilizing a simplified mission description replicate real-world flight performance of a hybrid electric aircraft? (ii) What is the estimated range limit for a high-performance hybrid-electric aircraft lifting operating constraints faced in real-world flight testing?
University of Stuttgart’s Institute of Aircraft Design is working on analytical aircraft design as well as flight testing with manned aircraft and scaled platforms [
15]. This research is performed on the manned hybrid-electric aircraft e-Genius with a digital version of the same aircraft modeled within the in-house version of the preliminary aircraft design tool SUAVE [
4]. Furthermore, this allows future projects to be assessed and evaluated early on, enabling the calibration of the methods used and support on future flight missions.
The concept of a digital twin involves creating a virtual representation of a physical system that is continuously updated with real-time data, enabling real-time monitoring, simulation, and optimization [
16,
17,
18]. This process typically encompasses several key steps as follows:
Modeling: Developing a high-fidelity digital replica of the physical system, incorporating its geometry, behavior, and operational characteristics [
19].
Calibration: Adjusting the digital model based on real-world data to ensure accuracy in performance predictions [
20].
Validation: Comparing the digital twin’s outputs with actual system behavior to confirm its reliability [
21].
Prediction: Utilizing the validated model to predict future performance, simulate different operating conditions, and optimize system behavior [
22].
The approach taken in this paper aligns with the principles of the digital twin concept. First, a model is established by representing the hybrid-electric aircraft within a design environment, incorporating its geometry, powertrain, and flight profile definitions. Next, this model is calibrated using measured flight data, ensuring that the simulated outcomes closely reflect real-world performance. Once the numerically generated results match the additional operational flight measurements under representative conditions, the digital twin is considered validated. Finally, the paper predicts the aircraft’s behavior under extended scenarios—removing certain real-world constraints—to estimate its full range potential.
The investigated aircraft, e-Genius, is a two-seater touring motor glider developed and built by the institute [
23]. The first flight took place in 2011 in a fully battery-electric configuration. Afterwards, extensive flight testing and many records followed, from the first electric aircraft to cross the Alps to the longest flight for an electrically powered aircraft below 1000 kg maximum take-off mass (MTOM) with the distance covered being over 500 km. After this, the aircraft was converted to a serial hybrid-electric aircraft, utilizing a combustion engine in the fuselage. This addresses the low energy density of the batteries while still achieving superior energy efficiency by operating the engine in optimal conditions. In this configuration, the aircraft was capable of extending its own record to more than 2000 km. Afterwards, the aircraft was converted to a fully-electric tow plane, towing gliders to altitude. This conversion was completed recently and the next step for the research platform is already planned, demonstrating an integrated skin heat exchanger in flight.
The paper is organized as follows.
Section 2 will give an overview of the methodology of the paper, including a detailed introduction of the aircraft e-Genius, its propulsion architecture, and the selected mission. Furthermore, the design tool used and the steps for calibration are explained.
Section 3 will highlight the calibration process of the model, show the accuracy compared to three real flight missions, and discuss uncertainties. Afterwards, in
Section 4, the true potential of the aircraft will be discussed, removing operational constraints. Finally, a summary and future outlooks are given in
Section 5.
2. Methodology
This section will introduce the aircraft e-Genius in its hybrid-electric configuration, also briefly describing the characteristics of the serial-hybrid propulsion system. Afterwards, the reference mission selected for this paper is explained, followed by an explanation of the design tool SUAVE. Furthermore, the simplification process for the mission is shown as well as the necessary steps to calibrate the digital twin including aerodynamic, structural, and propulsive efficiency.
2.1. e-Genius High Performance Hybrid
The e-Genius is one of the experimental research aircraft of the Institute of Aircraft Design of the University of Stuttgart [
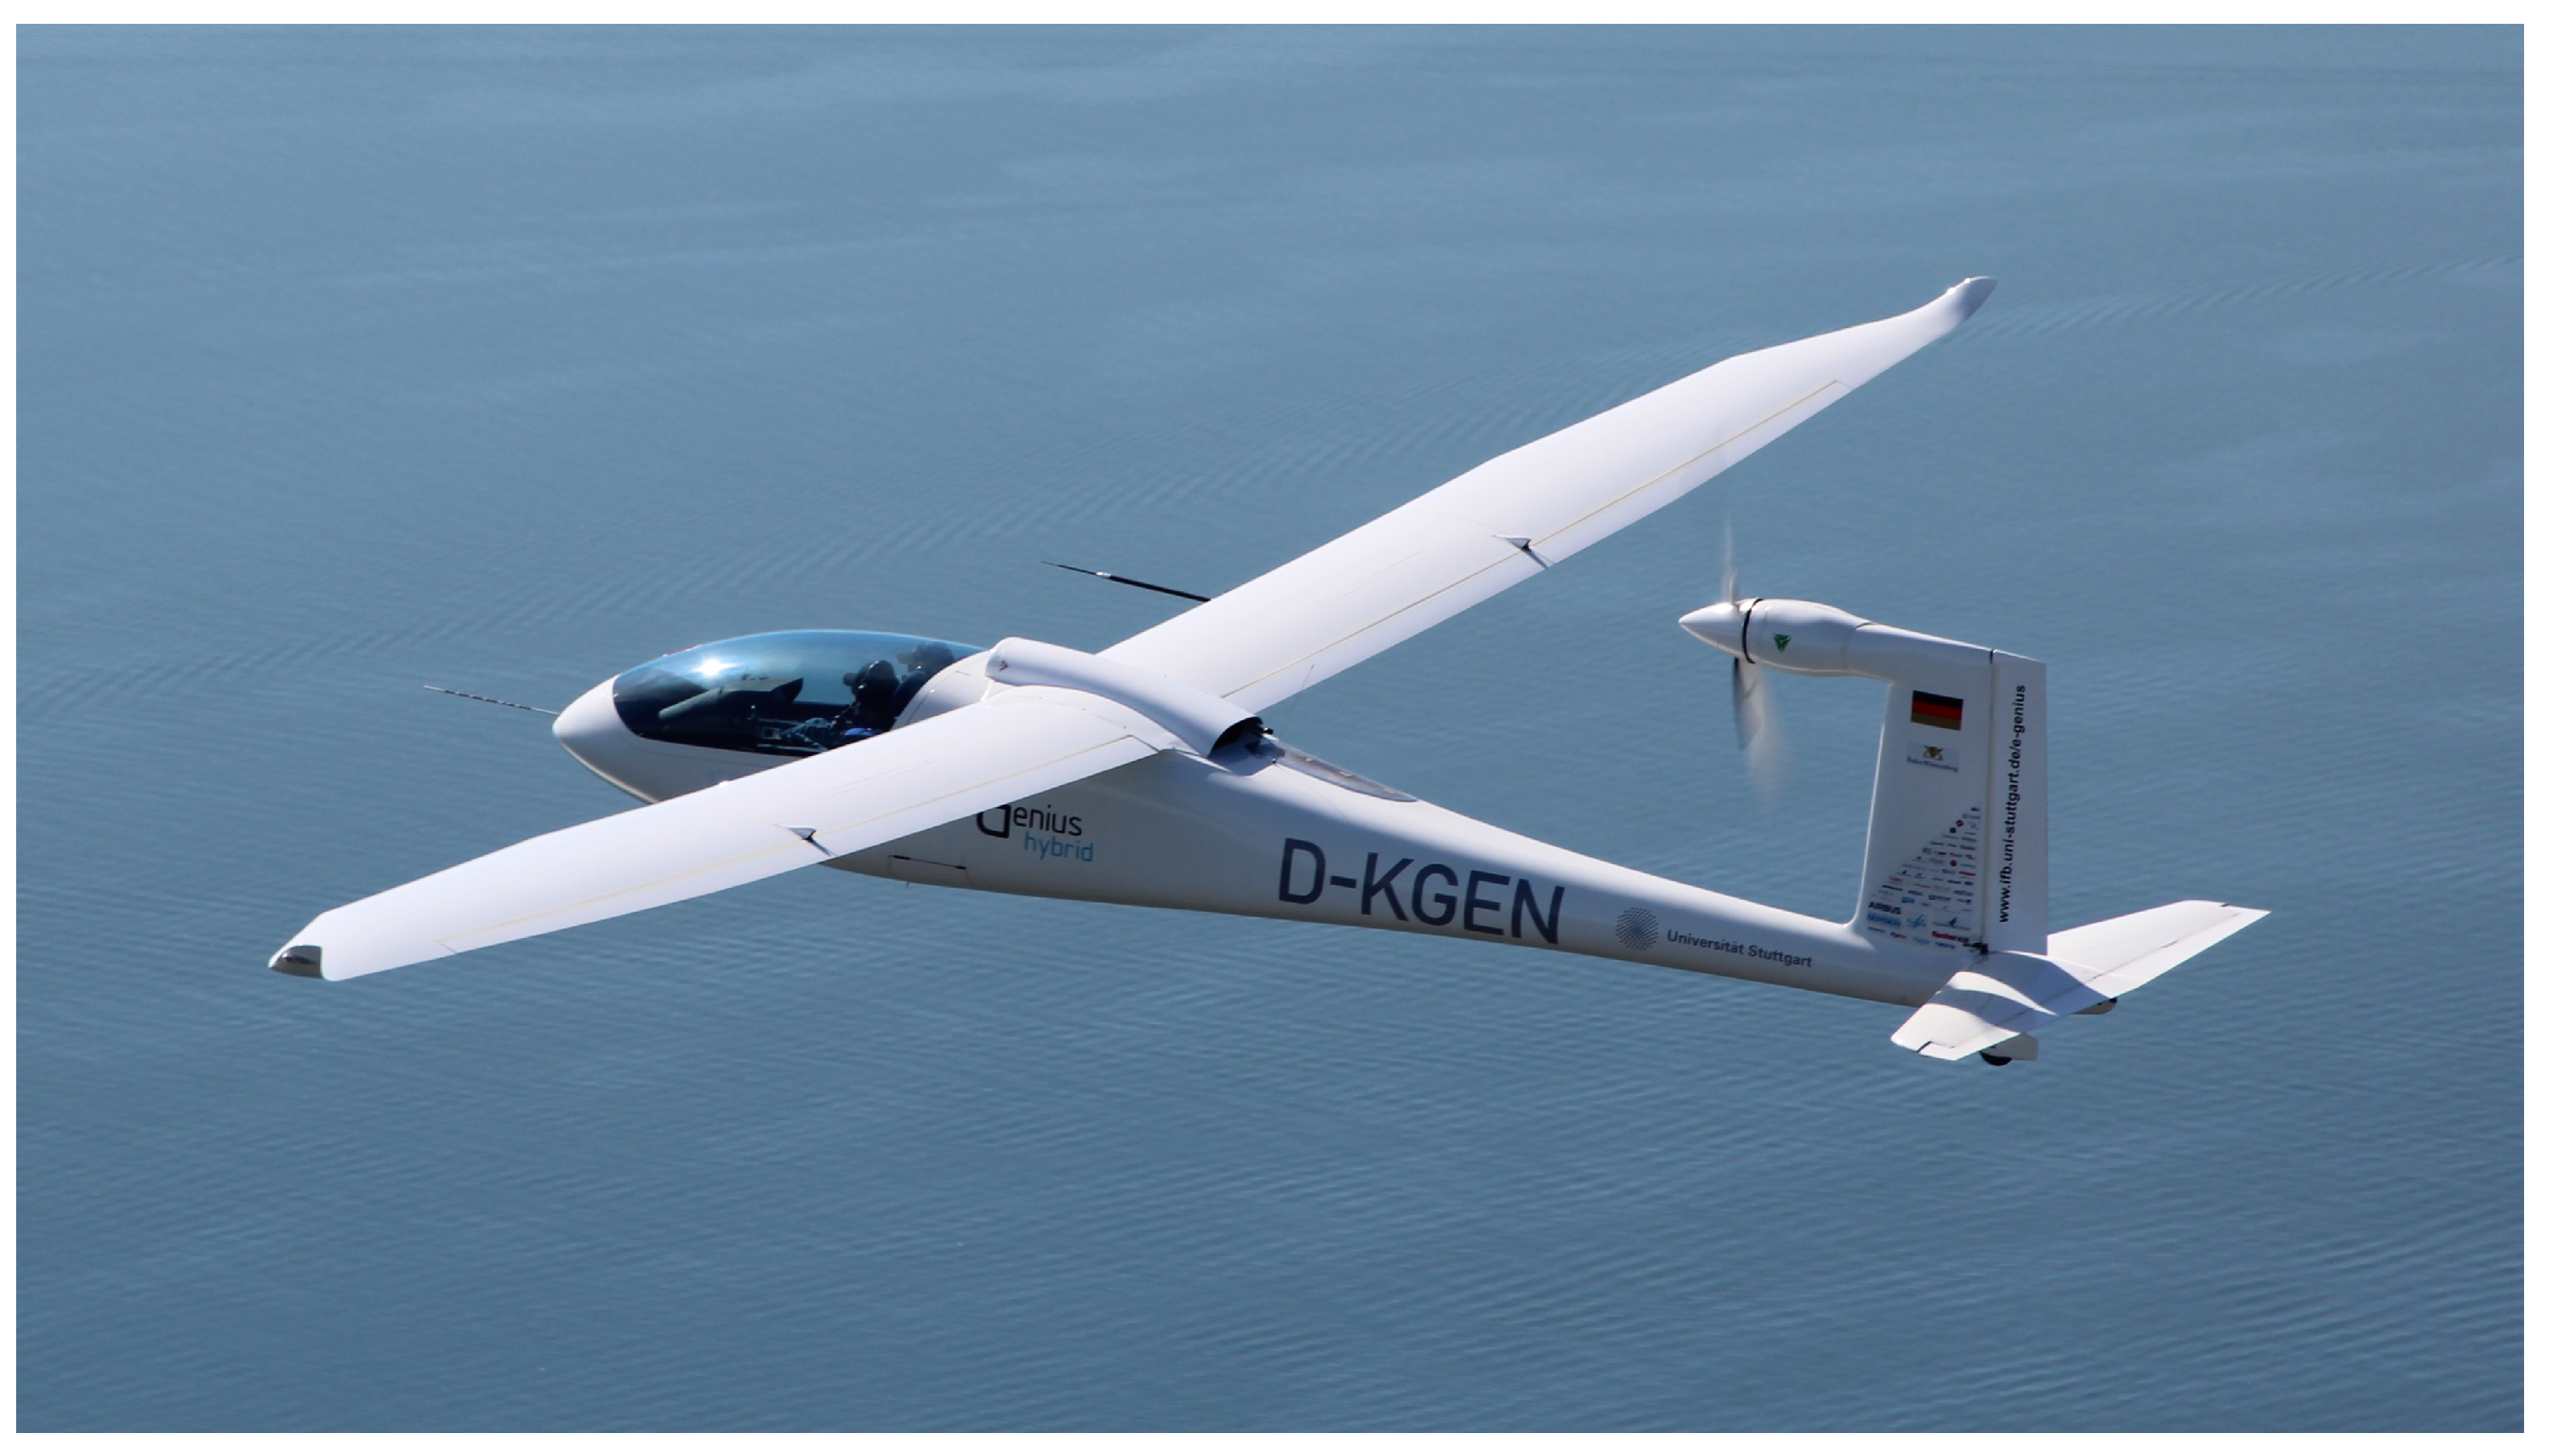
23]. It is a touring motor glider with a two-seat side-by-side cockpit and an unconventional propulsion layout, having the electrically driven propeller positioned at the top of the vertical stabilizer. The aircraft is used as a flying testbed to test and evaluate different powertrain architectures, energy sources, and novel concepts addressing sustainable aviation. For this, the initial purely battery-electric powertrain was replaced with a serial-hybrid configuration in 2018–2021 which can be seen in
Figure 1. General aircraft and propulsion system data are given in
Table 1.
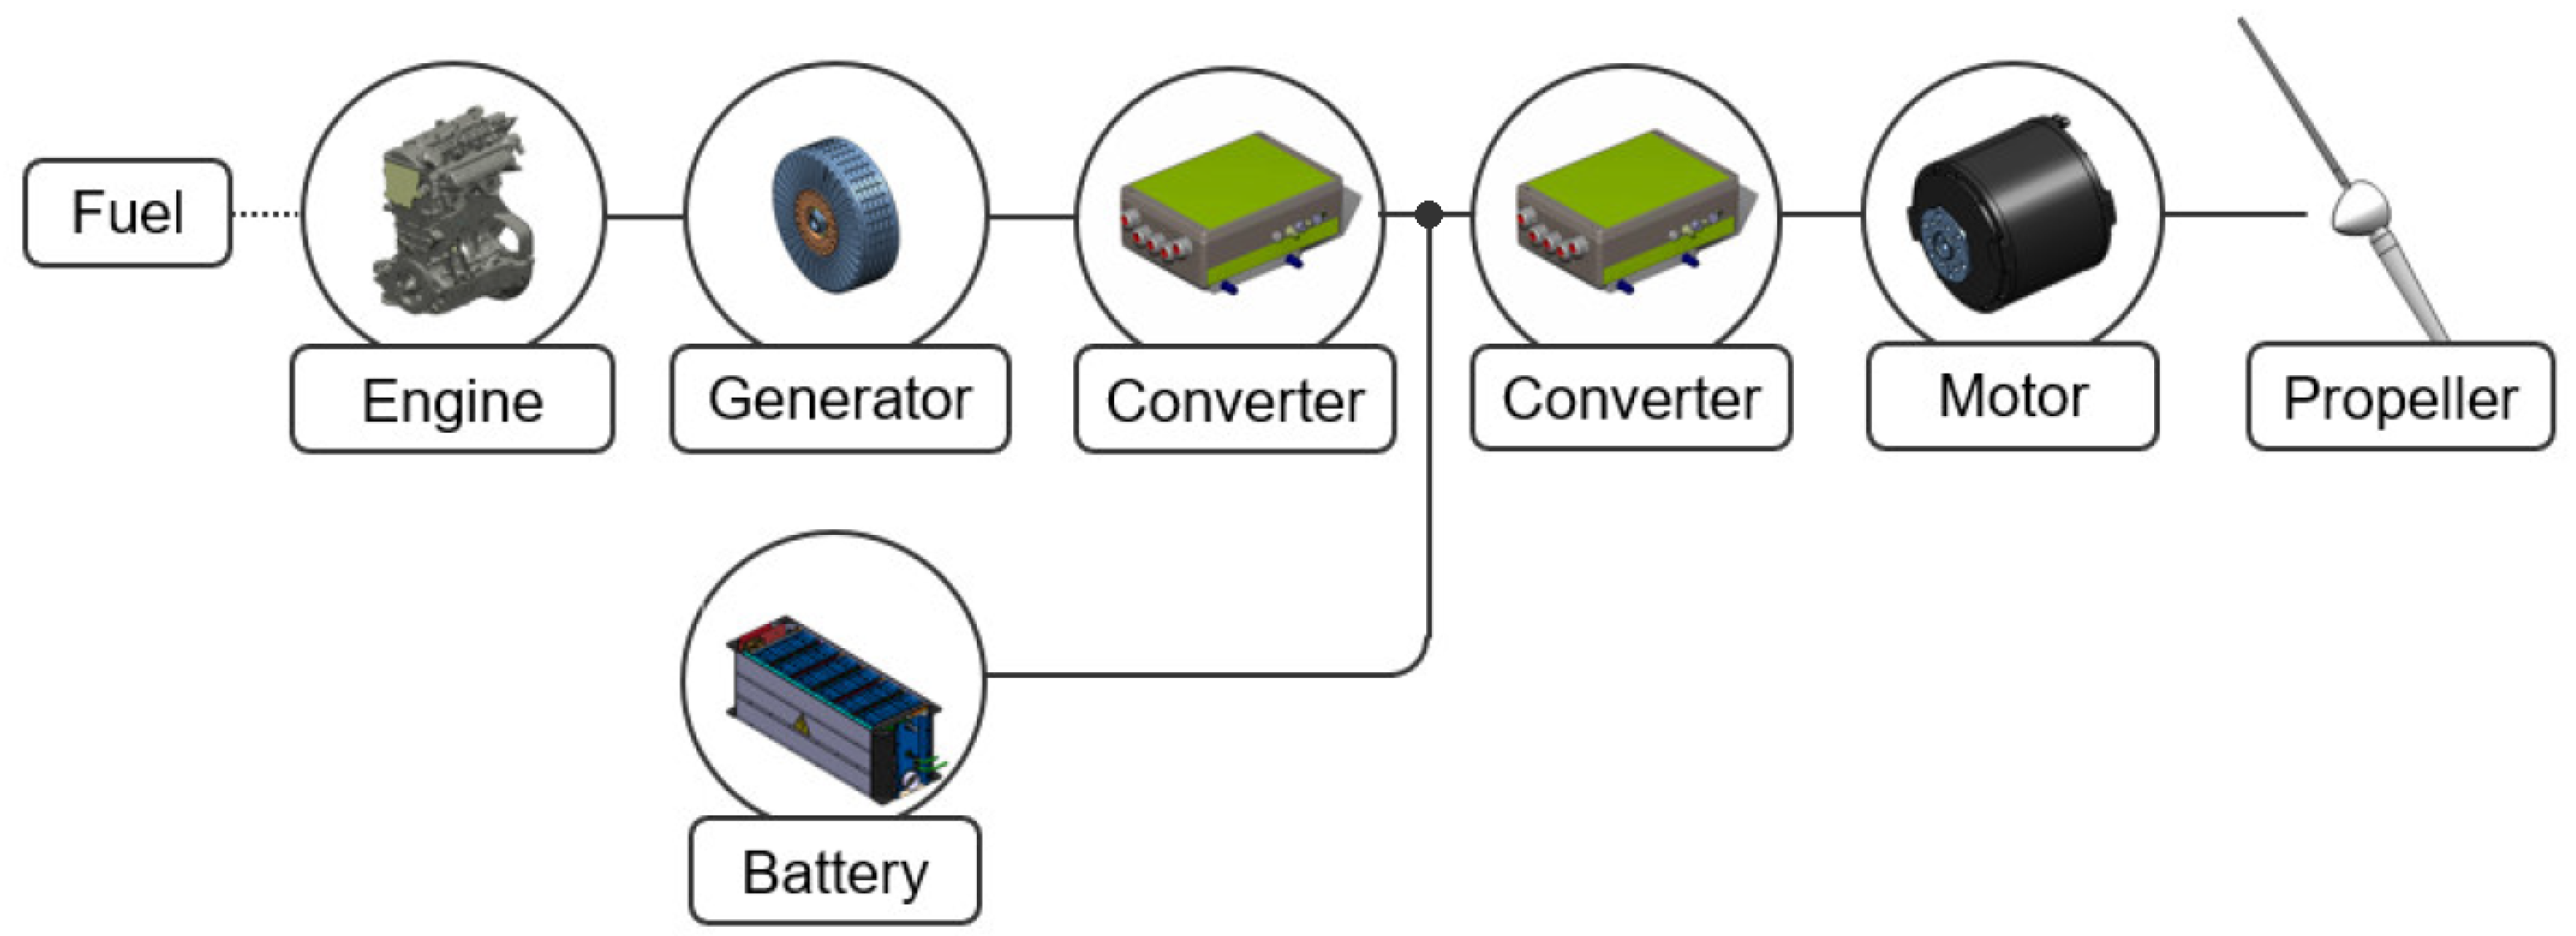
Figure 2 shows a sketch of its series hybrid-electric propulsion architecture. The automotive diesel engine is connected to a generator which, via a converter (or later called electronic speed controller (ESC) within SUAVE), provides power to the high-voltage (HV) DC-bus. A second converter is used to transform the DC power into AC power to drive the electric motor which is directly coupled to the two-blade propeller. In general, the battery is only used to boost the power of the generator during take-off and climb. However, it is powerful enough to allow for a fully electric take-off and contains enough energy to cover the required visual flight rule (VFR) reserve of 30 min. If needed, the battery can also be recharged by the generator system during flight. Overall, the management is flexible and allows powering the propeller from the battery or generator alone, from both combined, or by recharging the batteries from the ICE as well as by the energy harvesting of the propeller.
2.2. Reference Flight Mission
For the verification of the created model (see
Section 2.3), a mission from the 2022 flight test campaign is chosen. As deviations between the model and the real flight accumulate over time, the longest available mission is selected to obtain the highest possible accuracy. It was performed on 1 August 2022, aiming for the Federation Aeronautique Internationale (FAI) world record for the highest speed over a closed course of 2000 km for electrically driven aircraft with a maximum take-off mass below 1000 kg (FAI Class C1-b, Group 6) [
25].
To fulfill the requirements of this record category, the mission was conducted as an “out and return” flight. It started from the test site AREA BW in Mengen (EDTM), the home base of the e-Genius, flying to the turn-point over Saint-Jean-de-Luz at the French–Spanish border and back to EDTM. The official record distance, measured from point to point, was
km, with the e-Genius setting an absolute distance record in its FAI class. The actual flight covered a distance of
km over a flight time of 10 h 31 min, with an official average ground speed of
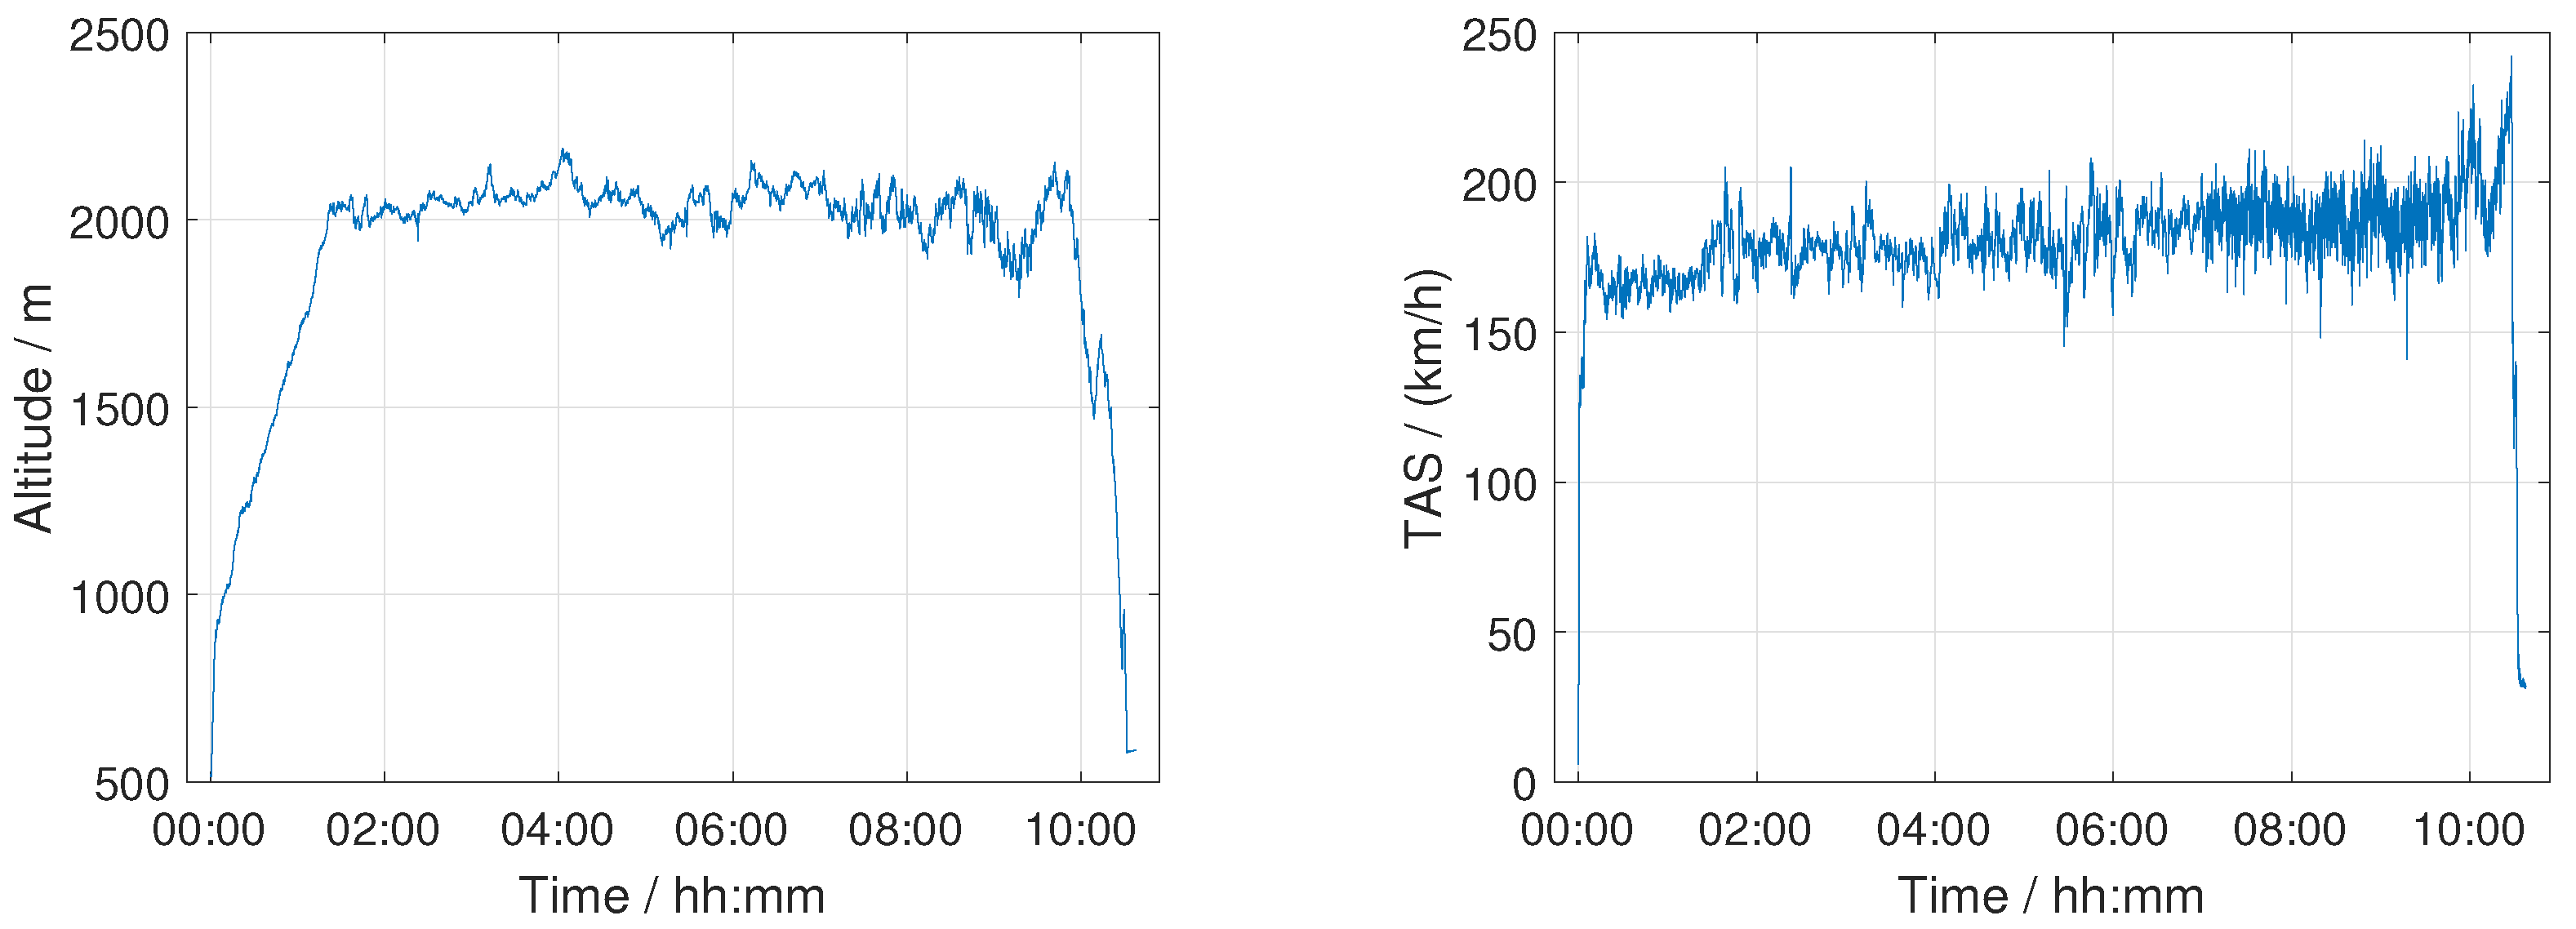
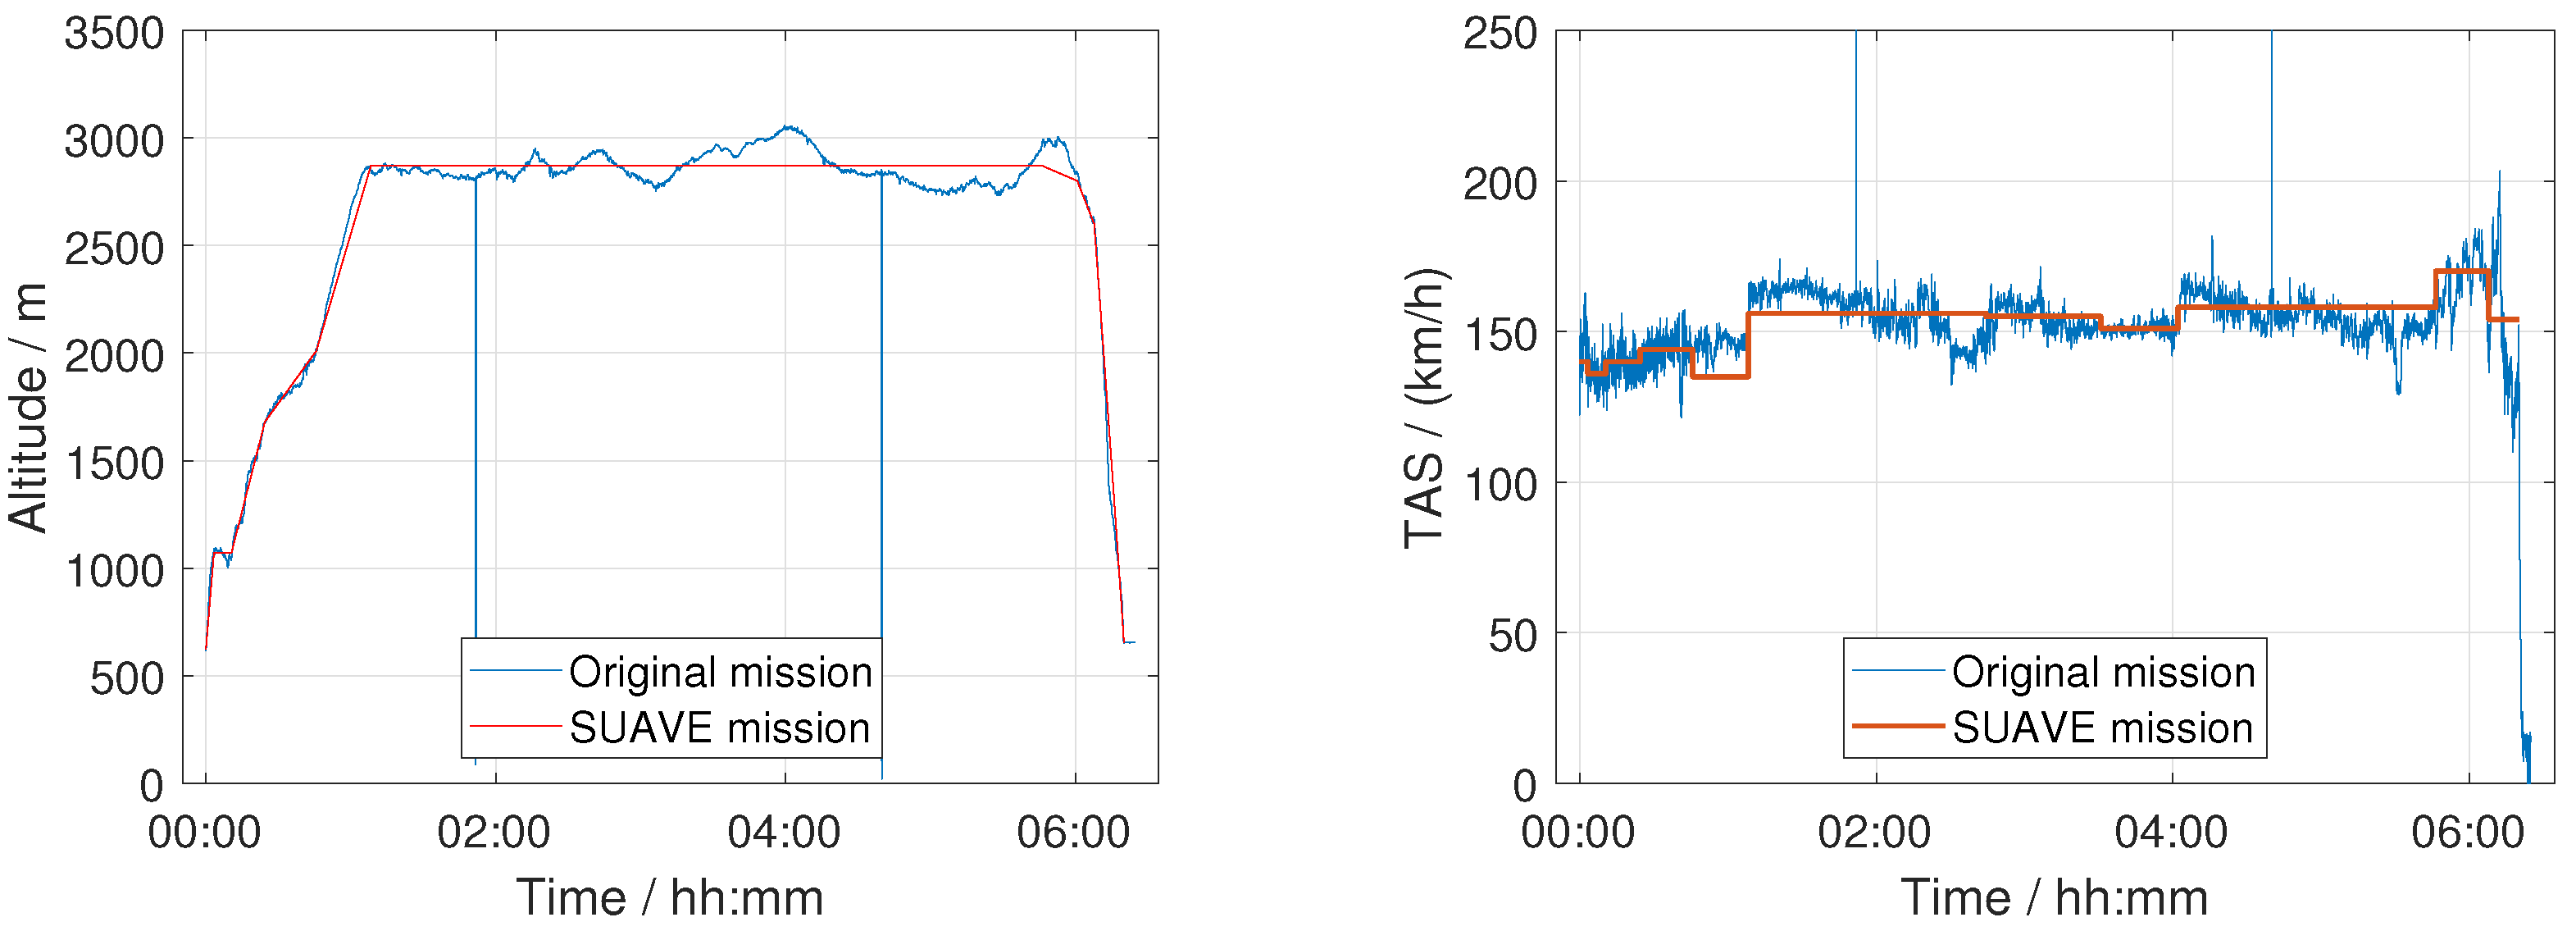
km/h. The altitude and speed profile of the record flight can be seen in
Figure 3. A total of 83 L of Diesel was used, giving an average fuel consumption of
L per 100 km per passenger.
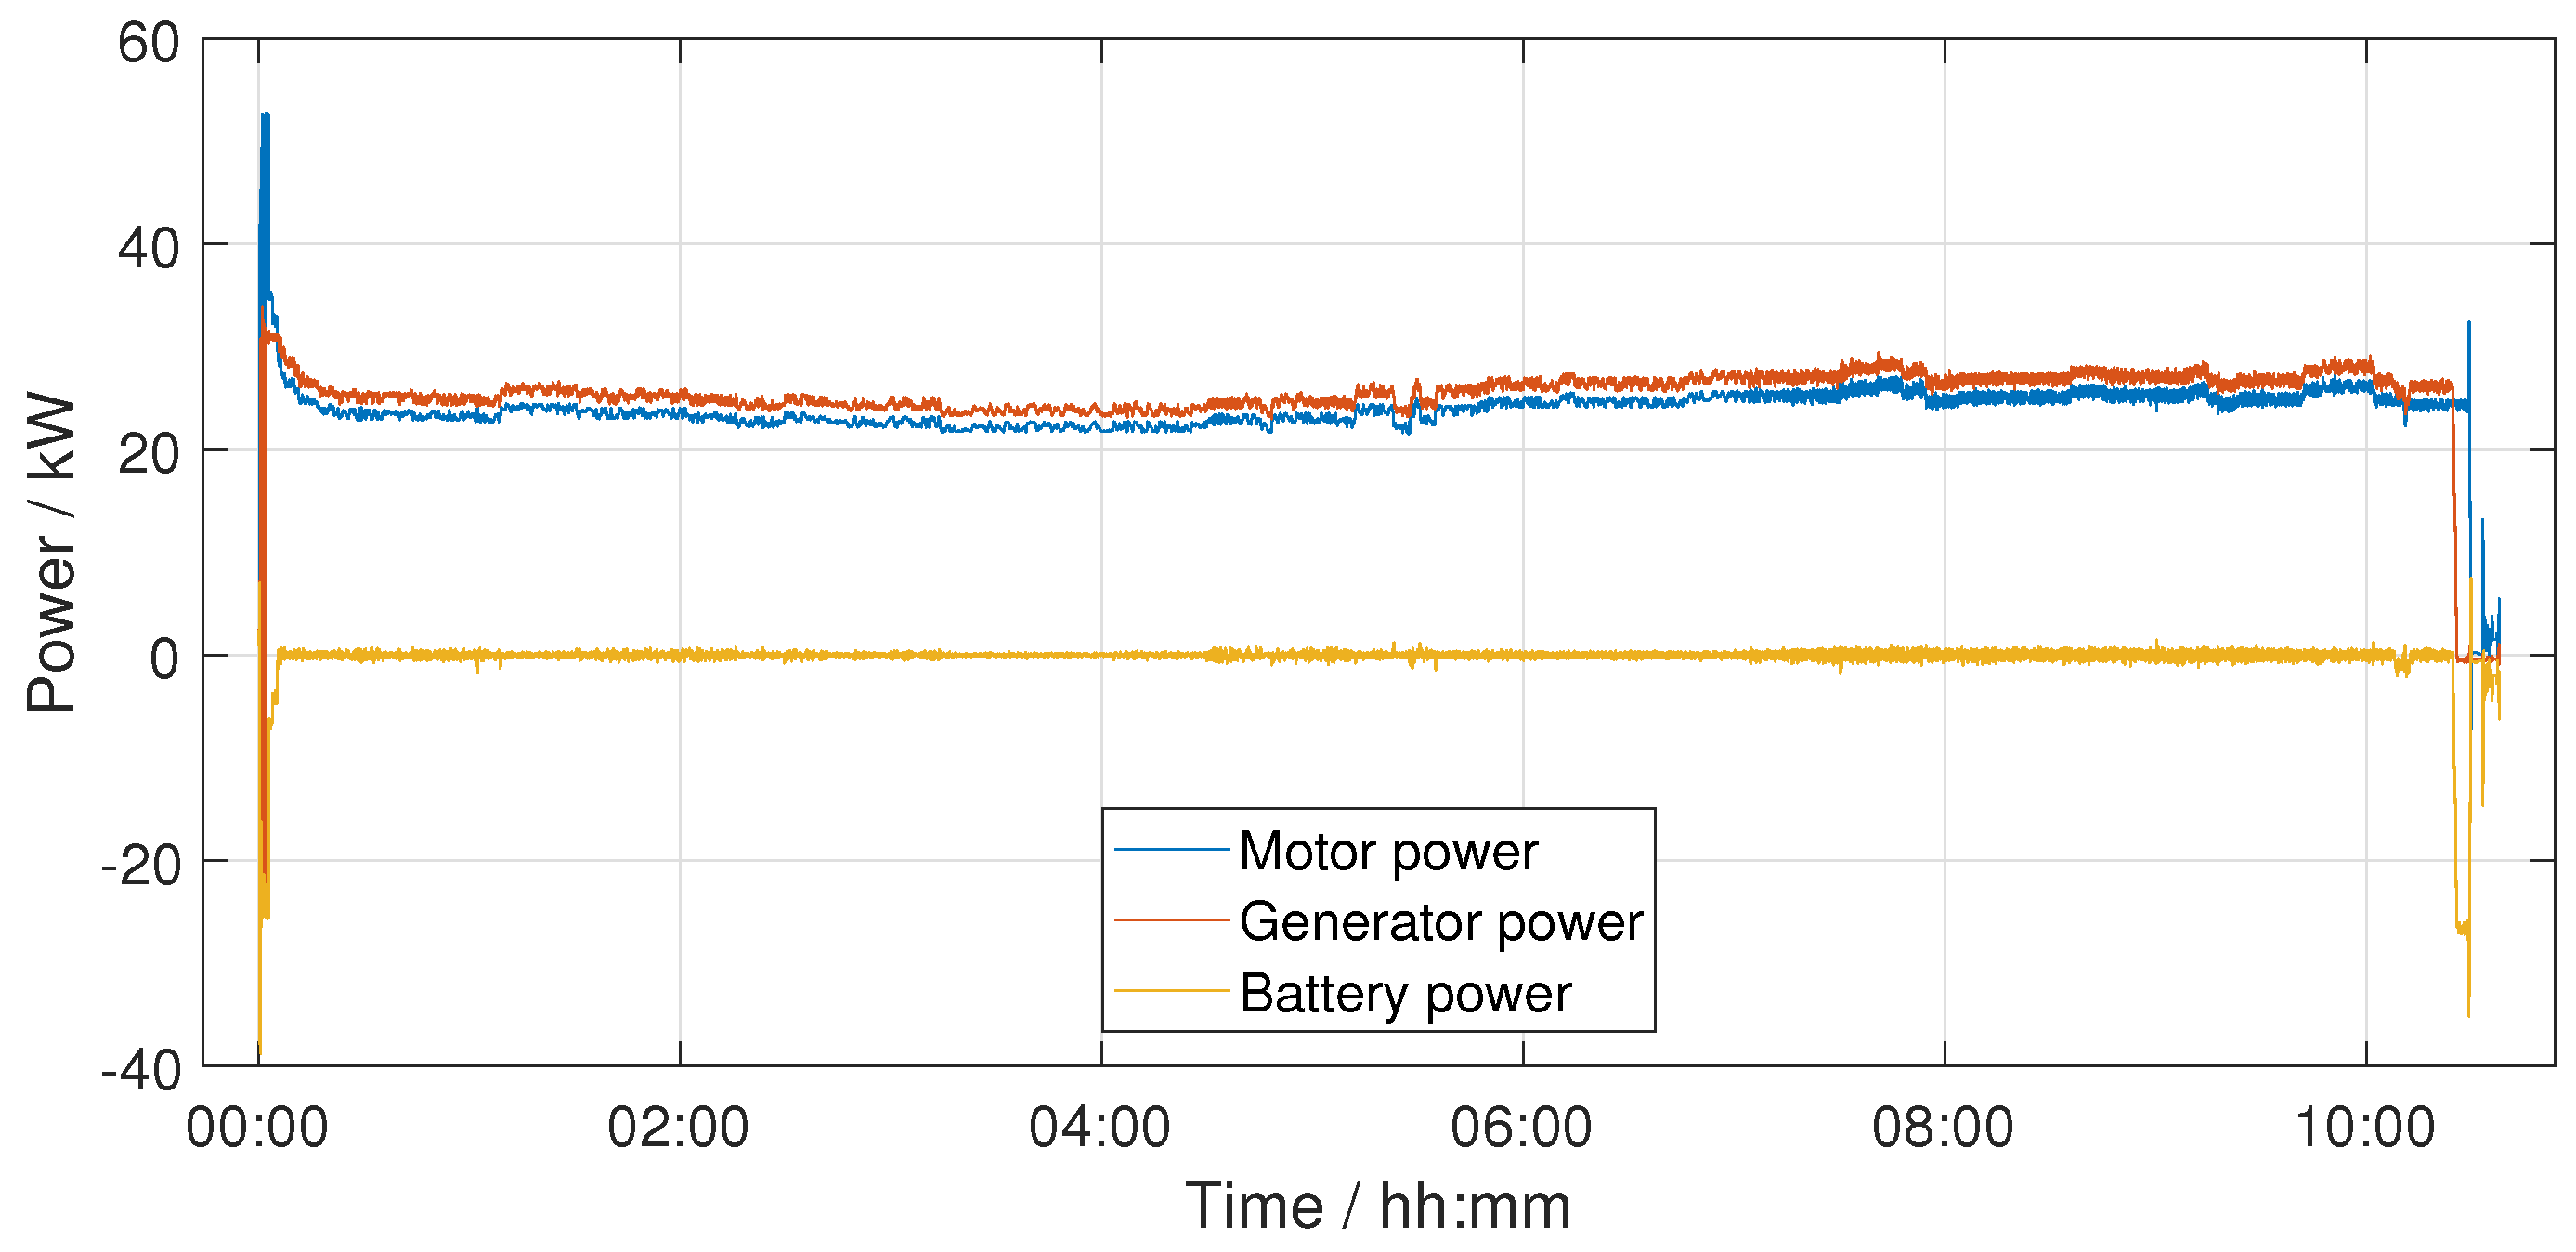
Figure 4 shows the power profile for the mission of the converter and electric motor, the diesel engine plus generator (called Genset), and the battery. The powers were measured at the HV-bus; therefore, the efficiency of the generator and its converter is already included. On the other hand, the efficiency of the converter of the electric motor needs to be taken into account to estimate the actual power of the electric motor. This also explains why the power of the Genset and electric motor are almost identical in this figure, while in reality there is a slight difference between the actual power of the diesel engine and the electric motor. It can be seen that the majority of the flight was performed solely on Genset power, with the battery only boosting it during the initial climb. The battery was then used again at the end of the mission, where the Genset was shut off to allow it to cool down. As the cooling of the diesel engine is only provided by the airflow generated by the movement of the aircraft, it is difficult to cool the engine while on the ground. To avoid the risk of hotspots forming inside the engine compartment, located in the central fuselage that could damage the structure, this cool down routine is performed at the end of every flight. External cooling on ground would take time to install on the aircraft after landing, increasing the risk of hotspots, while active cooling would increase mass and reduce aircraft performance. It should be noted that the battery was not recharged in flight for this mission. During take-off and initial climb, only
kWh were used, leaving the battery at a state of charge (SOC) of 88%. The battery voltage after the climb was at 434 V. To prevent an overvoltage during operation, the limit for recharging the battery via the generator is set to 430 V. Therefore, recharging would have been possible only after using more energy from the battery. However, recharging the battery in flight is less efficient than using the Genset in a turbo-electric approach, due to conversion losses connected with the recharging. As the remaining energy in the battery was still sufficient for VFR reserves, there was no need for recharging it.
2.3. Aircraft Design Environment
SUAVE (Stanford University Aerospace Vehicle Environment) is a preliminary aircraft design toolbox in the form of a library, provided by the Stanford University [
26,
27]. It offers a range of tools and well-established empirical methods for mass estimation, aerodynamics, and mission analysis. Within this framework, the vehicle and its configurations (e.g., flaps settings and landing gear extracted or retracted) are defined. Additionally, SUAVE enables the modeling and integration of multidisciplinary and multi-fidelity surrogate models [
28], facilitating a more accurate and adaptable aircraft design process.
One major advantage of SUAVE is its numerical modeling of the mission, as opposed to relying on the Breguet equation. The Breguet equation integrates range calculations with flight and propulsion system equations [
29,
30,
31], which is advantageous for conventional propulsion architectures (i.e., combustion engines) due to its analytical solution. However, for hybrid-electric systems that combine combustion engines with batteries, the Breguet equation is not universally valid [
32,
33]. Therefore, SUAVE’s mission analysis numerically solves the flight equations, providing a robust framework for integrating hybrid-electric propulsion architectures by decoupling range calculations from the propulsion system.
The mission analysis in SUAVE is based on a predefined mission consisting of multiple segments, where derivatives are evaluated at 16 points per segment by default. The predefined mission is further detailed in
Section 2.3.1. The necessary aerodynamic modeling for the flight equations is addressed in
Section 2.3.2, alongside the propulsion architectures in
Section 2.3.3.
In SUAVE, the energy network serves as the mathematical representation of the propulsion architecture and must provide both thrust and vehicle mass flow (i.e., fuel consumption) for mission analysis. For this study, the energy network is specifically modeled for the hybrid-electric propulsion system as shown in
Section 2.1. This approach enables the calculation of missions for various powertrain configurations, including hybrid-electric systems, provided that all relevant equations are incorporated within the energy network.
For this study, an in-house version of this open-source tool has been used and extended to model the serial-hybrid powertrain. Additionally, meteorological influences, such as wind effects, have been incorporated into the framework. Normally, only idealized design missions are considered in SUAVE, and thus, meteorological influence is of no interest. The flight times of the hybrid e-Genius are long compared to the purely electric version. This means, that the meteorological conditions, especially wind, have a significant impact on the energy and fuel consumption during the mission. In addition, in this case, a real mission is modeled, which in contrast to the ideal aircraft design world is influenced by wind. Therefore, these effects have been included into the mission-solving process. The impact on the ground speed of the aircraft and thus distance traveled, as well as change in the energy requirements, are included. Energy is not only affected by headwind or tailwind but also crosswind, due to the compensation necessary to stay on track. To include wind, the user now has to specify in the mission definition for each mission segment the true wind direction (TWD) and speed (WS), as well as define the true course (TC) and airspeed (TAS) at which the aircraft is flying. Based on this, the wind angle (WA, Equation (
1)) is calculated. Depending on the result,
needs to be added (WA
) or subtracted (WA
).
The wind correction angle (WCA) is calculated with Equation (
2).
Finally, true heading (TH, Equation (
3)) and ground speed (GS, Equation (
4)) are calculated.
The ground distance to be covered during a mission segment and, together with the wind correction angle, the flight time increases or decreases based on the specified wind speed and direction. This results in a change in the energy requirements for the flight.
The basic structure of the SUAVE model was adapted from an existing model of the e-Genius, which, however, uses a purely battery-electric propulsion system. More detailed information on this model can be found in the work of Grüning [
34]. Starting from this model, the key aspects and the changes made are highlighted in the following sections.
2.3.1. Mission Definition
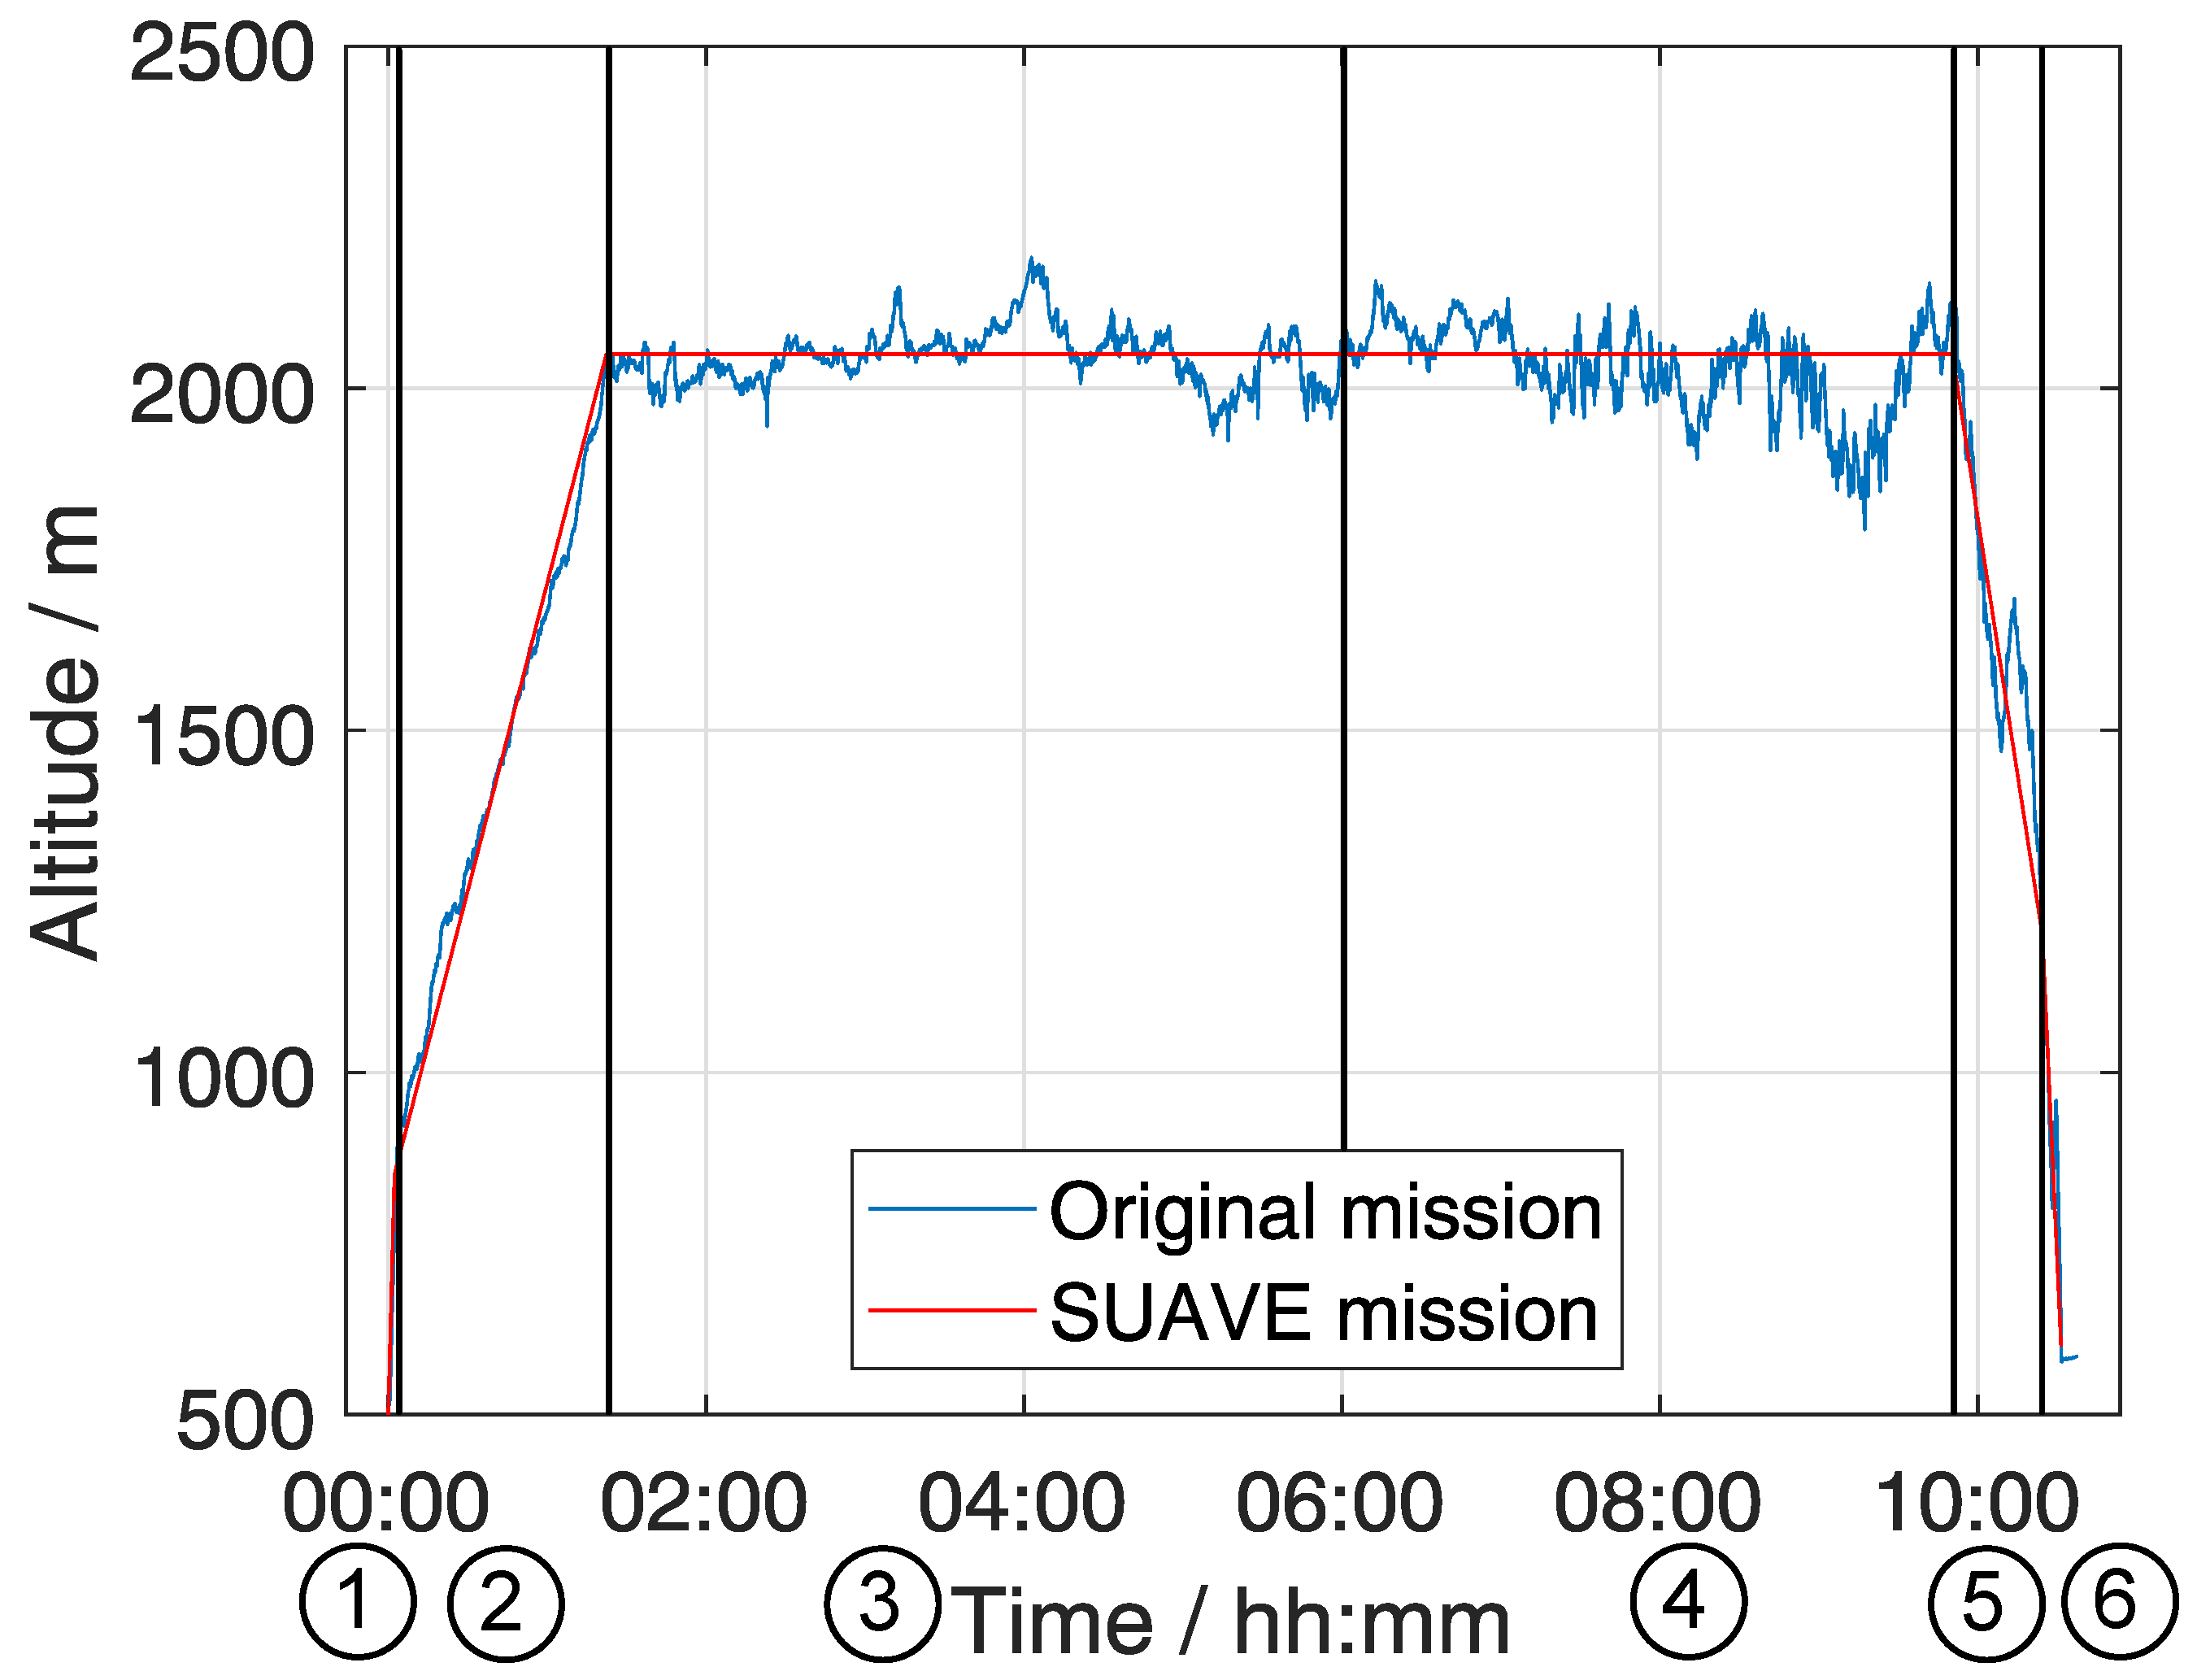
Figure 5 shows how the SUAVE mission segments were derived from the real-world mission and is grouped into the following 6 parts: (1) initial climb, (2) climb, (3) cruise out, (4) cruise return, (5) descent, and (6) final approach. The initial climb (1) is separated from climb (2) by the usage of available energy; first, the first segment battery and generator are used, while in the second segment battery power is 0 kW and all power is provided by the ICE over the generator. Part (3) represents the first half of the cruise, flying out to the turn point over Saint-Jean-de-Luz, while (4) is the cruise return to the home base in Mengen. Finally, the descent is segmented again into two parts, the reason for that once more being related to the energy source used. In part (5), the ICE is still operating and provides the needed power. For the final approach (6), only battery power is used to account for the cooling requirement of the ICE in the real mission.
2.3.2. Aerodynamics
For the aerodynamic model, the SUAVE internal model Fidelity Zero was used. This is based on a combination of several semi-empirical models, which describe lift using a vortex-lattice model [
35]. The drag is divided into parasitic, induced, compressible, and miscellaneous drag. Parasitic and compressible drag is calculated using the Shevell method [
36,
37], while induced drag is calculated using a vortex lattice model. Miscellaneous drag is taken into account by other factors. More information on Fidelity Zero can be found in the work of Lukaczyk et al. [
35].
2.3.3. Propulsion System Modeling
The series hybrid-electric powertrain, see
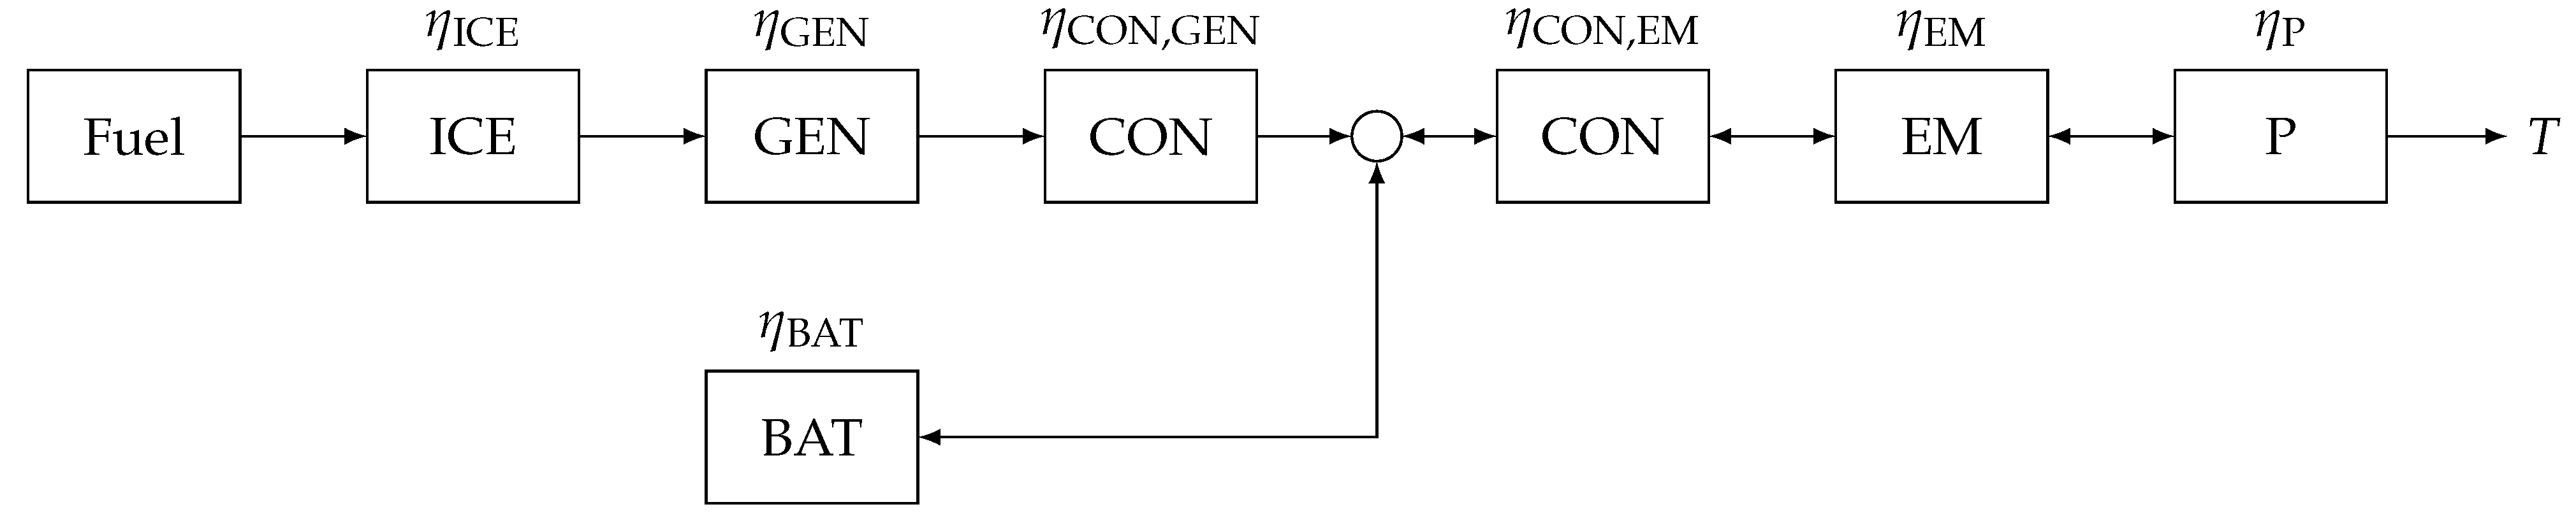
Figure 2, of the e-Genius is mathematically represented within the energy network of SUAVE. To accurately model this powertrain, a new network is developed, combining components of a conventional with a battery-electric propulsion system. The network consists of key components, including the internal combustion engine (ICE), generator (GEN), converter of the generator (CON), battery (BAT), converter of the electric motor (CON), electric motor (EM), and propeller (P), all adapted to the specific powertrain architecture of the e-Genius, as illustrated in
Figure 6.
Those components are given a specific efficiency
value based on the available data sheets and the experience gathered during operation, which can be found in
Table 2.
This newly developed energy network provides a physics-based approach to modeling the propulsion system. The required electric motor power is calculated based on the thrust demand from the propeller. To supply this power, the combustion engine operates up to its maximum output before any additional power demand is provided by the battery. However, in each mission segment, the battery power contribution can be manually adjusted by either an absolute or a relative value in relation to the required power. This capability is particularly used during the initial climb, where a battery power reference of 25 kW is set, ensuring the more accurate representation of the reference mission.
2.3.4. Mass Estimation
The mass of the e-Genius can be estimated using the Raymer [
37] and Flops [
41] methods. Due to the reason that the operating empty mass and (maximum) takeoff mass are exactly known, estimations are not required. Furthermore, detailed information on component masses is also available but is not needed for the simulations of interest. Therefore, the empty mass of 763 kg is directly specified in the definition, as well as the takeoff mass of 950 kg.
3. Results
To close the gap between the real-world e-Genius and its digital twin in SUAVE, the model is calibrated using the flight data from the reference mission in
Section 2.2. This calibration primarily refers to aerodynamic and propulsion-specific adjustments to ensure that the model does match the actual performance of the e-Genius.
3.1. Calibration of the Model
The calibration process focuses on two key areas, aerodynamics and the propulsion system, comparing them with real-flight data and minimizing discrepancies between both. As there are too many unknowns due to the limited amount of parameters currently measured in flight it is not possible to fully calibrate each subsystem. The calibration process is such that the outcome, e.g., known fuel flow is met, as changes to aerodynamics require an opposite adjustment to the propulsive efficiency to achieve similar fuel flow values in the model.
3.1.1. Propulsion
For this study, the components of the energy network are mainly defined by their efficiency. These are taken from the respective datasheet and modified where needed to match the power data from the real flight mission. For the ICE, the efficiency is defined by the specific fuel consumption (SFC). This is set to 240 g/kWh (0.3946 lb/hp/h) for the first cruise segment (for the third mission segment, see
Figure 5) and 250 g/kWh (0.411 lb/hp/h) for the remaining mission. For the battery, an efficiency of 99% is assumed for the entire mission. For the remaining components, the efficiencies used are presented in
Table 2.
3.1.2. Aerodynamics
The results of the low-fidelity aerodynamic model in SUAVE are compared with a measured lift-over-drag polar versus speed [
42]. The measurements found in
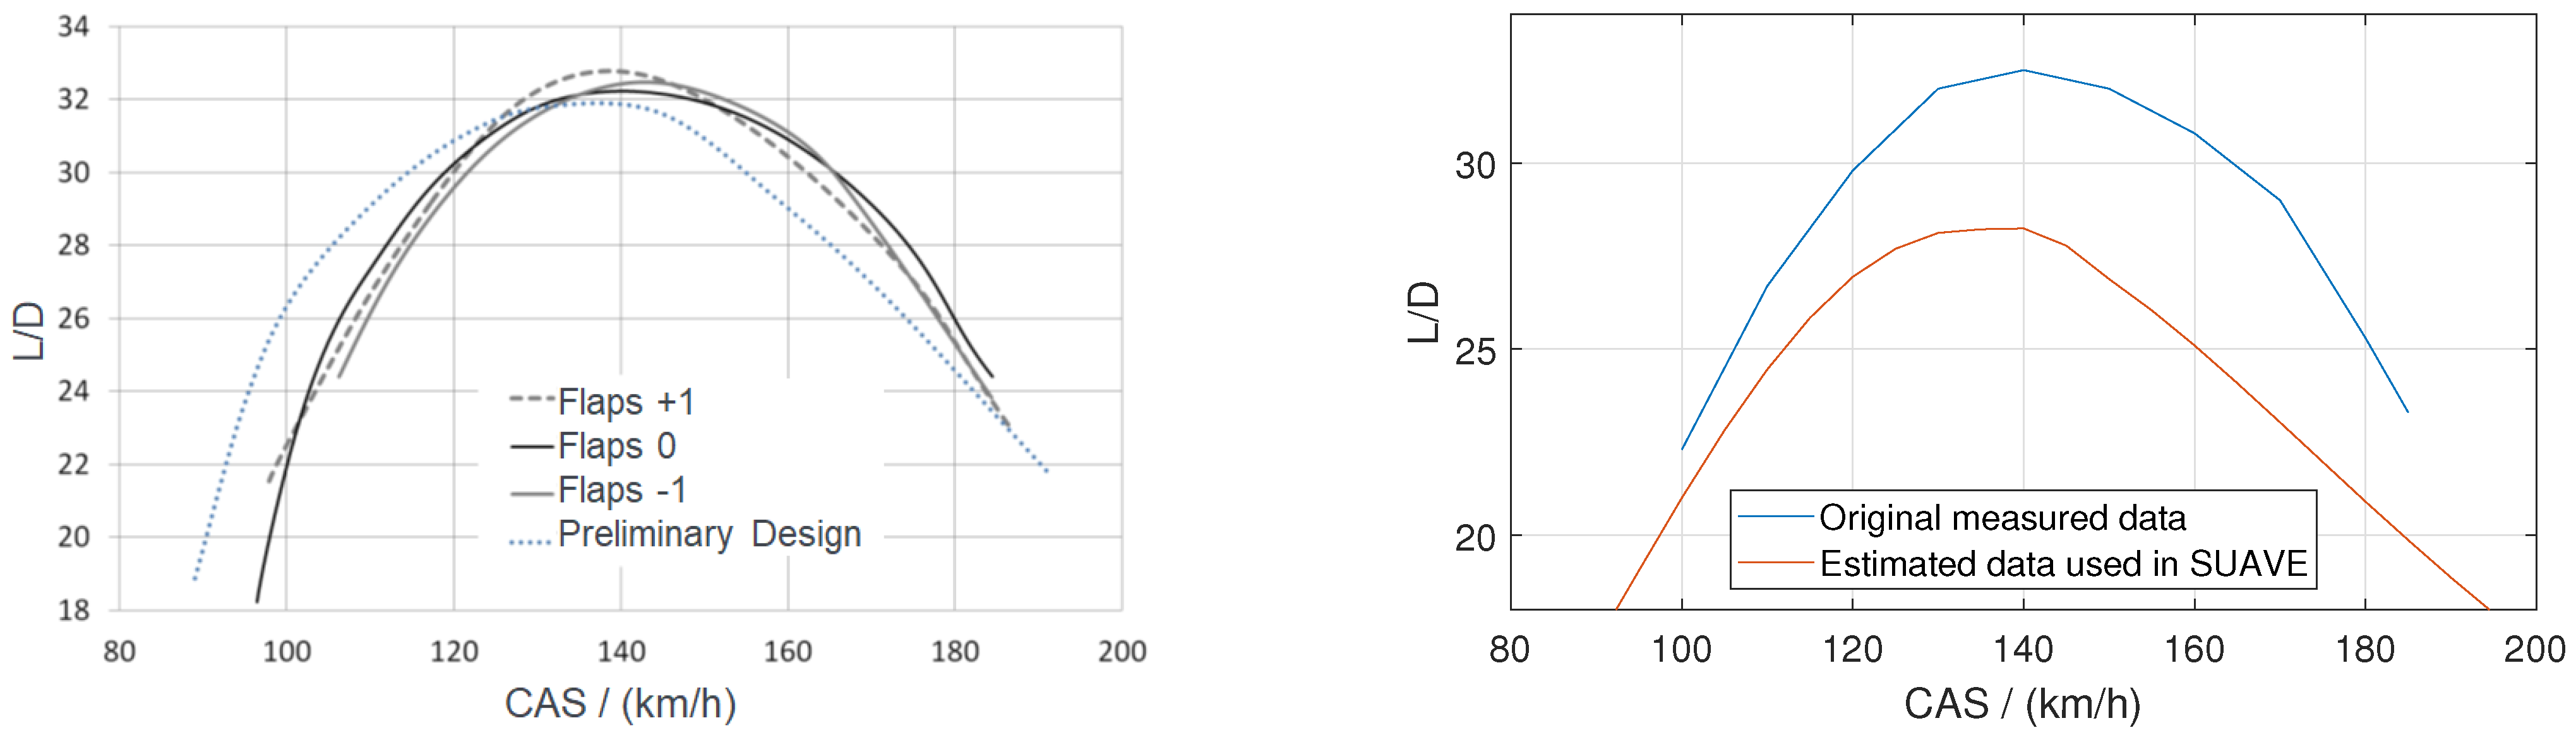
Figure 7 (left-hand side) are taken from the clean battery-electric e-Genius without a propeller and the cooling inlet of the hybrid-electric version. As a result, the measured data overestimate the glide performance of the hybrid e-Genius and a reduction in glide ratio is necessary. However, the exact difference is unknown. CFD studies on the flow through the cooling inlet and the resulting drag, carried out by Lindner [
43], calculated an increase of 8.8% at a Calibrated Airspeed (CAS) of 150 km/h. This leads to a reduction of the lift-to-drag (L/D) ratio, from 32 to 29.4. Flight tests with the hybrid-electric variant suggest an additional reduction of the glide ratio caused by the influence of the propeller. Based on the experience from these tests, it can be estimated that the maximum L/D is around 28. To further validate this estimation, additional flight tests are needed and planned for the upcoming season. These include an in-flight thrust and torque measurement of the propeller. This allows for a direct calculation of the glide ratio for all flight conditions, as well as an efficiency estimation of the overall powertrain, including the propulsive efficiency.
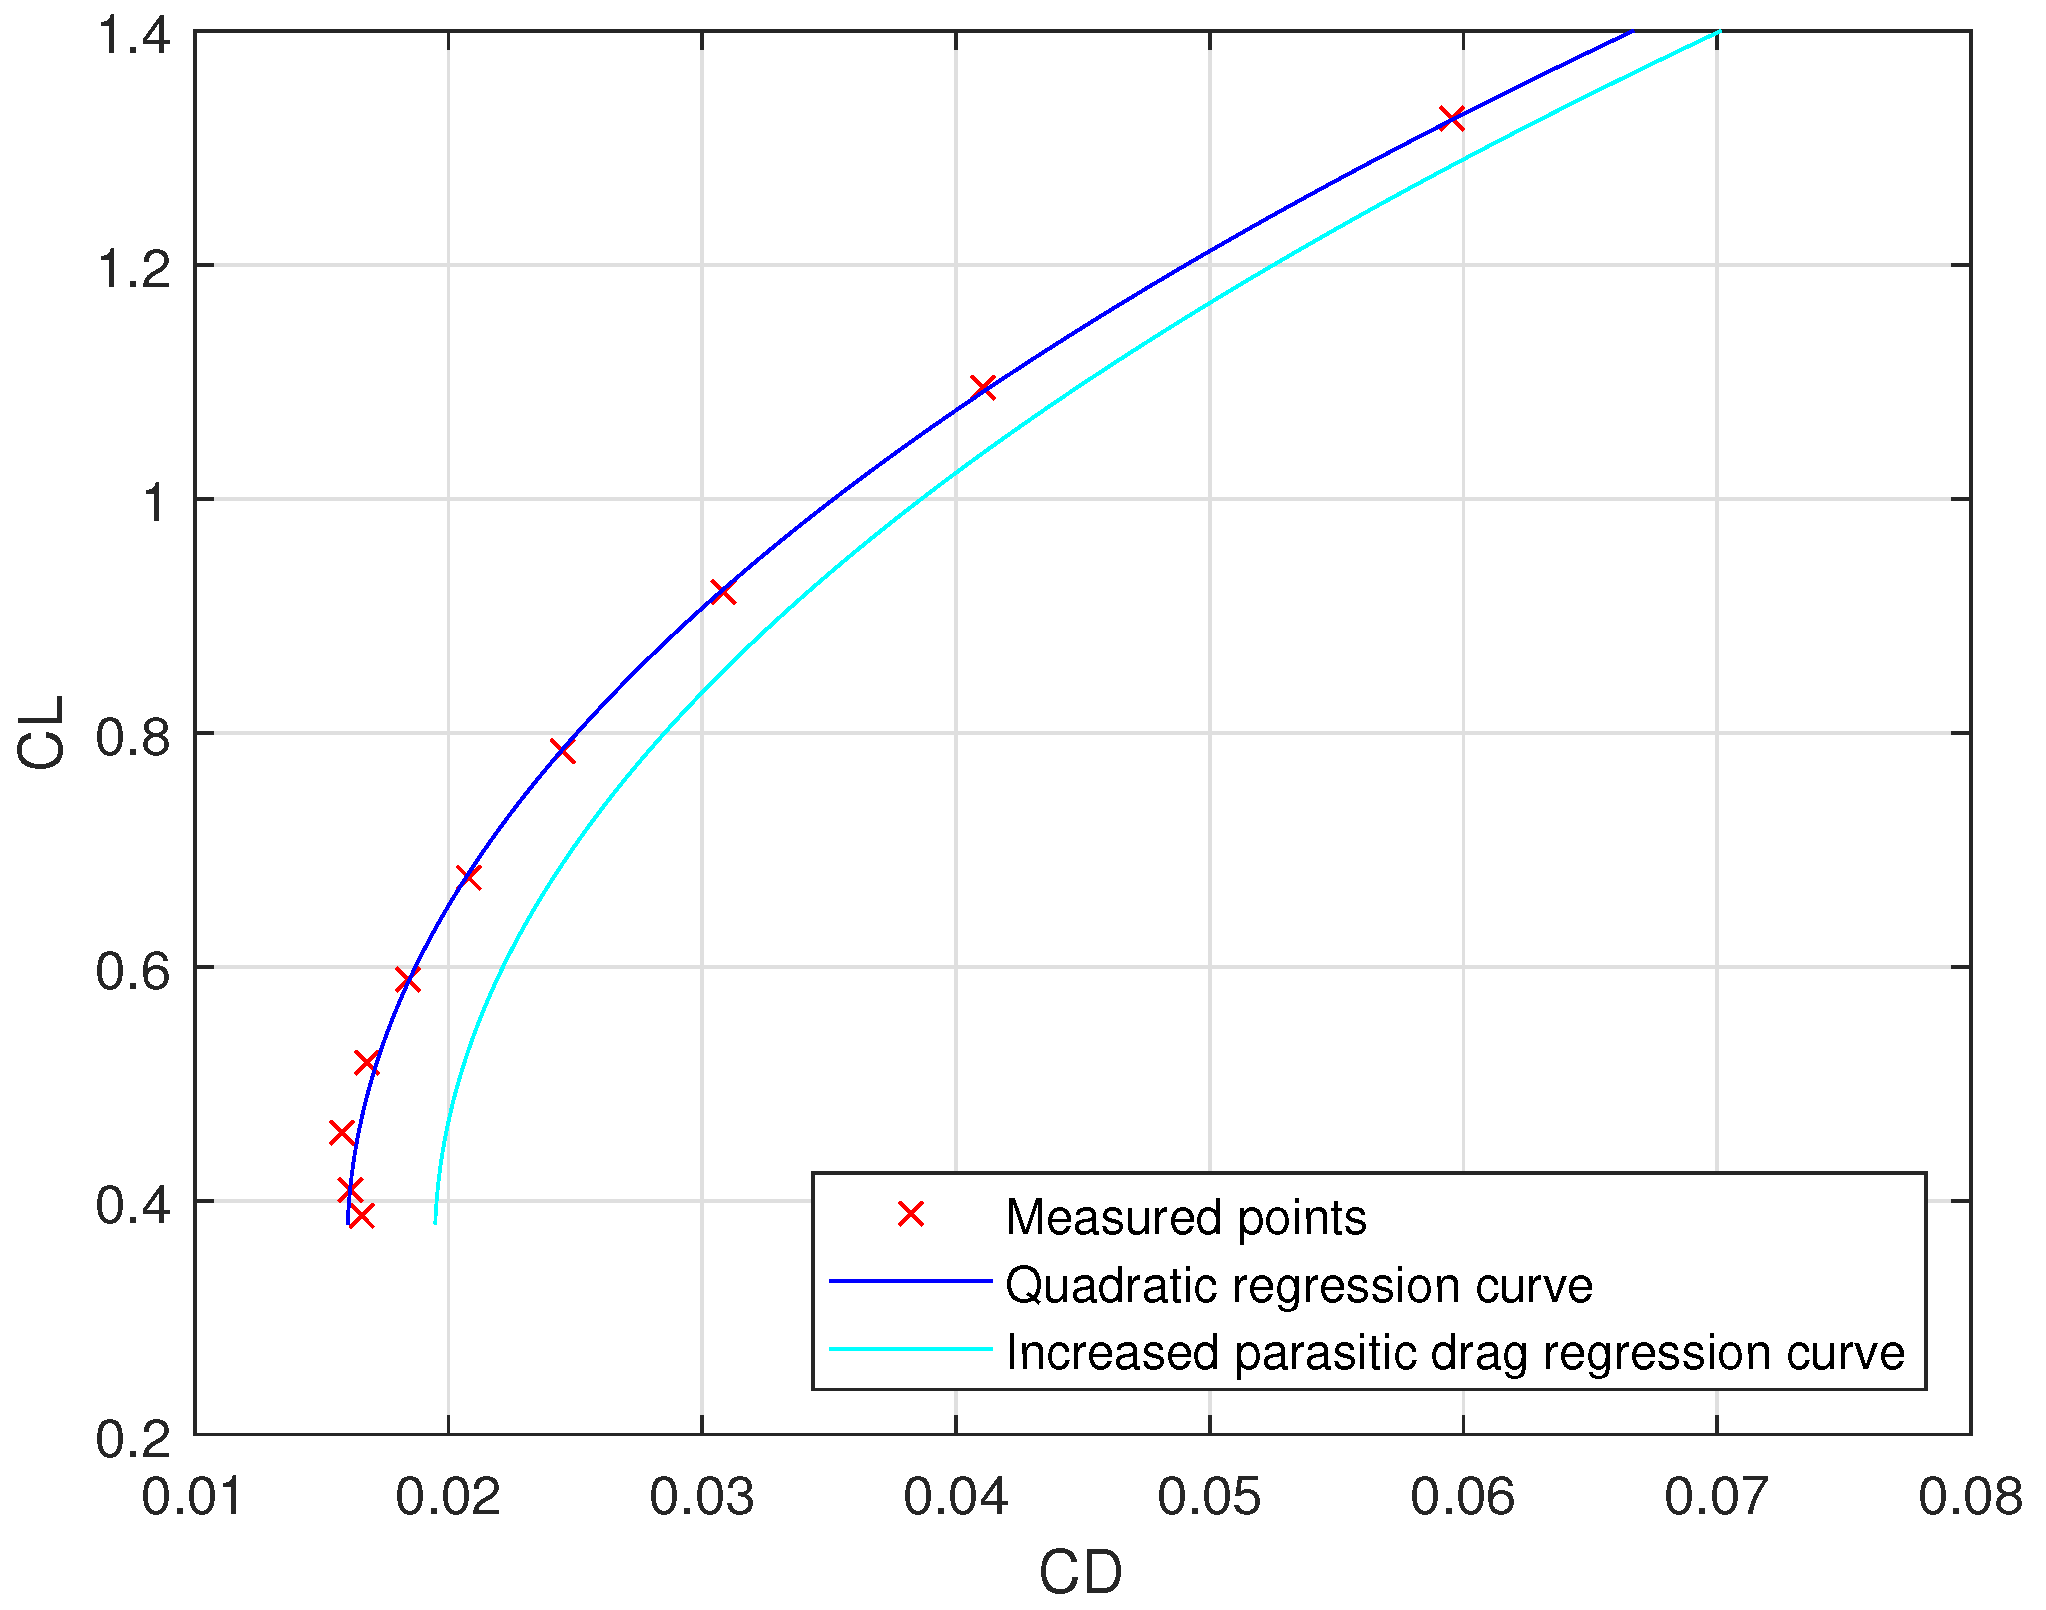
For this paper, the polar and the glide ratio of the digital twin are tailored to each mission segment based on the aircraft speed. To adjust the L/D, individual drag count values are added to the initial calculated drag values of the model. The actual numbers are found by converting the measured L/D polar to a drag polar. Here, the constant part of the drag can be changed to account for the additional parasitic drag of the cooling inlet and the propeller. The drag curve is found by calculating the required lift coefficient (
) for selected CAS values using the assumption of horizontal flight as follows:
Since the data in
Figure 7 (left-hand side) are at sea-level altitude, assuming no temperature deviation and a density of 1.225 kg/m
3, the CAS equals the TAS. The reference wing area
S of the e-Genius is 14.1 m
2, and the lift can be calculated based on the aircraft mass
m of 900 kg and the gravitational factor
g. By taking the average L/D value from the different flap settings, the
and
values in
Figure 8 can be estimated. Based on these points, a second-degree polynomial regression is used to calculate drag. This drag is finetuned to match the fuel burn of the reference mission together with the assumptions for the powertrain efficiencies. To find the delta drag values within SUAVE to adjust the aerodynamic model to the estimated polar, a separate mission is created. Here, the TAS is varied from 90 km/h to 200 km/h, increasing in 5 km/h increments during a horizontal flight at sea-level. This gives a new maximum L/D of 28.2. The full curve is shown in
Figure 7 (right-hand side).
3.2. Validation of the Calibrated Model
The validation of the e-Genius simulation model is done in two steps; First, the reference mission that was used for the calibration of the model is evaluated. Second, the model is tested against two additional long-range missions, a 500 km out-and-return mission, flown at a higher airspeed than the reference mission, and a 1000 km mission with several turn points.
3.2.1. Comparison with the Reference Mission
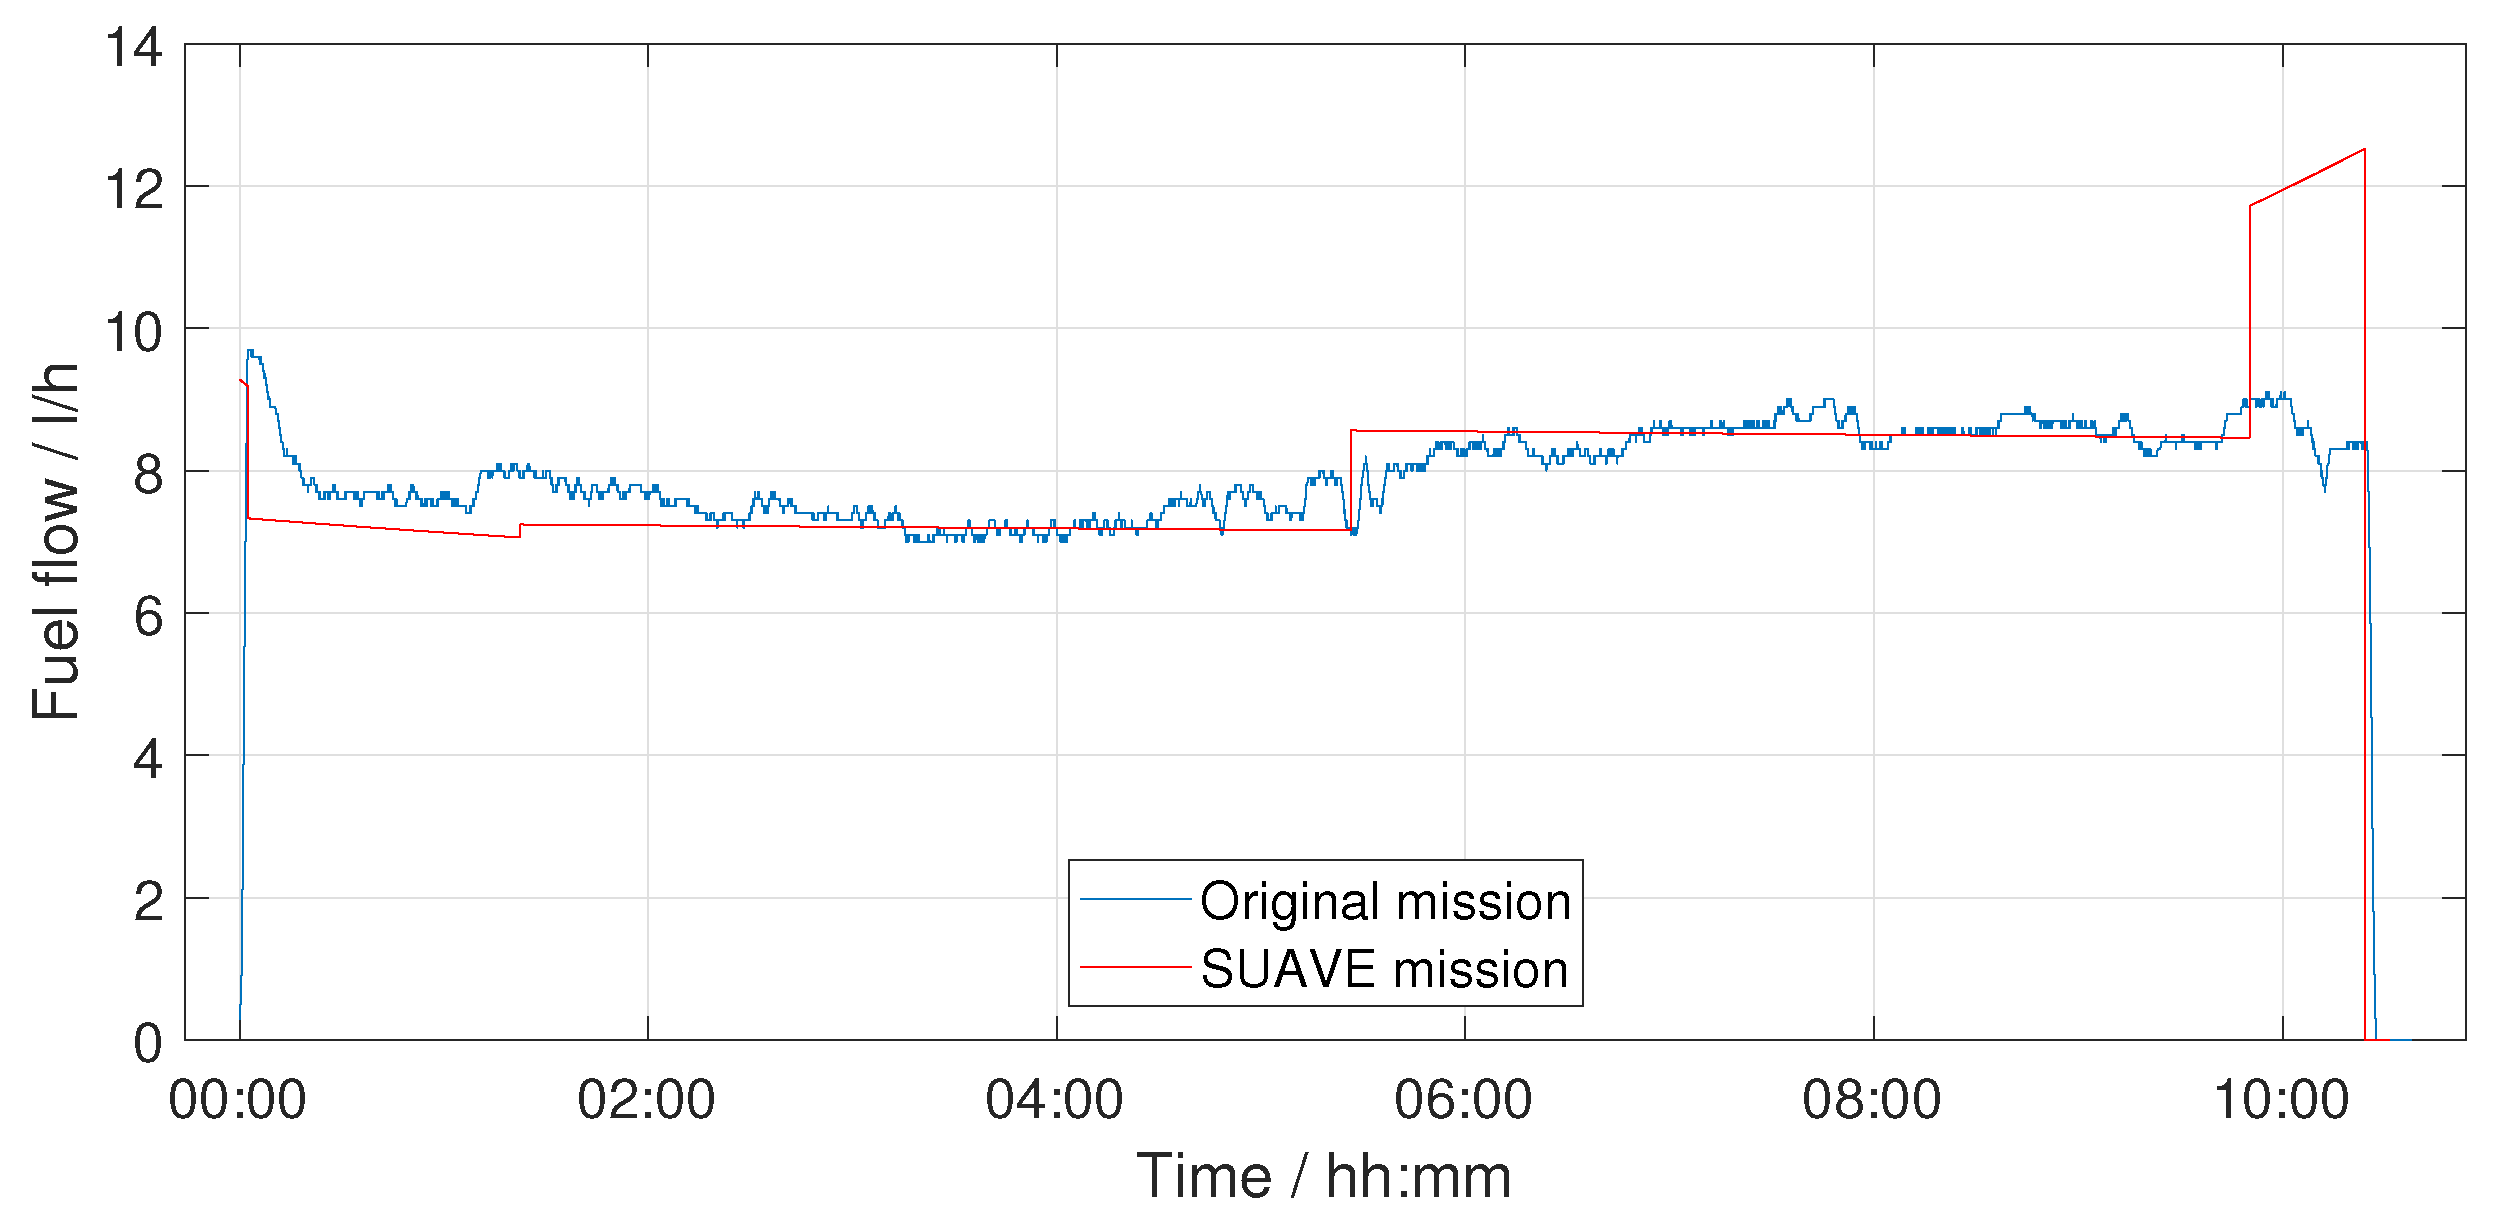
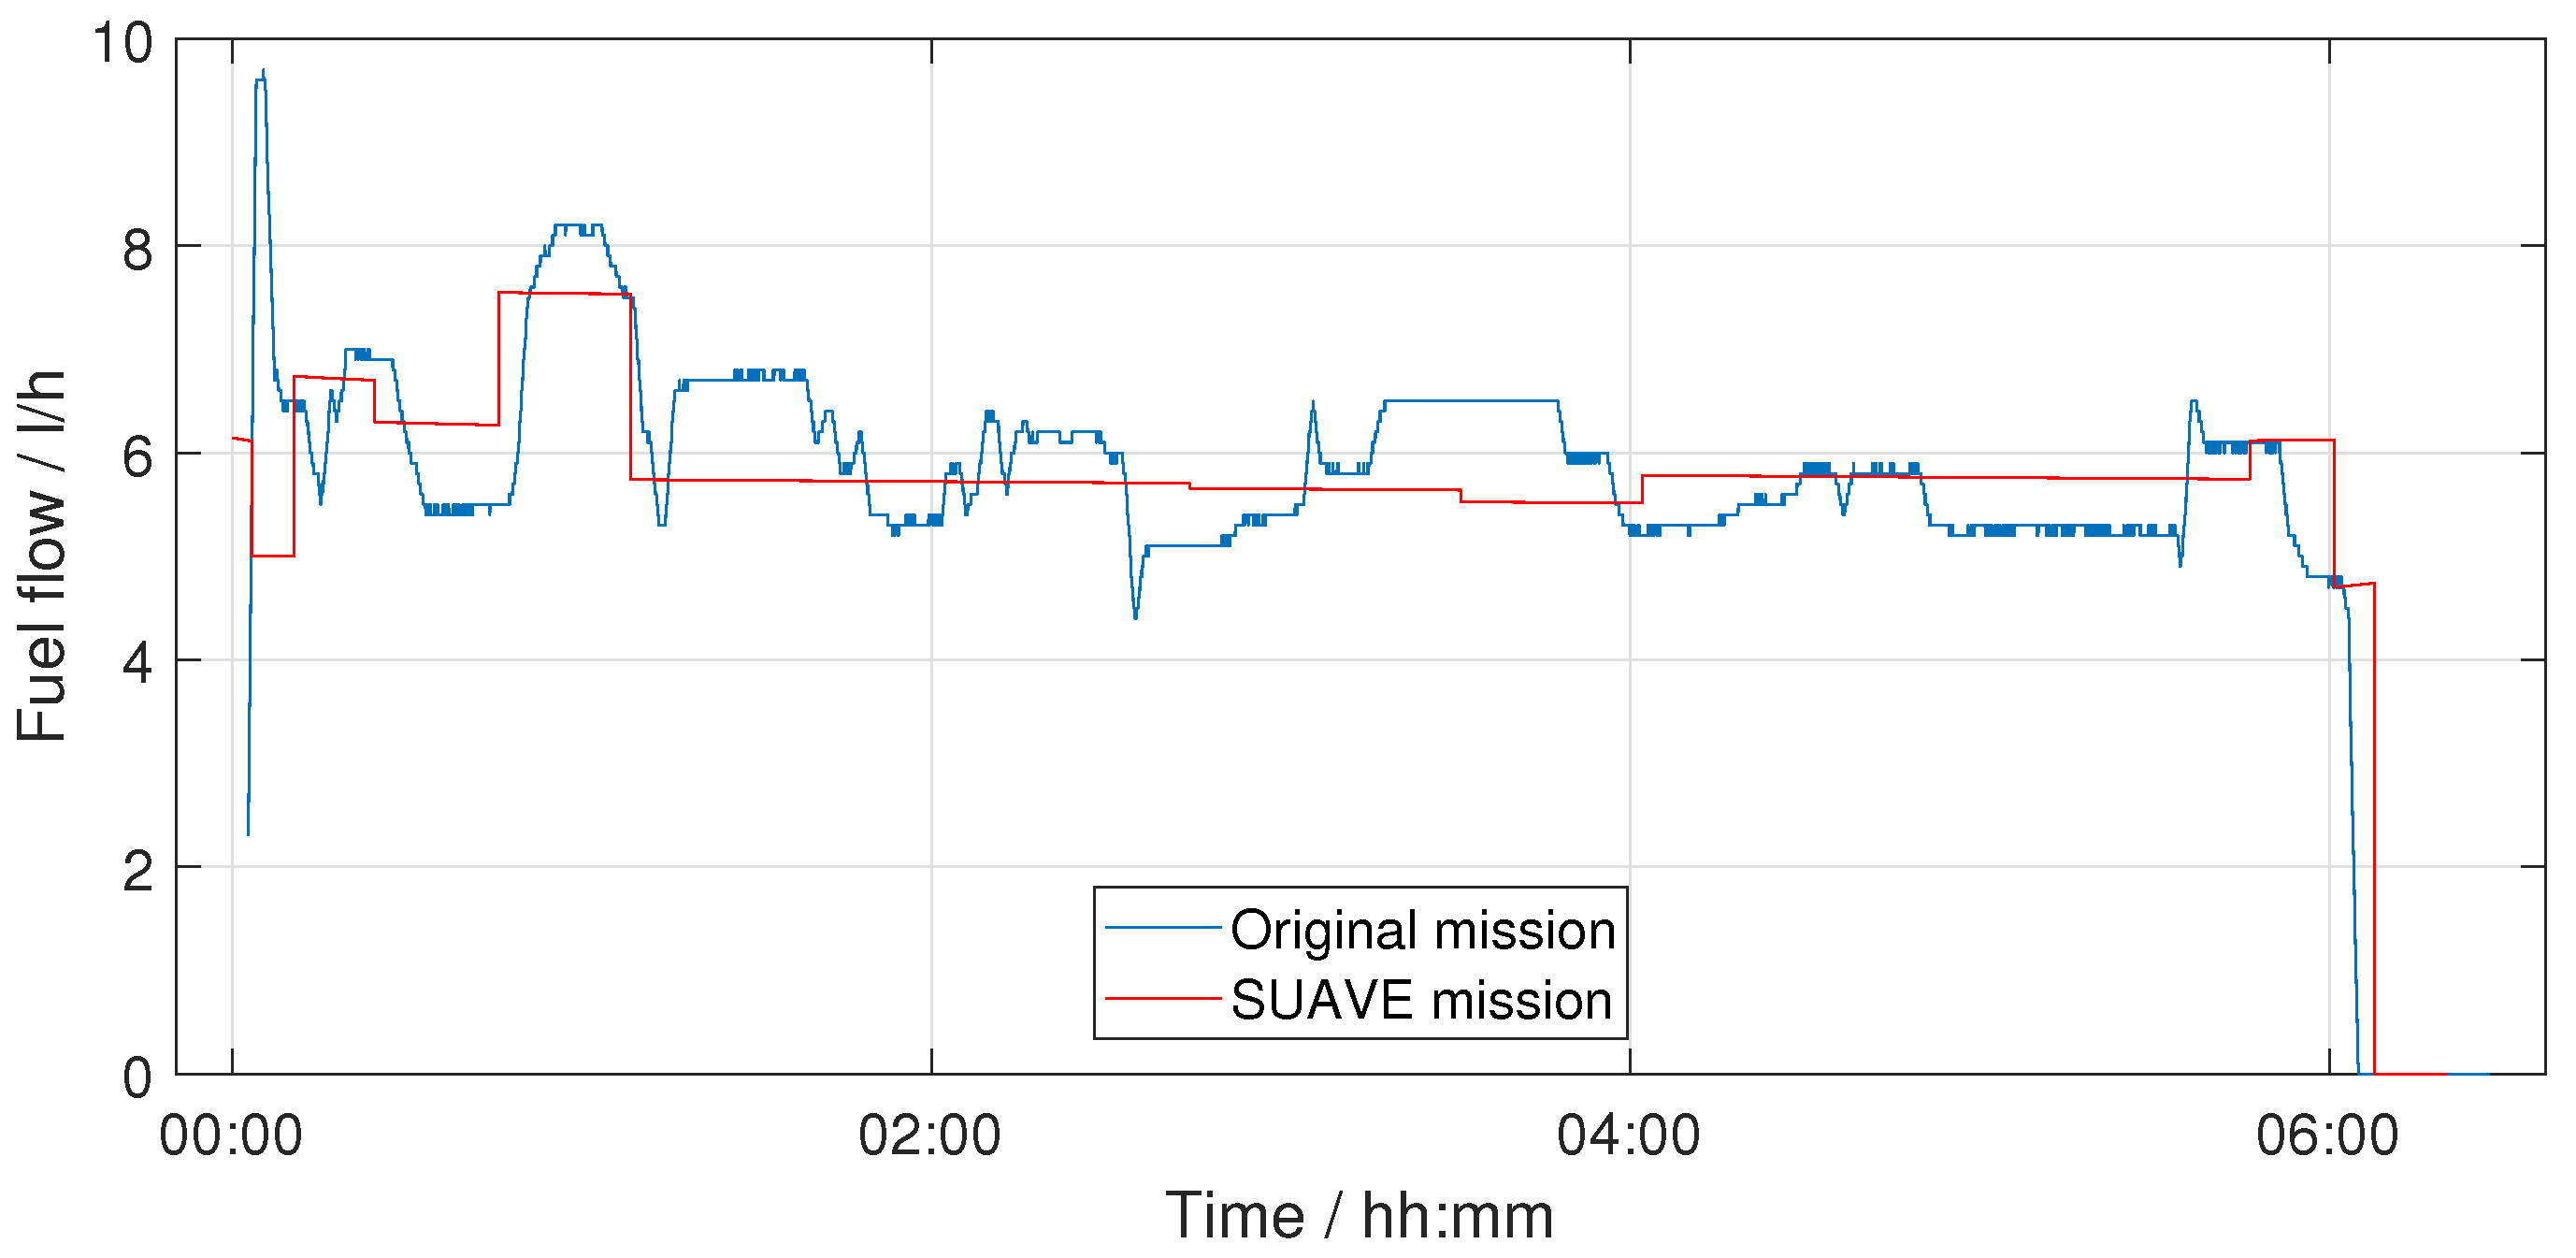
Fuel consumption is considered the main evaluation criterion and can be determined from
Figure 9. This serves as an indicator of the overall performance capabilities of the e-Genius. In this context, particular attention should be given to the cruise phase and the increase in fuel consumption during the return flight phase, which is due to an increased flight speed.
As shown in
Figure 9, the maximum fuel consumption during the climb phase is not fully reached, which is most likely due to the lower overall efficiency of the real propulsion system under higher loads, which is not reflected within the simulations by the assumption of constant efficiency. However, the longer cruise segments are sufficiently represented in terms of fuel consumption. The increase in fuel consumption during the first descent phase, on the other hand, suggests issues with the propulsion network or the mission simplification and indicates that uncertainties still exist in the model. For a better understanding of this problem, the resulting power values are compared with those of the mission data in
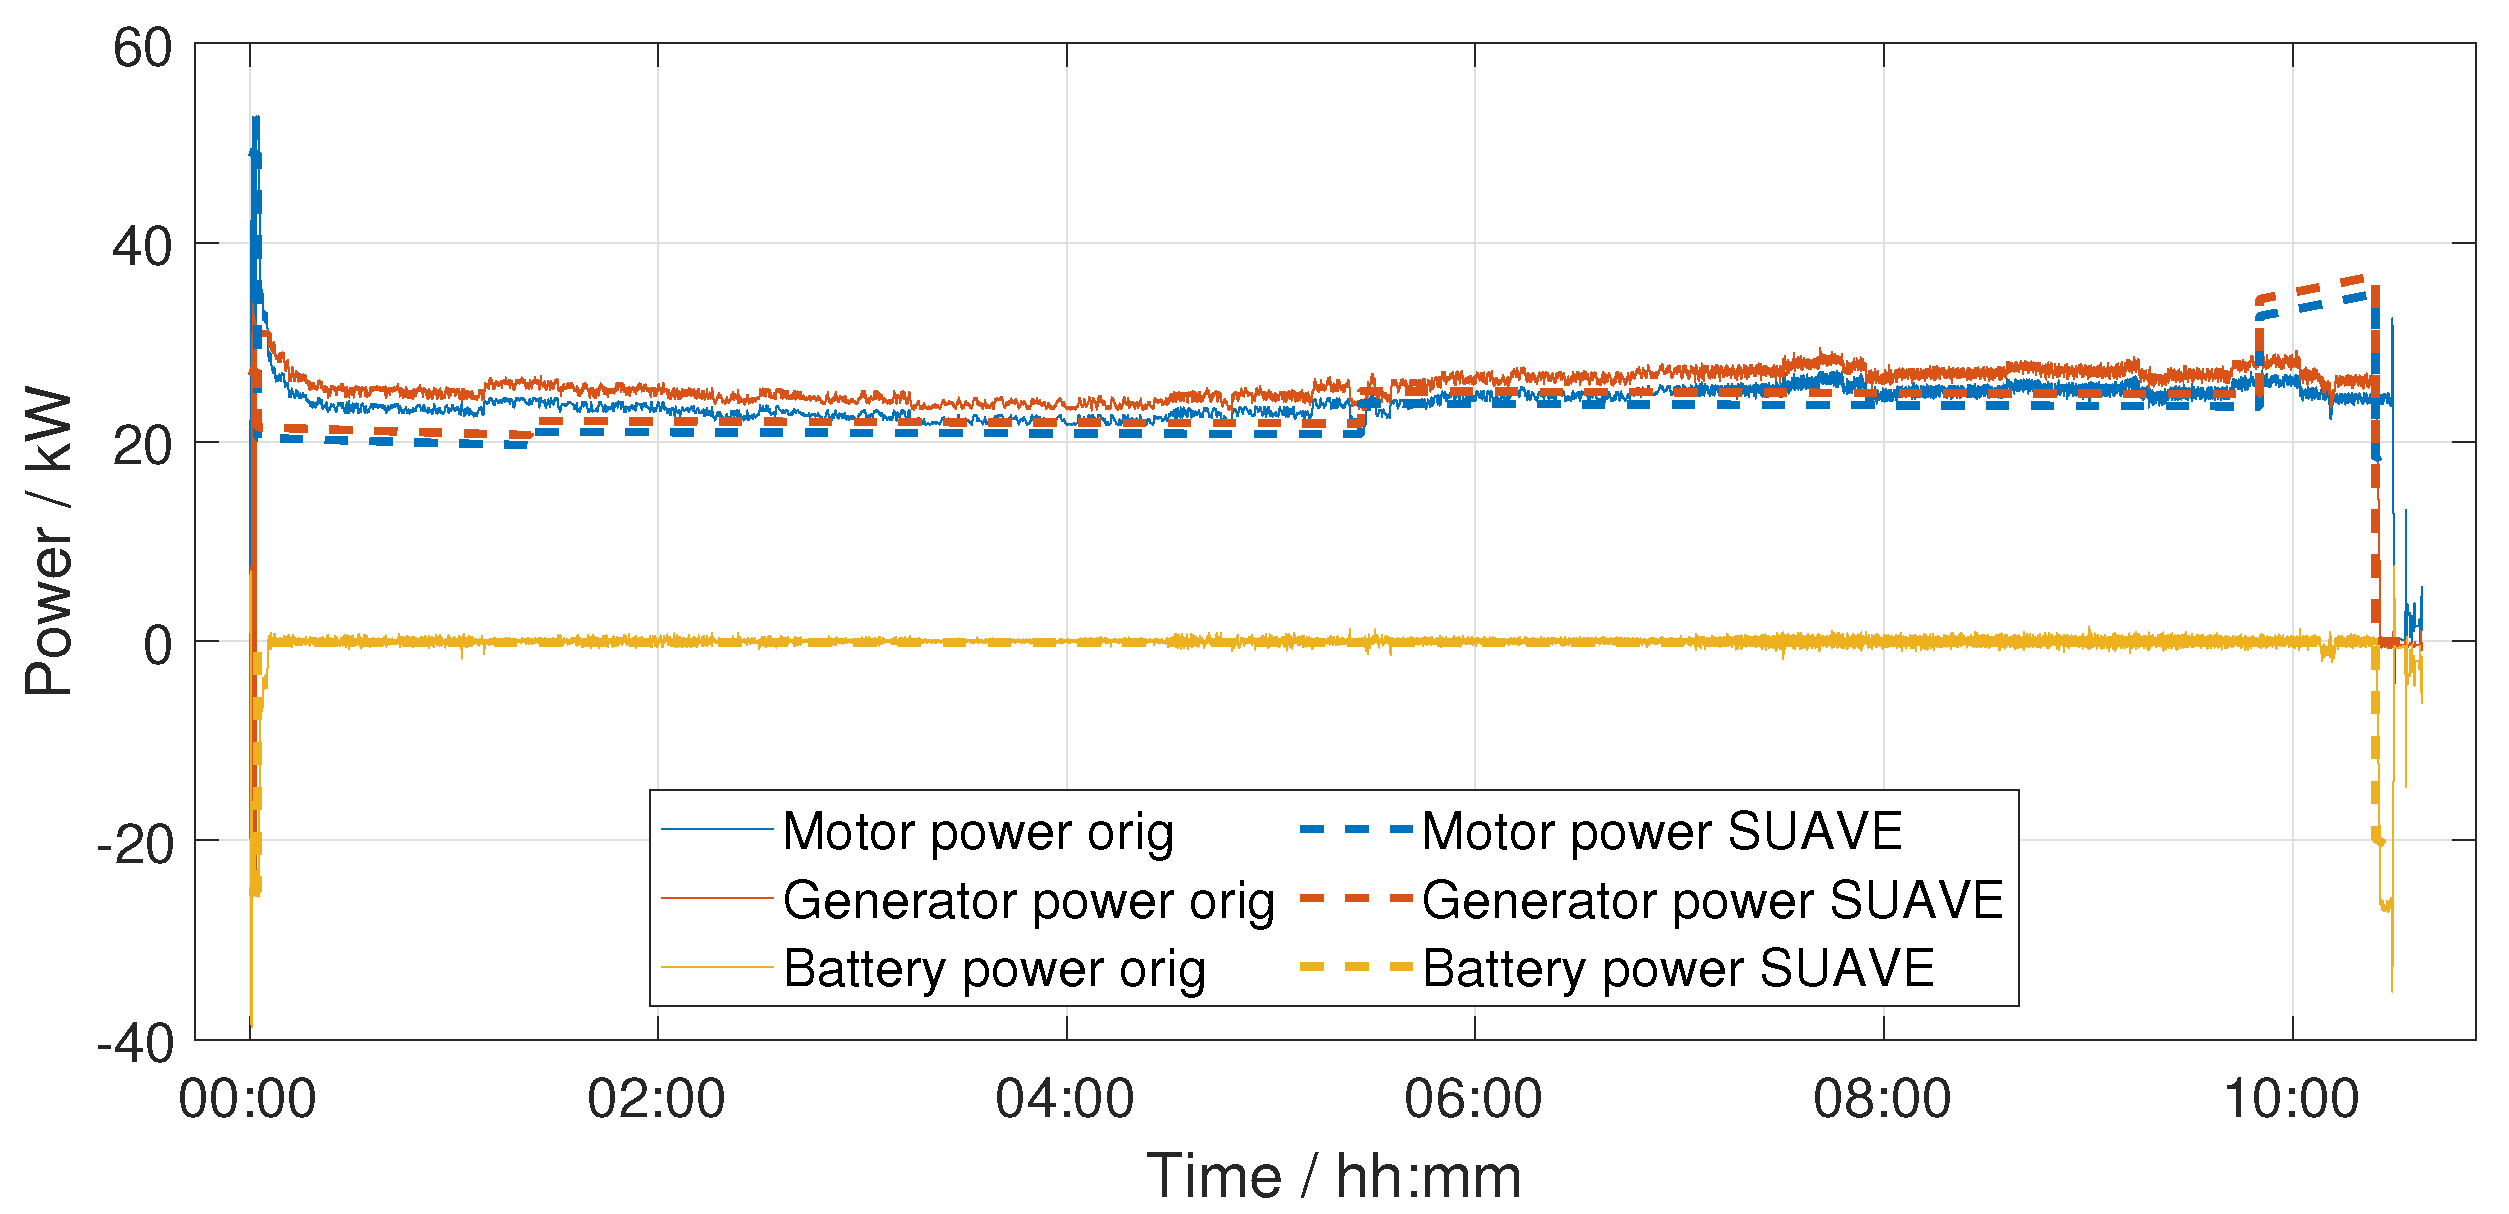
Figure 10.
In
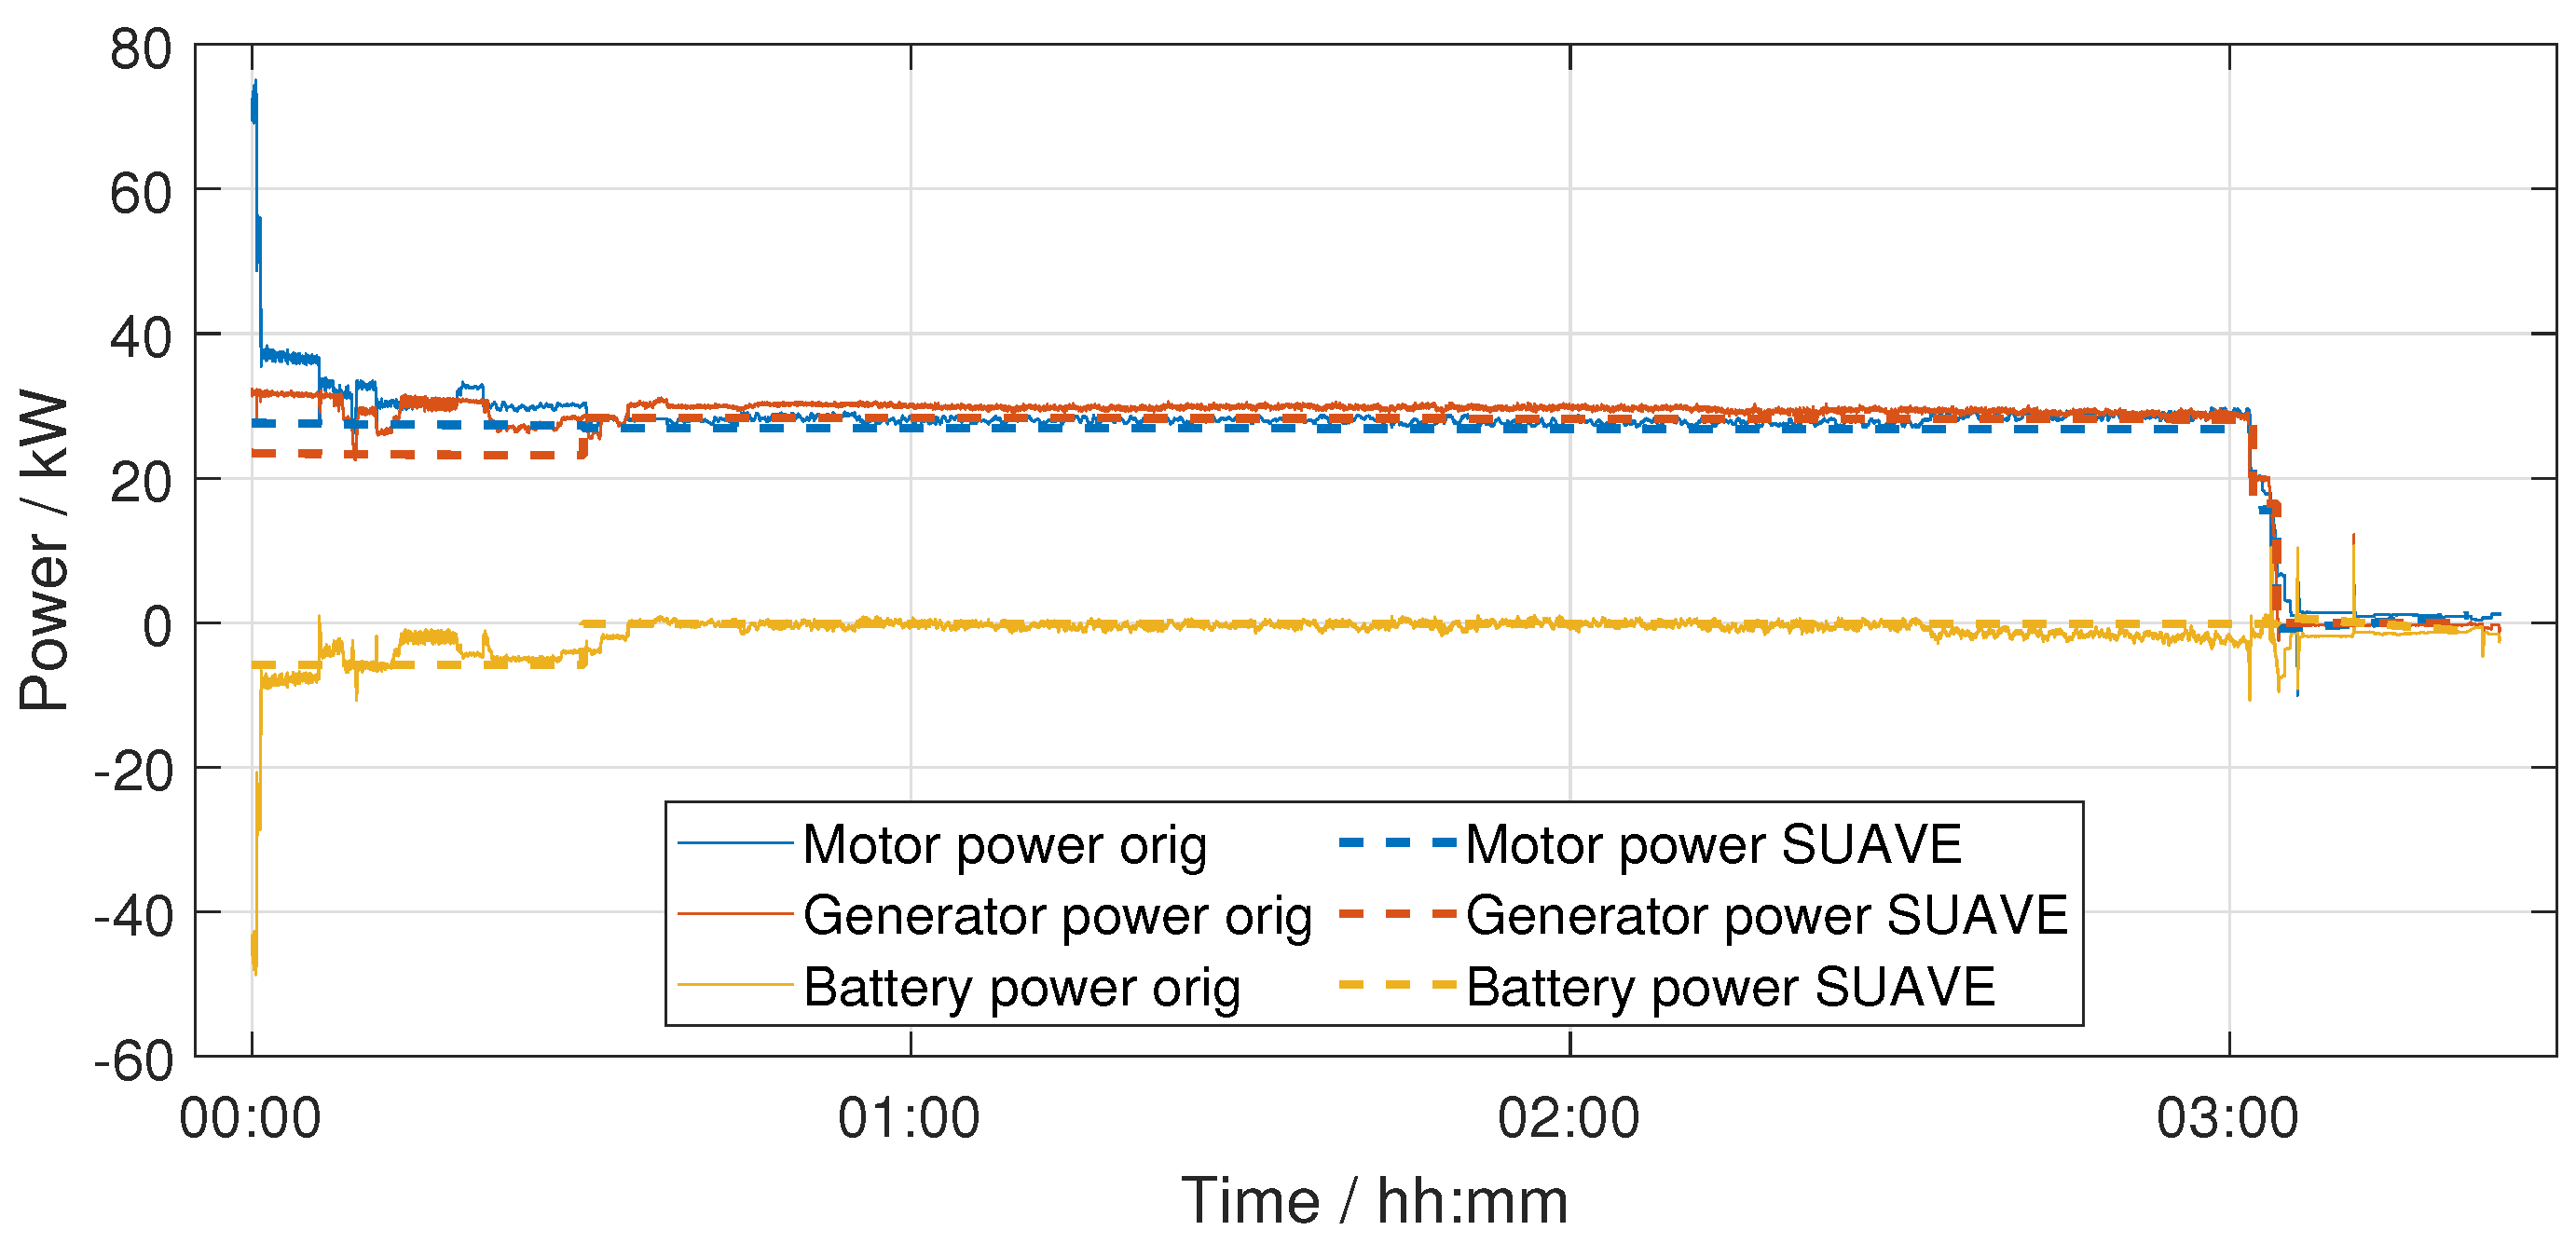
Figure 10, the power values of the mission data and the calculated values of the model can be seen. Similarities can be observed when comparing
Figure 9 with
Figure 10. The model does not reach the peak of the motor power in the first segment, which is again most likely due to the lower overall efficiency of the real propulsion system. Different results can be obtained in the cruise segments. Here, the motor power of the model is approximately 5 kW below the mission data. This can again be an indicator of the lower overall propulsive efficiency of the original e-Genius. Similarly, to the increased fuel flow in the first descent segment, higher power is also visible, which is expected by the given SFC within the segment.
Realistic modeling is evident when considering the mission as a whole. With the same flight time and distance, an accurate result of 83.5 L of fuel consumed is calculated, as can be seen in
Table 3.
3.2.2. Comparison with Additional Missions
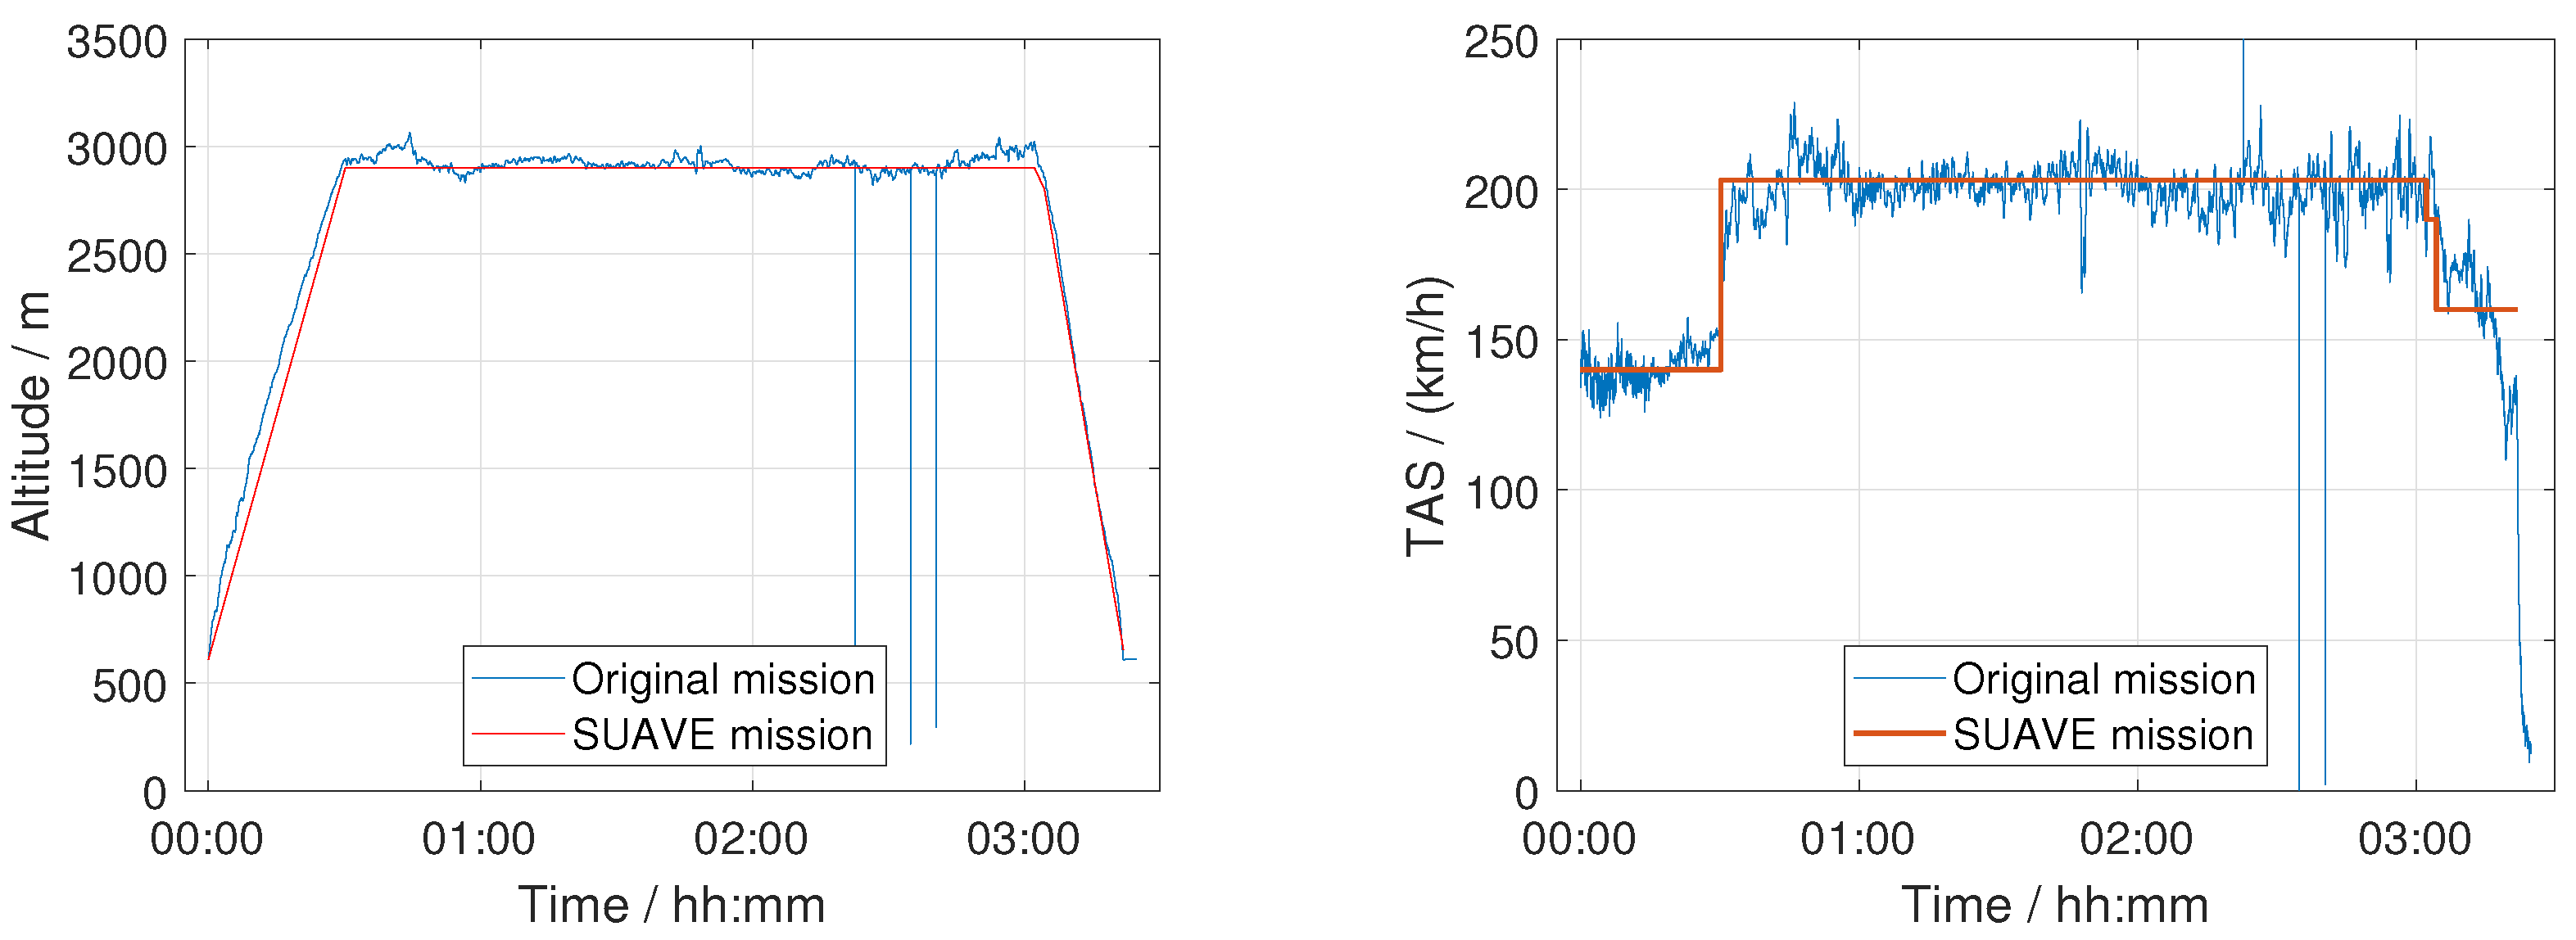
The altitude and speed profile for the 500 km mission and the approximation in SUAVE is shown in
Figure 11. The mission was flown in a similar way to the reference mission, flying out in a straight line to a turn point and returning to the staring point. Due to the shorter distance, the mission could be flown at a higher airspeed, as the fuel reserves were not of concern.
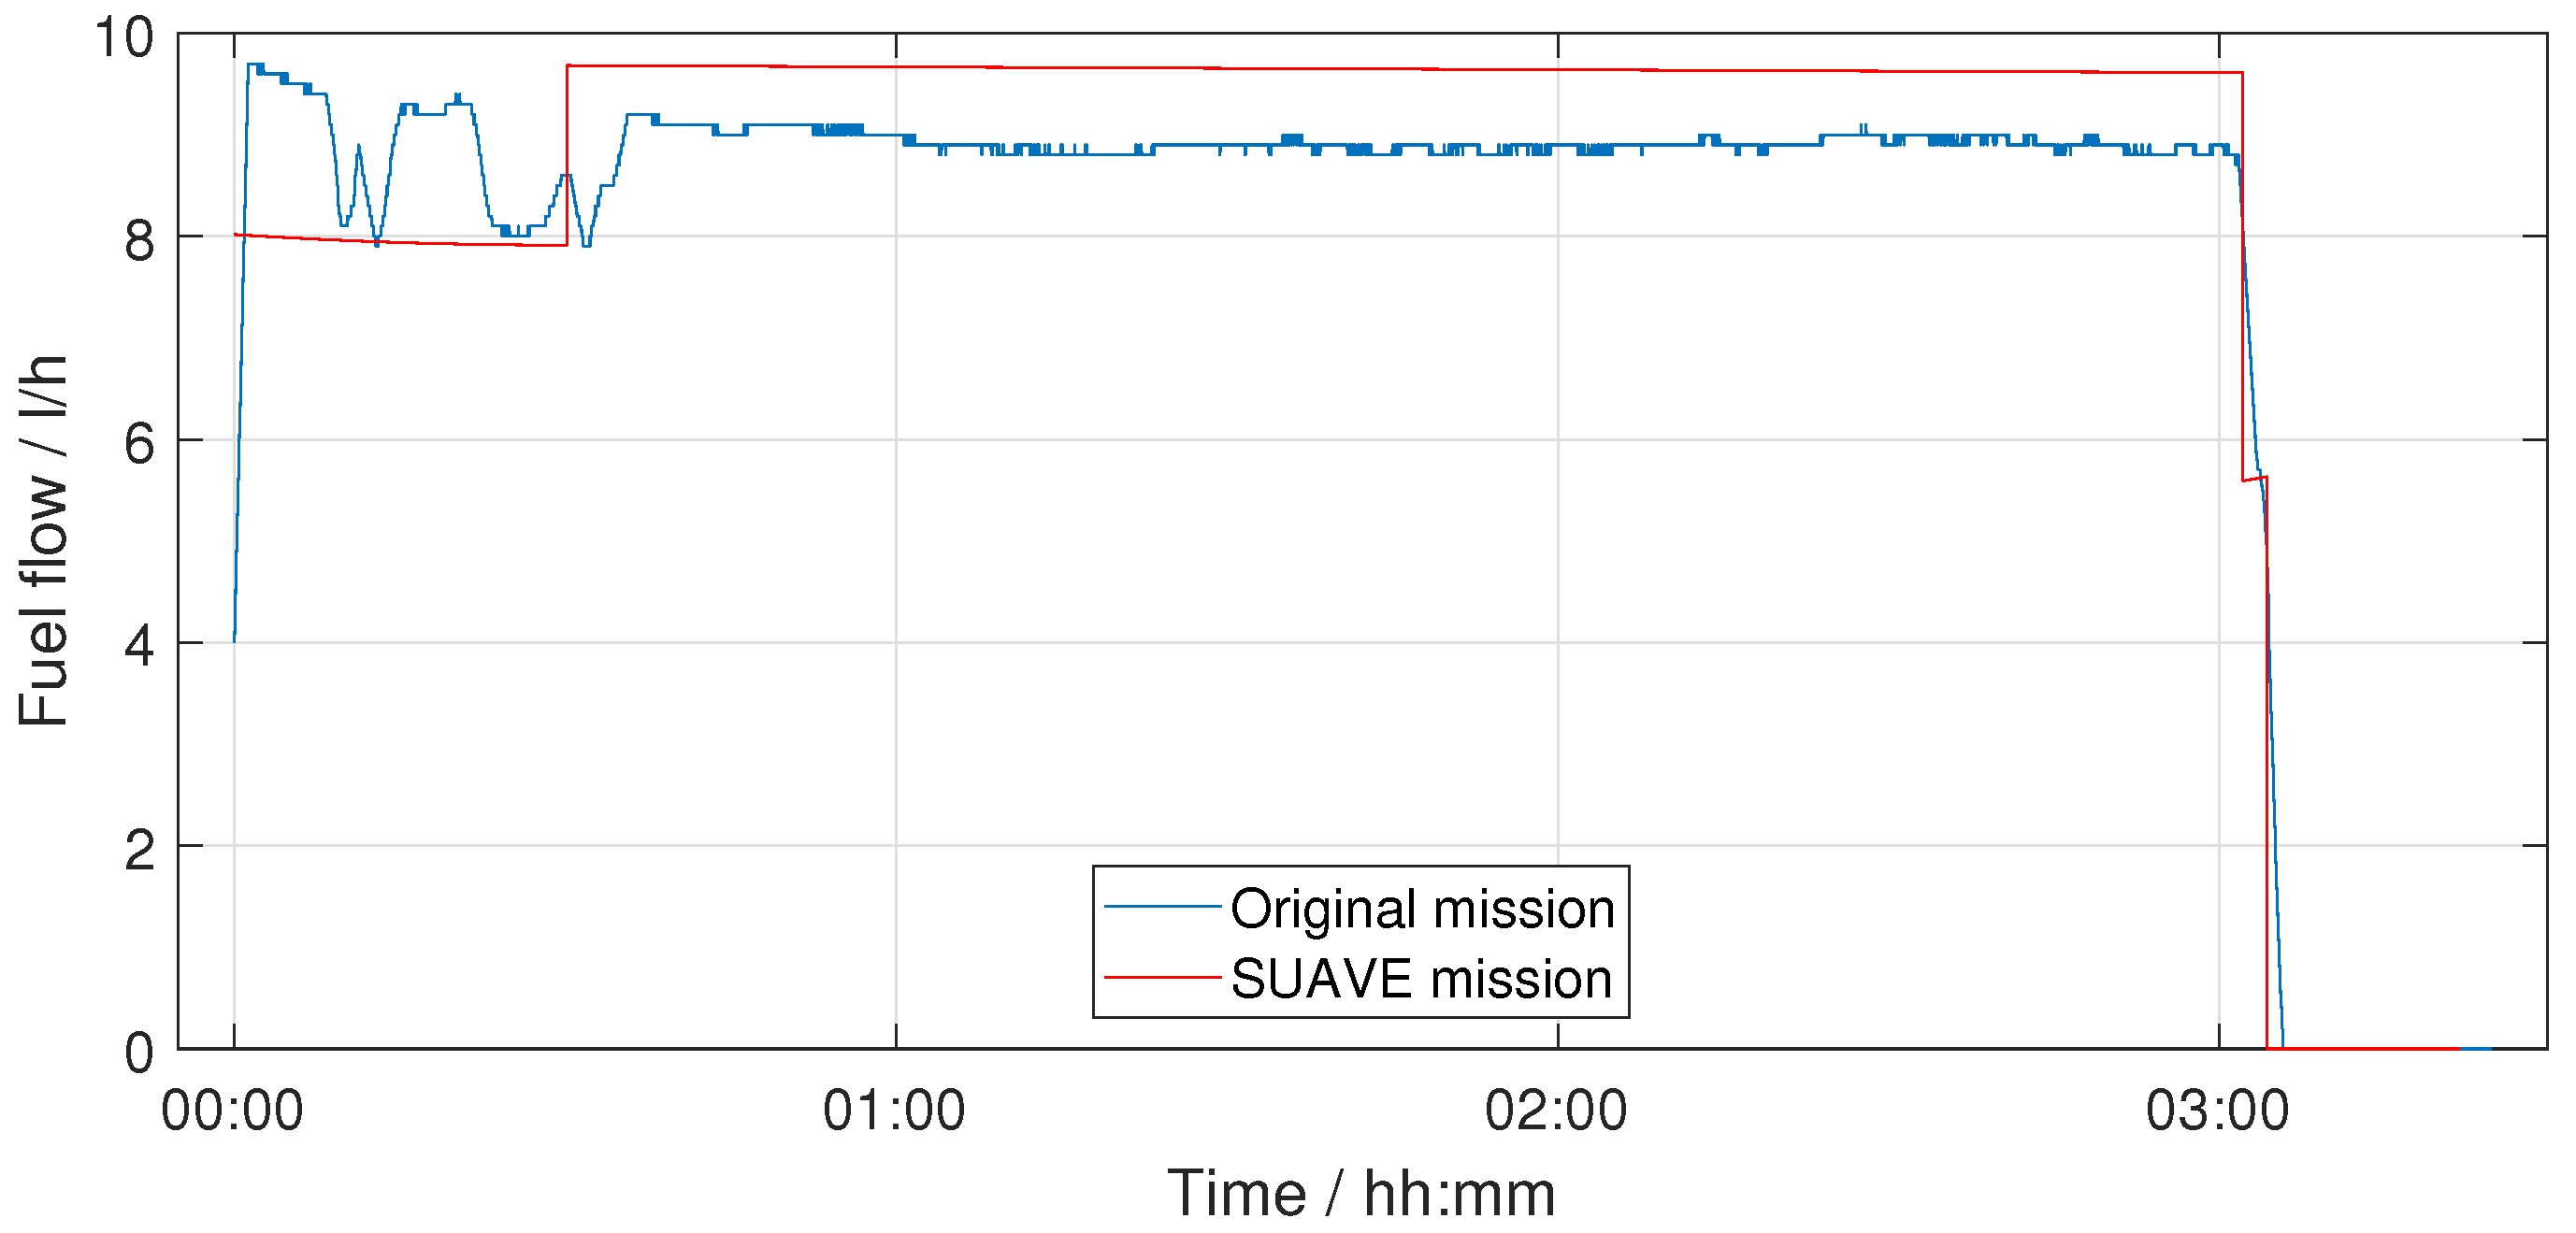
Figure 12 shows the fuel flow of the real mission compared to the results from the SUAVE model. It can be seen that the model overestimates fuel consumption during the cruise phase while underestimating it during the climb phase. The low fuel consumption in the climb can be explained by SUAVE calculating a too low power in this phase, as can be seen in
Figure 13. In the cruise, there is a good match between the calculated power from the SUAVE model and the measured data from the real mission. This indicates that the combustion engine has a better efficiency at high power than assumed in
Section 3.1.1. The effects of the discrepancy in the efficiency of the ICE can be seen in the overall fuel consumption in
Table 4, where the calculated value is 5.1% higher than the measured data.
Figure 14 shows the mission profile for the 1000 km mission. Unlike the other two missions, this was not an out-and-return mission but included several turn points. As this mission was carried out in an aircraft configuration with a reduced maximum fuel capacity of 36 L, the airspeed was reduced to conserve fuel. The results for the fuel flow of the SUAVE model compared to the real-world mission data can be seen in
Figure 15. For the reduced power of this mission with reduced airspeed, there is a good match between the calculated fuel consumption and the averaged data from the mission. This results in a good estimation of the total burnt fuel as seen in
Table 5.
3.3. Uncertainties
As shown in
Figure 7,
Figure 10, and
Figure 13, there are still uncertainties affecting the model. The assumption of constant component efficiencies and SFC throughout the whole mission (all segments) does not fully reflect the real-world behavior. Different operating points lead to varying efficiencies. The aerodynamics also cannot be validated exactly, as a detailed measurement campaign on the aerodynamics has not yet been conducted for the e-Genius in its current configuration. Such a test could adjust the model’s lift-over-drag polar and provide more accurate insights into the behavior of the hybrid e-Genius at certain speeds. Another issue is the wind vector, which affects the aircraft. So far, due to limitations in available data from the original flight, the model can only be fed with headwind or tailwind components calculated from the ground speed and true airspeed. A wind correction angle cannot be extracted without measured data on the orientation of the aircraft. However, a wind vector perpendicular to the flight path also influences the performance of the aircraft and increases fuel consumption.
Nevertheless, as shown in
Table 3,
Table 4 and
Table 5, the model still serves as a sufficient tool to simulate flight missions for the e-Genius.
4. Discussion: e-Genius Unleashed
There are several limitations that result in not “flying” the e-Genius hybrid to its range limit. These are based on the operational or regulatory restrictions and economic considerations.
First of all, e-Genius is limited to Day-VFR operations alone. This means that the aircraft can only operate during the day and in good weather [
44]. Daytime is defined as the period between the beginning of morning civil twilight to the end of evening civil twilight [
44]. The longest day in Mengen, the aircraft’s home base, would theoretically give almost 17 h and 30 min of flight time. However, airport opening hours are shorter [
45], and for every half-hour extension of the opening hours, quite expensive fees apply. This limits the available flight time for an endurance record flight. Mitigation would vary from changing to a different airfield with longer opening hours to going north, close to the polar circle, where daytime in summer is longer. Here, only 30 min of VFR reserves ([
46], AMC1 NCO.OP.125(b)) apply as a limitation. In addition, e-Genius is limited to flying over land, so extensive legs over open water are forbidden. This further limits the possibility of setting up a suitable task. Furthermore, the FAI record classes specify a speed record for a 2000 km out-and-return leg, and the next one would require flying 5000 km [
25].
Due to these constraints, the actual record flight was performed at higher-than-optimal cruise speeds, resulting in additional fuel burn, reducing the achievable distance. Applying the mitigation stated above, the only limitation will be finding pilots willing to spend 17+ h in the e-Genius. On the other hand, the maximum range can be simply calculated with the help of our calibrated “digital twin” SUAVE model.
Lifting these limitations and flying the aircraft in SUAVE is a faster and more cost-efficient way. First, the maximum range including VFR reserves of 30 min is estimated. Hence, all fuel is burned during the mission, as the battery has enough energy to provide the VFR reserves. To estimate this, the climb and descent phases were left unaltered in comparison to the original record flight, and the two cruise legs have been extended to use up all the fuel available. In addition, cruise was simulated at an optimal glide speed of 140 km/h to increase fuel efficiency while increasing overall flight time even further. In total, a range of 2645 km can be achieved.
In addition, increasing the range even further would be possible by replacing the second pilot with fuel. This would allow for approximately additional 85 L or 70 kg of fuel. Using this, the range increases to 5178 km, while increasing the flight time to 34.9 h. Again, the climb and descent have been unaltered, and only the two cruise phases (again with best glide) are elongated to burn up all available fuel. It must be noted that this is a rather theoretical calculation which is not practical in the current e-Genius. Additional capabilities for the autopilot need to be implemented; however, in general, the Solar Impulse 2 has demonstrated the feasibility of long-duration flights with a single pilot on board [
47].
5. Conclusions and Future Outlooks
In this paper, a model of the two-seat hybrid-electric aircraft e-Genius was created within an in-house version of the preliminary aircraft design tool SUAVE. This includes an aerodynamic model of the aircraft and the components for the serial hybrid-electric propulsion architecture, as well as the mass consideration of the whole aircraft. This model was then calibrated using real flight data from the FAI-ratified world record flight over a distance of 2000 km. To better account for the real world conditions during this flight, the SUAVE environment was extended by a method aiming to include wind in the mission-solving process. The calibrated model was verified against two additional mission over distances of 500 km and 1000 km, showing good alignment in general. Afterwards, it was used to explore the additional potential of the e-Genius in its hybrid-electric configuration.
In relation to the first research question, this study shows that the digital twin of an hybrid electric aircraft with a simplified mission structure can replicate a real-world mission in terms of fuel burn with a deviation of less than one percent. However, it also shows some divergence for other parameters like battery power. Improving this should be a goal for the future, although requiring additional parameters to be measured in flight. In addition, defining a special mission for calibration and adding equipment for wind calculations can further improve the calibration of the model and thus the performance of this digital twin. This could be combined with measuring the thrust, torque, and efficiencies of the individual components. As a first step, implementing thrust and torque measurement capabilities in flight will enhance model accuracy. This is enabled by the assumption of a static horizontal flight, where drag equals thrust and together with torque the propulsive efficiency is also known. This will further result in knowledge of the powertrain efficiency from batteries to the propeller shaft. Second, making compass data available to the logging, the orientation of the aircraft and the crosswind component can be calculated from measured data (TAS, GS, and orientation). And third, implementing performance maps for the ICE and electric motor can further improve the digital twin model.
In response to the second research question, the maximum range of the e-Genius hybrid without limitations and restrictions is estimated. This is possible because of the digital twin model within the SUAVE aircraft design framework. Depending on the number of pilots on board and thus available fuel, a range of 2645 km or 5178 km can be estimated, respectively. These estimations include reducing the cruise speed to best glide compared to the speed during the actual record flight.
Overall, the model allows us to optimize future flights with the aircraft, finding optimal cruising altitudes based on the forecasted wind and weather, further enhancing the potential of the aircraft.
Finally, the calibrated SUAVE model also allows us to estimate the performance and impact of future technologies like the planned integrated skin heat exchanger of the follow-up project. The next steps consist of upgrading the SUAVE e-Genius to the latest iteration of the actual aircraft now capable of towing gliders. This includes a new, more powerful motor as well as a new battery pack to allow for the increased power draw in towing. Another interesting research direction could include new energy carriers, such as liquid or gaseous hydrogen or compressed natural gas. This can be investigated within SUAVE either with combustion engines or fuel cells.
Author Contributions
Conceptualization, D.E.; methodology, D.E., A.B., N.G., and J.M.; writing—original draft preparation, D.E., A.B., N.G., and J.M.; writing—review and editing, D.E., A.B., N.G., J.M., and A.S.; visualization, D.E., A.B., N.G., and J.M.; supervision, A.S. All authors have read and agreed to the published version of the manuscript.
Funding
This research received no external funding.
Data Availability Statement
All relevant data are included as figures or tables in the main article. Further inquiries can be directed to the corresponding author(s).
Conflicts of Interest
The authors declare no conflicts of interest.
Abbreviations
The following abbreviations are used in this manuscript:
| AC | Alternating current |
| BAT | Battery |
| CAS | Calibrated airspeed |
| CON | Converter |
| DC | Direct current |
| EM | Electric motor |
| ESC | Electronic speed controller |
| FAI | Federation Aeronatique Internationale |
| GEN | Generator |
| GS | Ground speed |
| HV | High voltage |
| ICE | Internal combustion engine |
| L/D | Lift-over-drag |
| MTOM | Maximum take-off mass |
| P | Propeller |
| SFC | Specific fuel consumption |
| SOC | State of charge |
| T | Thrust |
| TAS | True airspeed |
| TC | True course |
| TH | True heading |
| TWD | True wind direction |
| VFR | Visual flight rules |
| WA | Wind angle |
| WCA | Wind correction angle |
| WS | Wind speed |
References
- European Commission. Directorate General for Research and Innovation. In Fly the Green Deal: Europe’s Vision for Sustainable Aviation; Publications Office: Luxembourg, 2022. [Google Scholar]
- Masson-Delmotte, V.; Zhai, P.; Pirani, A.; Connors, S.L.; Péan, C.; Berger, S.; Caud, N.; Chen, Y.; Goldfarb, L.; Gomis, M.I.; et al. 2021: Summary for Policymakers. Climate Change 2021: The Physical Science Basis. Contribution of Working Group I to the Sixth Assessment Report of the Intergovernmental Panel on Climate Change; IPCC: Geneva, Switzerland, 2021. [Google Scholar]
- Brenner, F.; Mangold, J.; Eisenhut, D.; Moebs, N.; Strohmayer, A. Deriving a Year 2040 Reference Aircraft from a Modern Turboprop, Implemented and Calibrated in SUAVE. J. Phys. Conf. Ser. 2023, 2526, 012009. [Google Scholar] [CrossRef]
- Mangold, J.; Eisenhut, D.; Brenner, F.; Moebs, N.; Strohmayer, A. Preliminary Hybrid-Electric Aircraft Design with Advancements on the Open-Source Tool SUAVE. J. Phys. Conf. Ser. 2023, 2526, 012022. [Google Scholar] [CrossRef]
- Eisenhut, D.; Mangold, J.; Moebs, N.; Brenner, F.; Strohmayer, A. Case Study on Hybrid-Electric Aircraft Designs Enabled by an Enhanced SUAVE Version. J. Phys. Conf. Ser. 2023, 2526, 012019. [Google Scholar] [CrossRef]
- Brelje, B.J.; Martins, J.R. Electric, hybrid, and turboelectric fixed-wing aircraft: A review of concepts, models, and design approaches. Prog. Aerosp. Sci. 2019, 104, 1–19. [Google Scholar] [CrossRef]
- Abu Salem, K.; Palaia, G.; Quarta, A.A. Review of hybrid-electric aircraft technologies and designs: Critical analysis and novel solutions. Prog. Aerosp. Sci. 2023, 141, 100924. [Google Scholar] [CrossRef]
- Finger, D.F.; de Vries, R.; Vos, R.; Braun, C.; Bil, C. A Comparison of Hybrid-Electric Aircraft Sizing Methods. In Proceedings of the AIAA Scitech 2020 Forum, Orlando, FL, USA, 6–10 January 2020. [Google Scholar] [CrossRef]
- Electra. Electra.aero|Electra Completes World’s First Hybrid-Electric eSTOL Aircraft Flight. 20 November 2023. Available online: https://www.electra.aero/news/worlds-first-hybrid-electric-estol-flight (accessed on 19 March 2025).
- Diamond Aircraft Industries. Diamond Aircraft Proudly Presents the World’s First Serial Hybrid Electric Aircraft “DA36 E-Star”. 2011. Available online: https://www.diamondaircraft.com/en/about-diamond/newsroom/news/article/diamond-aircraft-proudly-presents-the-worlds-first-serial-hybrid-electric-aircraft-da36-e-star/ (accessed on 19 March 2025).
- Diamond Aircraft Industries. Diamond Aircraft 1st Flight Multi-Engine Hybrid Electric Aircraft. 2018. Available online: https://www.diamondaircraft.com/en/about-diamond/newsroom/news/article/diamond-aircraft-1st-flight-multi-engine-hybrid-electric-aircraft/ (accessed on 19 March 2025).
- Ampaire Inc. Ampaire Flies First Hybrid-Electric Regional Aircraft. 2022. Available online: https://www.ampaire.com/_files/ugd/03bbf3_4857b2d4fe744b908001f5e2ffcf46de.pdf (accessed on 19 March 2025).
- Mahepa. Available online: https://mahepa.eu/ (accessed on 19 March 2025).
- Trainelli, L.; Riboldi, C.E.; Salucci, F.; Rolando, A. A General Preliminary Sizing Procedure for Pure-Electric and Hybrid-Electric Airplanes. In Proceedings of the Aerospace Europe Conference, Bordeaux, France, 25–28 February 2020. [Google Scholar]
- Institute of Aircraft Design, University of Stuttgart. Aircraft Design Homepage. Available online: https://www.ifb.uni-stuttgart.de/en/research/aircraftdesign/ (accessed on 18 December 2024).
- Casola, L. Opportunities and Challenges for Digital Twins in Engineering: Proceedings of a Workshop—In Brief; The National Academies Press: Washington, DC, USA, 2023. [Google Scholar] [CrossRef]
- Hällqvist, R. On Standardized Model Integration: Automated Validation in Aircraft System Simulation, 1st ed.; Linköping University Medical Dissertations Series; Linkopings Universitet: Linköping, Sweden, 2019; Volume 1866. [Google Scholar]
- Corporation, I. What Is a Digital Twin?|IBM. Available online: https://www.ibm.com/think/topics/what-is-a-digital-twin? (accessed on 27 March 2025).
- Wright, L.; Davidson, S. How to tell the difference between a model and a digital twin. Adv. Model. Simul. Eng. Sci. 2020, 7, 13. [Google Scholar] [CrossRef]
- Gomes, C.; Feng, H.; Kazemi, Z.; Pierce, K. Calibration of Models for Digital Twins. In The Engineering of Digital Twins; Fitzgerald, J., Gomes, C., Larsen, P.G., Eds.; Springer International Publishing: Cham, Swizerland, 2024; pp. 129–146. [Google Scholar] [CrossRef]
- American Bureau of Shipping Guidance Notes on Verification and Validation of Models, Simulations, and Digital Twins. Available online: https://ww2.eagle.org/content/dam/eagle/rules-and-guides/current/design_and_analysis/348-guidance-notes-on-verification-and-validation-of-models,-simulations,-and-digital-twins-2024/348-vandv-gn-nov24.pdf (accessed on 27 March 2025).
- Meyer, H.; Zimdahl, J.; Kamtsiuris, A.; Meissner, R.; Raddatz, F.; Haufe, S. Development of a Digital Twin for Aviation Research. In Proceedings of the Deutscher Luft- und Raumfahrt Kongress, Online, 1–3 September 2020. [Google Scholar]
- Institute of Aircraft Design, University of Stuttgart. E-Genius Homepage. Available online: https://www.ifb.uni-stuttgart.de/en/research/mannedaircraft/e-genius/ (accessed on 18 December 2024).
- Geiß, I.; Strohmayer, A. Operational Energy and Power Reserves for Hybrid-Electric and Electric Aircraft; Deutsche Gesellschaft für Luft- und Raumfahrt—Lilienthal-Oberth e.V.: Bonn, Germany, 2021. [Google Scholar] [CrossRef]
- Fédération Aéronautique Internationale. FAI Sporting Code: Section 2-Aeroplanes. Available online: https://www.fai.org/sites/default/files/documents/sporting_code_section_2-_aeroplanes_-_edition_2024.pdf (accessed on 22 November 2024).
- Botero, E.M.; Wendorff, A.; MacDonald, T.; Variyar, A.; Vegh, J.M.; Lukaczyk, T.W.; Alonso, J.J.; Orra, T.H.; Ilario da Silva, C. SUAVE: An Open-Source Environment for Conceptual Vehicle Design and Optimization. In Proceedings of the 54th AIAA Aerospace Sciences Meeting, San Diego, CA, USA, 4–8 January 2016. [Google Scholar] [CrossRef]
- Wendorff, A.; Variyar, A.; Ilario, C.; Botero, E.; Capristan, F.; Smart, J.; Alonso, J.; Kulik, L.; Clarke, M.; Colonno, M.; et al. SUAVE: An Aerospace Vehicle Environment for Designing Future Aircraft; Stanford University: Stanford, CA, USA, 2022. [Google Scholar]
- Karpuk, S.; Mosca, V.; Liu, C.; Elham, A. Development of a Multi-fidelity Design, Analysis, and Optimization Environment for Future Transport Aircraft. In Proceedings of the AIAA SCITECH 2022 Forum, Reston, VA, USA, 3–7 January 2022. [Google Scholar] [CrossRef]
- Raymer, D.P. Aircraft Design: A Conceptual Approach, 2nd ed.; AIAA Education Series; American Institute of Aeronautics and Astronautics: Washington, DC, USA, 1992. [Google Scholar]
- Roskam, J. Airplane Design, Part II: Preliminary Configuration Design and Integration of the Propulsion System, 4th ed.; DARcorporation: Lawrence, KS, USA, 2004. [Google Scholar]
- Torenbeek, E. Synthesis of Subsonic Airplane Design: An Introduction to the Preliminary Design of Subsonic General Aviation and Transport Aircraft, with Emphasis on Layout, Aerodynamic Design, Propulsion and Performance, 1st ed., 8th Reprint ed.; Kluwer Academic Publ: Dordrecht, The Netherlands, 1982. [Google Scholar]
- Geiß, I.; Voit-Nitschmann, R. Sizing of the energy storage system of hybrid-electric aircraft in general aviation. CEAS Aeronaut. J. 2017, 8, 53–65. [Google Scholar] [CrossRef]
- Hepperle, M. Electric Flight-Potential and Limitations. In Proceedings of the Energy Efficient Technologies and Concepts of Operation, Lisbon, Portugal, 22–24 October 2012. [Google Scholar]
- Grüning, N. Development and Validation of an e-Genius Simulation Model in the Conceptual Design Environment SUAVE. Bachelor’s Thesis, Universität Stuttgart, Stuttgart, Germany, 2023. [Google Scholar]
- Lukaczyk, T.W.; Wendorff, A.D.; Colonno, M.; Economon, T.D.; Alonso, J.J.; Orra, T.H.; Ilario, C. SUAVE: An Open-Source Environment for Multi-Fidelity Conceptual Vehicle Design. In Proceedings of the 16th AIAA/ISSMO Multidisciplinary Analysis and Optimization Conference, Dallas, TX, USA, 22–26 June 2015. [Google Scholar] [CrossRef]
- Shevell, R.S.; Bayan, F.P. Development of a Method for Predicting the Drag Divergence Mach Number and the Drag due to Compressibility for Conventional and Supercritical Wings; Stanford University: Stanford, CA, USA, 1980. [Google Scholar]
- Raymer, D.P. Aircraft Design: A Conceptual Approach, 6th ed.; AIAA Education Series; American Institute of Aeronautics and Astronautics, Inc.: Reston, VA, USA, 2018. [Google Scholar]
- EMRAX|Uros Klopcic. EMRAX 268 Technical Data: Version 1.5. Available online: https://emrax.com/wp-content/uploads/2024/02/EMRAX_268_datasheet_v1.5.pdf (accessed on 20 January 2025).
- UNITEK Industrie Elektronik GmbH. MANUAL Digitaler Batterie-Motorregler. 2022. Available online: https://www.unitek-industrie-elektronik.de/wp-content/uploads/BAMOCAR-PG-D3-700-400_DE.pdf (accessed on 20 January 2025).
- Sineton d.o.o. Elektromotor für Hydrogenius: A0911 Datasheet. 2009. [Google Scholar]
- Wells, D.P.; Horvath, B.L.; McCullers, L.A. The Flight Optimization System Weights Estimation Method; Technical Report NASA/TM-2017-219627; NASA: Washington, DC, USA, 2017; Volume I. [Google Scholar]
- Schumann, L. Reduktion des Energiebedarfs Mittels Eines Batterieelektrischen Antriebs am Beispiel Eines Kleinflugzeugs; Institut für Flugzeugbau, Universität Stuttgart: Stuttgart, Germany, 2018. [Google Scholar] [CrossRef]
- Lindner, M. Analyse und Optimierung der Kühlluftströmung von e-Genius Hybrid. Master’s Thesis, Universität Stuttgart, Stuttgart, Germany, 2021. [Google Scholar]
- European Aviation Safety Agency. Easy Access Rules for Standardised European Rules of the Air (SERA); Technical Report; European Aviation Safety Agency: Cologne, Germany, 2023. [Google Scholar]
- Deutsche Flugsicherung GmbH. AIP AD 2-68. 2025. Available online: https://aip.dfs.de/BasicVFR/2025MAY01/pages/809352015B5361E6C5FA4756859ABD33.html (accessed on 31 January 2025).
- European Aviation Safety Agency. Easy Access Rules for Air Operations: Annex VII (Part-NCO) Subpart B; European Aviation Safety Agency: Cologne, Germany, 2023. [Google Scholar]
- André Borschberg (SUI) (17594)|World Air Sports Federation. Available online: https://www.fai.org/record/17594 (accessed on 28 March 2025).
Figure 1.
e-Genius in its hybrid electric configuration.
Figure 1.
e-Genius in its hybrid electric configuration.
Figure 2.
Series hybrid-electric powertrain layout of the e-Genius [
24].
Figure 2.
Series hybrid-electric powertrain layout of the e-Genius [
24].
Figure 3.
Measured data of the real flight altitude (left) and True Airspeed (TAS) (right) mission profile of the record mission.
Figure 3.
Measured data of the real flight altitude (left) and True Airspeed (TAS) (right) mission profile of the record mission.
Figure 4.
Measured data for the mission profile of the record mission for the power of the electric motor, the generator and the battery.
Figure 4.
Measured data for the mission profile of the record mission for the power of the electric motor, the generator and the battery.
Figure 5.
SUAVE mission segments (red and numbers) derived from the real-world mission data (blue) that serve as an input for the simulation.
Figure 5.
SUAVE mission segments (red and numbers) derived from the real-world mission data (blue) that serve as an input for the simulation.
Figure 6.
Serial hybrid propulsion architecture illustrating the energy network as the combination of an internal combustion engine (ICE), generator (GEN), converter (CON), electric motor (EM), and battery (BAT). The figure shows the energy flow between the components, with power efficiency by for each component in the system. The thrust T is generated by the propeller (P).
Figure 7.
Aerodynamic flight testing with the clean e-Genius without a propeller and cooling inlet (
left) [
42] compared to the aerodynamic calibration results and regression line (blue) of the model (
right). Different flap settings were conducted, as well as a preliminary design in the flight testing. To compare the data with the results of the model, an average out of all flap settings is used.
Figure 8.
Calculated drag points and the regression curve (blue) in comparison to the new drag curve with increased parasitic drag (light blue).
Figure 8.
Calculated drag points and the regression curve (blue) in comparison to the new drag curve with increased parasitic drag (light blue).
Figure 9.
Results of the model fuel flow compared to the mission data.
Figure 9.
Results of the model fuel flow compared to the mission data.
Figure 10.
Results of the model power compared to mission data from the reference mission.
Figure 10.
Results of the model power compared to mission data from the reference mission.
Figure 11.
Measured data of the real flight altitude (left) and TAS (right) mission profile of the 500 km mission and the approximation in the SUAVE model. The spikes are due to momentary problems with data exchange between the vario and the logger during the flight.
Figure 11.
Measured data of the real flight altitude (left) and TAS (right) mission profile of the 500 km mission and the approximation in the SUAVE model. The spikes are due to momentary problems with data exchange between the vario and the logger during the flight.
Figure 12.
Results of the model fuel flow compared to mission data from the 500 km mission.
Figure 12.
Results of the model fuel flow compared to mission data from the 500 km mission.
Figure 13.
Results of the model power compared to mission data from the 500 km mission.
Figure 13.
Results of the model power compared to mission data from the 500 km mission.
Figure 14.
Measured data of the real flight altitude (left) and TAS (right) mission profile of the 1000 km mission and the approximation in the SUAVE model. Again, the spikes are due to momentary problems with data exchange between the vario and the logger during the flight.
Figure 14.
Measured data of the real flight altitude (left) and TAS (right) mission profile of the 1000 km mission and the approximation in the SUAVE model. Again, the spikes are due to momentary problems with data exchange between the vario and the logger during the flight.
Figure 15.
Results of the model fuel flow compared to mission data from the 1000 km mission.
Figure 15.
Results of the model fuel flow compared to mission data from the 1000 km mission.
Table 1.
Data of the e-Genius in its long range hybrid-electric configuration.
Table 1.
Data of the e-Genius in its long range hybrid-electric configuration.
| Parameter | Value |
|---|
| General aircraft data |
| Operational mass empty | 763 | |
| Maximum take-off mass | 950 | |
| Wing area | 14.1 | |
| Wing span | 16.9 | |
| Maximum take-off power | 80 | |
| Maximum continuous power | 35 | |
| Hybrid-electric propulsion system |
| Battery capacity | 11 | |
| Battery system mass | 65 | |
| Maximum continuous power of the combustion engine | 35 | |
| Mass of hybrid system (w/o batteries and tank) | 114 | |
| Maximum fuel capacity | 98 | |
Table 2.
Efficiencies of the e-Genius powertrain.
Table 2.
Efficiencies of the e-Genius powertrain.
| Component | | Efficiency |
|---|
| Generator [38] | | 94% |
| Battery | | 99% |
| Converter Generator [39] | | 97% |
| Converter Electric Motor | | 98% |
| Electric Motor [40] | | 95% |
| Propeller | | 90% (cruise), 80% (takeoff) |
Table 3.
Final mission model data compared to mission data from the reference mission.
Table 3.
Final mission model data compared to mission data from the reference mission.
| Parameter | Flight Data | SUAVE/Digital Twin | Difference |
|---|
| Flight Time | 10
h
31
min | 10
h
31
min | 0.0% |
| Distance | 2031
km | 2031
km | 0.0% |
| Fuel Burnt |
L |
L | 0.4% |
Table 4.
Final mission model data compared to mission data for the 500 km mission.
Table 4.
Final mission model data compared to mission data for the 500 km mission.
| Parameter | Flight Data | SUAVE/Digital Twin | Difference |
|---|
| Flight Time | 3
h
22
min | 3
h
22
min | 0.0% |
| Distance | 650
km | 650
km | 0.0% |
| Fuel Burnt |
L |
L | 5.1% |
Table 5.
Final mission model data compared to mission data from the 1000 km mission.
Table 5.
Final mission model data compared to mission data from the 1000 km mission.
| Parameter | Flight Data | SUAVE/Digital Twin | Difference |
|---|
| Flight Time | 6
h
20
min | 6
h
20
min | 0.0% |
| Distance | 1055
km | 1055
km | 0.0% |
| Fuel Burnt | 36
L |
L | 0.6% |
| Disclaimer/Publisher’s Note: The statements, opinions and data contained in all publications are solely those of the individual author(s) and contributor(s) and not of MDPI and/or the editor(s). MDPI and/or the editor(s) disclaim responsibility for any injury to people or property resulting from any ideas, methods, instructions or products referred to in the content. |
© 2025 by the authors. Licensee MDPI, Basel, Switzerland. This article is an open access article distributed under the terms and conditions of the Creative Commons Attribution (CC BY) license (https://creativecommons.org/licenses/by/4.0/).


