1. Introduction
As the demand for quality services among air passengers continues to rise, higher requirements are being placed on the contact stand. The Bay Area, which can provide more contact stands, is key to improving the bridge docking rate. The Bay Area primarily consists of stands and taxiway corridors, and their coordinated operation is crucial to overall efficiency. However, due to the complexity of aircraft movements within the Bay Area and the significant interdependencies between stands, optimizing operational procedures in the Bay Area has become a critical challenge that the industry urgently needs to address. During peak flight hours at busy airports, ramp congestion and aircraft rollout conflicts occur from time to time, resulting in ever-increasing flight delays. There are two main types of aircraft rollout conflicts: (1) neighboring aircraft rollout conflicts; (2) non-neighboring aircraft rollout conflicts with their taxiing forward rollout aircraft in the taxiing process [
1]. Meanwhile, as airport airside operations transition from digitization to intelligent management, the traditional sequential single-aircraft pushback method is no longer sufficient to meet peak-hour operational demands. The Bay Area has become a major bottleneck in airport efficiency, requiring urgent optimization.
The Civil Aviation Administration has issued relevant regulations on apron layout and aircraft operation rules on the apron. At present, some studies have focused on optimizing the apron layout, planning stand arrangements and taxiway settings to improve apron operation efficiency. For example, Hagspihl et al. [
2] established a mixed-integer programming model to plan the apron layout, aiming to minimize the number of aircraft assigned to remote stands. Wang et al. [
3] planned the remote apron stand layout and taxiway configuration with the objective of maximizing the number of stands. Li M. et al. [
4] constructed an evaluation index system for the spatial efficiency of Bay Area apron areas from the two perspectives of apron design and operation, and applied it to the calculation of domestic Bay Area. The results show that the proposed system can effectively evaluate the spatial efficiency of Bay Area with different layouts.
Current research on the optimization of Bay Area operations at domestic and international airports primarily focuses on two aspects: stand allocation optimization and operational procedure optimization.
Regarding stand allocation optimization, Burke et al. [
5] set fuel consumption reduction and economic cost minimization as two primary optimization objectives and proposed two airport surface operation strategies. By improving the stand allocation strategy, they optimized the departure queue sequence and reduced unnecessary aircraft delays before takeoff. Diepen et al. [
6] proposed a column generation algorithm and developed a two-stage model to analyze the robustness of stand allocation. Cheng et al. [
7] established a stand allocation model and evaluated the performance of three metaheuristic algorithms: Genetic Algorithm (GA), Tabu Search (TS), and Simulated Annealing (SA). Zoutendijk, M. [
8] applied Mixture Density Networks (MDNs) and Random Forest Regression to predict flight delays at European airports. They further integrated probabilistic forecasting into a stochastic stand allocation problem, achieving up to a 74% reduction in conflicting flights compared to deterministic gate assignment models. Xue Y. [
9] introduced a safety-based apron grouped operation rule, developed a constraint model, and optimized the model using Genetic Algorithm (GA) to achieve a balanced distribution of stand idle time. Liu Y. [
10] considered factors such as bridge docking rate, passenger walking distance and stand conflict, and proposed a multi-objective stand allocation collaborative optimization model. Bagamanova et al. [
11] focused on the robustness of slot allocation, proposed an innovative allocation method to mitigate the impact of flight delays on overall operations, and validated it with simulation tools. Karsu et al. [
12] established a mixed-integer planning model with the optimization objectives of minimizing the total walking distance of passengers and minimizing the number of flights assigned to the remote seats, and solved the problem by using a branch-and-bound algorithm, which effectively protects the rights and interests of passengers. She et al. [
13] investigated the slot allocation problem of flights under different operating states, transformed the preferences of airport operators into scores as the optimization objective, and considered the robustness problem caused by flight delays at the same time, and they designed a two-phase Monte Carlo-based NSGA-II algorithm for effective solution.
Regarding operational procedure optimization, Wouter van Lingen [
14] analyzed the impact of gate pit-stops on flight delays and operational efficiency. By integrating the Electronic Taxiing System (ETS) into the modeling of aircraft arrival and departure states, they demonstrated the effectiveness of gate pit-stops in improving operational efficiency. Li Z. [
15] constructed a dynamic waiting point model and used a two-layer simulated annealing algorithm to reduce stand delay time. Yu Q. [
16] proposed a Bay Area operation optimization strategy under apron control handover conditions. Based on the analysis of Bay Area configurations, they developed a particle swarm optimization algorithm to minimize total pushback time within the Bay Area. Chang Y. [
17] established a flight conflict detection algorithm for the Bay Area, based on airport Bay Area usage rules and historical flight data nodes, providing support for air traffic controllers in scheduling adjustments. Yang T. [
18] proposed an airport airside Bay Area optimization model, which introduced stand-related factors and quantified structural parameters. Using a dynamic grouping method, they effectively improved airport airside operational efficiency. Shi Z. et al. [
19] investigated operational restrictions specific to Beijing Daxing Airport’s Bay Area configuration, analyzing the impact of aircraft conflicts within the Bay Area. Liu Y. [
20] designed a U-shaped apron operation program, including exclusive, zonal shared, and globally shared modes. Through multi-dimensional evaluation metrics and classification-based assessments, the global sharing mode significantly increased apron capacity and improved operational efficiency at complex airports.
From the above studies, it can be seen that the optimization of stand allocation in the Bay Area has only improved the turnover rate and utilization of stands. In terms of optimizing operational procedures, it has merely reduced the number of conflicts within the Bay Area and enhanced the operational efficiency of a single aircraft, and it has optimized zonal grouping within the existing stand allocation. However, these improvements have had a limited impact on the overall operational efficiency of the Bay Area.
Deep reinforcement learning has been widely applied in path planning. Dai S. [
21] designed an efficient path planning framework for multi-unmanned vehicle systems using deep reinforcement learning, and introduced an improved twin-delayed deep deterministic policy gradient (TD3) algorithm, enabling effective exploration in unknown environments and efficient collaborative obstacle avoidance and encirclement. Si P. [
22] proposed a multi-agent deep reinforcement learning UAV path planning framework that employs the proximal policy optimization (PPO) algorithm and network pruning to improve training efficiency, verifying its effectiveness under different parameter configurations. Y. Guan [
23] proposed a collaborative multi-UAV trajectory design method based on multi-agent proximal policy optimization (MAPPO) to enhance RF/FSO channel throughput, demonstrating that MAPPO outperforms state-of-the-art deep reinforcement learning (DRL) methods in RF resource allocation efficiency. Liu, X. [
24] designed a comprehensive reward function based on the angle, speed, altitude, distance, and damage in the missile attack area for unmanned combat aerial vehicles (UCAVs), utilizing the centralized training and decentralized execution paradigm to enhance UAV decision-making capabilities and algorithm training efficiency. Kang H. [
25] further improved training efficiency by introducing state normalization and action masking strategies. Wei, D. [
26] addressed the challenge of sparse and stochastic rewards in UAV agents’ learning to search for unknown dynamic targets by proposing the OC-MAPPO method, which provides stable and continuous rewards for agents. Ming C. [
27] proposed an online multi-agent proximal policy optimization (O-MAPPO) scheme to enhance energy efficiency while satisfying task execution, power consumption, computation, and time constraints. Simulation results show that O-MAPPO significantly outperforms benchmark algorithms in robustness and stability.
This paper proposes a deep reinforcement learning-based Multi-Stand Grouped Operations method to enhance the Bay Area’s capability to simultaneously operate multiple aircraft, thereby improving the overall operational efficiency of the Bay Area. The specific innovations are as follows:
Proposed a Multi-Stand Grouped Operations method based on a safety threshold, constructing a secure operational space for aircraft in the Bay Area;
Developed an optimization model for the Bay Area based on the Multi-Stand Grouped Operations method;
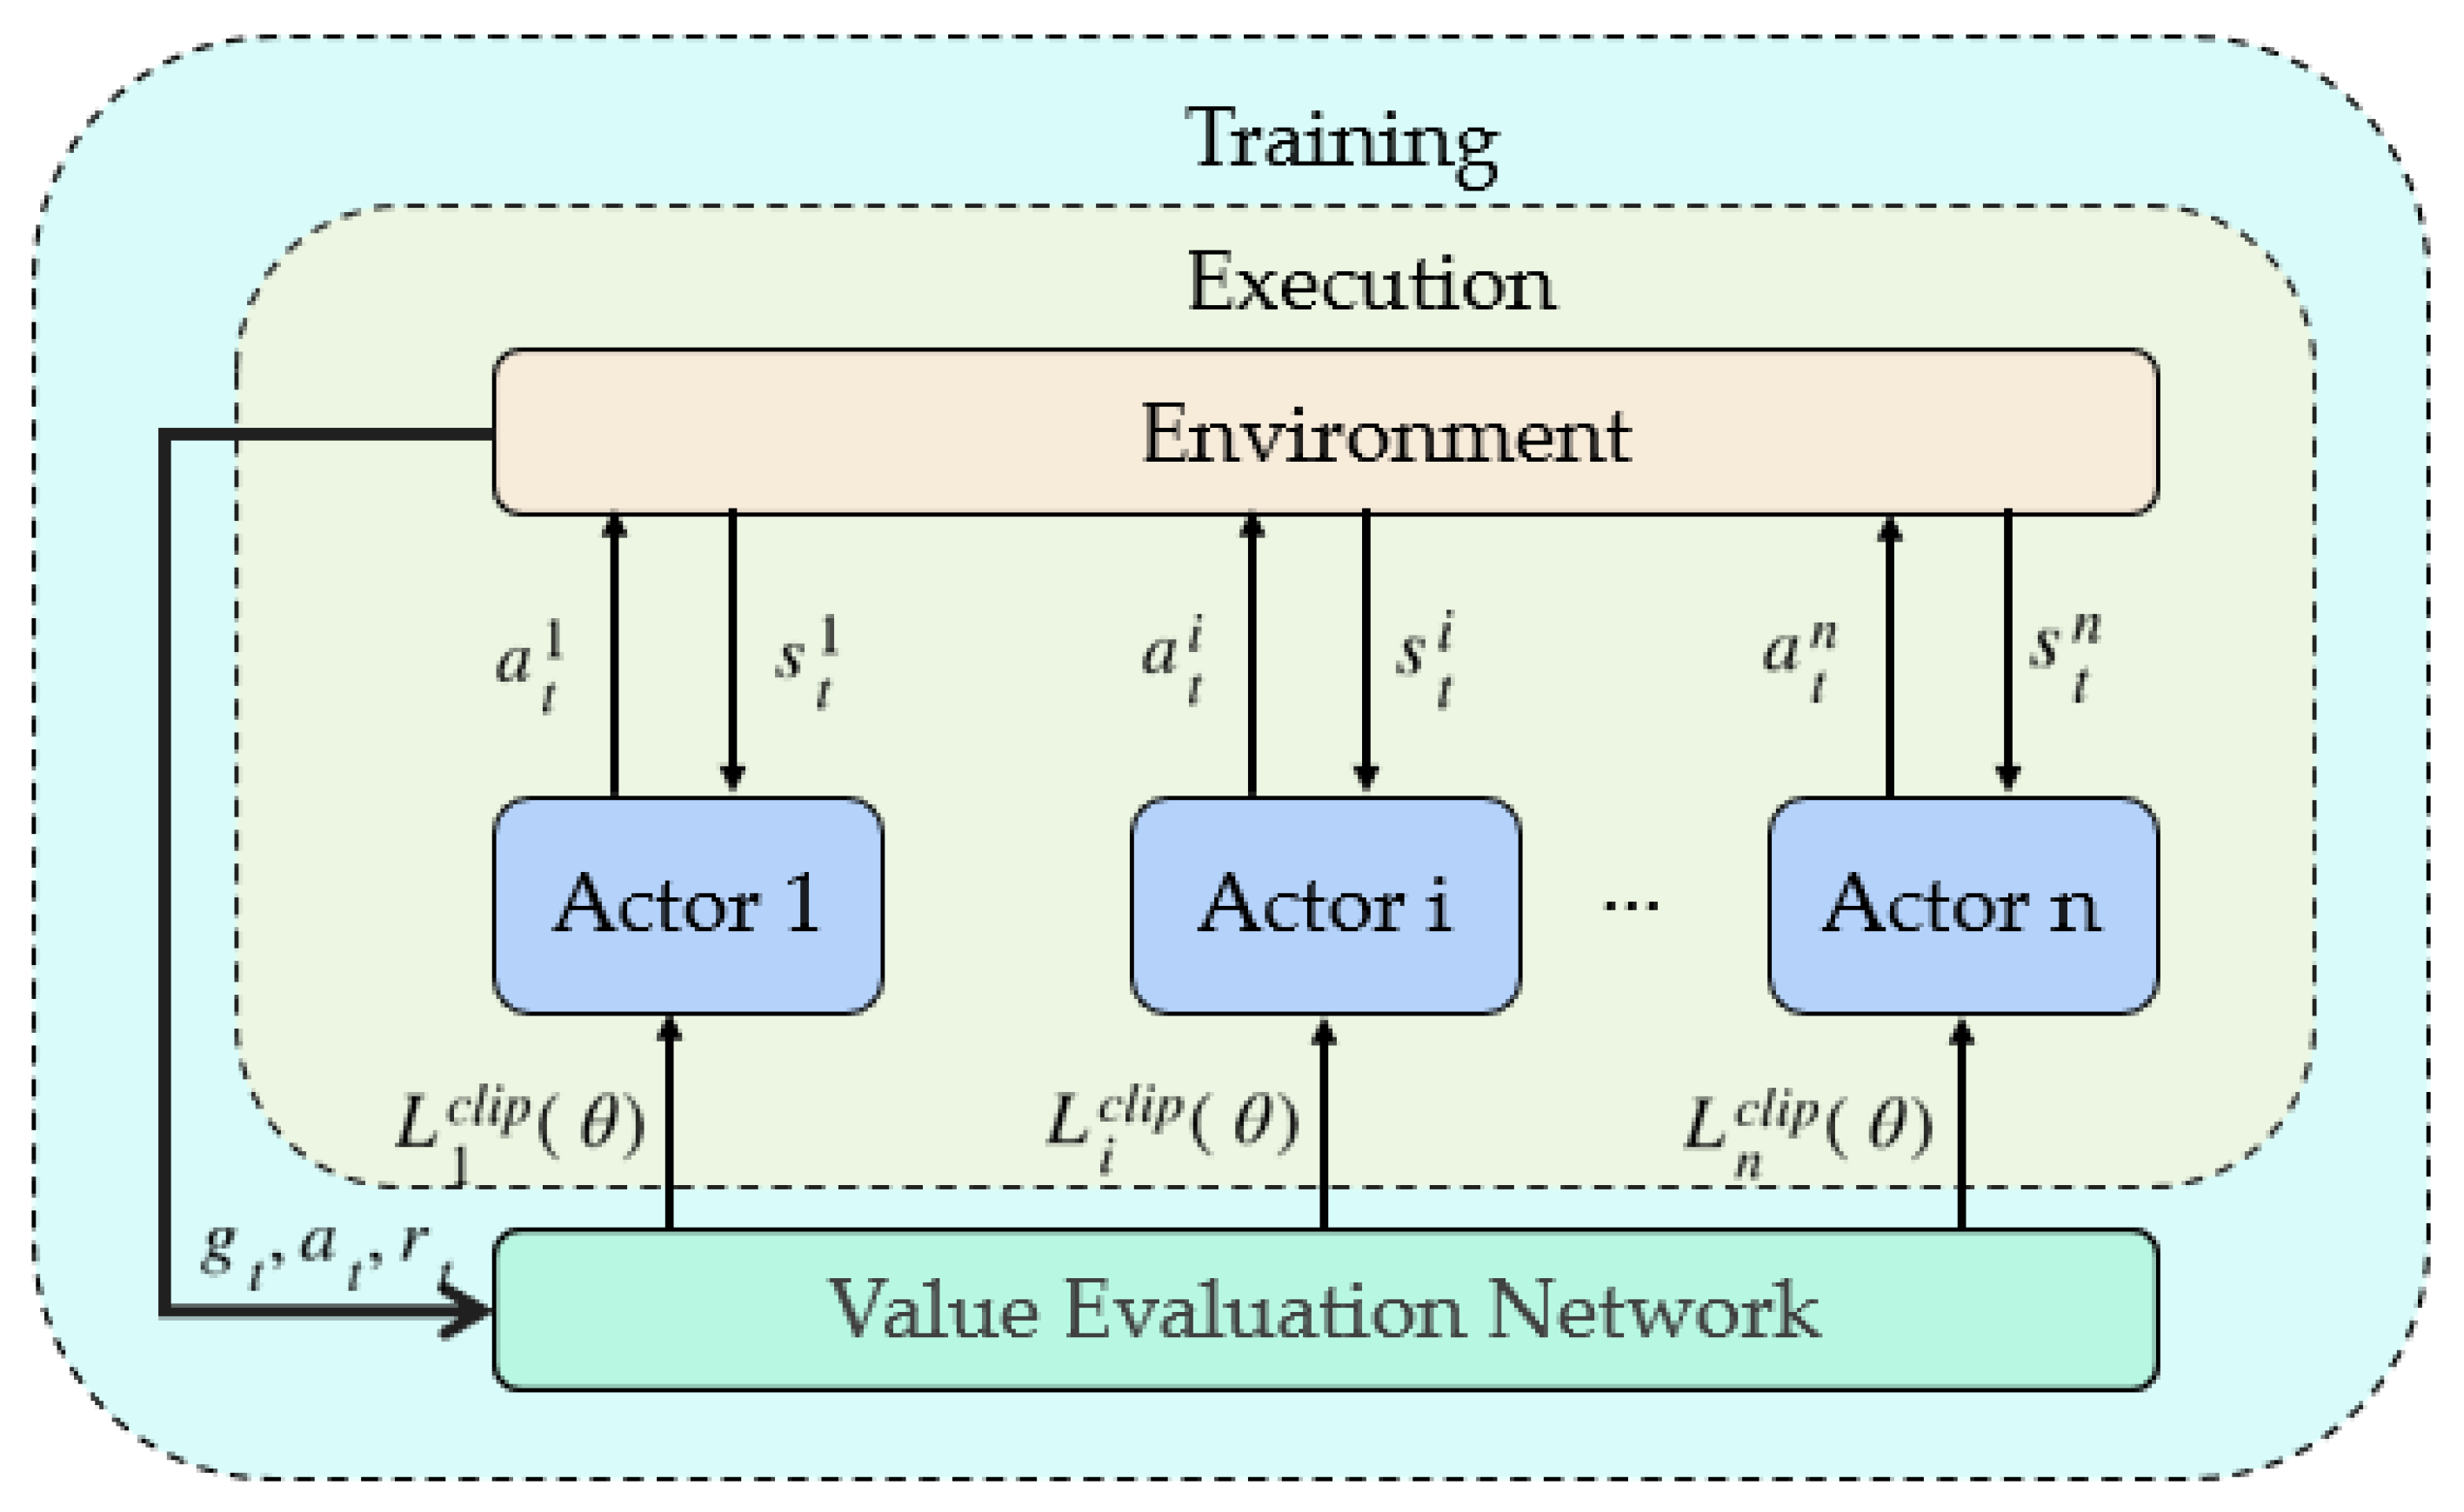
Employed the MAPPO algorithm to derive optimal slip-in and pushback strategies, enabling distributed decision-making;
Provided a reference model for the Airport Operations Center (AOC) in stand allocation, facilitating stand reallocation and multi-stand marshalling operations to reduce flight delays and enhance Bay Area operational efficiency.
2. Current Status of the Analysis of the Composition and Operational Characteristics of the Facilities in the Airport Bay Area
2.1. Comprehensive Analysis of Aircraft Operational Processes in the Bay Area
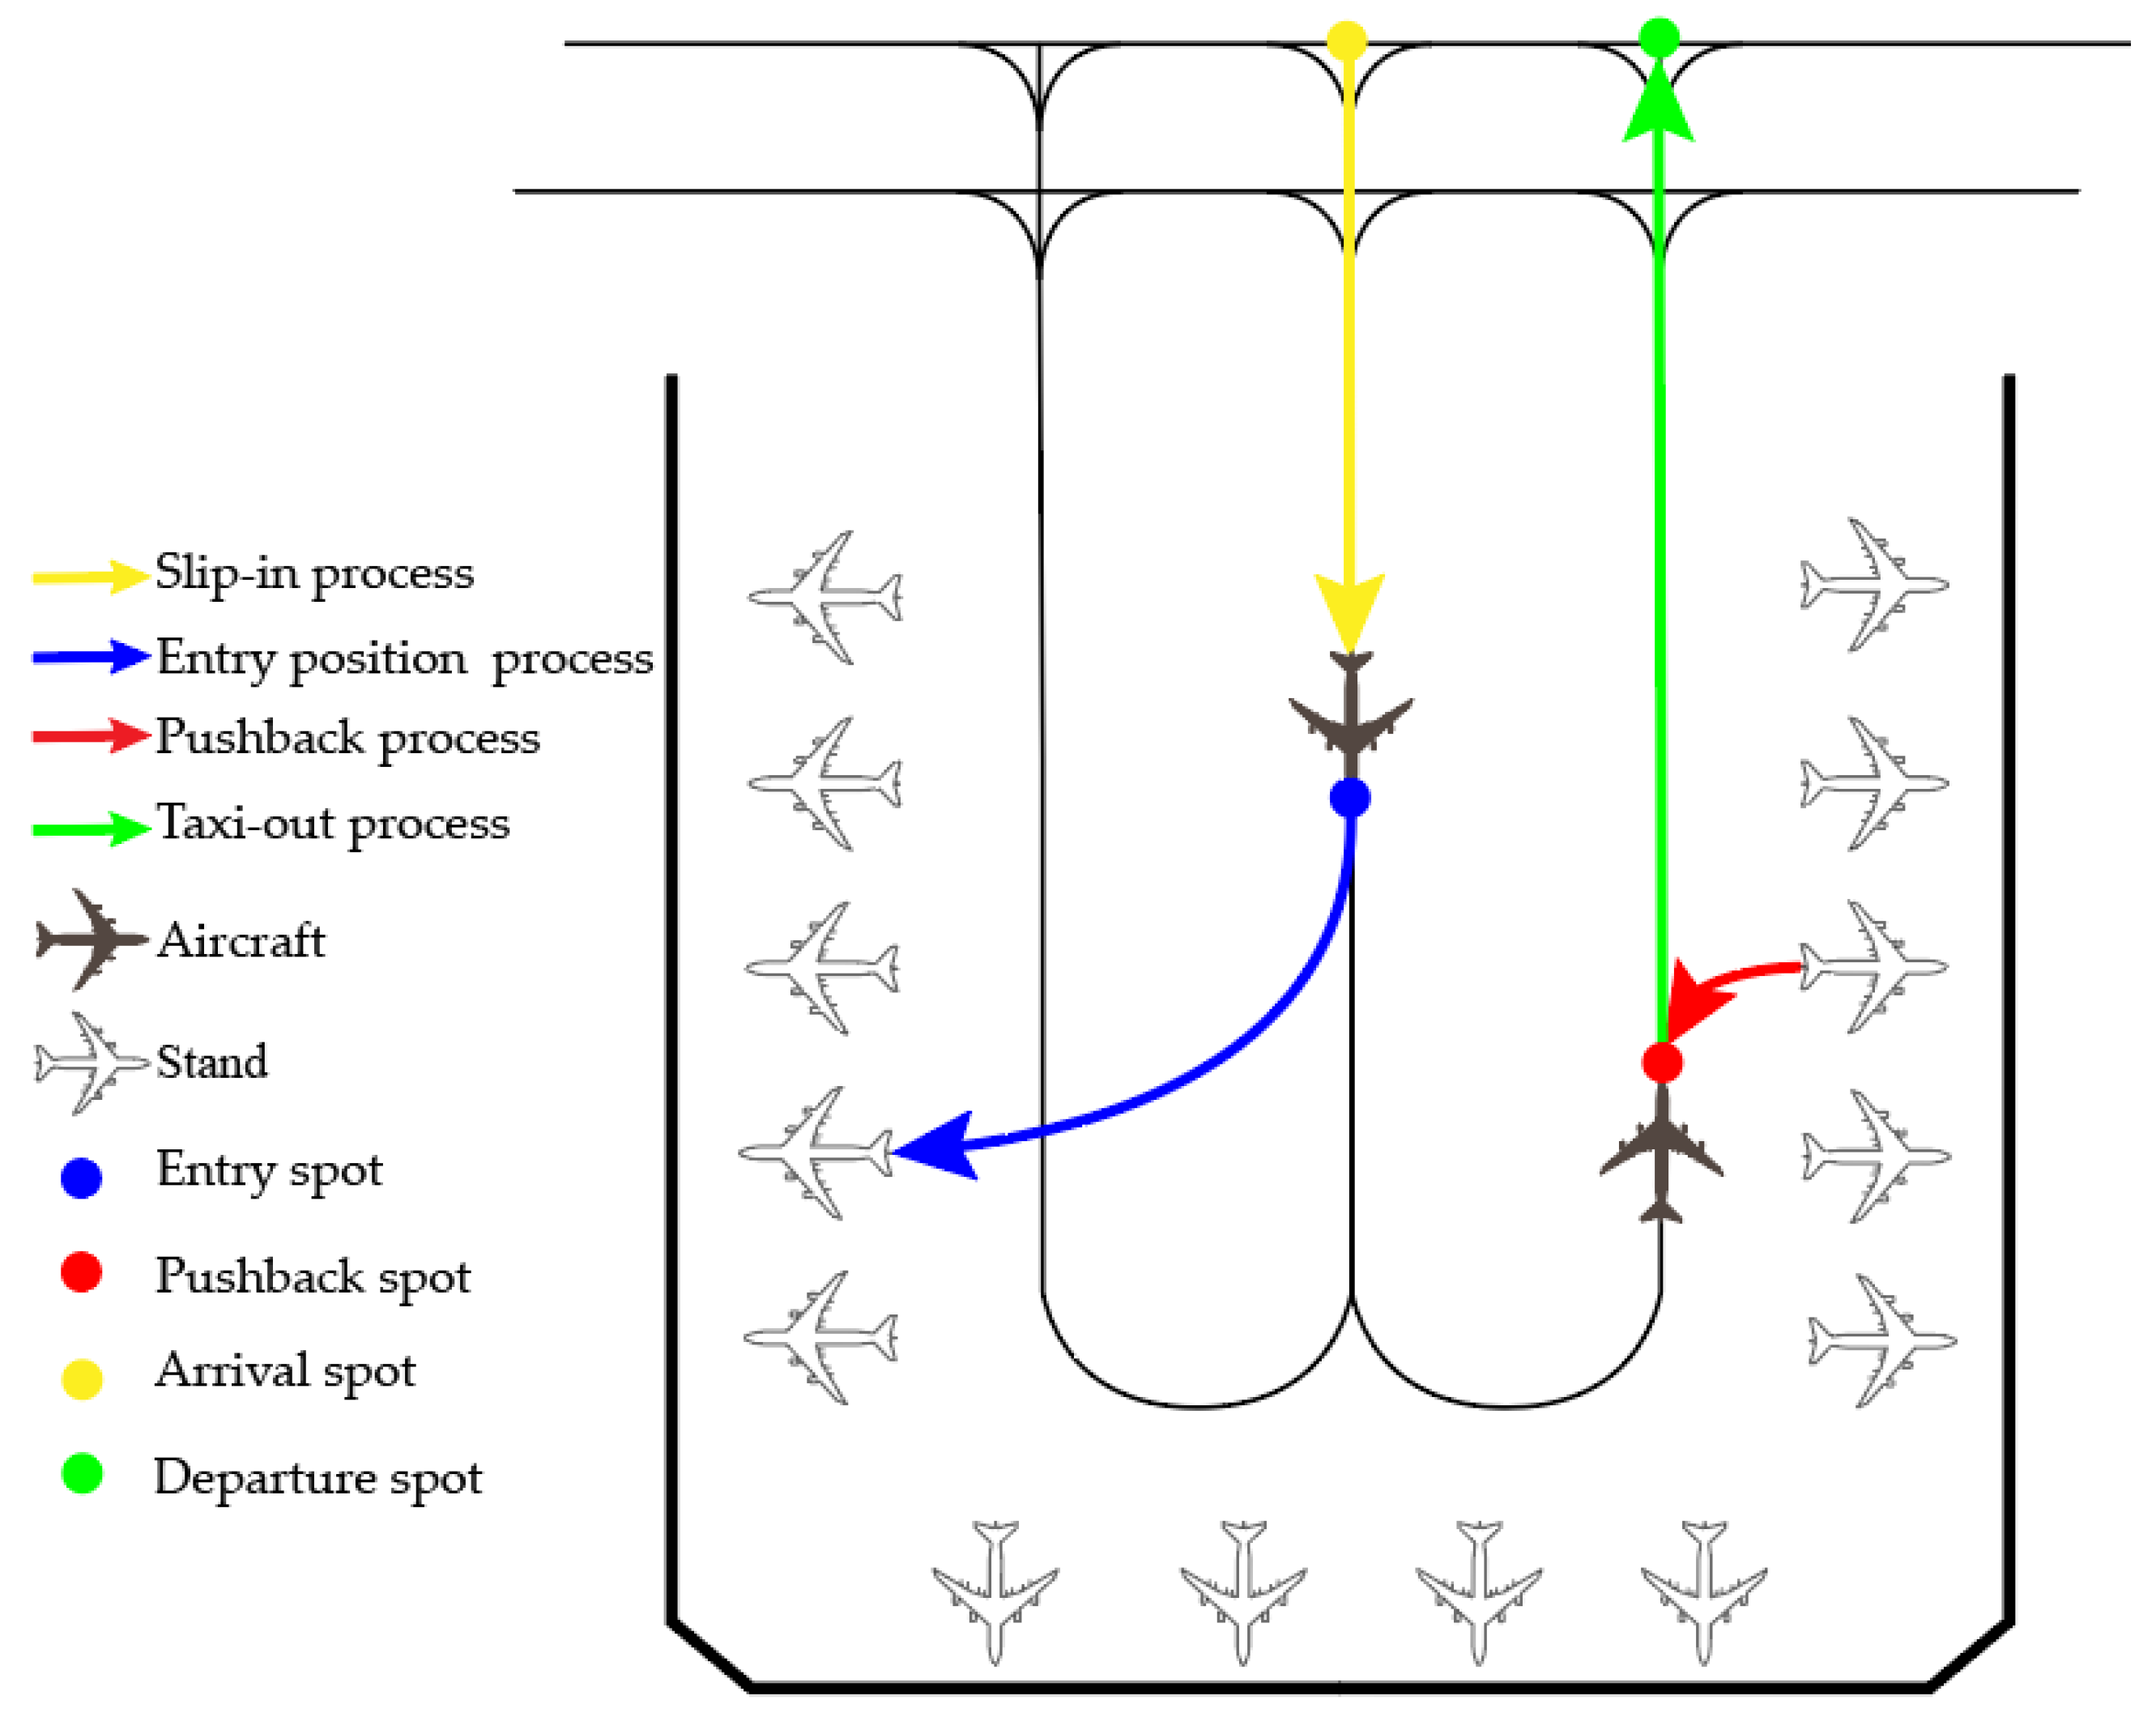
Aircraft operating in the Bay Area generally follow four main processes: slip-in process, entry process, pushback process, and taxi-out process. Arrival flights must complete the slip-in process to enter the assigned stand, while departure flights undergo a pushback process followed by a taxi-out process to exit the Bay Area. These processes are illustrated in
Figure 1.
Slip-in process. The slip-in process refers to the aircraft taxiing from the Bay Area’s arrival spot to the designated entry spot, which corresponds to the assigned stand. The entry spot is a virtual point on the taxiway where the aircraft transitions from taxiway operation to stand operation;
Entry process. The entry process involves taxiing the aircraft from the entry spot to the designated stand;
Pushback process. The pushback process refers to the aircraft being towed by a pushback tug from the stand to the designated pushback spot;
Taxi-out process. The taxi-out process is the phase where the aircraft taxis from the pushback spot to the Bay Area exit point in preparation for departure.
2.2. Analysis of Stand Types and Pushback Process in the Bay Area
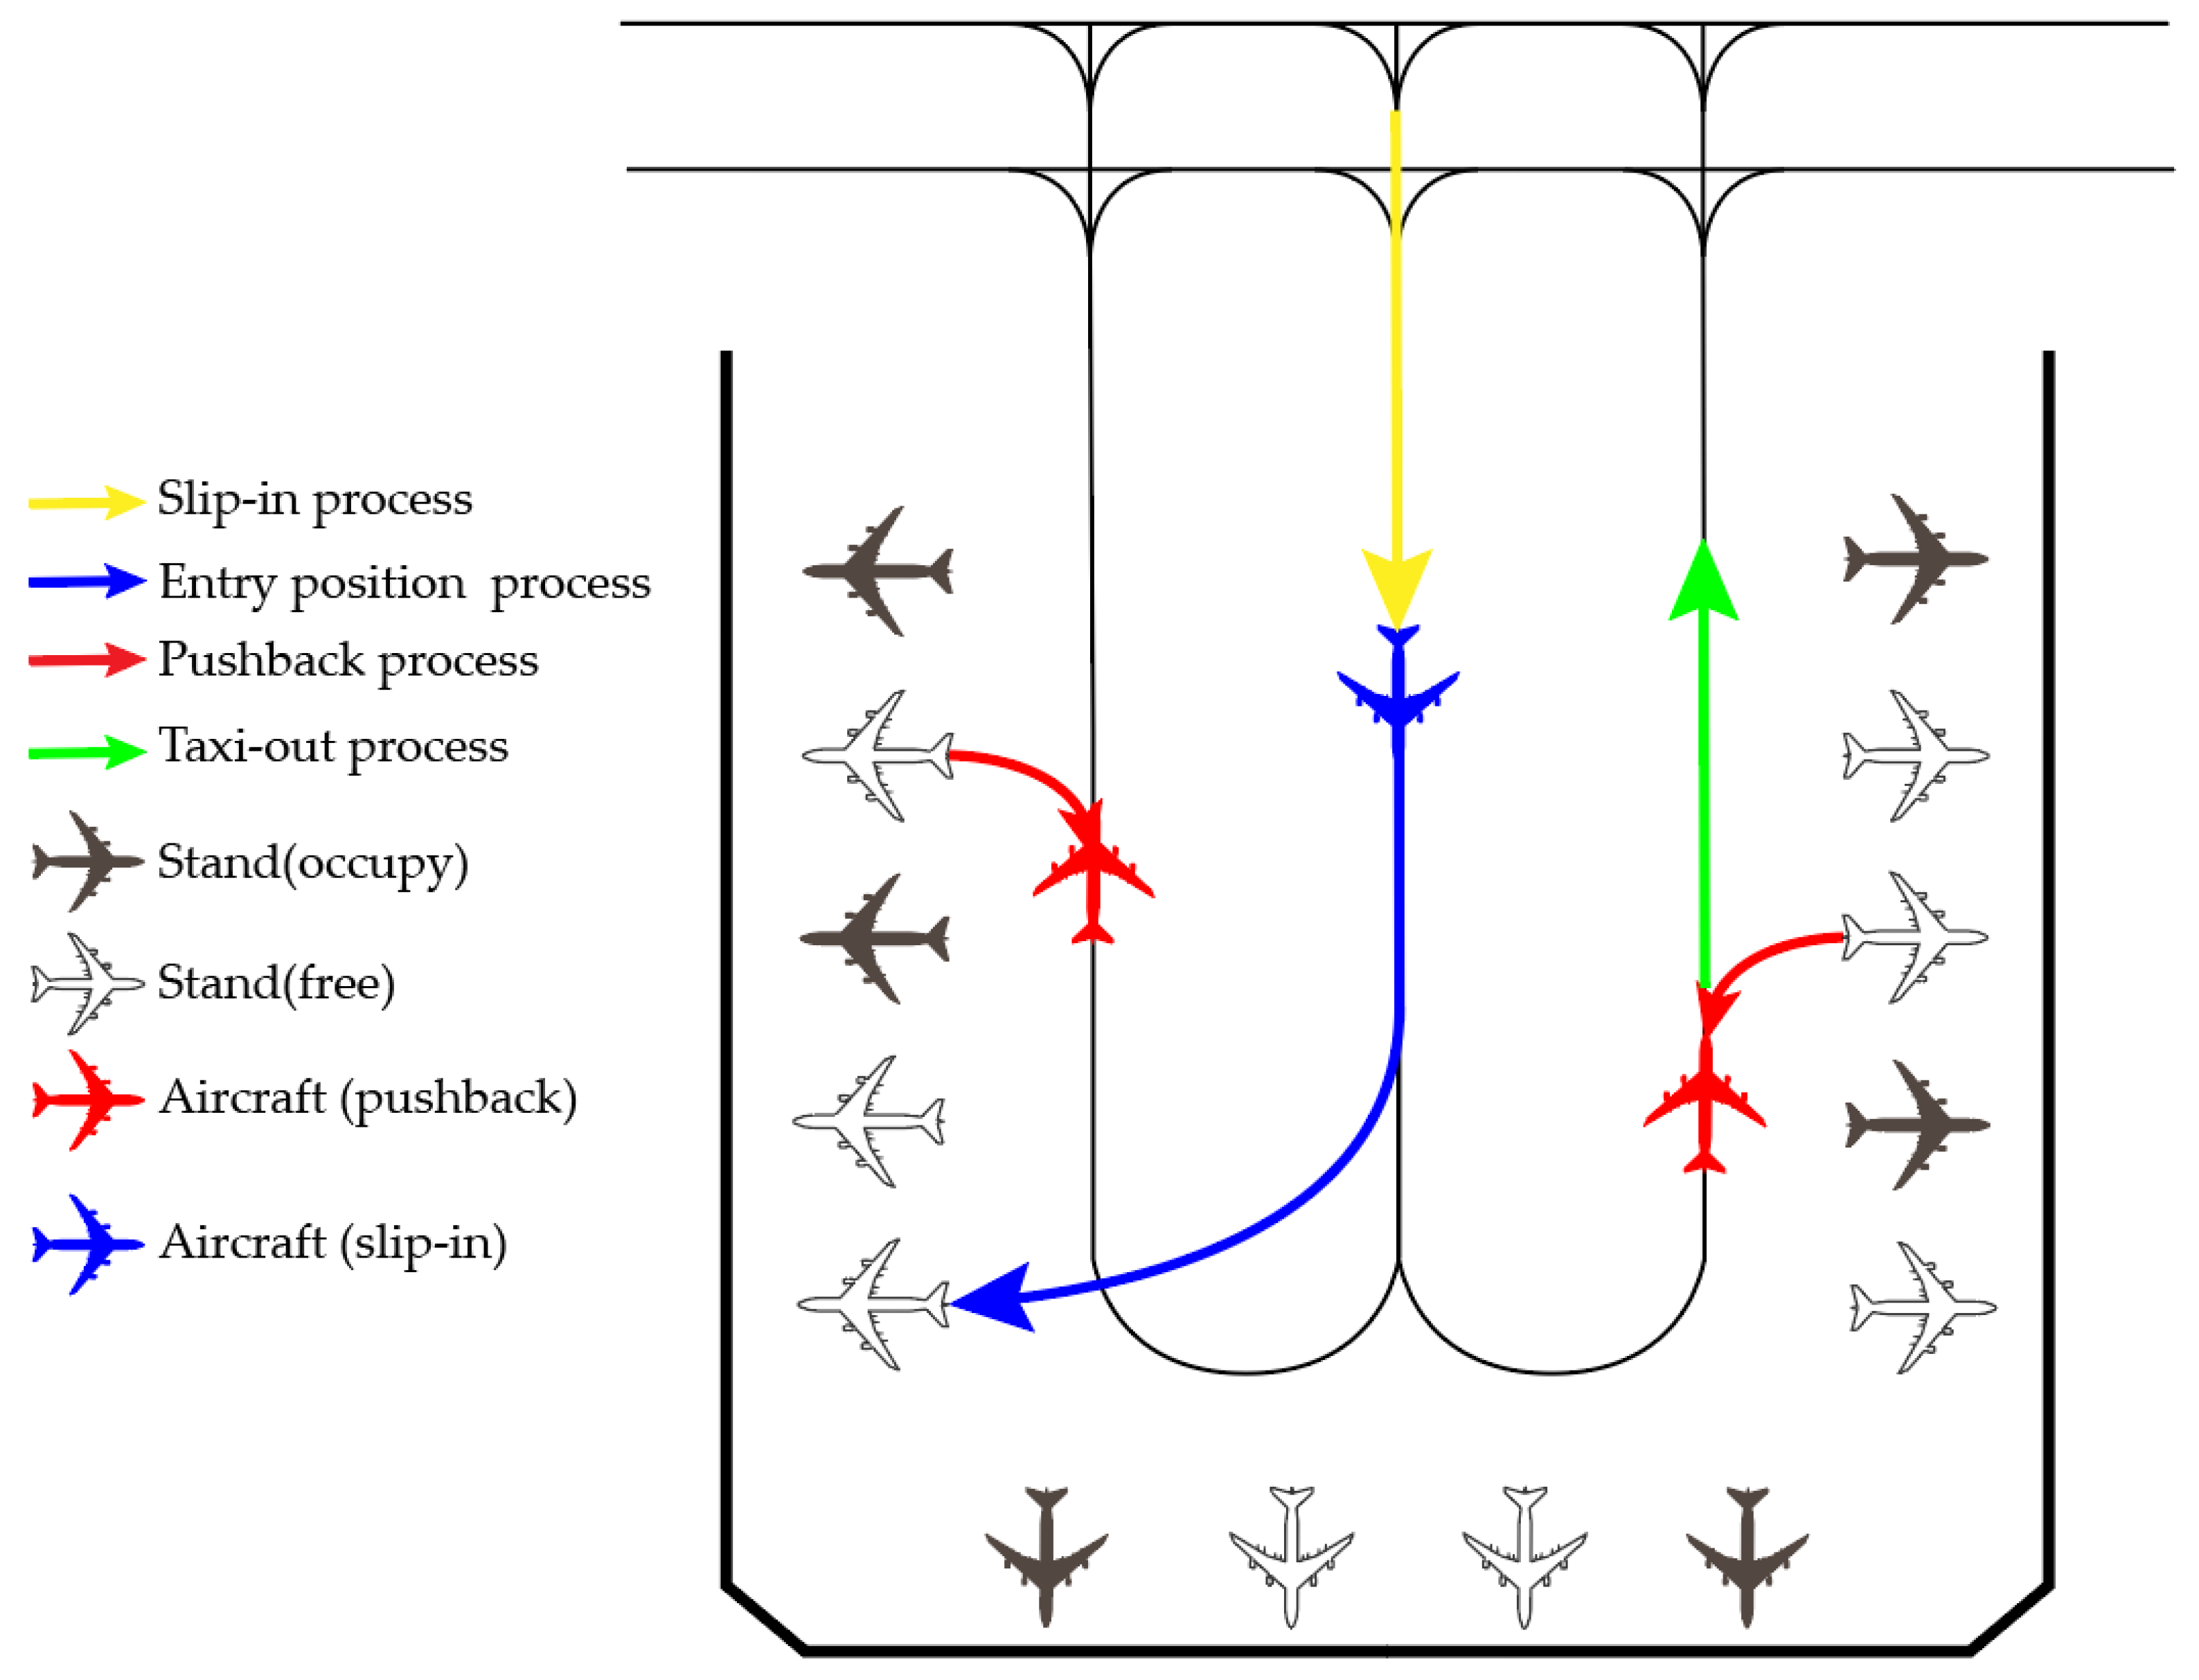
The stands in the Bay Area can be divided into three types according to their location—pier stand, terminal stand and corner stand. The stand release procedure is mainly reflected in the release flow; the release flow of the stand is related to the direction of travel of the taxiway at its location and nearby. The traditional release method at the airport is a one-sided release mode. In order to maximize the number of grouped flights, the terminal stand can adopt a two-sided release mode. Taking the three-aisle Bay Area as an example, we can describe the following steps:
Pier stands are stands located in the terminal building’s finger section and close to the outside of the taxiway. The closer a pier stand is to the outside of the Bay Area, the less impact it will have on the Bay Area when it is pushed out;
The bottom stand refers to the stand in the main part of the terminal building. There are two main procedures for pushing out the bottom stand, as shown in
Figure 2 as ‘red push’ and ‘blue push’. Generally, the method with the shortest taxiway after pushing out is selected, and the choice will also be based on the activities of the stands on both sides;
A corner stand is a stand between a bottom stand and a pier stand. When pushing out an aircraft from a corner stand, it will have a huge impact on other stands in the Bay Area. The pushback procedures for a corner stand are similar to those for pier stands.
2.3. Classification of Flight Types and Their Operational Characteristics in the Bay Area
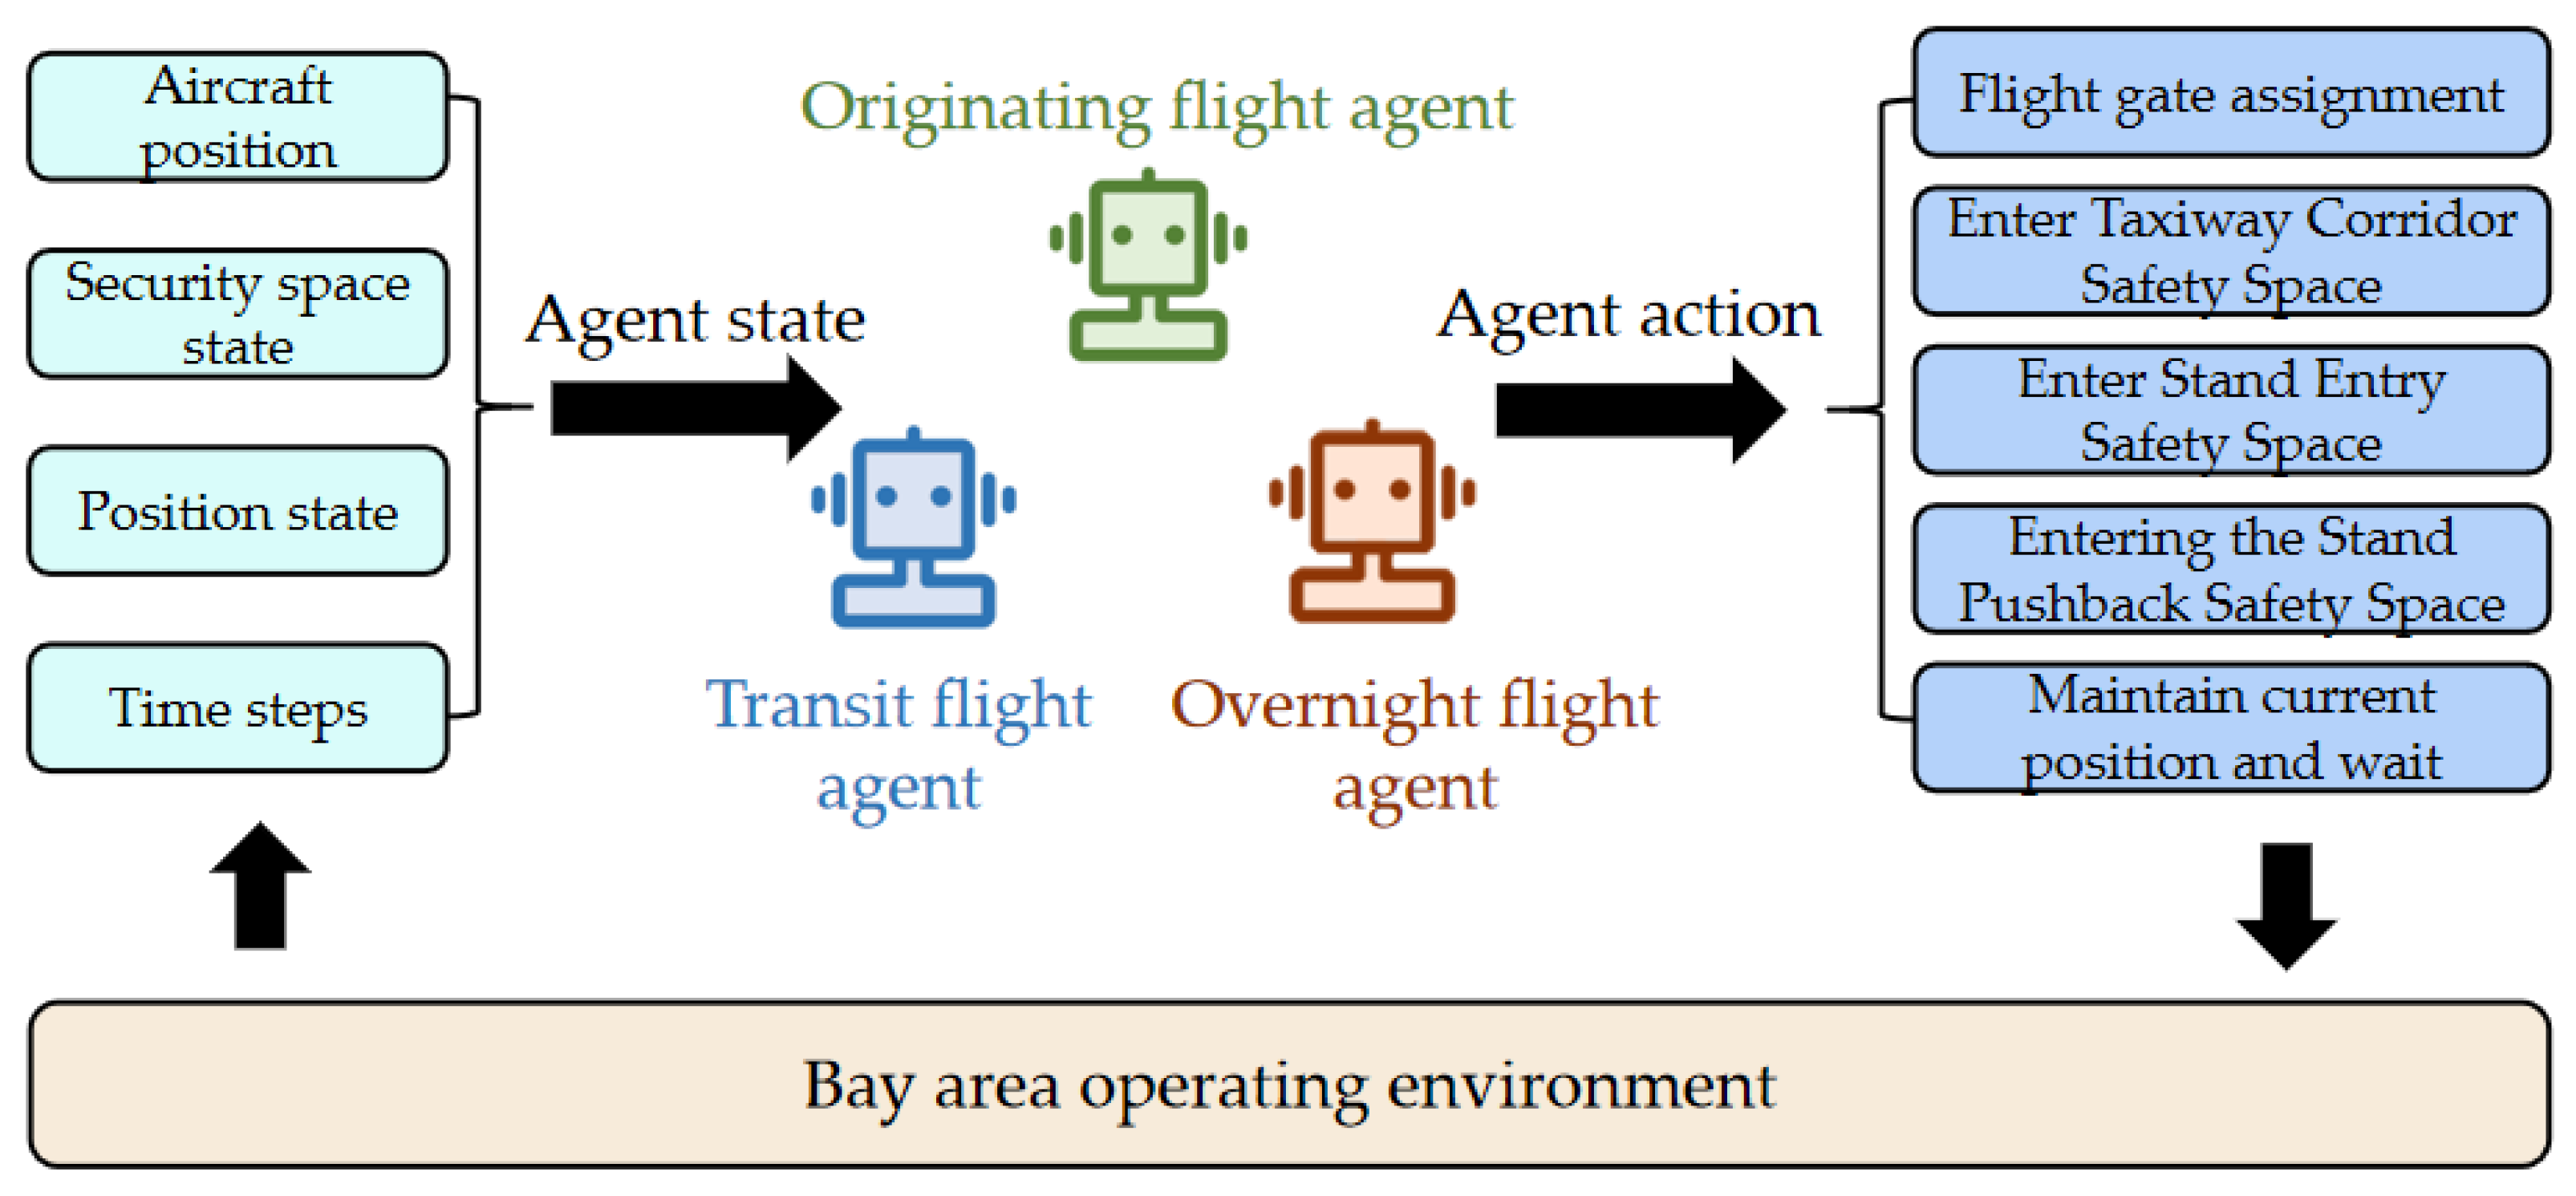
Flights are categorized into originating flights, transit flights, and overnight flights based on their operational tasks. While definitions may vary across airports, their operational procedures within the Bay Area remain consistent. This document adopts 00:00–24:00 as the standard time reference for flight classification, defined as follows.
Originating flights
Overnight flights
Transit flights
Excluding originating and overnight flights, all other flights are categorized as transit flights, which include both arrival and departure operations.
Their Bay Area procedures typically consist of the slip-in, entry, pushback, and taxi-out processes.
Transit flights are further classified into the following:
Short-transit flights—Flights with a transit time of less than 4 h.
Long-transit flights—Flights with a transit time of more than 4 h.
Due to longer layovers, arrival aircraft may be towed to a remote stand. Before departure, they may be relocated to a stand in the Bay Area or pushed back directly from the remote stand. The analysis of the operation procedures for various types of flights in the Bay Area is shown in
Figure 3.
2.4. Flight Conflict Analysis for the Bay Area
In the current operation mode of aircraft within the terminal Bay Area of airports, the typical strategy is a “single aircraft pushback one by one” approach. In practical airport operations, only one aircraft is allowed to operate within the Bay Area at any given time, ensuring that there is no conflict between aircraft. However, flight delays often result from potential conflicts caused by the inability to meet the demand for the simultaneous operation of multiple aircraft within the same time period. To enable simultaneous aircraft operations, this section analyzes the causes of flight conflicts. Based on the operational processes, flight conflicts can be mainly categorized into two main types—one is path conflicts during flight operations; the other is safety conflicts caused by wake turbulence and safety distance requirements.
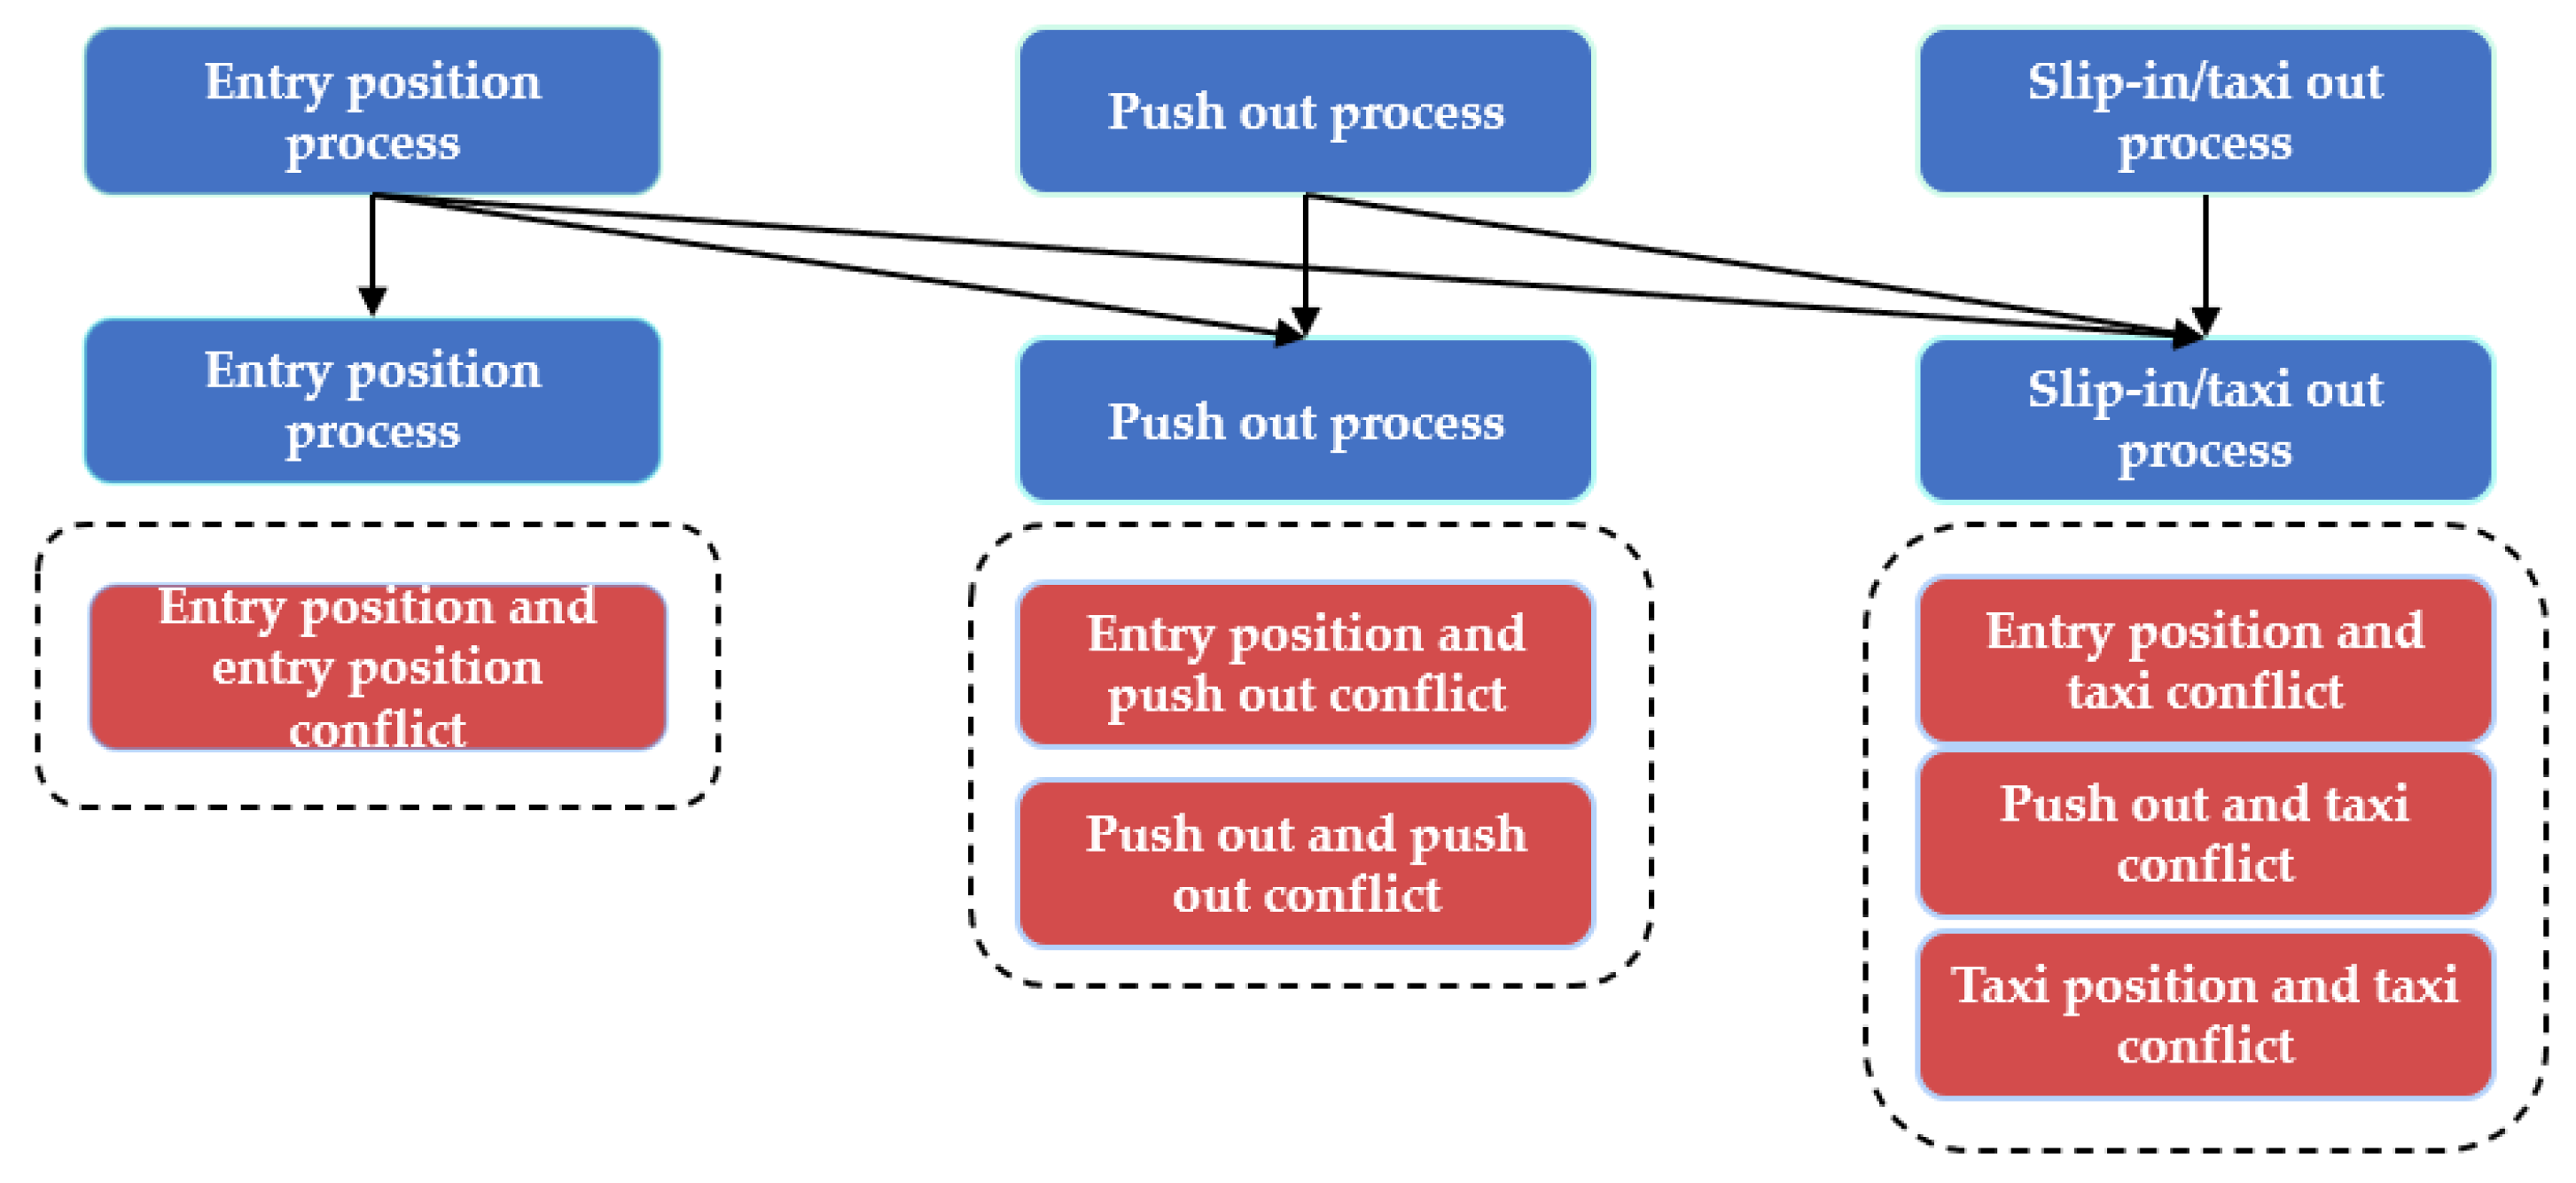
Path conflicts are categorized based on the minimum safe distance between aircraft on the apron and the trajectory changes associated with different operational processes.
The entry process involves a path transition from the taxiway to the stand. The pushback process involves a path transition from the stand to the taxiway. The slip-in and taxi-out processes do not involve any path changes, as both occur entirely on the taxiway. Since both the slip-in and taxi-out processes take place on the taxiway, they are considered within the same category. In total, six types of path conflicts occur between flights, as illustrated in
Figure 4.
- 2.
Safety conflicts caused by wake turbulence and minimum safety distance
The impact range of wake turbulence under idle engine thrust varies depending on aircraft type and wind speed conditions. For ease of calculation, the wake turbulence impact area is approximated as a rectangle, with the width equal to the aircraft’s wingspan and the length corresponding to the wake turbulence effect distance under upwind conditions.
2.5. Multi-Stand Grouped Operations Based on Safety Domain
“Flight formation” refers to grouping multiple flights within the Bay Area that meet the safe operating conditions in the stand and taxiway within the same defined period of time to achieve the simultaneous operation of multiple aircraft within the group; “stand formation” refers to grouping stands in the Bay Area that do not affect each other’s operations into a group, so that aircraft in the same group can operate at the same time to improve the operational efficiency of the Bay Area. However, both are limited by the gate assignment of flights in the Bay Area and the safe operation of aircraft. Therefore, this paper proposes safety thresholds for each operation process based on the path conflicts and safety spacing conflicts generated between the aircraft’s various operating processes in the Bay Area, and proposes a Multi-Stand Grouped Operations method based on safety thresholds.
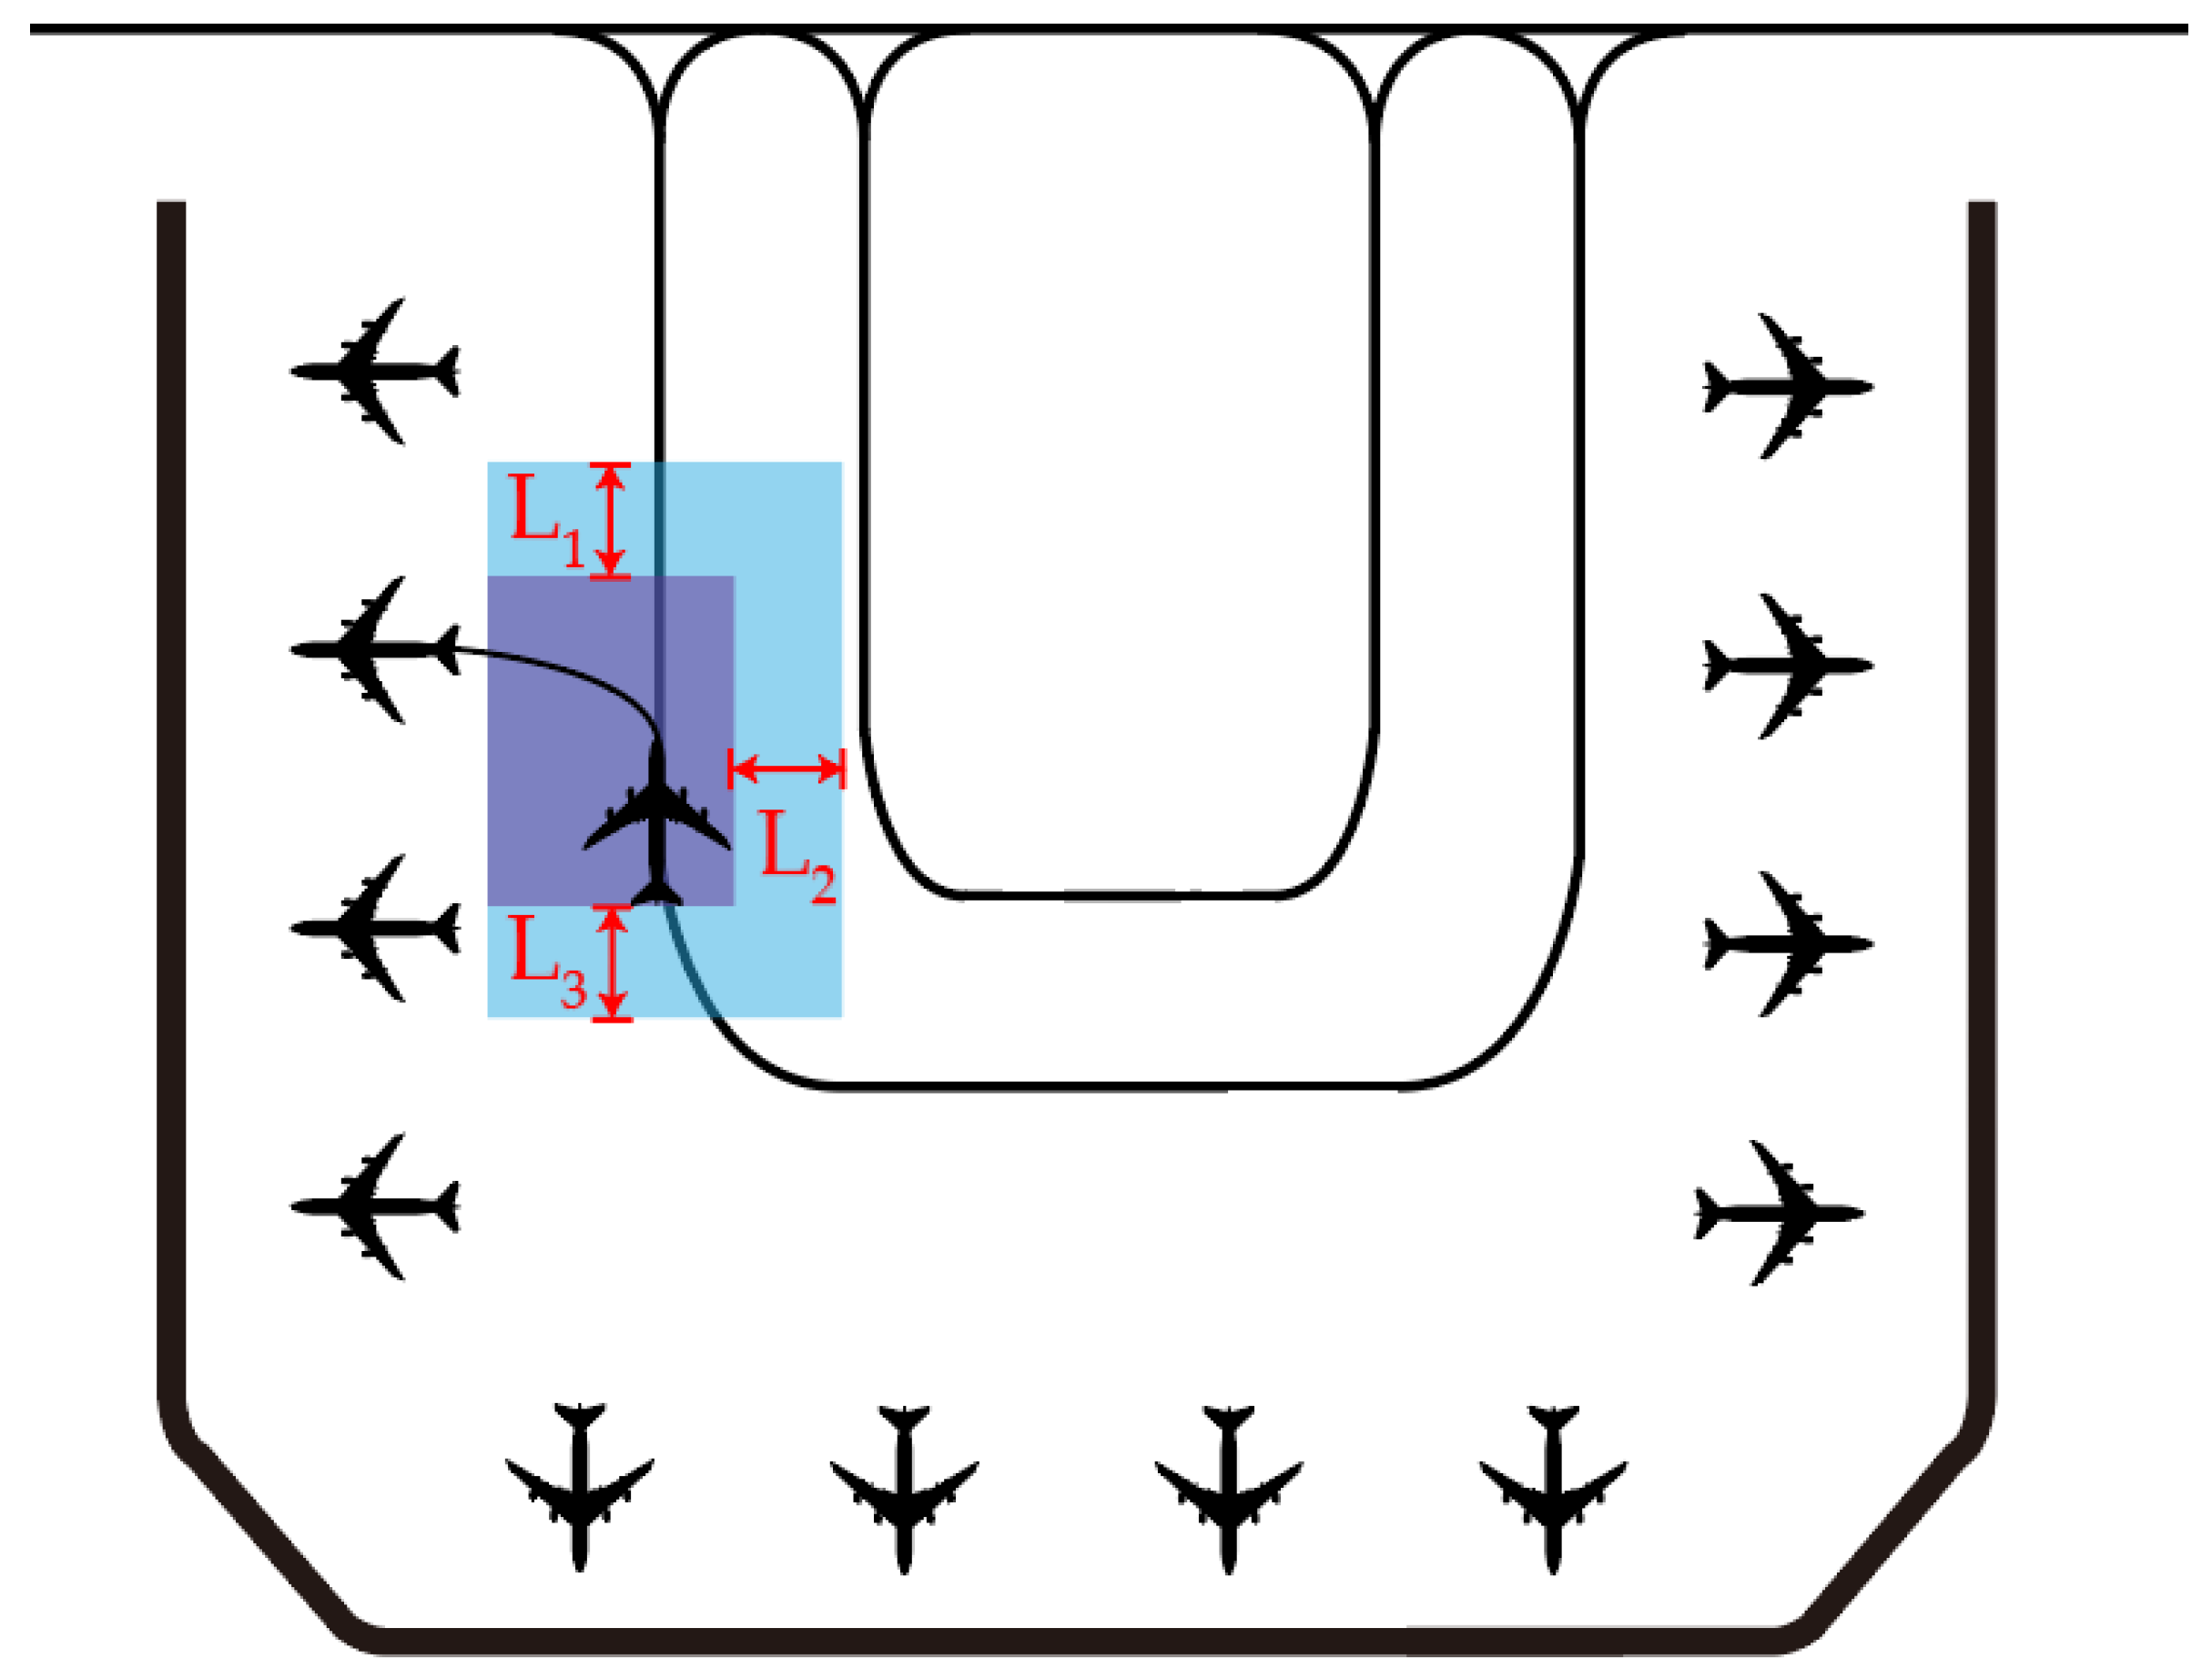
In the entire aircraft operation process, the entry stand is the process from the entry spot to the stand, and the path changes from the taxiway to the stand. According to the envelope generated by considering the safety spacing and the wake impact range during aircraft operation, the safety domain of the entry stand is constructed. Due to the influence of the wake, the safety zone is relatively large, which will cause conflicts with other safety domains and make it difficult for aircraft to operate at the same time. The pushback process is the process from the stand to the pushback spot. The path changes from the stand to the taxiway. The safety domain of the pushback process is constructed based on the envelope line generated by considering the safe distance during aircraft operation. In the pushback process, the aircraft is pushed out by the trailer, there is no influence of the wake blast, and the pushback processes at different stands can be run simultaneously; the slip-in process and taxi out process are the processes that occur from the arrival spot to the entry spot and from the pushback spot to the departure spot, respectively, and the path does not change between them. Considering the wake blast, the safety threshold during taxiway operation is constructed by referring to the principle of automatic railway blocking, as shown in
Figure 5.
Due to the conflict between the safety thresholds of each operation process in static space, when initially grouping stands, there are many possibilities for the number of groups and the number of stands in a group. Through aircraft parking reallocation and dynamic operation, an optimal Multi-Stand Grouped Operation strategy for the Bay Area is obtained, which enables multiple flights in the Bay Area to operate simultaneously with different operation processes, so as to improve the operation efficiency of the Bay Area.
In the actual stand allocation process, taking Guangzhou Baiyun Airport as an example, the airport AOC (Airport Operations Control Center) duty officers initially perform the pre-allocation of stands for all flights at around 7 p.m. on the night before operation. During the actual operation on the following day, the duty officers conduct secondary allocation based on the real-time operation status of flights. The proposed multi-stand grouped operation method is applied after the pre-allocation of flights. It focuses on the reallocation of flights assigned within the bay area and proposes a Multi-Stand Grouped Operation strategy to provide decision-making support for the secondary allocation conducted by the duty officers.
It should be noted that this study has not incorporated the impact of human scheduling behaviors on conflict avoidance into the modeling analysis. Therefore, it is assumed that the dispatcher performs the secondary stand allocation strictly following the proposed Multi-Stand Grouped Operations method, in order to explore and evaluate the effectiveness of this method in improving the operational efficiency of the Bay Area.
3. Construction of an Optimization Model for the Operation of the Terminal Bay Area
This chapter builds upon the previously proposed Multi-Stand Grouped operation method and constructs the corresponding safety operational spaces, including the Taxiway Corridor Safety Space, Stand Entry Safety Space, and Stand Pushback Safety Space. Based on the complete operational procedures of originating flights, overnight flights, and transit flights within the Bay Area, these processes are represented through their respective safety spaces. Task modeling is then performed, and a Bay Area operational optimization model is developed by integrating stand allocation with the occupancy time of each safety space.
3.1. Basic Model Assumptions
The following basic assumptions are made for the model:
Since this study focuses on the optimization of aircraft operations within the Bay Area, it is assumed that the arrival and departure times of flights are known. Congestion on taxiways between the Bay Area exit and the runway is not considered, nor are delays of flights outside the Bay Area. The availability of stands within the Bay Area is fixed, with no consideration of stand failures or the activation of combined stands. Towing operations within the Bay Area are also excluded;
To ensure the general applicability and accuracy of the model, it is assumed that the stand occupancy time (including guaranteed parking times) is fixed, with specific durations determined based on the operational conditions of the airport. Additionally, the entry and pushback routes for each stand are fixed. Aircraft operate within the Bay Area along the designated Taxiway Corridor, Stand Entry Streamline, and Stand Pushback Streamline. Finally, flight priority within the Bay Area is not considered, and sequencing is based on the scheduled arrival and departure times.
3.2. Environmental Modelling and Construction of Safe Operating Spaces
The Bay Area environment is modeled based on its facilities, including stands, stand entry spots, pushback spots, the taxiway corridor, stand arrival spots, and stand departure spots. Based on these key points, the Bay Area is divided into different operational zones, including the stand zone, taxiway corridor zone, and Bay Area entrance and exit zone.
Based on the entire process of flights operating in the Bay Area and the types of flight conflicts, the space for the safe operation of flights in different operating processes is constructed, including the Taxiway Corridor Safety Space (TCSS), Stand Entry Safety Space (SESS) and Stand Pushback Safety Space (SESS).
Assuming that the distance between adjacent taxiways in the Bay Area is , the length of the largest aircraft type is , the wingspan is , the minimum safe distance is , and the length of the wake impact range is . Among these, compared to , the is longer, and when considering both the minimum safe distance and the wake impact range in the same direction at the same time, the minimum safe distance can be ignored. is the m-th stand in the Bay Area (m = 1, 2, …, M); is the n-th Taxiway Corridor Safety Space (n = 1,2, … N); is the Stand Pushback Safety Space corresponding to ; is the Stand Entry Safety Space corresponding to .
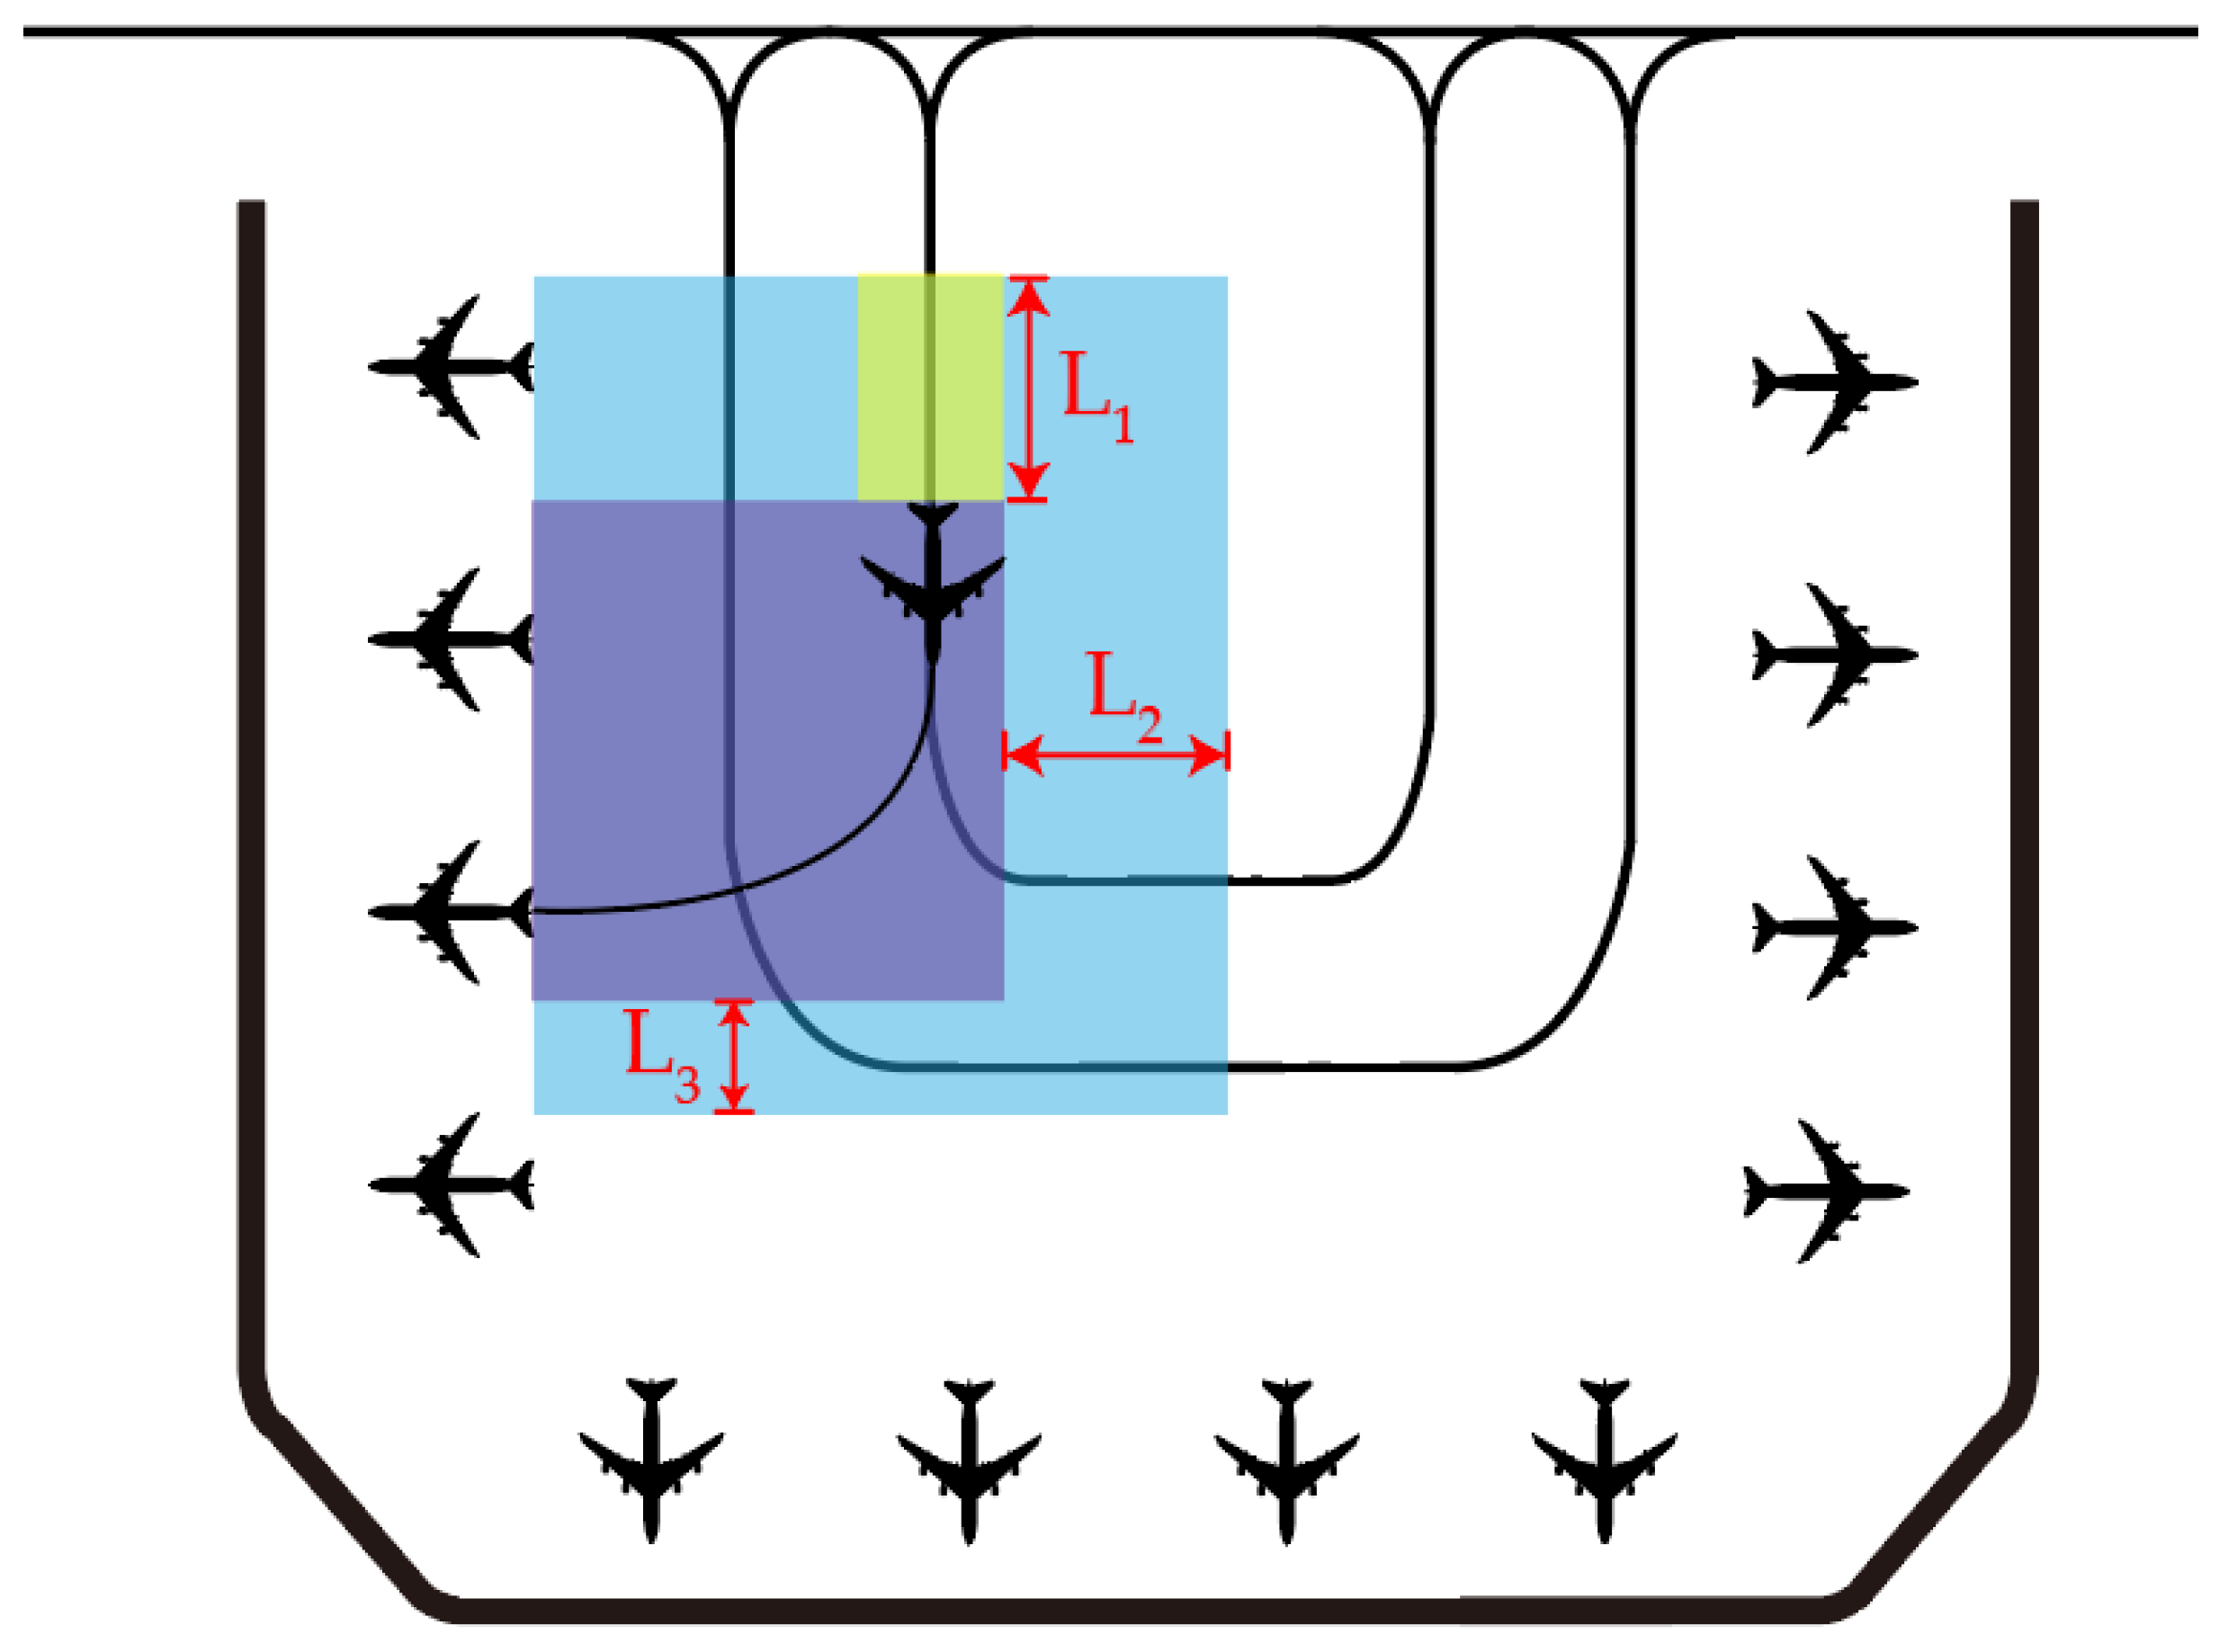
3.2.1. Taxiway Corridor Safety Space
The taxiway corridor is divided into multiple continuous Taxiway Corridor Safety Spaces
based on conflicts arising from the slip-in and taxi-out processes, as well as the pushback and entry processes, as presents in
Figure 6 for details.
To ensure that an aircraft operating at any position within the n-th (where n > 2) Taxiway Corridor Safety Space does not affect the operation of another aircraft at any position within the (n − 2)-th Taxiway Corridor Safety Space, the spatial separation must prevent wake vortex interference. Based on the direction of aircraft movement along the taxiway, it is necessary that when an aircraft has just entered the n-th Taxiway Corridor Safety Space, the wake turbulence influence range does not extend to the end of the (n − 2)-th Taxiway Corridor Safety Space.
Therefore, the required length of the Taxiway Corridor Safety Space is calculated as .
When the distance L between taxiway corridor T1 and taxiway corridor T2 is greater than or equal to the sum of and , the Bay Area allows aircraft on taxiway corridor T1 and taxiway corridor T2 to operate simultaneously. The condition for an aircraft to enter Taxiway Corridor Safety Space is that there are no aircraft in Taxiway Corridor Safety Space . When the distance L between T1 and T2 is less than the sum of and , the condition for entering is that there are no aircraft in and .
3.2.2. Stand Entry Safety Space
When the stand for an incoming aircraft is confirmed to be
, the area formed by the path taken by the aircraft in the entry stand from the entry spot
to the stand, taking into account the impact of its wake and the safety distance, forms the safe area for the aircraft to slip into the stand. The area affected by the wake of the aircraft when it slips in from
to
is a sector formed by the aircraft’s path. However, this sector will not affect the area that the aircraft cannot reach during operation. For the sake of calculation, a rectangle is formed based on the sector, from the taxiway to the stand, to form the Stand Entry Safety Space
. See
Figure 7 for details.
Let and denote the maximum lateral and longitudinal distances, respectively, that are affected by wake turbulence during stand entry, and let represent the required safety clearance for the aircraft’s wings during stand entry. It is assumed that ,
The operational rules are as follows. For an aircraft that needs to complete stand entry, only one aircraft may operate within the same Stand Entry Safety Space at any given time. If the Stand Entry Safety Space of a given stand overlaps with the Safety Operational Space of another aircraft currently in operation, the aircraft must wait at the Entry Point or in the preceding Taxiway Corridor Safety Space.
3.2.3. Stand Pushback Safety Space
During the pushback process, an aircraft leaving the airport in stand
needs to be towed from the stand to pushback spot
by a tow truck. The area formed by the path from
to
is the safety domain for pushing out from this stand. Only the minimum safe distance of the aircraft is considered at this time, and the influence range of the wake vortex is not considered. The area formed by the path from
to
is the fan-shaped area formed by the aircraft sweeping past, but the area affected by the fan shape is an area that cannot be reached during aircraft operation. For convenience of calculation, a rectangle is formed based on the fan shape, from the taxiway to the stand, to finally form the Stand Pushback Safety Space
, as shown in
Figure 8.
, , and represent the safety distances required for the aircraft’s wings or fuselage in the lateral and longitudinal directions during pushback.
Figure: .
The operational rules are as follows. For an aircraft that needs to complete pushback, only one aircraft is allowed to operate within the same Pushback Safety Space at any given time; if the Pushback Safety Space overlaps with the Safety Operational Space of another aircraft currently in operation, the aircraft must wait at the stand.
3.3. Task Modelling
To capture the operational status of all flights within the Bay Area over a given time period, a task modeling approach is employed. First, based on the chronological order of flight arrivals and departures, the i-th arriving flight and the j-th departing flight are defined. Here is the i-th arrival task performed by the aircraft (i = 1, 2, …, I); is the j-th departure task performed by the aircraft (j = 1, 2, …, J);
Next, by matching aircraft identifiers, a correspondence is established among originating flights, transit flights, overnight flights, arriving flights, and departing flights. An originating flight corresponds to one departing flight; a transit flight corresponds to one arriving flight and one departing flight; and an overnight flight corresponds to one arriving flight. These are then divided into arrival tasks and departure tasks, where an originating flight completes a departure task, a transit flight completes an arrival task, and an overnight flight completes an arrival task.
Arrival task. When an aircraft performs an arrival task, it first undergoes gate assignment. The aircraft moves from its stand to arrival spot , arrives at entry spot , and completes stand entry. At this point, the aircraft must complete its operations within the corresponding Taxiway Corridor Safety Space and Stand Entry Safety Space, thereby fulfilling its arrival task.
Departure task. When an aircraft performs an arrival task, it needs to be pushed out from its stand to parking pushback spot , taxi through the taxiway to departure spot , and then leave the Bay Area. At this point, the aircraft must complete its operation within the corresponding Pushback Safety Space and Taxiway Corridor Safety Space, thereby fulfilling its departure task.
3.4. Decision Variables
To represent the assigned stand for arriving flights, the stand location for departing flights, and the safety operation spaces traversed by each flight, the following decision variables are defined:
, the decision variable corresponding to whether arrival flight is operating at . If it is operating at , the value is 1; otherwise, the value is 0.
, the decision variable corresponding to whether arrival flight operates at . If it operates at , the value is 1; otherwise, the value is 0.
, the decision variable corresponding to whether arrival flight is assigned to stand . If it is assigned to stand , the value is 1; otherwise, the value is 0.
, the decision variable corresponding to whether departure flight operates at . If it operates at , the value is 1; otherwise, the value is 0.
, the decision variable corresponding to whether departure flight operates at . If it operates at , the value is 1; otherwise, the value is 0.
, whether the guaranteed stand of the departure flight is the decision variable corresponding to , and if the guaranteed position is , it is 1, otherwise it is 0.
, the decision variable corresponding to whether is occupied at time t. If it is occupied or assigned a gate assignment, the value is 1; otherwise, the value is 0. is the time step t (t = 1, 2, …, T) for the aircraft to operate in the Bay Area, and by time step T, all flight tasks are completed (the same notation applies hereinafter).
, the decision variable corresponding to whether is occupied at time t. If it is occupied, the value is 1; otherwise it is 0.
, the decision variable corresponding to whether is occupied at time t. If it is occupied, the value is 1; otherwise, it is 0.
, the decision variable corresponding to whether is occupied at time t. If it is occupied, the value is 1; otherwise, it is 0.
3.5. Objective Function
The optimization of operations in the Bay Area mainly involves two aspects. From the perspective of aircraft operations, except for the fixed flight guarantee time, the shorter the total operating time of all aircraft in the Bay Area, the shorter the waiting time for aircraft, and the better the optimization effect. From the perspective of flight operations, the shorter the total delay time of all flights in the Bay Area, the better the optimization effect. Therefore, the objective function is proposed.
Objective Function (1) minimizes the total operating time of all flights in the Bay Area. The total operating time is defined as the sum of the taxiway running time and the stand entry time for arriving flights, plus the sum of the pushback time from the stand and the taxiway running time for departing flights, minus the simultaneous operation time of aircraft in the Bay Area (i.e., the time during which multiple safety spaces are occupied concurrently). To prevent the minimization of operating time from leading to increased flight delays, objective Function (2) is introduced to minimize the delay time of all departing flights, where the delay time is defined as the difference between the actual departure time corresponding to the departure task and the scheduled departure time.
Here, is the planned departure time corresponding to the aircraft performing departure task ; is the actual departure time corresponding to the aircraft performing departure task ; is the operating time of the arrival flight assigned to stand from the stand arrival spot to the entry spot; is the operating time of the departure flight from the pushback spot to the departure point; is the time required for the aircraft to complete its operation within the safety space allocated to stand ; is the time required for the aircraft to complete its operation within the Stand Pushback Safety Space allocated to stand ; is the simultaneous operation time of aircraft in the Bay Area (the time when multiple safety spaces are occupied simultaneously).
3.6. Constraints
3.6.1. Constraints on Stands
Only one aircraft can be parked at a stand at the same time. Therefore, at any time step t, the following constraint must be satisfied:
Each arrival flight must be assigned a stand. Therefore, the following constraint must be satisfied:
3.6.2. Constraints on Taxiway Corridor Safety Space
Only one aircraft can be operated in each Taxiway Corridor Safety Space at the same time. Therefore, at any time step t, the following constraint must be satisfied:
3.6.3. Constraints on Stand Pushback Safety Space
Only one aircraft can operate in each Stand Pushback Safety Space at the same time, so the constraint needs to be satisfied at any time step t,
3.6.4. Constraints on Stand Entry Safety Space
Only one aircraft can operate in each Stand Entry Safety Space at the same time, so the constraint needs to be satisfied at any time step
t,
3.6.5. Safety Space Conflict Constraint
When an aircraft is ready to enter the Taxiway Corridor Safety Space, it must satisfy the constraint that there is no aircraft in the safety space for the next Taxiway Corridor Safety Space. The constraint that needs to be satisfied is
When there is a spatial conflict between any two safety spaces within any set in
, including conflicts in static space between the Stand Entry Safety Space and Stand Pushback Safety Space of the same stand, as well as conflicts in static space between the Stand Entry Safety Space and Stand Pushback Safety Space of adjacent stands, the following constraint must be satisfied:
The Stand Entry Safety Space of stand
has a static spatial conflict with the adjacent Taxiway Corridor Safety Space, and its Stand Pushback Safety Space also has a static spatial conflict with the adjacent Taxiway Corridor Safety Space. These spaces respectively form
and
, and the following constraint must be satisfied:
5. Instance Validation
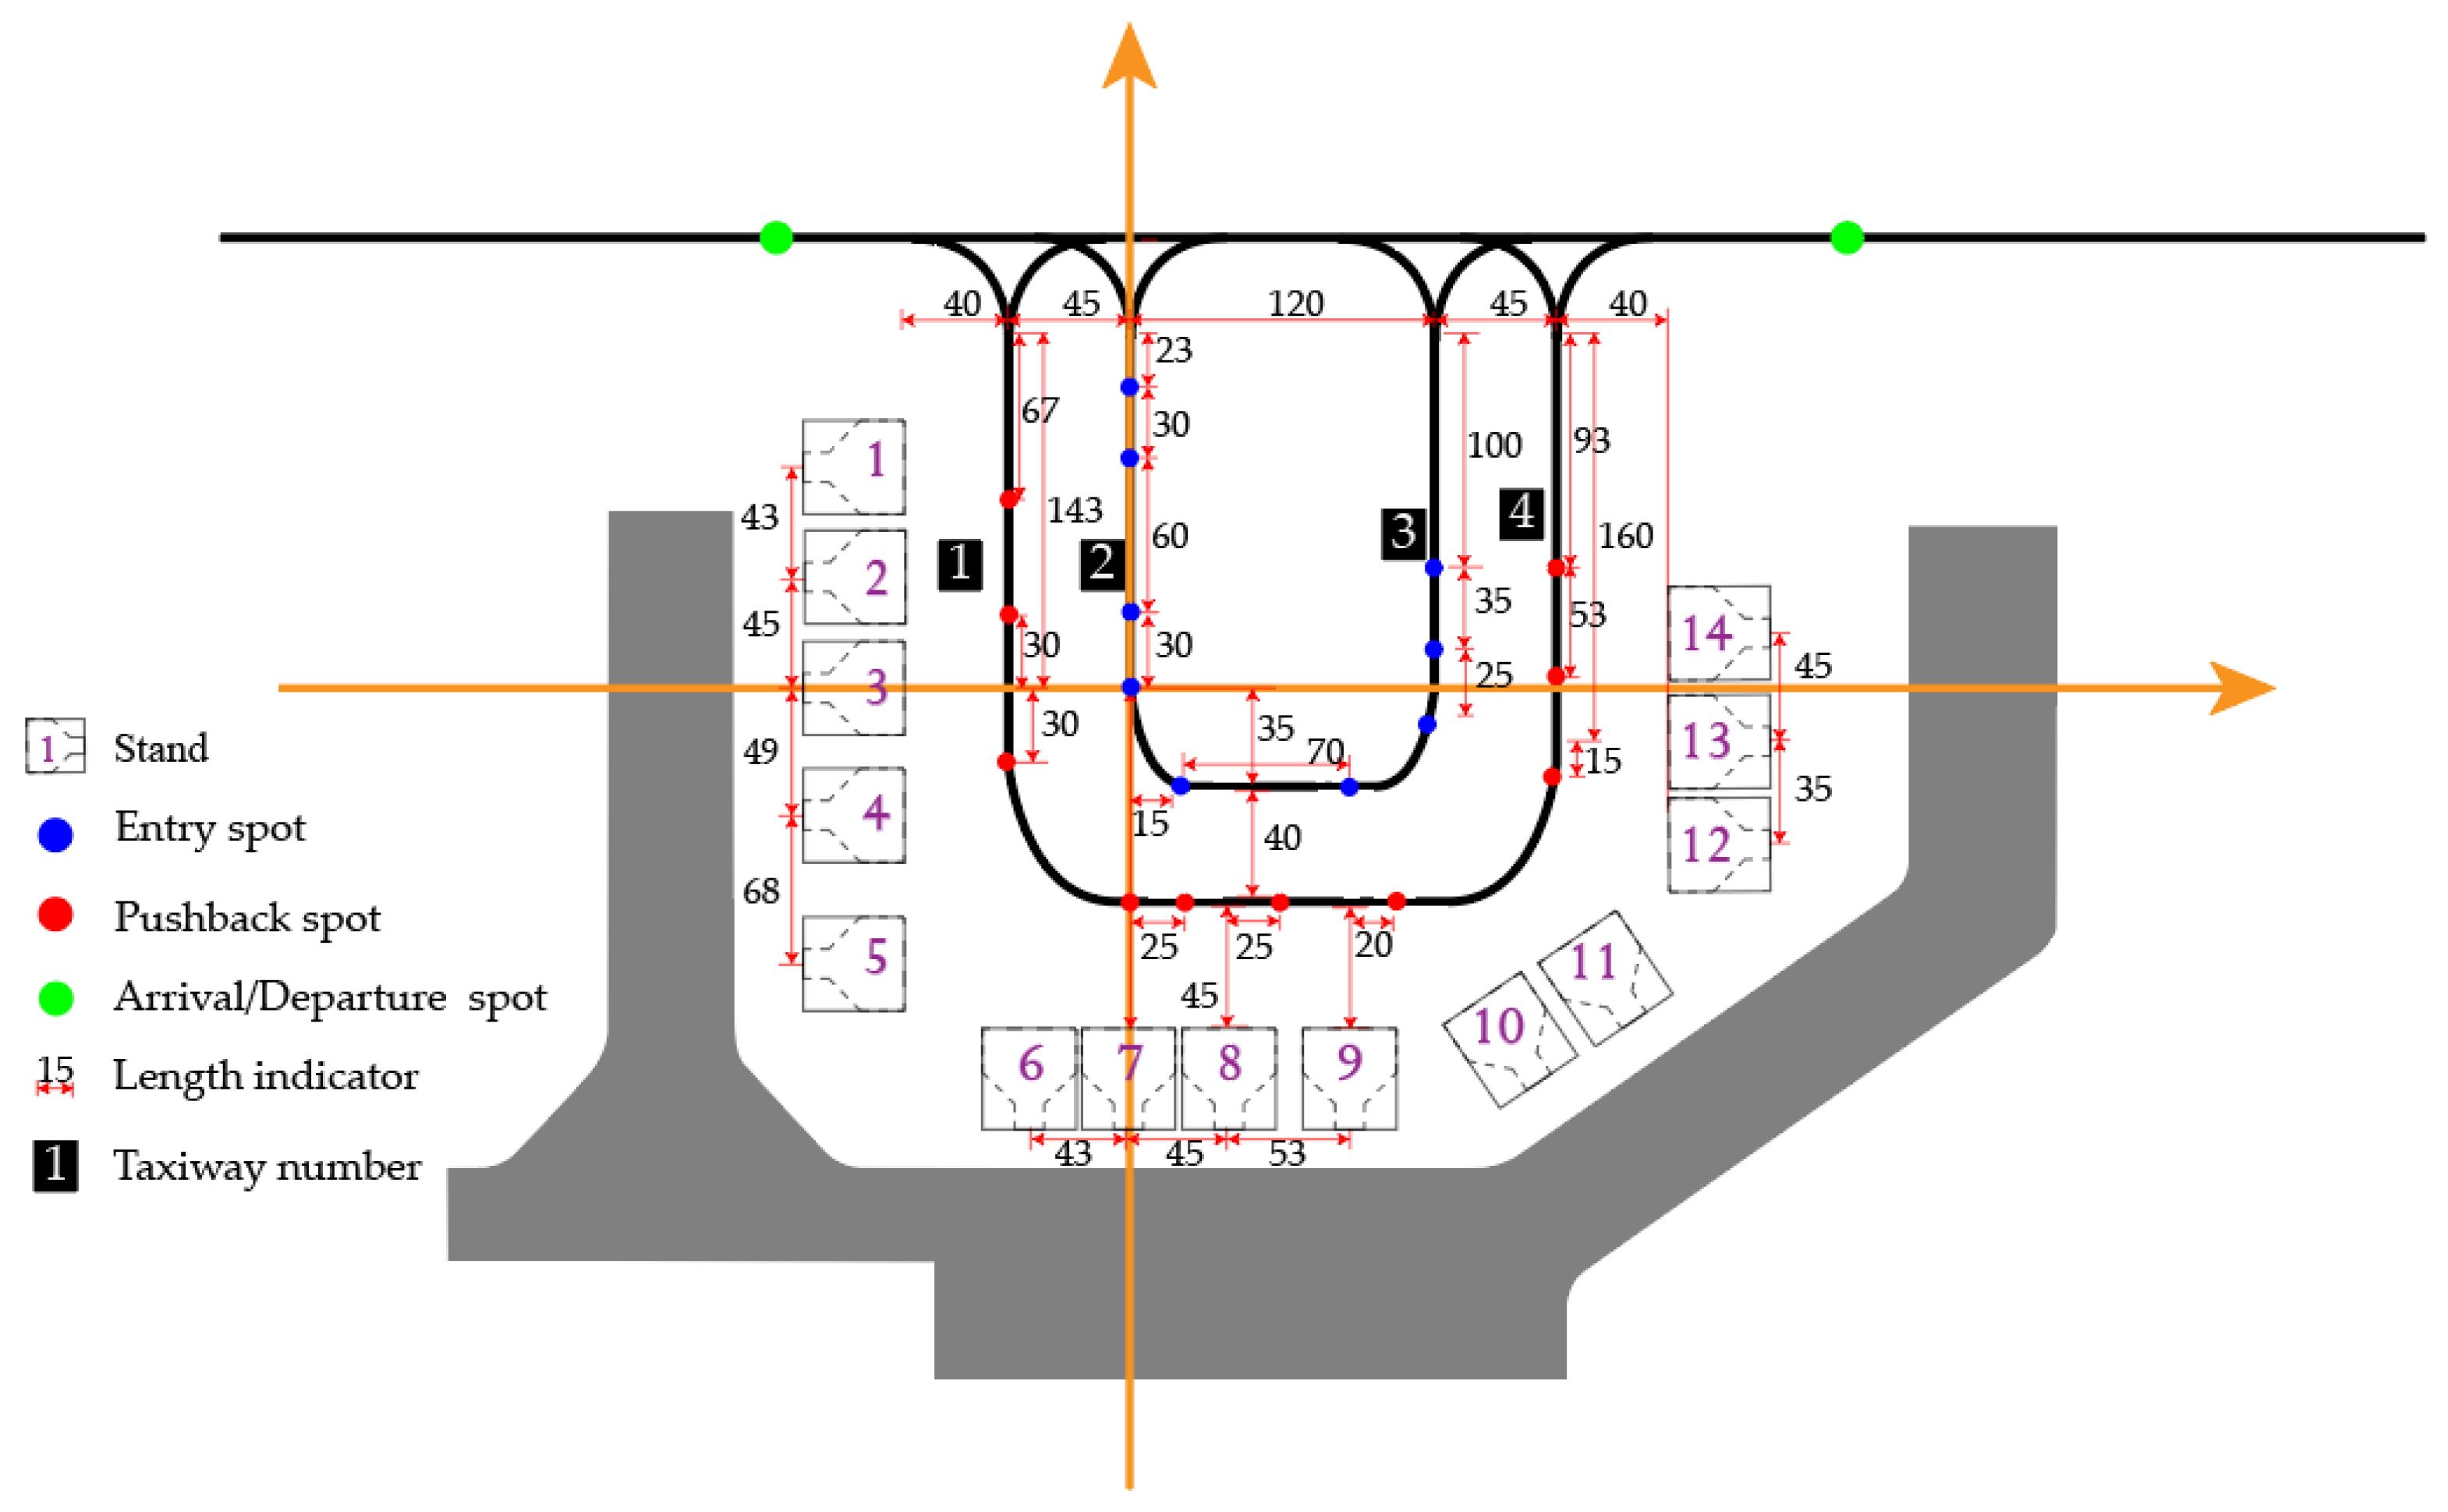
The Northwest Bay Area of T2 of Guangzhou Baiyun Airport is selected as the research object to verify the validity of the constructed formation model. The Bay Area consists of 14 class C machine stands, numbered 256–269, and the taxiway type is double U-channel, with four taxiways, following the operation mode of ‘in the middle and out on both sides’. The numbering of the stands has been set as 1–14.
A coordinate system was established with the stand entry spot of GATE 04 as the origin and the direction of Taxiway 2 as the
Y-axis. Based on the actual spatial layout of the airport Bay Area, the coordinates of each stand and taxiway were determined according to the distances between stands and the distances between taxiways. All stands for category C aircraft were assumed to have the same rectangular shape, and the coordinates of each stand are represented by its center point and the four corner points. The Baiyun Airport Bay Area layout model is shown in
Figure 11.
For calculation convenience, the stands on the same side, including concourse stands, bottom stands, and corner stands, were parallelized and normalized with respect to their distances from the terminal building. The specific coordinates of some stands are shown in
Table 1. The coordinates of key operational points, including arrival spots, departure spots, stand entry points, and pushback waiting points for certain stands, are shown in
Table 2.
Six taxiway safety spaces were constructed, some of which are shown in
Table 3; there are also 14 gate entry safety spaces, some of which are shown in
Table 4, and 14 gate pushback safety spaces, some of which are shown in
Table 5.
To optimize the allocation of flights operating in and out of the Bay Area on a selected day in 1 July 2023 (00:00–24:00), a total of 158 flights were considered after excluding one canceled flight. Filtering the flights based on aircraft registration numbers revealed that some aircraft operated 3–4 flights during this period. To streamline the analysis, these aircraft were renumbered accordingly. The final dataset included 71 transit flights, 10 originating flights, and six overnight flights. Specific details of some flights and aircraft are shown in
Table 6.
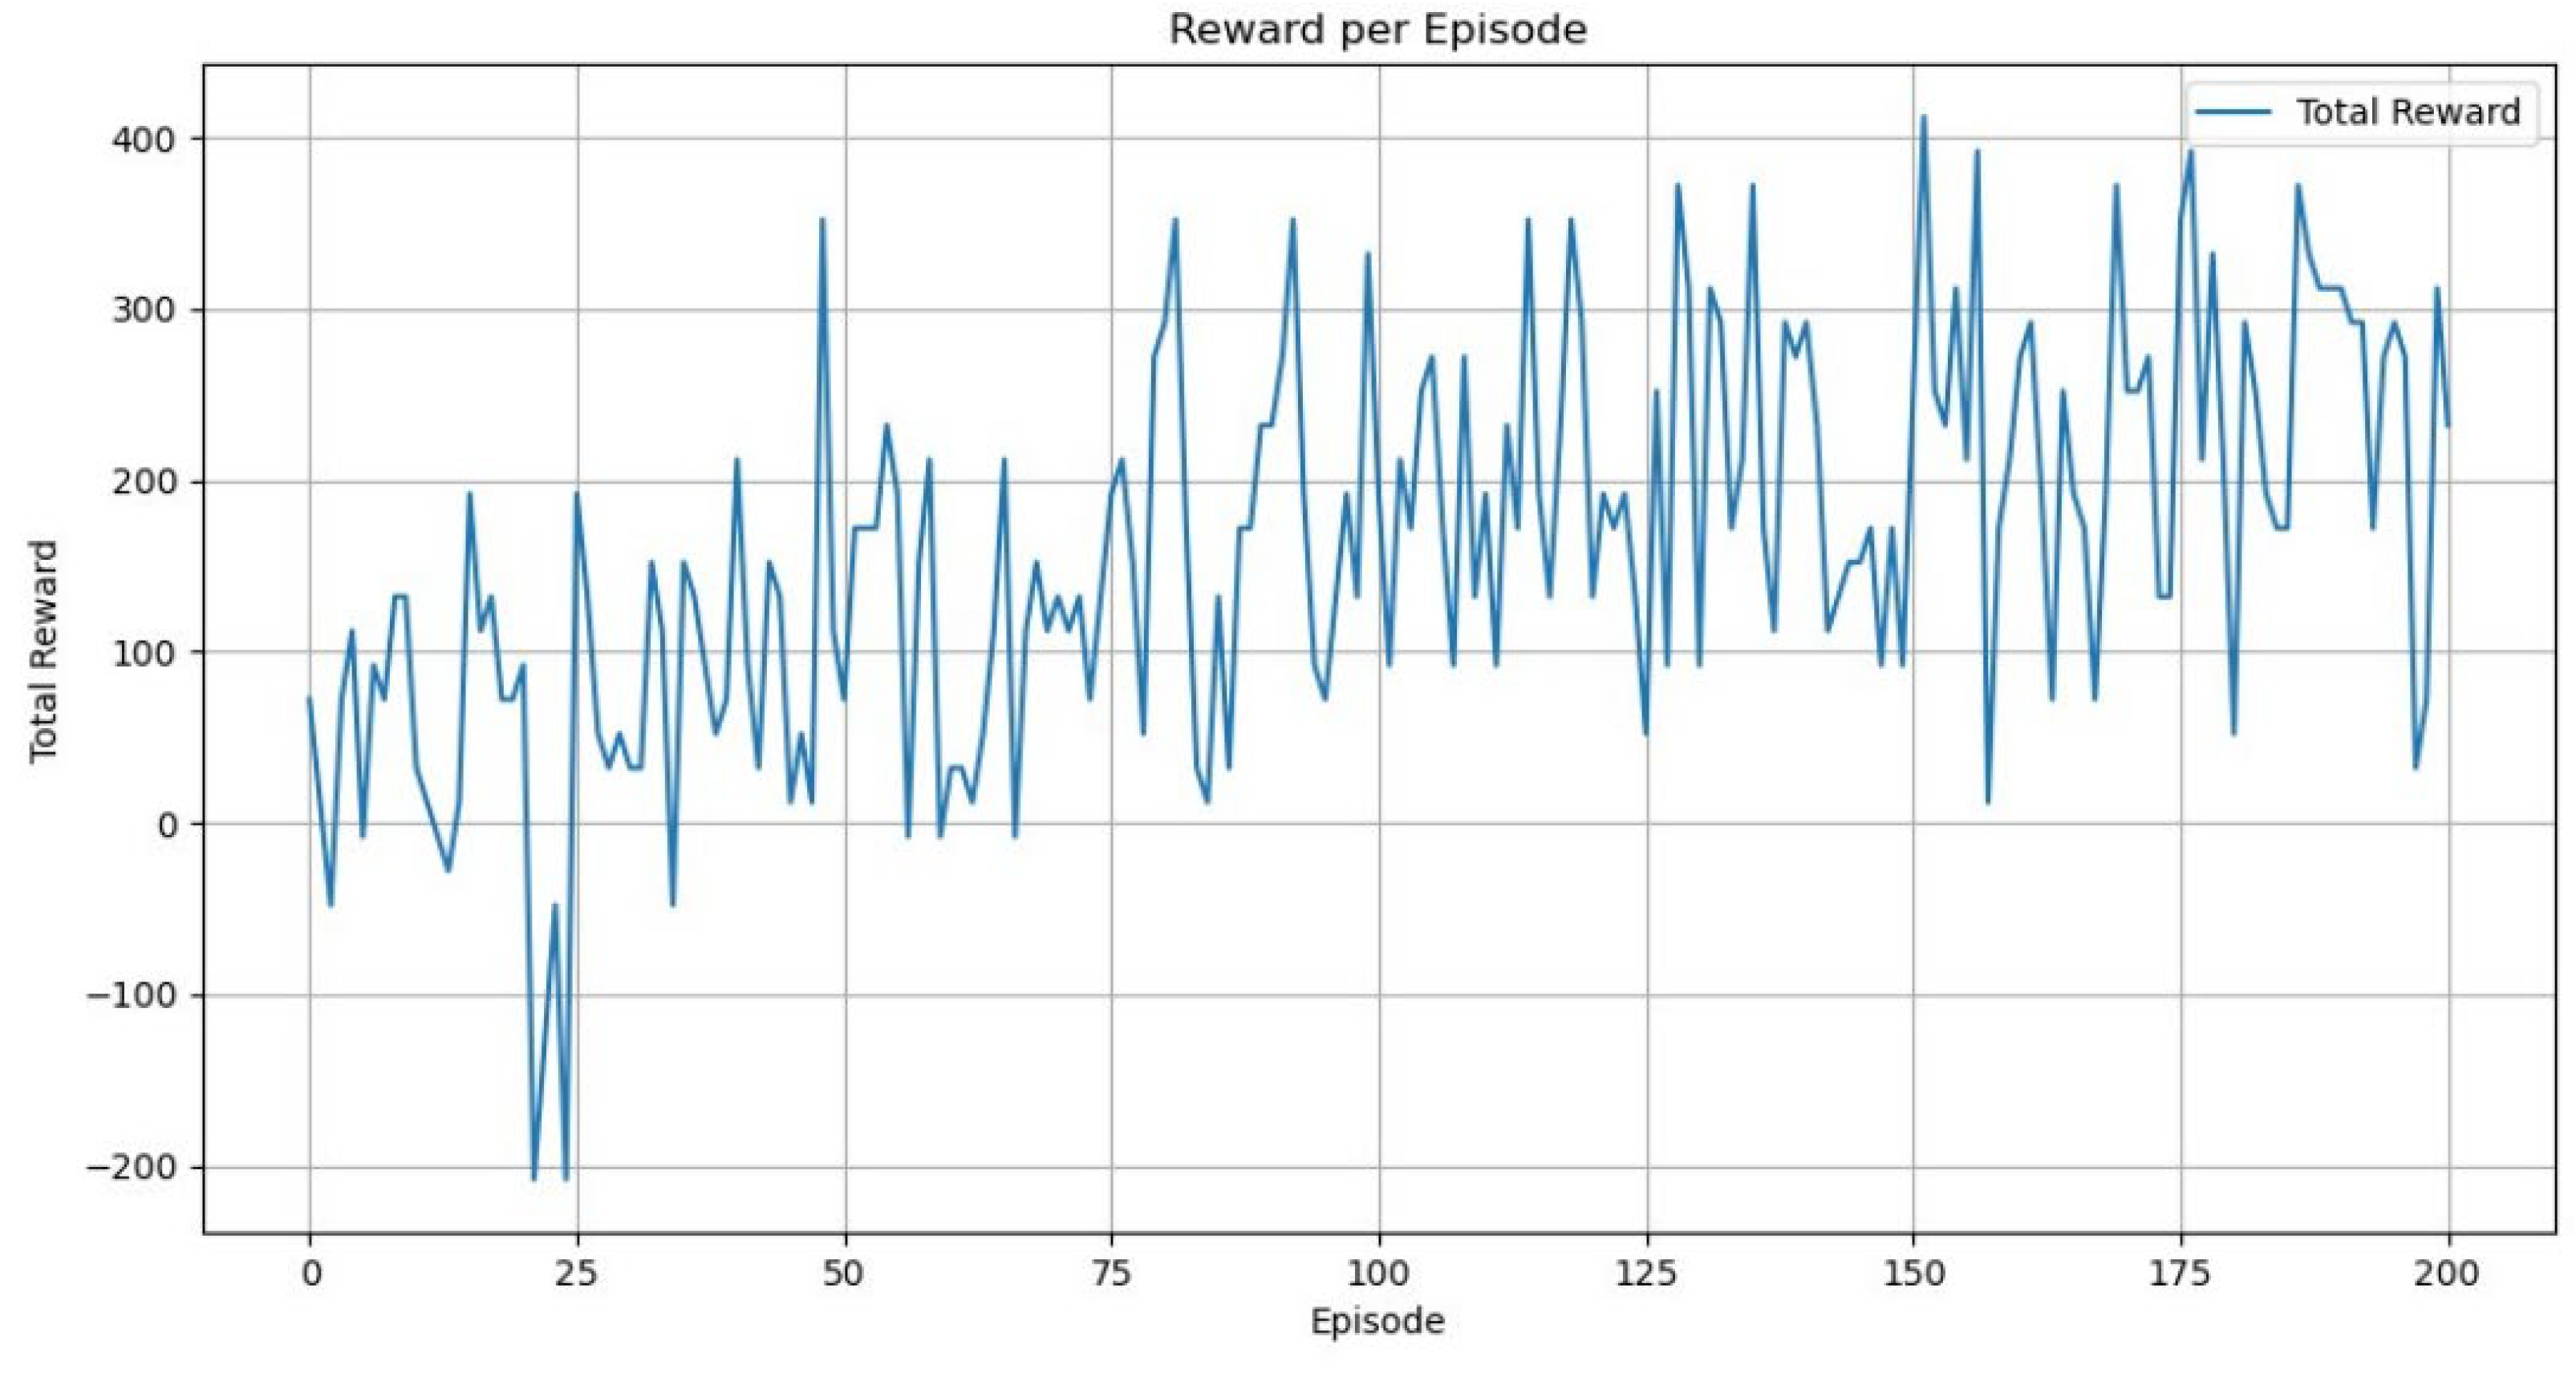
In the early training stage, a grid search was conducted within reasonable ranges to identify appropriate values. During subsequent training, fine-tuning was applied based on training stability, convergence curves, and the performance of the test results. The hyperparameter settings of the model are shown in
Table 7, and the reward curve after 200 training rounds is shown in
Figure 12. The model training in this study was conducted on a hardware platform equipped with an RTX 3080 GPU (10GB) and an Intel i9-12900K CPU. The RTX 3080 GPU was manufactured by ASUS, Shanghai, China, and the i9-12900K CPU was manufactured by Intel, Chengdu, China. Under 200 training episodes, the average total training time of the MAPPO model was approximately 42.5 min, with each episode taking about 0.51 s on average. The breakdown of computational resource consumption for different modules is shown in
Table 8. The final solution is obtained, and the experimental results are analyzed, which mainly include the following three aspects.
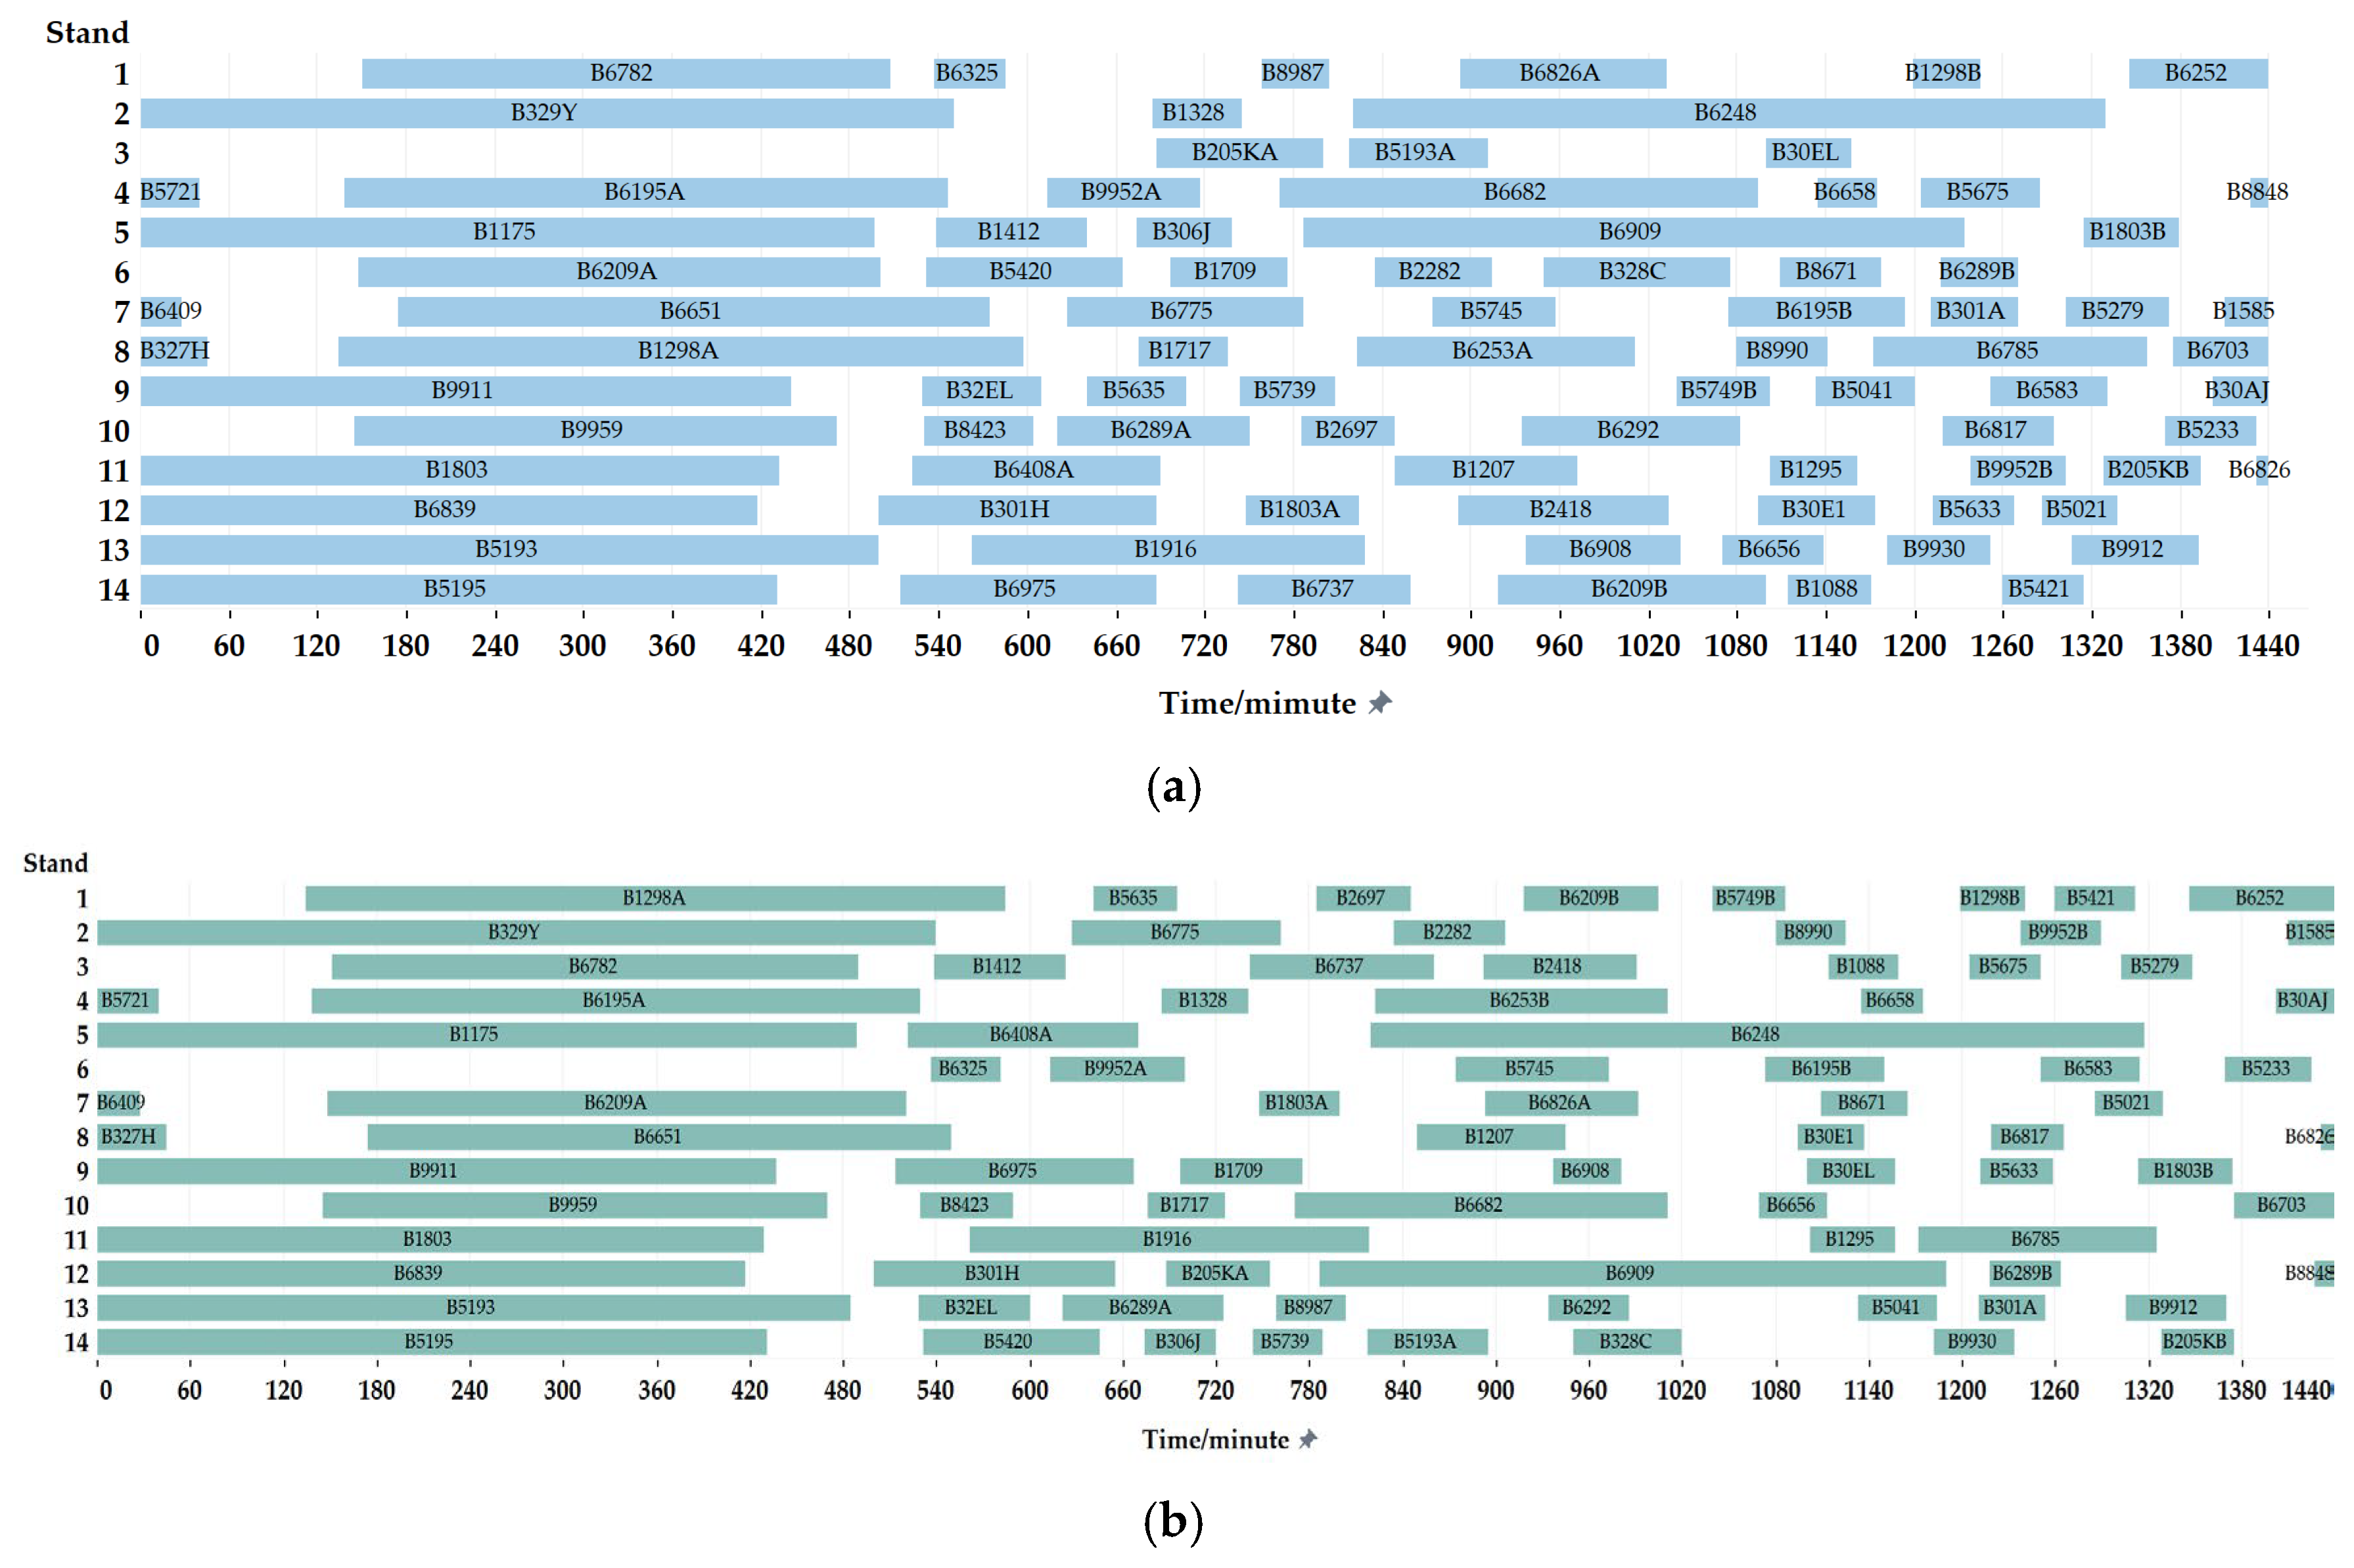
By solving the algorithm, the 158 flights allocated to the Bay Area are reasonably allocated to the stands in the Bay Area; the results of the stand allocation of the original scheme and the optimized stand allocation of the Multi-Stand Grouped Operations are shown in
Table 9, and the Gantt chart of the gate assignment is shown in
Figure 13.
Among them, the pier stands under the optimized allocation plan have a total of 89 flights allocated, with an average of 12.71 flights per stand; the terminal stands have 46 flights allocated, with an average of 11.5 flights per stand; the corner stands have 23 flights allocated, with an average of 7.67 flights per stand. Compared with the original allocation plan, the pier stands have 20 more flights allocated, the bottom gate assignment flights decreased by 8, and the corner gate assignment flights decreased by 12. The main reasons are as follows.
Under the optimized allocation plan, a total of 89 flights were assigned to pier stands, with an average of 12.71 flights per stand. Terminal stands were allocated 46 flights, with an average of 11.5 flights per stand, while corner stands were assigned 23 flights, averaging 7.67 flights per stand. Compared to the original allocation scheme, the number of flights assigned to pier stands increased by 20, while terminal stands saw a reduction by 8 flights, and corner stands experienced a decrease by 12 flights. The primary reasons for these changes are as follows.
Pier stands, located near the outer edge of the Bay Area, allow for slip-in and pushback operations with minimal impact on other stands. The closer a stand is to the outer edge, the shorter the slip-in and pushback times. Consequently, more short-transit flights were allocated to concourse stands in the optimized plan, leading to an increase in their assigned flights.
Corner stands, on the other hand, significantly affect nearby pier stands and terminal stands during aircraft entry and pushback operations. As a result, the optimized plan allocated more long-transit flights to corner stands, reducing their total number of assigned flights.
Although terminal stands have a relatively lower impact on surrounding stands during entry and pushback, their location at the base of the concourse results in longer slip-in and pushback distances. Therefore, the number of flights assigned to base stands was reduced in the optimized plan.
- 2.
Delay time
The delay time of each aircraft after the optimization of Multi-Stand Grouped Operation is obtained based on the time node of each aircraft completing its task during training, as shown in
Figure 14. To verify the effectiveness of the proposed optimization method, this study conducted a paired
t-test to statistically analyze the flight delay times before and after optimization. The results show that the average flight delay time under the original stand allocation scheme was 34.26 min with a variance of 772.53, while after implementing the “Multi-Stand Grouped Operations” optimization, it was reduced to 12.86 min with a variance of 436.63, representing a reduction of approximately 62.45%. The p-value of the paired
t-test was 1.69 × 10⁻¹³, indicating that the reduction in delay time is statistically significant. During the entire day, only one flight experienced an increase in delay time, while the delay times of all other flights were reduced.
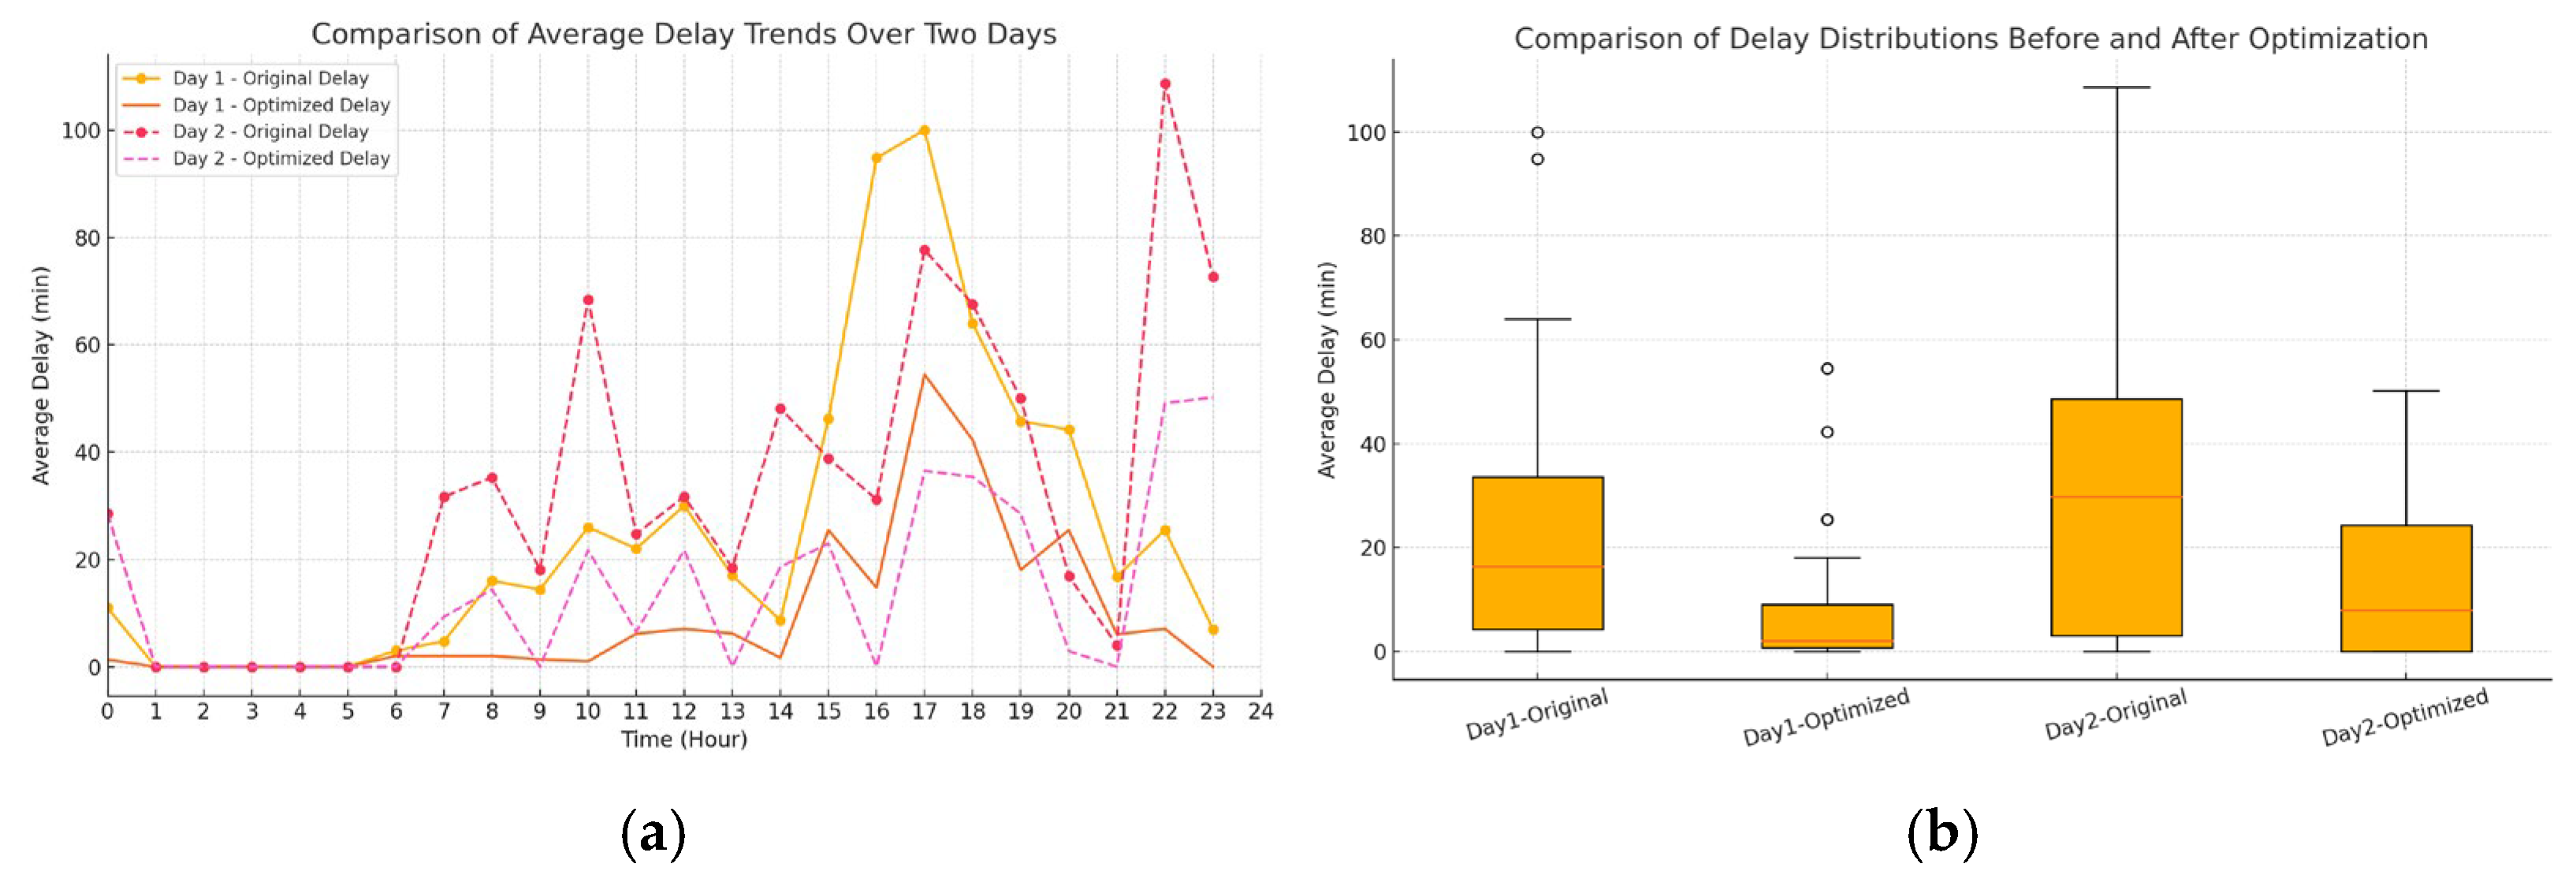
To further test the robustness of the model under different operational conditions, the flight data on July 2 were selected for validation. Considering the difference in the number of flights between the two days, a comparison was made based on the average flight delay time per hour within the same time period. Detailed results are shown in
Figure 15.
For Day 1, the average delay time before optimization was 25.47 min with a standard deviation of 28.37 min, while after optimization, the average delay time was reduced to 7.16 min with a standard deviation of 11.33 min. For Day 2, the average delay time before optimization was 28.04 min with a standard deviation of 32.01 min, while after optimization, it was reduced to 9.17 min with a standard deviation of 12.53 min.
In addition, paired t-tests were conducted to evaluate the statistical significance of the delay reduction. The p-value for Day 1 was 0.000278, and for Day 2 it was 0.0000224, both of which are far less than 0.001, indicating highly significant differences between the pre-optimization and post-optimization results. In summary, the proposed Multi-Stand Grouped Operations method can effectively reduce the average flight delay time in the Bay Area on different days, demonstrating stable optimization performance with strong statistical significance.
- 3.
Multi-Stand Grouped Operation plan
In each training round, the start and end times of each stand corresponding to safe operating space are recorded. The simultaneous operating status of intelligent bodies is obtained based on the simultaneous occupation of safe operating space. The stands of intelligent bodies are grouped according to their simultaneous operating status, and the stands within a group can be marshalled together, including pushback and pushback, pushback and entry position, slip-in and slip-in, taxi-out and taxi-out, and slip-in and slip-out. The influence of wake turbulence is not considered when pushing out positions, the safety space for pushing out positions is small, and pushing out–pushing out simultaneous operation is more common. Multi-Stand Grouped Operations involves pushing out more stands. The stands in each time period after optimization are shown in
Table 10.
Among the 158 flights operating in the Bay Area, Multi-Stand Grouped Operations were conducted 46 times, including 5 instances of three-stand grouped operations and 41 instances of two-stand grouped operations. Within these Multi-Stand Grouped Operations, pushback operations were carried out 28 times, with 5 instances involving three-stand grouped operations and 23 instances involving two-stand grouped operations.
Based on this grouping arrangement, stands that appeared in multiple groups were reclassified into a single group. If the corresponding safety operational space of the stands within the group did not present static conflicts, the grouping was finalized. However, if static conflicts existed within the safety operational space, the stand with the highest grouping frequency was selected as the final grouping stand, while the remaining stands were reassigned for further grouping. The final groupings obtained were as follows: {1,6,9,13}, {2,8,12}, {3,7,17}, {4,10}, and {5,11}. Flights assigned to stands within the same group could operate simultaneously. Based on the final grouping arrangement, the grouped operations ultimately achieved 100% execution efficiency.


