Safety Assessment Method for Parallel Runway Approach Based on MC-EVT for Quantitative Estimation of Collision Probability


Abstract
1. Introduction
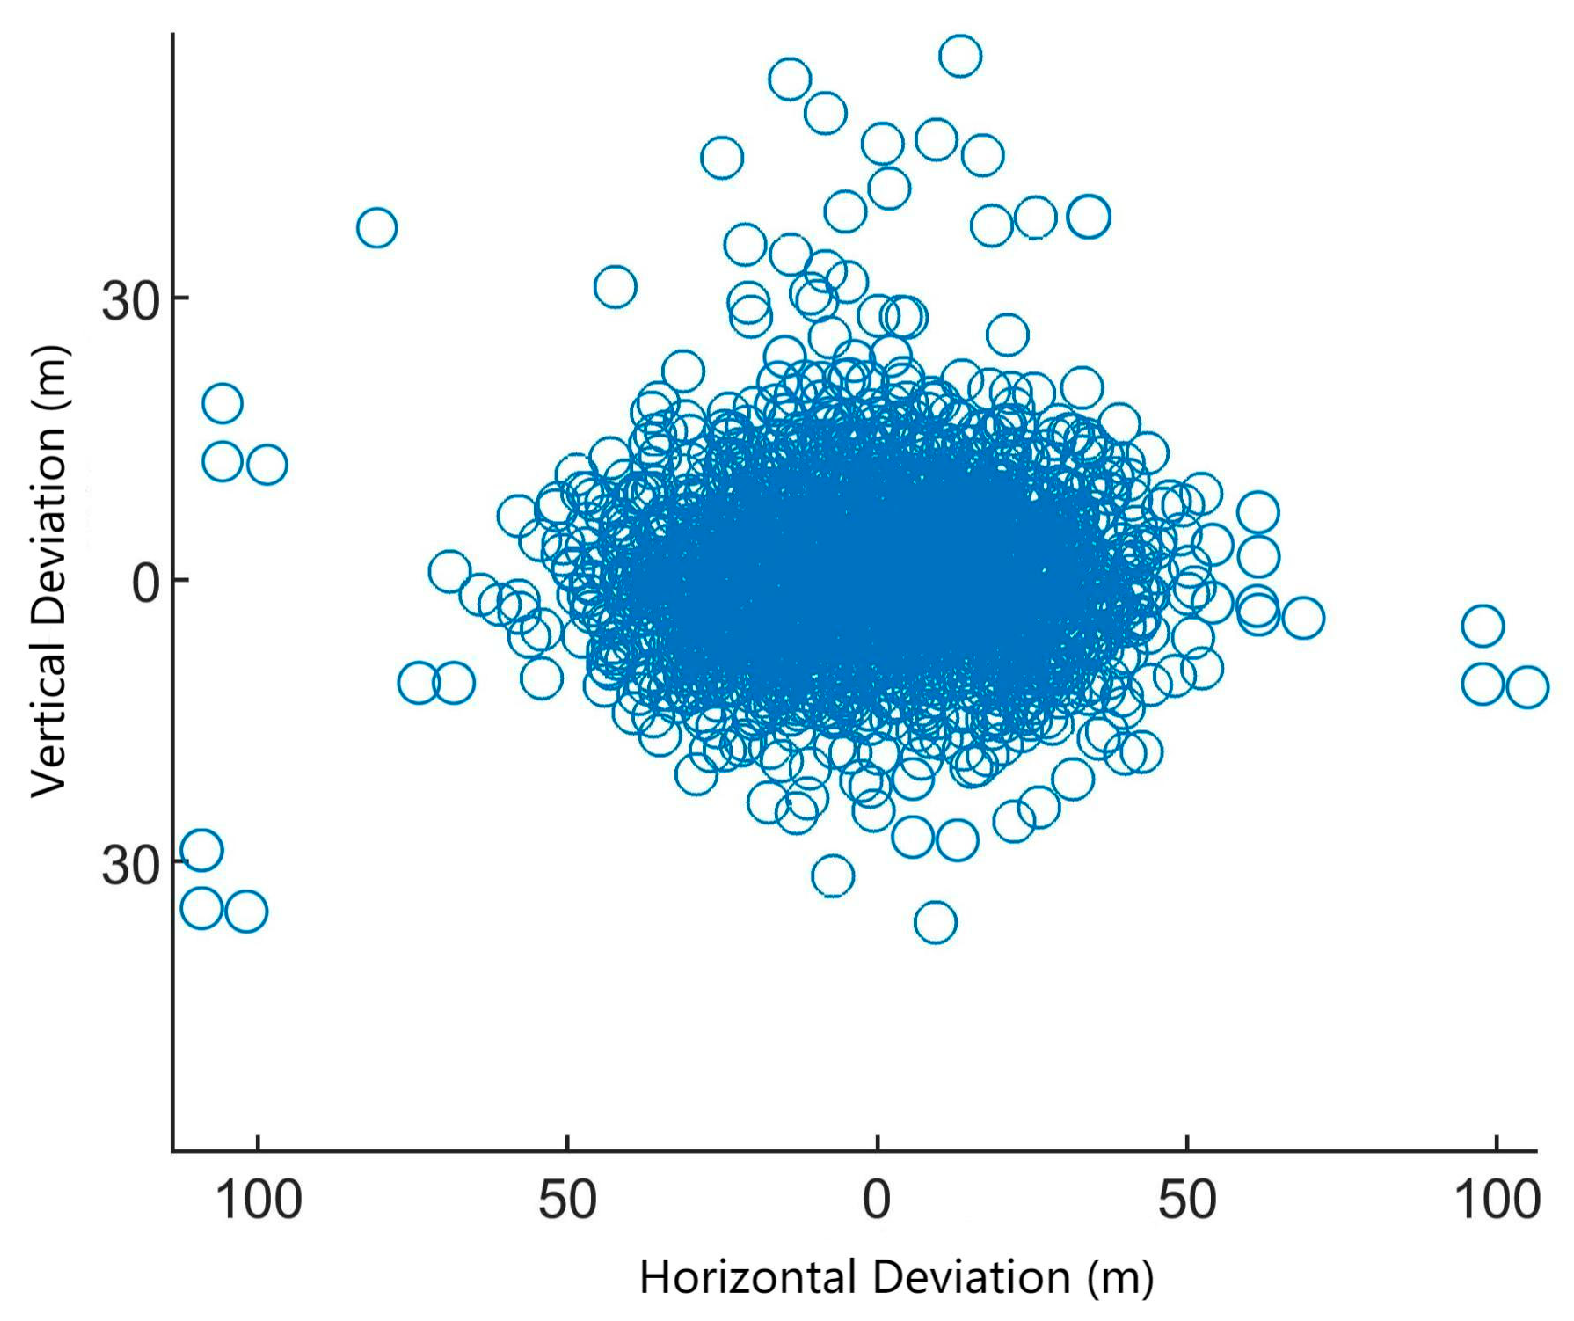
- The proposed approach utilizes ADS-B trajectory data to extract approach deviation performance and quantify the uncertainty of errors under the performance-based navigation (PBN) operational mode. This uncertainty is assumed to follow a two-dimensional Gaussian distribution, allowing the simulation to better capture its variability.
- This study proposes a quantitative collision risk assessment method for parallel approaches, integrating Monte Carlo simulation with extreme value theory (MC-EVT). This method enables the rapid simulation of approach risk scenarios and utilizes Bayesian conditional probability to estimate risk levels.
- Experimental validation is performed to conduct an in-depth analysis of key risk factors, with the goal of further improving the efficiency of parallel approach operations.
- In the approach risk scenarios constructed in this study, the proposed method exhibits superior effectiveness and efficiency compared to conventional Monte Carlo simulation approaches.
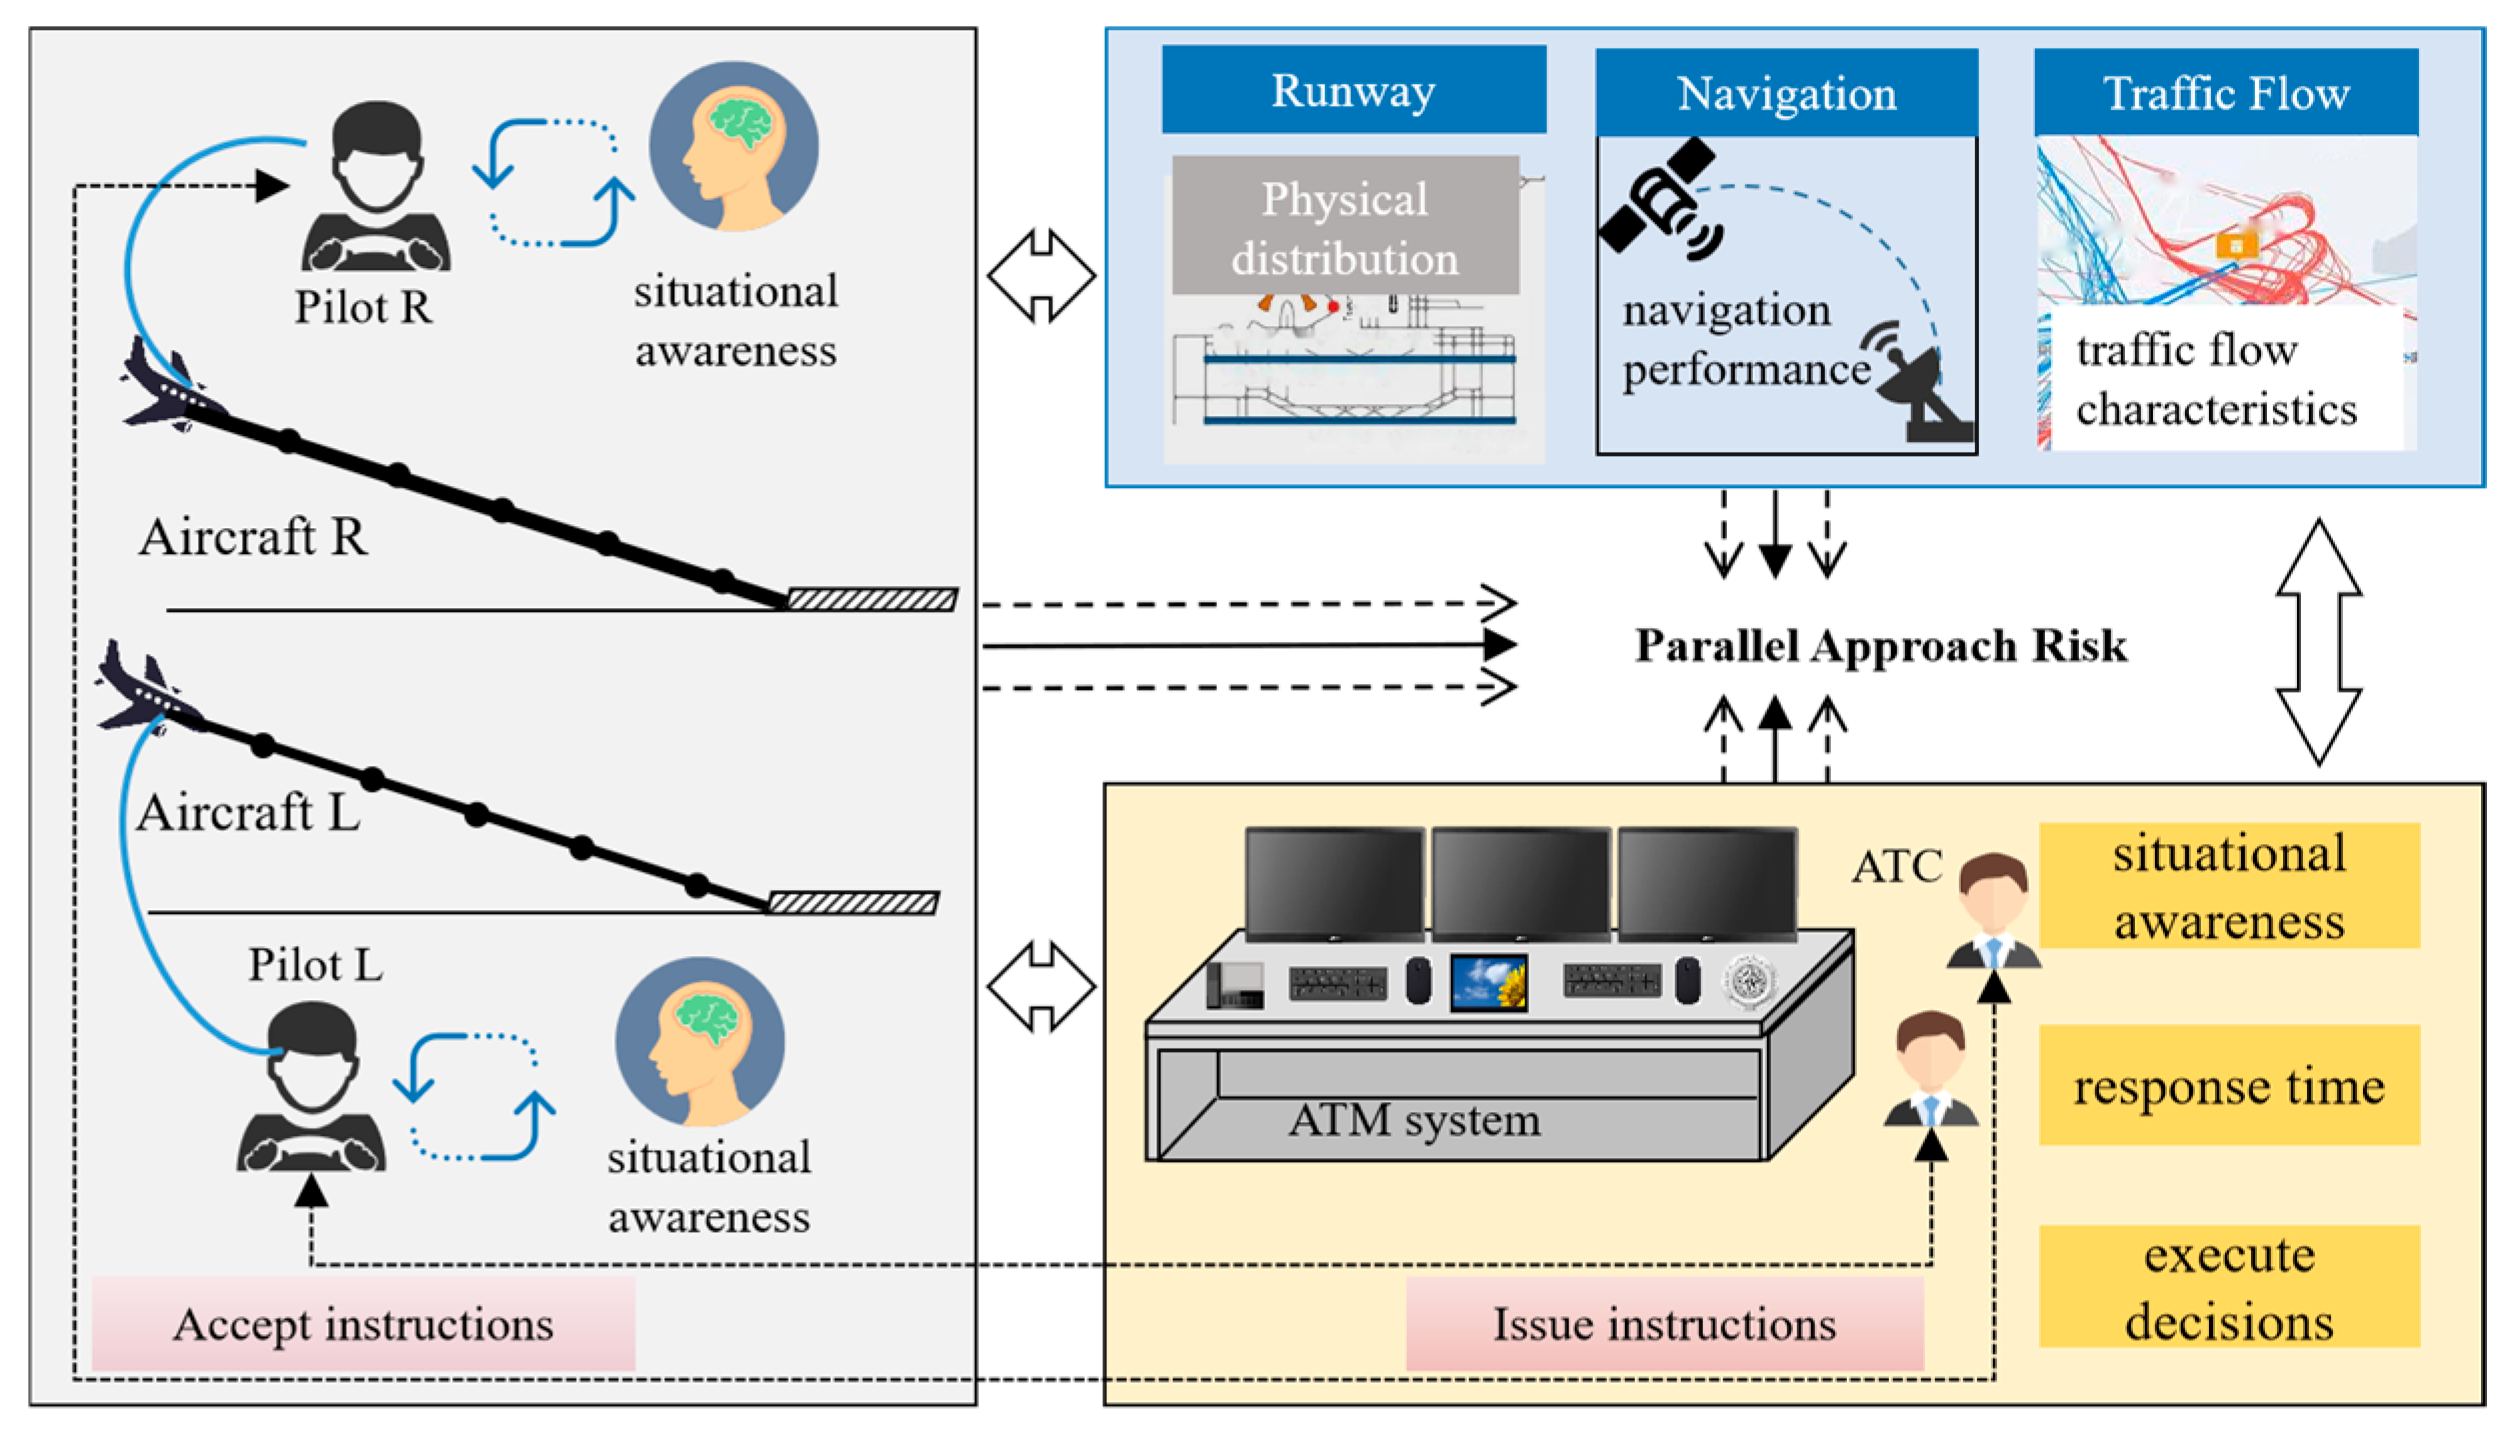
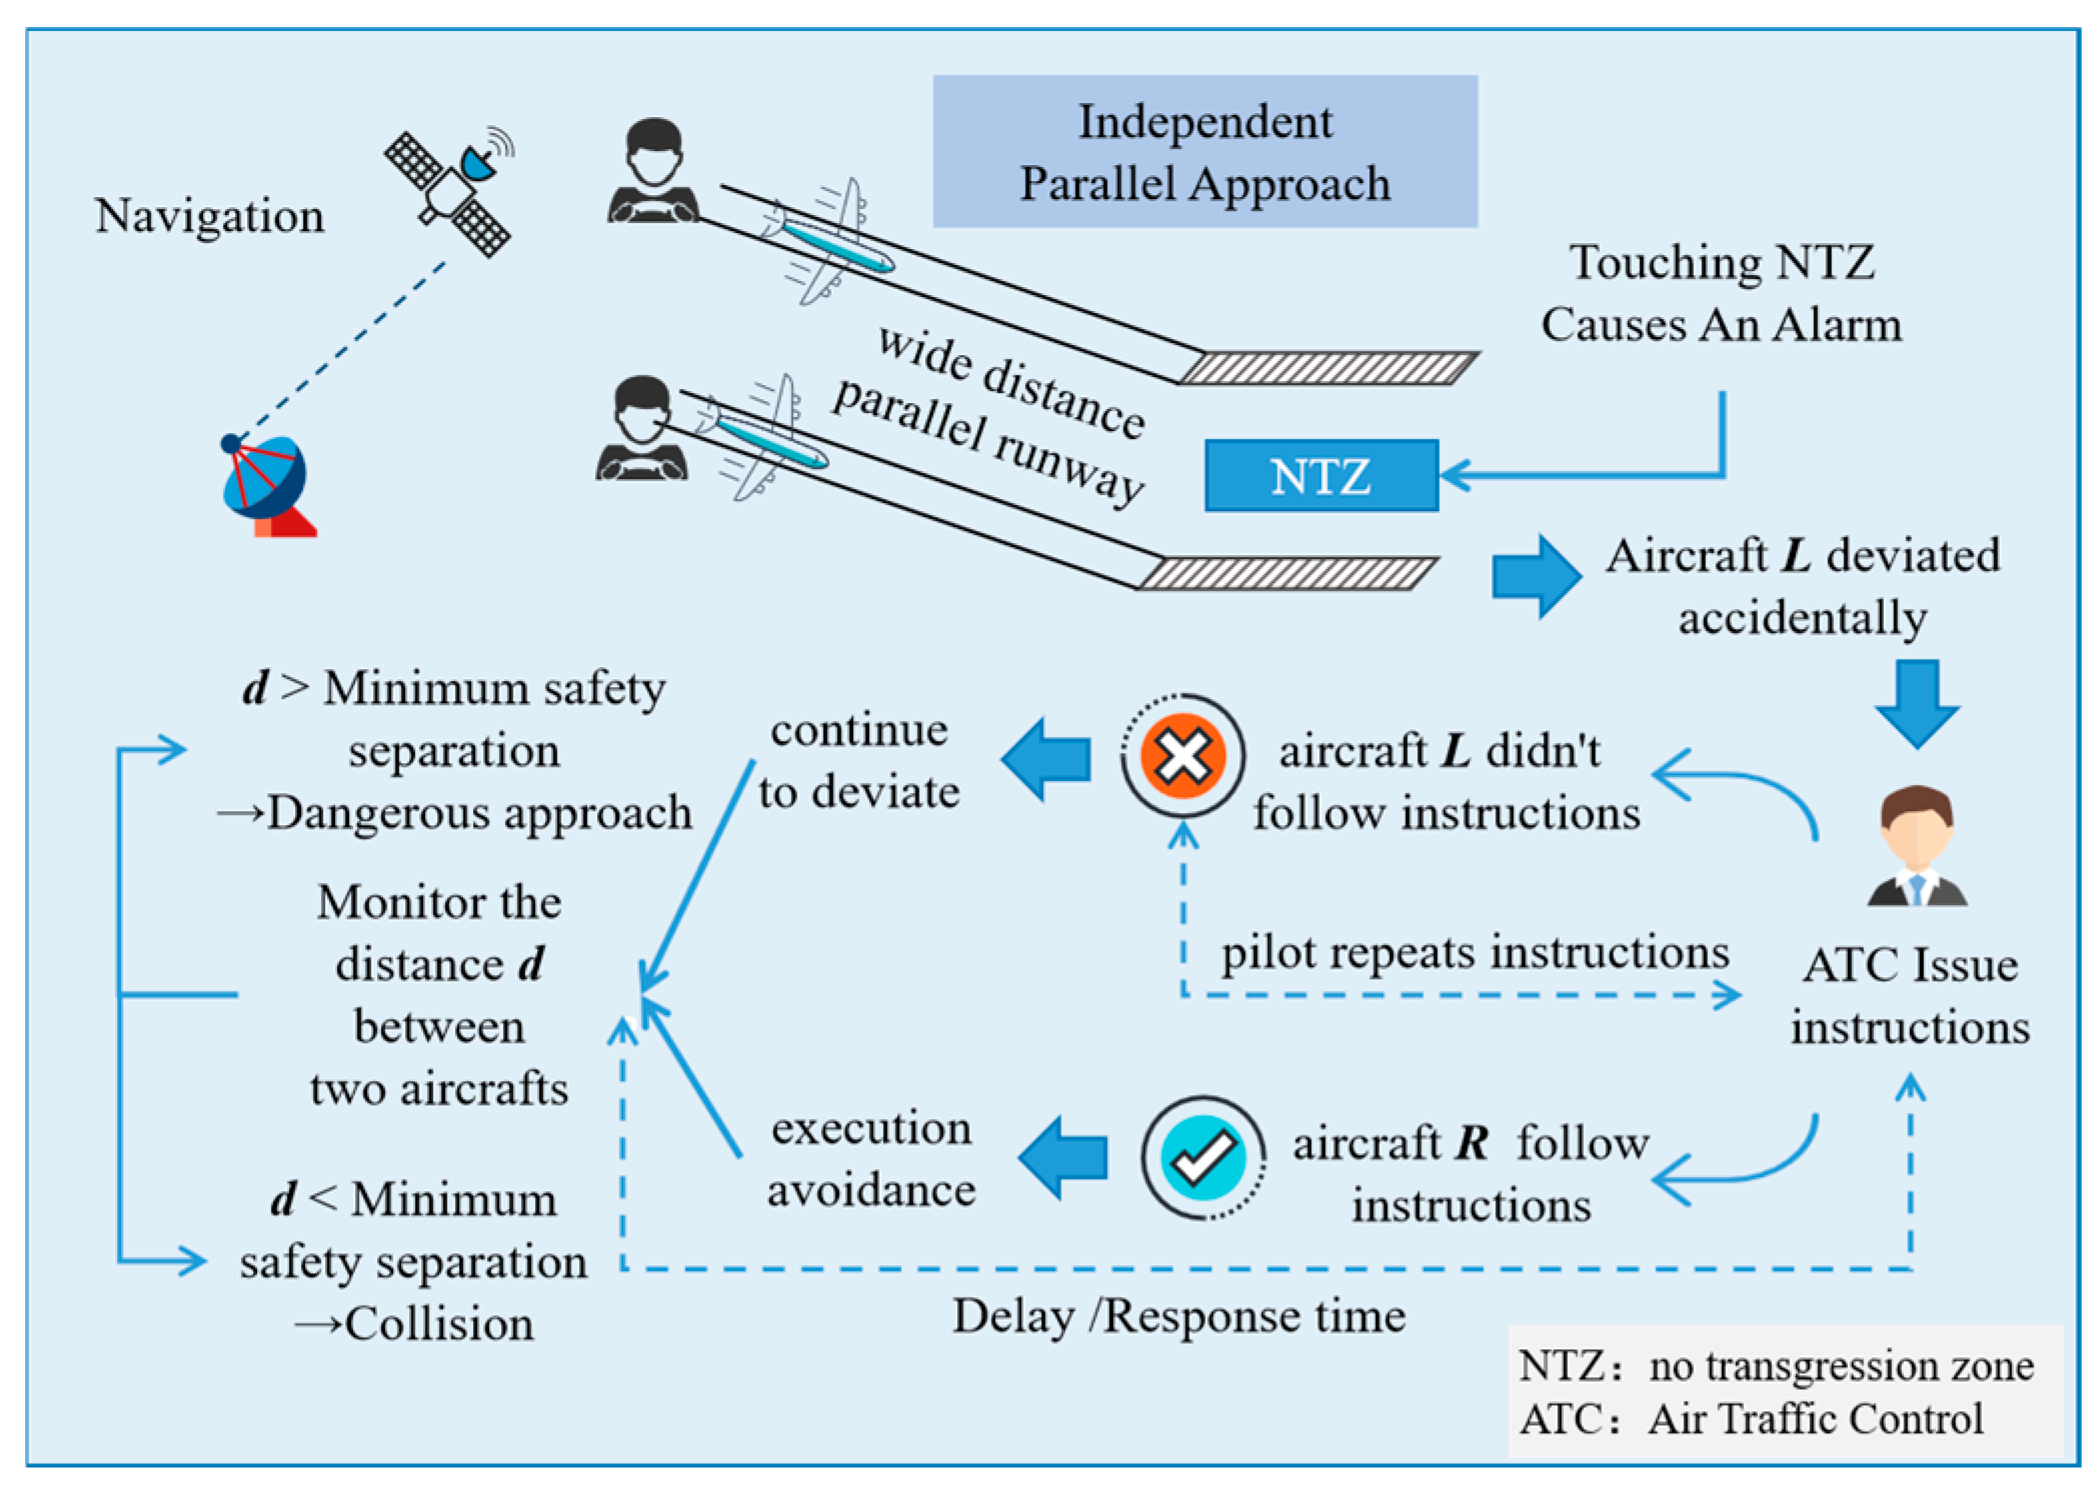
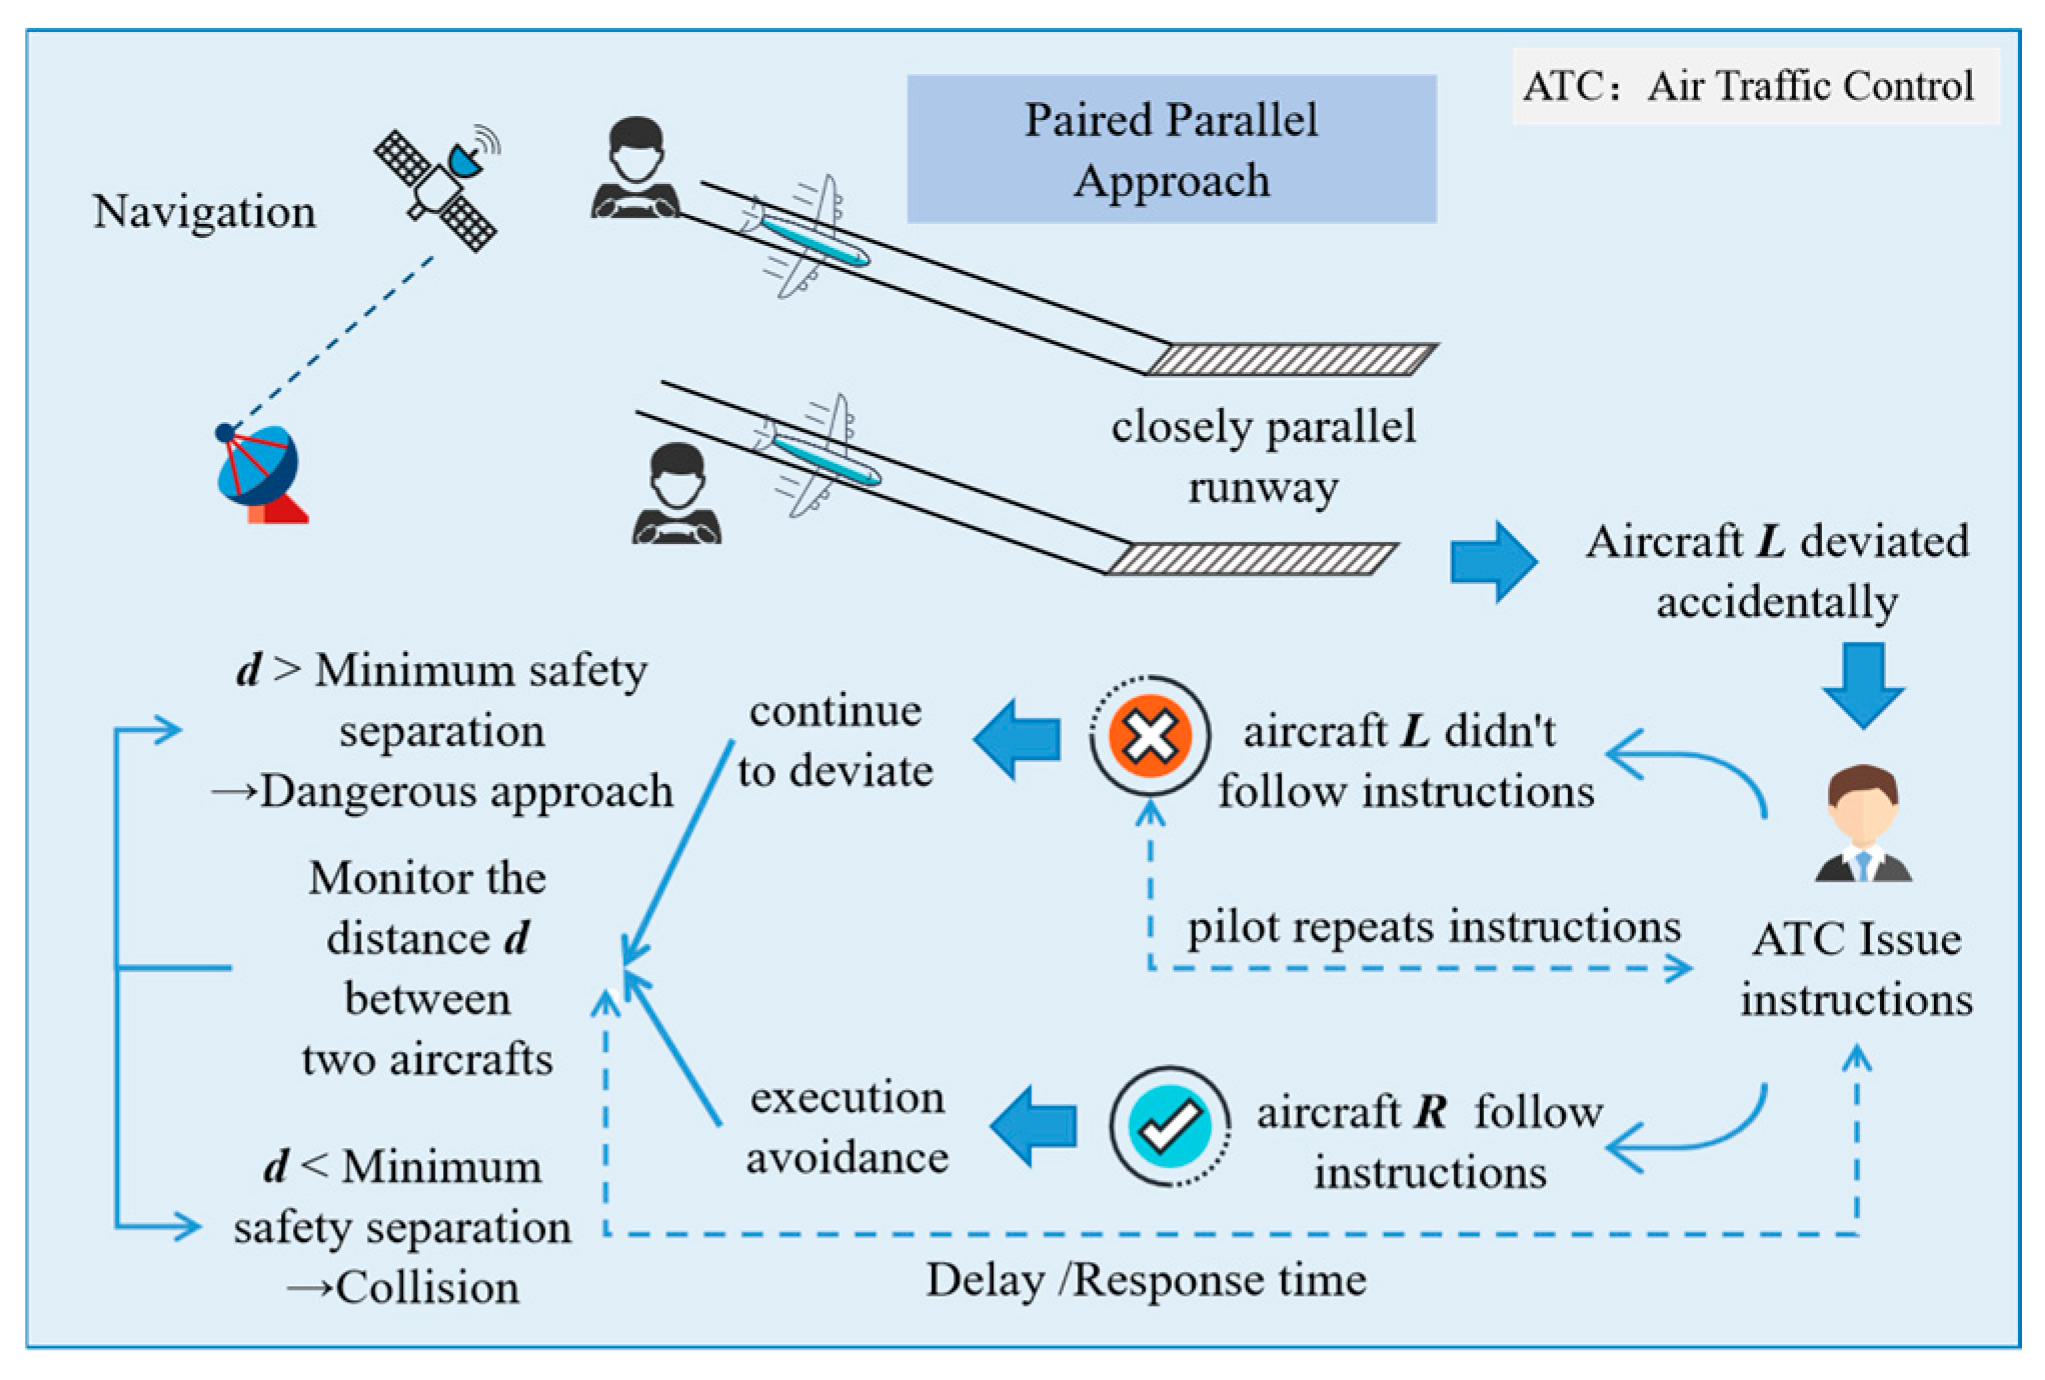
2. Parallel Approach Operation Risk Scenario
2.1. Scene Description
2.2. Target Level of Safety (TLS)
3. Parallel Approach Collision Risk Assessment Model Based on MC-EVT
3.1. Extreme Value Theory
- Block Maxima Approach
- Peaks Over Threshold (POT)
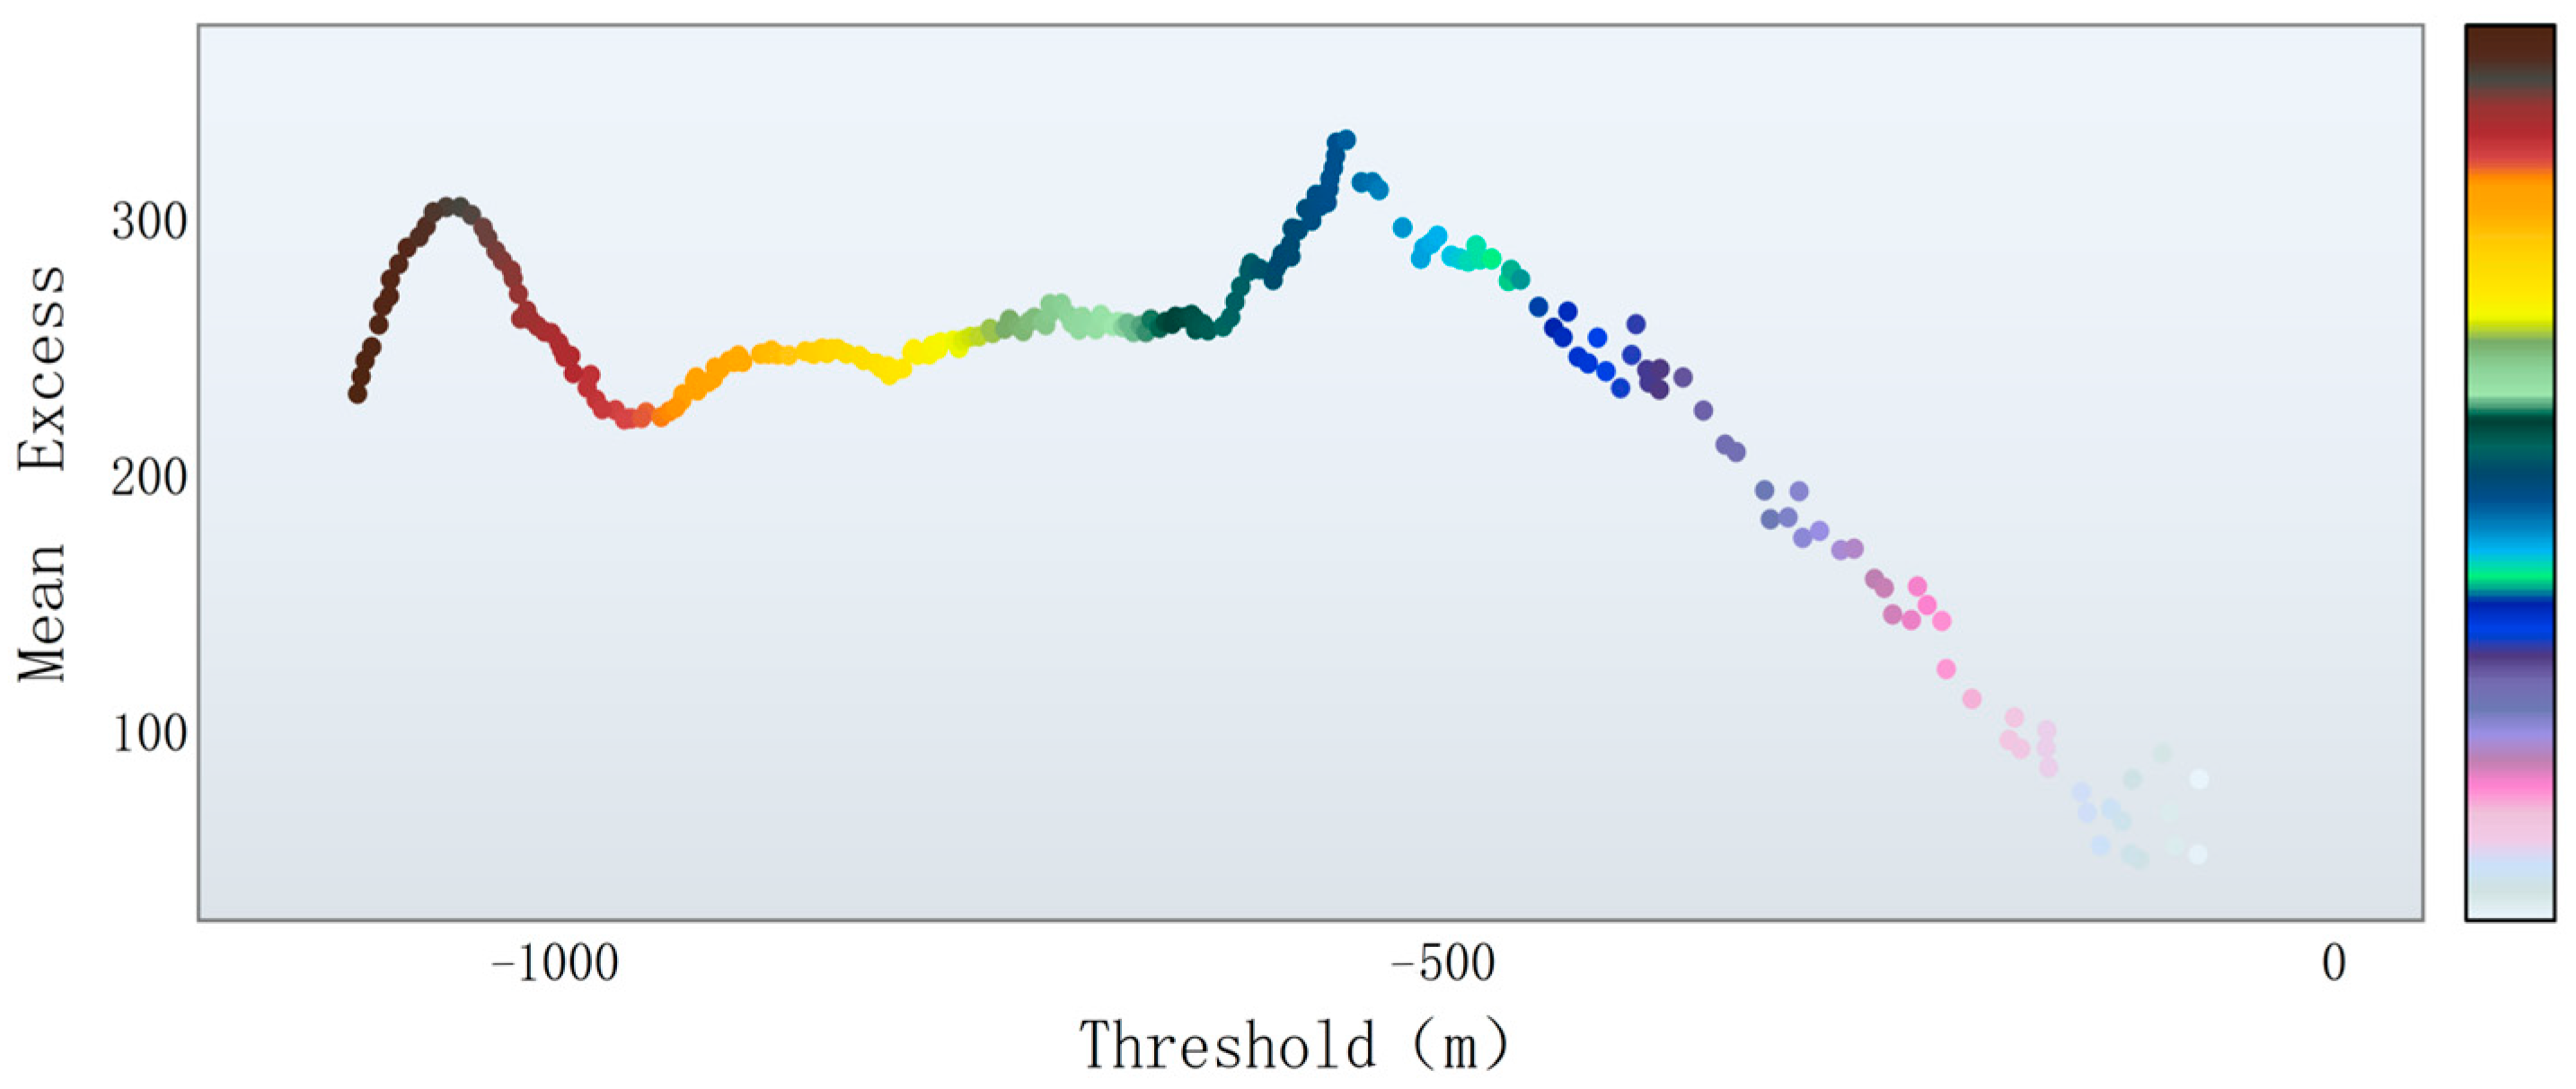
- Threshold selection
3.2. Collision Risk Probability Estimation Based on MC-EVT
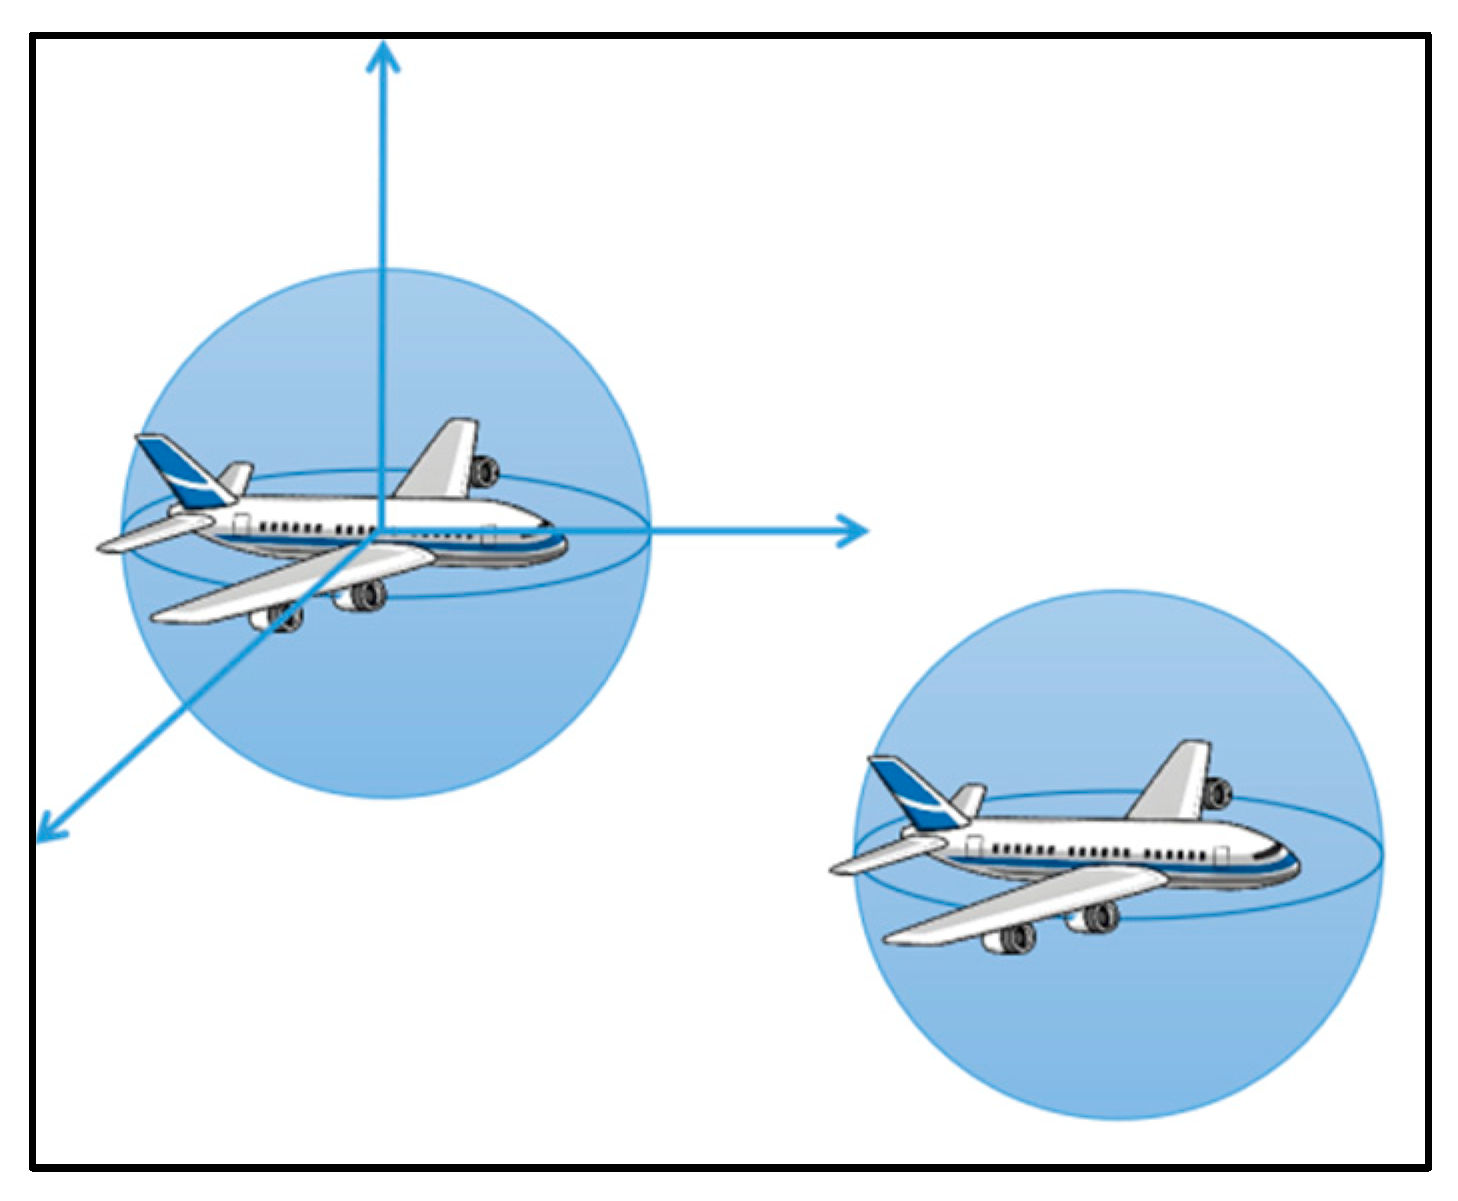
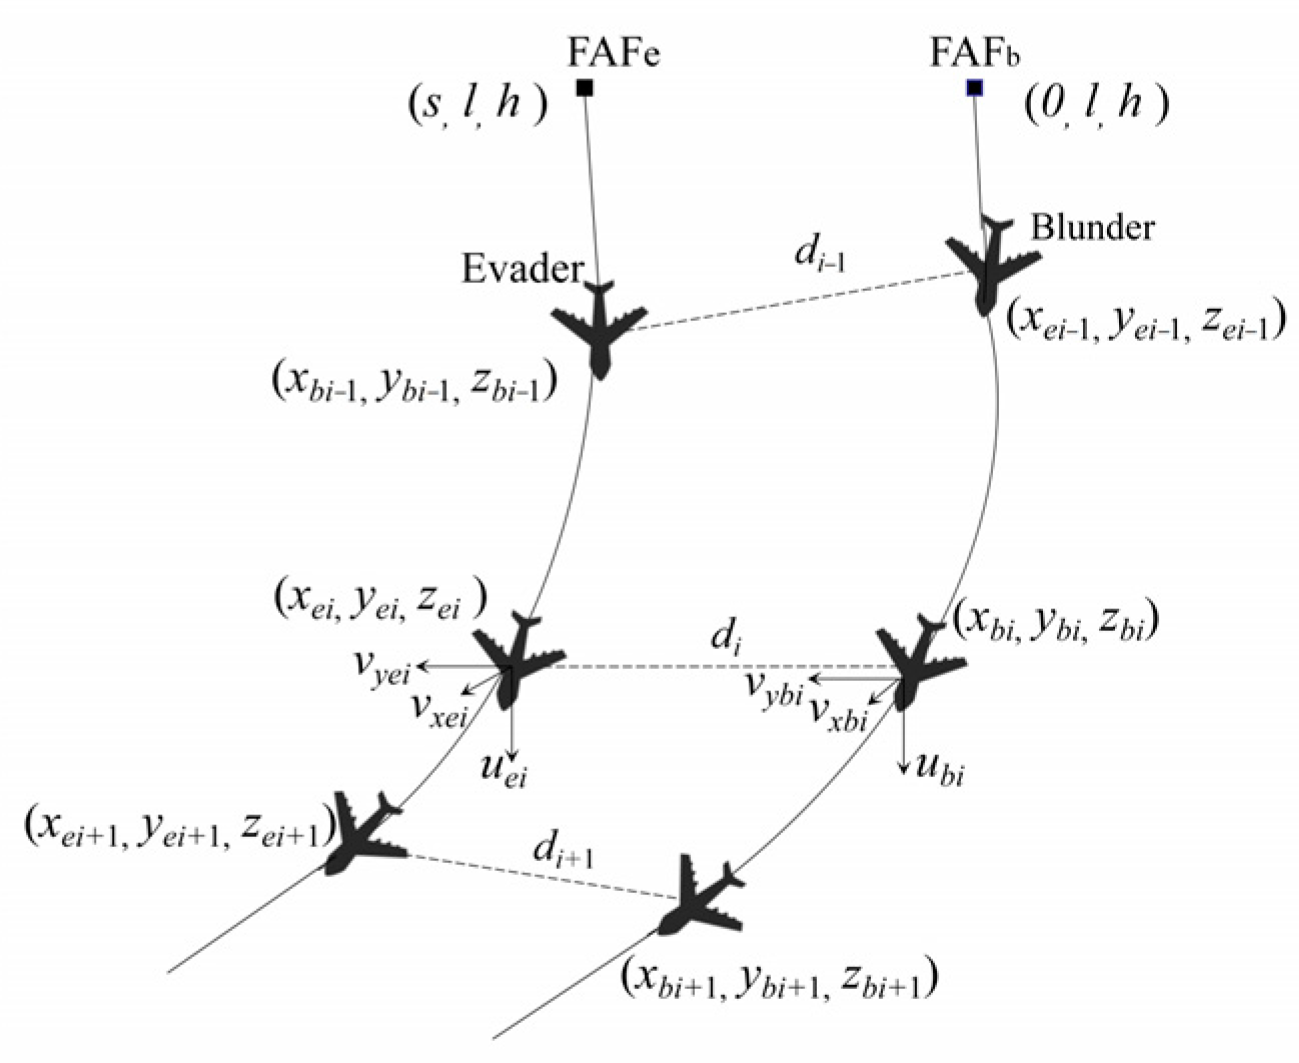
3.2.1. Aircraft Model Representation
3.2.2. Kinematic Model of Aircraft Motion
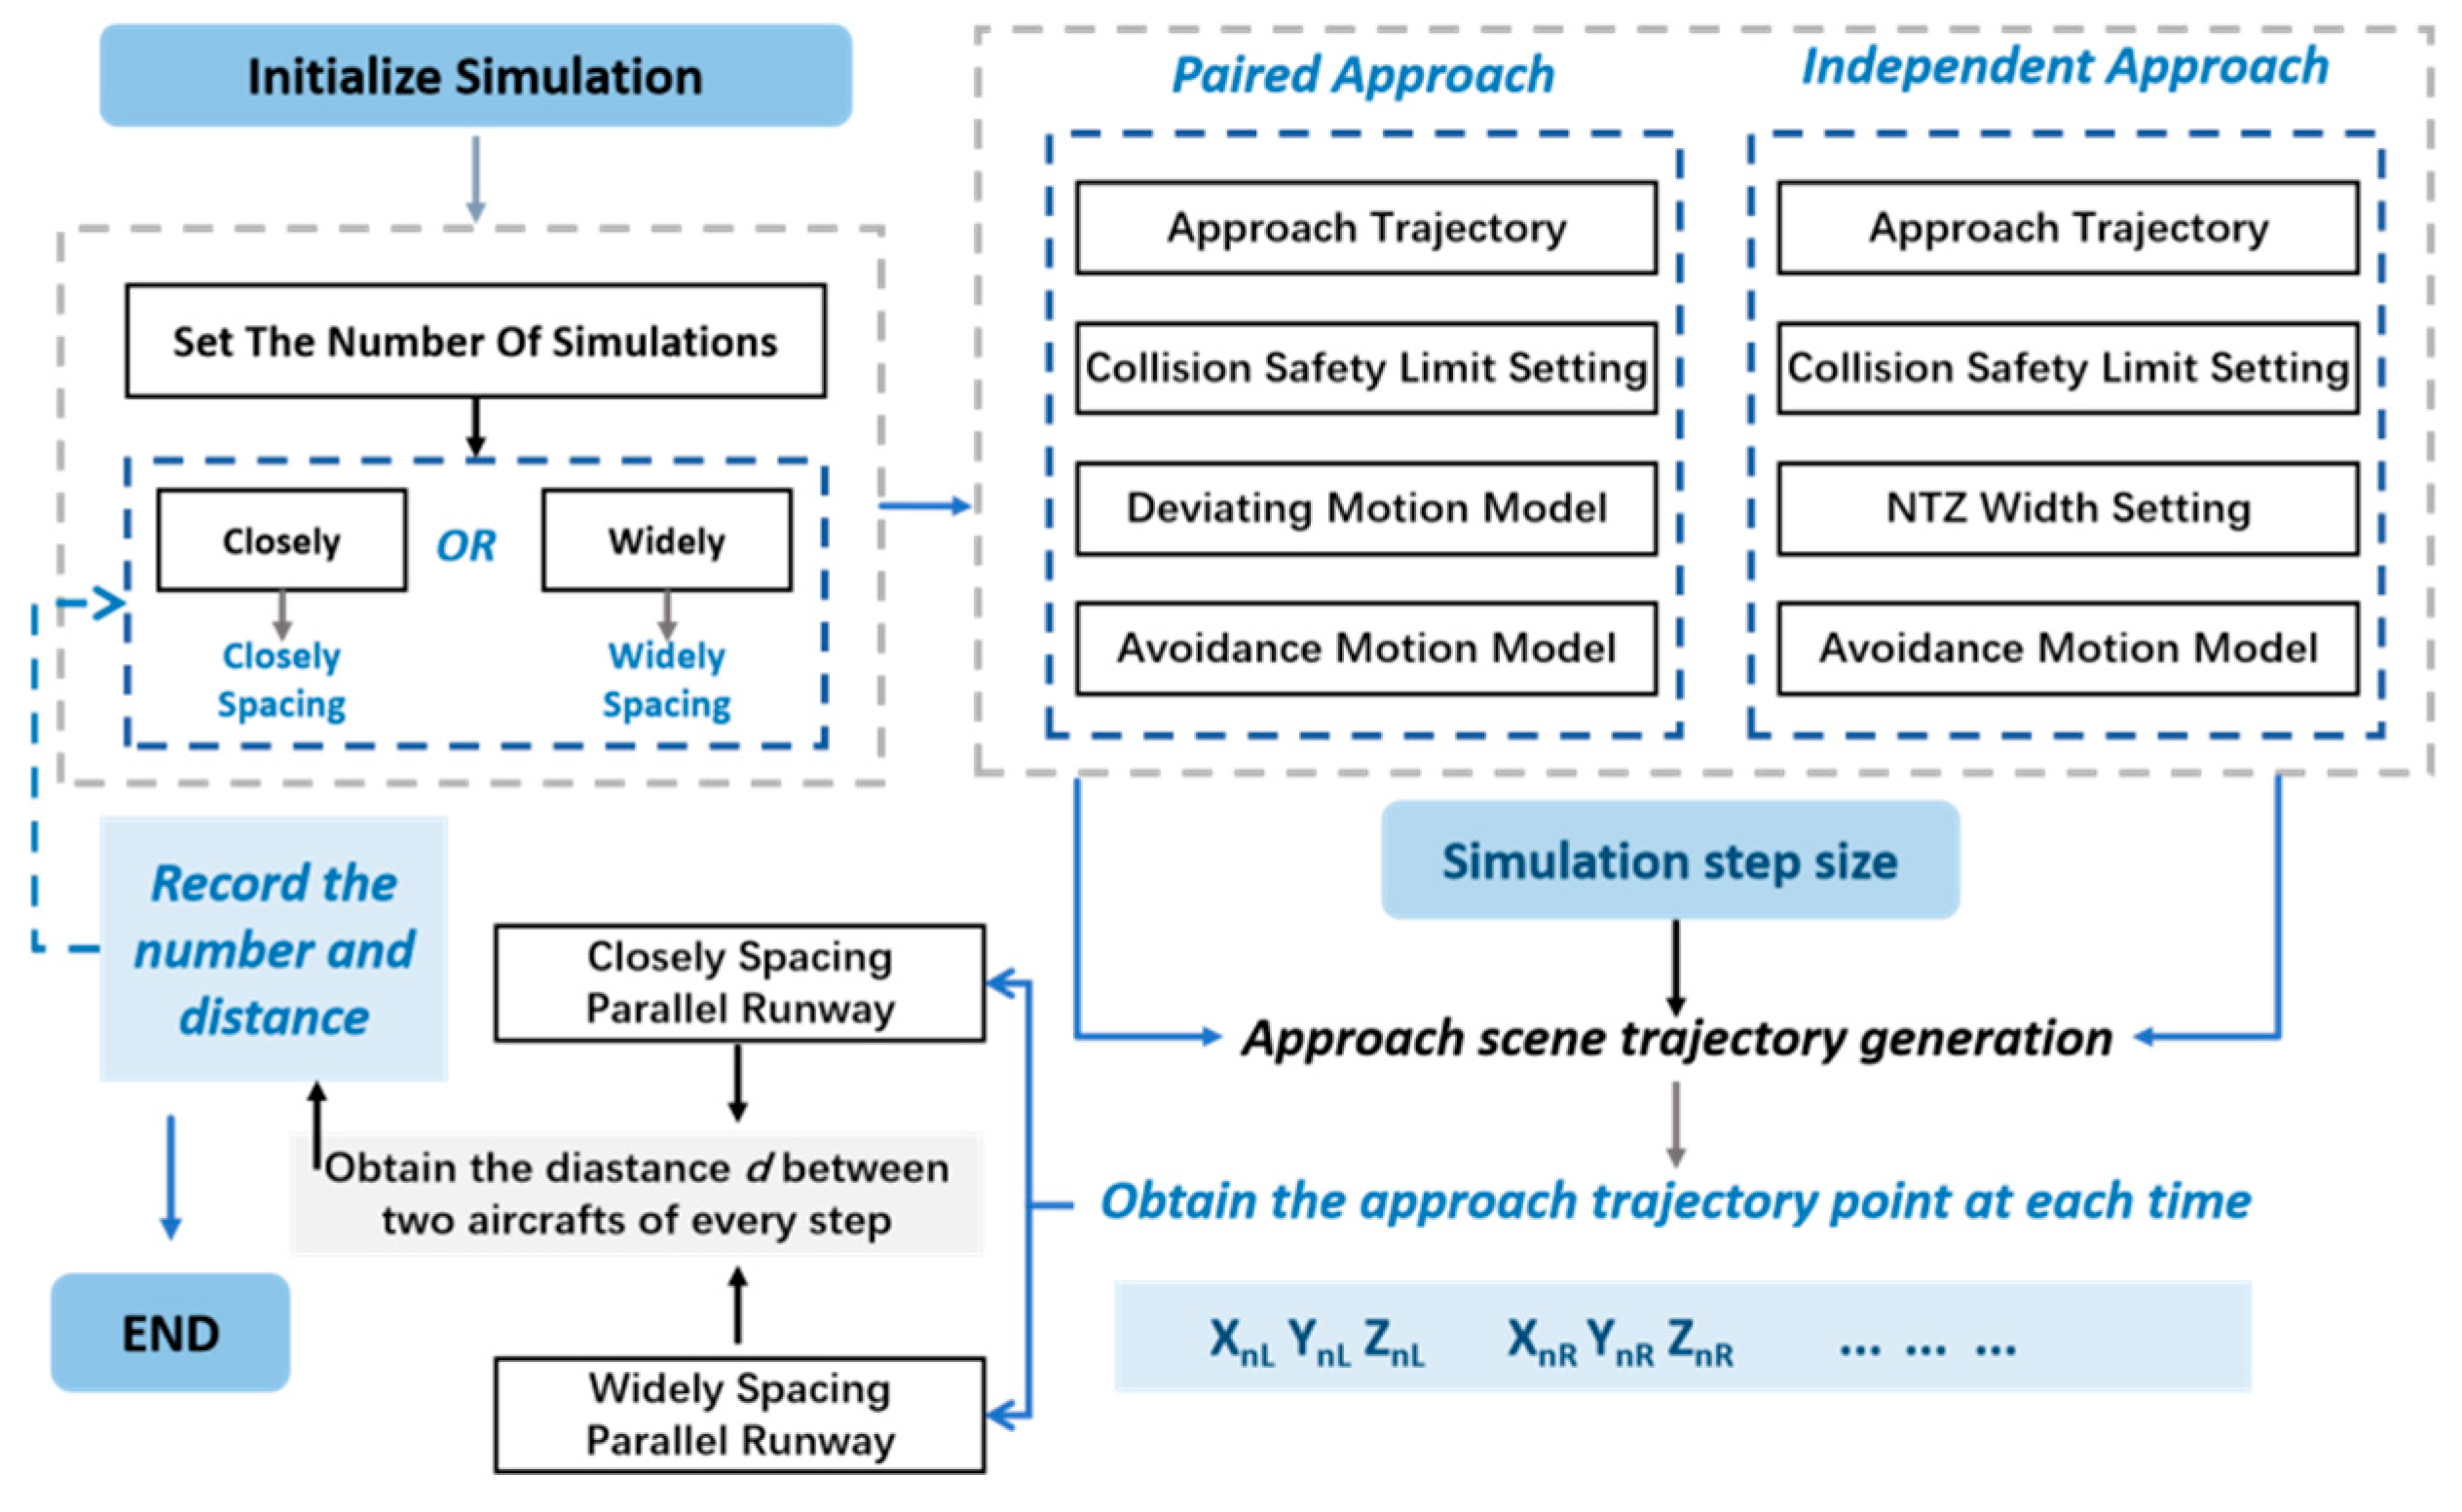
3.2.3. Monte Carlo Simulation
3.2.4. Collision Risk Probabilities
4. Experimental Analysis
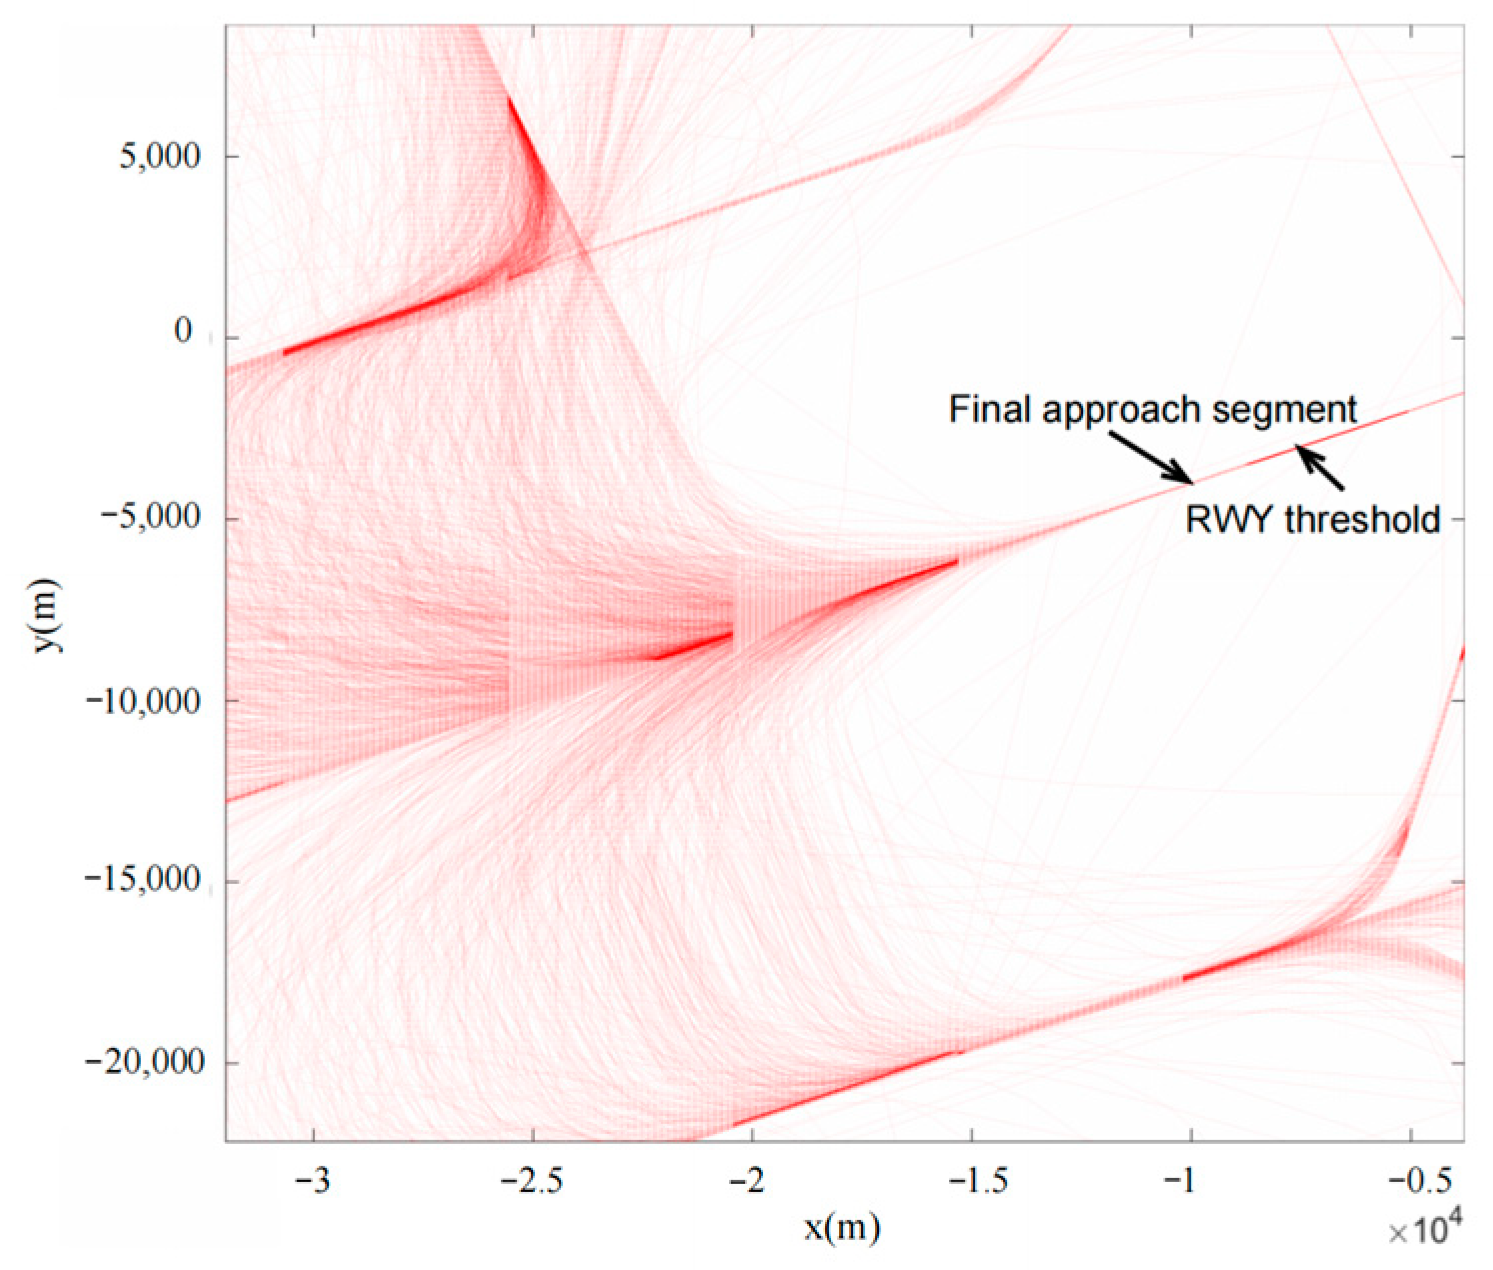
4.1. Analysis of Characteristics of Approaching Traffic Flow Based on ADS-B
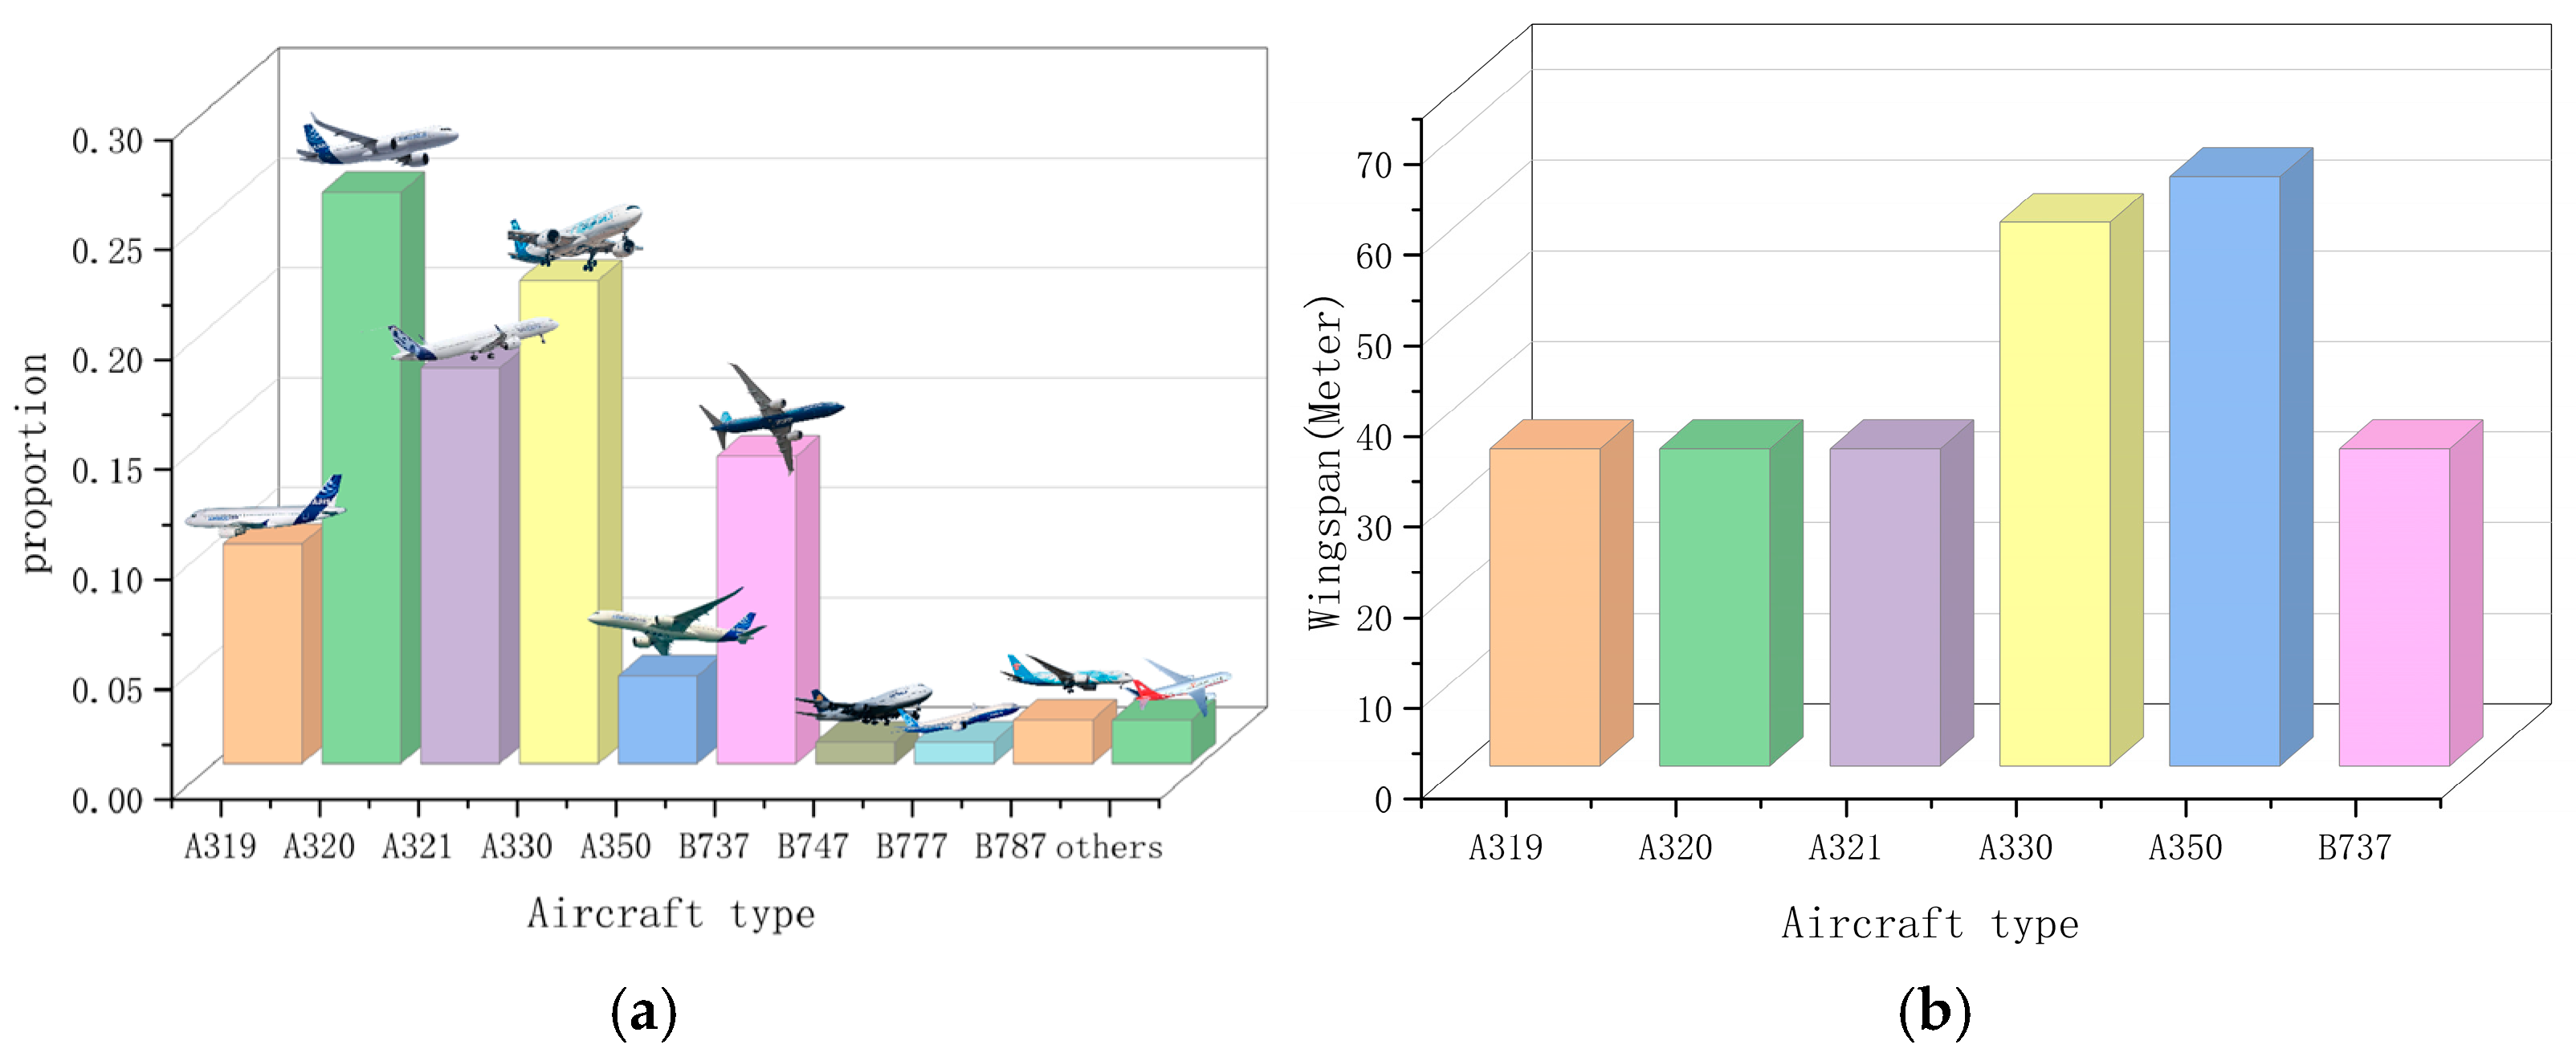
4.1.1. Aircraft Type
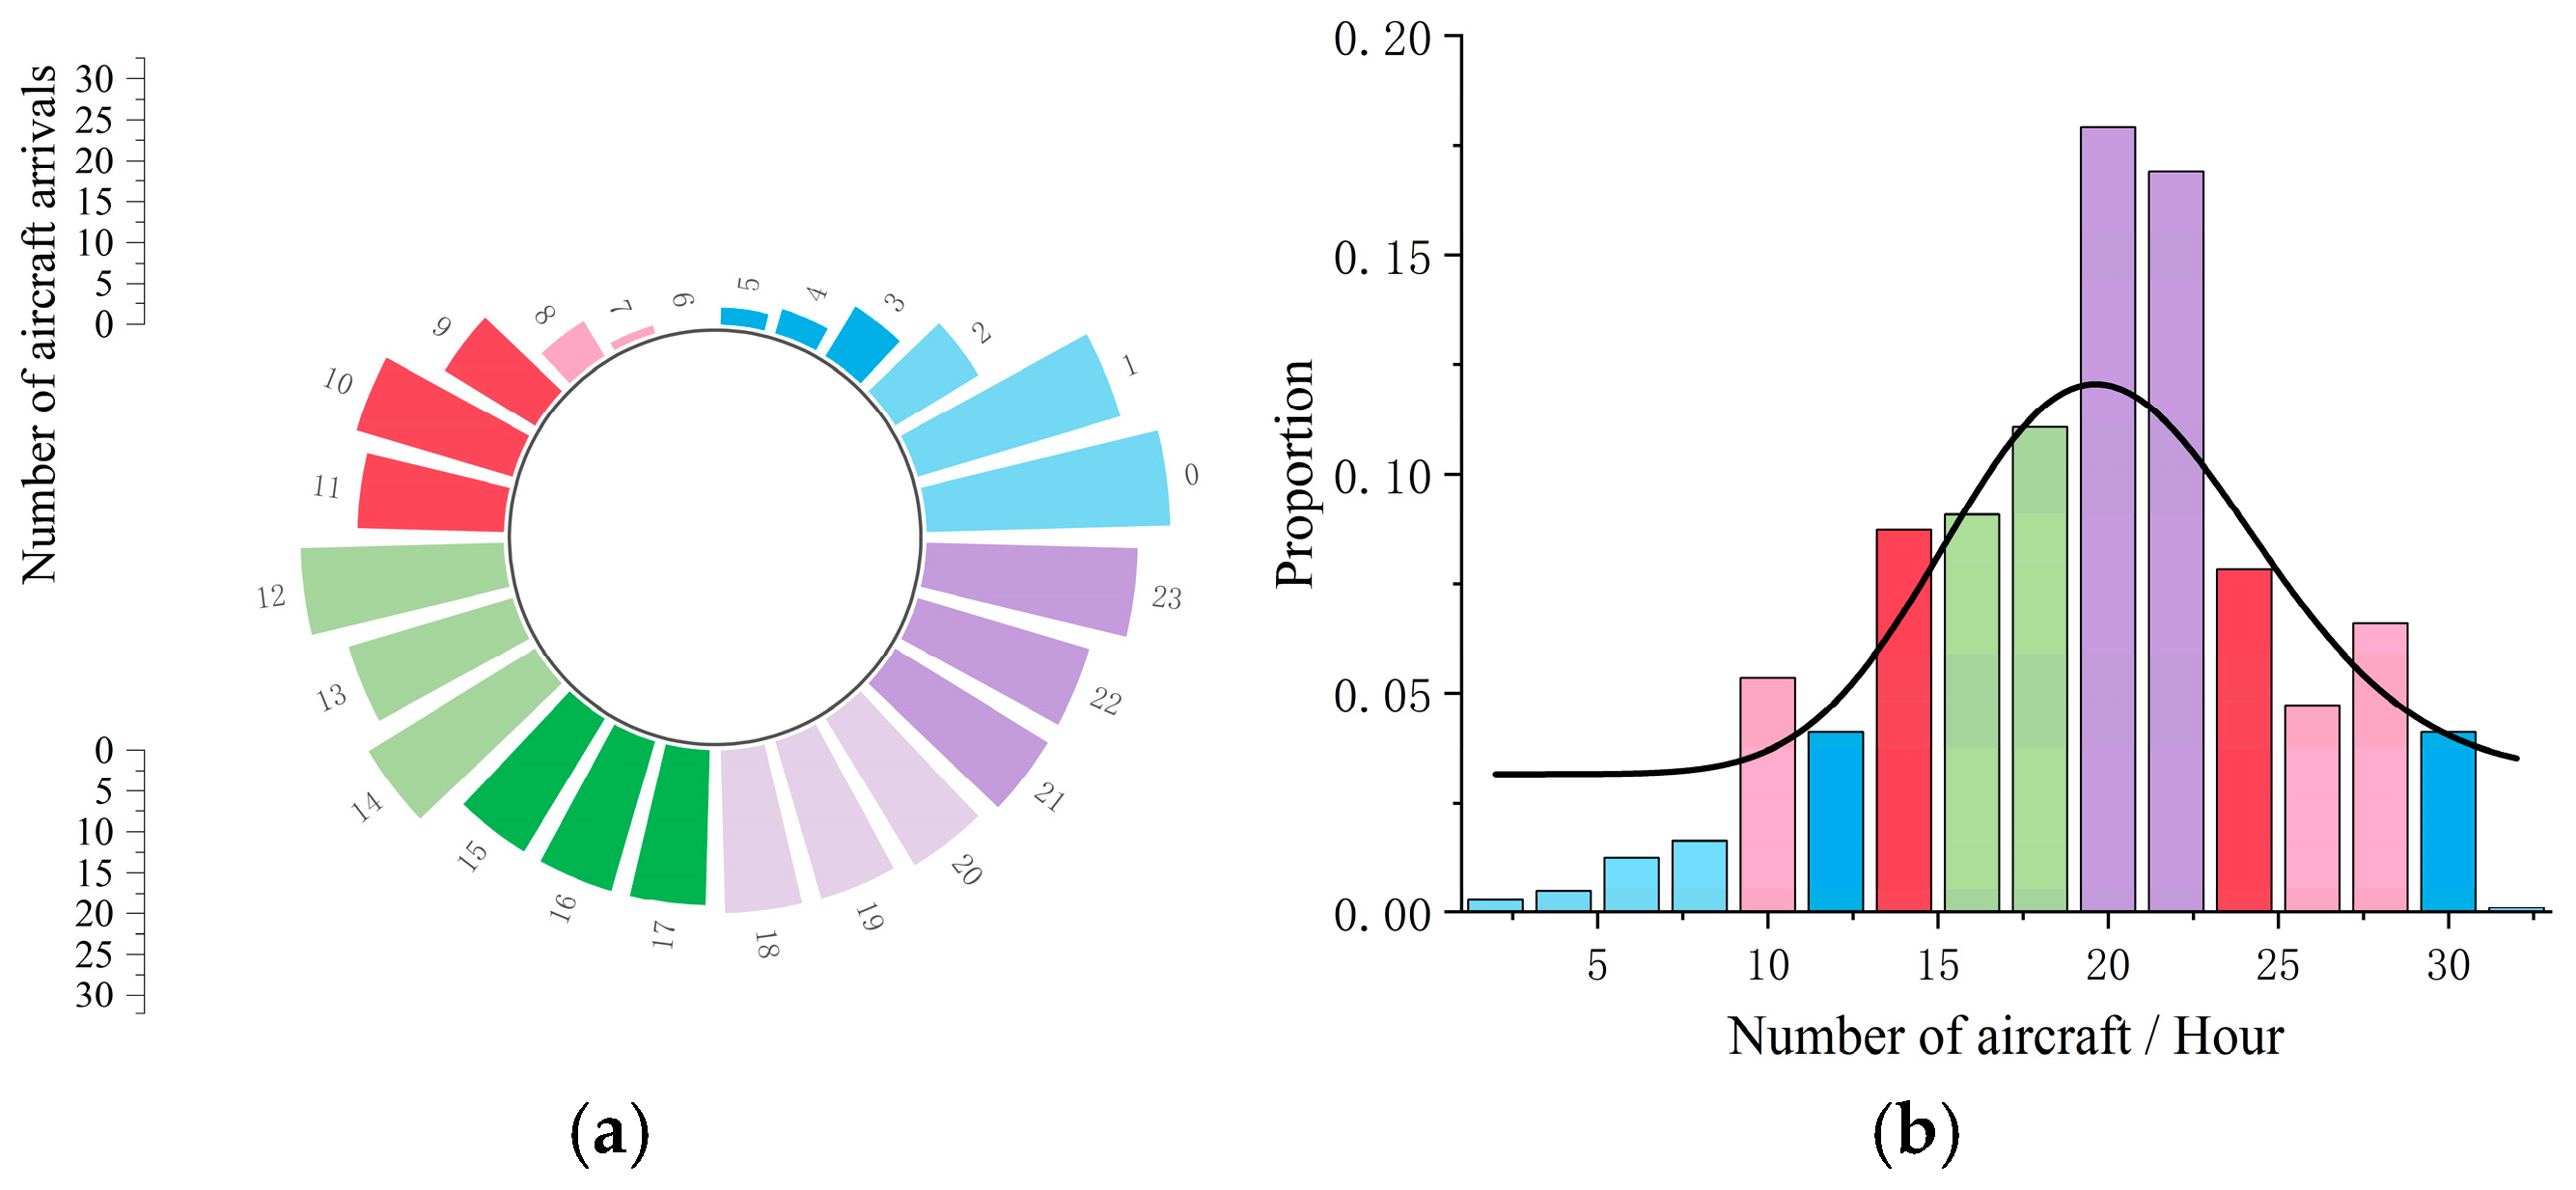
4.1.2. Arrival Distribution of Traffic Flow
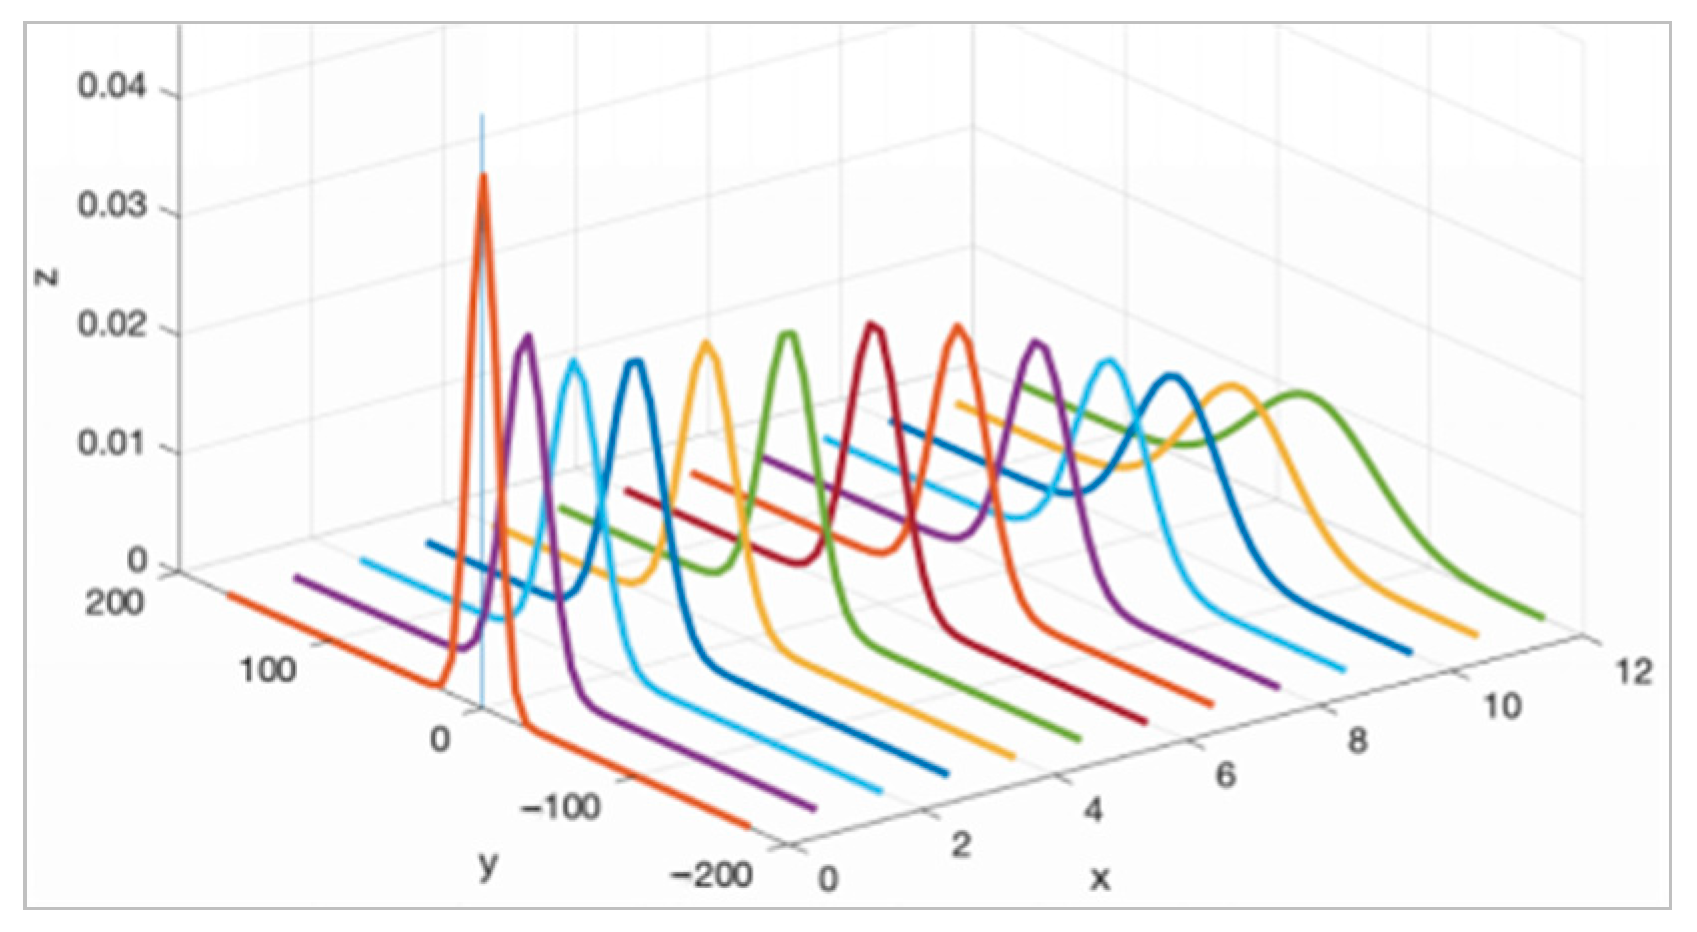
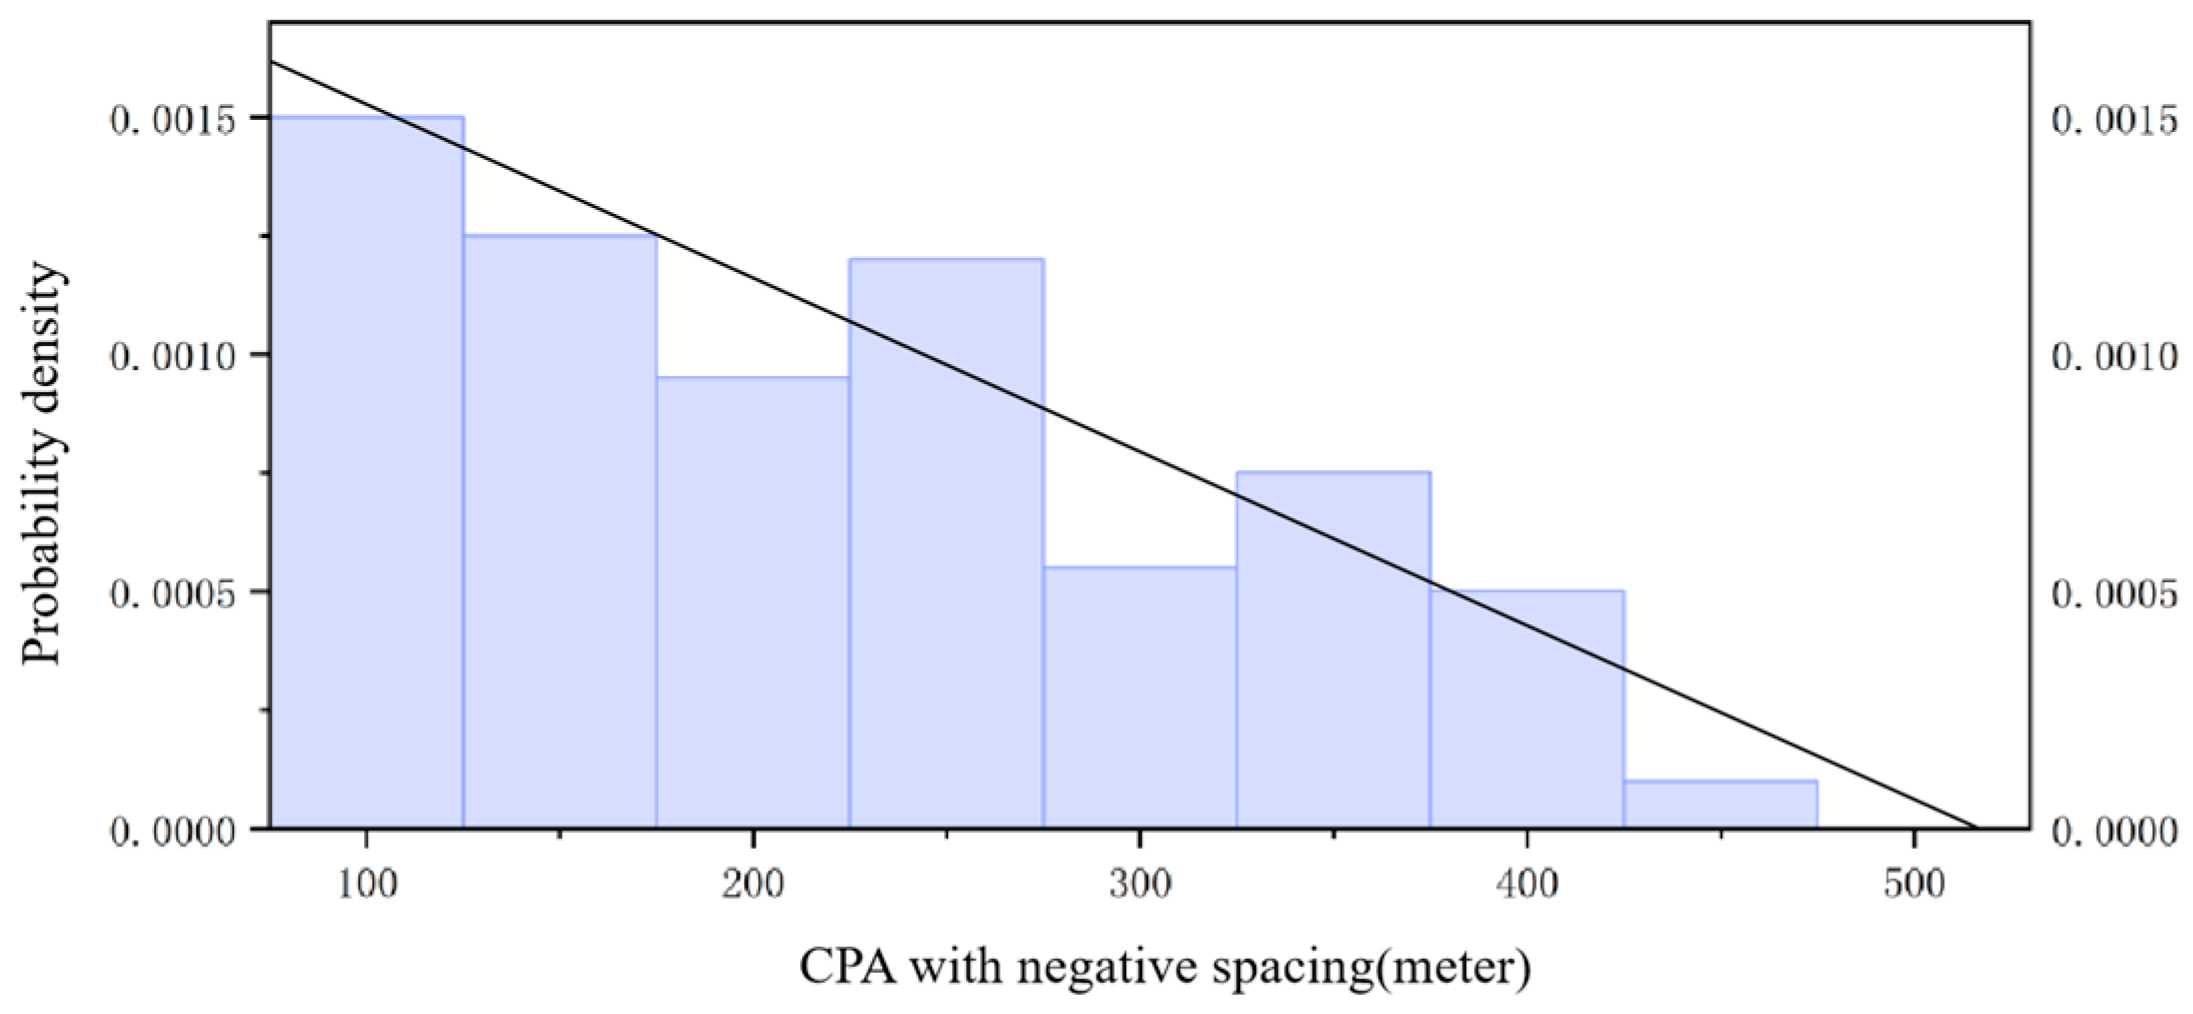
4.1.3. Analysis of Approach Deviation Performance
4.2. Monte Carlo Simulation Under Typical ICAO Error Scenarios
4.3. Collision Probability
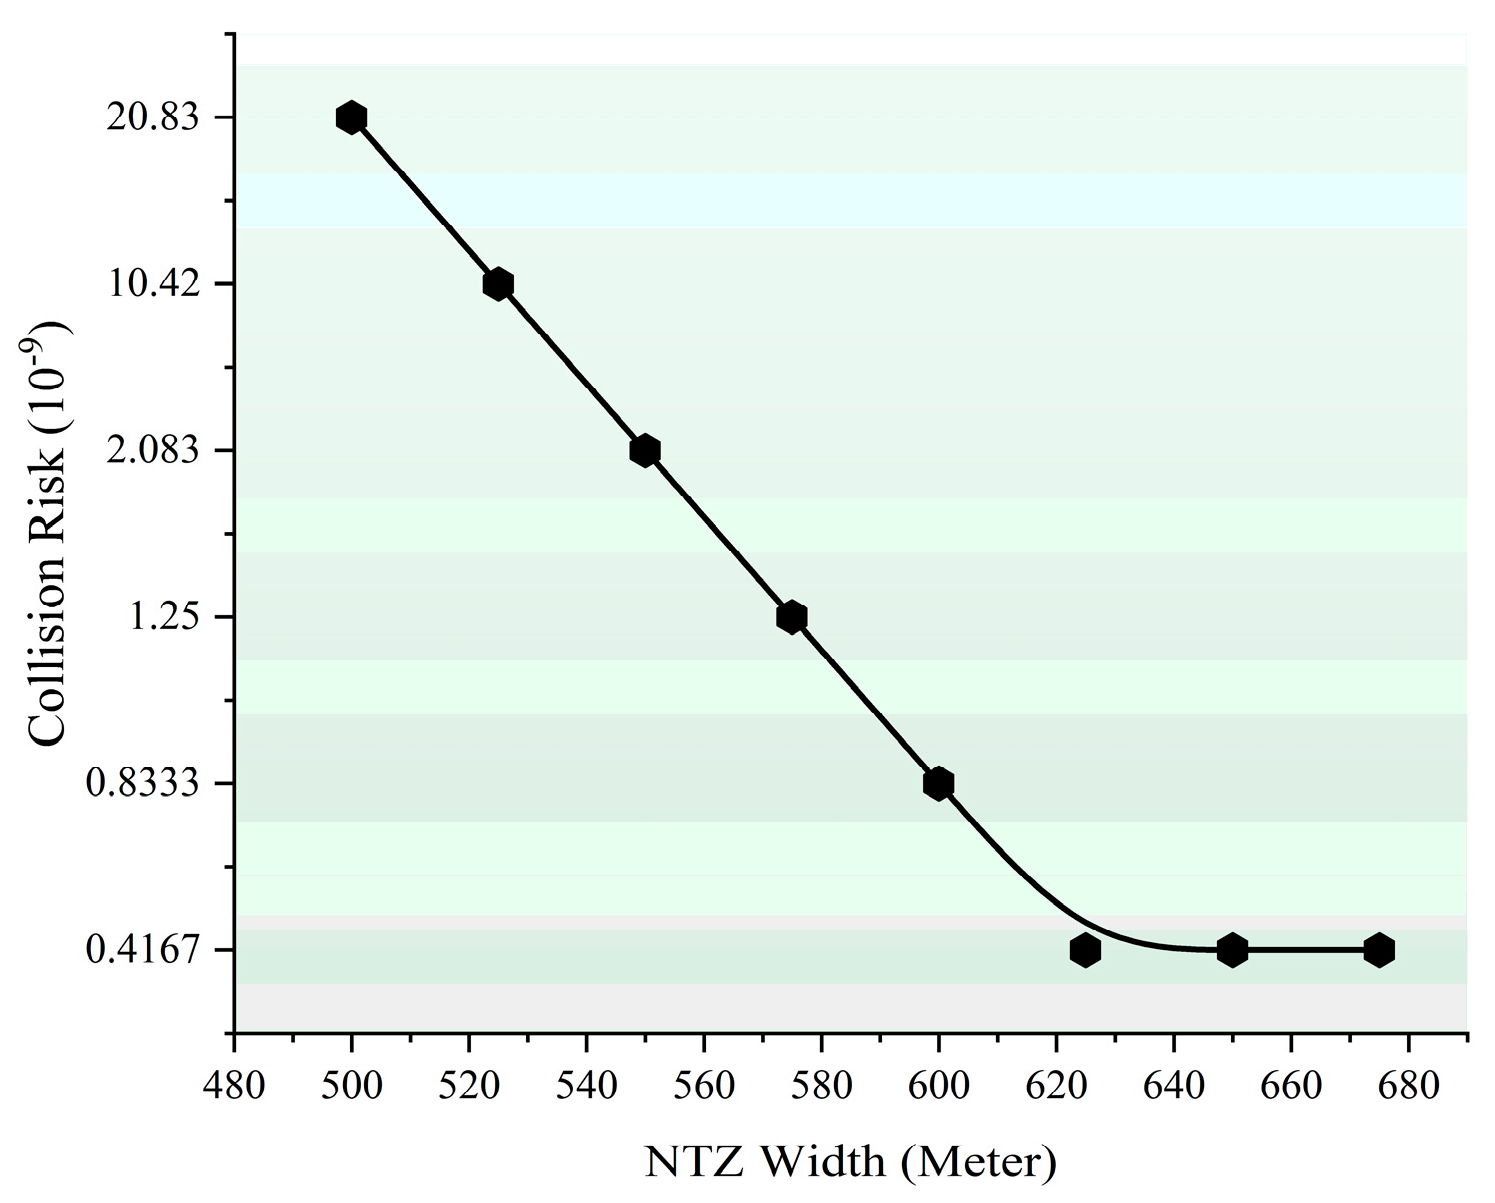
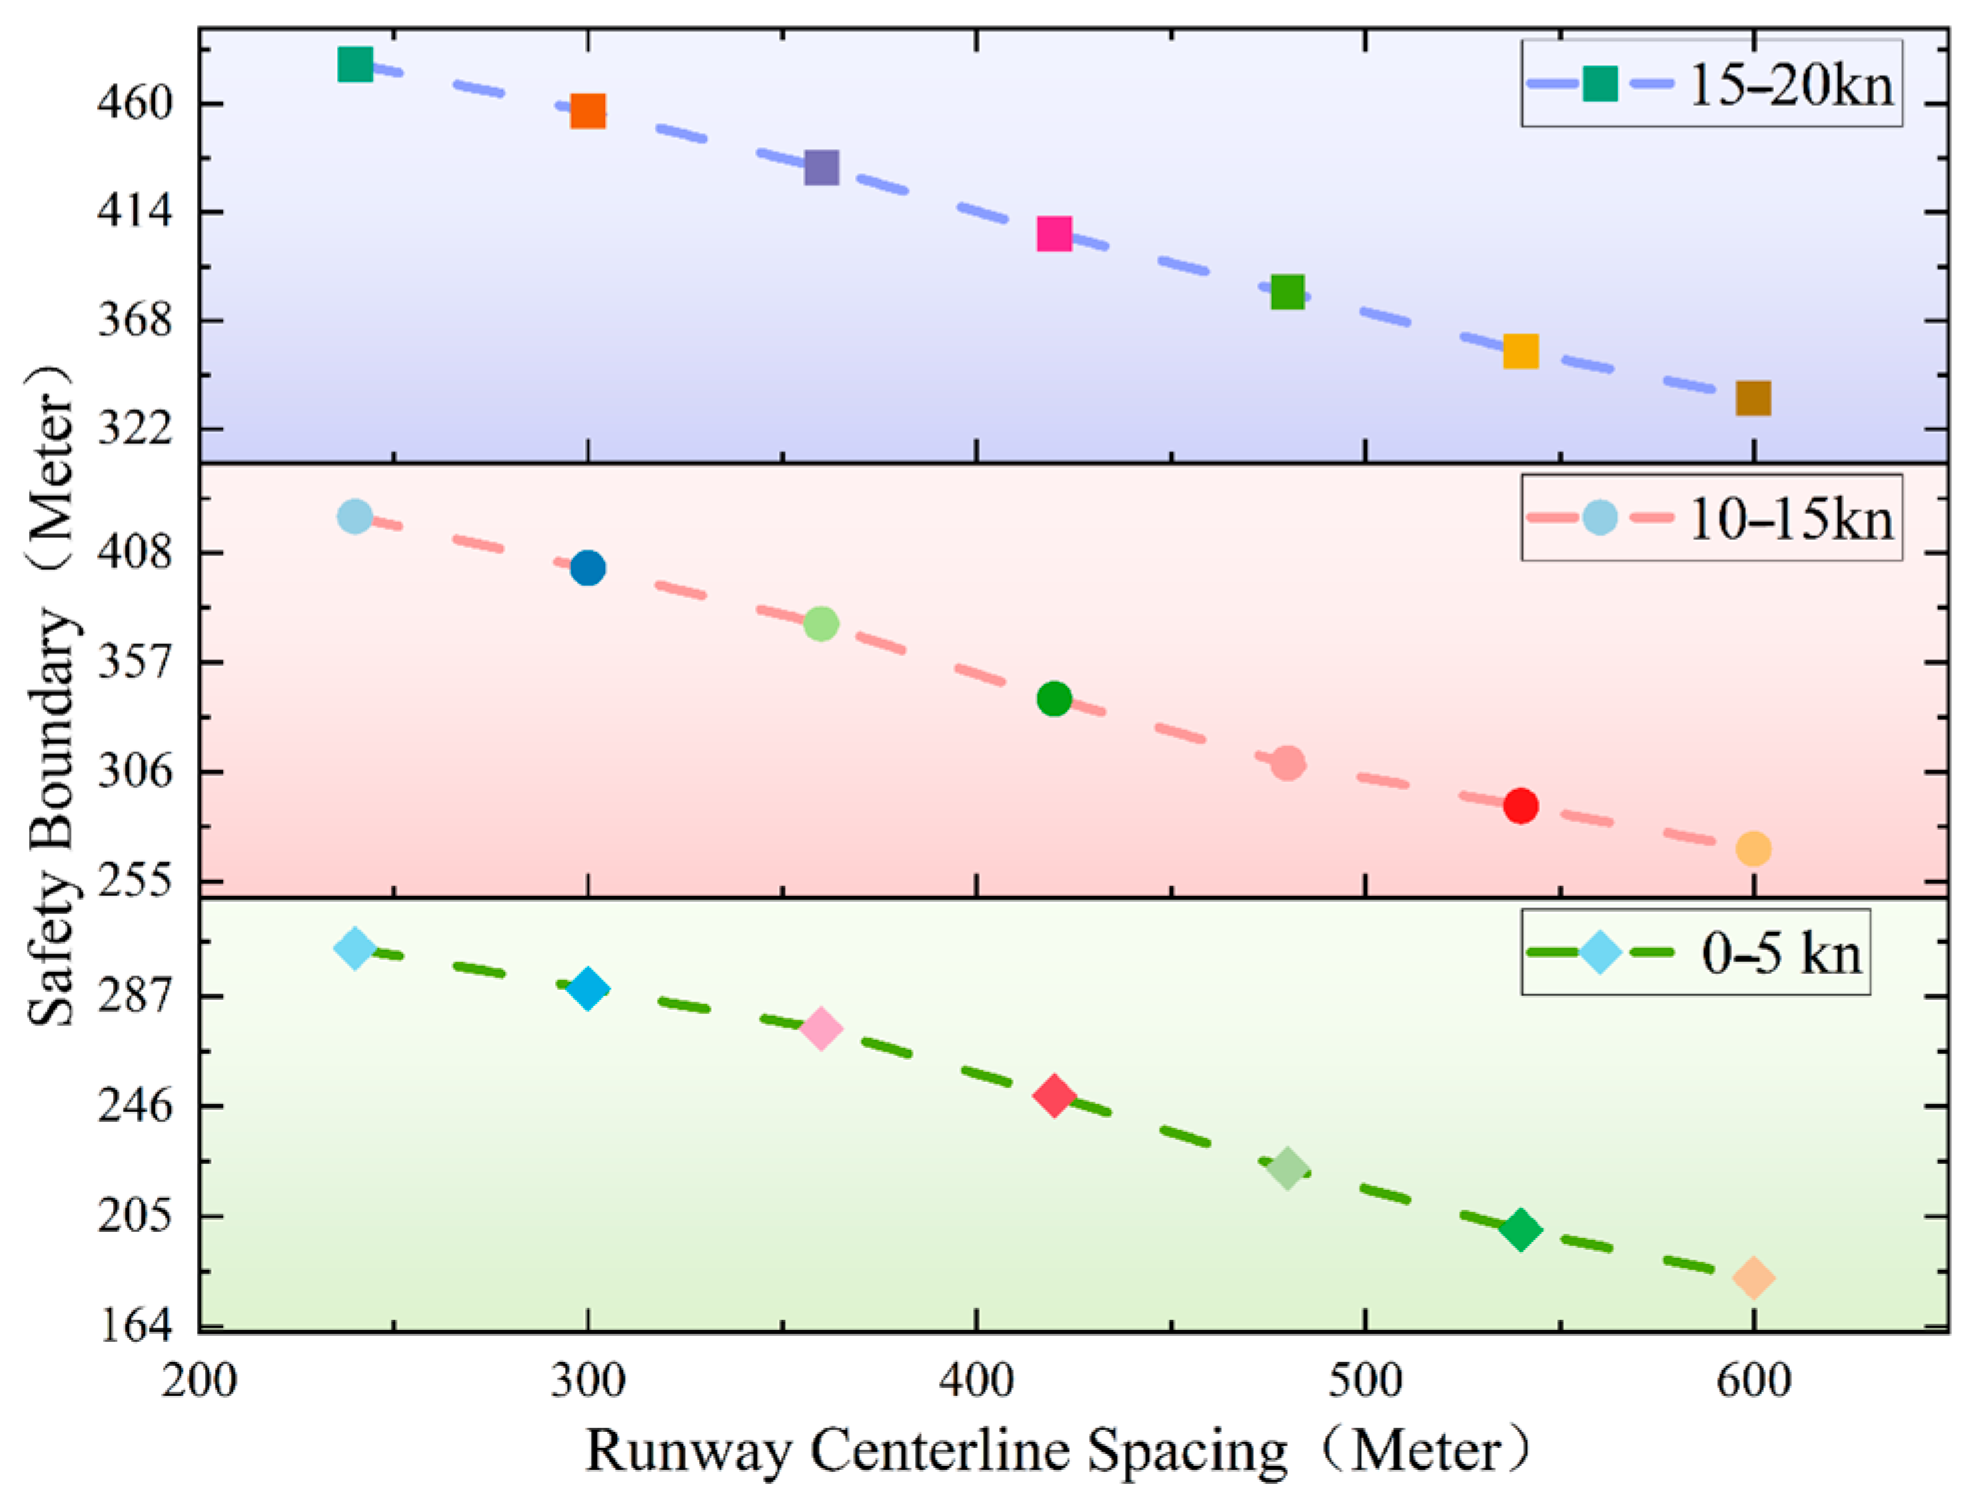
4.4. Analysis of Other Factors
5. Conclusions
Author Contributions
Funding
Data Availability Statement
Conflicts of Interest
Abbreviations
| MC | Monte Carlo |
| EVT | Extreme value theory |
| CAAC | Civil Aviation Administration of China |
| ICAO | International Civil Aviation Organization |
| ADS-B | Automatic Dependent Surveillance-Broadcast |
| PBN | Performance-based navigation |
| FAA | Federal Aviation Administration |
| CRA | Collision risk assessment |
| BMA | Block Maxima Approach |
| TLS | Target Level of Safety |
| FAF | Final Approach Fix |
| MLE | Maximum likelihood estimation |
| POT | Peaks Over Threshold |
References
- Andy, L.J.G.; Alam, S.; Lilith, N.; Piplani, R. A deep reinforcement learning approach for Runway Configuration Management: A case study for Philadelphia International Airport. J. Air Transp. Manag. 2024, 120, 102672. [Google Scholar] [CrossRef]
- International Civil Aviation Organization. Manual on Simultaneous Operations on Parallel or Near-Parallel Instrument Runways (SOIR); International Civil Aviation Organization: Montreal, QC, Canada, 2004. [Google Scholar]
- Civil Aviation Administration of China. Regulations on Parallel Runway Simultaneous Instrument Operation Management; Civil Aviation Administration of China: Beijing, China, 2004. [Google Scholar]
- Chen, Y.; Zhao, Y.; Wu, Y. Recent progress in air traffic flow management: A review. J. Air Transp. Manag. 2024, 116, 102573. [Google Scholar] [CrossRef]
- Bone, R.S.; Olmos, B.O.; Mundra, A. Paired Approach Operational Concept. In Proceedings of the Digital Avionics Systems, IEEE, Daytona Beach, FL, USA, 14–18 October 2001; pp. 1–14. [Google Scholar]
- Pang, K.; Cai, L.; Qiao, Y.; Liu, Y.; Wang, G. Analysis of dual-runway collision risk in an independent parallel approach mode. J. Transp. Inf. Saf. 2019, 2, 18–24. [Google Scholar]
- Lv, Z.; Li, Y.; Zhang, Z. Study on paired approach collision risk based on accident tree analysis. Sci. Technol. Ind. 2013, 4, 130–134. [Google Scholar]
- Wang, L. Study on simultaneous approach collision risk under yaw condition. Flight Dyn. 2018, 36, 35–38. [Google Scholar]
- Lu, F.; Zhu, N.; Yang, S.; Zhang, Z.; Liu, B. Assessment of lateral collision risk in closed spaced parallel runways paired approach. China Saf. Sci. J. 2016, 26, 87–92. [Google Scholar]
- Wang, L.; Wei, F. The parallel runway collision risk in the instrument approach mode. J. Air Force Eng. Univ. (Nat. Sci. Ed.) 2018, 19, 15–19. [Google Scholar]
- Cheng, T.; Cui, D. Independent running conflict alarm algorithm for parallel runway based on differential games. J. Tsinghua Univ. Sci. Technol. 2004, 10, 1352–1355. [Google Scholar]
- Irvine, D.; Budd, L.C.; Pitfield, D.E. A Monte-Carlo approach to estimating the effects of selected airport capacity options in London. J. Air Transp. Manag. 2015, 42, 1–9. [Google Scholar] [CrossRef]
- Yang, H. Research on Safety Separation of Paired Approach to Closely Spaced Parallel Runways Based on Monte Carlo Method. Master’s Thesis, Civil Aviation Flight University of China, Deyang, China, 2023. [Google Scholar]
- Wang, F.; Zhao, L. Capacity evaluation method for parallel runway based on monte carlo simulation. In Proceedings of the 2018 Chinese Control and Decision Conference (CCDC), IEEE, Shenyang, China, 9–11 June 2018; pp. 5411–5415. [Google Scholar]
- Chen, Y.; Yang, H.; He, X.; Gao, H.; Zhao, R.; Sun, W. Research on Safety Separation Distance in Paired Approach Based on Monte Carlo Simulation. Int. J. Comput. Intell. Syst. 2024, 17, 265. [Google Scholar] [CrossRef]
- Wei, Z.; He, Q.; Zhou, Q.; Wang, G. Measuring dependence structure and extreme risk spillovers in stock markets: An Aparch-Evt-Dmc approach. Phys. A Stat. Mech. Its Appl. 2023, 632, 129357. [Google Scholar] [CrossRef]
- Li, M.; Zhou, J.; Sheng, K.; Guan, B.; Gu, H.; Jiang, J. Radiomics of intrathrombus and perithrombus regions for Post-EVT intracranial hemorrhage risk Prediction: A multicenter CT study. Eur. J. Radiol. 2024, 178, 111653. [Google Scholar] [CrossRef] [PubMed]
- FAA. Separation Requirements for Triple Simultaneous Independent Close Parallel Approaches-High Update Rate Surveillance Not Required; DOT-FAA-AFS-400-85; FAA: Washington, DC, USA, 2014. [Google Scholar]
- FAA. Traffic Alert and Collision Avoidance Aystem (TCAS) and Precision Runway Monitor (PRM) Collision Risk Differences in the Closely Spaced Approach Environment; DOT-FAA-AFS-420-90; FAA: Washington, DC, USA, 2001. [Google Scholar]
- Blom, H. Air Traffic Complexity and the Interacting Particle System Method: An Integrated Approach for Collision Risk Estimation. In Proceedings of the 2011 American Control Conference, San Francisco, CA, USA, 29 June–1 July 2011. [Google Scholar]
- Henry, M. A Monte Carlo Simulation for Evaluating Airborne Collision Risk in Intersecting Runways; American Institute of Aeronautics and Astronautics: Reston, VA, USA, 2010. [Google Scholar]
- Minimalism, S.V.; McNeil, G.C.; Gene, N. Frequency and severity of deviations during simultaneous independent approaches to parallel runways. In Herdsman. In Proceedings of the Integrated Communications, Navigation Chancellorsville Conference (ICNS), Herndon, VA, USA, 11–13 May 2010; p. 24. [Google Scholar]
- Coles, S. An Introduction to Statistical Modeling of Extreme Values; Springer Series in Statistics: Berlin/Heidelberg, Germany, 2001. [Google Scholar]
- Ankunda, A.; Ali, Y.; Mohanty, M. Pedestrian crash risk analysis using extreme value models: New insights and evidence. Accid. Anal. Prev. 2024, 203, 107633. [Google Scholar] [CrossRef]
- Gnedenko, B. Sur la distribution limite du terme maximum d’une serie aleatoire. Ann. Math. 1943, 44, 423–453. [Google Scholar] [CrossRef]
- Saeed Far, S.; Abd Wahab, A.K. Evaluation of peaks-over-threshold method. Ocean. Sci. Discuss. 2016, 47, 1–25. [Google Scholar]
- Del Castillo, J.; Daoudi, J. Estimation of the generalized Pareto distribution. Stat. Probab. Lett. 2009, 79, 684–688. [Google Scholar] [CrossRef]
- Davison, A.C.; Smith, R.L. Models for exceedances over high thresholds. J. R. Stat. Soc. Ser. B 1990, 52, 393–442. [Google Scholar] [CrossRef]
- Dey, A.K.; Das, K.P. Modeling extreme hurricane damage using the generalized Pareto distribution. Am. J. Math. Manag. Sci. 2016, 35, 55–66. [Google Scholar] [CrossRef]
- Schmidt, F.; Zhou, X.Y.; Toutlemonde, F.A. Peaks-over-threshold analysis of extreme traffic load effects on bridges. In Proceedings of the Young Research Seminar 2013, Lyon, France, 5–7 June 2013; p. 13. [Google Scholar]
- Hewett, N.; Fawcett, L.; Golightly, A.; Thorpe, N. Using extreme value theory to evaluate the leading pedestrian interval road safety intervention. Stat 2024, 13, e676. [Google Scholar] [CrossRef]
- Balkema, A.A.; De Haan, L. Residual life time at great age. Ann. Probab. 1974, 2, 792–804. [Google Scholar] [CrossRef]
- Pickands, J., III. Statistical inference using extreme order statistics. Ann. Stat. 1975, 3, 119–131. [Google Scholar]
- Casella, G.; Berger, R.L. Chapter 10: Asymptotic Theory, Section on Asymptotic Properties of MLEs. In Statistical Inference, 2nd ed.; Duxbury Press: Duxbury, MA, USA, 2002. [Google Scholar]
- Idris, H.R.; Clarke, J.P.; Bhuva, R.; Kang, L. Queuing model for taxi-out time estimation. Air Traffic Control. Q. 2002, 10, 1–22. [Google Scholar] [CrossRef]
- Thiel, C. Untersuchung der Navigationsgenauigkeiten von Luftfahrzeugen im Flughafennahbereich-Modellierung und Implementierung Dreidimensionaler Verteilungsfunktionen unter Berücksichtigung der Navigationsinfrastruktur an Großen Verkehrsflughäfen. Ph.D. Thesis, TU Berlin, Berlin, Germany, 2009. [Google Scholar]
- Jovanovic, B.D.; Levy, P.S. A look at the rule of three. Am. Stat. 1997, 51, 137–139. [Google Scholar] [CrossRef]


| Type | Speed | Deceleration −m/s2 | |
|---|---|---|---|
| kn | m/s | ||
| Heavy | 140–165 | 72–85 | 0.06 |
| Medium | 120–140 | 61–72 | 0.05 |
| Light | 91–120 | 47–61 | 0.03 |
| Coss Section Window | Threshold Distance [m] | Lateral | Vertical | ||
|---|---|---|---|---|---|
| Section 1 | 0 m | 1.156 | 7.343 | 1.035 | 6.479 |
| Section 2 | 1000 m | 9.847 | 10.932 | 1.119 | 6.255 |
| Section 3 | 2000 m | 23.654 | 13.181 | 1.594 | 7.153 |
| Section 4 | 3000 m | 18.611 | 13.746 | 2.005 | 7.718 |
| Section 5 | 4000 m | 19.893 | 17.951 | 3.653 | 9.031 |
| Section 6 | 5000 m | 10.107 | 15.433 | 3.325 | 9.126 |
| Section 7 | 6000 m | −1.124 | 15.991 | 2.649 | 8.891 |
| Section 8 | 7000 m | −7.473 | 19.135 | 1.809 | 10.611 |
| Section 9 | 8000 m | −10.667 | 19.012 | 1.825 | 14.003 |
| Section 10 | 9000 m | −17.698 | 24.173 | 2.192 | 14.543 |
| Section 11 | 10,000 m | −16.295 | 25.981 | 1.461 | 16.912 |
| Section 12 | 11,000 m | −14.473 | 30.736 | −1.014 | 19.235 |
| Section 13 | 12,000 m | −17.512 | 35.841 | 1.521 | 20.012 |
| Parameter | Values |
|---|---|
| Velocity | 150 kn |
| Deviation Angle | 30° |
| Avoidance angle | 45° |
| Error deviation rate | 1/24,000 |
| Reaction and Communication Time | 8.5 s |
| NTZ width | 610 m |
| Runway centerline spacing | 1036 m |
| Collision distance limit | 153 m |
| Properties | Detailed Properties |
|---|---|
| The ratio of heavy, medium, and light aircraft | ①1:0:0; ②1.5%:97%:1.5%; ③0:0:1 |
| Speed and deceleration | Refer to Table 1 |
| Runway centerline spacing | 400 m~700 m, 1036 m~1500 m |
| NTZ width | 610 m (widely spaced parallel runway) |
| The final approach segment | 600 m high and 12 km long from the runway threshold |
| Arrival law | Poisson distribution, 20/per hour |
| Deviation angle | α~(30°, 52), αmax~35°, αmin~25° |
| Error deviation rate | 1/24,000 |
| Departure point | FAF to any point 2 km before the runway threshold |
| Avoidance angle | α~(45°, 52), αmax~50°, αmin~40° |
| Avoidance acceleration | 0.514 m/s2 |
| The relative position | Located at 0~3 km in the longitudinal direction behind the deviation (widely spaced runway) |
| Response time | From the aircraft deviation order to the pilot receiving the command: 8~12 s |
| Safety zone | 445 m–3891 m (short runway) [15] |
| The actual approach deviation | The probability distribution is shown in Table 4 |
| Collision distance limit | 153 m |
| Safety target level | 5 × 10⁻⁹ |
| Runway Centerline Spacing | Collision Risk Probability |
|---|---|
| 1100 | 1.667 × 10⁻¹⁰ |
| 1300 | 8.333 × 10⁻¹¹ |
| 1500 | 4.167 × 10⁻¹¹ |
| 1700 | 1.25 × 10⁻¹² |
| The Proportion of Heavy, Medium, and Light Aircrafts | Collision Risk Probability |
|---|---|
| 1:0:0 | 4.167 × 10⁻¹⁰ |
| 1.5%:97%:1.5% | 1.05 × 10⁻⁹ |
| 0:0:1 | 8.333 × 10⁻¹⁰ |
Disclaimer/Publisher’s Note: The statements, opinions and data contained in all publications are solely those of the individual author(s) and contributor(s) and not of MDPI and/or the editor(s). MDPI and/or the editor(s) disclaim responsibility for any injury to people or property resulting from any ideas, methods, instructions or products referred to in the content. |
© 2025 by the authors. Licensee MDPI, Basel, Switzerland. This article is an open access article distributed under the terms and conditions of the Creative Commons Attribution (CC BY) license (https://creativecommons.org/licenses/by/4.0/).
Share and Cite
Li, Y.; Zhang, H.; Shi, Z.; Zhou, J.; Li, W. Safety Assessment Method for Parallel Runway Approach Based on MC-EVT for Quantitative Estimation of Collision Probability. Aerospace 2025, 12, 396. https://doi.org/10.3390/aerospace12050396
Li Y, Zhang H, Shi Z, Zhou J, Li W. Safety Assessment Method for Parallel Runway Approach Based on MC-EVT for Quantitative Estimation of Collision Probability. Aerospace. 2025; 12(5):396. https://doi.org/10.3390/aerospace12050396
Chicago/Turabian StyleLi, Yike, Honghai Zhang, Zongbei Shi, Jinlun Zhou, and Wenqing Li. 2025. "Safety Assessment Method for Parallel Runway Approach Based on MC-EVT for Quantitative Estimation of Collision Probability" Aerospace 12, no. 5: 396. https://doi.org/10.3390/aerospace12050396
APA StyleLi, Y., Zhang, H., Shi, Z., Zhou, J., & Li, W. (2025). Safety Assessment Method for Parallel Runway Approach Based on MC-EVT for Quantitative Estimation of Collision Probability. Aerospace, 12(5), 396. https://doi.org/10.3390/aerospace12050396