Article

Integrated Aircraft Engine Energy Management Based on Game Theory

1
Sino-European Institute of Aviation Engineering, Civil Aviation University of China, Tianjin 300300, China
2
Eastern Airlines Technology Co., Ltd., Shanghai 200050, China
*
Author to whom correspondence should be addressed.
Aerospace 2025, 12(4), 328; https://doi.org/10.3390/aerospace12040328
Submission received: 6 March 2025 / Revised: 6 April 2025 / Accepted: 8 April 2025 / Published: 10 April 2025
(This article belongs to the Special Issue Aircraft Design and System Optimization)

Abstract

:
The current generation of integrated power systems is represented by the Adaptive Power and Thermal Management System (APTMS). The coupled performance between the APTMS and the aircraft engine significantly increases the difficulty of energy management and optimization. This article establishes an energy-coupled Amesim model of the APTMS and the aircraft engine to analyze performance conflicts. Energy optimization based on the Stackelberg game model is established, with the aircraft engine as the leader and the APTMS as the follower. The Adaptive Chaotic Particle Swarm Optimization (ACPSO) algorithm is introduced to search for the game equilibrium solution. Simulation results indicate that this energy management strategy can achieve equilibrium and alleviate performance conflict. In flight, the optimal strategy depends on thrust–fuel flow characteristics and cooling power demand. Finally, compared with the multi-objective optimization algorithm MOPSO and the non-cooperative Cournot game model, the advantages of this energy management system based on the Stackelberg game are verified.

1. Introduction

An aircraft’s energy system is designed to extract energy from the primary engine, either through shaft power off-take or bleed air, to attain the necessary power and energy for the operation of onboard equipment. This system plays a crucial role in maintaining the functionality and reliability of the aircraft’s various systems, ensuring their normal and efficient performance throughout flight [1]. The process of extracting energy from the aircraft engine can influence several performance parameters, including the fuel consumption rate. Moreover, the method of energy extraction—whether through shaft power, bleed air, or other means—and the specific operating conditions under which it occurs can lead to markedly different effects on engine performance [2,3].
Secondary energy involves generation, conversion, regulation, distribution, and transportation. Aircraft systems and aircraft engines are evolving towards physical and energy integration stages. Ref. [4] addressed the formation of integrated secondary power systems. The current generation of integrated power systems is represented by the Adaptive Power and Thermal Management System (APTMS), which integrates an energy extraction system, auxiliary and emergency power system, and environmental control system. Unlike Power and Thermal Management Components (T/EMMs), the APTMS can adjust its operating mode according to different flight situations, automatically select the optimal power source, and thus achieve the goal of maximum integrated efficiency and minimum fuel costs [5].
Adaptive Power and Thermal Management Systems (APTMSs) and aircraft engines may exhibit performance trade-offs under different operating conditions, such as T/O and cruise scenarios. Current research on APTMSs has primarily focused on investigating the performance impacts of various flight conditions and energy extraction settings on aircraft engines and the APTMS [6,7,8,9]. According to prior research, we identified two primary challenges in the energy management of the APTMS. (1) The APTMS is deeply integrated with aircraft engine operations, making it infeasible to design APTMS strategies in isolation without dynamically considering the engine’s operational status. (2) Under varying flight conditions, the APTMS must be automated with real-time/on-demand evaluation mechanisms to achieve the efficient allocation of multi-energy resources. Due to these challenges, current research has primarily focused on optimizing APTMS parameters [10] and solely maximizing the engine economy [11]. The independent optimization objectives and conflicts that arise make it impossible to obtain optimal solutions for both challenges simultaneously. This constitutes a multi-objective optimization problem [12]. This problem has been given limited attention.
Game theory primarily explores scenarios where multiple interest-bearing entities are in conflict, with each entity making rational decisions based on the decisions of other participants and their own circumstances to achieve their objectives. In multi-energy management, game theory models can be introduced, where the effectiveness of a system depends not only on its own strategy but also on the strategies chosen by other relevant participants, thereby achieving equilibrium in their strategy and maximizing performance [13,14]. In game models of integrated energy systems, the Stackelberg game model, which distinguishes between leaders and followers, is widely applied. Through adopting the Stackelberg game model, multi-objective optimization problems can be effectively transformed into nested single-objective optimization problems. Therefore, the Stackelberg game model is extensively used in research areas such as distributed micro-grid energy management [15,16], the optimization of energy supply benefits for renewable energy producers [17,18], the optimization of operational strategies in integrated energy systems [14,19], and decision support [20,21], among others. These areas typically involve multiple coupled systems, multi-energy allocation, and conflicts among participants’ performance, benefits, and efficiency. The APTMS and aircraft engine conform to the aforementioned characteristics; their operational states are mutually influential, exhibit performance conflicts, involve exchanging key variable information, and demonstrate dynamic adjustments with flight conditions. As an energy supplier (the aircraft engine) and an energy consumer (the APTMS) with an asymmetric relationship, their hierarchical interaction is appropriately modeled using a Stackelberg game.
Sustainable energy sources and associated aviation technology will be widely adopted in aircraft, particularly commercial aviation. Key technologies such as liquid hydrogen fuel [22,23], high-energy-density batteries [24], and electrical propulsion [25,26] are expected to drive the decarbonization of air transport while balancing performance and operational feasibility. The energy management of sustainable energy involves multiple energy sources, where each source can function as either an energy supplier or an energy user. This constitutes the most fundamental distinction from traditional energy management. However, with the increasing number of energy sources, traditional multi-objective optimization algorithms are extremely complex, and the computational overhead and long iteration times are significantly increased. The Stackelberg game can effectively mitigate this shortcoming.
This article investigates the energy management problem under the coupled operation of an APTMS and aircraft engine. A novel Stackelberg game-based energy management strategy is proposed and developed to achieve efficient energy allocation across different flight conditions while mitigating performance conflicts between subsystems. Under cruise flight conditions, this paper conducts simulation experiments and compares the proposed method with conventional multi-objective optimization approaches and the Cournot game model. The results demonstrate the superiority of the proposed approach in achieving more efficient energy allocation.

2. System Modeling

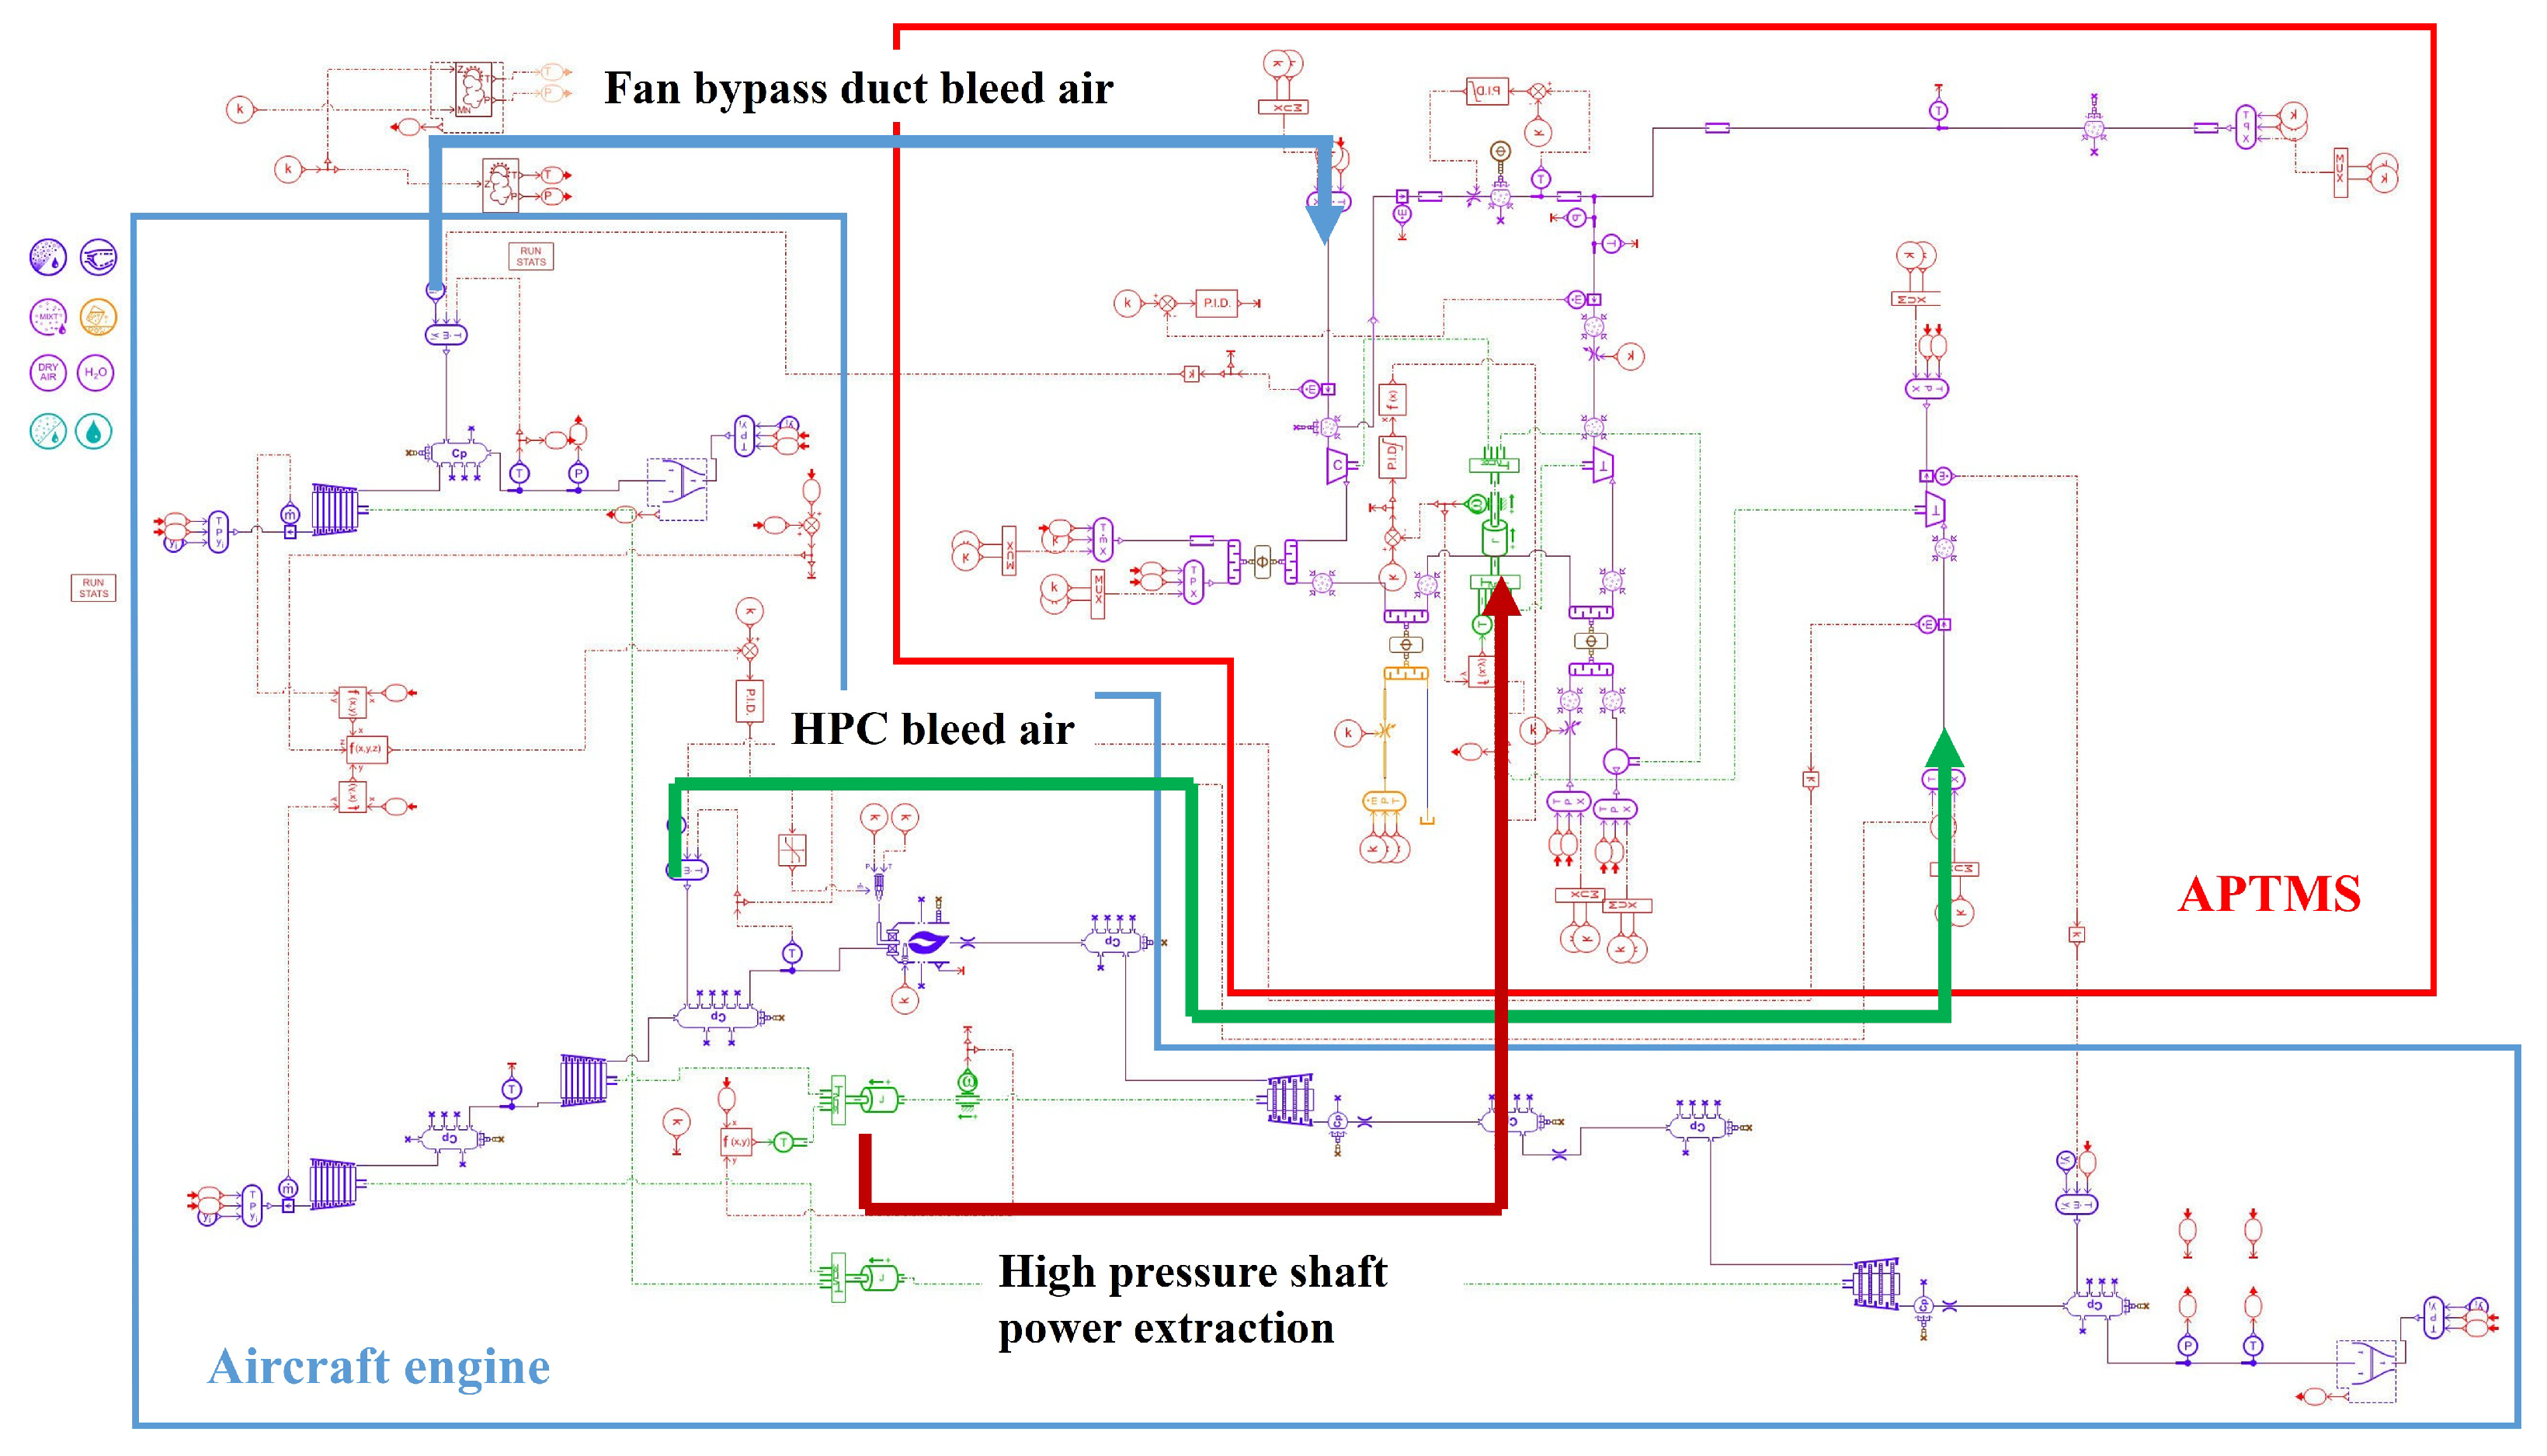
2.1. Aircraft Engine Modeling

The system architecture is shown in Figure 1. The integrated aircraft power model established in the text consists of two main parts: the aircraft engine and the APTMS system. The aircraft engine is the primary power source of the aircraft, mainly including the air intake, fan, compressor (HPC), combustion chamber, turbine, nozzle, and other accessory components. The Adaptive Power and Thermal Management System can be divided into two main parts: the cooling unit and the combine power unit. The cooling unit mainly includes an air compressor (C), a cooling turbine (CT), a multiple heat exchange, water separators, etc., which cool and depressurize high-temperature, high-pressure gases to provide cooling gases at the appropriate temperature for equipment bays and cabins. The combine power unit mainly consists of the integrated starter generator (ISG) and the power turbine (PT), which meet the electrical power demands of the electromechanical systems and provide energy for the cooling unit. Onboard electromechanical systems typically include hydraulic, electrical systems, and fuel control systems.
APTMS bleed air q 1 , q 2 , extracts shaft power W s h a f t from the aircraft engine and jointly produces W e , o u t and W a p t m s . W a p t m s drives the main shaft to rotate, generating cooling power Q c a b i n , Q e l e to meet the thermal load.
During the flight mission, the multi-source energy extraction system model is as follows. The combine power unit utilizes three methods to extract energy from the aircraft engine: fan duct bleed air, HPC bleed air, and HPC shaft power extraction. The cooling unit uses bleed air from the aircraft engine’s fan bypass duct as a cooling source. The APTMS system converts the shaft power drawn from the high-pressure shaft, output from the accessory gearbox of the aircraft engine, to electrical power using an integrated starter generator. Additionally, HPC bleed air drives the power turbine (PT) and input power to the APTMS rotor. The gas, after inflating and cooling in the power turbine, is merged into the main nozzle of the aircraft engine to compensate for some thrust loss. HPC bleed air and shaft power extraction meet the thermal management energy requirements of the APTMS system and the energy demands of the onboard electromechanical systems.
This aircraft engine modeling is based on a twin-spool, high-bypass-ratio, turbofan engine. Its architecture and multi-source energy extraction model are shown in Figure 2. Aircraft engines are composed of the following core components: intake assembly, fan (low-pressure compressor), high-pressure compressor, combustion chamber, high-pressure turbine, low-pressure turbine, exhaust nozzle, bypass Dduct, and associated energy extraction systems. It is a nonlinear system. First, individual components must be modeled separately and connected based on mass and energy conservation principles. Finally, the Newton–Raphson iterative method is used to solve. When the aircraft engine operates in a steady-state environment, it must meet the balance conditions for flow, pressure, and high/low-pressure shaft power. Eight balance equations are listed in Table 1.
Among them, m ˙ b y b represents the fan bypass bleed airflow rate and m ˙ c b represents the HPC bleed airflow rate; W s h a f t , e x represents the shaft power off-take.
The combustion chamber model can be represented by the following formula. ξ b represents the combustion efficiency, H f represents the lower heating value of the fuel, and σ represents the combustion chamber pressure ratio.
W 3 c p T 3 + W f H f ξ b + c p , f T f = W 4 c p T 4 P 4 = σ P 3
The economy of an aircraft engine is one of the indicators used to evaluate its performance, generally measured by the engine’s specific fuel consumption (SFC) and fuel flow, with units of kilograms per Newton-hour (g/(N · h)) and kilograms per second (kg/s). At a fixed thrust, the value of specific fuel consumption is the same as the value of fuel flow.

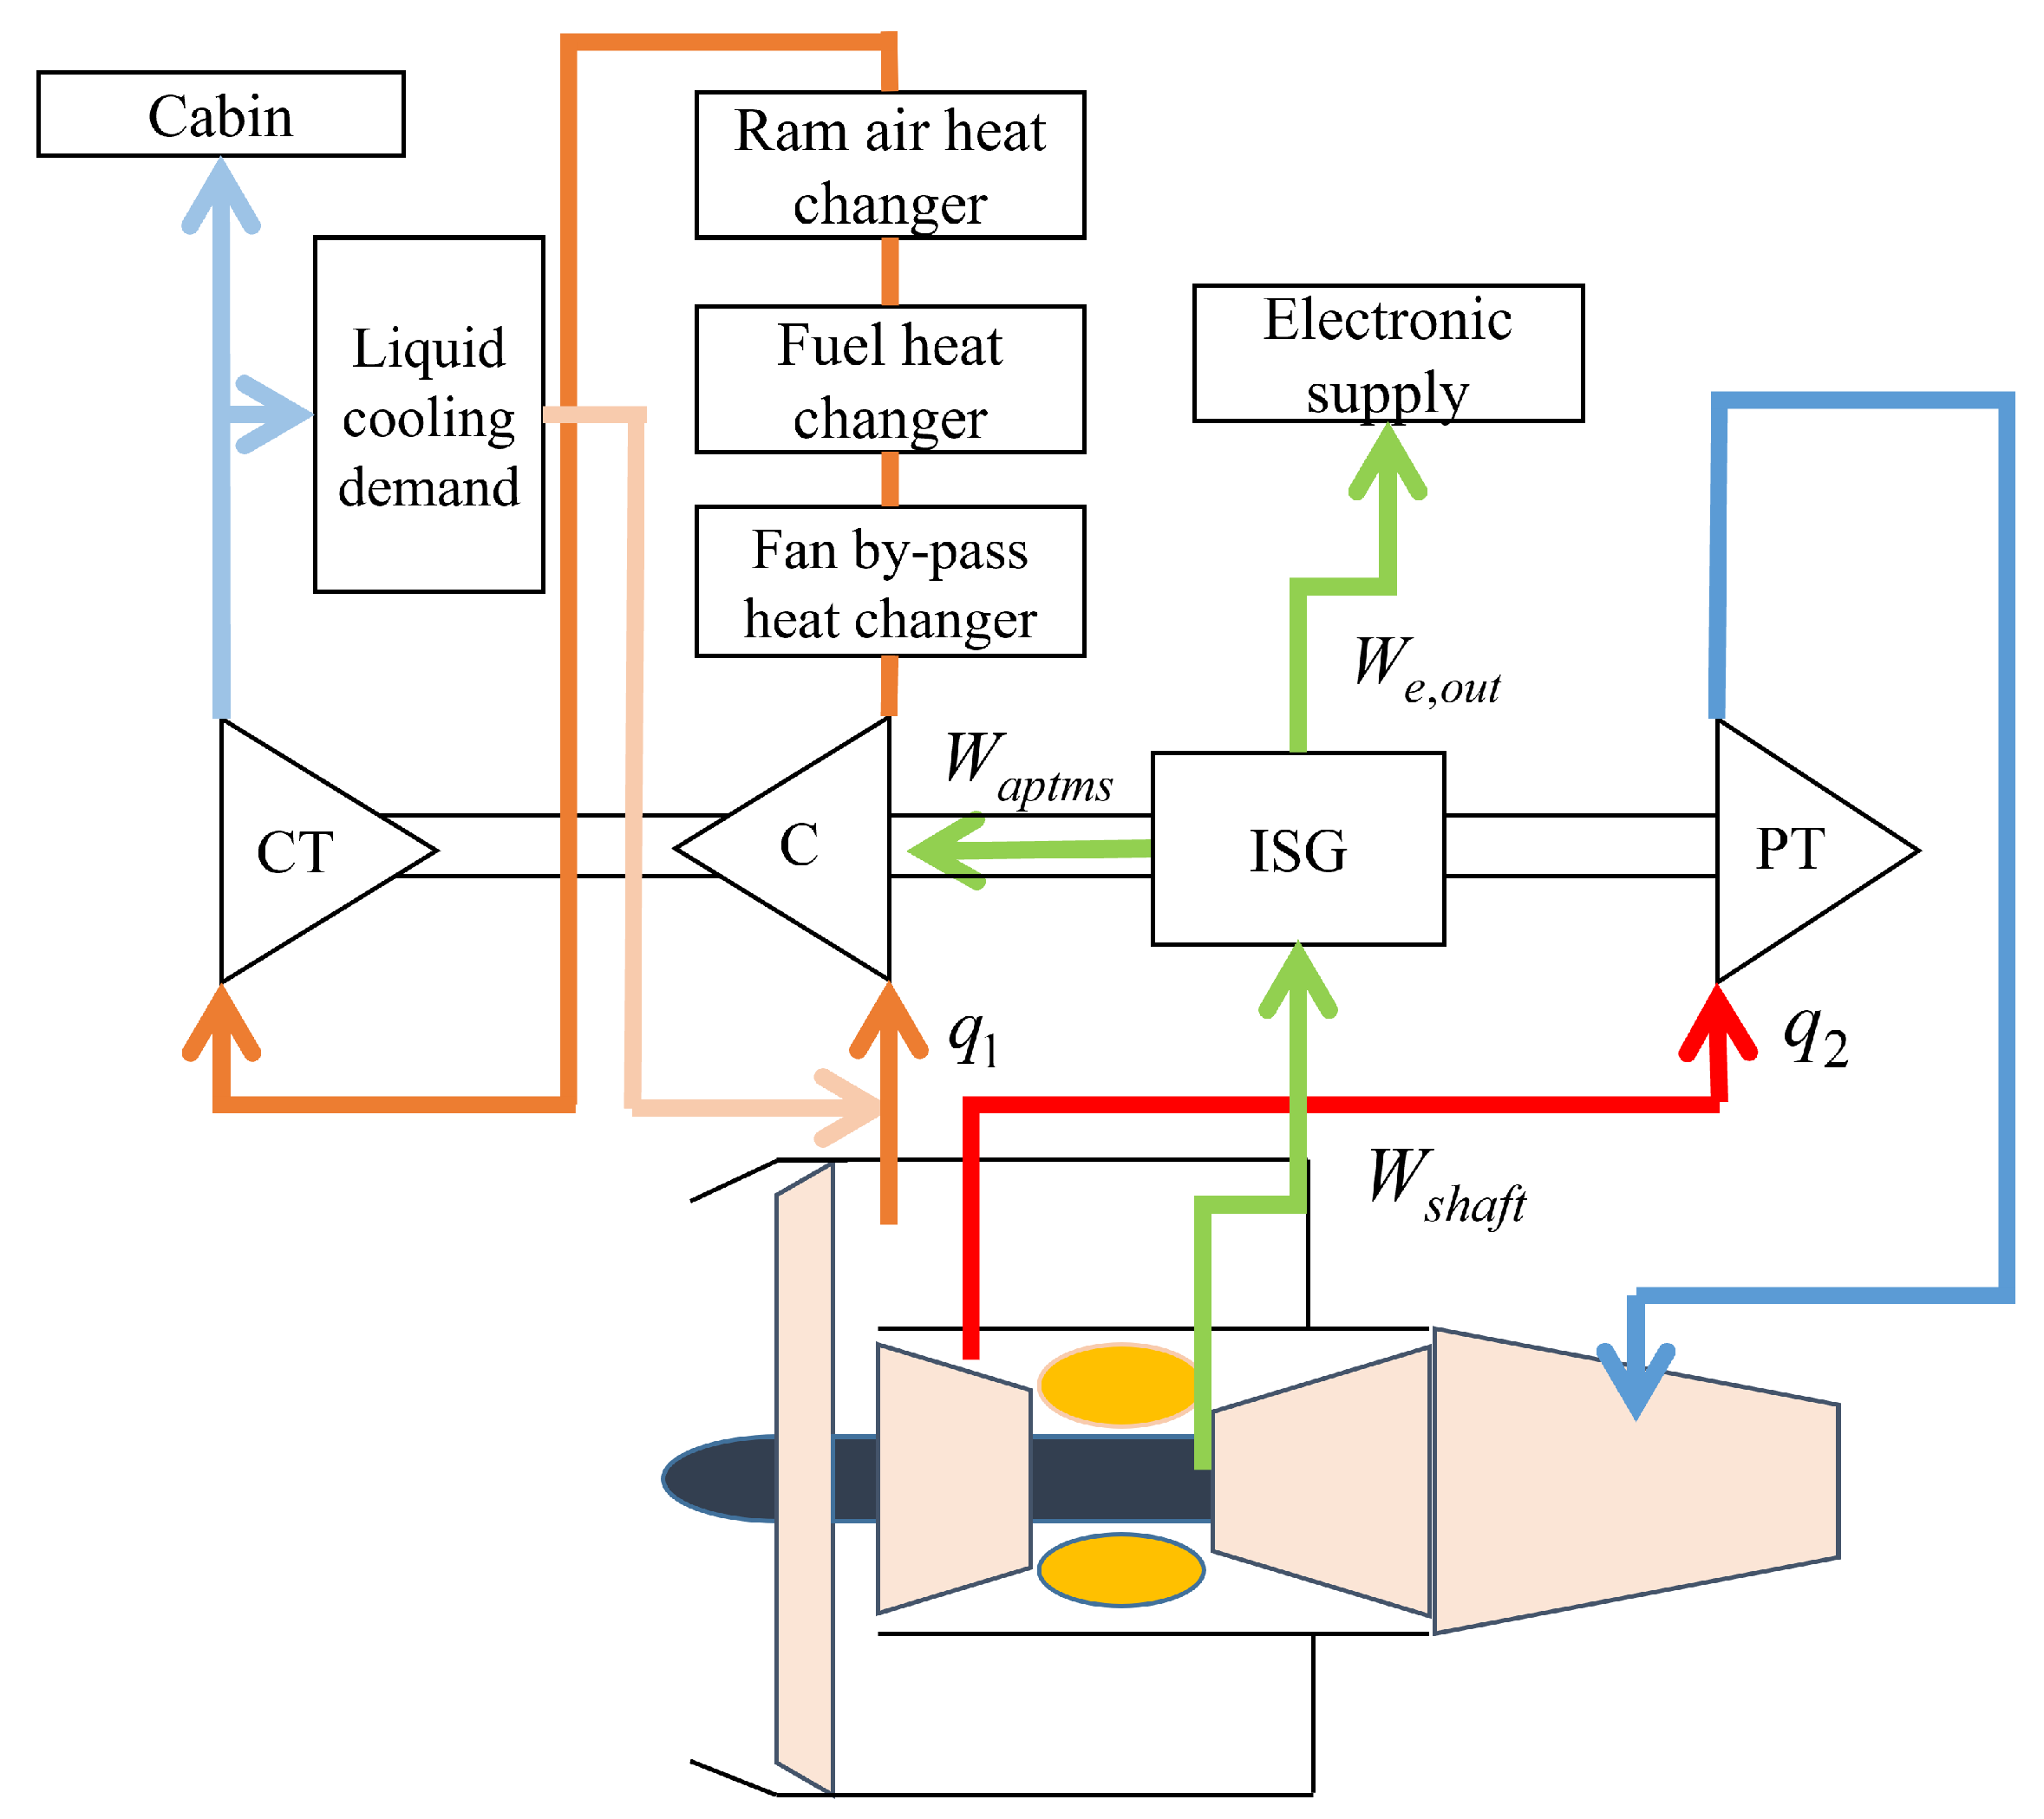
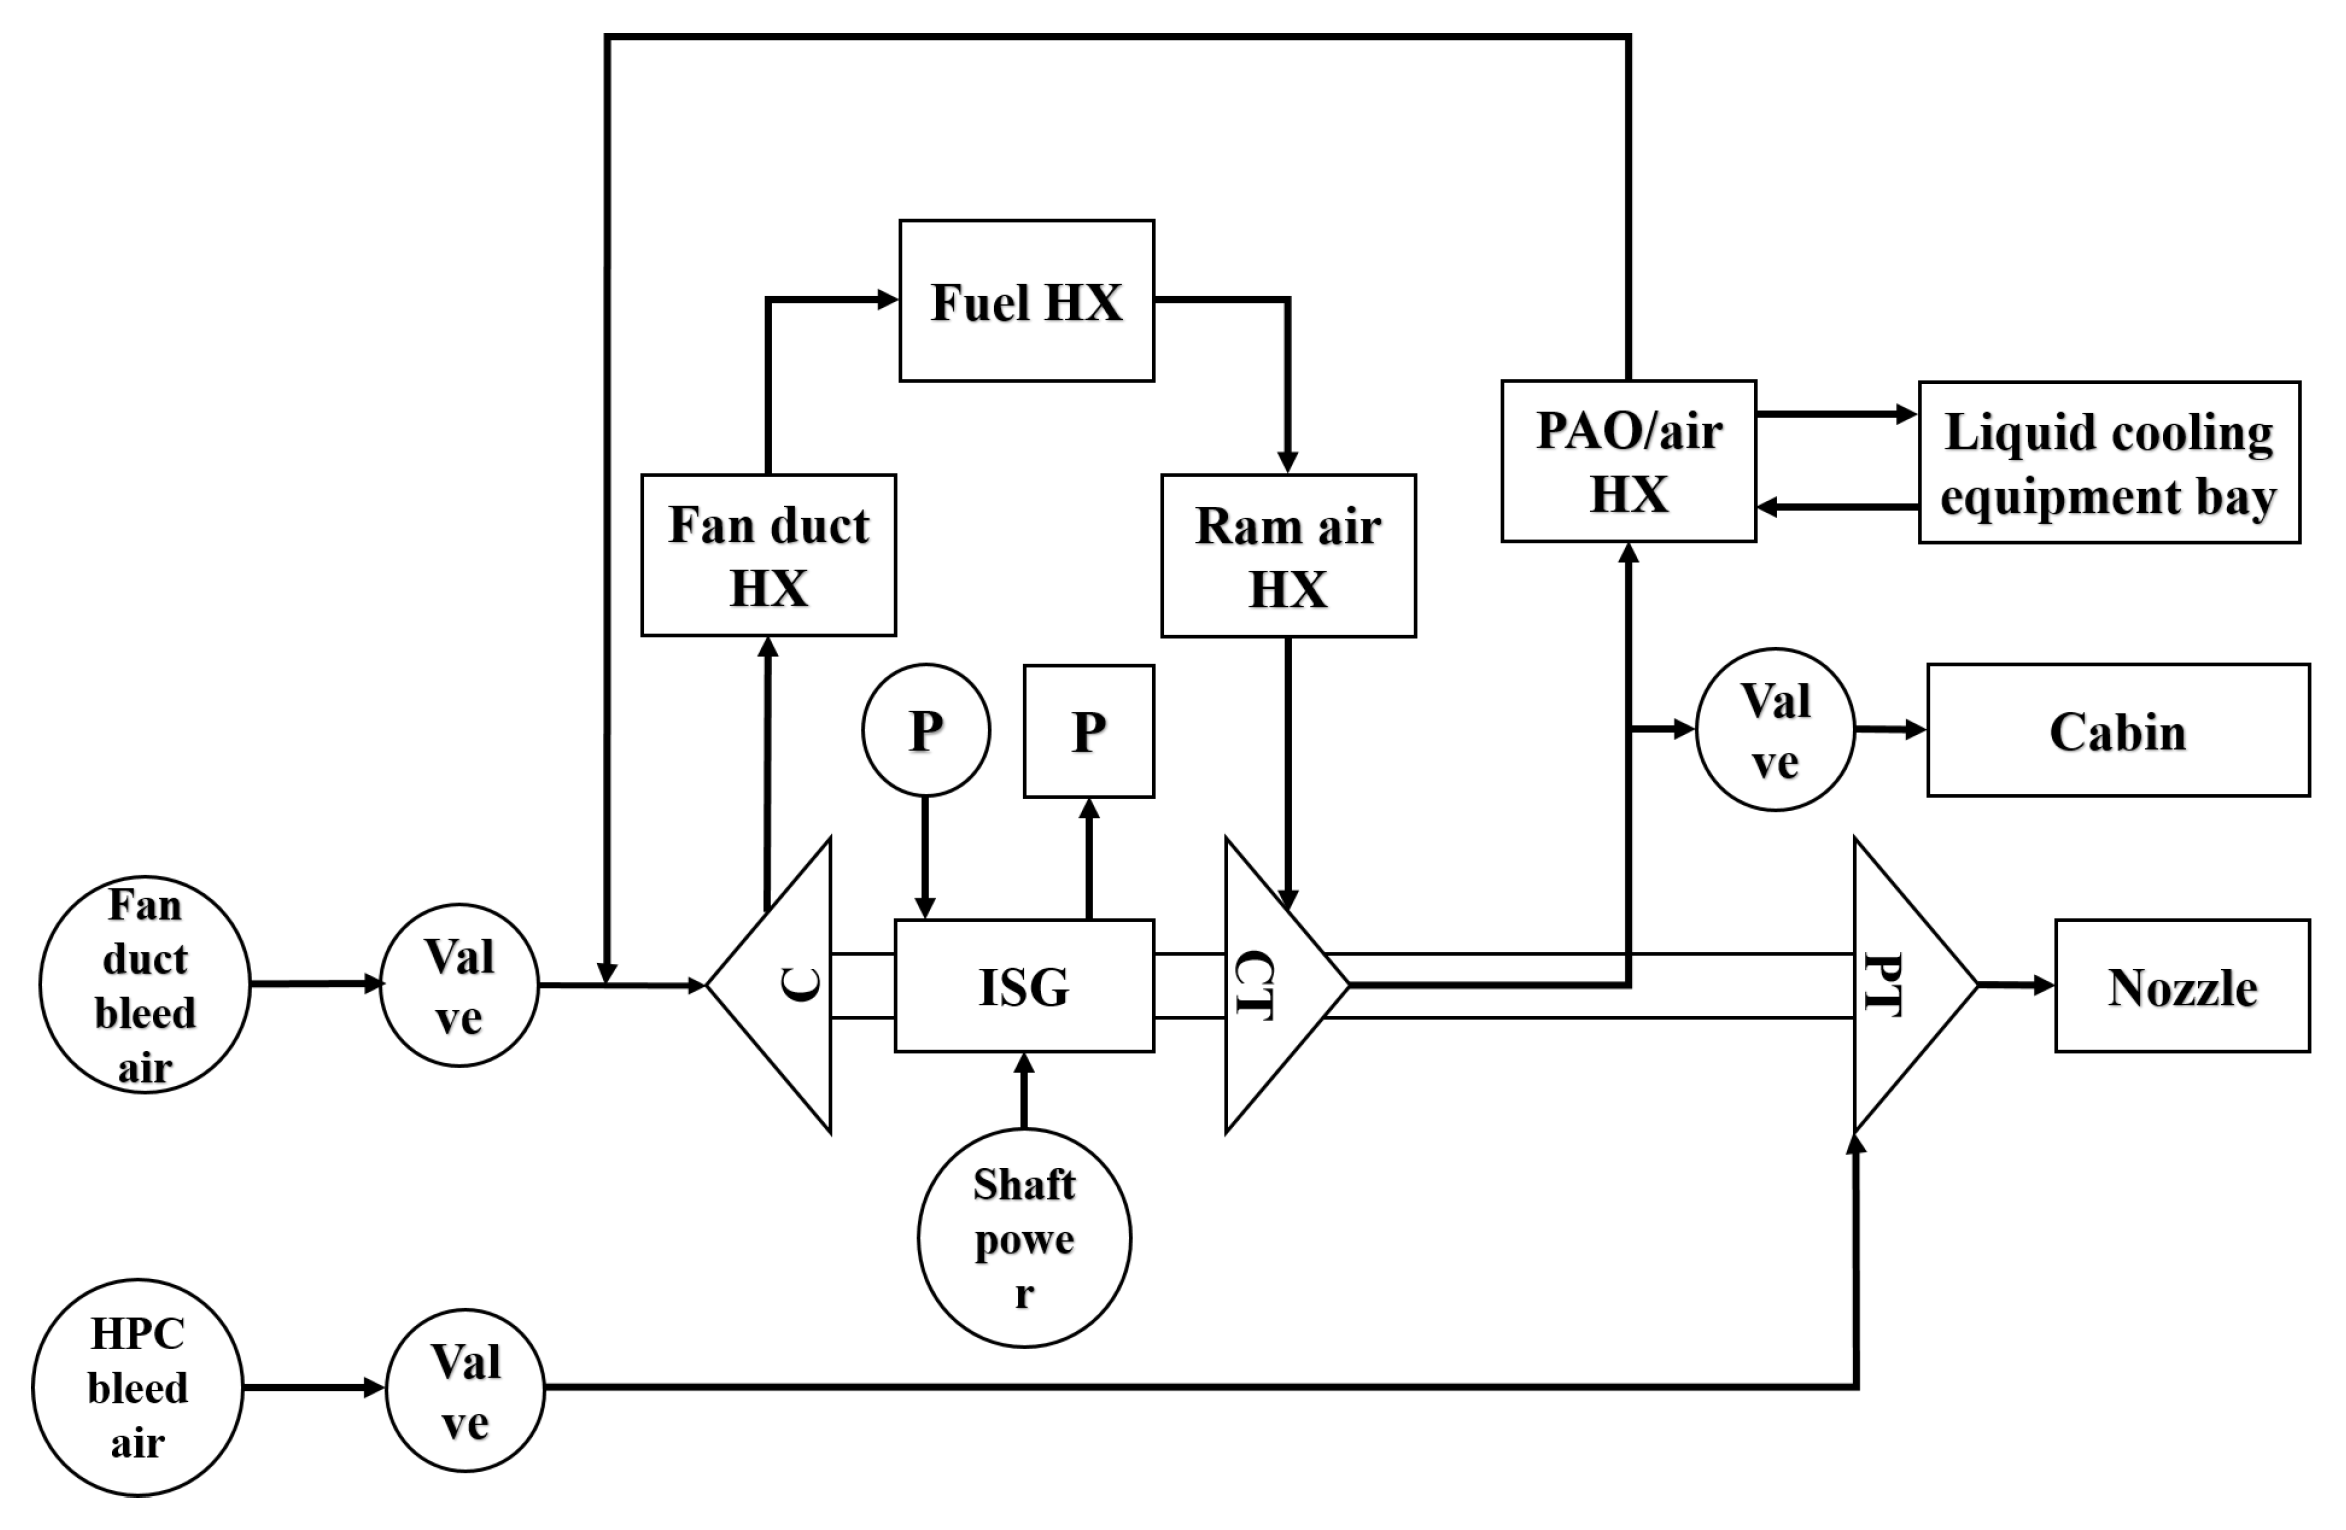
2.2. APTMS System Modeling

The APTMS is also a complex nonlinear system, which can be divided into a combine power unit and cooling unit based on functionality. The cooling unit includes the intake duct, compressor, heat exchange, and cooling turbine. The combine power unit includes the power turbine and the combined starter–generator. The cooling unit is connected to the combine power unit by the main shaft and rotates on the same axis. The structure is illustrated in Figure 3. Like the aircraft engine, it must satisfy the principles of energy conservation and mass conservation, and the Newton–Raphson iterative method is used to solve it. The energy balance conditions are shown in Equation (2).
W C + W s h a f t = W P T + W e , o u t + W C T
W represents the work; subscript C, s h a f t , P T , and C T represent that the work comes from compressor, high-pressure shaft, power turbine, and cooling turbine. W e , o u t represents the work provided to other electromechanical systems.
Conducting first law or second law of thermodynamics analyses in isolation can provide deep insights into the behavior of thermodynamic processes, yet neither can fully characterize the system’s processes in their entirety [27]. Exergy is defined as the maximum work a system can deliver when it equilibrates with its environment. Exergy loss is intrinsically linked to system efficiency, as it originates from exergy flow that exits the system without subsequent utilization [28]. The expression for exergy flow is as shown in Equation (3).
E ˙ x = d d t U + P 0 V l T 0 S + i = 1 n 1 T 0 T Q ˙ i + m ˙ h + u 2 2 + g z T 0 s
E x represents exergy; E ˙ x represents exergy flow; U represents the internal energy; T represents the system’s temperature; S represents the entropy; P represents the pressure; V l represents the system volume; Q represents the transferred heat; m ˙ represents the mass flow; h represents the enthalpy; u represents the velocity; z is the relative altitude; and g is the gravity acceleration. The subscript 0 denotes the environmental state.
From the energy conservation of the control volume, the expression for the loss of exergy can be derived as Equation (4)
E x d e s = E x o u t E x i n
E x d e x represents exergy destruction; E x o u t represents exergy outflow; and E x i n represents exergy inflow.
This article considers the APTMS system as a black-box model, neglecting internal components (e.g., compressors, turbines, and heat exchangers) and focusing solely on exergy inflow and outflow across the system boundary [28]. Exergy inflow to the APTMS system originates from the aircraft engine, including: (1) fan duct bleed air E x q 1 (2) high-pressure shaft power extraction for electricity generation E x s h a f t (3) HPC bleed air for driving power turbine E x q 2 . Exergy outflow of the APTMS comprises: (1) heat transfer to the fan duct via the fan duct heat exchanger E x Q f a n ; (2) heat transfer to fuel via the fuel heat exchanger E x Q f u e l ; (3) heat transfer to ram air via the ram air heat exchanger E x Q r a m ; (4) cooling power provided to the electrical equipment E x Q e l e ; (5) airflow provided to the cabin E x c a b i n ; and (6) electrical power provided to the entire aircraft’s electromechanical system. Exergy destruction can be represented as Equation (5).
E x d e s = E x q 1 + E x q 2 + E x s h a f t E x Q f a n E x Q f u e l E x Q r a m E x Q e l e E x c a b i n
The APTMS’s exergy efficiency can be represented as Equation (6). It quantifies the system’s capability to harness exergy potential while maintaining cooling performance requirements. In the APTMS, exergy destruction primarily originates from turbine/compressor isentropic efficiency losses, heat exchanger irreversibilities, pipeline frictional dissipation, and generator energy conversion inefficiencies. Improving exergy utilization efficiency minimizes energy waste, thereby reducing both fan duct bleed for thermal management and the power required to sustain system operation.
η E x = E x o u t E x i n = 1 E x d e s E x i n
Simcenter Amesim is a multidisciplinary complex system modeling and simulation platform developed by Siemens. It uses a graphical approach to describe the connections between various components in a system, reflecting the load effects between components and the flow of energy and power within the system.
The APMTS system and aircraft engine exhibit complex multi-physics energy interactions. Amesim2024 provides a series of hydraulic, pneumatic, thermal, and other model libraries that can effectively capture the mutual coupling and energy interactions during modeling, thereby facilitating the analysis of performance conflicts. Simulation using Amesim can obtain relatively accurate simulation results. The aforementioned modeling process is implemented and validated within Amesim2024, with the model shown in Figure 4. Some modeling parameters for the aircraft engine and APTMS system are provided in Table 2 as suggested by Francisco [29] and Lei [11].

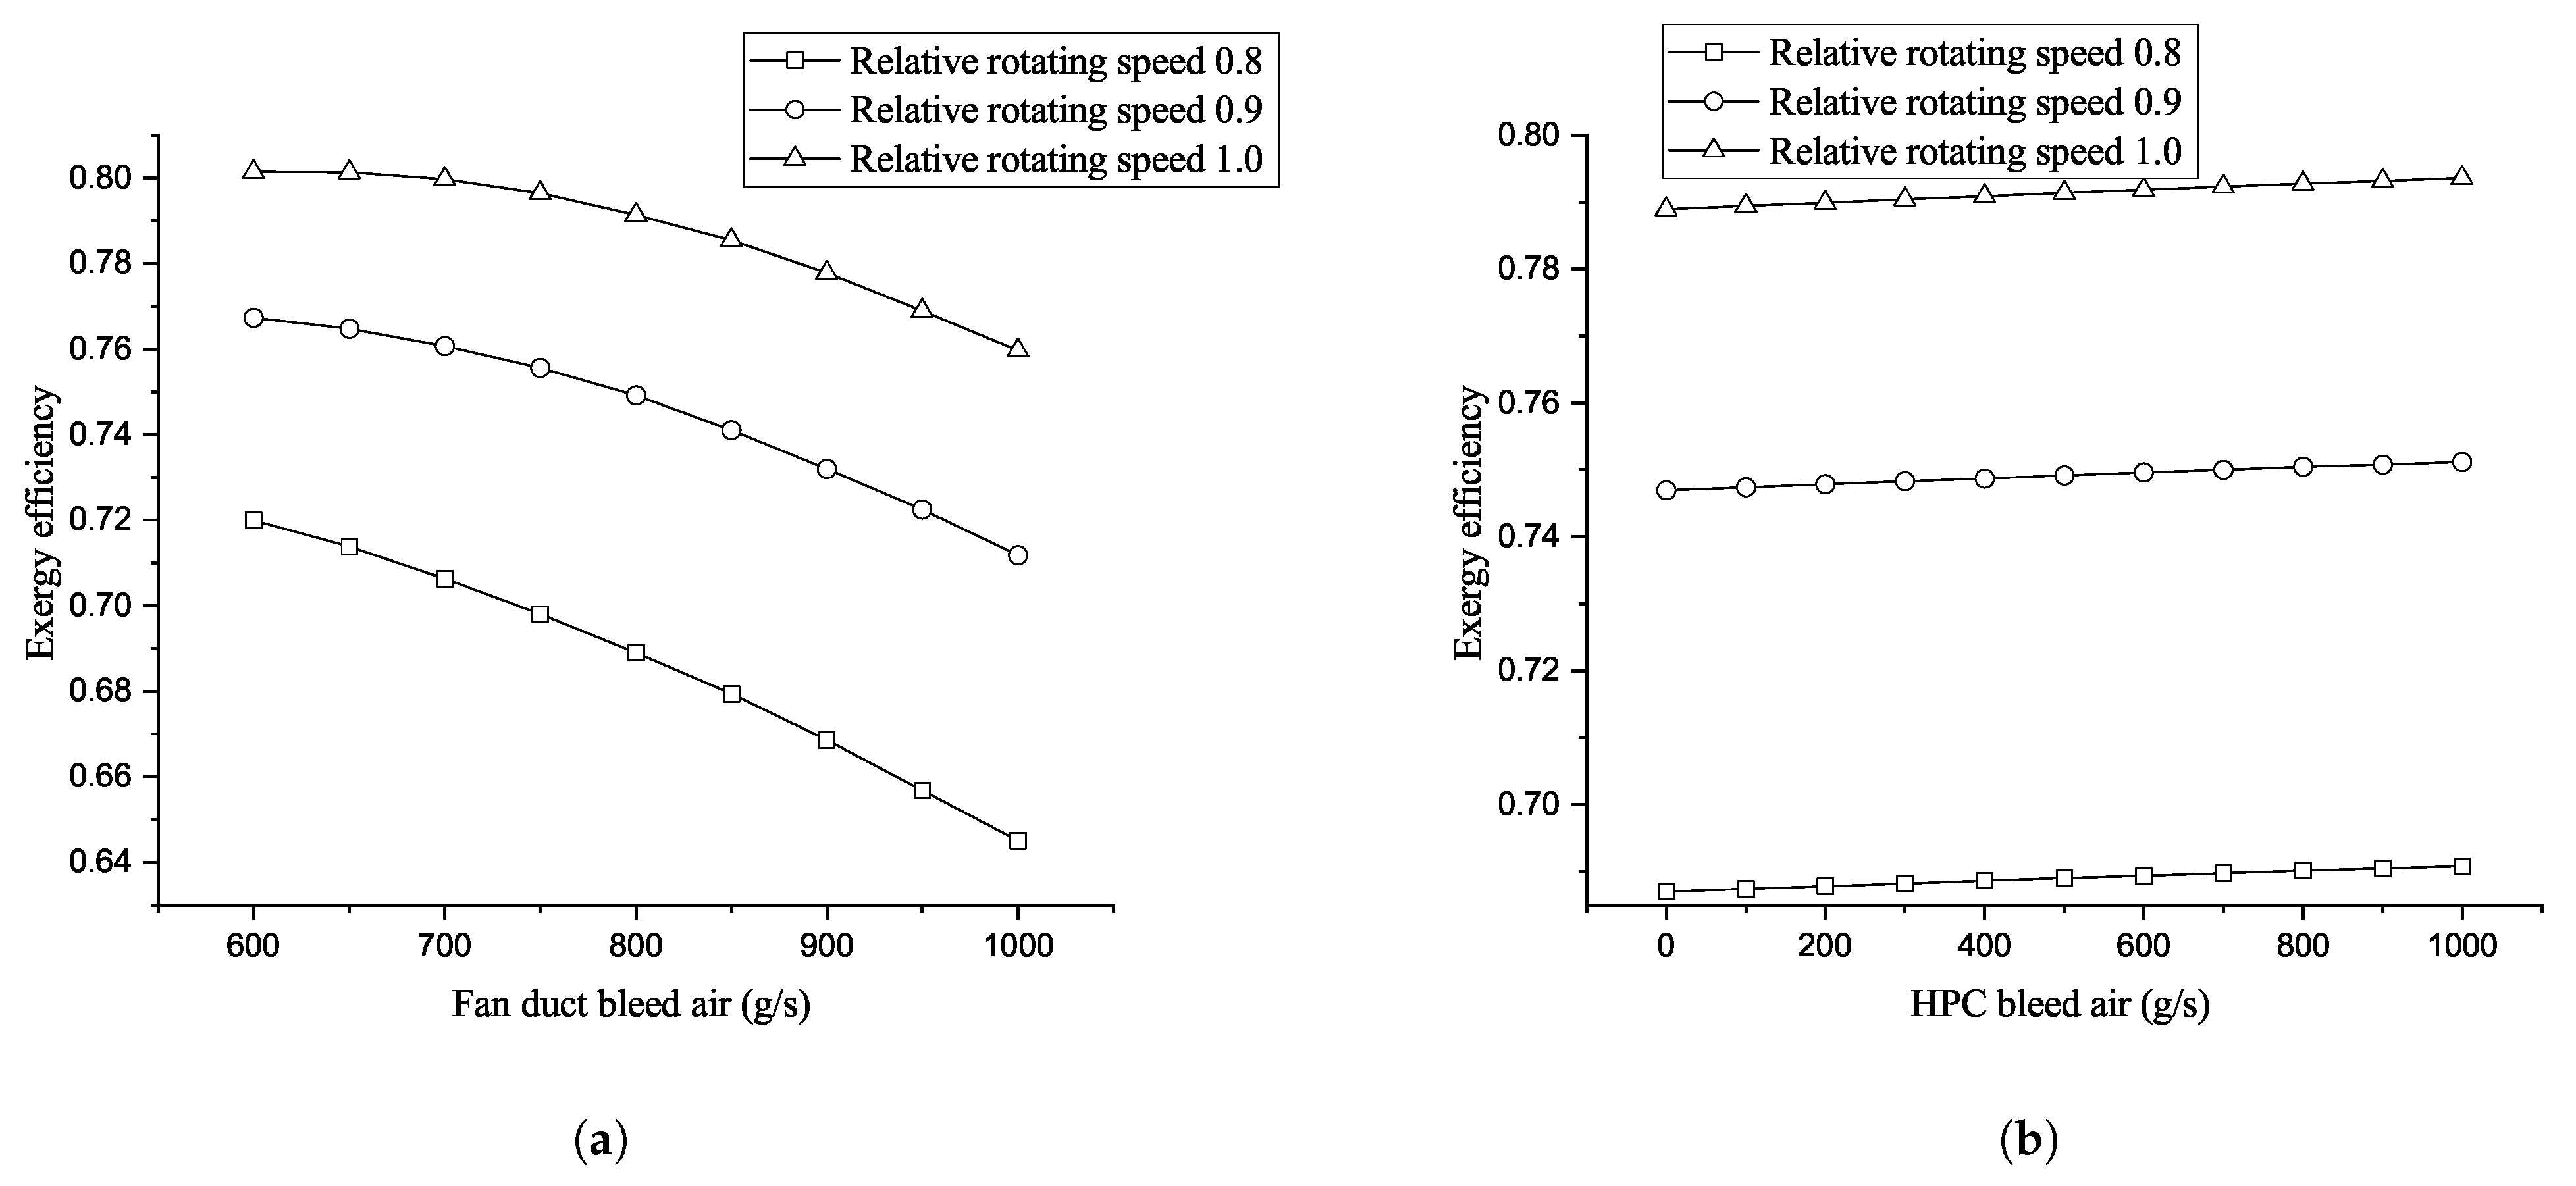
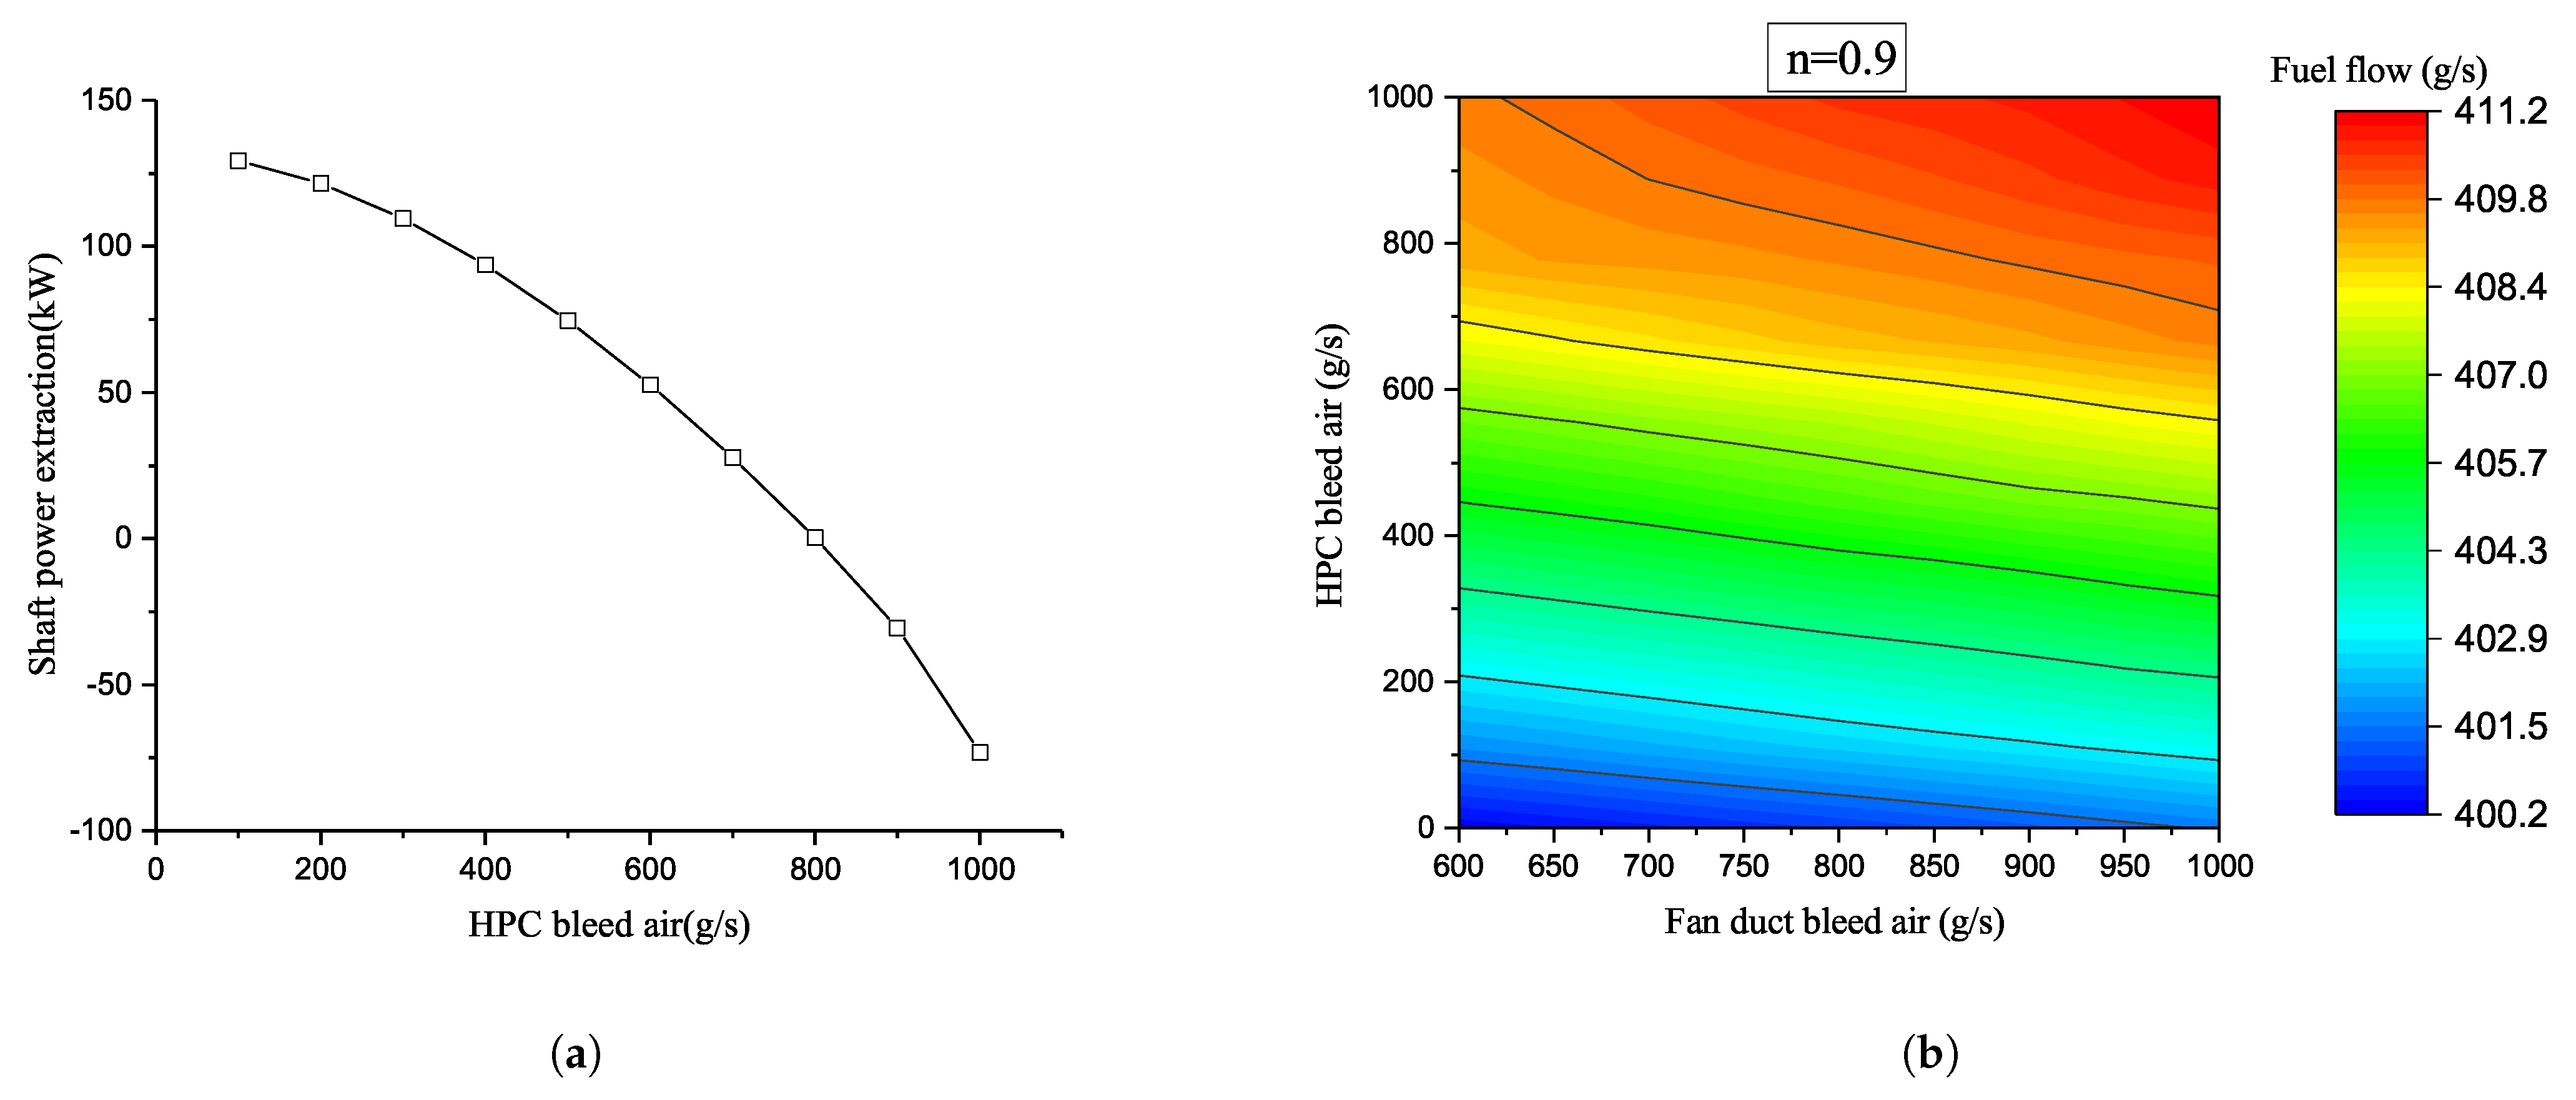
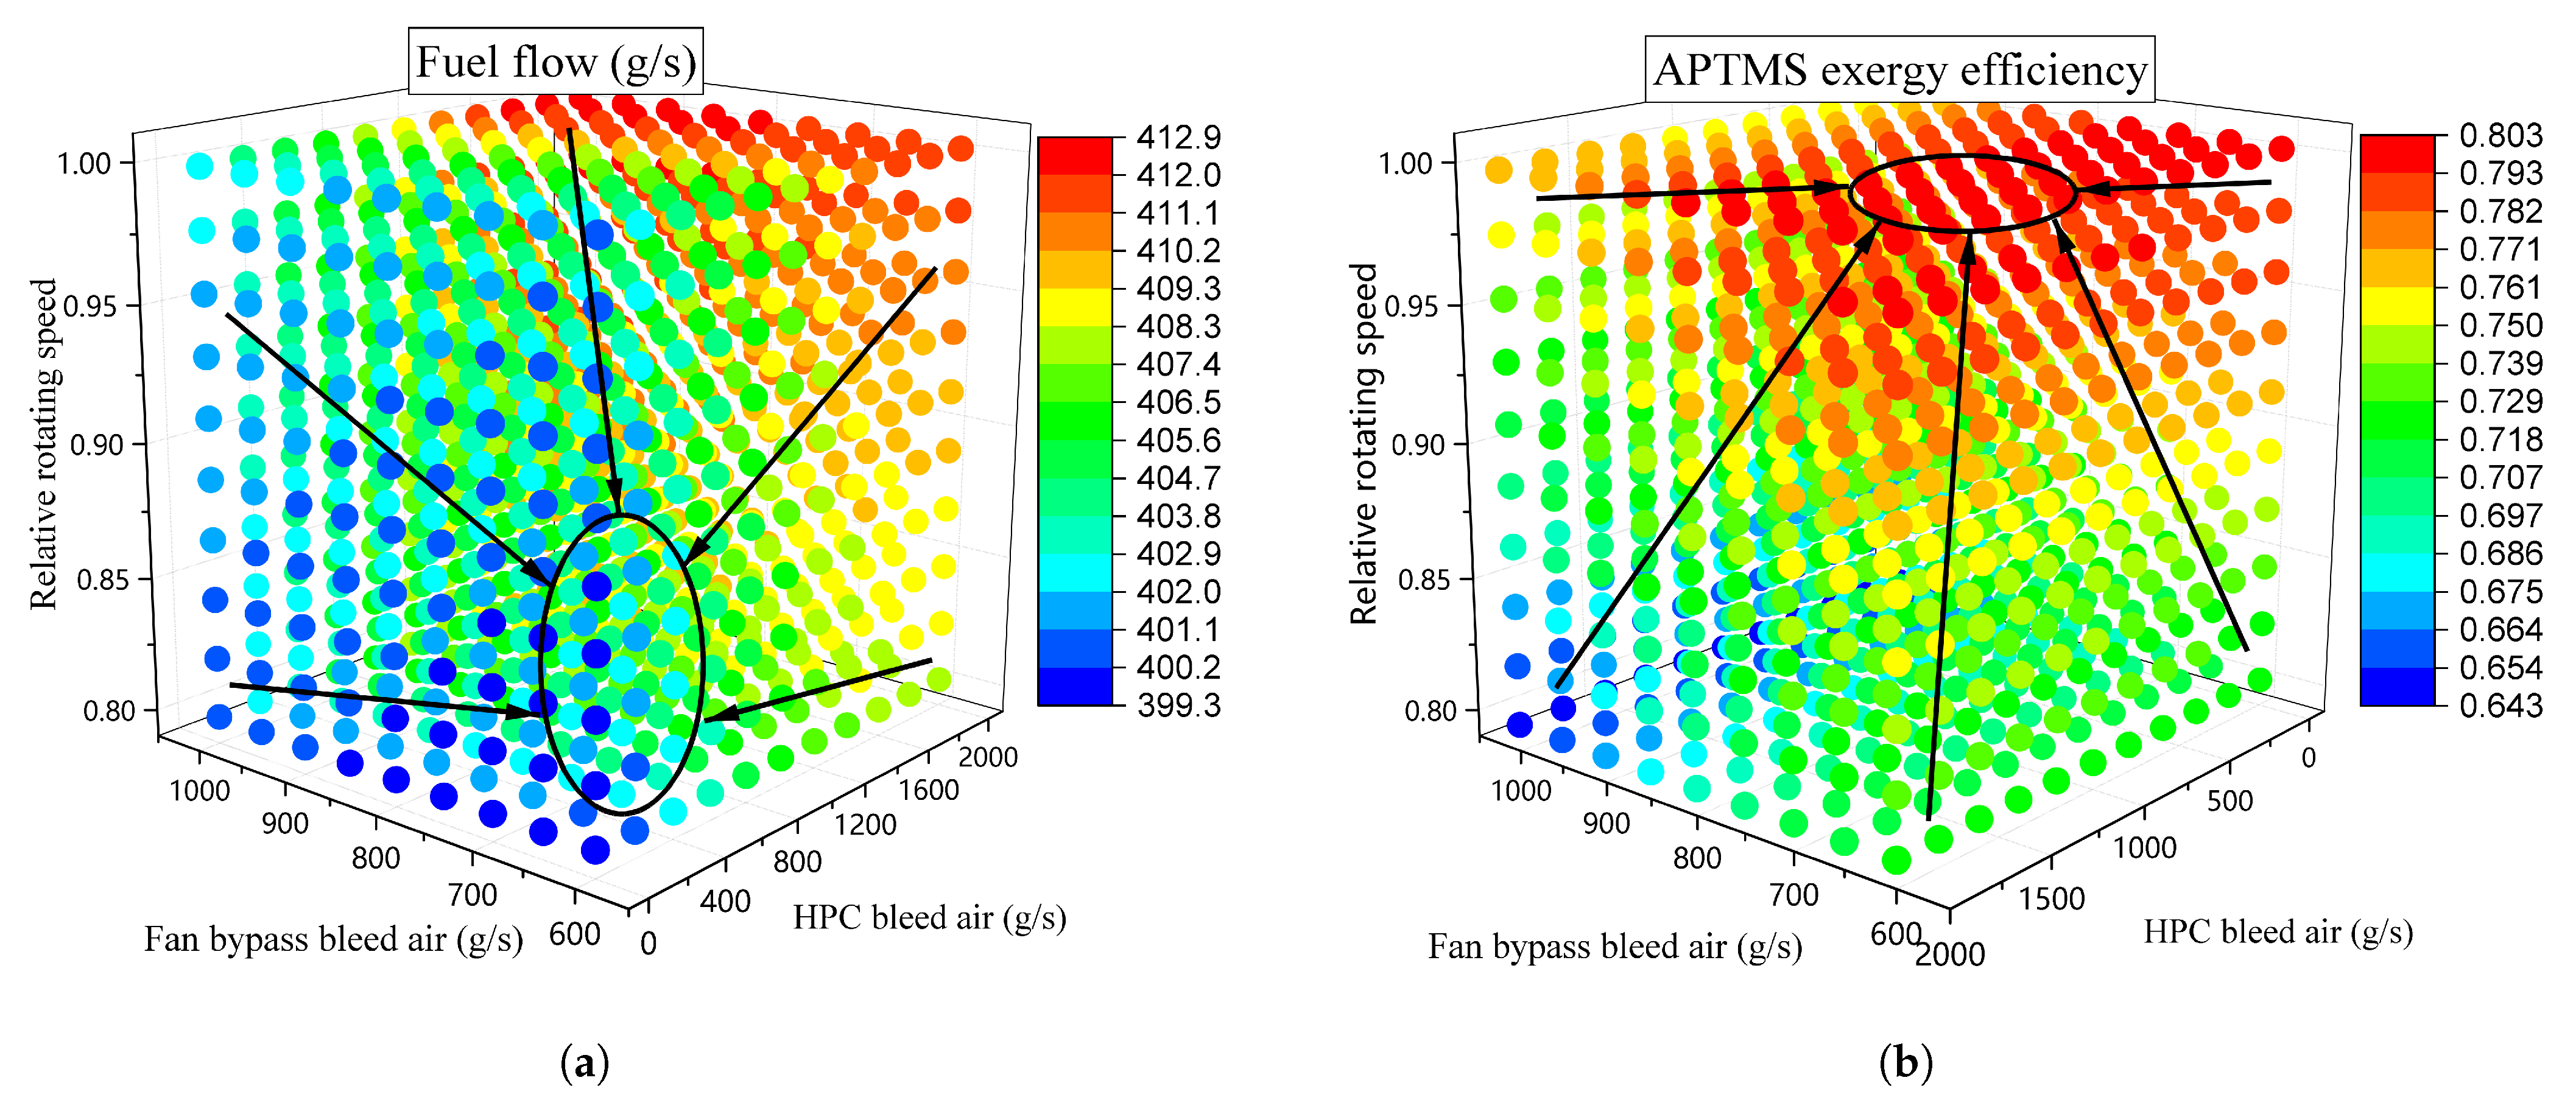
3. Coupling Influence Between the Aircraft Engine and APTMS

The APTMS system extracts power from the high-pressure shaft of the aircraft engine via the combine power unit (CPU) and combines it with the power generated by the HPC bleed air-driven power turbine to drive the cooling unit, which provides cooling power while also allocating power to other electromechanical systems. Its operational characteristics will inevitably affect the operation of the aircraft engine. It is coupled between them in terms of performance.
Figure 5a,b represents the impact of fan duct bleed and HPC bleed on the exergy efficiency of the APTMS system. From Figure 5a, it can be observed that the system rotating speed affects the relationship between exergy efficiency and fan duct bleed air. As the rotating speed increases, the system’s exergy efficiency is improved, and the curve descends more gently. This reflects the impact of rotating speed and mass flow rate on the efficiency of the compressor and turbine components. As shown in Figure 5b, increasing HPC bleed air increases exergy efficiency. At higher rotating speeds, the position of the maximum exergy efficiency shifts towards higher bleed air, resulting in a nearly linear increase in exergy efficiency with bleed amount within the bleed range.
Figure 6a represents the relationship between shaft power extraction and HPC bleed air under a relative rotating speed of 0.9 and constant fan duct bleed air mass flow. Shaft power extraction and HPC bleed together provide energy for the APTMS system. When the APTMS system is in a certain state, the system’s energy demand is fixed. Hence, the two vary inversely. The greater the amount of HPC bleed air, the less the required shaft power extraction.
From Figure 6b, it can be seen that the increase in fuel flow indicates that HPC bleed air results in greater fuel compensation compared to shaft power extraction. When providing the same power to the APTMS system, HPC bleed air increases the fuel flow by approximately 1.8% compared to shaft power extraction. It can be observed that under fixed fan duct bleed air conditions, the sensitivity between HPC bleed air and fuel flow rate diminishes as HPC bleed air increases.
Observing the relative positions of the optimal values of exergy efficiency and fuel flow in Figure 7a,b, it is notable that within a reasonable range of variables, the maximum points of fuel economy and exergy efficiency are located at different positions, and they generally exhibit an opposite trend. Low fuel flow and high exergy efficiency cannot coexist, indicating a conflict in performance between them.

4. Stackelberg Game and Adaptive Chaotic Particle Swarm Algorithm

4.1. Stackelberg Game

The Stackelberg game model, proposed by German economist Heinrich von Stackelberg, is an asymmetric leader–follower model [15]. The Stackelberg game model G consists of three basic elements: players P, strategies Ω , and utility functions U. It can be specifically represented by Equation (7).
G = P ; Ω ; U
In the Stackelberg game, participants exhibit a hierarchy in strategy formulation priorities due to their distinct roles: followers must dynamically adjust their optimal response strategies based on the strategy information provided by the leader while also considering their own objective functions. The combination of all participants’ strategies constitutes the game’s strategy space; the individual benefit metrics calculated under the current strategy combination are defined as utility functions. The modeling process requires the definition of three core elements: clarifying the game’s hierarchical structure, specifying each participant’s feasible strategy set and utility function coupling relationships, and quantifying the pathways of the impact of strategic interactions on utility functions.
The aircraft engine is identified as the leader in the Stackelberg game due to its role as a global energy supply source, while the APTMS system functions as the follower for energy distribution. During game-play, the follower dynamically optimizes its response strategy based on the leader’s strategy and feeds back the adjusted strategy to the leader. This bidirectional strategy iteration helps achieve to equilibrium convergence. Due to the highly nonlinear characteristics of the engine’s thermodynamic model and the APTMS energy network, the system cannot find equilibrium solutions analytically. Thus, numerical iteration algorithms are needed to approximate Nash equilibrium solutions.
Based on the characteristics of the Stackelberg game model described earlier, the aircraft engine should be regarded as the leader and the APTMS as the follower. The game model can be represented as Equation (8).
G = P ; Ω Ω e n g , Ω a p t m s ; U U e n g , U a p t m s
Ω a p t m s represents the APTMS’s strategy; Ω e n g represents the aircraft engine’s strategy. U a p t m s represents the utility function of the APTMS, and U e n g represents the utility function of the engine.
In flight, the onboard computer will collect data and automatically calculate the cooling power and output power requirements based on the aircraft’s status. The APTMS will adjust its own rotating speed and fan duct bleed air to meet the cooling power demand and also maximize η E x . Therefore, the rotational speed n and fan duct bleed air q 1 are chosen as the decision variables for the APTMS system.
The objective of the APTMS is to maximize the exergy efficiency η e x of the cooling unit while satisfying the cabin, cockpit, and avionics bay’s cooling power demand, and the objective function can be represented as Equation (9).
U a p t m s = max η E x q 1 , n
For the i−th games, the strategy of the APTMS can be represented as Equation (10).
Ω a p t m s i = n i , q 1 , i , i 1 , M
M is a possible strategy number.
The APTMS’s total available strategy set can be represented as Equation (11).
Ω a p t m s = Ω a p t m s 1 , Ω a p t m s 2 , , Ω a p t m s i , , Ω a p t m s M
Therefore, the Stackelberg game of the APTMS can be represented as Equation (12).
G a p t Ω e n g , Ω a p t m s i ,   Ω a p t m s i
Ω a p t m s i represents the optimal strategy of the APTMS eliminating the strategy Ω a p t m s i .
The constraints for the APTMS include maintaining the rotational speed within the limited range, meeting the cooling demands of the cabin and avionics bays, and satisfying the power requirements of other electromechanical systems. The constraints for APTMS can be represented as Equation (13).
n min n n max q 1 , min q 1 q 2 , max Q c a b i n Q c a b i n , min Q e l e Q e l e , min W e , o u t W e , o u t , min
After adjusting the performance of the APTMS in the previous section, the aircraft engine will also modify the high-pressure compressor (HPC) bleed air and shaft power extraction. This adjustment aims to ensure an adequate energy supply for the electromechanical systems while maintaining the APTMS’s performance and minimizing fuel consumption. Therefore, the different values q 2 of HPC bleed air and fan bleed air provided by the aircraft engine to the APTMS constitute the strategy of the aircraft engine.
The objective of the aircraft engine is to minimize fuel flow, and the objective function can be represented as Equation (14).
U e n g = min W f q 2
N is the number of possible strategies, and W f is the fuel flow function.
The aircraft engine’s available strategy set can be represented as Equation (15).
Ω e n g = Ω e n g 1 , Ω e n g 2 , , Ω e n g i , , Ω e n g M
Therefore, the Stackelberg game of the aircraft engine can be represented as Equation (16).
min G e n g Ω e n g j ,   Ω e n g j ,   Ω a p t m s *
Ω e n g j presents the optimal strategy of the APTMS, eliminating the strategy Ω e n g j .
The constraints for the aircraft engine include maintaining shaft power extraction and bleed air within the required range and ensuring constant thrust. The constraints for the aircraft engine can be represented as Equation (17).
q 2 , min q 2 q 2 , max F a = F b S M m i n S M
F a and F b represent the thrust before and after the optimization, and S M represents the HPC surge margin.

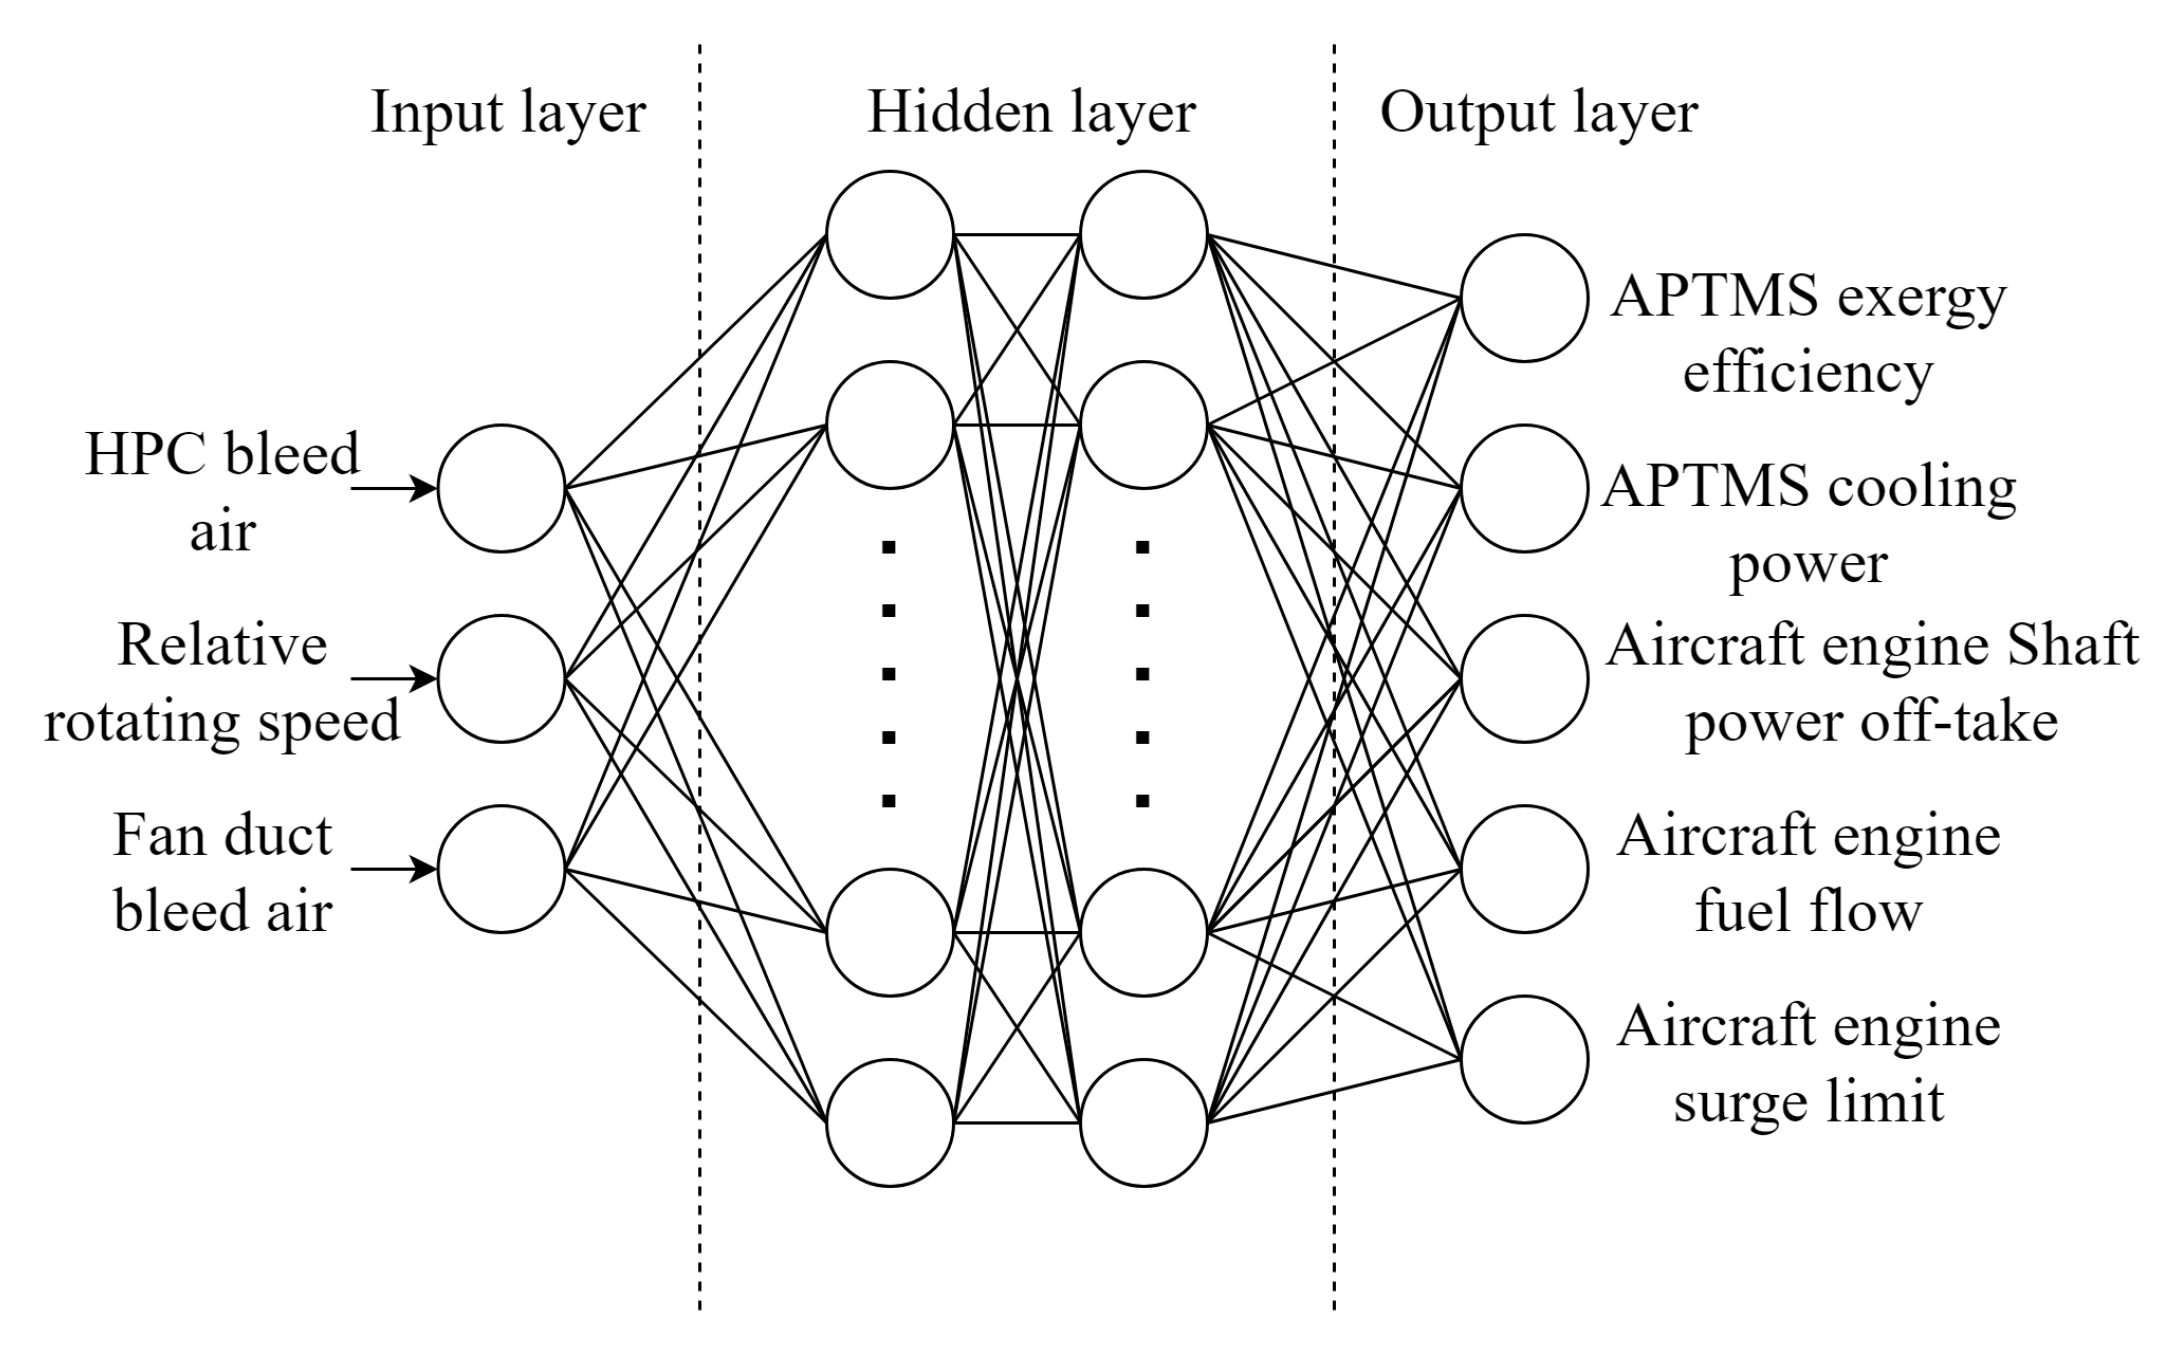
4.2. ANN-Based APTMS-Engine Performance Surrogate Model

Both APTMS and aircraft engine models are complex, high-order, nonlinear systems. Directly applying the ACPSO algorithm for optimization would consume excessively high computational resources and time. Building a neural network surrogate model based on the Amesim model is an excellent choice [30]. The Amesim model performs extensive computations to generate datasets that are then used for training the neural network. However, to create a neural network surrogate model that encompasses the entire operation envelope, it is necessary to compute over 100,000 data points and undertake complex parameter tuning to ensure accuracy requirements are met [31]. This approach is not a good idea for Amesim and exceeds the needs of this article.
A more reasonable choice is to establish an APTMS-engine performance neural network surrogate model for each flight condition. A feedforward multi-layer network is employed with the Levenberg–Marquardt back-propagation algorithm training on one flight condition. The network is composed of an input layer, two hidden layers, and an output layer. The structure of the ANN surrogate model is illustrated in Figure 8.
In layer m, the output a i can be expressed with the weight matrix w i m , bias b i m , and activation function f m , as shown in Equation (18).
a i m = f m j = 1 S w i , j m a j m 1 + b i m
The network system equation can be given by Equation (19). a 0 is the input vector p .
a m = f m w m a m 1 + b m
a, f, w, a are the output, weight matrix, bias, and activation function in the form of a matrix.
The training procedure involves learning the network association between inputs and outputs by adjusting the network’s weights and biases to minimize the performance index. V. V can be expressed as Equation (20).
V = q = 1 Q t q a q M T t q q q M = e T ( x ) · e ( x )
x is the network parameter vector x = w 1 , 1 1 w 1 , 2 1 w S 1 , R 1 b 1 1 b S 1 1 w 1 , 1 2 w 1 , 1 2 b S M M T . R, R M , and M refers to the number of inputs and neurons in each hidden layer and and the network layers, respectively; t is the input matrix; and e is the error matrix.
To minimize Δ V ( x ) , the Levenberg–Marquardt back-propagation method is used to update network weights and biases in Equations (21) and (22).
Δ ( x ) = [ J T ( x ) J ( x ) + μ I ] 1 J T ( x ) e ( x )
V ( x ) = J ( x ) e ( x )
V ( x + Δ x ) is calculated using updated network parameters. If V ( x + Δ x ) increases, then parameter μ is multiplied by β ; otherwise, it is divided by β . When the V or V ( x ) reduces the performance goal and minimum performance gradient, the algorithm converges.
The coefficient of determination R 2 and mean square error (MSE) are introduced to evaluate the goodness-of-fit of the prediction data and reference data quantitatively.
R 2 = 1 i = 1 N y ^ i y i 2 i = 1 N y ¯ i y i 2
M S E = 1 N i = 1 N y ^ i y i 2
y ^ represents prediction data, y represents reference data, and y ¯ is the mean value of the reference data.
All neural network surrogate models for APTMS engine performance across all flight conditions employed in the next section exhibit an R 2 ≥ of 0.999 and MSE of ≤ 1 × 10 4 , demonstrating its capability to capture system performance characteristics and coupling relationships accurately.

4.3. Adaptive Chaotic Particle Swarm Algorithm

Stackelberg games are usually solved using the backward induction method. However, when faced with implicit system models or highly complex interactions that do not have analytical expressions, deriving equilibrium solutions often requires iterative computational methods. This article employs the Particle Swarm Optimization (PSO) algorithm to solve the objective function related to the aircraft engine and the APTMS [32]. However, it requires careful selection of parameters such as the inertia coefficient and learning factors. When tackling complex problems, the PSO algorithm often gets trapped in local optima, which hamper its ability to find the global optimal solution. This issue is significantly pronounced when optimizing complex systems that feature high-dimensional, nonlinear, or multi-modal landscapes [33]. Therefore, introducing chaotic variables into the PSO can help escape local optima through self-learning coefficients [34].
The original PSO velocity update formula is Equation (25):
V i d t + 1 = w · V i d t + c 1 · r a n d 1 · p b e s t x i d t + c 2 · r a n d 2 · g b e s t x i d t x i d t + 1 = x i d t + v i d t + 1 t = 1 , , N p a r
V i = V i 1 , V i 2 , , V i d are the velocities of the 1-th particles.
The inertia coefficient w quantifies how a particle’s velocity at iteration t + 1 is influenced by its preceding iteration t. A larger value makes the particle swarm tend towards global search, while a smaller value tends towards local search; therefore, a nonlinear dynamic inertia coefficient formula can be employed as shown in Equation (26).
w = w = w min + f j f min , j · w max w min f a v g , j f min , j f j = < f a v g , j w = w max f j > f a v g
The dynamic learning factors characterize the directional search patterns exhibited by the particle swarm. For dynamic learning factor c 1 , it reflects the learning of particles towards the swarm’s best particles, with larger values making the particle swarm tend towards local search and smaller values towards global search. Another dynamic search factor c 2 , reflecting the learning of particles towards the global best particles, is the opposite. By constructing a function, particles can search extensively in the global domain during the early stages of evolution and quickly and accurately converge to the global optimal solution in the later stages. The constructed function c 1 , c 2 is represented in Equation (27).
c 1 = 2 sin π 2 1 t t max 2 c 2 = 2 sin π t 2 t max 2
The initialization of particle swarm positions significantly influences the iterative outcomes of the Particle Swarm Optimization (PSO) algorithm. To avoid a non-uniform distribution of initial particle positions, which can lead to incomplete search coverage and hinder finding the global optimum, this study uses chaotic distribution for initializing the particle swarm. This article adopts the classic logistic model as shown in Equation (28).
z t + 1 = μ z t 1 z t t = 0 , 1 ,
μ is the control parameter; z t is a random number between 0 and 1. When μ = 4 and z t 0.25 ,   0.5 ,   0.75 , the initialization will be in a state of complete chaos [35]. The flowchart of the adaptive chaotic PSO algorithm for solving the Stackelberg game mechanism is shown in Figure 9.
(1)
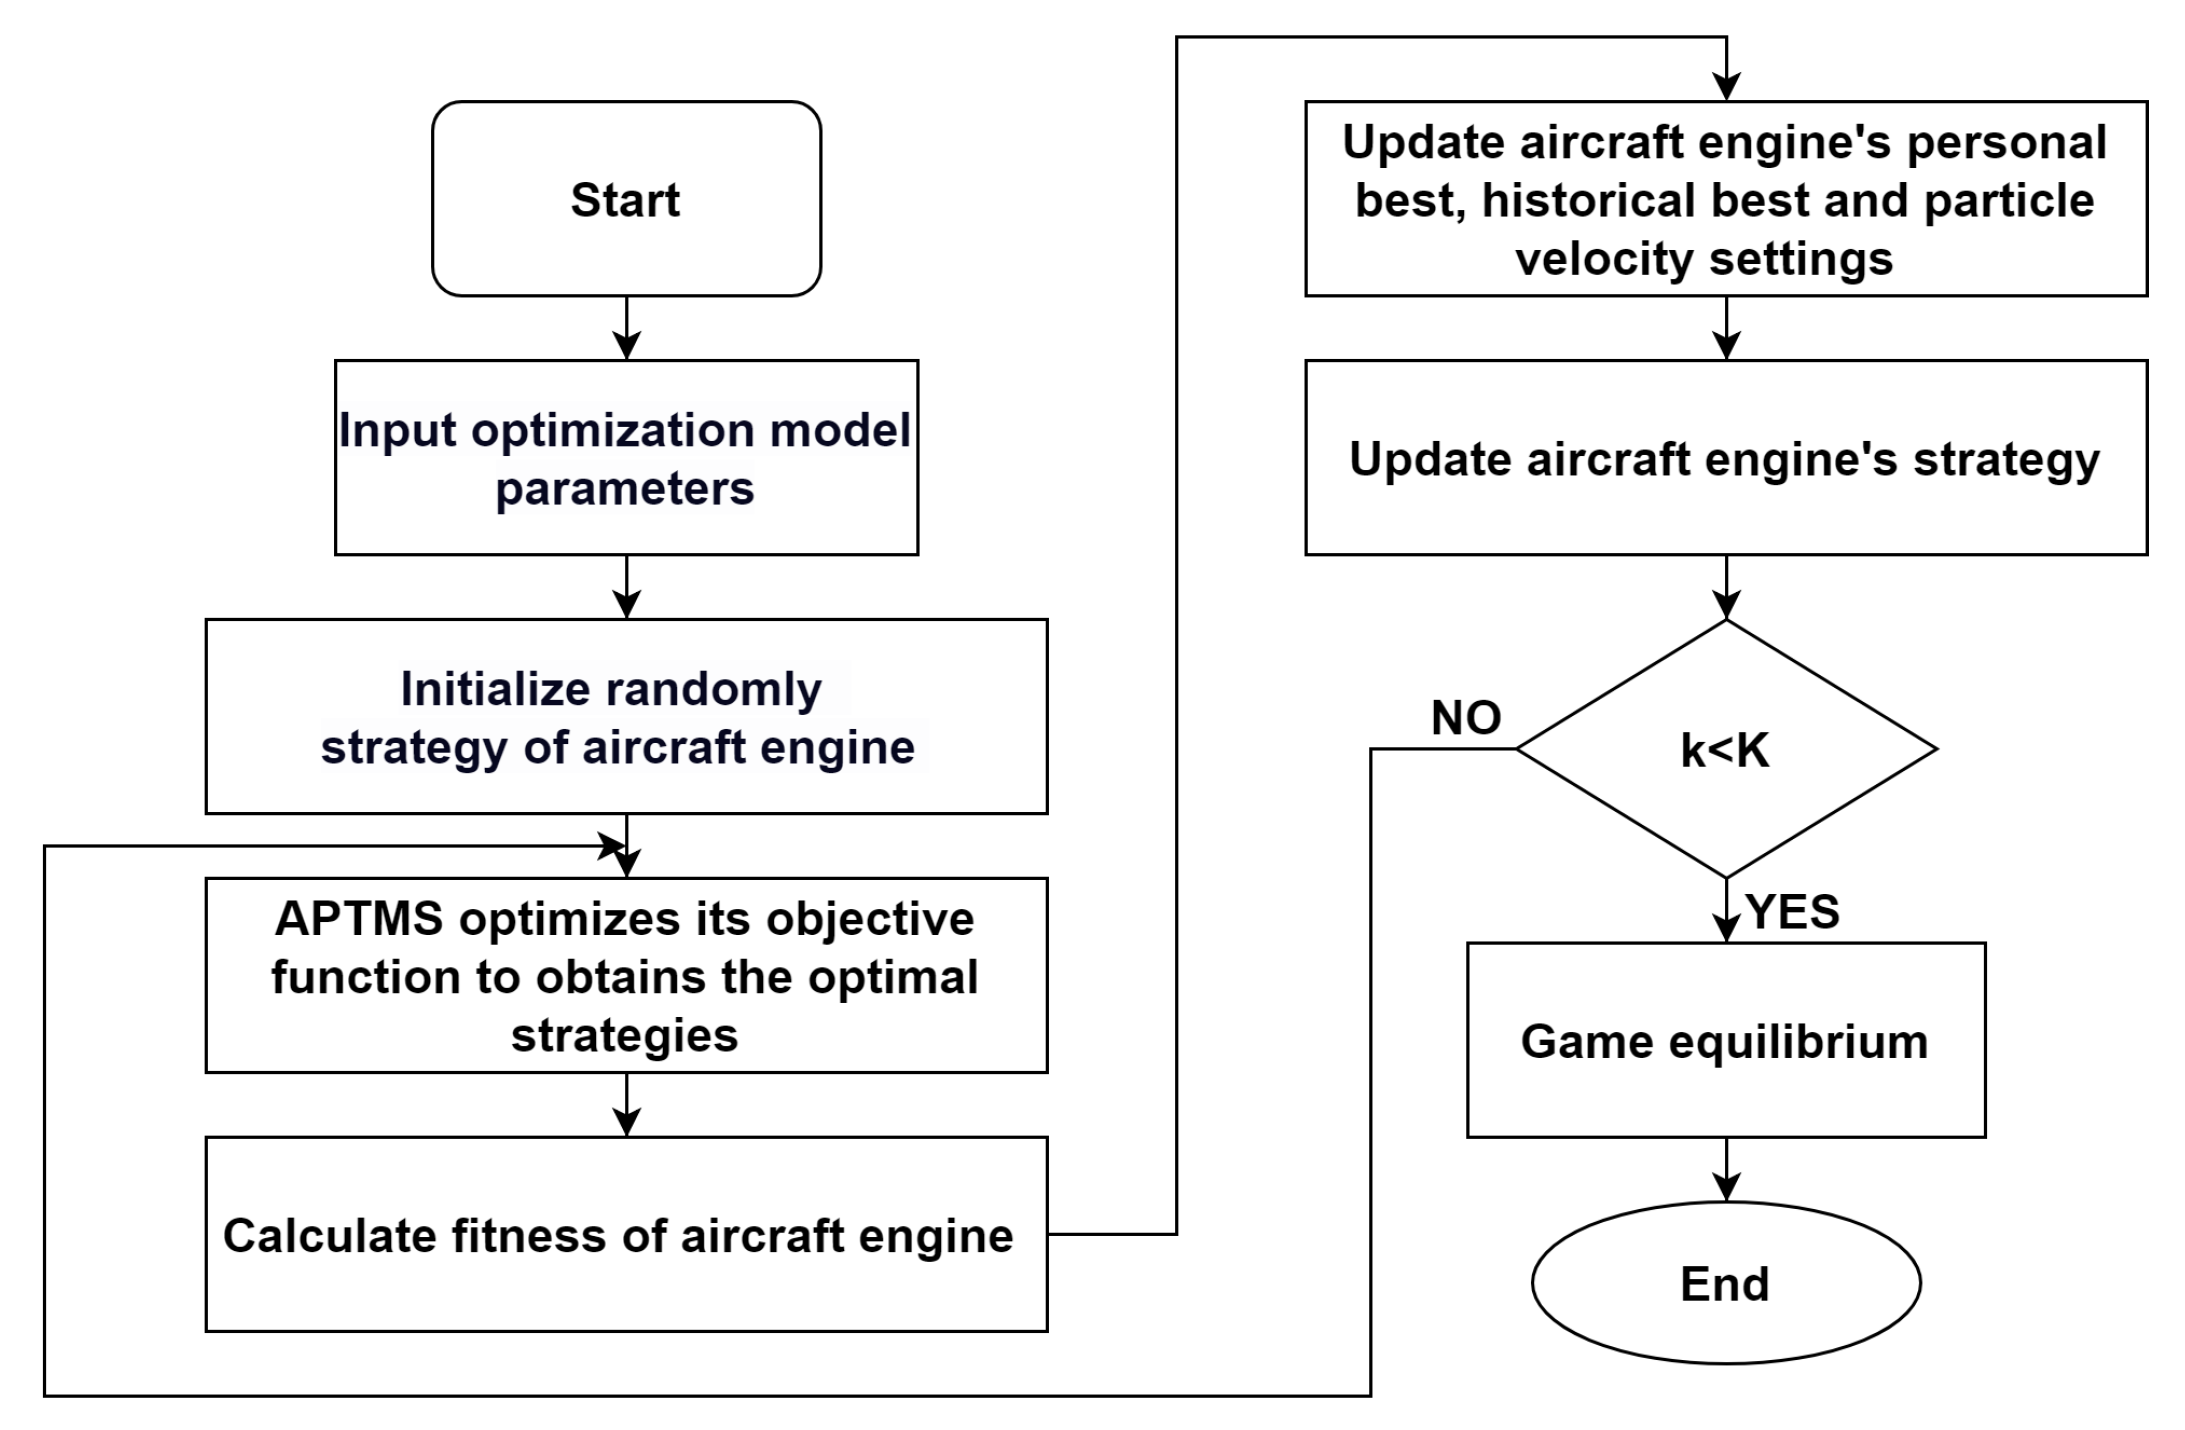
Set the environmental parameters for the system model: flight altitude, flight Mach number, and energy demand. Set the iteration parameters for the ACPSO: particle count and maximum iteration number.
(2)
Randomly generate q 2 as strategies for the aircraft engine and pass the parameters to the APTMS system.
(3)
The APTMS system employs the ACPSO algorithm to determine strategies that maximize exergy efficiency, resulting in optimal rotational speed n and fan bleed air q 1 that meets cooling power demand.
(4)
APTMS’s strategies are passed to the aircraft engine and calculate the fitness and the fuel flow.
(5)
Update the aircraft engine’s particle swarm personal best set and group best set. Update the particle swarm velocities.
(6)
According to the new velocities, and calculate the aircraft engine’s new strategies.
(7)
Check if the number of iterations k has reached the maximum limit or if the fuel economy of the aircraft engine and the exergy efficiency of the APTMS system have achieved equilibrium. If either condition is met, output the results. If not, continue iterating.
(8)
Re-update the strategies and repeat steps (3) to (7).

5. Simulation

This paper uses the ACPSO to solve the objective functions of the leader and the follower, respectively, and requires iteration. The dynamic learning factor and inertia coefficient settings are shown in Section 4.3, with a population size set to 60 and a max optimization iteration number for the aircraft engine of 40.

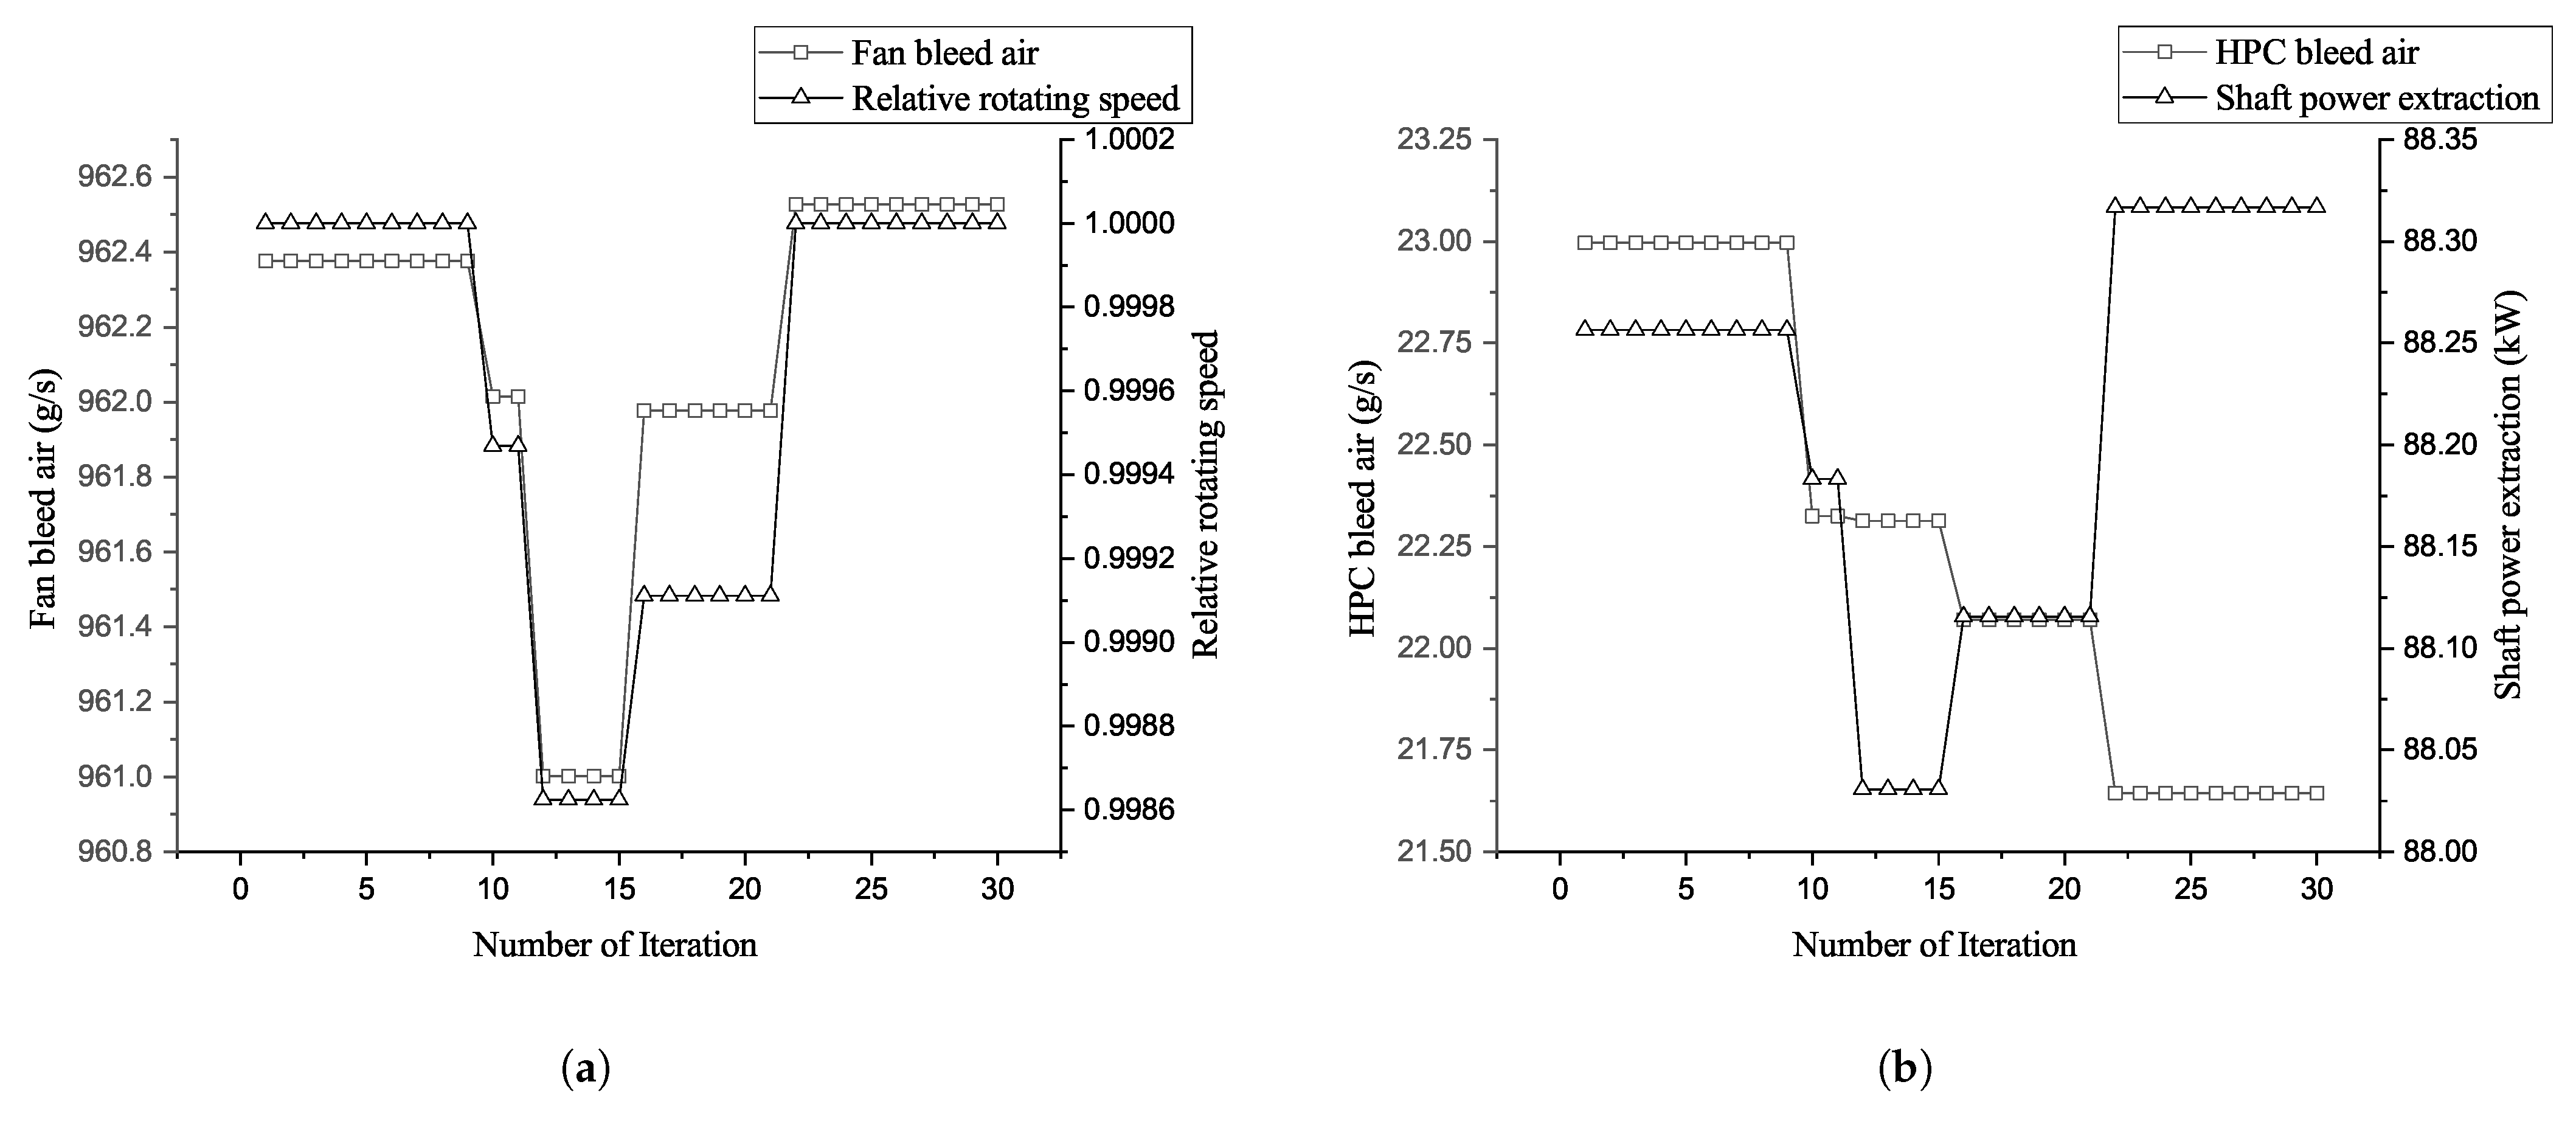
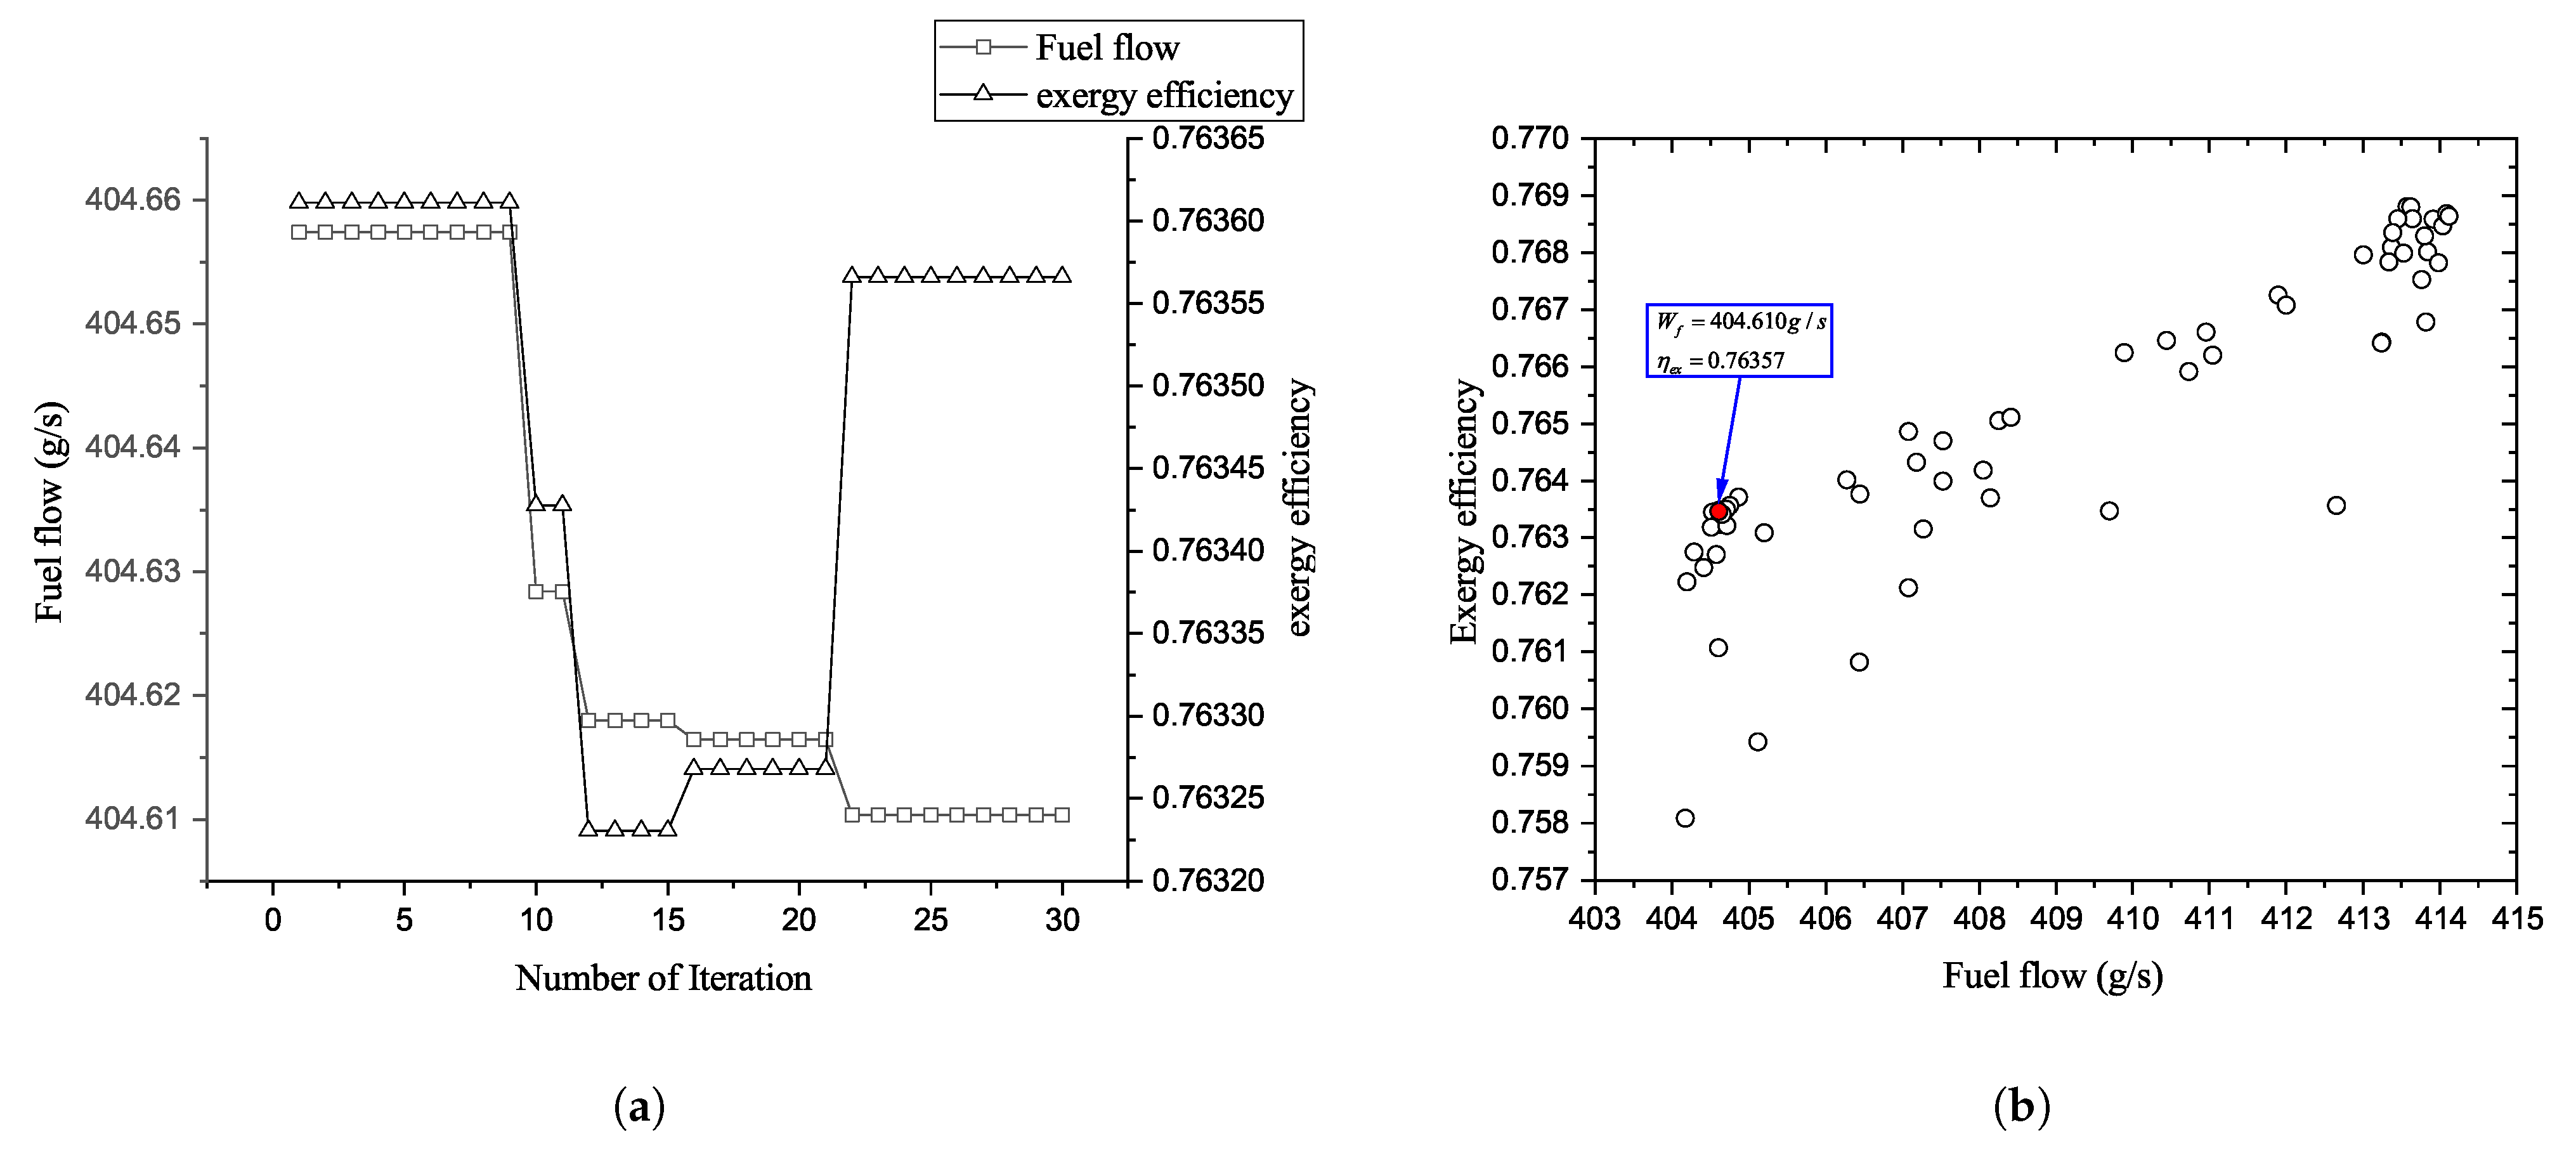
5.1. Cruise Simulation

The cruise phase has the longest flight duration, the most fuel consumption, and the thinnest atmosphere, and it requires the highest compression performance of the cooling unit. The typical maximum cruising altitude for large aircraft is 39,000 feet, and the maximum flight speed is 0.82 Mach. This paper selects typical cruise conditions for simulation; all power demands are set according to articles or simulation results. The flight altitude is 9750 m, the flight speed is 0.78 Mach, and the net thrust is 20.5 kN. To ensure the air renewal in the cabin, the fan duct bleed air flow is set to 600–1000 g/s, and the maximum HPC bleed air does not exceed 5% of the core mass flow, with a setting range of 0–2000 g/s, 0–1000 g/s for each engine. In this flight environment, the cooling power requirement is 31.25 kW, and the power requirement for various electromechanical systems of the aircraft is 36 kW [36,37].
Figure 10 shows that after 22 iterations, it is clear that the optimization objectives proposed in this paper have all converged, demonstrating that the Stackelberg game has reached an equilibrium. The fan duct bleed air flow is iterated from 962.376 g/s to 962.527 g/s, and the HPC bleed air is iterated from 45.992 g/s to 43.288 g/s. The shaft power extraction is iterated from 88.256 kW to 88.317 kW.
Figure 11a represents the performance in iterations. In terms of performance between the aircraft engine and APTMS, the fuel flow of the aircraft engine is iterated from 404.657 g/s to 404.610 g/s, and the exergy efficiency of the APTMS is iterated from 0.76361 to 0.76357. In the game between the aircraft engine and the APTMS system, the aircraft engine sacrifices 0.0052% in exergy efficiency in exchange for improving by 0.012% in fuel economy. Figure 11b shows the 30th iteration of effective results and best results, which include the fuel consumption of the aircraft engine and the exergy efficiency of the APTMS.
Unlike the Stackelberg game model, players in the Cournot game model do not coordinate with each other and do not adjust their strategies based on those of others. The fuel consumption and exergy efficiency of Stackelberg–ACPSO and Cournot–ACPSO are shown in Table 3. The Stackelberg–ACPSO strategy achieves a fuel saving of 0.106% and an increase in exergy efficiency of 0.05%.
The multi-objective particle optimization (MOPSO) algorithm handles multiple objectives by leveraging the external archive and the Pareto dominance principle. We solve the same APTMS engine multi-objective optimization problem using MOPSO to verify that the optimization effect based on the Stackelberg game is better. The population size is 400, and the maximum number of iterations is 100. The optimization results must balance fuel consumption with exergy efficiency; the selected best result is marked in the Pareto front. We can see in Figure 12 that the fuel comsumption is 404.611 g/s, and the exergy efficiency is 0.763403. Compared with the results in Figure 11b, the Stackelberg–ACPSO algorithm improves by 0.000247% in fuel economy and 0.0219% in exergy efficicency.

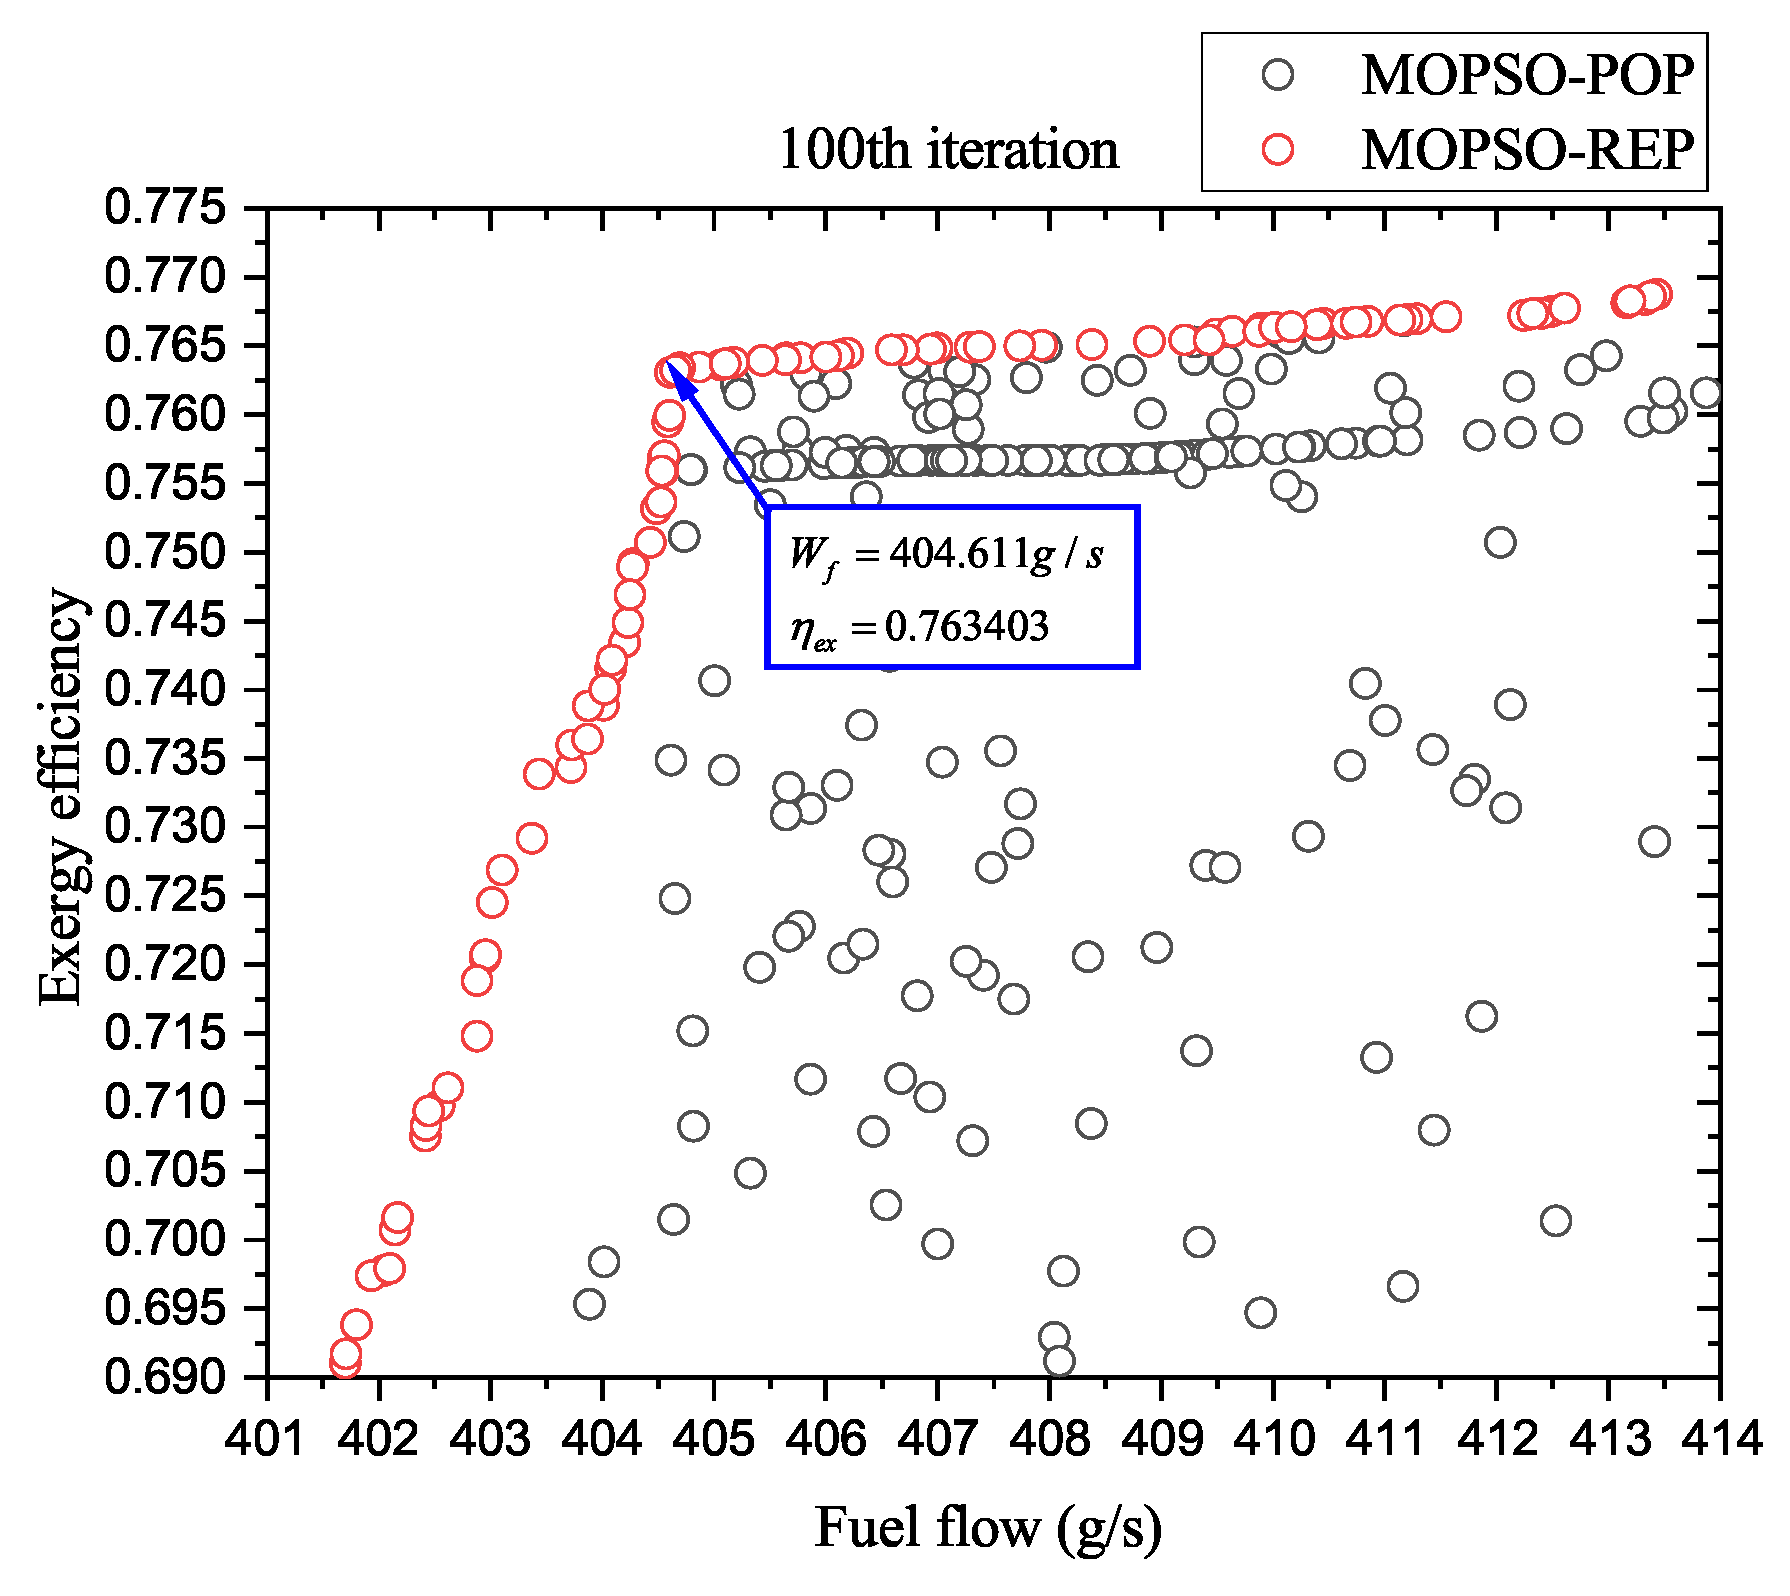
5.2. Comparison Between MOPSO, Cournot–ACPSO, and Stackelberg–ACPSO

In order to verify that the Stackelberg–ACPOS multi-objective optimization effect is better, multi-cruise conditions are shown in Table 4. Under the above flight conditions, we keep the same computer hardware and algorithm parameter settings.
The fuel flow and exergy efficiency of Stackelberg–ACPSO, Cournot–ACPSO, and MOPSO are shown in Figure 13 and Figure 14.
It can be seen from Figure 14a,b that the effect of using the Stackelberg–ACPSO algorithm is greater than the Cournot–ACPSO algorithm. The maximum fuel flow reduction is 0.8 g/s, and the maximum efficiency augmentation is 0.924%. In a Cournot game, it is assumed that APTMS and aircraft engines are on an equal footing, with no exchange of strategic information, both independently pursuing the maximization of their own performance. The ‘selfish’ outcome of this independent optimization leads to intensified performance conflicts and a reduction in their respective maximum achievable performance. However, in a Stackelberg game, the aircraft engine assumes the role of the leader, with APTMS acting as the follower, establishing a hierarchical decision-making structure. Strategic information is shared, and each participant adjusts its strategy in response to the others’ moves, resulting in ‘order’ and ‘coordination’ that alleviate performance conflicts.
It can be seen from Figure 13a,b that the effect of using the Stackelberg–ACPSO algorithm is also greater than the MOPSO algorithm. The maximum fuel flow reduction is 1.1 g/s, and the maximum efficiency augmentation is 0.428%. From Figure 13 and Figure 14, the enhancement achieved by Stackelberg–ACPSO over MOPSO is greater than that achieved over Cournot–ACPSO in terms of improving exergy efficiency. The MOPSO algorithm fails to account for the mutual coupling between the APTMS system and the aircraft engine, treating them as a single entity for optimization. This approach overlooks their distinct system characteristics, often resulting in suboptimal outcomes. Additionally, MOPSO requires a large number of particles and iterations, which leads to extended computational times.

5.3. Flight Mission Simulation

During actual flight operations, the power demands of the aircraft’s electromechanical systems and the air-cooling and liquid-cooling power requirements of the cabin and electrical equipment undergo real-time variations. As a result, the extraction of shaft power from the aircraft engine and the bleed air system must be dynamically adjusted in real time.
The Stackelberg–ACPSO optimization algorithm is constrained by its algorithmic architecture and parameter configuration, enabling iterative operations only in a single defined flight scenario or at a fixed time point. To address this limitation, FADEC (Full-Authority Digital Electronic Control) utilizes a time discretization strategy for energy management during flight missions. The system collects real-time flight data at regular intervals and triggers iterative simulations of the optimization algorithm. The results of these calculations serve as the global energy allocation plan for the subsequent time windows. The shortest regular interval is considered the iteration time cost. The duration of this strategy is mainly influenced by two factors: (1) the iterative computation time of the Stackelberg–ACPSO algorithm, and (2) the solution time of the simulation model. By deploying surrogate models to replace complex simulations and using distributed parallel computing architectures, the system can significantly reduce the duration of each optimization cycle, allowing for shorter control intervals. This design breakthrough enables the energy management system to dynamically respond to changes in flight states, meeting the stringent requirements of real-time or just-in-time dynamic energy management.
Aiming to characterize the system’s integrated performance and demonstrate variations in energy management strategies, this article takes a typical transport flight mission as an example; 16 key flight conditions across different mission phases (takeoff, climb, second climb segment, cruise, descent, approach, and landing) are selected for computational analysis. Electromechanical system power demand, cooling power demand, and aircraft engine thrust are all set according to flight simulation data. These flight conditions are shown in Table 5.
It can be seen in Figure 15 that the Stackelberg game-based energy management strategy exhibits different preferences for HPC bleed air extraction, shaft power extraction, fan duct bleed air, and relative rotating speed under different power demands and thrust states.
During takeoff (0–120 s), aircraft engines operate at maximum thrust under the most extreme working conditions. Simultaneously, the aircraft’s electromechanical systems demand the second-highest amount of energy, while the environmental control system (ECS) has the highest power requirements. To reduce fuel consumption while ensuring safety, energy management strategies prioritize shaft power extraction and utilize HPC bleed air to compensate for residual power demands while maintaining the HPC’s surge margin. At the critical moment when the fan duct bleed air attains its maximum temperature and pressure, the APTMS system reduces rotational speed to ensure adequate cooling power is maintained.
During the climbing phase (120–1262.8 s), aircraft engines operate at moderate-to-high thrust levels. There are frequent changes in aircraft attitude and high cooling power demands. The operation of anti-icing systems results in increased power requirements for electromechanical systems. Energy management strategies tend to prioritize increased use of HPC bleed air, with shaft power extraction compensating for deficits. At this stage, HPC bleed air exhibits lower sensitivity to fuel consumption, and sacrificing some fuel economy to improve the exergy efficiency of the APTMS is considered acceptable. During this flight phase, increasing fan duct bleed air flow demonstrates a more pronounced reduction in APTMS exergy efficiency compared to rotational speed reduction. Consequently, the optimal strategy prioritizes maintaining reduced rotational speed to optimize system performance.
During the cruise, descent, and approach phases, aircraft engines operate at low or idle thrust levels. In these phases, HPC bleed air exhibits heightened sensitivity to fuel flow rates, while the exergy efficiency of the APTMS remains relatively high compared to other flight stages. As a result, energy management strategies prioritize shaft power extraction to satisfy the demands of electromechanical systems, even if it means accepting a slight decrease in exergy efficiency to enhance fuel economy. During this flight phase, the APTMS maintains high rotational speeds while modulating fan duct bleed air in response to cooling power requirements.
Based on the above analysis, it can be concluded that the changes in optimal strategy are related to cooling power requirements and aircraft engine thrust. At high thrust levels, the system prioritizes shaft power extraction combined with HPC bleed air to meet safety and electrical power demands while reducing fuel consumption. Meanwhile, the extracted fan duct air exhibits higher temperature and pressure, and the deterioration effect of bleed air on exergy efficiency becomes more pronounced. Therefore, the APTMS reduces rotational speed to provide sufficient cooling power. At medium-high thrust levels, aircraft engine thrust shows lower sensitivity to fuel flow. The optimal strategy chooses to sacrifice acceptable fuel flow to enhance exergy efficiency. Under low-thrust conditions, where engine thrust is more sensitive to fuel flow, the optimal strategy primarily involves utilizing shaft power extraction. Simultaneously, with lower temperature and pressure in the fan duct bleed air, the APTMS maintains a high rotational speed. By adjusting the bleed air volume, the maximum exergy efficiency can be achieved.
Furthermore, this article compares the multi-objective optimization effect of Stackelberg–ACPSO, Cournot–ACPSO and MOPSO algorithm across these 16 flight conditions.
From Figure 16, it can be seen that the multi-objective optimization effect of Stackelberg–ACPSO is better than others. We can observe that the advantages of Stackelberg–ACPSO are most pronounced during the takeoff and climbing phases, while its superiority is least evident during the descent phase.

6. Conclusions

This paper concentrates on the energy management of an aircraft engine and the Adaptive Power and Thermal Management System (APTMS) by proposing a game model based on the Stackelberg game to alleviate performance conflict between them. A coupled Amesim model of a high-bypass-ratio turbofan engine and the APTMS was established according to the architectures of both systems, and the performance conflicts between them were analyzed. Ultimately, the Stackerberg game model was solved using an Adaptive Particle Swarm Optimization algorithm. The optimization results were compared with traditional multi-objective optimization algorithm MOPSO and the non-cooperative Cournot game to validate its effect. Meanwhile, the energy management method was applied to 16 key flight conditions of a typical transport flight mission profile, and we analyzed the trade-off between shaft power extraction and HPC bleed, fan duct bleed air and relative rotating speed. The main conclusions are as follows:
(1)
There is a significant performance conflict between the aircraft engine and the APTMS system, as their optimization objectives are fundamentally opposed within the operational envelope. An improvement in exergy efficiency inevitably leads to a decline in fuel economy.
(2)
This article proposes an energy management strategy based on the Stackelberg game to mitigate the performance conflicts between the APTMS system and the aircraft engine. Furthermore, it introduces an enhanced Particle Swarm Optimization (PSO) method that incorporates adaptive chaos search, inertia coefficient, and adjustable learning factors to determine the Stackelberg equilibrium effectively.
(3)
Through simulation and calculation, the optimization effects of Stackelberg–ACPSO were found to be superior to those of Cournot–ACPSO and MOPSO.
(4)
Optimal strategy selection relies on thrust-dependent characteristics and cooling power demand through parametric mission profile simulations under Stackelberg game energy management.

Author Contributions

Conceptualization, H.Z., C.L. and X.L.; Methodology, C.L.; Software, C.L.; Validation, R.L.; Investigation, X.L.; Resource, X.L.; Data curation, R.L. and Z.F.; Writing—review and editing, H.Z. and C.L.; Project administration, H.Z.; Funding acquisition, H.Z. All authors have read and agreed to the published version of the manuscript.

Funding

The present work was supported by the Fundamental Research Funds for Central Universities (3122019180).

Data Availability Statement

The data presented in this study are available on request from the corresponding author. The data are not publicly available due to privacy reasons.

Conflicts of Interest

Author Zhilong Fan was employed by the company Eastern Airlines Technology Co., Ltd. The remaining authors declare that the research was conducted in the absence of any commercial or financial relationships that could be construed as a potential conflict of interest.

Abbreviations

The following abbreviations are used in this manuscript:
APMTSAdaptive Power and Thermal Management System
PSOParticle Swarm Optimization
ACPSOAdaptive Chaotic Particle Swarm Optimization
T/EMMPower and Thermal Management Components
CTCooling turbine
PTPower turbine
HPCHigh-pressure compressor
LPCLow-pressure compressor
HPTHigh-pressure turbine
LPTLow-pressure turbine
ISGIntegrated starter-gene
SFCSpecific fuel consumption
HXHeat exchanger
CPUCombine power unit
MOPSOMulti-objective Particle Swarm Optimization

References

  1. Guo, S.; Wang, Y.; Pan, J.; Li, A. Integrated Technology of Aircraft Electromechanical Fluid System, 1st ed.; Shanghai Scientific & Technical Publishers: Shanghai, China, 2020. (In Chinese) [Google Scholar]
  2. Scholz, D.; Seresinhe, R.; Staack, I.; Lawson, C. Fuel Consumption Due to Shaft Power Off-Takes from the Engine; Shaker Verlag: Düren, Germany, 2013. [Google Scholar] [CrossRef]
  3. Slingerland, R.; Zandstra, S. Bleed Air versus Electric Power Off-takes from a Turbofan Gas Turbine over the Flight Cycle. In Proceedings of the 7th AIAA ATIO Conf, 2nd CEIAT Int’l Conf on Innov and Integr in Aero Sciences, 17th LTA Systems Tech Conf; Followed by 2nd TEOS Forum, Belfast, Northern Ireland, 18–20 September 2007. [Google Scholar] [CrossRef]
  4. Van Heerden, A.; Judt, D.; Jafari, S.; Lawson, C.; Nikolaidis, T.; Bosak, D. Aircraft Thermal Management: Practices, Technology, System Architectures, Future Challenges, and Opportunities. Prog. Aerosp. Sci. 2022, 128, 100767. [Google Scholar] [CrossRef]
  5. Luo, Z.; Wang, X.; Huang, C. Adaptive Power and Thermal Management System for New Generation Aircraft. Aeronaut. Sci. Technol. 2012, 5, 38–41. (In Chinese) [Google Scholar]
  6. Roberts, R.A.; Decker, D.D. Control Architecture Study Focused on Energy Savings of an Aircraft Thermal Management System. J. Dyn. Syst. Meas. Control 2014, 136, 041003. [Google Scholar] [CrossRef]
  7. Stoia, M.F.; Ek, G.W.; Bowcutt, K.G.; Needels, J.T. Integrated Power and Thermal Management System for High Speed Aircraft. In Proceedings of the AIAA Propulsion and Energy 2021 Forum, Virtual Event, 9–11 August 2021. [Google Scholar] [CrossRef]
  8. Hu, X. Modeling and Performance Analysis of Power Thermal Management System Based on MATLAB Simulation Platform. Master’s Thesis, Nanjing University of Aeronautics and Astronautics, Nanjing, China, 2018. (In Chinese). [Google Scholar]
  9. Zhuang, L.; Xu, G.; Dong, B.; Liu, Q.; Huang, C.; Wen, J. Study on performance and mechanisms of a novel integrated model with Power & Thermal Management system and turbofan engine. Appl. Therm. Eng. 2023, 219, 119481. [Google Scholar] [CrossRef]
  10. Rong, A.; Pang, L.; Jiang, X.; Qi, B.; Shi, Y. Analysis and Comparison of Potential Power and Thermal Management Systems for High-Speed Aircraft with an Optimization Method. Energy Built Environ. 2021, 2, 13–20. [Google Scholar] [CrossRef]
  11. Lei, Y. Research on Scheme of Integrated Thermal and Energy Management System of Aircraft. Master’s Thesis, Nanjing University of Aeronautics and Astronautics, Nanjing, China, 2016. (In Chinese). [Google Scholar]
  12. Lei, T.; Min, Z.; Gao, Q.; Song, L.; Zhang, X.; Zhang, X. The Architecture Optimization and Energy Management Technology of Aircraft Power Systems: A Review and Future Trends. Energies 2022, 15, 4109. (In Chinese) [Google Scholar] [CrossRef]
  13. Zheng, F.; Chen, Y.; Zhang, J.; Cheng, F.; Zhang, J. A Two-Stage Energy Management for Integrated Thermal/Energy Optimization of Aircraft Airborne System Based on Stackelberg Game. Energy 2023, 269, 126506. [Google Scholar] [CrossRef]
  14. Huang, Y.; Wang, Y.; Liu, N. A Two-Stage Energy Management for Heat-Electricity Integrated Energy System Considering Dynamic Pricing of Stackelberg Game and Operation Strategy Optimization. Energy 2022, 244, 122576. [Google Scholar] [CrossRef]
  15. Chen, Y.; Wang, X.; Qian, T.; Wu, X. Energy Management in Microgrids Based on Generalized Stackelberg Game Theory. Electr. Power Autom. Equip. 2022, 42, 171–177. (In Chinese) [Google Scholar] [CrossRef]
  16. Zhou, B.; Peng, H.; Zang, T.; Zhang, Y.; Zhao, W.; Cao, Q. Peer-to-Peer Trade Strategy for Multi-microgrid System Based on Stackelberg Game. Proc. CSU-EPSA 2023, 35, 103–111. (In Chinese) [Google Scholar] [CrossRef]
  17. Chen, L.; Fan, Y.; Li, G.; Li, F.; Zhao, D. Energy Optimization Management Strategy of Photovoltaic Hydrogen Production System Based on Stackelberg Game. Mod. Electr. Power 2024, 41, 507–516. (In Chinese) [Google Scholar] [CrossRef]
  18. Chen, W.; Luo, W.; Liang, K.; Bai, C. Research on New Energy Investment Strategy Based on Non-cooperative and Cooperative Bimatrix Games. J. Syst. Sci. Math. Sci. 2024, 44, 3557–3572. (In Chinese) [Google Scholar] [CrossRef]
  19. Lin, J.; Li, G. Power Allocation Based on Stackelberg Game in Wireless Location Network. In Proceedings of the 14th Annual Conference on Satellite Communications; College of Communications Engineering, Army Engineering University of PLA: Nanjing, China, 2018; pp. 397–404. (In Chinese). [Google Scholar]
  20. Zhang, X.; Wang, Y.; Zhang, H.; Zhao, J.; Jia, R. Research on High-Speed Automatic Lane Change Decision-Making and Planning Considering Driving Style. Automob. Technol. 2024, 1, 17–28. (In Chinese) [Google Scholar] [CrossRef]
  21. Xu, H.; Chen, p.; Li, X.; Wang, P.; Ma, L. Charging Management Strategy of Electric Vehicle Based on Stackelberg Game. Comput. Appl. Softw. 2024, 41, 382–388. (In Chinese) [Google Scholar] [CrossRef]
  22. Soleymani, M.; Mostafavi, V.; Hebert, M.; Kelouwani, S.; Boulon, L. Hydrogen Propulsion Systems for Aircraft, a Review on Recent Advances and Ongoing Challenges. Int. J. Hydrogen Energy 2024, 91, 137–171. [Google Scholar] [CrossRef]
  23. Tiwari, S.; Pekris, M.J.; Doherty, J.J. A Review of Liquid Hydrogen Aircraft and Propulsion Technologies. Int. J. Hydrogen Energy 2024, 57, 1174–1196. [Google Scholar] [CrossRef]
  24. Zhang, J.; Roumeliotis, I.; Zolotas, A. Model-Based Fully Coupled Propulsion-Aerodynamics Optimization for Hybrid Electric Aircraft Energy Management Strategy. Energy 2022, 245, 123239. [Google Scholar] [CrossRef]
  25. He, L.; Chen, F.; Tian, P.; Gou, H. An Improved Energy Management Strategy for Hybrid Electric Powered Aircraft Based on Deep Reinforcement Learning. Aerosp. Sci. Technol. 2024, 149, 109137. [Google Scholar] [CrossRef]
  26. Yang, C.; Lu, Z.; Wang, W.; Li, Y.; Chen, Y.; Xu, B. Energy Management of Hybrid Electric Propulsion System: Recent Progress and a Flying Car Perspective under Three-Dimensional Transportation Networks. Green Energy Intell. Transp. 2023, 2, 100061. [Google Scholar] [CrossRef]
  27. Hayes, D.; Lone, M.; Whidborne, J.F.; Camberos, J.; Coetzee, E. Adopting Exergy Analysis for Use in Aerospace. Prog. Aerosp. Sci. 2017, 93, 73–94. [Google Scholar] [CrossRef]
  28. Ge, Y.; Song, B.; Pei, Y. Analysis Method of More-electric Aircraft Energy Efficiency Based on Exergy. Acta Aeronaut. Astronaut. Sin. 2014, 35, 1276–1283. (In Chinese) [Google Scholar] [CrossRef]
  29. Da Costa Baptista, F.M. A 0-D Off-Design Performance Prediction Model of the CFM56-5B Turbofan Engine. Ph.D. Thesis, Techico Lisboa, Lisboa, Portugal, 2017. [Google Scholar]
  30. Quevedo-Reina, R.; Álamo, G.M.; Aznárez, J.J. ANN-based Surrogate Model for the Structural Evaluation of Jacket Support Structures for Offshore Wind Turbines. Ocean Eng. 2025, 317, 119984. [Google Scholar] [CrossRef]
  31. Candon, M.; Esposito, M.; Fayek, H.; Levinski, O.; Koschel, S.; Joseph, N.; Carrese, R.; Marzocca, P. Advanced Multi-Input System Identification for next Generation Aircraft Loads Monitoring Using Linear Regression, Neural Networks and Deep Learning. Mech. Syst. Signal Process. 2022, 171, 108809. [Google Scholar] [CrossRef]
  32. Cao, J.; Yang, D.; Dehghanian, P. Co-Optimization of Multiple Virtual Power Plants Considering Electricity-Heat-Carbon Trading: A Stackelberg Game Strategy. Int. J. Electr. Power Energy Syst. 2023, 153, 109294. [Google Scholar] [CrossRef]
  33. Raju, V.A.G.; Nayak, J.; Dash, P.B.; Mishra, M. Short-Term Solar Irradiance Forecasting Model Based on Hyper-Parameter Tuned LSTM via Chaotic Particle Swarm Optimization Algorithm. Case Stud. Therm. Eng. 2025, 69, 105999. [Google Scholar] [CrossRef]
  34. Zhang, G.; Zhang, J.; Guo, R.; Gao, Z.; Niu, Y. An Adaptive Chaotic Particle Swarm Optimization Based Scheduling Strategy for Combined Cooling, Heating and Power System. Mod. Electr. Power 2020, 37, 551–558. (In Chinese) [Google Scholar] [CrossRef]
  35. Dong, C.; Cheng, H.; Wang, S.; He, C.; Wang, B.; Shao, X.C. Comprehensive Energy System Optimization Based on CIPSO Algorithm. J. Zhejiang Univ. Technol. 2024, 52, 196–202+229. [Google Scholar]
  36. Lampl, T.S.; Muschkorgel, S.; Hornung, M. Parameterized Flight Mission for Secondary Power Requirement Estimations of Commercial Transport Aircraft. In Proceedings of the 17th AIAA Aviation Technology, Integration, and Operations Conference, Denver, CO, USA, 5–9 June 2017. [Google Scholar] [CrossRef]
  37. Yang, Y.; Gao, Z. Power Management Problem for Civil Aircraft under More Electric Environment. Int. J. Aerosp. Eng. 2020, 2020, 8474375. [Google Scholar] [CrossRef]
Figure 1. System architecture of the APTMS system and aircraft engine.
Aerospace 12 00328 g001
Figure 2. The system architecture.
Aerospace 12 00328 g002
Figure 3. The APTMS architecture.
Aerospace 12 00328 g003
Figure 4. Aircraft engine and APTMS system coupling Amesim model.
Aerospace 12 00328 g004
Figure 5. The impact of bleed air on exergy efficiency. (a) Fan duct bleed air vs exergy efficiency; (b) HPC bleed air vs exergy efficiency.
Aerospace 12 00328 g005
Figure 6. The impact of bleed air on the fuel flow. (a) HPC bleed air and fan duct bleed air vs shaft power extraction; (b) HPC bleed air vs. shaft power extraction.
Aerospace 12 00328 g006
Figure 7. The optimization direction of fuel and exergy efficiency. (a) The economy of aircraft engine optimization direction; (b) exergy efficiency of the APTMS system optimization direction.
Aerospace 12 00328 g007
Figure 8. ANN-based APTMS engine performance surrogate model.
Aerospace 12 00328 g008
Figure 9. Stackelberg–ACPSO algorithm solving process.
Aerospace 12 00328 g009
Figure 10. Change in parameters in iterations.(a) Change of n and q 1 ; (b) Change of q 2 and W s h a f t .
Aerospace 12 00328 g010
Figure 11. Change in performance in iterations. (a) Change of f and η E x ; (b) Change of integrated performance.
Aerospace 12 00328 g011
Figure 12. Diagram of the algorithm optimization results of MOPSO.
Aerospace 12 00328 g012
Figure 13. Comparison between MOPSO and Stackelberg–ACPSO. (a) Comparison of fuel flow between MOPSO and Stackelberg–ACPSO; (b) Comparison of exergy efficiency between MOPSO and Stackelberg–ACPSO.
Aerospace 12 00328 g013
Figure 14. Comparison between Cournot–ACPSO and Stackelberg–ACPSO. (a) Comparison of fuel flow between Cournot–ACPSO and Stackelberg–ACPSO; (b) Comparison of exergy efficiency between Cournot–ACPSO and Stackelberg–ACPSO.
Aerospace 12 00328 g014
Figure 15. The flight mission simulation results. (a) q 1 and n; (b) q 2 and W s h a f t .
Aerospace 12 00328 g015
Figure 16. Comparison between Stackelberg–ACPSO, Cournot–ACPSO and MOPSO. (a) Comparison of fuel flow and exergy efficiency between Stackelberg–ACPSO and Cournot–ACPSO; (b) Comparison of fuel flow and exergy efficiency between Stackelberg–ACPSO and MOPSO.
Aerospace 12 00328 g016
Table 1. Aircraft engine modeling equilibrium equation.
Equilibrium   Equation
High-pressure rotor shaft power balance W H T η H = W c + W s h a f t , e x
Low-pressure rotor shaft power balance W L T η L = W F
Combustor outlet flow balance m ˙ 4 + m ˙ f = m ˙ 5
HPT outflow balance m ˙ 45 = m ˙ 5
Fan outflow balance m ˙ 2 = m ˙ b y p a s s + m ˙ c o r e
Nozzle inflow and outflow balance m ˙ 7 = m ˙ 9
Fan duct airflow balance m ˙ 2 = m ˙ b y p a s s + m ˙ b y b
HPC airflow balance m ˙ 3 = m ˙ 25 + m ˙ c b
Table 2. Modeling parameters of the aircraft engine.
ParametersValue
Turbine entry temperature1696 K
Combustion chamber efficiency0.99
Pressure ratio of HPC10.668
Pressure ratio of outer fan1.69
Pressure ratio of inner fan3.197
High-pressure shaft speed14,736 r/min
Low-pressure shaft speed5057 r/min
Power turbine entry temperature473.15 K
Cool side airflow of fan bypass duct HX2 kg/s
Cool side airflow of fuel HX2 kg/s
Fuel temperature298.15 K
Standard atmosphere pressure101,325 Pa
Standard shaft speed22,500 r/min
Table 3. Comparsion of Stackelberg–ACPSO and Cournot–ACPSO.
PerformanceFuel Flow (g/s)Exergy Efficiency
Stackelberg–ACPSO404.6100.76357
Cournot–ACPSO405.040.76316
Table 4. Cruise simulation conditions.
ConditionAltitude/mMa
192500.76
292500.78
392500.8
495000.76
595000.78
……………
1210,0000.80
Table 5. Flight simulation conditions.
ConditionTime (s)MaAltitude (m)Net Thrust
(kN)
Electrical
Power
Demand (kW)
Cooling Power
Demand (kW)
100011046.951522.25
2120.40.2417309038.3630321.5
3287.40.413361524.196456539.3345923
4443.20.5023230486047.5990623.75
5481.20.5413279.537662644.0497523.75
66300.603234840.7548.338.3996224.5
7779.40.664216402.025154238.1967127.5
810210.747488274.1359234.137.2820327.7
91262.80.781079754.3423620.536.632131.25
1034500.781079754.3423620.536.632131.25
113471.60.780359754.342361736.8372531.25
123780.70.723017728.646321736.3784727.7
134089.80.631555574.806291736.5719827.5
1446660.442182665.658761742.8895923.750
155243.80.23248457.025131734.7271623
1654440.2324801740.456522.25
Disclaimer/Publisher’s Note: The statements, opinions and data contained in all publications are solely those of the individual author(s) and contributor(s) and not of MDPI and/or the editor(s). MDPI and/or the editor(s) disclaim responsibility for any injury to people or property resulting from any ideas, methods, instructions or products referred to in the content.

