4.2. Workload and Situational Awareness
The analyses of ISA queries, voice communication, and XFL errors are described in the following.
In total, 308 ISA responses were considered for analysis. Due to unmatched scenario pairs, independent t-tests were performed to compare the ISA response times between traffic scenarios as well as solution and baseline scenarios. The response times did not significantly differ between the low-traffic (M = 7.30, SD = 5.35) and high-traffic (M = 7.34, SD = 5.89) runs, t = 0.057, p = 0.955. However, the response times were significantly longer in the baseline runs (M = 8.32, SD = 6.73) compared to the solution runs (M = 6.58, SD = 4.58), t = 2.56, p = 0.011. This could lead to the conclusion that the workload in solution runs was lower.
Further, Mann-Whitney-U tests were calculated to assess ISA responses across scenarios. Between baseline and solution scenarios, no significant differences were found, U = 12.48, p = 0.250. However, the high-traffic scenarios were rated significantly higher on the ISA than the low-traffic ones, U = 14.89, p < 0.001. This trend is also observed on the NASA-TLX in [
5], which showed higher reported workload during the high-traffic scenarios. It may be that the higher workload during the higher-traffic scenarios is not reflected in the response times as the workload levels were too low to negatively affect the response times. Moreover, participants may take longer to respond to ISA queries during the baseline runs because they are engaged in conversation with the planning controller and are less focused on the screen. With a mean of 2.39 and a standard deviation of 0.85, the workload was generally from rated “relaxed” to “comfortable” across all conditions.
To objectively assess workload, ref. [
53,
54] used a variety of physiological measures that were not applied for the validation at hand. However, ref. [
55] showed the correlation of those measures to the radio communication parameter, as analysed in the following.
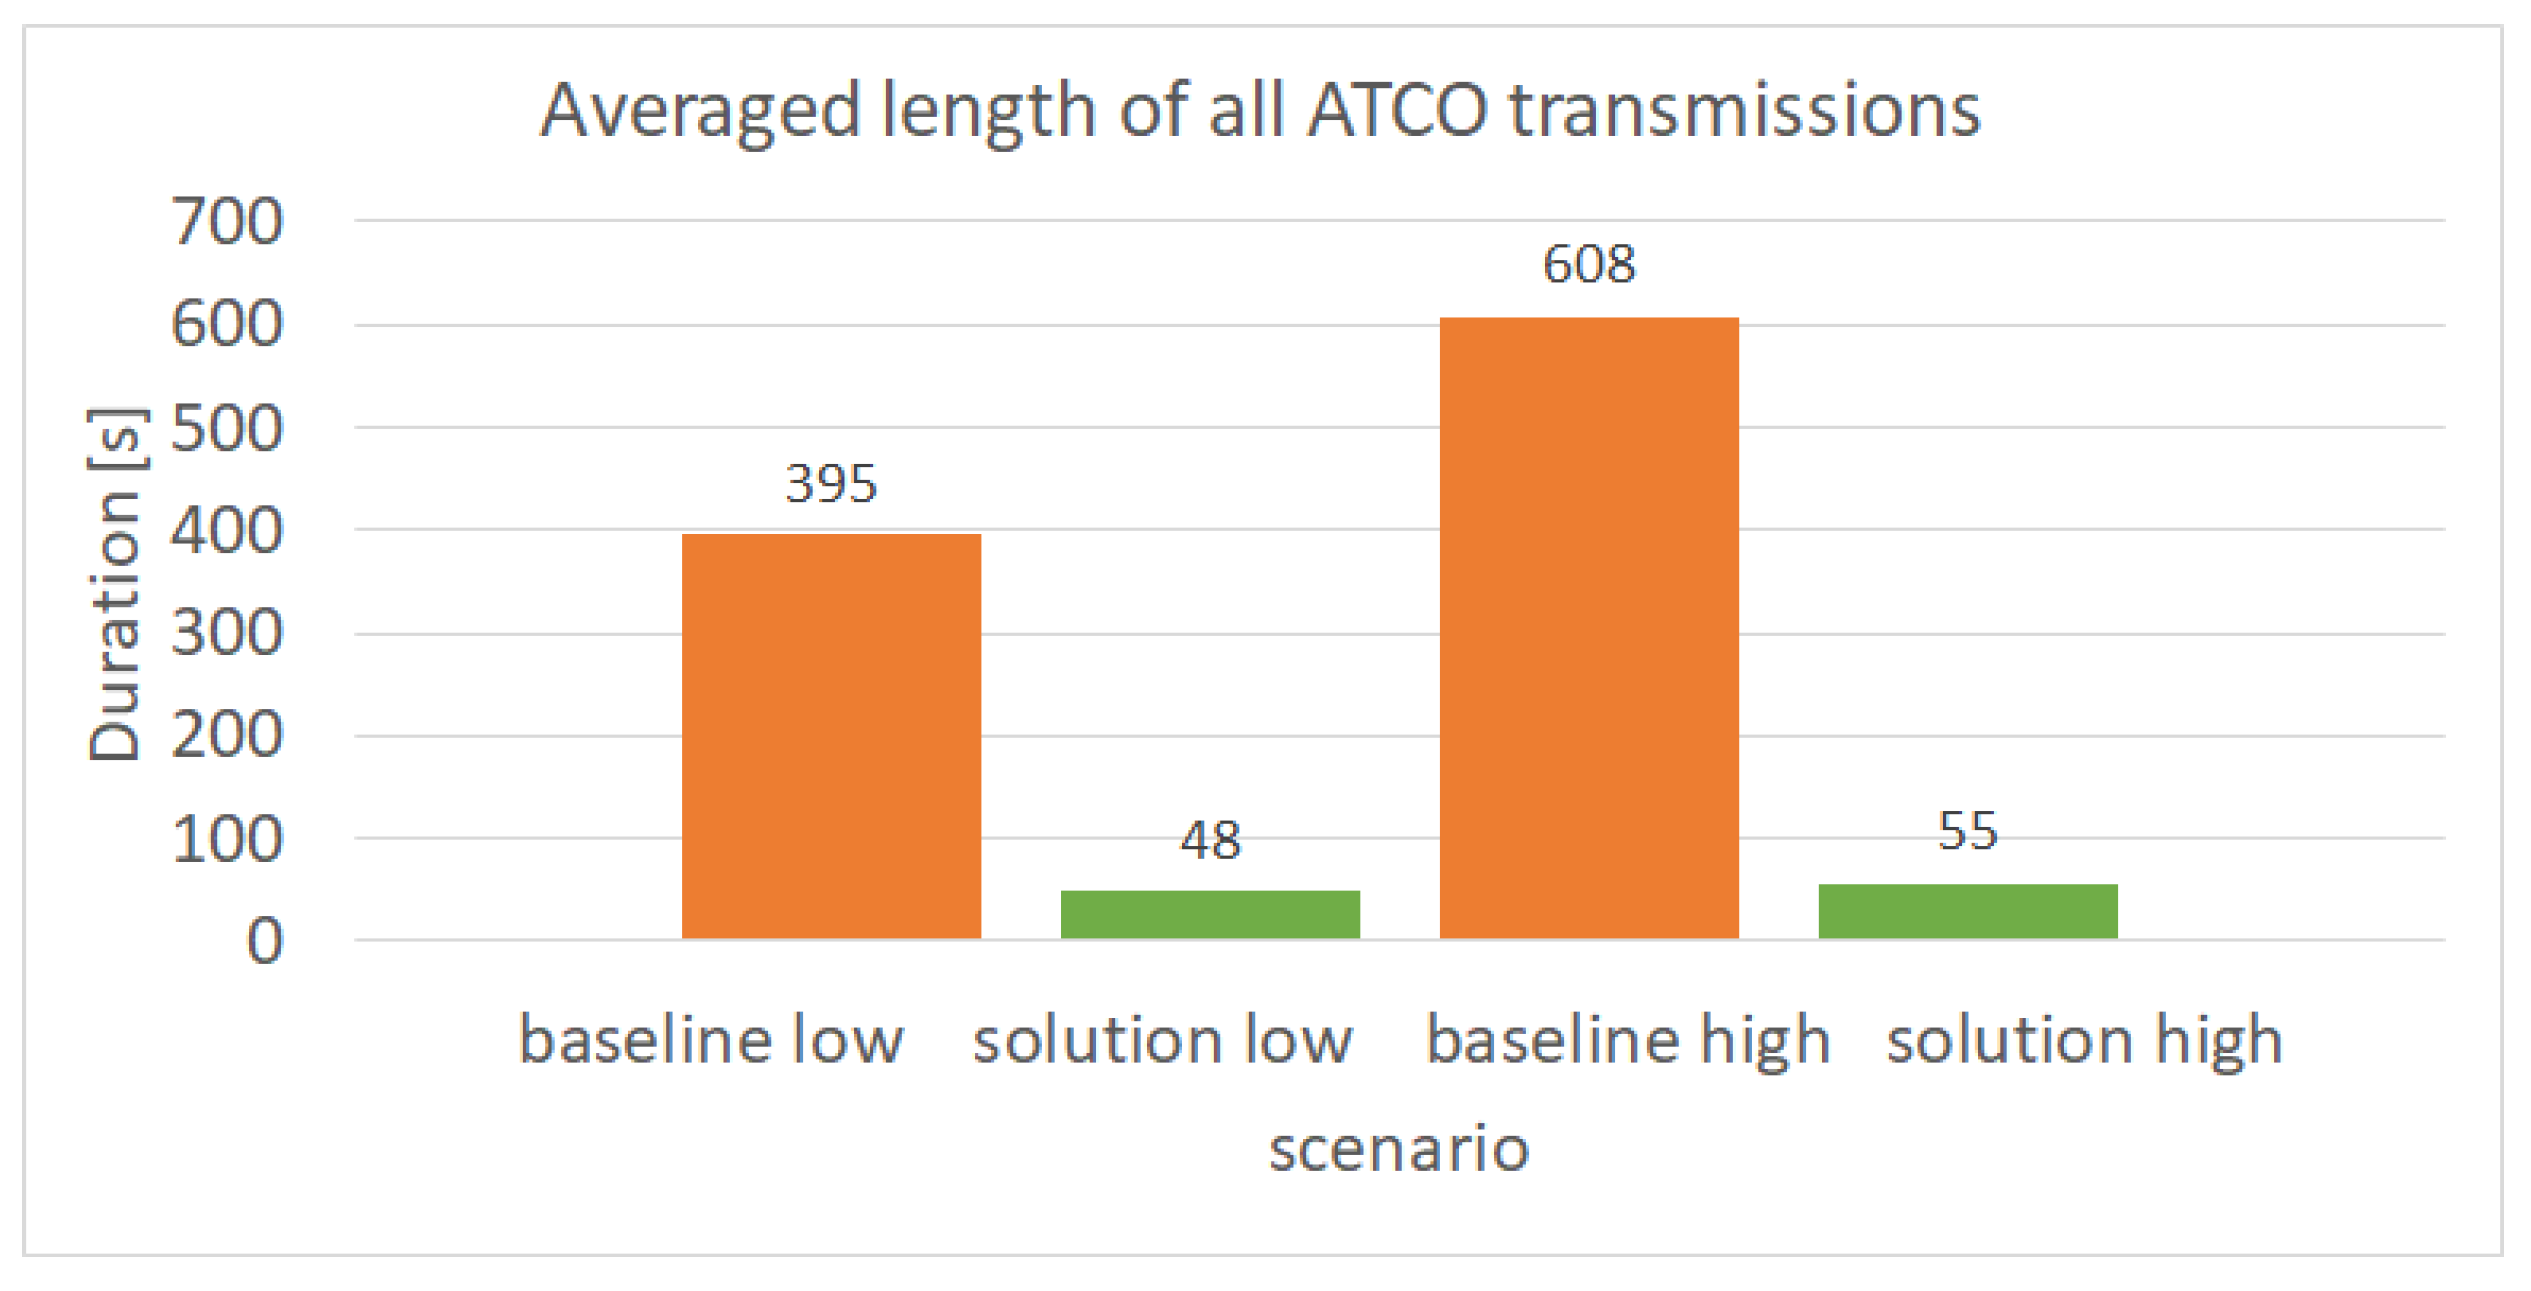
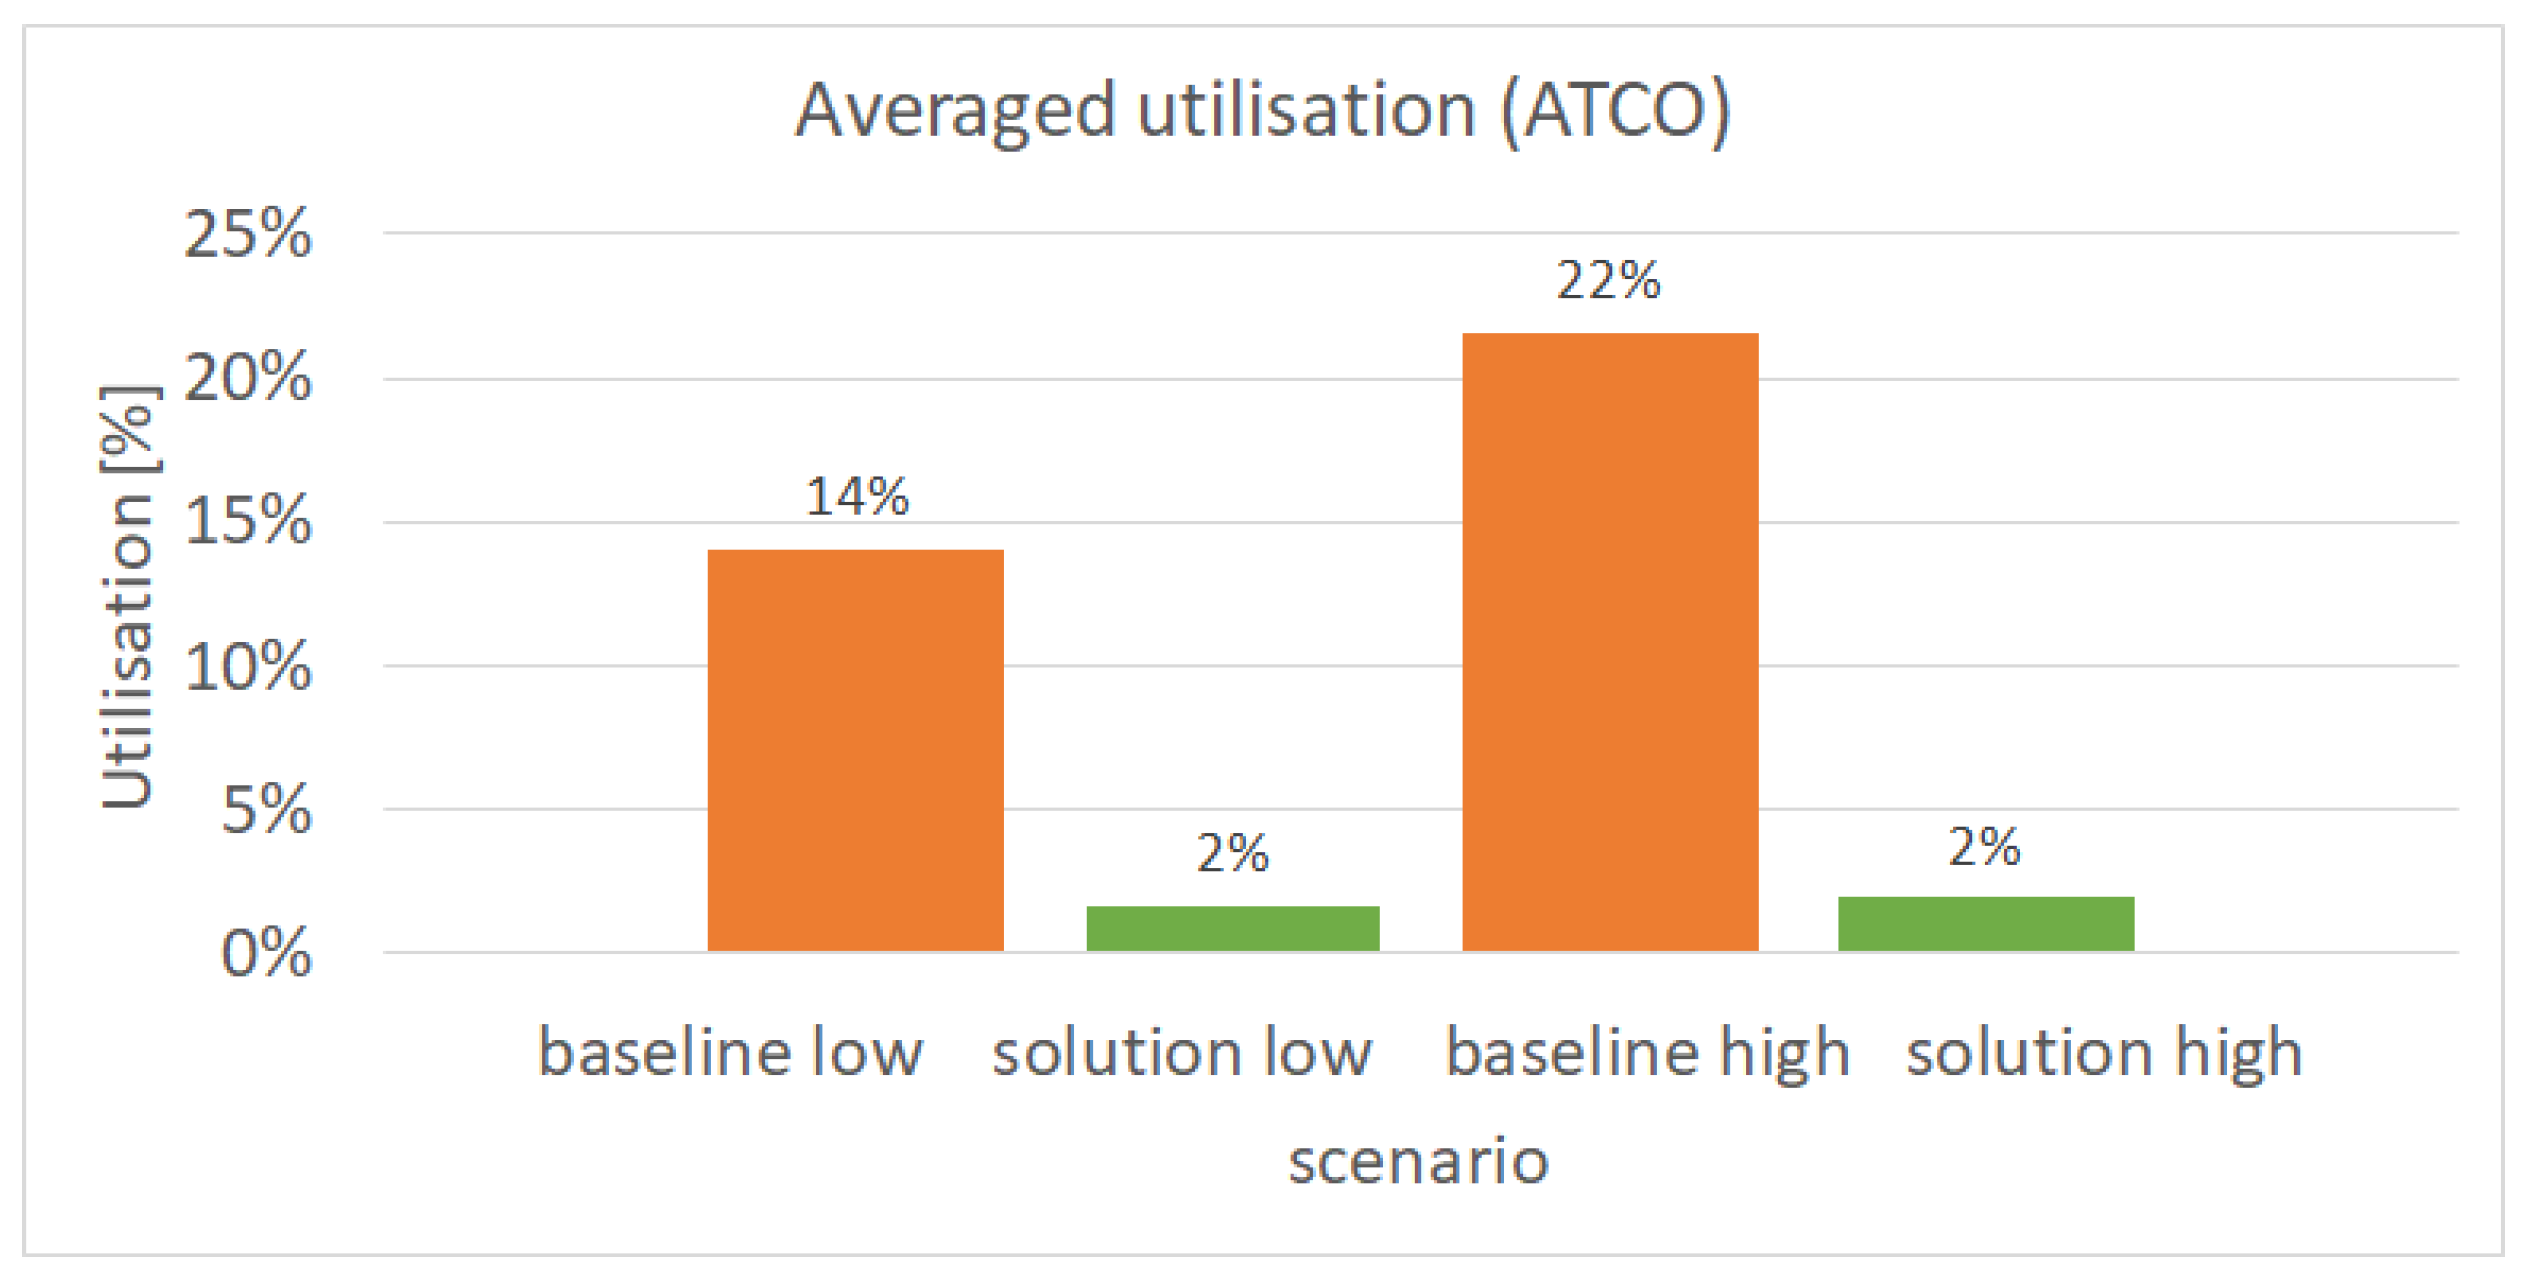
Figure 6,
Figure 7 and
Figure 8 visualise the average number of radio–telephony contacts (transmissions), their average overall duration, and the average utilisation in relation to the simulation time over all simulation runs.
Figure 6 shows on average around 91 transmissions in the baseline low scenarios. The number clearly increases to 133 in the baseline high scenarios due to the higher amount of managed aircraft, which leads to more radio–telephony contacts. For the solution scenarios, on the other hand, there is only a minor difference in the number of transmissions between the low and high scenarios, which shows that the higher amount of aircraft did not require significantly more verbal communication in scenarios where CPDLC was the preferred way of providing clearances.
Figure 7 shows the amount of time the ATCO needed to communicate all required clearances to the pilots. For baseline low scenarios, the duration of ATCO speech during simulation runs was on average 6.6 min (395 s) and 10.1 min (608 s) for baseline high scenarios. The solution scenarios again show only a minor difference between the low (48 s) and high (55 s) scenarios.
Figure 8 sets the ATCO communication time from
Figure 7 in relation to the total simulation time of a simulation run. This shows that in baseline low scenarios, the ATCO required 14% of the time in a simulation run to issue all verbal clearances. This increased to 22% in the baseline high scenarios. For the solution runs, the time needed for verbal communication from the ATCO site made up only 2% of the simulation run duration.
Figure 7.
Length of all transmissions in seconds averaged over all runs per scenario.
Figure 7.
Length of all transmissions in seconds averaged over all runs per scenario.
Figure 8.
Percentage of run duration used for radiotelephony (sending) averaged of all runs per scenario.
Figure 8.
Percentage of run duration used for radiotelephony (sending) averaged of all runs per scenario.
All parameters reflect the same relationship: the possibility of using CPDLC with all aircraft reduces the number of necessary radio transmissions and thus the average total duration of all radio transmissions and the utilisation, i.e., the proportion of time spent on (controller) voice radio in the total time. Although 100% CPDLC equipment of the aircraft was assumed, only a few, frequently used, instructions were available for CPDLC. It was also possible, and sometimes necessary, to give instructions by radio in the solution scenarios. This takes into account the current operational limitations of CPDLC: First, the wide range of possible ATCO instructions is not fully covered. Second, time critical instructions require instant responses from pilots or a clear indication possibility from the ATCO that the pilot did not react. With readback, this indication possibility is realised faster than with the current usual CPDLC response time of 2 min [
67]. To obtain comparable scenarios, readback errors and missing readback events in baseline scenarios were replaced by simulated CPDLC failures, including an indication in the aircraft label in the solution scenarios, leading to roughly the same increase in workload being brought on by these events in all scenarios. However, the response times of the pseudo pilots for speech and CPDLC were not defined, resulting in similar times.
It is also evident in the comparison of both solution scenarios that there are nearly no extra transmissions despite the doubling of traffic (see
Figure 6). This could be expected as voice communication is only used for complex instructions and/or such events not covered by CPDLC, i.e., aircraft with sick passengers and CPDLC failures. However, there is a similar effect for the baseline scenarios: a doubling of the traffic volume is covered with 1.5 times the number of transmissions. This is a good example to show that an increase in the traffic amount does not necessarily lead to the same increase in complexity and/or in communication. A larger proportion of the additional aircraft compared to the low scenario is passing through the sector without the need of additional instructions. Nevertheless, even these aircraft add workload to ATCOs as they need to and will be considered for other potentially conflicting traffic.
Voice communication is only one part of the ATCO’s task load and workload. However, the above-mentioned significant reduction when using CPDLC for very few basic instructions would contribute to a lower ATCO workload and enable an SC to maintain the workload level of an ATCO in an ATCO team. The usage of CPDLC reduces readback to the same extent and is not taken into account in the data, despite creating additional capacity for the ATCO. As described above, this contradicts the subjective assessment in [
5], which needs further analysis.
In the analysis of XFL deviations, some aircraft were excluded as no electronic coordination was possible due to coordination system outtakes during part of the validation runs. In these cases, the controllers were instructed to consider their own coordination as accepted. Thus, the number of runs in
Table 7 is higher than that in
Table 8.
Table 8 shows the distribution of the remaining deviations across the scenarios and the average number of deviations per scenario. The deviations are also divided into four categories:
For
minor deviations, it can be assumed that they cease in the following seconds and were therefore not coordinated by the ATCOs. The effort is greater than the benefit if the controller is assumed to be aware of all surrounding traffic. All
medium deviations are closer or as close to another assignable FL as to the coordinated FL, whereas
large deviations correspond to an occupation of a wrong i.e., not coordinated, FL.
Lateral excursions can be regarded as particularly critical, as the lateral sector may not even be aware of the aircraft and cannot include it in the preliminary planning. In addition, a separate categorisation was made for
forgotten aircraft that have an identical actual entry and exit FL but a different coordinated XFL. In this case, it can be assumed that these aircraft were completely overlooked. In other cases, aircraft may have been instructed to fly to the coordinated FL, but did not reach the corresponding FL or were not coordinated in time. Although XFL deviations are used in the literature [
51] to assess situational awareness, a deviation to severity levels, as used in this analysis, is not performed. The result of an “uncontrolled” scenario is given as an additional reference value. In this case, no controller intervened, and all aircraft followed their flight plan. Even in the uncontrolled scenario, the number of deviations is too low to perform
t-tests. Nevertheless, from an operational perspective, the amount of XFL deviations is high. The reason for this is the intended explicit non-intervention of the pseudo pilots and, in particular, the pseudo controller. In operational mode, pilots would ask for higher or lower FLs as soon as it seemed necessary or operationally sensible from their point of view. Neighbouring sectors would call and make enquiries, act proactively, and coordinate or complain. In addition, events such as not adhering to a rate that was correctly read back actively favoured deviations. These measures were initially taken to simulate a more realistic environment (e.g., where there are also pilots mistakes) and, secondly, to ensure as far as possible the occurrence of XFL deviations to enable a comparison. This comparison contains a key message: The SCO concept and system can perform comparably well. Analysing only the low scenarios, nearly all XFL deviation categories show higher average values in the low-traffic solution runs. However, the number of considered runs was higher and the difference was not significant. Still, it is remarkable that these deviations occur in relaxed traffic conditions, as shown by ISA values. One reason could be the missing Attention Guidance for XFLs. There was no coloured indication in the label. In the baseline scenario, this could have been caught by the planner controller as it is their primary task to coordinate handover conditions with adjacent sectors. The comparison of high scenarios show the opposite: nearly all deviation categories show lower values for the solution scenario. Again, the differences are not significant. Based on this and the response time to ISA queries, it can be concluded that the level of situational awareness is hardly impaired by SCO.
Table 8.
XFL deviations.
| Scenario | Baseline Low | Solution Low | Uncontrolled Low | Baseline High | Solution High | Uncontrolled High |
|---|
| runs | 3 | 5 | 1 | 7 | 7 | 1 |
| average number | 4.3 | 5.8 | 16 | 10 | 9.3 | 27 |
| average minor | 0.1 | 0.4 | 0 | 0.6 | 0.1 | 0 |
| average medium | 0.7 | 0.2 | 1 | 1.7 | 1 | 2 |
| average large | 3.3 | 4.6 | 13 | 6 | 6.6 | 20 |
| average lateral excursion | 0 | 0.6 | 2 | 1.7 | 1.6 | 5 |
| average forgotten | 0.7 | 0.8 | not applicable | 1.3 | 1 | not applicable |
4.4. Environmental Impact
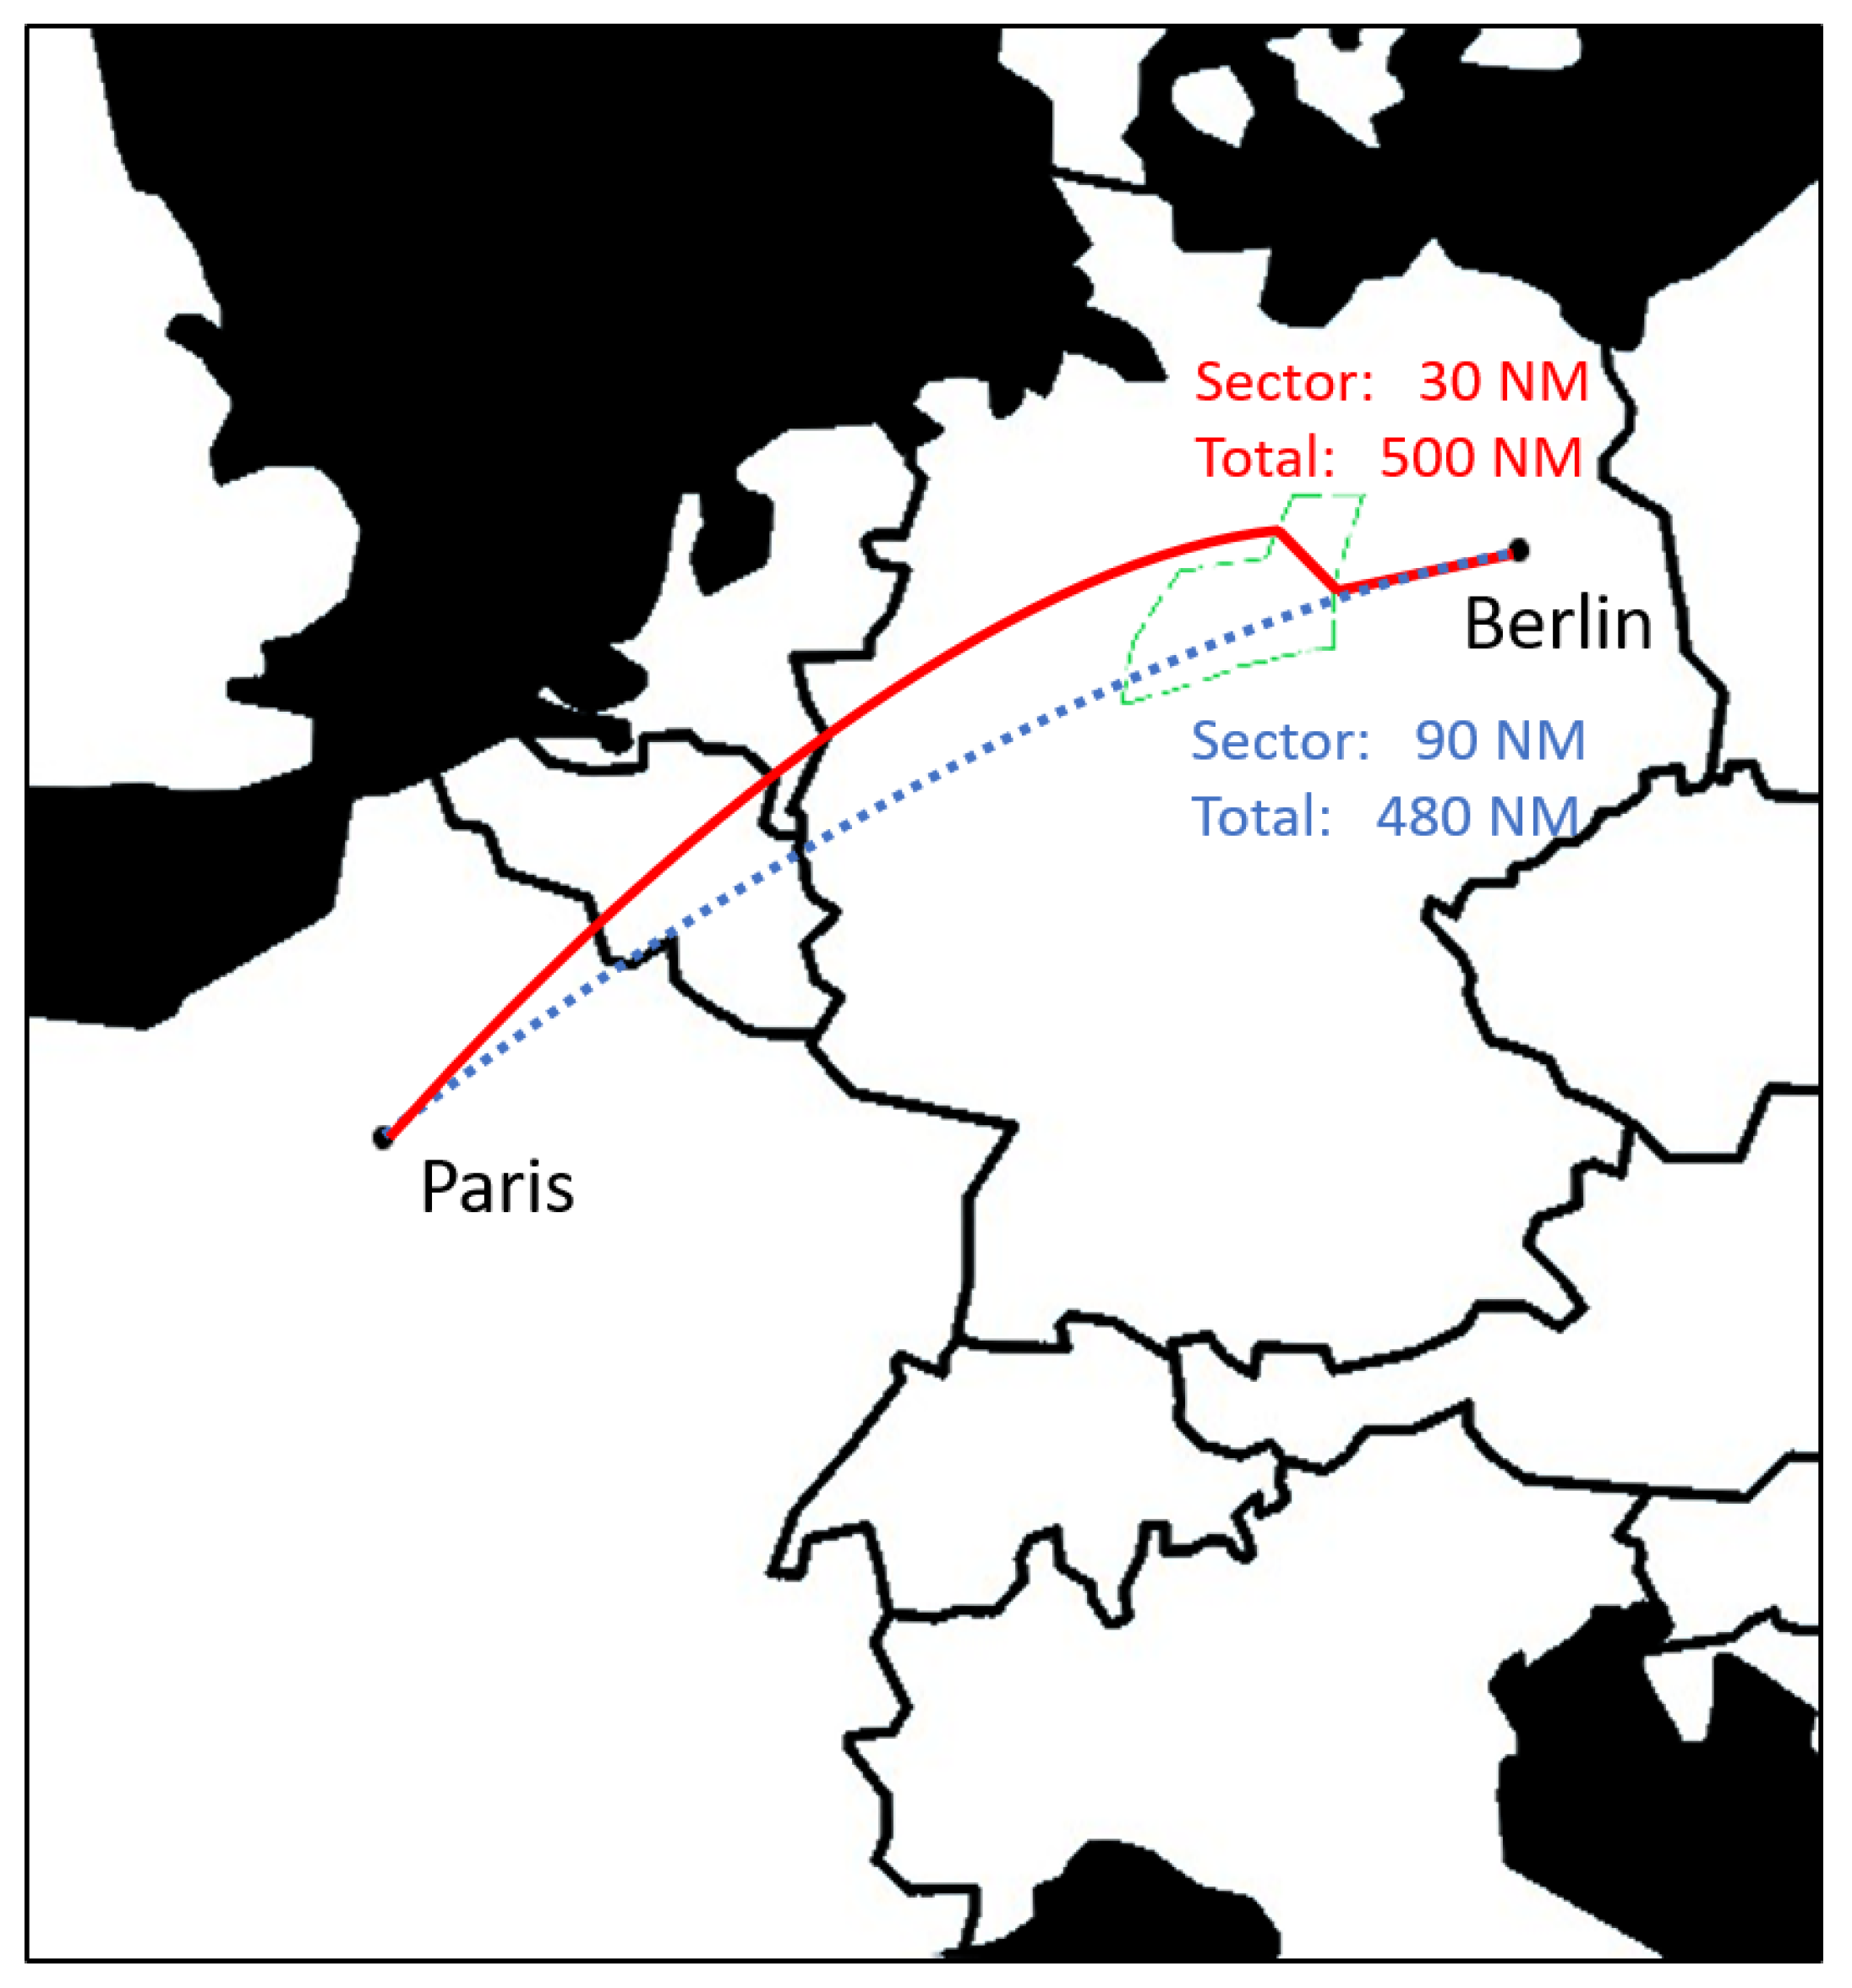
To determine the environmental impact, the flight duration and distance of each aircraft was recorded. Using the operational performance data, the scenario distance, duration comparison, and the aircraft type, it is possible to calculate the fuel burned by each aircraft. The data used for the calculation are taken from the NARSIM BADA v3.16 simulation environment. Excluding the aircraft affected by the sick passenger event and combining the data for each scenario, it is possible to obtain a comparison of the baseline and solution scenario runs.
For the high-traffic scenario, a total reduction of 4010 kg of fuel is calculated. By using the tools, a fuel consumption of 98.8% of the baseline is achieved (
Table 10), leading to an average fuel difference of 98 kg and saving close to 310 kg of CO
2 per flight. For the low-traffic scenario, the opposite is the case, with an additional consumption of 3225 kg of fuel and an increased consumption of 102.2% compared to the baseline.
The increase between the baseline and solution for low scenarios could be due to the influence of individual performance, as the baseline low scenario was conducted four times, whereas the solution low scenario was conducted seven times. Furthermore, the analysis is based on the lateral difference between corresponding flights of baseline and solution scenarios considering BADA [
58]. Vertical differences (e.g., descending an aircraft unnecessary early) are not analysed in the study.
4.5. Cost Efficiency and Capacity
The validation at hand was not intended to identify the optimal or maximum capacity suitable for SCO. Instead, it aimed to show the ability of an SC to safely and efficiently manage 80% of the traffic of a controller team. The aim of the recordings for capacity were to evidence that potential cost efficiency, safety, and operational efficiency benefits were not caused by less traffic being handled, by the non-acceptance of individual flights, or by delays to flatten traffic peaks.
Realistic cost efficiency calculations require comparable safety, operational efficiency, and environmental impact to baseline scenarios. SCO cost efficiency gains stem from single SC deployments handling at least half the traffic of a two-person ATCO team. For simplification, this study used the declared capacity of an existing sector as a reference, which represents the maximum number of aircraft allowed in a specified sector in a specified time period. This value is typically not required continuously. The two validated conditions for traffic load (40% and 80%) are able to show that SCO is at least equally as cost-efficient as a controller team. The 40% solution scenario performs better than the 80% baseline scenario in terms of safety, workload, and situational awareness according to the applied objective measures in the validation. This also indicates a potential higher cost efficiency, as the 80% solution scenario is just as good, with some exceptions regarding the corresponding baseline scenario. The same applies for both 40% scenarios. The use of a maximum of 80% of the declared capacity was selected to take the situation of an unknown system and sector for the participants into account. However, the findings cannot be extrapolated to 100% declared capacity. Nevertheless, even a potential use of an SC working 80% instead of two ATCOs working 100% equals a theoretical increase of 60% capacity per ATCO. This can be understood through an example of two ATCOs being able to handle 60 aircraft per hour (30 per ATCO per hour) and the SC being able to handle 48 according to the results. As discussed in
Section 2.1.6, the cost efficiency measure, as used in [
61], shows a higher cost efficiency in terms of ATCO hours per flights but a lower overall capacity at the same time. Assuming that 100% of traffic needs to be controlled, SCO brings a potential 40% cost efficiency increase. It has to be admitted that this is a purely theoretical calculation, since, in a controller team, both ATCOs will handle all aircraft as they have different tasks and responsibilities. It is not possible to allocate half the amount to each ATCO as it cannot be assumed that two ATCOs can handle double the amount of traffic of one ATCO. For example, [
13] assumed 60% more capacity if a second ATCO is joining. This would imply that a single ATCO could handle 62.5% without additional means. Furthermore, the required cost for implementation would reduce cost efficiency at least during the introduction phase, as considered in [
61]. In addition, the stated benefit ignores other possible countermeasures of an air navigation service provider (ANSP), e.g., the collapsing of sectors. However, a collapsed sector consisting of two sectors will always have a lower declared capacity than the cumulative declared capacity. On the other hand, it will most likely have a higher declared capacity than any of the single sectors. Whether SCO or collapsing sectors is more beneficial depends on the concrete values of the declared capacity, the maximum traffic load for an SC, and the dependency or relative overlap of flights between the single sectors. Still, SCO has an advantage over collapsing in terms of reducing safety-critical handover times between ATCOs.

