Article

An Innovative Priority-Aware Mission Planning Framework for an Agile Earth Observation Satellite

National Key Laboratory of Aerospace Flight Dynamics, Northwestern Polytechnical University, Xi’an 710072, China
*
Author to whom correspondence should be addressed.
Aerospace 2025, 12(4), 309; https://doi.org/10.3390/aerospace12040309
Submission received: 17 February 2025 / Revised: 28 March 2025 / Accepted: 3 April 2025 / Published: 4 April 2025
(This article belongs to the Section Astronautics & Space Science)

Abstract

:
Earth observation satellites, particularly agile Earth observation satellites (AEOSs) with enhanced attitude maneuverability, have become increasingly crucial in emergency response and disaster monitoring operations. Efficient mission planning for densely distributed ground targets with diverse priorities poses significant challenges, especially when considering strict attitude maneuver constraints and time-sensitive requirements. To address these challenges, this paper proposes a target clusters and dual-timeline optimization (TCDO) framework that integrates priority-based geographical clustering with temporal–spatial coordination mechanisms for efficient mission planning. The proposed approach effectively maintains satellite maneuver constraints while achieving significant improvements in priority-based target acquisition and computational efficiency. Experimental results demonstrate the framework’s superior performance, achieving a 94% coverage rate and a 99.5% reduction in computation time compared to traditional scheduling methods, such as linear programming and genetic algorithms.

1. Introduction

Natural disasters (floods, earthquakes, and wildfires) and urban security incidents (large-scale emergencies, critical infrastructure threats, and mass public gathering events) necessitate rapid Earth observation capabilities, driving the demand for efficient and flexible satellite monitoring systems [1,2,3]. In such time-critical scenarios, the capability to swiftly acquire high-resolution imagery of specific targets while maintaining comprehensive situational awareness is essential [4,5,6]. Agile Earth observation satellites (AEOSs), equipped with enhanced attitude control through roll and pitch adjustments, have emerged as vital tools for emergency response monitoring [7,8,9]. However, the effective utilization of these satellites presents significant mission planning challenges, particularly when addressing densely distributed observation targets with heterogeneous priority levels [10,11,12]. These challenges manifest primarily in coordinating observations across multiple high-priority targets while satisfying strict physical constraints, including attitude maneuver limitations and continuous observation requirements for data quality [13,14,15]. The complexity intensifies with the necessity to select optimal observation windows from multiple available time periods within the planning horizon while accounting for temporal coupling between successive observations [16,17,18]. This temporal–spatial coordination requirement, combined with emergency response urgency, presents a distinctive set of challenges that substantially impact satellite mission planning effectiveness [19,20].
While real-world satellite operations do involve complex interactions between subsystems (e.g., power management, sensor types, and environmental factors like cloud cover), the current study focuses on the core challenge of efficiently coordinating the observations of multiple high-priority targets under strict time and maneuver constraints. Our research primarily addresses the task scheduling problem for densely distributed targets, where the focus is on optimizing satellite attitude maneuvers and minimizing observation delays, thereby enhancing operational efficiency in time-sensitive scenarios. The effects of environmental factors, such as sensor performance or energy management, are outside the scope of the current study but could be explored in future work.
While comprehensive satellite operations involve multiple subsystems, including communication scheduling, our study focuses specifically on the observation planning component to achieve advances in priority-based target acquisition. This approach aligns with modular satellite mission planning architectures, where observation scheduling generates data acquisition tasks that are subsequently managed by the communication subsystem.
Satellite mission planning approaches have evolved from energy-centric optimization toward more sophisticated methodologies addressing emergency response requirements [21]. Traditional approaches emphasizing energy optimization and long-term efficiency [22] have advanced through various algorithmic innovations. For instance, Ref. [23] introduced methods for dense region observation, while Ref. [24] developed an automatic task planning approach for observation scheduling. Although these methods represent initial efforts to balance computational efficiency with mission objectives, they exhibit limitations in handling densely distributed targets with varying priorities. Recent research has introduced advanced optimization techniques to address the temporal–spatial complexity inherent in emergency response scenarios [25,26,27]. Notably, Ref. [28] developed collaborative mission planning for area target imaging, while Ref. [29] established an emergency task scheduling framework. Contemporary approaches utilizing multiple strategies [30] show promise in managing complex scenarios. Nevertheless, these methods continue to face significant challenges in simultaneously addressing time-dependent maneuver constraints, priority-based target selection, and temporal coupling in dense distribution scenarios, particularly when the rapid acquisition of high-priority targets is critical for effective emergency response.
To address these limitations and enhance the effectiveness of emergency response satellite mission planning, this paper proposes a target clusters and dual-timeline optimization (TCDO) framework. The TCDO framework synthesizes priority-based geographical clustering with temporal–spatial coordination mechanisms through two key components: a priority-based geographical clustering method that systematically groups targets according to their priority levels and spatial distribution, and a dual-horizon planning mechanism that integrates short-term emergency response optimization with long-term coverage objectives. This comprehensive approach ensures both rapid high-priority target acquisition and efficient overall coverage.
The main contributions of this paper are as follows:
  • A novel priority-based geographical clustering method is developed that effectively manages densely distributed targets while preserving their priority relationships, substantially enhancing computational efficiency in large-scale scenarios.
  • An innovative dual-horizon planning mechanism is proposed that optimally balances immediate emergency response requirements with long-term coverage objectives while rigorously incorporating satellite attitude maneuver constraints.
  • The real-time response capability of the framework is demonstrated through comprehensive experiments, establishing superior performance in both computational efficiency and priority-based target acquisition compared to state-of-the-art methods.
The remainder of this paper is structured as follows: Section 2 presents the system model and problem formulation, encompassing satellite attitude dynamics and target observation constraints. Section 3 delineates our proposed algorithm framework, elaborating on the priority-based clustering method and dual-horizon planning approach. Section 4 presents comprehensive simulation results and a comparative analysis using real-world scenario data. Finally, Section 5 concludes the paper with a summary of contributions and future research directions.

2. Problem Formulation

Emergency response observation missions require agile Earth observation satellites (AEOSs) to efficiently acquire imagery of multiple densely distributed targets with varying priority levels. The core challenge lies in coordinating the satellite’s attitude maneuvers to maximize observation effectiveness while adhering to multiple operational constraints. This section provides a comprehensive mathematical framework for the problem, covering satellite attitude dynamics, observation geometry, and mission constraints.
The problem formulation proceeds as follows: First, we develop a detailed system model to characterize the satellite’s attitude dynamics and observation geometry via coordinate transformations. Next, we specify the physical and operational constraints to ensure feasible mission execution. Finally, the problem is formulated as a mathematical optimization model to guide the development of solution algorithms.
The TCDO framework is designed with flexibility to accommodate various orbital parameters typical for Earth observation missions. Our current implementation and analysis focus on satellites in circular Low Earth Orbit (LEO), which represents the most common configuration for agile Earth observation platforms.

2.1. System Model

While Earth observation satellites typically employ three-axis attitude control, our model focuses on roll and pitch adjustments as the dominant mechanisms affecting target acquisition in the emergency response scenarios considered in this study. This simplification is justified by the regional nature of our application, where yaw requirements remain relatively consistent across observations, a modeling approach that aligns with other state-of-the-art formulations [31].
Figure 1 illustrates the three essential coordinate systems used in our formulation: (1) the Earth-Centered Inertial (ECI) frame O- X I Y I Z I , where the origin O is at the Earth’s center, Z I points along the Earth’s rotation axis, and X I and Y I lie in the equatorial plane, with X I pointing toward the vernal equinox; (2) the orbital coordinate systems o i - x o i y o i z o i (where i 1 , 2 represents different satellite positions), with the origin o i at the satellite’s center of mass at position i, z o i pointing toward the Earth’s center, y o i perpendicular to the orbital plane, and x o i completing the right-handed system along the velocity direction; and (3) the satellite body coordinate systems b i - x i y i z i , where the origin is at the satellite’s center of mass, the z i -axis aligns with the optical axis, and the x i and y i axes align with the satellite’s roll and pitch rotation axes, respectively. The figure also illustrates the line-of-sight (LOS) vectors connecting the satellite to targets T 1 and T 2 , and the roll angles ϕ i and pitch angles θ i required to align the satellite’s optical axis with each target.
The satellite employs a push-broom imaging mode with two-axis attitude maneuverability. The conical regions (shaded in yellow) represent the feasible attitude maneuver envelope of the satellite’s optical axis, which is determined by the maximum roll and pitch angles achievable by the attitude control system.
The relative position between the satellite and a ground target in the ECI frame at time t is expressed as
r s t i ( t ) = r t i ( t ) r s i ( t )
where r t i ( t ) and r s i ( t ) represent the position vectors of the target and satellite in the ECI frame, respectively.
The transformation from ECI to the orbital frame is achieved through a rotation matrix C i o ( t ) :
r s t o ( t ) = C i o ( t ) r s t i ( t )
where C i o ( t ) is determined by the satellite’s orbital position and velocity:
C i o ( t ) = v s i | v s i | r s i × v s i | r s i × v s i | × v s i | v s i | r s i × v s i | r s i × v s i | T
In Equation (3), C i o ( t ) represents the rotation matrix from ECI to the orbital frame at time t, calculated using the satellite’s position vector r s i and velocity vector v s i in the ECI frame. The matrix is constructed using three orthogonal unit vectors: the first row contains the normalized velocity vector v s i | v s i | , which defines the x o -axis of the orbital frame; the third row contains the normalized angular momentum vector r s i × v s i | r s i × v s i | , which defines the z o -axis; and the second row completes the right-handed system. The notation | v s i | indicates the Euclidean norm of the velocity vector, while × denotes the cross-product operation.
The transformation methodology between coordinate systems follows advanced approaches in satellite attitude determination [32,33], adapted for agile Earth observation contexts.
The line-of-sight (LOS) vector from the satellite to the target in the orbital frame can be normalized as
e s t o ( t ) = r s t o ( t ) | r s t o ( t ) | = [ e x o ( t ) , e y o ( t ) , e z o ( t ) ] T
To align the satellite’s optical axis with the target, the body frame needs to rotate from the orbital frame through roll angle ϕ and pitch angle θ . The transformation matrix C o b ( t ) from the orbital to the body frame is
C o b ( t ) = cos θ 0 sin θ sin ϕ sin θ cos ϕ sin ϕ cos θ cos ϕ sin θ sin ϕ cos ϕ cos θ
The LOS vector in the body frame should align with the optical axis along the z-axis:
C o b ( t ) e s t o ( t ) = [ 0 , 0 , 1 ] T
From this alignment condition, the required attitude angles can be derived:
θ ( t ) = arcsin ( e x o ( t ) )
ϕ ( t ) = arctan ( e y o ( t ) e z o ( t ) )
In Equations (7) and (8), θ ( t ) and ϕ ( t ) represent the required pitch and roll angles, respectively, at time t to align the satellite’s optical axis with the target. These angles are derived from the condition that the line-of-sight vector in the body frame should align with the optical axis along the z-axis, as expressed in Equation (6). The components e x o ( t ) , e y o ( t ) , and e z o ( t ) are the elements of the normalized line-of-sight vector in the orbital frame, derived from Equation (4). The arcsin function in Equation (7) provides the pitch angle needed to align the x-axis component, while the arctan function in Equation (8) determines the roll angle required to align both the y and z components simultaneously.

2.1.1. Attitude Dynamics with Flywheel Actuator

For attitude control, we model the satellite’s dynamics assuming the use of a flywheel-based actuation system. The dynamics of the pitch and roll angles, θ and ϕ , can be expressed as second-order differential equations:
I ϕ ϕ ¨ ( t ) + D ϕ ϕ ˙ ( t ) = M ϕ ( t )
I θ θ ¨ ( t ) + D θ θ ˙ ( t ) = M θ ( t )
where I ϕ and I θ represent the moments of inertia around the pitch and roll axes, D ϕ and D θ are the damping coefficients, and M ϕ ( t ) and M θ ( t ) are the control torques generated by the flywheel system. The flywheel-based attitude control model builds upon recent formulations by [34,35], with the parameters calibrated to match contemporary agile satellite capabilities.
We now define the total energy required for an attitude maneuver, which includes both kinetic energy and control energy. The total energy consumed during the maneuver is expressed as
E t o t a l = k f i { ϕ , θ } | Δ α | + P o b s · T o b s
where k f is the energy coefficient for the flywheel system. Δ α represents the absolute angular difference in the attitude angle α . This parameter quantifies the magnitude of the attitude adjustment required between observations, which directly impacts both the maneuver time and energy consumption. P o b s is the payload power consumption, and T o b s is the observation duration. This energy consumption is primarily determined by the angle change, considering the linear relationship between the actuation torque and angle adjustment.
The time required for a maneuver is given by the maximum time required for either roll or pitch adjustment:
T m = max { T ϕ , T θ }
where
T α = | Δ α | α ˙ m a x
with α ˙ m a x being the maximum angular velocity.

2.1.2. Energy Consumption and Power Budget

To account for the power budget, the energy consumption during the satellite’s operations, including both attitude maneuvers and observation, is constrained by the satellite’s energy resources. The total energy consumption is modeled as Equation (11). The satellite operates in the Earth’s shadow and sunlight regions, which necessitates the consideration of solar energy generation only during the sunlight phase. The energy available from the solar arrays during the mission can be modeled as
E s o l a r = t s u n l i g h t P s o l a r ( t ) d t
where P s o l a r ( t ) is the power generated by the solar panels during the sunlight phase, and t s u n l i g h t represents the time duration when the satellite is exposed to sunlight. The total energy consumption is then bounded by the energy provided by both the battery and solar arrays:
k = 1 N E t o t a l , k + E i d l e η E c a p a c i t y + E s o l a r
where E c a p a c i t y represents the available battery capacity, E i d l e denotes the basic power consumption for satellite operations, and η is the power system efficiency coefficient. This constraint ensures that the satellite can operate sustainably while maintaining a sufficient power margin.
Our energy constraint model employs a conservative approach that establishes a minimum energy threshold to be maintained throughout the mission. While operational satellites experience dynamic changes in battery capacity, this bound ensures mission feasibility for emergency response scenarios with relatively short planning horizons, where the initial battery state significantly influences energy availability [36,37].

2.2. Mission Constraints

Satellite mission planning must satisfy various physical and operational constraints, such as those for attitude maneuverability, observation geometry, and power consumption.

2.2.1. Attitude Maneuverability

The attitude maneuver constraints ensure that the satellite’s attitude adjustments remain within feasible limits, including the maximum roll and pitch angles between consecutive observations:
Δ α 1 , 2 = | α ( t 2 ) α ( t 1 ) | , α { ϕ , θ }
Δ α 1 , 2 Δ α m a x
For the satellite model considered in this study, Δ α m a x = 45 deg for both the roll and pitch angles, representing the typical mechanical and control system limitations of agile Earth observation satellites.

2.2.2. Observation Geometry

To ensure high-quality imagery, the observation geometry must adhere to field-of-view (FOV) constraints:
arccos ( e s t b · e z b ) θ F O V / 2
where θ F O V is the field-of-view angle.

2.2.3. Power Consumption

The satellite’s power consumption, including the energy required for attitude maneuvering and payload operations, must adhere to the power budget constraints discussed above.

2.3. Mathematical Model

The agile satellite observation scheduling problem is formulated as a constrained optimization problem. Let T denote the set of all targets and S represent the set of all feasible observation slots. The decision variables are defined as
x i , j = 1 , if target i is observed in slot j 0 , otherwise
The objective function integrates both the rapid response to high-priority targets and overall observation effectiveness:
min J = α i T p i · t w , i · x i + β 1 i T x i · v i i T v i
This is subject to
j S x i , j = 1 , i T
i T x i , j 1 , j S
t j s t a r t t k e n d + T m k , j , k , j S
x i , j = 0 , i T , j W i
The weighting parameters α and β in the objective function are set to 0.7 and 0.3, respectively, based on empirical testing to balance the response time and coverage efficiency.
This formulation ensures the efficient and feasible scheduling of the satellite’s observation mission while respecting the operational constraints and optimizing the observation coverage.

3. Target Clusters and Dual-Timeline Optimization Framework

The proposed target clusters and dual-timeline optimization (TCDO) framework addresses the challenge of scheduling agile satellite observations for densely distributed targets with heterogeneous priorities. Our framework integrates two key components: a priority-based geographical clustering method that organizes targets based on their spatial distribution and priority levels, and a dual-timeline coordinated planning strategy that balances the immediate priority response with long-term coverage optimization. This hierarchical approach enables the efficient handling of complex observation scenarios while maintaining both computational tractability and mission effectiveness.

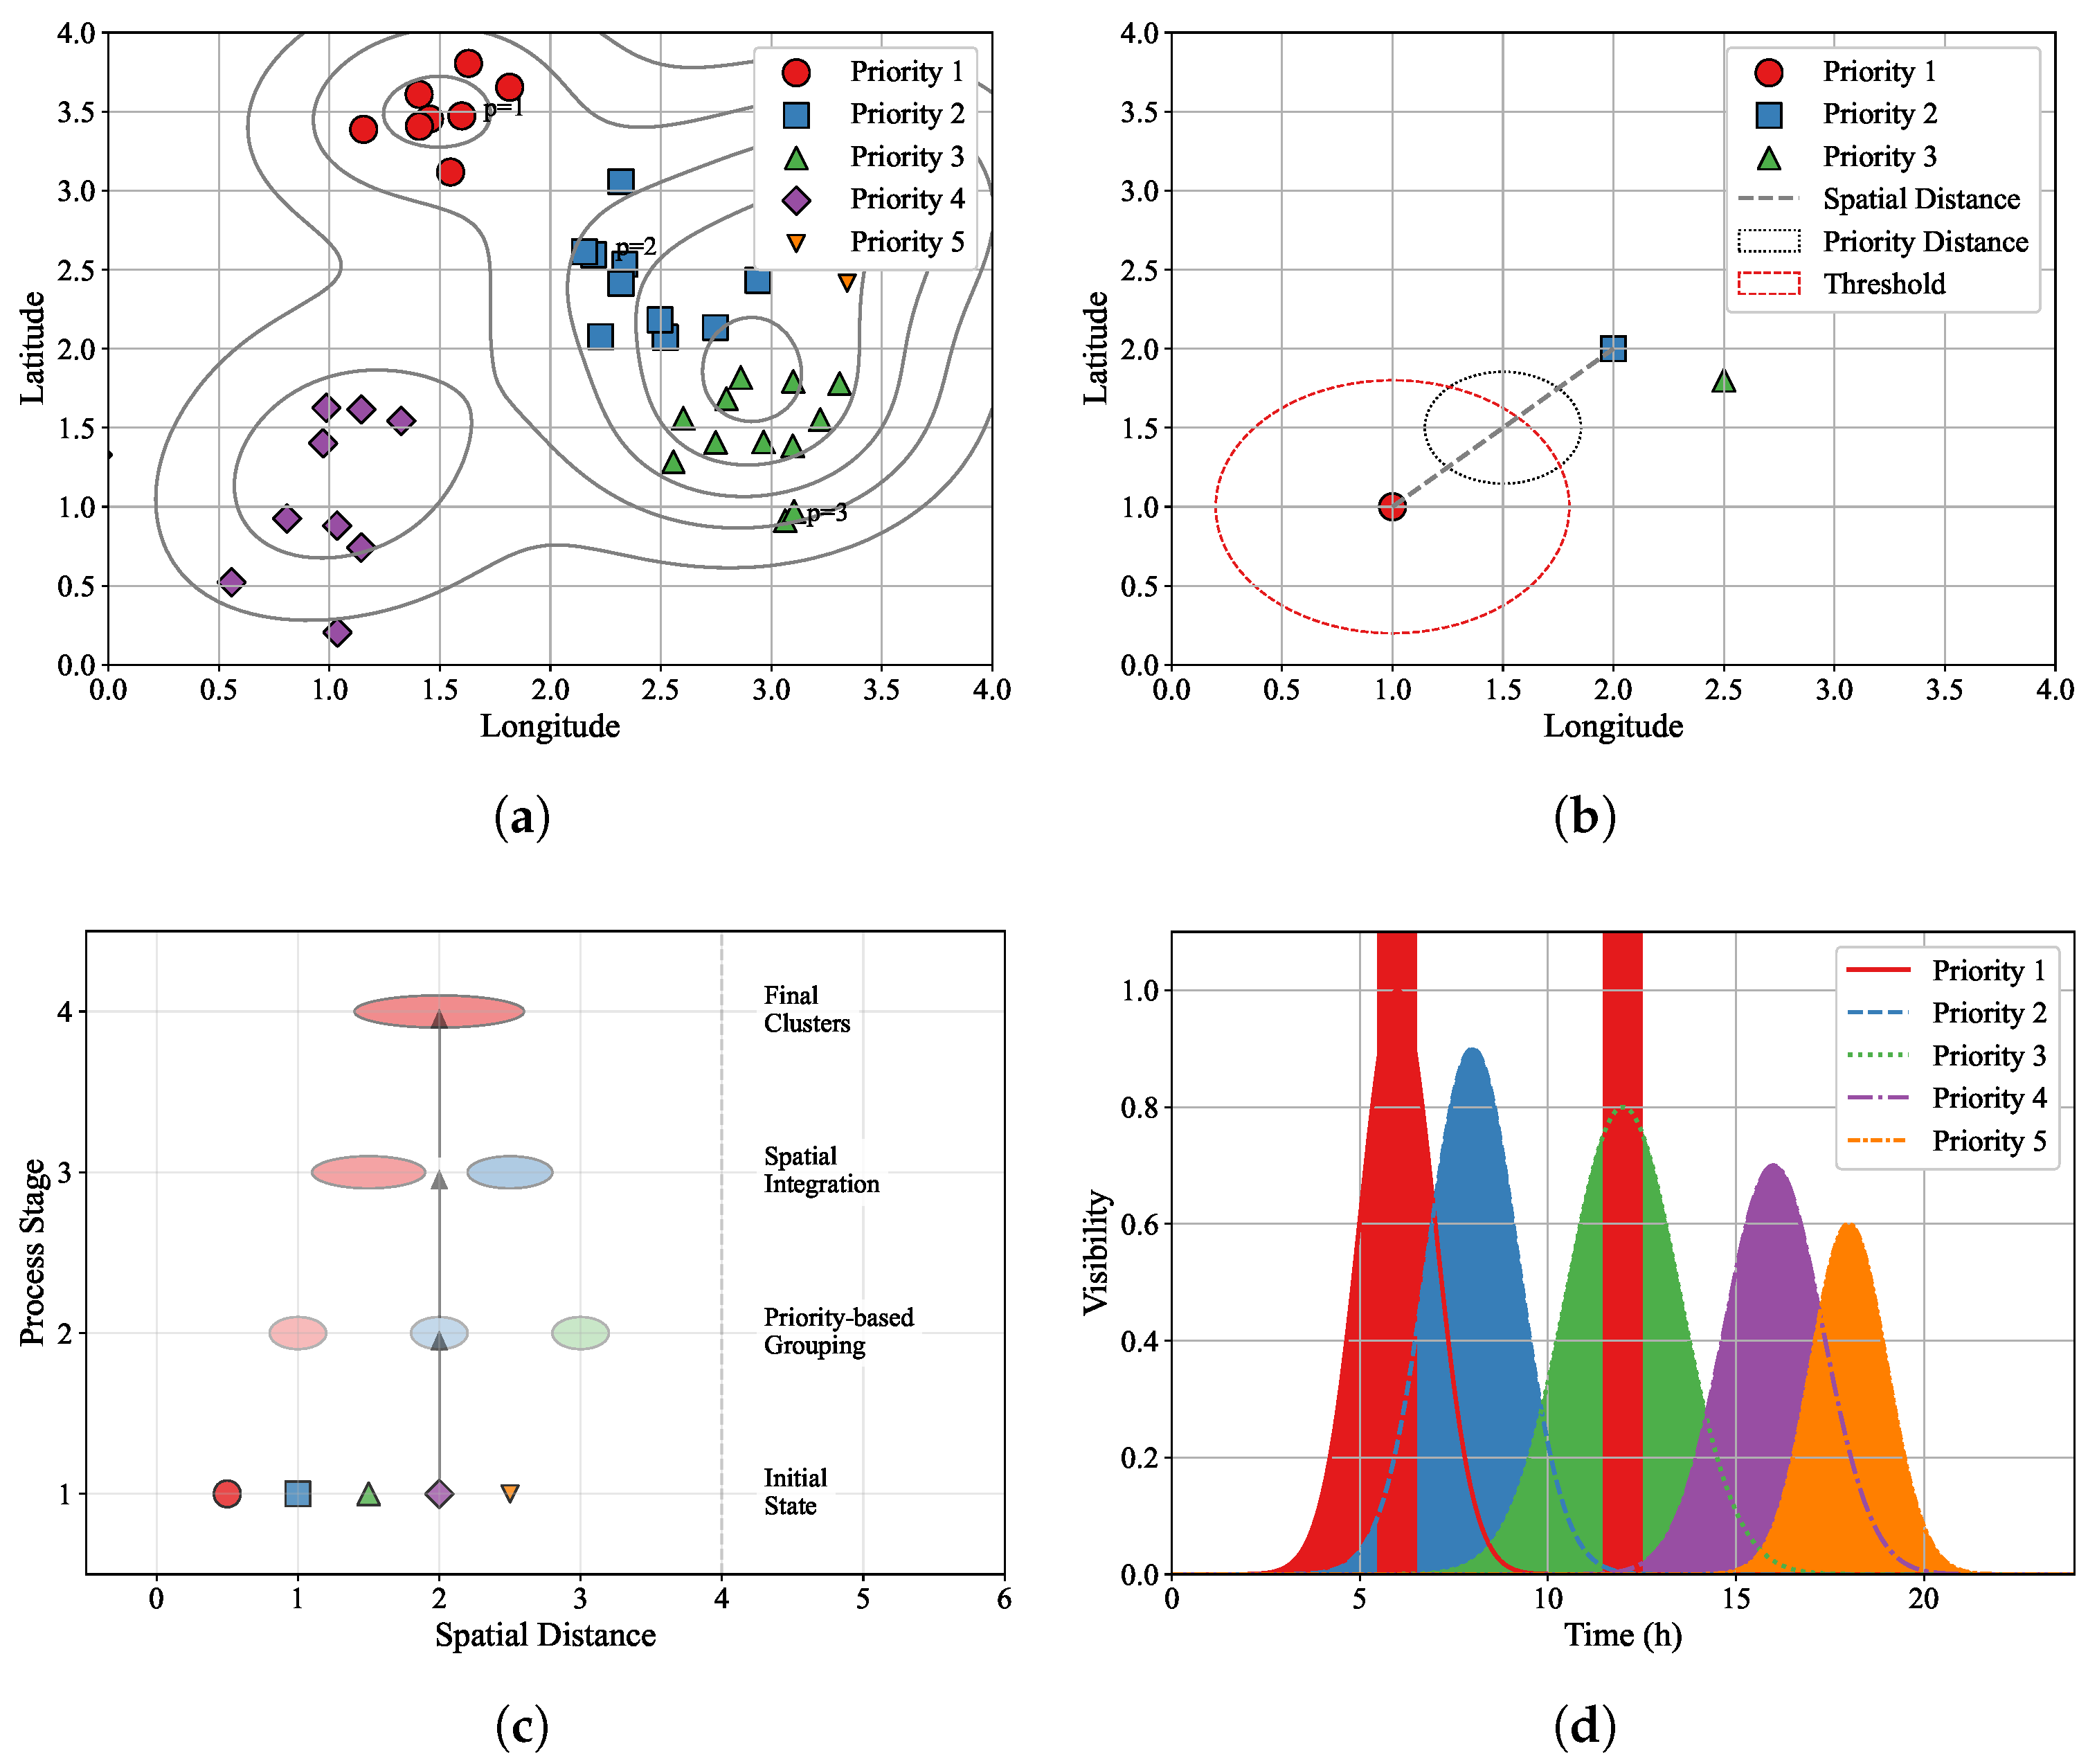
3.1. Priority-Based Geographical Clustering

The proposed clustering method integrates both spatial distribution and target priority information through a novel composite distance metric. Given a set of observation targets T = t 1 , t 2 , . . . , t n distributed across the surveillance area, each target t i is characterized by its geographical coordinates ( x i , y i ) and normalized priority value p i [ 0 , 1 ] . As illustrated in Figure 2a, targets with different priorities (indicated by different sizes and colors) exhibit natural grouping tendencies in their spatial distribution.
We propose an enhanced composite distance metric that effectively captures both spatial and priority relationships between targets. Given two targets t i and t j , their dissimilarity is quantified through a theoretically grounded distance function that integrates the Mahalanobis distance for spatial features and a nonlinear priority difference measure:
d ( t i , t j ) = ( x i x j ) T Σ 1 ( x i x j ) + α · exp ( β | p i p j | ) 1 exp ( β | p i p j | ) + 1
where x i = [ x i , y i ] T represents the spatial coordinates of target i, Σ denotes the spatial covariance matrix that captures directional scale differences, α is the priority weighting coefficient, and β controls the sensitivity to priority differences. Our composite distance metric extends the work of [38] on priority-integrated clustering, while the hierarchical approach adapts techniques from [39] to the satellite observation context. The priority weighting coefficient α ranges from 0.3 to 0.8 depending on mission emphasis, with higher values used for emergency response scenarios. The sensitivity parameter β typically ranges from 1.5 to 4.0, with our experiments using β = 2.5 to provide appropriate differentiation between priority levels. This formulation offers several theoretical advantages over traditional Euclidean-based metrics: (1) The Mahalanobis component accounts for spatial feature correlations and varying scales in different directions. (2) The sigmoid-like priority difference term provides bounded, nonlinear sensitivity to priority variations. (3) The separable structure maintains computational efficiency while enhancing the representational capacity.
We begin by providing rigorous mathematical definitions of the key concepts in our framework.
Definition 1.
The quality of a cluster C k at time t is defined as a tuple Q ( C k , t ) = ( σ k , R k , A k ( t ) ) , where
Q ( C k , t ) = ( t i C k p i | C k | , t i C k p i ( x i , y i ) c k 2 t i C k p i , 1 | C k | t i C k / t W i )
where σ k is the normalized priority density, R k is the priority-weighted radius of gyration, and A k ( t ) is the temporal accessibility.
In our implementation, the priority-weighted radius of gyration R k typically ranges from 0.05 to 0.3 in geographical coordinates for well-formed clusters, with higher values indicating more dispersed targets.
Definition 2.
The urgency of a target t i at time t is defined as
U ( t i , t ) = p i · exp ( λ p ( t d e a d l i n e t ) ) · 1 Δ t i + ϵ
where p i is the target’s priority level, t d e a d l i n e is the latest allowable observation time, Δ t i is the remaining visibility window time, ϵ is a small positive constant for numerical stability, and λ p is the urgency decay rate. The composite index σ k generally ranges from 0.4 to 0.95, with λ = 3.5 used to balance priority emphasis and spatial efficiency. Clusters with σ k > 0.8 are considered high priority for observation planning.
Based on Definition 1 (Cluster Quality), Definition 2 (Priority Urgency), and the composite metric, we develop a hierarchical clustering approach that progressively constructs target groups reflecting both spatial efficiency and priority-based urgency. The clustering process begins with individual targets as singleton clusters C i ( 0 ) = t i and iteratively merges clusters based on their inter-cluster distances. At each iteration k, the distance between clusters is computed using a minimum linkage criterion:
D i j ( k ) = min t a C i ( k ) , t b C j ( k ) d ( t a , t b )
To maintain cluster quality and prevent the formation of overextended groups, we introduce an adaptive clustering threshold that evolves with the target distribution characteristics:
θ k = α · 1 n i = 1 n min j i d ( t i , t j )
where α is a scaling factor that controls cluster granularity. Clusters are merged according to the following criterion:
C i ( k + 1 ) = C i ( k ) C j ( k ) if D i j ( k ) θ k
Each cluster C k is represented by its priority-weighted geometric center c k :
c k = t i C k p i ( x i , y i ) t i C k p i
The characteristics of each cluster are quantified through several key metrics defined in Definition 2. The spatial dispersion of the targets within each cluster is measured through a priority-weighted radius of gyration R k , capturing the geographical spread of the targets weighted by their priorities. To evaluate the overall significance of each cluster for observation planning, we introduce a composite index σ k that integrates priority levels with spatial compactness, where λ is a parameter that balances priority emphasis and spatial efficiency in the cluster evaluation. Additionally, the temporal characteristics of the clusters are analyzed through their accessibility function A k ( t ) , where W i represents the visibility time windows for target t i , and / · is the indicator function. This measurement helps identify optimal observation periods through the following condition:
T k o p t = t subject to A k ( t ) A t h r e s h o l d
where A t h r e s h o l d represents the minimum required proportion of visible targets within a cluster.
Through this integrated clustering approach, our method effectively organizes observation targets into priority-aware spatial groups, providing a solid foundation for the subsequent dual-timeline planning process.

3.2. Dual-Timeline Planning Strategy

Our dual-timeline planning strategy addresses the inherent tension between the rapid response to high-priority targets and efficient overall coverage through an innovative coordination mechanism. As illustrated in Figure 3, the framework consists of three main functional modules that process system inputs, including target properties, priority distribution, visibility windows, and system constraints. The pseudocode Algorithm 1 presents the detailed implementation of this coordination mechanism.
Algorithm 1: Temporal–Spatial Coordinated Planning
1:
function CoordinatePlanning( T , C , H )
2:
    Initialize planning parameters and energy budget
3:
    while mission active AND E r e m a i n > E m i n  do
4:
        Update system metrics P ( t ) , E ( t ) , V ( t )
5:
         ξ ω p P ( t ) + ω e E ( t ) + ω v V ( t )
6:
        if  ξ > ξ t h r e s h o l d  then                 ▹ Priority-driven mode
7:
            T u r g e n t SelectUrgentTargets( T , P ( t ) )
8:
            π s h o r t ShortTermPlanning( T u r g e n t , H )
9:
           ExecuteObservation( π s h o r t )
10:
        else                   ▹ Coverage optimization mode
11:
            C n e x t SelectNextCluster( C , V ( t ) )
12:
            π l o n g LongTermPlanning( C n e x t , E ( t ) )
13:
           ExecuteObservation( π l o n g )
14:
        end if
15:
        UpdateWeights( ω p , ω e , ω v )
16:
        UpdateSystemState()
17:
    end while
18:
end function
19:
functionUpdateWeights( ω p , ω e , ω v )
20:
    for  i p , e , v  do
21:
         Δ i EvaluatePerformanceDeviation(i)
22:
         ω i ω i + η i Δ i
23:
    end for
24:
    NormalizeWeights( ω p , ω e , ω v )
25:
end function
The target clustering module performs geographical grouping based on target locations and analyzes priority density to form meaningful clusters. These clusters serve as basic units for subsequent planning phases, enabling efficient resource allocation and coordinated observation scheduling. The dual-timeline core implements the parallel processing of the immediate priority response and long-term coverage optimization. The short-term planning module optimizes observation sequences within high-priority clusters while considering satellite attitude constraints and electrical power limitations. Consider the current satellite state s t = [ ϕ , θ , ϕ ˙ , θ ˙ ] T , where ϕ and θ represent the roll and pitch angles, respectively. Let subscript nav denote the navigation-related variables for satellite maneuver characteristics. The short-term optimization objective function J S T is formulated as
J S T = max π k = 1 H γ k t i T k p i · v i ( π k ) · w n a v ( t i , s k )
where H is the planning horizon, γ is a temporal discount factor, and w n a v ( t i , s k ) is a maneuverability weight function that evaluates observation efficiency considering the current satellite state:
w n a v ( t i , s k ) = exp ( λ 1 τ n a v λ 2 e n a v )
The maneuver characteristics are quantified through
τ n a v = max ( τ ϕ , τ θ )
e n a v = k 1 | Δ ϕ | + k 2 | Δ θ | + E o b s
subject to operational constraints:
| ϕ ˙ | , | θ ˙ | ω m a x t o b s T t h r e s h o l d k = 1 H e n a v E r e m a i n
where T t h r e s h o l d represents the minimum duration required for complete target observation.
The long-term planning module coordinates cluster transitions and temporal–spatial resource allocation to maximize overall mission effectiveness. Let subscript c denote cluster-related variables, and let C represent the total number of clusters. The long-term objective function J L T is formulated as
J L T = max Φ t = 0 T c = 1 C σ c ( t ) · x c ( t ) · q c ( t )
where q c ( t ) is a dynamic quality function that evaluates cluster observability:
q c ( t ) = α 1 A c ( t ) + α 2 C c ( t ) + α 3 E c ( t )
The components represent cluster accessibility A c ( t ) , compactness measure C c ( t ) , and power efficiency factor E c ( t ) . The power efficiency factor is defined as the ratio of the expected observation value to the required electrical power consumption:
E c ( t ) = t i C c p i · v i ( t ) P e s t ( C c , t )
where P e s t ( C c , t ) estimates the total power requirement for observing cluster c at time t, considering both the attitude maneuver and payload operation power consumption.
The temporal–spatial allocation among clusters follows
τ c = T a v a i l a b l e · σ c · | C c | · q c ( t ) j = 1 C σ j · | C j | · q j ( t )
where τ c represents the allocated observation time for cluster c, and T a v a i l a b l e is the total available time within the current planning horizon.
We propose an adaptive coordination framework that efficiently bridges short-term and long-term planning processes while maintaining computational tractability. The system state is evaluated through a weighted performance metric:
ξ ( t ) = i I ω i ( t ) · M i ( t ) , I = { p , e , v }
where ω i ( t ) represents the adaptive weights for the priority (p), energy (e), and visibility (v) metrics, with i I ω i ( t ) = 1 . The performance metrics are defined as
M p ( t ) = t i H p i Δ t i + ϵ · exp ( η p t w , i )
M e ( t ) = E r e m a i n ( t ) E c a p a c i t y · exp ( η e P ¯ ( t ) )
M v ( t ) = k = 1 K A k ( t ) · σ k k = 1 K σ k
The weight adaptation follows a gradient-based update rule:
ω i ( t + Δ t ) = P { ω i ( t ) α ω i L ( t ) }
where P { · } denotes projection onto the probability simplex to ensure i ω i ( t ) = 1 , and L ( t ) is a composite loss function incorporating multiple planning objectives.
This coordination mechanism features several innovations that distinguish it from traditional approaches. First, the state evaluation function enables dynamic mode switching based on a comprehensive mission status assessment rather than relying on fixed scheduling rules. Second, the adaptive weight update process allows the system to learn from execution feedback and adjust its behavior accordingly. Third, the integration of energy efficiency and visibility opportunities in the coordination mechanism ensures sustainable operation while maximizing observation opportunities.

3.3. Complexity Analysis and Optimization

The computational complexity of our framework arises from three primary components. For each component, we develop targeted optimization strategies that significantly reduce the computational overhead while maintaining solution quality.

3.3.1. Core Components Analysis

(1) Clustering Process: The base implementation requires O ( n 2 ) operations for distance calculations among n targets, where n represents the total number of observation targets. We introduce a spatial indexing structure that reduces this complexity through hierarchical partitioning:
T c l u s t e r ( n ) = i = 1 log n n 2 i = O ( n · log n )
where T c l u s t e r ( n ) denotes the total computational operations for cluster formation, and i represents the hierarchical level in the partitioning structure.
(2) State Evaluation: We implement an incremental update mechanism that exploits the temporal locality of state changes:
Δ ξ ( t ) = i M t ω i Δ i ( t )
where Δ ξ ( t ) represents the change in the system state at time t, M t denotes the set of metrics requiring updates, ω i is the weight coefficient for metric i, and Δ i ( t ) indicates the change in metric i at time t. This mechanism leverages the observation that most satellite maneuvers only affect a small subset of the state metrics.
(3) Path Optimization: We employ a constrained search space defined by maneuverability and energy constraints:
S r e d u c e d = { s j : d ( s j , s c u r r e n t ) d m a x e ( s j ) e t h r e s h o l d }
where S r e d u c e d represents the reduced search space, s j denotes a potential satellite state, s c u r r e n t is the current satellite state, d m a x represents the maximum allowable maneuver distance, and e t h r e s h o l d denotes the energy consumption threshold. The function d ( s j , s c u r r e n t ) measures the maneuver distance between states, while e ( s j ) calculates the electrical power consumption for reaching state s j . This optimization significantly reduces the effective branching factor in path search, yielding
T p a t h ( k ) = O ( k 2 )
where T p a t h ( k ) represents the path optimization time complexity, k denotes the size of the reduced search space, and k is the original search space size.

3.3.2. Theoretical Bounds

To establish the efficiency of our hierarchical state update mechanism, we need to formally bound the expected size of updates required per time step. The following Theorem 1 and its proof (Appendix A) demonstrate that the number of affected metrics scales logarithmically with the system size, making our approach computationally tractable for large-scale satellite constellations.
Theorem 1.
The expected size of the update set M t is logarithmically bounded:
E [ | M t | ] c · log m
where c is a system-dependent constant, and m is the number of clusters.

3.3.3. Overall Performance Guarantee

We establish a rigorous complexity–quality trade-off for our proposed framework. The following proposition formally characterizes the performance guarantees of our algorithm:
Proposition 1
(Complexity–Quality Trade-Off). For a given accuracy threshold ϵ > 0 and confidence parameter δ ( 0 , 1 ) , our framework provides probabilistic approximation guarantees with logarithmic computational complexity. Specifically, the algorithm generates solutions that are within a ( 1 + ϵ ) factor of the optimal value, with a probability of at least 1 δ .
The total computational complexity is bounded by
T t o t a l = O 1 ϵ 2 ln ( 1 δ ) ( n · log n + m · log m )
where n and m represent the problem-specific parameters characterized in the previous sections.
The significance of Proposition 1 lies in its ability to provide near-optimal solutions with provable probabilistic guarantees (the full proof of this is provided in Appendix B). By controlling the accuracy threshold ϵ and confidence parameter δ , our framework offers a flexible approach to balancing computational efficiency and solution quality.
This optimization framework enables real-time implementation while providing theoretical guarantees on both computational efficiency and solution quality.

4. Simulation and Result Analysis

4.1. Experimental Setup and Data Description

Simulation experiments were implemented in Python 3.8 on a Lenovo China Y9000P laptop using an NVIDIA (Santa Clara, CA, USA) GeForce RTX 3060 GPU on the Windows platform.

4.1.1. Satellite and Target Parameters

The satellite parameters are presented in Table 1, with the specifications derived from the SPOT-6/7 agile Earth observation satellite series. This reference system was selected because it represents one of the most well-documented and operationally proven AEOS platforms, with comprehensive technical specifications publicly available through the European Space Agency’s Earth Observation Portal. The attitude control system operates with electrical power consumption characteristics similar to those of operational agile satellites: a maximum slew rate of 3 deg/s with attitude maneuver limits of ±45 degrees in both roll and pitch axes, a peak power consumption of 2.4 kW during attitude maneuvers, and a nominal imaging power consumption of 1.8 kW. The power system is equipped with a 180 Ah battery at 32 V (equivalent to 5.76 kWh total capacity), with an operational depth-of-discharge limit of 80% to ensure battery longevity, providing an effective available capacity of 4.61 kWh for mission operations.

4.1.2. Target Distribution and Visibility Windows

The scenario involves 80 targets with different priority levels, where 50 targets have visibility windows within the observation period (17:00:00–22:30:00 UTC, 10 November 2024). The targets are distributed across a geographical region bounded by 25° N–50° N latitude and 95° E–135° E longitude, encompassing Northeast Asia, a region characterized by diverse natural disaster risks, including earthquakes, floods, and industrial hazards, as well as densely populated urban areas requiring frequent monitoring. This region was selected due to its high concentration of both natural and human-made emergency monitoring requirements, making it an ideal test case for evaluating the system’s performance in real-world emergency response scenarios. The targets’ distribution is generated using stratified random sampling to ensure representative coverage of the area. The sampling process employs a Latin Hypercube Sampling (LHS) method to maintain spatial diversity while accounting for priority level distributions.

4.2. Performance Analysis and Results

4.2.1. Clustering Analysis

Our TCDO framework employs priority-based geographical clustering, as illustrated in Figure 4. The spatial distribution reveals distinct correlations between geographical proximity and priority levels, effectively categorizing targets into three primary groups.
The temporal analysis (Figure 5) shows high-density observation windows between 18:40 and 19:00 UTC, which guided our planning strategy optimization.

4.2.2. Attitude Maneuver and Power Consumption Analysis

Figure 6 illustrates the satellite attitude evolution and electrical power consumption profile throughout the mission. The detailed analysis during the high-density observation period (18:44:00–18:50:00) demonstrates the framework’s capability to maintain smooth attitude transitions while adhering to maneuver rate constraints. Although the satellite’s attitude trajectories show significant changes during this period, these variations are a natural result of the high target density within the observation window, requiring frequent attitude adjustments to maintain optimal observation angles. It is important to note that, during this time period, the satellite is in the Earth’s shadow, and, therefore, solar array charging is not considered in the power consumption analysis. The power consumption profile reveals effective electrical energy management across the mission timeline, particularly in ensuring sufficient power availability for high-priority observations, with the assumption that the battery alone supports the power needs during this period.

4.2.3. Coverage and Priority Performance

The effectiveness of our priority-based planning approach is quantitatively demonstrated through a comprehensive cluster analysis (Figure 7). The framework achieves differentiated observation rates across priority levels: 100% for high-priority clusters, 92% for medium-priority clusters, and 89% for low-priority clusters. This hierarchical performance pattern validates the method’s capability to maintain priority-based discrimination while ensuring high overall coverage.
The observation execution sequence, visualized in Figure 8, captures the temporal distribution of executed observations relative to available visibility windows. The high-density observation period demonstrates the framework’s sophisticated scheduling capabilities, effectively managing multiple concurrent visibility windows while maintaining the priority-based execution order. Figure 9 further validates this capability through a statistical analysis of task completion patterns across priority levels.

4.3. Comparative Analysis

We evaluated TCDO against three established baseline approaches: our framework without clustering (NC), linear programming (LP), and the genetic algorithm (GA). Figure 10 presents a comprehensive performance comparison across critical metrics.

4.3.1. Coverage and Computational Efficiency

The TCDO framework achieves a 94% coverage rate, matching the performance of the GA while substantially outperforming LP (82%). This superior performance stems from two key algorithmic innovations: First, the priority-based geographical clustering effectively reduces the solution space by grouping spatially correlated targets while preserving their priority relationships, enabling more focused and efficient search strategies. Second, the dual-timeline coordination mechanism allows for dynamic adjustment between local optimization and global coverage, preventing the algorithm from being trapped in local optima that commonly affect LP.
The framework’s computational efficiency is particularly noteworthy, requiring only 1.8 s of processing time—representing remarkable reductions of 79%, 91%, and 99.5% compared to the NC, LP, and GA approaches, respectively. This significant improvement in computational efficiency can be attributed to the hierarchical problem decomposition strategy. Unlike the GA’s population-based global search or NC’s exhaustive enumeration, TCDO’s cluster-based processing effectively reduces the computational complexity from O ( n 2 ) to O ( n · log n ) . Furthermore, the temporal–spatial coordination mechanism enables the parallel processing of different priority levels, leading to more efficient resource utilization during computation.

4.3.2. Power Management and Priority Response

TCDO demonstrates superior power management, with a total power consumption of 1.097 kWh, achieving 4.2% improved efficiency over baseline approaches. To objectively evaluate the mission effectiveness, we introduce a comprehensive scoring mechanism that captures the essential characteristics of emergency response satellite observation:
S = i = 1 N p i · exp ( λ t o b s , i ) · v i
where p i represents the target priority, t o b s , i denotes the observation timing, and v i indicates successful observation. This metric integrates three critical aspects: priority differentiation through linear weighting ( p i ), temporal urgency via exponential decay ( exp ( λ t o b s , i ) ), and completion status ( v i ). The exponential term particularly penalizes delays in high-priority target observation, aligning with emergency response requirements. The scoring mechanism S produces values typically ranging from 30 to 65 in our experimental scenarios. For reference, an ideal scenario with an immediate observation of all targets would yield S 78 , while random scheduling typically yields S 25 . The TCDO framework achieves S = 52.3 , representing approximately 67% of the theoretical maximum performance. This metric effectively captures the framework’s capability to prioritize high-value targets while maintaining overall coverage, with the exponential term λ = 0.15 calibrated to align with typical emergency response timeline requirements.

4.3.3. Scalability Analysis

The TCDO framework exhibits exceptional scalability for large-scale problems involving 100 targets, requiring only 2.35 s for computation compared to substantially longer processing times for baseline methods. This computational advantage stems from the framework’s systematic optimization approach in handling target allocation and observation scheduling.
Figure 11 illustrates the framework’s computational efficiency across varying problem scales. The significant performance gap between TCDO and conventional methods becomes more pronounced as the problem size increases, highlighting the framework’s capability to handle large-scale observations while maintaining computational efficiency.

4.3.4. Performance Integration and Practical Implications

The TCDO framework demonstrates comprehensive advantages through the following:
  • Computational Efficiency: Superior scalability enabling real-time planning applications.
  • Mission Performance: A high coverage rate with effective priority-based discrimination.
  • Power Optimization: Efficient electrical power management while maintaining mission effectiveness.
These results represent a significant advancement in satellite observation planning, particularly for large-scale operations requiring both high performance and computational efficiency. The framework’s ability to balance multiple objectives while maintaining computational tractability makes it especially suitable for practical deployment in operational scenarios.

5. Conclusions

This paper developed a target clusters and dual-timeline optimization (TCDO) framework that addresses the challenge of agile satellite observation planning for densely distributed targets with heterogeneous priorities. The framework integrates priority-based geographical clustering with temporal–spatial coordination mechanisms, effectively balancing emergency response requirements with coverage optimization. Experimental results demonstrated the framework’s superior performance, achieving a 94% coverage rate and a 99.5% reduction in computation time compared to traditional scheduling methods, such as LP and genetic algorithms. The TCDO framework offers a computationally efficient solution for real-time satellite observation planning, particularly in emergency response scenarios where rapid target acquisition and efficient mission execution are essential. Future work will focus on extending the framework to multi-satellite coordination and include integrating downlink scheduling constraints to address the interface between observation planning and data transmission management.

Author Contributions

Conceptualization, G.Z. and Z.Z.; methodology, G.Z. and C.O.; software, G.Z. and Y.G.; validation, G.Z. and P.S.; formal analysis, Z.Z.; investigation, G.Z.; writing—original draft preparation, G.Z., C.O. and Y.G.; writing—review and editing, G.Z., P.S. and Z.Z.; supervision, Z.Z.; project administration, Z.Z.; funding acquisition, Z.Z. All authors have read and agreed to the published version of the manuscript.

Funding

This research was funded by National Key Laboratory of Helicopter Dynamics 2024-CXPT-GF-JJ-093-07.

Data Availability Statement

The datasets used and/or analyzed during the current study are available from the corresponding author on reasonable request.

Acknowledgments

This work was supported by the Sanqin Talent Special Support Program.

Conflicts of Interest

The authors declare no conflicts of interest.

Appendix A. Proof of Theorem 1

Proof. 
We prove this bound by analyzing the spatial and temporal locality of state changes. Consider a satellite maneuver m t with the following impact region:
R ( m t ) = { s S : d ( s , s c u r r e n t ) 2 sin ( θ m a x / 2 ) }
Given the hierarchical clustering structure, at each level i, the number of potentially affected clusters n i satisfies
n i min { m / 2 i , | R ( m t ) C i | }
where C i represents the clusters at level i.
The total number of affected metrics forms a bounded sum that can be split into two parts: levels where m / 2 i > k contribute k per level and levels where m / 2 i k form a geometric series. Therefore,
| M t | k log 2 ( m k ) + 2 k = O ( log m )
By taking expectation over all possible maneuvers and applying the linearity of expectation, we obtain E [ | M t | ] c · log m , where c = k ( 1 + log 2 ( e ) ) is determined by maneuver constraints and clustering properties. □

Appendix B. Proof of Proposition 1

Proof. 
Let O P T denote the optimal solution value and A L G denote our algorithm’s solution value. For a dual-timeline planning strategy with K = 2 ϵ 2 ln ( 1 δ ) independent iterations, we have
Pr [ A L G O P T 1 + ϵ ] 1 δ
where δ = exp ( ϵ 2 K 2 ) . The iteration runtime bound T i t e r = O ( n · log n + m · log m ) leads to the total complexity while maintaining the O ( n + m ) memory requirement throughout the execution. □

References

  1. Huang, W.; Li, Z.; He, X.; Xiang, J.; Du, X.; Liang, X. DRL-Based Dynamic Destroy Approaches for Agile-Satellite Mission Planning. Remote Sens. 2023, 15, 4503. [Google Scholar] [CrossRef]
  2. Lu, Z.; Shen, X.; Li, D.; Chen, Y.; Li, D. A Mission Planning Modeling Method of Multipoint Target Imaging Within a Single Pass for Super-Agile Earth Observation Satellite. IEEE Syst. J. 2021, 16, 1921–1932. [Google Scholar]
  3. Rigo, C.A.; Seman, L.O.; Camponogara, E.; Morsch Filho, E.; Bezerra, E.A. Task Scheduling for Optimal Power Management and Quality-of-Service Assurance in CubeSats. Acta Astronaut. 2021, 179, 550–560. [Google Scholar]
  4. Lee, K.; Kim, D.; Chung, D.; Lee, S. Application of Optimal Scheduling for Synthetic Aperture Radar Satellite Constellation: Multi-Imaging Mission in High-Density Regional Area. Aerospace 2024, 11, 280. [Google Scholar] [CrossRef]
  5. Wu, J.; Song, B.; Zhang, G.; Ou, J.; Chen, Y.; Yao, F.; Xing, L. A Data-Driven Improved Genetic Algorithm for Agile Earth Observation Satellite Scheduling with Time-Dependent Transition Time. Comput. Ind. Eng. 2022, 174, 108823. [Google Scholar]
  6. Long, J.; Wu, S.; Han, X.; Wang, Y.; Liu, L. Autonomous Task Planning Method for Multi-Satellite System Based on a Hybrid Genetic Algorithm. Aerospace 2023, 10, 70. [Google Scholar] [CrossRef]
  7. Fan, H.; Yang, Z.; Zhang, X.; Wu, S.; Long, J.; Liu, L. A Novel Multi-Satellite and Multi-Task Scheduling Method Based on Task Network Graph Aggregation. Expert Syst. Appl. 2022, 205, 117565. [Google Scholar]
  8. Li, J.; Wu, G.; Liao, T.; Fan, M.; Mao, X.; Pedrycz, W. Task Scheduling Under a Novel Framework for Data Relay Satellite Network via Deep Reinforcement Learning. IEEE Trans. Veh. Technol. 2023, 72, 6654–6668. [Google Scholar]
  9. Cui, K.; Song, J.; Zhang, L.; Tao, Y.; Liu, W.; Shi, D. Event-Triggered Deep Reinforcement Learning for Dynamic Task Scheduling in Multisatellite Resource Allocation. IEEE Trans. Aerosp. Electron. Syst. 2022, 59, 3766–3777. [Google Scholar]
  10. Liu, Z.; Xiong, W.; Han, C.; Zhao, K. A Multi-Pointer Network for Multiple Agile Optical Satellite Scheduling Problem. Aerospace 2024, 11, 792. [Google Scholar] [CrossRef]
  11. Ou, J.; Xing, L.; Yao, F.; Li, M.; Lv, J.; He, Y.; Zhang, G. Deep Reinforcement Learning Method for Satellite Range Scheduling Problem. Swarm Evol. Comput. 2023, 77, 101233. [Google Scholar] [CrossRef]
  12. Wen, Z.; Li, L.; Song, J.; Zhang, S.; Hu, H. Scheduling Single-Satellite Observation and Transmission Tasks by Using Hybrid Actor-Critic Reinforcement Learning. Adv. Space Res. 2023, 71, 3883–3896. [Google Scholar] [CrossRef]
  13. Petrović, M.; Vukobratović, B.; Miljković, Z.; Jokić, A. Multi-Objective Scheduling of a Single Mobile Robot Based on the Grey Wolf Optimization Algorithm. Appl. Soft Comput. 2022, 131, 109784. [Google Scholar]
  14. Li, L.; Chen, H.; Li, J.; Jing, N.; Emmerich, M. Preference-Based Evolutionary Many-Objective Optimization for Agile Satellite Mission Planning. IEEE Access 2018, 6, 40963–40978. [Google Scholar] [CrossRef]
  15. Lu, Z.; Shen, X.; Li, D.; Chen, Y. Integrated Imaging Mission Planning Modeling Method for Multi-Type Targets for Super-Agile Earth Observation Satellite. IEEE J. Sel. Top. Appl. Earth Obs. Remote Sens. 2022, 15, 4156–4169. [Google Scholar] [CrossRef]
  16. Yu, T.; Huang, J.; Chang, Q. Optimizing Task Scheduling in Human-Robot Collaboration with Deep Multi-Agent Reinforcement Learning. J. Manuf. Syst. 2021, 60, 487–499. [Google Scholar]
  17. Thomas, A.; Mastrogiovanni, F.; Baglietto, M. MPTP: Motion-Planning-Aware Task Planning for Navigation in Belief Space. Robot. Auton. Syst. 2021, 141, 103786. [Google Scholar]
  18. Fei, H.; Zhang, X.; Long, J.; Liu, L.; Wang, Y. Towards Multi-Satellite Collaborative Computing via Task Scheduling Based on Genetic Algorithm. Aerospace 2023, 10, 95. [Google Scholar] [CrossRef]
  19. Song, Y.; Ou, J.; Pedrycz, W.; Suganthan, P.N.; Wang, X.; Xing, L.; Zhang, Y. Generalized Model and Deep Reinforcement Learning-Based Evolutionary Method for Multitype Satellite Observation Scheduling. IEEE Trans. Syst. Man Cybern. Syst. 2024, in press. [Google Scholar]
  20. Lee, M.; Kim, S.J.; Kim, H.Y.; Choi, H.L. Consensus-Based Task Scheduling Algorithm for Agile Earth Observation Satellites with Different Authorities. In Proceedings of the ASCEND 2021, Las Vegas, NV, USA, 15–17 November 2021; p. 4122. [Google Scholar]
  21. She, Y.; Li, S.; Zhao, Y. Onboard Mission Planning for Agile Satellite Using Modified Mixed-Integer Linear Programming. Aerosp. Sci. Technol. 2018, 72, 204–216. [Google Scholar]
  22. Song, Y.; Huang, D.; Zhou, Z.; Chen, Y. An Emergency Task Autonomous Planning Method of Agile Imaging Satellite. EURASIP J. Image Video Process. 2018, 2018, 29. [Google Scholar]
  23. Huang, W.; Wang, H.; Yi, D.; Wang, S.; Zhang, B.; Cui, J. A Multiple Agile Satellite Staring Observation Mission Planning Method for Dense Regions. Remote Sens. 2023, 15, 5317. [Google Scholar] [CrossRef]
  24. Yahang, Z.; Haiyue, Y.; Mengfei, Y.; Ruochu, Y.; Shuhang, L. Automatic Task Planning and Its On-Orbit Verification of Agile Remote Sensing Satellite. Int. J. Aerosp. Eng. 2023, 8923088. [Google Scholar] [CrossRef]
  25. Zhao, Y.; Du, B.; Li, S. Agile Satellite Mission Planning via Task Clustering and Double-Layer Tabu Algorithm. Comput. Model. Eng. Sci. 2020, 122, 235–257. [Google Scholar]
  26. Qiu, W.; Xu, C.; Ren, Z.; Teo, K. Scheduling and Planning Framework for Time Delay Integration Imaging by Agile Satellite. IEEE Trans. Aerosp. Electron. Syst. 2021, 58, 189–205. [Google Scholar]
  27. Herrmann, A.; Schaub, H. Reinforcement Learning for the Agile Earth-Observing Satellite Scheduling Problem. IEEE Trans. Aerosp. Electron. Syst. 2023, 59, 5235–5247. [Google Scholar]
  28. Zezhong, L.; Shen, X.; Deren, L.; Li, D.; Chen, Y.; Wang, D.; Shen, S. Multiple Super-Agile Satellite Collaborative Mission Planning for Area Target Imaging. Int. J. Appl. Earth Obs. Geoinf. 2023, 117, 103211. [Google Scholar]
  29. Sun, H.; Xia, W.; Wang, Z.; Hu, X. Agile Earth Observation Satellite Scheduling Algorithm for Emergency Tasks Based on Multiple Strategies. J. Syst. Sci. Syst. Eng. 2021, 30, 626–646. [Google Scholar]
  30. Mok, S.H.; Jo, S.; Bang, H.; Leeghim, H. Heuristic-Based Mission Planning for an Agile Earth Observation Satellite. Int. J. Aeronaut. Space Sci. 2019, 20, 781–791. [Google Scholar]
  31. Wang, X.; Deng, C.; Shao, A.; Tan, Z. Agile earth observation satellite scheduling over 20 years: Formulations, methods, and future directions. IEEE Syst. J. 2020, 15, 3881–3892. [Google Scholar] [CrossRef]
  32. Wang, H.; Xu, R. Heuristic decomposition planning for fast spacecraft reorientation under multiaxis constraints. Acta Astronaut. 2022, 198, 286–294. [Google Scholar]
  33. Mok, S.-H.; Bang, H.; Lee, D. Closed-form solution of attitude command generation for spin-to-spin maneuver. Adv. Space Res. 2023, 71, 676–691. [Google Scholar]
  34. Fazlyab, A.R.; Saberi, F.F.; Kabganian, M. Fault-tolerant attitude control of the satellite in the presence of simultaneous actuator and sensor faults. Sci. Rep. 2023, 13, 20802. [Google Scholar]
  35. Gao, S.; Tian, Y.; Fang, J.; Xu, S. Adaptive fuzzy fault-tolerant control for the attitude tracking of spacecraft within finite time. Acta Astronaut. 2021, 189, 166–180. [Google Scholar]
  36. Chun, J.; Fan, J.; Zeng, Q.; Liu, J. Deep reinforcement learning for the agile earth observation satellite scheduling problem. Mathematics 2023, 11, 4059. [Google Scholar] [CrossRef]
  37. Peng, G.; Zhao, J.; Song, B.; Xie, Y.; Zhao, W.; Xi, X. An exact algorithm for agile earth observation satellite scheduling with time-dependent profits. Comput. Oper. Res. 2020, 120, 104946. [Google Scholar]
  38. Chowdhury, S.; Helian, N.; de Amorim, R.C. Feature weighting in DBSCAN using reverse nearest neighbours. Pattern Recognit. 2023, 137, 109314. [Google Scholar]
  39. Chen, Y.; Li, W.; Zhang, S.; Zhang, Y.; Liu, Y.; Shen, Z. A multi-objective modeling method of multi-satellite imaging task planning for large regional mapping. Remote Sens. 2020, 12, 344. [Google Scholar] [CrossRef]
Figure 1. Schematic diagram of coordinate transformation and observation geometry between satellite and ground targets.
Aerospace 12 00309 g001
Figure 2. Priority-based geographical clustering method. (a) Target distribution with different priorities (indicated by marker size) and their cluster affiliations (indicated by marker shape). The visualization demonstrates our clustering approach using a representative subset of points from the complete 80-target dataset described in Section 4.1. (b) Distance integration demonstration showing how spatial distance and priority similarity are combined with threshold circle. (c) Four-stage hierarchical clustering process showing the evolution from the initial state to the final clusters. (d) Temporal analysis of cluster visibility windows, where the overlap of visibility scores and threshold line helps identify optimal observation periods.
Aerospace 12 00309 g002
Figure 3. Framework of the dual-timeline coordinated planning strategy.
Aerospace 12 00309 g003
Figure 4. Geographical distribution of targets with different priority levels (indicated by marker size) and their cluster affiliations (indicated by marker shape). The clustering results demonstrate strong geographical coherence while preserving priority relationships, with Cluster 1 (blue circles) covering northern high-priority regions, Cluster 2 (green triangles) covering central regions, and Cluster 3 (red squares) covering southern coastal areas.
Aerospace 12 00309 g004
Figure 5. Temporal distribution of target visibility windows from 17:00:00 to 22:30:00, featuring an expanded view of the high-density period (18:44:00–18:50:00) to illustrate the concurrent visibility opportunities across multiple targets.
Aerospace 12 00309 g005
Figure 6. Satellite attitude maneuver trajectories and energy consumption history: (a) complete mission timeline with detailed view of dense observation period (18:44:00–18:50:00), (b) cumulative energy consumption profile.
Aerospace 12 00309 g006
Figure 7. Cluster-wise analysis showing average priority levels and corresponding observation rates: (a) the number of objects in each cluster compared to the number of objects that have been observed. (b) the average priority of the target and the observed rate of the target for each cluster.
Aerospace 12 00309 g007
Figure 8. Target observation timeline visualization: combined view of complete observation schedule (17:00:00–22:30:00) with enlarged detail of peak activity period (18:44:00–18:50:00), showing original visibility windows (dashed lines) and actual observation intervals (colored blocks).
Aerospace 12 00309 g008
Figure 9. Priority-based task completion distribution highlighting preferential treatment of high-priority targets.
Aerospace 12 00309 g009
Figure 10. Performance comparison of different algorithms: (a) coverage rate showing percentage of successfully observed targets, (b) computation time demonstrating processing efficiency on logarithmic scale, (c) total energy consumption across observation period, (d) priority-weighted efficiency score considering observation timing and target priorities.
Aerospace 12 00309 g010
Figure 11. Computation time comparison of different algorithms for various target numbers.
Aerospace 12 00309 g011
Table 1. Satellite parameters.
SMAEcc.Inc.RAANArg. Per.True Anom.Batt. Cap.
(km)(-)(deg.)(deg.)(deg.)(deg.)(Ah)
7065.00.00.00.098.20.0180.0
Disclaimer/Publisher’s Note: The statements, opinions and data contained in all publications are solely those of the individual author(s) and contributor(s) and not of MDPI and/or the editor(s). MDPI and/or the editor(s) disclaim responsibility for any injury to people or property resulting from any ideas, methods, instructions or products referred to in the content.

