Abstract
With the significant potential of Unmanned Aircraft Vehicles (UAVs) extending throughout various fields and industries, their proliferation raises concerns regarding potential risks within the national airspace system (NAS). To enhance the safe and efficient integration of UAVs into airport environments, this paper presents an analysis of temporal statistical patterns in flight traffic, the predictive modeling of future traffic trends using machine learning, and the identification of optimal time windows for UAV operations within airports. The framework was developed using historical Automatic Dependent Surveillance–Broadcast (ADS-B) data obtained from the OpenSky Network. Historical flight data from Class B, C, and D airports in California are processed, and statistical analysis is carried out to identify temporal variations in flight traffic, including daily, weekly, and seasonal trends. A recurrent neural network (RNN) model incorporating Long Short-Term Memory (LSTM) architecture is developed to forecast future flight counts based on historical patterns, achieving mean absolute error (MAE) values of 4.52, 2.13, and 0.87 for Class B, C, and D airports, respectively. The statistical analysis findings highlight distinct traffic patterns across airport classes, emphasizing the practicality of utilizing ADS-B data for UAV flight scheduling to minimize conflicts with manned aircraft. Additionally, the study explores the influence of external factors, including weather conditions and dataset limitations on prediction accuracy. By integrating machine learning with real-time ADS-B data, this research provides a framework for optimizing UAV operations, supporting airspace management and improving regulatory compliance for safe UAV integration into controlled airspace.
1. Introduction
Integrating UAVs into the NAS is crucial to safely expand UAV operations in both the commercial and public sectors. This integration will allow for smooth coordination between manned and unmanned aircraft, reducing congestion, improving air traffic efficiency, and opening up new possibilities for industries like logistics, agriculture, and emergency response. As UAVs operate alongside traditional aircraft, they will transform urban and rural environments by providing reliable, rapid services, from medical deliveries to real-time disaster assistance, ultimately reshaping the way we connect, deliver, and respond globally.
From small UAVs used in close-range surveillance to larger, long-range UAVs deployed in intelligence and combat support, these autonomous aircraft are redefining capabilities in various industries. In civil applications, UAVs are used for agriculture [1], infrastructure monitoring [2], public safety [3], and environmental conservation [4], providing high-precision, cost-effective solutions for tasks that once required significant human resources. UAVs also play a critical role in time-sensitive scenarios such as emergency response, search and rescue, and medical deliveries, ensuring rapid access to remote or hazardous areas [5]. In defense, UAVs offer improved functionalities in surveillance, border security, and electronic warfare, while the integration of artificial intelligence and real-time analytics continues to push the boundaries of autonomous operation [6]. As UAVs become more integrated with AI and data analytics, their role in civilian and military applications is set to grow, promising NAS operations to be safer, more efficient, and highly adaptable to the needs of a rapidly changing world.
UAVs are transforming airport operations, offering advanced solutions in inspection, security, wildlife management, and environmental monitoring. By assisting with infrastructure inspections, UAVs reduce downtime and boost efficiency through the rapid and thorough assessments of runways [7], lighting, and fencing [8]. In security, UAVs enhance perimeter surveillance, keep restricted areas secure, and monitor unauthorized activity, ensuring a safer airport environment [9]. In addition, UAVs help to manage wildlife by detecting and deterring birds and other animals, reducing the risk of bird strikes on runways [7]. For environmental monitoring, UAVs gather data on air quality, noise pollution, and local environmental conditions, helping airports manage their ecological footprint [10].
However, integrating UAVs into airport operations presents distinct challenges, including maintaining safe coordination with manned aircraft [11], ensuring effective communication for detect-and-avoid systems (DAAs) to avoid operational conflicts [12], and meeting stringent regulatory standards [13]. Each risk category—air, ground, and infrastructure—requires a targeted approach in risk analysis to ensure safe UAV operations. Air risk analysis focuses on avoiding collisions and interference with aircraft systems by setting safe zones and altitude restrictions [14]. The assessment of ground risk is vital to prevent damage to ground personnel and equipment, establishing safe operating areas to avoid disruptions to ground activities. Infrastructure risk analysis evaluates potential impacts on airport assets, including ATC, radars, lighting, and communication systems. As UAVs become more integral to airport functions, a comprehensive approach to risk management is essential for the safe and smooth integration of UAVs into the complex environment of airport operations [12] and UAV capacity estimation within restricted airspace [15]. Finally, the risk of lost communication links between the UAV and its ground station presents a significant challenge [16]. A disruption in connectivity can lead to mid-flight anomalies, posing threats to both operational safety and mission success.
To ensure safe and efficient UAV integration into NAS and airport operations, technologies for detecting crewed aircraft and other non-cooperative traffic are important. Airports are usually equipped with systems that enable DAA such as radar and ADS-B, among others. ADS-B is a key enabler for air traffic control (ATC) as well as the other aircraft to see the aircraft and hence to avoid them. By providing real-time position and velocity data, ADS-B enables precise tracking of manned aircraft, facilitating safe coordination with manned aircraft and reducing collision risks. Several studies have highlighted the utility of ADS-B in UAV operations. For instance, a 2024 study analyzed ADS-B systems and channel occupancy, emphasizing the importance of ADS-B in strengthening UAV control and situational awareness [17]. Another paper focused on collision avoidance capabilities in high-density airspace using ADS-B, demonstrating its effectiveness in ensuring situational awareness during mixed-traffic airspace operations [18]. ADS-B remains one of the best methods for cooperative aircraft surveillance due to its wide adoption, interoperability, and ability to support safe operation for both manned and unmanned aircraft.
2. Background
The use of the commercial mandate of ADS-B became effective since 2020 by the NextGen program of the USA [19] and the SESAR program of the European Union [20]. This implementation aims to enhance air traffic surveillance, improve operational efficiency, and increase flight safety by replacing traditional radar-based tracking with satellite-based technology. Previous studies show that ADS-B data has better performance than radar technology in terms of signal accuracy, thus offering a reliable means of communication and navigation. Thus, ADS-B data help in aggregating flight operations and provide a detailed view of flight traffic based on flight data distributions [21]. Additionally, since ADS-B data captures flight activity during the landing phase, they are crucial for analyzing traffic patterns and associated risks [22], especially considering that more than half of commercial flight accidents occur during landing [23]. Furthermore, UAV operations are widely carried out at altitudes that lie within the landing or approach phase of the flight, posing an additional risk of near-mid-air collision (NMAC). ADS-B data is spatially and temporally referenced—while GPS locations provide the special location of the flight, the timestamp provides the temporal characteristic of the flight. Thus, risk mitigation measures can be derived from ADS-B data based on the time and location of flight traffic. The next section describes the previous analysis of flight data utilizing ADS-B data.
Corrado et al., 2021 [24] used clustering algorithms on ADS-B data to detect spatial and energy anomalies, finding that spatial anomalies often coincide with energy anomalies. Their analysis aids air traffic control and flight crews in improving risk assessment and safety. Margaret McNamara et al., 2016 [25] analyzed the ADS-B data adjacent to the Purdue University Airport, Indianapolis International Airport, and Paris Charles de Gaulle International Airport. They emphasized the cost-effectiveness of ADS-B Mode-S data collection and their potential application in airport operations and fleet usage. They argued that the unique ICAO identifier from Mode-S data can be used for real-time fleet tracking and in particular increase the efficiency of flight schools. Data-driven approaches using ADS-B data were carried out recently, including ADS-B processing and operational milestone concepts [21], as well as the analysis of airport performance correlation with the weather conditions in European airports [26], which was further improved to forecasting operational delays using the application of artificial neural networks [27]. Verbraak et al. [28] analyzed large ADS-B datasets to assess the quality of ADS-B data, and they concluded that ADS-B data can report accurate navigational parameters, but external factors have the potential to influence the accuracy of the data. Zhang et al., 2011 [29] compared ADS-B data with radar data and high accuracy real-time kinematic (RTK) data and concluded that ADS-B data are better quality than radar data. Schultz et al., 2018 [30] analyzed ADS-B data and developed a framework to optimize aircraft traffic and efficiency using prediction-based assistance tools.
Given the critical need for UAV integration into airspace and the role of reliable data sources like ADS-B in risk identification and mitigation, this study utilizes ADS-B data to analyze UAV-related risks and develop mitigation strategies in and around airports. The broader objective of this paper is to enhance the safe and effective integration of UAVs into airport settings. More specifically, we investigate the temporal behavior of flight traffic patterns for airports that exist in Class B, C, and D airspace using ADS-B data. The paper conducts a comprehensive statistical analysis of flight traffic data to gain insights into specific temporal flight traffic variations in each airport. After that, a machine learning algorithm, RNN, is used to predict future flight traffic. Knowing future flight traffic patterns helps UAV operators plan optimal times for carrying out UAV operations. The key takeaways from the present study include the finding that ADS-B is a reliable data source that can be utilized in such analyses. Additionally, it is observed that the flight traffic patterns for each specific airport class are independent and need to be analyzed separately. Furthermore, the study identifies specific time intervals and days in a week when reduced flight traffic is observed, which could help reduce the risk of UAV integration into airports. Finally, ADS-B data, coupled with machine learning models such as RNN, can be efficient tools for predicting future flight traffic at specific airports.
This research was part of the FAA-sponsored project Safety Risk Mitigation for UAV on and Around Airports (A31_A11L.UAS.72), which was conducted under the Alliance for System Safety of UAS through Research Excellence (ASSURE) [31]. The project aimed to enhance the safe integration of UAV operations within airport environments by identifying risk mitigation strategies for both on-ground and airborne interactions with manned aircraft. The research in this paper aims to determine the most suitable time windows for UAV operations in airport environments by utilizing ADS-B data and machine learning models to reduce risk. This paper is organized as follows: Section 3 details the data collection, preprocessing, and exploratory analysis of ADS-B data to identify flight traffic patterns. A machine learning model using RNNs predicts flight counts based on historical data. Section 4 presents statistical findings, model performance, and factors like weather influencing traffic. The integration of UAV operations section explores how these findings aid UAV scheduling and regulatory alignment for safer airspace operations.
3. Materials and Methods
The workflow used in the present study is detailed in Figure 1. The workflow began with the collection of historical ADS-B data from the OpenSky Network. The dataset was refined by extracting flight records within a three-mile radius and up to 1000 feet in altitude. Next, interpolation and resampling techniques were applied to enhance data continuity. Altitude calculations were then performed using geometric altitude and mean sea level (MSL) values to determine the aircraft’s height above ground level (AGL). Exploratory data analysis was conducted, incorporating weather and other relevant auxiliary data. In the preprocessing phase, input and target attributes were identified for model training. An RNN using LSTM architecture was implemented to predict flight traffic patterns. Model performance was assessed through cross-validation to ensure reliability. Finally, the results were presented, providing interpretations into optimal flight periods. Each of these steps is explained in detail in the following sections.
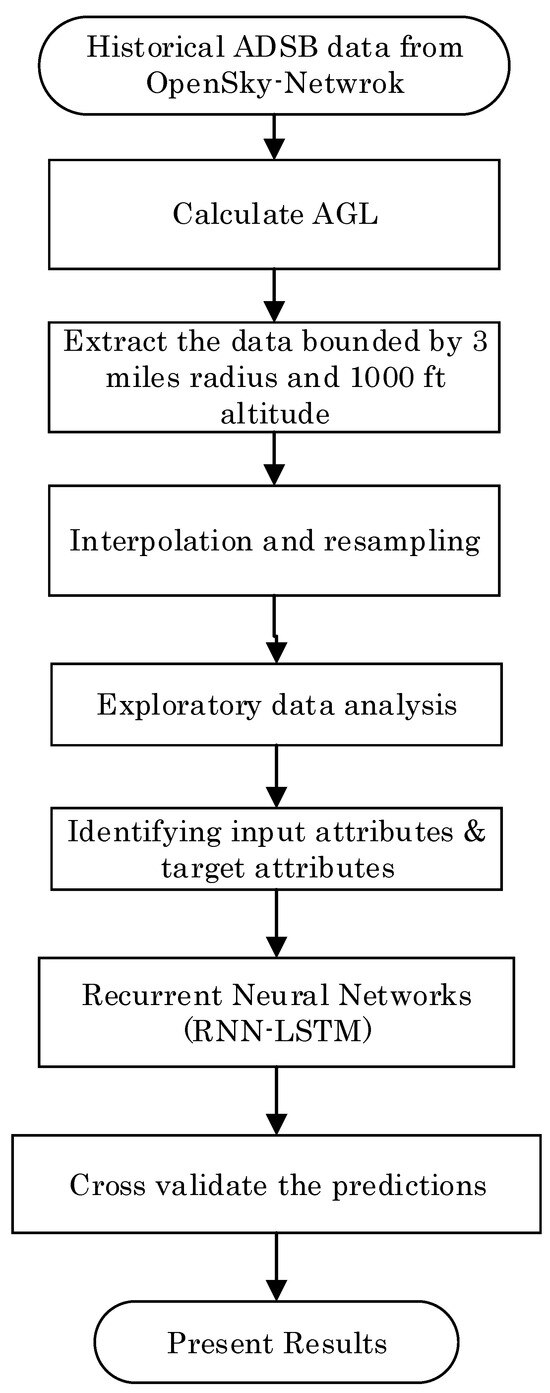
Figure 1.
Workflow for flight traffic prediction using ADS-B data. Steps include data extraction; preprocessing; exploratory analysis; and RNN-LSTM modeling, validation, and result presentation.
3.1. Data Collection
ADS-B is a key surveillance technology that periodically transmits aircraft state parameters, including GPS-derived position, altitude, velocity, and operational status. These broadcasts enhance real-time tracking and awareness of real-time conditions for pilots and air traffic controllers. ADS-B functionality is divided into two components: ADS-B Out, which refers to the transmission of aircraft information, and ADS-B In, which enables the reception of data from other aircraft. The transmitted signals are received by ground-based sensors or other airborne systems. The ADS-B data used in the present study were sourced from OpenSky Network. The OpenSky Network has been functioning as a non-profit since 2013 and is global initiative dedicated to collecting and archiving air traffic surveillance data through a distributed network of ADS-B receivers [32]. For comprehensive guidelines on ADS-B equipment mandates, performance criteria, and operational use, readers are directed to § 91.227 and § 91.225 of the Code of Federal Regulations [19].
The ADS-B system operates autonomously, continuously broadcasting aircraft state information without direct pilot input. These data are freely accessible to any entity with compatible receiving equipment, fostering greater transparency in air traffic monitoring. The OpenSky Network aggregates ADS-B transmissions from aircraft within range of its volunteer-operated receivers, compiling a comprehensive time series dataset that includes position data, kinematic data, operational status, and associated uncertainty metrics. These datasets have been extensively used in aviation research for applications such as ADS-B error analysis, fault detection, aircraft performance assessment, multilateration-based position validation, security evaluations, and air traffic modeling [21]. Given its extensive global coverage, open-sorce access, and established reliability, the OpenSky Network was selected as the primary ADS-B data source for this study.
Airport Selection
We identified three airports, covering each of the airport classifications according to those defined by the Federal Aviation Administration (see Figure 2): Los Angeles International Airport (LAX; Class B airspace), Sacramento International Airport (SMF; Class C airspace), and Santa Maria Public Airport (SMX; Class D airspace); see [33]. Opened in the southwestern section of Los Angeles known as the Westchester area, LAX is one of the busiest airports in the U.S., with extensive commercial traffic that includes everything from regional jets to commercial international flights. Conversely, SMF—located close to California’s capital—supports a moderate volume of commercial passenger traffic as well as cargo operations, which is representative of the class C airport’s typical profile. With substantially lower traffic volumes primarily resulting from general aviation, flight training, and low-complexity charter operations, Santa Barbara County-operated airport SMX is an ideal example of the kind of significantly less complex Class D airport operations. Airspace classification and ADS-B requirements in U.S. airspace as defined by the Federal Aviation Administration (FAA) are presented in the Figure 2.
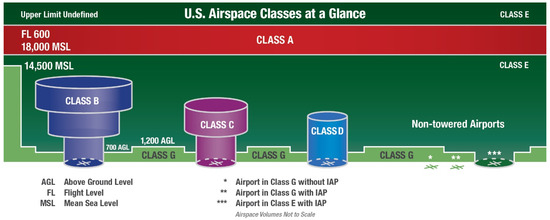
Figure 2.
Overview of U.S. airspace classifications, highlighting Class A, B, C, D, E, and G airspace along with altitude boundaries. The diagram differentiates controlled and uncontrolled airspace, including non-towered airports. IAP stands for Instrument Approach Procedure. (Source: [34]).
To study the spatiotemporal dynamics of flight activity of this representative class spectrum, we retrieved historical ADS-B data covering the complete calendar year 2021 (from the 1st of January to the 31st of December) from the OpenSky Network [32]. This open-access data source aggregates raw ADS-B signals from a worldwide array of receivers, providing detailed position and identification information for cooperative aircraft. Since LAX, SMF, and SMX exhibit diverse traffic patterns, airspace complexities, and operational procedures, analyzing them jointly helps ensure that our subsequent data-driven modeling approach applies to a wide range of airport types.
3.2. Data Preprocessing
In this section, the ADS-B data processing will be explained, which covers converting Unix timestamps to datetime, correcting altitude using USGS elevation maps, and resampling flights into equal data times. The time reference in ADS-B data retrived from the OpenSky Network is in the unix timestamp (UTS) format, also known as POSIX timestamp. This is the total count of seconds since 00:00:00 UTC on Thursday, 1 January 1970 [35]. The unix timestamp was converted to readable time format in local time zone using the Python package Pandas dt [36].
The flight altitude above mean sea level (MSL) in this study was derived from geometric altitude data obtained via OpenSky Network’s ADS-B system. Geometric altitude, determined using GPS, reflects an aircraft’s height relative to the Earth’s ellipsoid. To calculate the altitude above ground level (AGL), the MSL values were adjusted using digital elevation maps from the U.S. Geological Survey (USGS) [37]. These maps provide precise MSL values at each latitude and longitude along the flight path, allowing for determination of AGL altitude. A comparative analysis of MSL and AGL altitudes over a specific time period is illustrated in Figure 3. However, geometric altitude is still subject to GPS accuracy and DOP-related errors. In our case, when assessing flight counts within 1000 ft, these errors are negligible.
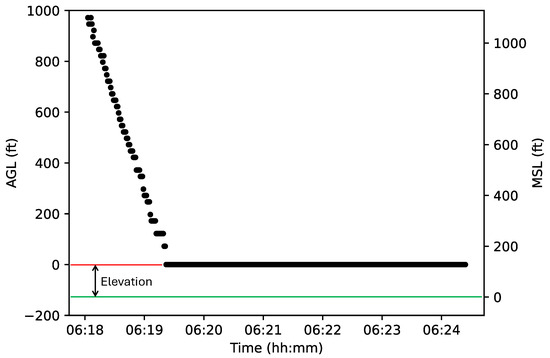
Figure 3.
The plot displays altitude above ground level (AGL, left y axis) and altitude above mean sea level (MSL, right y axis) versus time of an landing airport trajectory (callsign: AAL2670) at LAX Airport.
It was observed that the time intervals during the flight path are not uniform. In order to make meaningful flight count comparisons of different time duration in a given time interval, it is necessary to resample all flight data in the same time intervals. Therefore, we resampled each flight segment into time samples of 1 s using linear interpolation, as shown in Figure 4. Furthermore, we have interpolated latitude, longitude, and altitude, as well as created new samples at the newly created time samples.
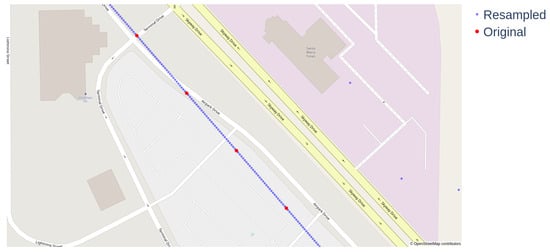
Figure 4.
An example showing the comparison of original and resampled aircraft trajectories from ADS-B data at Santa Maria Airport (SMX), shown overlaid on an aerial image.
3.3. Machine Learning
We utilized the RNNs machine learning framework to predict the next 168-h (one-week) airport flight counts based on previous records. This model was used to learn time patterns, in this case daily and weekly cycles that are built into flight traffic. In particular, we used an LSTM network, which is a dedicated RNN architecture that can model extended patterns in time series data [38]. A classification of popular RNN architectures is presented in the Figure 5. LSTM proved beneficial in this study, as it excels at capturing long-term dependencies in flight traffic data [39]. This capability allows for more accurate forecasting of daily and weekly trends while addressing the vanishing gradient problem that often affects standard RNNs [39]. Additionally, its specialized mechanisms help filter out short-term fluctuations, preserving relevant historical patterns.
Such capability is crucial for accurately capturing the cyclic trends and seasonality in the counts of flights. Our methodology consisted of formatting the data into sequences of hourly flight counts for up to 168 h and training the LSTM to forecast the flight count for the next time step. This allowed us to create a full-week forecast. We selected the LSTM model for its effectiveness in handling time series and sequential data. The model was implemented and trained using the Python 3.10.13, TensorFlow 2.10.0 framework [40], which is optimized for deep learning workflows and supports efficient GPU acceleration. Furthermore, to ensure robustness, we used cross-validation during training and fine-tuned the model’s hyperparameters, including the count of LSTM layers and hidden units and learning rate, to maximize predictive power. Here, we present only the pertinent details, and for a detailed description of the RNN, the readers are referred to [41,42].
RNNs process sequential data by keeping a hidden state that is updated recursively at every time step (see Figure 6). For an input sequence , the hidden state at time t is computed as
where denotes the hidden state from the previous time step. The weight matrices for the hidden state and input are represented by and , respectively, and is the bias vector for the hidden state. Finally, is the activation function, which is typically hyperbolic tangent (tanh) or rectified linear unit (ReLU); in this study, we used tanh.
The output at time t is determined as
Here, is the weight matrix for the output layer, represents the bias vector for the output layer, and denotes the activation function used in the output layer.
LSTM neural networks are part of the RNN family and have been designed to learn dependencies that are of long range. Each LSTM unit will include gates regulating information flow—the forget gate, input gate, and output gate. LSTM equations are formulated to handle sequential data effectively. The forget gate () is defined as
where the sigmoid activation function controls the amount of information from the previous cell state to be preserved. The weight matrices corresponding to the forget, input, cell state, and output gates are denoted by , respectively, while the corresponding bias terms for these gates are denoted as . The input gate () updates the cell state with new information and is formulated as
and the candidate cell state () is computed as
The revised cell state () is obtained by merging the influences of the forget and input gates:
where ⊙ represents element-wise multiplication. The output gate () regulates the flow of information to the hidden state, which is given by
and the hidden state () is computed as
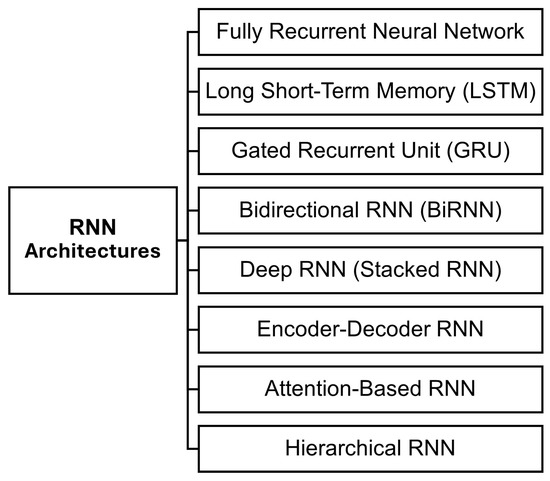
Figure 5.
A classification of recurrent neural network (RNN) architectures, highlighting key variants [43,44].
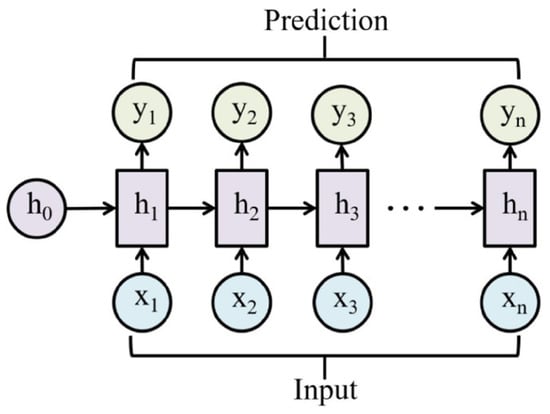
Figure 6.
Basic RNN architecture showing the hidden states and weight metrics (Source: [45]).
Application of LSTM for Flight Count Prediction
The prediction task is framed as a time series forecasting problem, where the historical data consisting of hourly flight counts , with T = 8760 for a full non-leap year. To capture both daily and weekly patterns, we constructed input sequences using a sliding window approach. Specifically, we created input vectors of fixed length 168 h (one week) as follows:
with the corresponding target value being the flight count at the next hour, . This formulation allows the LSTM to learn the sequential dependencies over a week-long period and to predict the immediate future value based on recent trends. The LSTM model was trained by minimizing the mean squared error (MSE) loss function, which is expressed as
where is the predicted flight count, is the actual flight count, and N is the total number of samples.
Our training datasets have two principal variables: time (hours) and the respective count of flights. With 365 days of continuous collection of information (24 h per day), 8760 data points constitute our dataset. The algorithm processed these data points and generated 168-h sliding windows with the respective target count of flights. Not only does this sliding window mechanism enrich training samples, but it also helps in the generalization of temporal trends for the model. During training, the LSTM model is treated as a ’black box’ and learns through training with past flight count information. With backpropagation through time (BPTT), its inner weights are calibrated to extract both short-term fluctuations and long-term periodicity in airline traffic. We used the mean absolute error (MAE) metric to evaluate the model’s performance. The MAE can be expressed as
where n denotes the total number of observations, denotes the actual values, denotes the predicted values, and corresponds the absolute error for each observation. The RNN was implemented on a system with an Intel Core i7 processor, 32GB RAM, and an NVIDIA RTx with 16GB RAM GPU using TensorFlow.
4. Results and Discussion
4.1. Exploratory Data Analysis
Flight Traffic Pattern Comparison
For each airport analyzed, a spatial boundary with a maximum radius of three miles was established to enable consistent comparison of the average flight counts across different airport classes for the year 2021. Due to its higher operational capacity and volume, Los Angeles International Airport (LAX, Class B) exhibited significantly higher average flight counts than the other two airports, Sacramento International Airport (SMF, Class C) and Santa Maria Public Airport (SMX, Class D). As shown in Figure 7, there was a marked decline in flight counts prior to the 100th day of the year, followed by a subsequent increase in both LAX and SMF until approximately the third quarter. In contrast, SMX maintained relatively stable flight counts throughout the year. It is important to note that a minor gap in ADS-B data from January, attributable to incomplete OpenSky Network coverage, contributed to the lower early-year values observed for SMF and SMX.
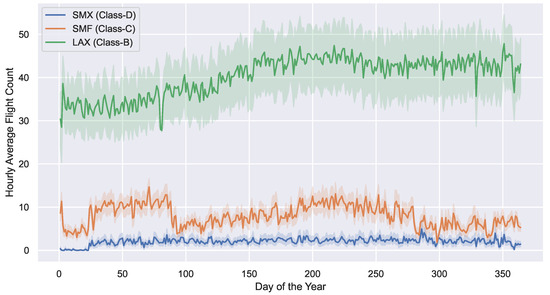
Figure 7.
Comparison of daily flight traffic patterns across Class B (LAX), Class C (SMF), and Class D (SMX) airports over the course of a year. The figure illustrates the hourly average flight count for each airport type, highlighting seasonal and temporal variations in air traffic density.
Hourly analyses further reveal that peak flight activity generally occurred between 05:00 and 15:00 local time, as illustrated in Figure 8. While some flights were observed later in the evening—particularly at LAX and SMF—these occurrences were infrequent. Consistent with expectations for a larger, busier airport, LAX recorded an average of approximately 55 flights per hour during daytime hours and around 27 flights per hour during nighttime hours, in contrast to the lower Figures observed at SMF and SMX. Figure 9 shows the average number of flights per hour during the day and night at the Class B (LAX), Class C (SMF), and Class D (SMX) airports. The difference in day and night activity is quite noticeable. LAX sees a significant increase in traffic during the day, although it still has a moderate number of flights overnight. On the other hand, SMX has very few flights at night, highlighting its lower overall traffic levels. SMF falls in between these two extremes, with moderate flight activity both during the day and night. However, there is still a clear drop in traffic during off-peak hours.
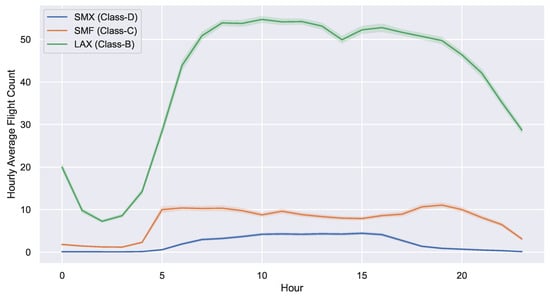
Figure 8.
Hourly average flight counts for Class B (LAX), Class C (SMF), and Class D (SMX) airports aggregated over the year 2021. The Figure highlights distinct daily traffic patterns, with peak activity occurring during daytime hours, particularly at LAX, while SMX exhibits consistently lower flight volumes.
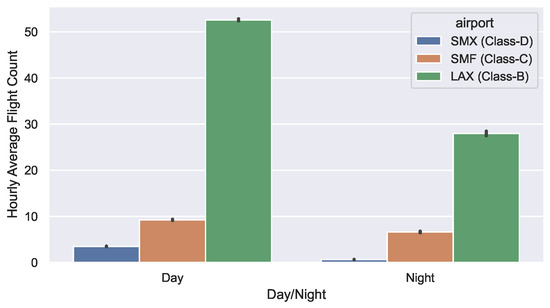
Figure 9.
Comparison of hourly average flight counts during day and night at Class B (LAX), Class C (SMF), and Class D (SMX) airports. The Figure illustrates distinct day–night traffic variations, with LAX experiencing significantly higher flight volumes, particularly during daytime hours, while SMX maintains consistently lower activity.
When evaluating temporal variations, the comparison between monthly and weekday average hourly flight counts (Figure 10 and Figure 11) indicates that inter-month variability was more pronounced than inter-weekday variability. Specifically, the weekday analysis demonstrated minimal fluctuation, particularly for the airports in Classes C and D. In contrast, monthly analysis shows that the Class C airport reached peak hourly flight counts of approximately 11 flights in March and August, while the Class B airport experienced peaks of around 45 flights in July and August. For the Class D airport, aside from the January data gap, the average hourly flight count remained consistently low at 2–3 flights throughout the year. Furthermore, Figure 10 presents the daily average flight counts, where minor peaks were observed in June, November, and December. The data suggest a gradual increase in overall flight counts as the year progressed, with LAX experiencing its highest activity in November and December—a trend that may be linked to increased traffic during holidays such as Thanksgiving, Veterans Day, and Christmas.
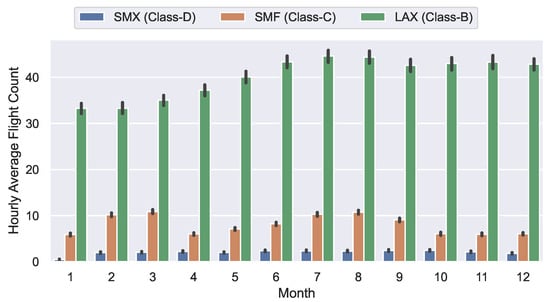
Figure 10.
Monthly variation in hourly average flight counts for Class B (LAX), Class C (SMF), and Class D (SMX) airports. The figure highlights seasonal traffic trends, with peak activity observed at LAX during summer and winter months.
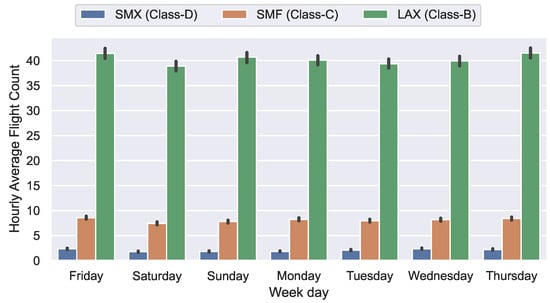
Figure 11.
Weekly variation in hourly average flight counts for Class B (LAX), Class C (SMF), and Class D (SMX) airports, showing relatively stable trends across weekdays with higher traffic at LAX.
4.2. Machine Learning Predictions
The progression of the MSE is visualized in Figure 12. It is evident that, after approximately 60 epochs, the MSE plateaued, indicating that further reductions in the loss function would be unattainable. Additionally, it is worth noting that LAX necessitated a greater number of epochs to achieve the lowest attainable loss when compared to the other two airports.
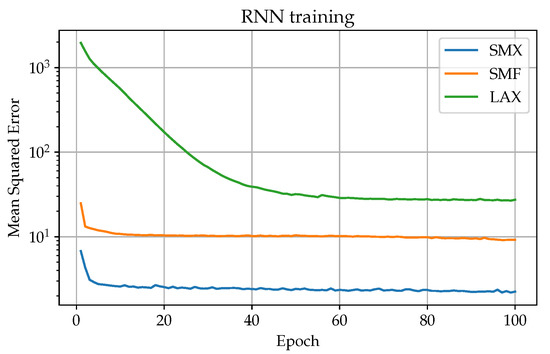
Figure 12.
Training loss progression of the RNN model for Class B (LAX), Class C (SMF), and Class D (SMX) airports. The mean squared error decreased with training epochs, stabilizing after approximately 60 epochs, indicating model convergence.
The machine learning predictions are depicted in Figure 13, Figure 14 and Figure 15. These predictions were assessed using the mean absolute error (MAE) evaluation metric, as detailed in the previous section. The MAE values for the three airports are as follows: 0.87 for SMX, 2.13 for SMF, and 4.52 for LAX. Notably, SMF exhibited a relatively high level of error when expressed as a percentage of these errors. Further investigation was conducted to understand the causes of this error. It was observed that SMF’s data displayed more pronounced fluctuations, both short-term (daily) and long-term (monthly), compared to the other two airports. These high fluctuations may not follow a discernible pattern. In contrast, LAX consistently demonstrated a pattern in data variability at both the local and global scales. On the other hand, SMX airport showed irregular fluctuations in hourly flight counts but maintained a consistent pattern when observed at daily and weekly scales. These data patterns may have influenced the prediction results of the ML-RNN algorithms.

Figure 13.
Predicted vs. actual hourly flight counts for LAX using the RNN model for the last week of 2021. The model captures overall trends but shows minor deviations, particularly during holiday periods.

Figure 14.
Predicted vs. actual hourly flight counts for SMF using the RNN model for the last week of 2021. The model captures overall trends but exhibits deviations, particularly around fluctuating traffic periods.

Figure 15.
Predicted vs. actual hourly flight counts for SMX using the RNN model for the last week of 2021. The model follows the general trend but shows deviations, particularly on 25 December, likely due to holiday-related traffic variations.
The results for LAX reveal a consistent pattern in weekly flight traffic, with minimal variation observed across weekdays. However, there was a notable intra-day variation in flight counts, with early morning hours experiencing lower traffic and daytime hours exhibiting higher traffic volumes. These findings align with the statistical analysis and general trends discussed in the previous section. Conversely, when considering SMF, the distinction in flight counts between day and night was not as pronounced as observed in LAX. This observation is consistent with the conclusions drawn from the previous statistical analysis.
On the other hand, SMX stood out as a unique case, where nighttime flight activity was almost non-existent, as accurately reflected in the ML analysis. However, on the date 25 December 2021 the model’s predictions deviated significantly from the actual values. While, on average, the ML predictions tended to slightly overestimate the actual counts, they still aligned with the overall trend of the true values. It is worth noting that the RNN model’s emphasis on avoiding overfitting led to more generalized flight count predictions.
An intriguing observation is that the first two days of the predictions fell within the first week of the Christmas holiday season, which exhibited abnormal flight traffic patterns compared to year-round weekly patterns. This particular timeframe was intentionally selected to assess the ML model’s performance. It became evident that the ML model’s accuracy was lower during this holiday period when compared with other days. The ML analysis highlights an interesting aspect: while it successfully predicted the general trends in local patterns, it fell short when it came to capturing specific days accurately. It is important to consider that the quality of the data obtained from the OpenSky Network may have some imperfections, and this could explain the discrepancies on a particular date like 25 December 2021. Nevertheless, the ML-based flight count predictions prove reliable for forecasting traffic at LAX airport. In essence, this underscores the need for a tailored, case-by-case approach when applying ML for forecasting at different airports.
While the flight numbers at commercial airports are typically well-known in advance, there are situations where predictability is challenging, particularly in airports like Grand Forks, where the primary traffic component comprises the University of North Dakota’s aviation training fleet. In such cases, the ML analysis serves as a valuable tool for observing prediction patterns.
4.3. Weather Considerations
Weather conditions affect the flight operations in a region and cause fluctuations in air traffic patterns. Particularly, heavy winds, precipitation, and blizzard conditions can cause significant operational disruptions, including cancellations, delays, and diversions. For instance, the December 2022 North American winter storm resulted in over 10,000 flight cancellations across the United States, with airports such as Chicago’s O’Hare International Airport and Denver International Airport among the hardest hit [46]. These weather-induced disturbances not only have immediate impacts on individual flight operations but can also cascade through the broader air traffic network, leading to systemic delays and reduced efficiency [26]. Recent advances in predictive analytics have incorporated meteorological data into machine learning models to better forecast these disruptions and optimize flight operations under varying weather conditions [26,27,47,48]. Integrating such weather parameters is therefore essential for developing reliable predictive frameworks aimed at supporting both the safety and efficiency of air traffic management systems. The effect of weather parameters such as wind speed and the precipitation on the flight count were analyzed for the selected airports, and the cross-correlation pair plot for the SMX airport is presented in the Figure 16. It can be seen from the Figure that the flight count did not display a correlation with those parameters. It is possible that adverse weather may have impacted the flight traffic for localized instances and did not show overall correlation.
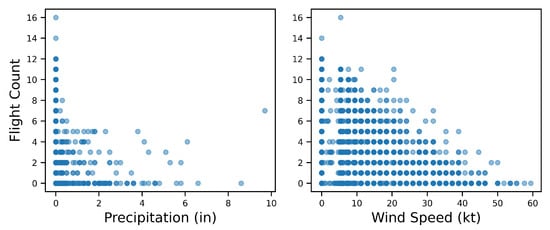
Figure 16.
Relationship between flight count and weather variables at Santa Maria (SMX). This figure presents two scatter plots illustrating the relationship between flight count and key meteorological factors at Santa Maria (SMX) Airport.
4.4. Other Considerations
OpenSky Network ADS-B sensor coverage is not consistently available at airports, particularly at lower altitudes, especially in the Midwest region of the USA, as shown in Figure 17. Therefore, it is imperative to conduct ML analysis while taking data availability into account. This approach ensures that the locally sourced ADS-B data are of high quality and can be employed with confidence in ML-based forecasting. Furthermore, it opens up opportunities to analyze inherent flight traffic patterns, contributing to more effective space–time management within the airport.
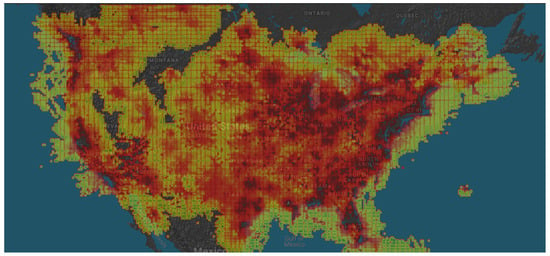
Figure 17.
Opensky Network coverage on 4 February 2025, source [32].
This paper has primarily concentrated on uncovering temporal data patterns within the airport environment. However, a more comprehensive examination would encompass not only temporal patterns but also specialized traffic patterns. A previous research study [14] has examined ADS-B spatial analysis and brought to light previously overlooked areas within the airport, situated far from the runways, that exhibit notably higher flight traffic densities than the surrounding regions. Operating UAVs in these areas could potentially pose elevated risks compared to other regions. However, their study did not explore spatial flight traffic prediction. Therefore, our future efforts will involve an analysis of spatial flight traffic predictions. In this research, the ML analysis exclusively relied on flight counts as input variables. Our findings revealed that weather parameters had a minimal impact on flight traffic predictions. However, it is essential to consider the potential influence of local variables such as festivals, events, and other regional factors on flight traffic. Exploring and integrating such data into the ML model could significantly enhance its predictive accuracy.
5. Integrating UAV Operations in Airport
Optimal operating times for UAVs in and around airports emerge from a multifaceted interplay of airport class, time of day, monthly and seasonal fluctuations, and broader airspace integration initiatives. At the most fundamental level, higher-volume Class B airports, such as LAX airport, exhibit pronounced diurnal peaks—typically between 05:00 and 15:00 local time—with a noticeable dip late at night. This cyclical pattern suggests that UAV flights can be scheduled in the early morning hours or post-evening peak to minimize the risk of encounters with manned aircraft for such things as perimeter checks and building inspections. In contrast, Class D airports, exemplified by SMX airport, register far lower flight volumes and more stable traffic patterns, thus offering a broader range of operational windows for UAVs throughout the day. Class C airports, such as SMF airport, generally occupy an intermediate position, exhibiting moderate traffic levels and somewhat more variable surges around holiday periods and seasonal fluctuations.
Beyond the day–night dichotomy, monthly and seasonal variations further refine the identification of optimal UAV operating times. The data indicate that certain months—often tied to tourism, holidays, or weather-related shifts—see spikes in flight operations, particularly at busier airports. For instance, Class B airports may experience a surge in November and December (linked to holiday travel), while Class C airports might see moderate spikes in months of increased leisure travel or school holidays. By contrast, smaller Class D airports often remain relatively steady, with fewer spikes but occasional dips that align with local events or flight training schedules. On a seasonal scale, extreme weather events—such as winter storms or monsoons—can introduce irregular disruptions. Although the present analysis does not show a strong statistical correlation between flight count and meteorological variables (e.g., wind speed, precipitation, etc.), it is nonetheless clear from the broader literature that prolonged adverse weather can ground aircraft or shift flight times, thereby opening unexpected UAV flight windows.
This nuanced understanding of flight patterns joins with the current research efforts aimed at integrating UAVs into controlled airspace [31,49]. As the FAA and other regulatory agencies advance Unmanned Aircraft Vehicle Traffic Management (UTM) frameworks, the dynamic scheduling of UAV flights based on real-time and forecasted air traffic density will become increasingly feasible [13]. Right-of-way rules and “detect and avoid” algorithms, which are cornerstones of these frameworks, rely heavily on accurate spatiotemporal data to prevent conflicts between manned and unmanned aircraft [11]. By utilizing historical flight trends and near-real-time ADS-B feeds, UAV operators can schedule missions during lower-traffic intervals, thus enhancing compliance with emerging regulatory guidelines and lowering the likelihood of near-mid-air collisions.
From a broader perspective, this research provides a foundational step toward systematically planning UAV flights in congested or sensitive environments. Moreover, this study predominantly employed historical data for flight traffic forecasting. Yet, a broader objective of this research extends to adopting real-time data streams from open-source platforms or locally installed ADS-B receivers. This incorporation of live feed data holds the promise of providing airport authorities with useful information for informed decision-making processes. Temporal models derived from year-long ADS-B datasets illuminate when and how airport traffic changes cycles. This information, in turn, serves as a building block for large-scale automated decision-making systems: if UAVs can be programmed to avoid known peak hours at Class B airports or to exploit consistently low-traffic windows at Class D facilities, the overall efficiency and safety of shared airspace improves. These findings also inform airport authorities and policymakers by offering empirical evidence that can guide the design of UAV corridors, vertical separation minima, and other operational procedures tailored to each airport’s unique profile.
Limitations and Future Work
Despite its value, the study does have limitations. First, coverage gaps in the ADS-B dataset—especially for lower-altitude operations—may lead to the underestimation of flight density at certain times or locations. To address this data scarcity issue and improve the flight data quality at Grand Forks International airport (GFK), researchers at the University of North Dakota (UND) took proactive steps by establishing an ADS-B receiver at UND Aerospace’s Gorman UAS Airfield with the aim of efficiently integrating it into the OpenSky Network’s cloud data infrastructure.
This study serves as a proof of concept, illustrating how recurrent neural networks (RNNs) can be utilized to capture flight traffic patterns for UAV scheduling. While our approach demonstrates the feasibility of using RNNs in this domain, a more comprehensive evaluation that includes multiple forecasting models would strengthen the comparative analysis. Assessing alternative machine learning techniques, such as gradient boosting or transformer-based models, could provide deeper insights into predictive performance differences. However, an extensive model comparison was beyond the scope of this work. Future research will focus on systematically evaluating a broader range of machine learning algorithms while integrating additional external variables—such as real-time weather conditions and regulatory constraints—to develop a more robust and widely applicable predictive framework.
We recognize that flight traffic predictions always involve some level of uncertainty. This can come from several factors. One issue is gaps or incomplete coverage in ADS-B data, which might miss parts of certain aircraft trajectories. Another challenge is the influence of external factors like weather disruptions, special events, or policy changes, which can cause sudden shifts in traffic patterns. Additionally, certain weather phenomena, although shown to be weakly correlated with overall flight counts in this dataset, may have a more substantial localized effect under extreme circumstances. Furthermore, the reliance on historical data means that sudden regulatory changes or emerging operational practices (e.g., rapid adoption of urban air mobility solutions) are not yet reflected in the model. Addressing these challenges will require integrating higher-resolution data streams, real-time weather inputs, and airport operational schedules into predictive frameworks. Moreover, assumptions about stable trends in time series data may not hold true during rare or unpredictable events. To address this, we plan to include formal uncertainty quantification in future work. We aim to use confidence intervals, ensemble methods, or Bayesian approaches to better capture the range of possible outcomes. This will help improve the model’s reliability for operational decision making.
6. Conclusions
By analyzing a full year of ADS-B data from multiple airports with different airspace classifications, we demonstrated how recurrent neural networks (RNNs) can uncover meaningful patterns in flight traffic. Our results particularly emphasize the model’s ability to capture daily and weekly fluctuations, offering valuable analysis for optimizing UAV operations. This approach is especially relevant in controlled airport environments, where maintaining real-time situational awareness is critical.
Our findings confirm that data-driven methods can effectively identify recurring cyclic trends, enabling stakeholders to anticipate predictable increases and decreases in flight activity. Such findings can be instrumental in scheduling UAV operations during lower-risk periods, thereby enhancing overall airspace safety and efficiency.
Looking ahead, we aim to refine this framework by incorporating additional predictive features and integrating more diverse data sources. This includes localized weather conditions and other operational factors that may influence air traffic dynamics. While this study provides a strong foundation, it is equally important to address rare but high-impact disruptions—such as severe storms or public health crises—through advanced uncertainty quantification and adaptive modeling techniques. Expanding in these areas will enhance the model’s accuracy and adaptability, ultimately equipping airport authorities and UAV operators with more reliable tools for managing shared airspace and mitigating operational risks.
Author Contributions
Conceptualization, S.V., P.S. and P.P.; methodology, S.V., P.S. and P.P.; validation, S.V. and P.S.; formal analysis, P.P.; investigation, P.P.; resources, S.V. and P.S.; data curation, P.P.; data pre-processing, P.P., J.T. and M.U.; writing—original draft preparation, P.P.; writing—review and editing, S.V. and P.S.; visualization, P.P., M.U. and J.T.; supervision, S.V. and P.S.; project administration, P.S.; funding acquisition, P.S. All authors have read and agreed to the published version of the manuscript.
Funding
This material is based upon work supported by the Federal Aviation Administration under the Alliance for System Safety of UAS through Research Excellence (ASSURE) Contract No.—A31_A11L.UAS.72. Although the data and information contained herein have been produced or processed from sources believed to be reliable, the Federal Aviation Administration makes no warranty, expressed or implied, regarding the accuracy, adequacy, completeness, legality, reliability or usefulness of any information, conclusions, or recommendations provided herein. Distribution of the information contained herein does not constitute an endorsement or warranty of the data or information provided herein by the Federal Aviation Administration or the U.S. Department of Transportation. Neither the Federal Aviation Administration nor the U.S. Department of Transportation shall be held liable for any improper or incorrect use of the information contained herein and assumes no responsibility for anyone’s use of the information. The Federal Aviation Administration and U.S. Department of Transportation shall not be liable for any claim for any loss, harm, or other damages arising from access to or use of data or information, including without limitation any direct, indirect, incidental, exemplary, special, or consequential damages, even if advised of the possibility of such damages. The Federal Aviation Administration shall not be liable to anyone for any decision made or action taken, or not taken, in reliance on the information contained herein.
Data Availability Statement
The data used in this study are publicly available and can be accessed through the OpenSky Network [32].
Acknowledgments
The authors would like to acknowledge the support of the Federal Aviation Administration under the Alliance for System Safety of UAS through Research Excellence (ASSURE) Contract No.—A31_A11L.UAS.72. The authors would also like to acknowledge the OpenSky Network for providing the ADS-B data used in this study.
Conflicts of Interest
The authors declare no conflicts of interest.
Abbreviations
The following abbreviations are used in this manuscript:
| ADS-B | Automatic Dependent Surveillance–Broadcast |
| AGL | Above Ground Level |
| API | Application Programming Interface |
| ATC | Air Traffic Control |
| BPTT | Backpropagation Through Time |
| CRC | Cyclic Redundancy Check |
| DAA | Detect and Avoid |
| FAA | Federal Aviation Administration |
| GPS | Global Positioning System |
| ICAO | International Civil Aviation Organization |
| LSTM | Long Short-Term Memory |
| MAE | Mean Absolute Error |
| ML | Machine Learning |
| MSL | Mean Sea Level |
| NAS | National Airspace System |
| NMAC | Near-Mid-Air Collision |
| POSIX | Portable Operating System Interface |
| RNN | Recurrent Neural Network |
| RTK | Real-Time Kinematic |
| SESAR | Single European Sky ATM Research |
| SMF | Sacramento International Airport |
| SMX | Santa Maria Public Airport |
| UAV | Unmanned Aerial Vehicle |
| UTM | Unmanned Aircraft Vehicle Traffic Management |
References
- Tsouros, D.C.; Bibi, S.; Sarigiannidis, P.G. A Review on UAV-Based Applications for Precision Agriculture. Information 2019, 10, 349. [Google Scholar] [CrossRef]
- Aela, P.; Chi, H.L.; Fares, A.; Zayed, T.; Kim, M. UAV-based studies in railway infrastructure monitoring. Autom. Constr. 2024, 167, 105714. [Google Scholar] [CrossRef]
- Stampa, M.; Sutorma, A.; Jahn, U.; Thiem, J.; Wolff, C.; Röhrig, C. Maturity levels of public safety applications using unmanned aerial systems: A review. J. Intell. Robot. Syst. 2021, 103, 16. [Google Scholar] [CrossRef] [PubMed]
- Yuan, S.; Li, Y.; Bao, F.; Xu, H.; Yang, Y.; Yan, Q.; Zhong, S.; Yin, H.; Xu, J.; Huang, Z.; et al. Marine environmental monitoring with unmanned vehicle platforms: Present applications and future prospects. Sci. Total Environ. 2023, 858, 159741. [Google Scholar] [CrossRef]
- Restas, A. Drone applications for supporting disaster management. World J. Eng. Technol. 2015, 3, 316–321. [Google Scholar]
- Castrillo, V.U.; Manco, A.; Pascarella, D.; Gigante, G. A review of counter-UAS technologies for cooperative defensive teams of drones. Drones 2022, 6, 65. [Google Scholar] [CrossRef]
- Tomić, L.; Čokorilo, O.; Macura, D. Runway Pavement Inspections Using Drone-Safety Issues and Associated Risks. Int. J. Traffic Transp. Eng. 2020, 10, 278–285. [Google Scholar]
- Chan, K.W.; Nirmal, U.; Cheaw, W.G. Progress on drone technology and their applications: A comprehensive review. AIP Conf. Proc. 2018, 2030, 020308. [Google Scholar] [CrossRef]
- Rodríguez, D.A.; Tafur, C.L.; Daza, P.F.M.; Vidales, J.A.V.; Rincón, J.C.D. Inspection of aircrafts and airports using UAS: A review. In Results in Engineering; Elsevier: Amsterdam, The Netherlands, 2024; p. 102330. [Google Scholar]
- Jońca, J.; Pawnuk, M.; Bezyk, Y.; Arsen, A.; Sówka, I. Drone-assisted monitoring of atmospheric pollution—A comprehensive review. Sustainability 2022, 14, 11516. [Google Scholar] [CrossRef]
- Snyder, P.R.; Kaabouch, N.; Nair, S.V.; Vacek, J.; Pothana, P.; Ullrich, M.; Martin, L.; Moe, J.; Akbas, M.I.; Kiernan, K.; et al. Propose UAS Right-of-Way Rules for Unmanned Aircraft Systems (UAS) Operations and Safety Recommendations: Final Report. Report A11L.UAS.97_A54, University of North Dakota, Embry-Riddle Aeronautical University, University of Kansas, 2024. Sponsored by U.S. Department of Transportation, Federal Aviation Administration. Available at NTIS and FAA William J. Hughes Technical Center. Available online: https://www.assureuas.org/wp-content/uploads/2021/06/A54_Final-Report.pdf (accessed on 10 January 2025).
- Rezaee, M.R.; Hamid, N.A.W.A.; Hussin, M.; Zukarnain, Z.A. Comprehensive Review of Drones Collision Avoidance Schemes: Challenges and Open Issues. IEEE Trans. Intell. Transp. Syst. 2024, 25, 6397–6426. [Google Scholar]
- United States Government Accountability Office. DRONES: FAA Should Improve Its Approach to Integrating Drones into the National Airspace System. In Report to Congressional Requesters; United States Government Accountability Office: Washington, DC, USA, 2023. [Google Scholar]
- Pothana, P.; Joy, J.; Snyder, P.; Vidhyadharan, S. UAS Air-Risk Assessment In and Around Airports. In Proceedings of the 2023 Integrated Communication, Navigation and Surveillance Conference (ICNS), Washington, DC, USA, 18–20 April 2023; pp. 1–11. [Google Scholar] [CrossRef]
- Ullrich, M.; Pothana, P.; Thornby, J.; Snyder, P.; Vidhyadharan, S. Determining the Saturation Point for UAV Operations in Airport Environments: A Probabilistic Approach. In Proceedings of the 2024 Integrated Communications, Navigation and Surveillance Conference (ICNS), Washington, DC, USA, 23–25 April 2024; pp. 1–11. [Google Scholar] [CrossRef]
- Arnold, K.P. The uav ground control station: Types, components, safety, redundancy, and future applications. Int. J. Unmanned Syst. Eng. 2016, 4, 37. [Google Scholar]
- Novák, A.; Kováčiková, K.; Chodelka, F.; Vel’ký, P. Analyzing ADS-B Systems and Channel Occupancy: Enhancing UAV Control and Aviation Safety through Airspace Management. In Proceedings of the 2023 New Trends in Aviation Development (NTAD), Stary Smokovec, Slovakia, 23–24 November 2023; pp. 177–181. [Google Scholar] [CrossRef]
- Zhang, N.; Liu, H.; Ng, B.F.; Low, K.H. Collision probability between intruding drone and commercial aircraft in airport restricted area based on collision-course trajectory planning. Transp. Res. Part Emerg. Technol. 2020, 120, 102736. [Google Scholar] [CrossRef]
- (GPO), U.G.P.O. Electronic Code of Federal Regulations, Title 14: Aeronautics and Space, Part 91—General Operating and Flight Rules, Subpart C—Equipment, Instrument, and Certificate Requirements. Electronic Code of Federal Regulations (eCFR), 2025. Last amended on 22 January 2025. Available online: https://www.law.cornell.edu/cfr/text/14/part-91/subpart-C (accessed on 4 February 2025).
- Brooker, P. SESAR and NextGen: Investing In New Paradigms. J. Navig. 2008, 61, 195–208. [Google Scholar] [CrossRef]
- Schultz, M.; Rosenow, J.; Olive, X. Data-driven airport management enabled by operational milestones derived from ADS-B messages. J. Air Transp. Manag. 2022, 99, 102164. [Google Scholar] [CrossRef]
- Li, X.; Romli, F.I.; Azrad, S.; Zhahir, M.A.M. An Overview of Civil Aviation Accidents and Risk Analysis. Proc. Aerosp. Soc. Malays. 2023, 1, 53–62. [Google Scholar]
- Airbus. Accidents by Flight Phase. 2025. Available online: https://accidentstats.airbus.com/accidents-by-flight-phase/ (accessed on 7 February 2025).
- Corrado, S.J.; Puranik, T.G.; Fischer, O.P.; Mavris, D.N. A clustering-based quantitative analysis of the interdependent relationship between spatial and energy anomalies in ADS-B trajectory data. Transp. Res. Part Emerg. Technol. 2021, 131, 103331. [Google Scholar] [CrossRef]
- McNamara, M.; Mott, J.; Bullock, D. Leveraging Aircraft Avionics for Fleet and Airport Management. Transp. Res. Rec. 2016, 2569, 32–41. [Google Scholar] [CrossRef]
- Schultz, M.; Lorenz, S.; Schmitz, R.; Delgado, L. Weather Impact on Airport Performance. Aerospace 2018, 5, 109. [Google Scholar] [CrossRef]
- Reitmann, S.; Schultz, M. Computation of Air Traffic Flow Management Performance with Long Short-Term Memories Considering Weather Impact. In Proceedings of the Artificial Neural Networks and Machine Learning—ICANN, Rhodes, Greece, 4–7 October 2018; Kůrková, V., Manolopoulos, Y., Hammer, B., Iliadis, L., Maglogiannis, I., Eds.; Springer: Cham, Switzerland, 2018; pp. 532–541. [Google Scholar]
- Verbraak, T.; Ellerbroek, J.; Sun, J.; Hoekstra, J. Large-Scale ADS-B Data and Signal Quality Analysis. In Proceedings of the 12th USA/Europe Air Traffic Management Research and Development Seminar, Washington, DC, USA, 27–30 June 2017. [Google Scholar]
- Zhang, J.; Wei, L.; Yanbo, Z. Study of ADS-B data evaluation. Chin. J. Aeronaut. 2011, 24, 461–466. [Google Scholar] [CrossRef]
- Schultz, M.; Olive, X.; Rosenow, J.; Fricke, H.; Alam, S. Analysis of airport ground operations based on ADS-B data. In Proceedings of the 2020 International Conference on Artificial Intelligence and Data Analytics for Air Transportation (AIDA-AT), Singapore, 3–4 February 2020; IEEE: Piscataway, NJ, USA, 2020; pp. 1–9. [Google Scholar]
- Alliance for System Safety of UAS Through Research Excellence (ASSURE). Safety Risk Mitigation for UAS on & Around Airports. 2025. Available online: https://assureuas.com/projects/safety-risk-mitigation-for-uas-on-around-airports/ (accessed on 20 February 2025).
- OpenSky-Network. OpenSky Network. 2023. Available online: https://opensky-network.org/ (accessed on 16 May 2023).
- The Federal Aviation Administration (FAA), Aeronautical Information Manual: Official Guide to Basic Flight Information and ATC Procedures; U.S. Department of Transportation, Federal Aviation Administration: Washington, DC, USA, 2022; Chapter 3.
- Federal Aviation Administration. Airspace Information Manual (AIM)—Chapter 3, Section 2. Controlled Airspace. 2025. Available online: https://www.faa.gov/air_traffic/publications/atpubs/aim_html/chap3_section_2.html (accessed on 18 February 2025).
- Std 1003.1-2017; IEEE Standard for Information Technology—Portable Operating System Interface (POSIX(TM)) Base Specifications, Issue 7. IEEE (Revision of IEEE Std 1003.1-2008); IEEE: Piscataway, NJ, USA, 2018; pp. 1–3951. [CrossRef]
- Pandas. Pandas-Python Data Analysis Library. 2023. Available online: https://pandas.pydata.org/docs/index.html (accessed on 16 May 2023).
- United States Geological Survey. EarthExplorer. 2025. Available online: https://earthexplorer.usgs.gov/ (accessed on 6 March 2025).
- tf.keras.layers.LSTM|TensorFlow v2.14.0. Available online: https://www.tensorflow.org/api_docs/python/tf/keras/layers/LSTM (accessed on 1 August 2023).
- Sherstinsky, A. Fundamentals of Recurrent Neural Network (RNN) and Long Short-Term Memory (LSTM) network. Phys. Nonlinear Phenom. 2020, 404, 132306. [Google Scholar] [CrossRef]
- Abadi, M.; Agarwal, A.; Barham, P.; Brevdo, E.; Chen, Z.; Citro, C.; Corrado, G.S.; Davis, A.; Dean, J.; Devin, M.; et al. TensorFlow: Large-Scale Machine Learning on Heterogeneous Systems. arXiv 2015, arXiv:1603.04467. [Google Scholar]
- Jain, L.C.; Medsker, L.R. Recurrent Neural Networks: Design and Applications, 1st ed.; CRC Press, Inc.: Boca Raton, FL, USA, 1999. [Google Scholar]
- Tyagi, A.K.; Abraham, A. (Eds.) Recurrent Neural Networks: Concepts and Applications, 1st ed.; CRC Press: Boca Raton, FL, USA, 2022; p. 412. [Google Scholar]
- Schmidt, R.M. Recurrent Neural Networks (RNNs): A gentle Introduction and Overview. arXiv 2019, arXiv:1912.05911. [Google Scholar]
- Katte, T. Recurrent neural network and its various architecture types. Int. J. Res. Sci. Innov. 2018, 5, 124–129. [Google Scholar]
- Mienye, I.D.; Swart, T.G.; Obaido, G. Recurrent Neural Networks: A Comprehensive Review of Architectures, Variants, and Applications. Information 2024, 15, 517. [Google Scholar] [CrossRef]
- Hsu, C.W.; Liu, C.; Liu, Z.; Mostafavi, A. Unraveling Extreme Weather Impacts on Air Transportation and Passenger Delays using Location-based Data. Data Sci. Transp. 2024, 6, 9. [Google Scholar] [CrossRef]
- Schultz, M.; Reitmann, S.; Alam, S. Predictive classification and understanding of weather impact on airport performance through machine learning. Transp. Res. Part Emerg. Technol. 2021, 131, 103119. [Google Scholar] [CrossRef]
- Wang, K.; Li, J.; Tian, Y. Airport Delay Prediction Method based on Improved Weather Impacted Traffic Index. In Proceedings of the 2019 IEEE 1st International Conference on Civil Aviation Safety and Information Technology (ICCASIT), Kunming, China, 17–19 October 2019; pp. 73–78. [Google Scholar] [CrossRef]
- Federal Aviation Administration. Unmanned Aircraft System Traffic Management (UTM), n.d. Available online: https://www.faa.gov/uas/advanced_operations/traffic_management (accessed on 6 February 2025).
Disclaimer/Publisher’s Note: The statements, opinions and data contained in all publications are solely those of the individual author(s) and contributor(s) and not of MDPI and/or the editor(s). MDPI and/or the editor(s) disclaim responsibility for any injury to people or property resulting from any ideas, methods, instructions or products referred to in the content. |
© 2025 by the authors. Licensee MDPI, Basel, Switzerland. This article is an open access article distributed under the terms and conditions of the Creative Commons Attribution (CC BY) license (https://creativecommons.org/licenses/by/4.0/).