1. Introduction
Unmanned aerial vehicles (UAVs) have made significant progress since their inception, driven by continuous technological innovations in navigation and networking technologies. Wireless relay systems are among the most promising applications of UAVs. Extensive simulations and experiments on UAV-based communications have been conducted [
1,
2,
3]. Among them, there are numerous studies on securing communication infrastructure during disasters by utilizing the mobility, flexibility, and pilotless flight capabilities of UAVs [
4,
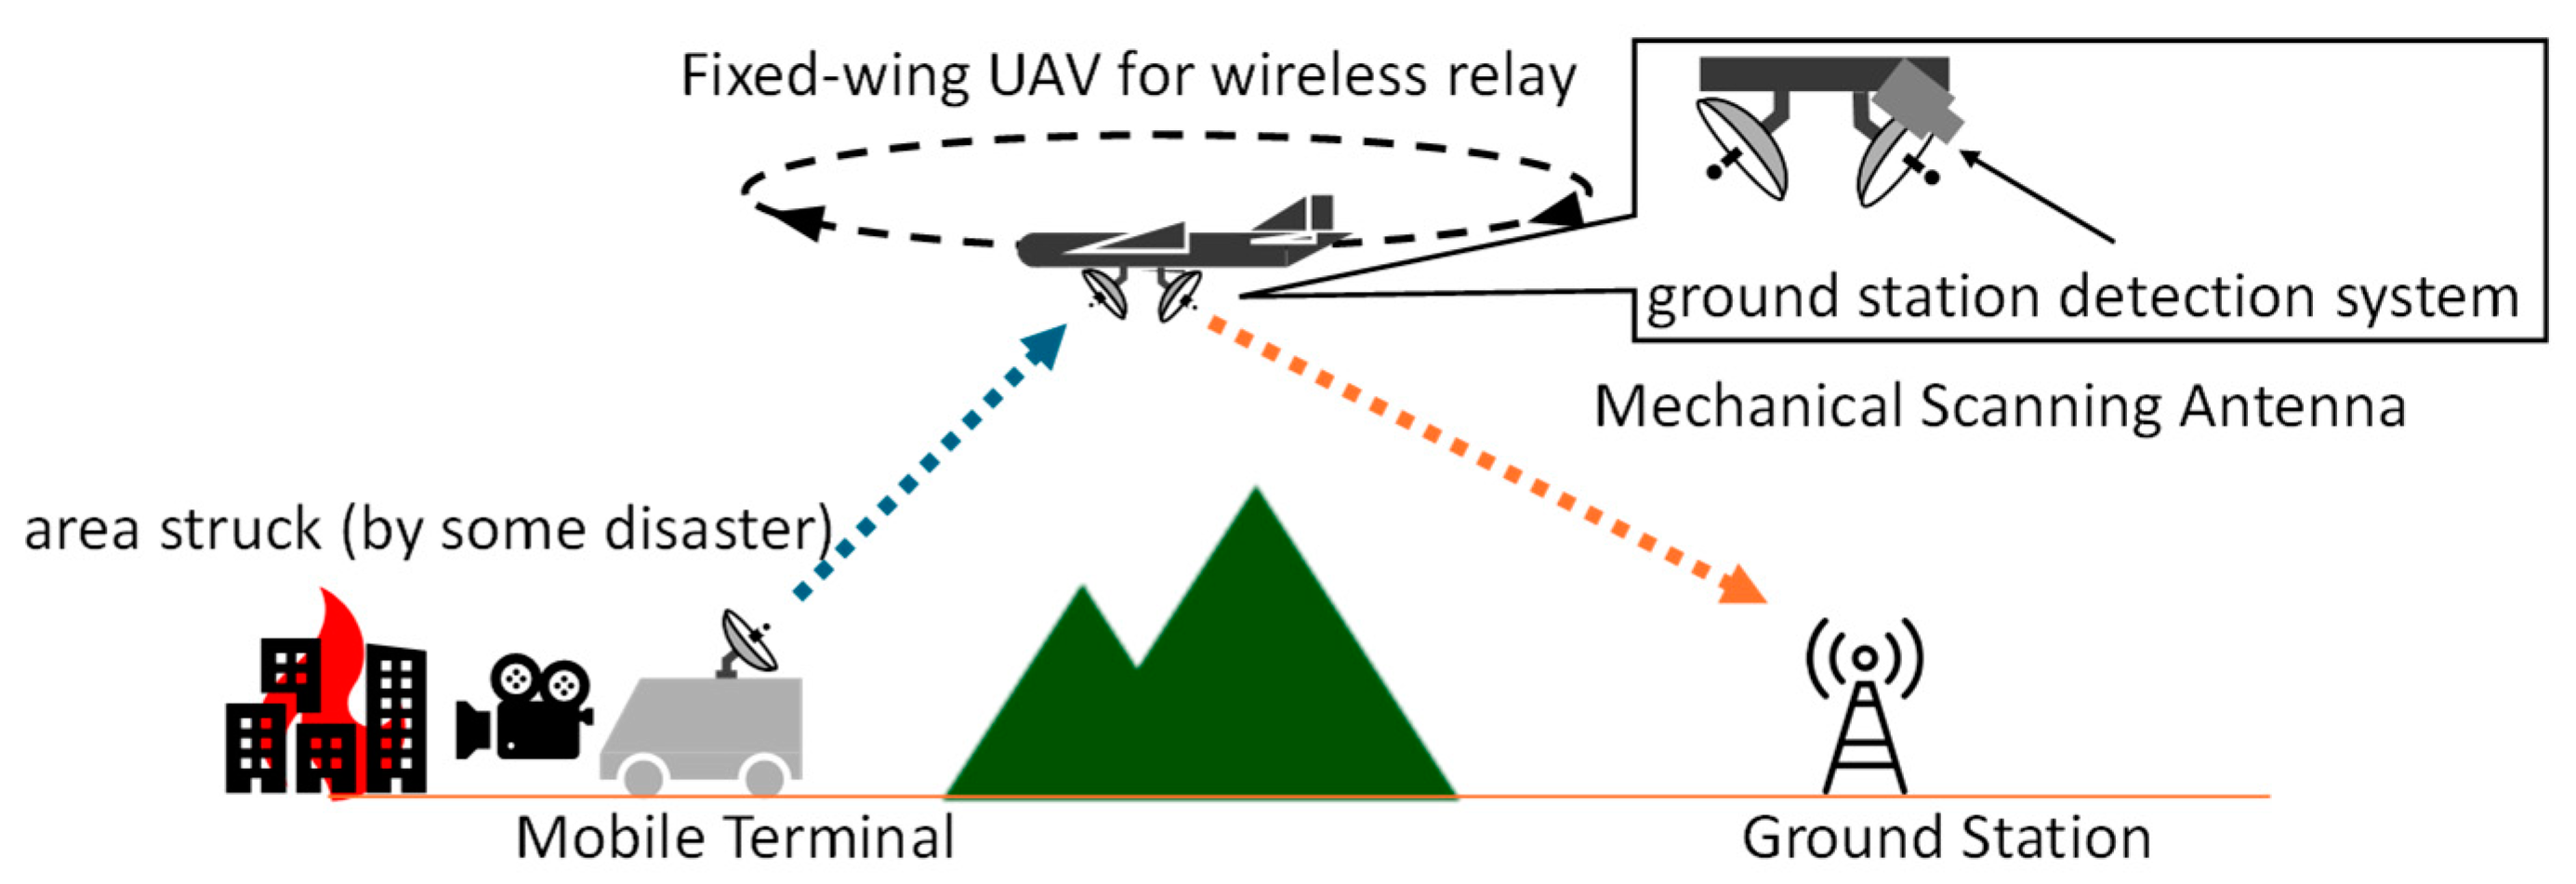
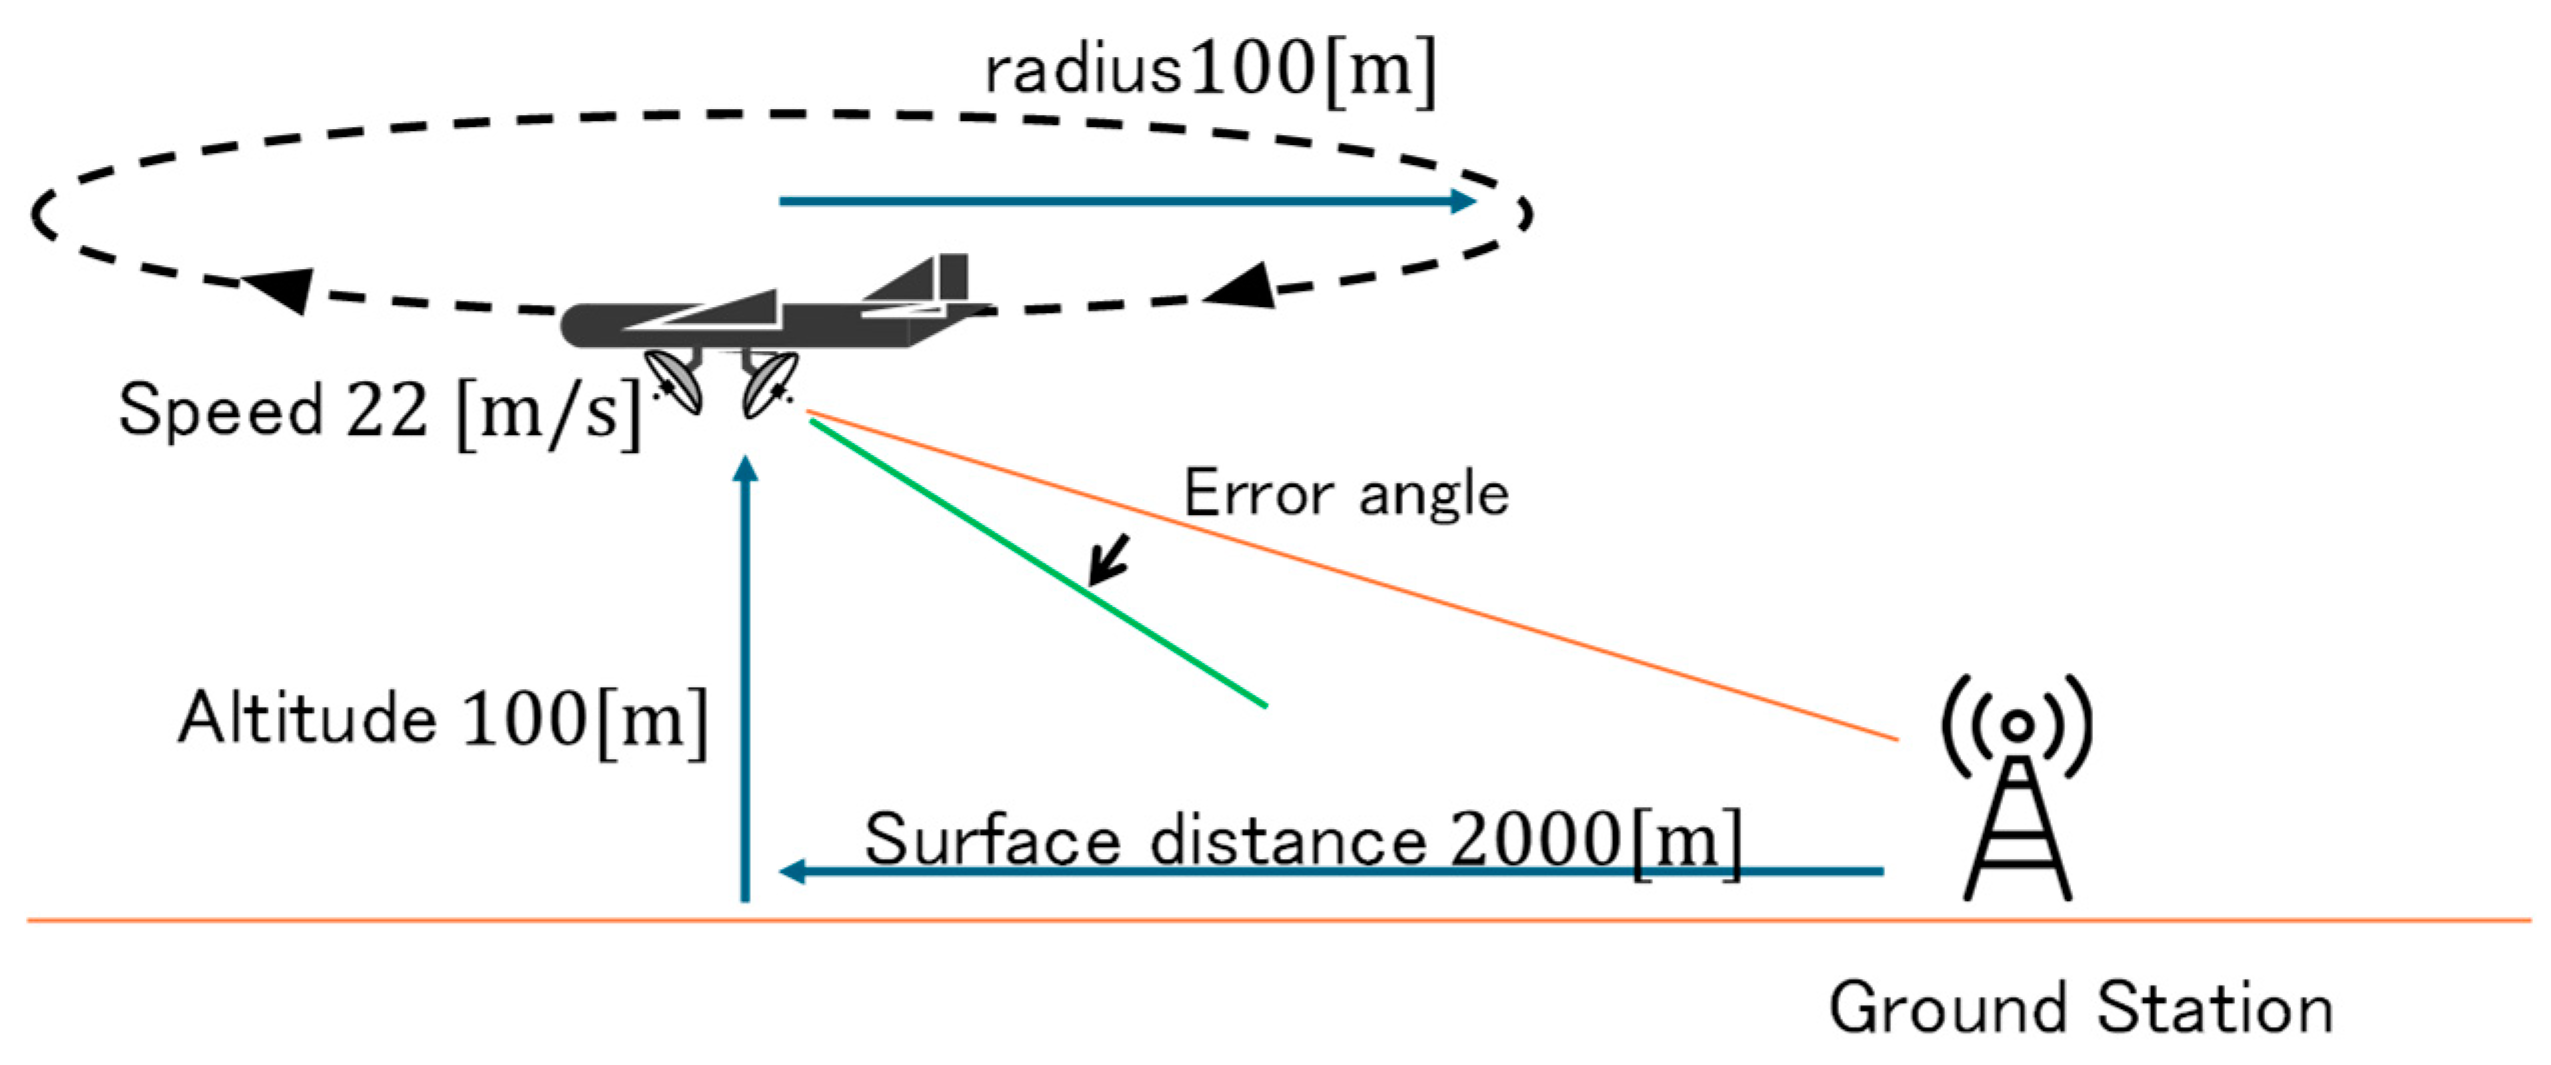
5]. The authors of the present paper also aim to use UAVs for video transmission during disasters. Specifically, we envision using a small fixed-wing UAV that remains airborne while circling, as shown in
Figure 1, as a wireless relay system for video transmission. The purpose of this system is to be deployed in disaster areas where network infrastructure has been disrupted in order to establish communication lines.
To link an antenna onboard the UAV with a ground station, it is imperative that the onboard antenna is accurately controlled to point toward the direction of the ground station. To achieve this, a highly accurate control system must be configured. Accordingly, the control system requires a direction detection system for the ground station, which is necessary to measure the deviation in the antenna angles from the ground station direction and provide feedback to the control system.
For a ground station direction detection system, the authors consider an approach to detect the direction of ground stations using image data obtained from cameras mounted on small fixed-wing UAVs. The most reliable method for detecting ground stations from image data is to place a distinctive marker on the ground station. Through the accurate recognition of the marker and detection of its position, the direction of the ground station can be determined with high precision. Furthermore, when operating a wireless relay system, the marker needs to be placed only on the ground station, which offers the advantage of not impairing the flexibility of the UAV. On the other hand, the detection performance of markers is highly dependent on the operating environment. Two factors can affect marker detection performance: first, the resolution of the marker, which can hinder detection due to the smaller size of the marker and the reduced number of pixels representing it at a distance; and second, motion blur, which occurs when a UAV is in flight and its posture is constantly changing. This motion blur distorts the markers, which can interfere with marker detection.
There are also methods for detecting the direction of ground stations without using markers or cameras. One example is a radio frequency (RF) sensor that directs the antenna of a geostationary communications satellite toward the ground station [
6]. Since RF sensors only need to detect beacon signals, they can detect ground stations relatively easily, even from flying UAVs. However, because RF sensors are composed of multiple power feed systems, high-precision RF sensors are heavy and consume significant amounts of power. Furthermore, a beacon transmitter must be installed at the ground station for the RF sensor to detect its direction, which reduces the flexibility of UAV operations.
Considering the trade-offs of each approach, the increase in weight and power consumption associated with the higher accuracy of RF sensors presents a major disadvantage for small flight systems. Therefore, as part of a wireless relay system for small UAVs, it is essential to develop a sensor system that detects the direction of the ground station using a camera and a marker, while being resilient to the effects of the operating environment. A key factor is the marker detection method’s ability to tolerate the influences of the operating environment. The sensor must meet the following three performance requirements:
Detection of low-resolution, long-range markers;
Accuracy of marker detection;
Robust marker detection against motion blur.
Among these, the accuracy of detecting the direction angle toward the ground station is the most important for a highly accurate antenna control system. Moreover, motion blur, which is proportional to the angular velocity generated by the UAV’s motion, occurs in the acquired image. This motion blur can interfere with marker detection.
Conventionally, an Augmented reality (AR) marker is used in position detection. The detection of AR markers is carried out by using the contour information inherent to the shape of the marker. However, for a wireless relay system in a UAV operating environment, contour information may degrade due to low resolution and motion blur, leading to poor detection performance. Therefore, a method for marker detection that does not rely on contour shape is necessary.
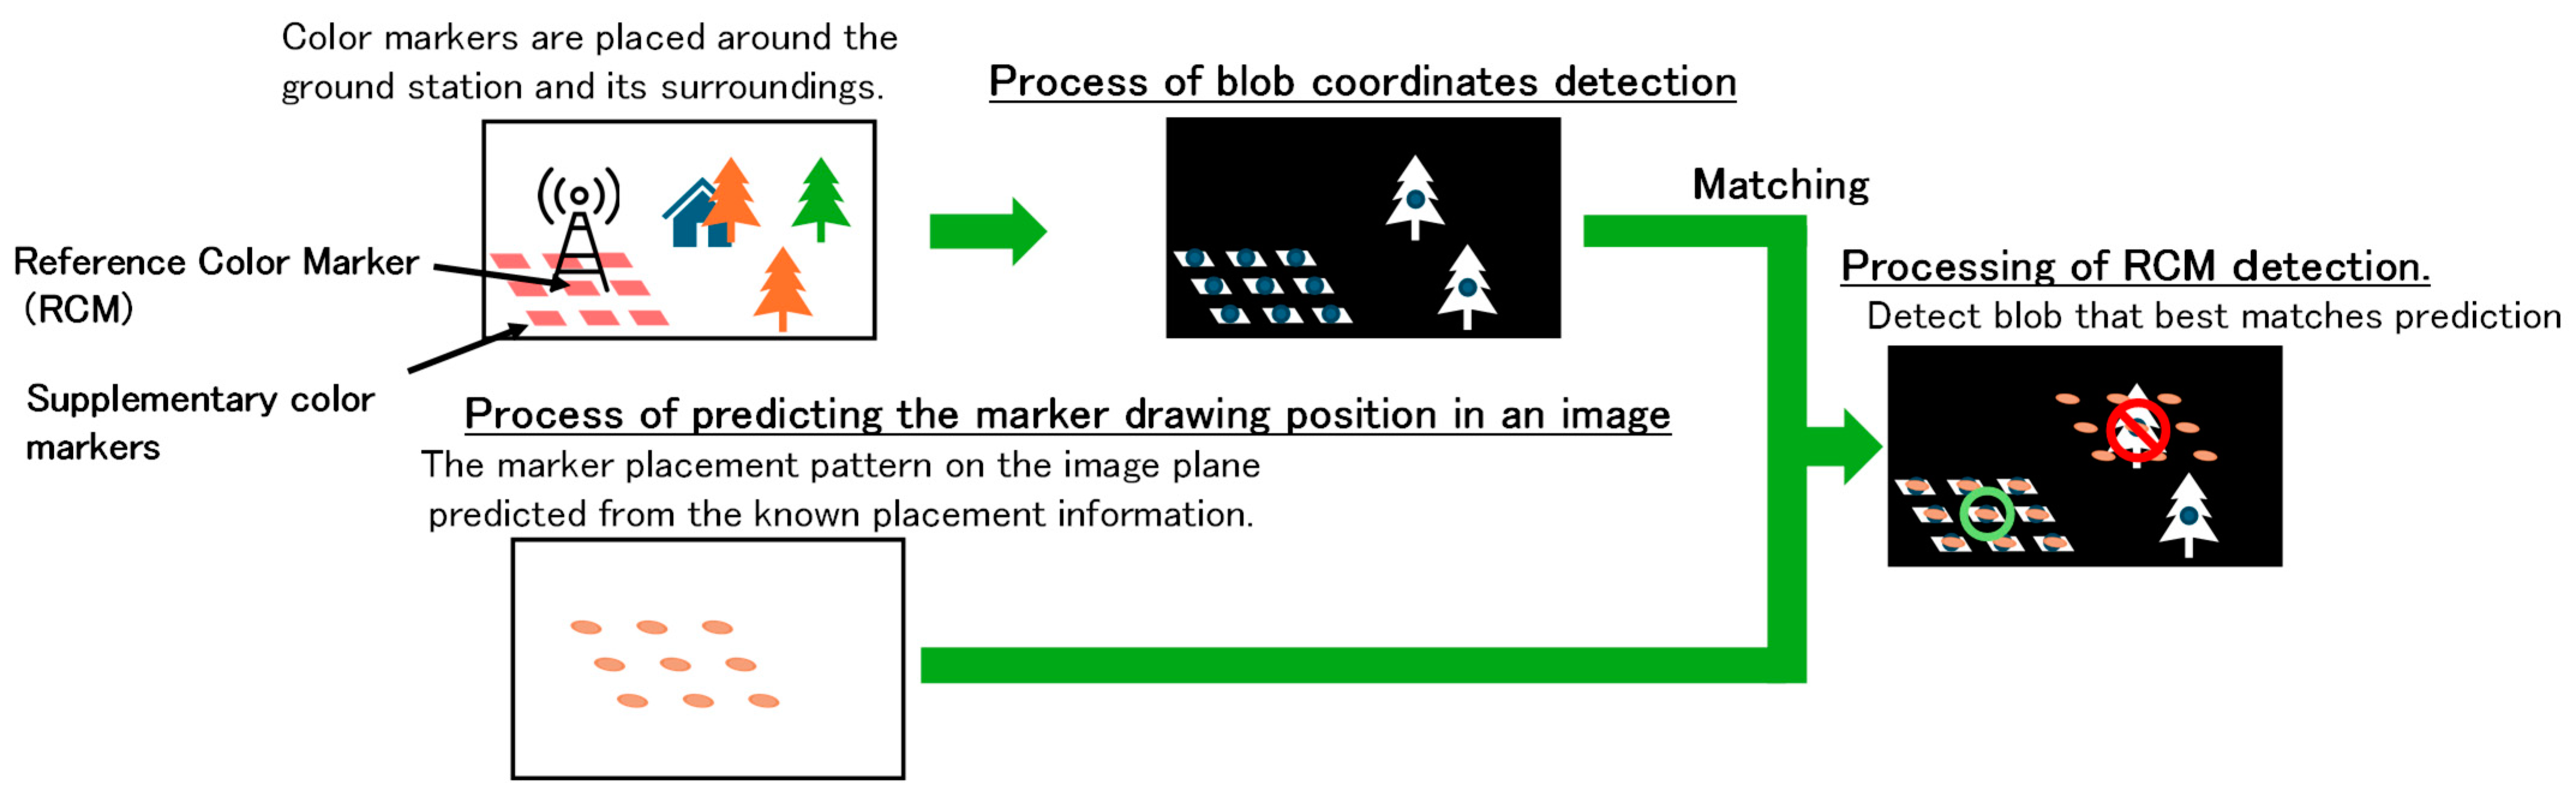
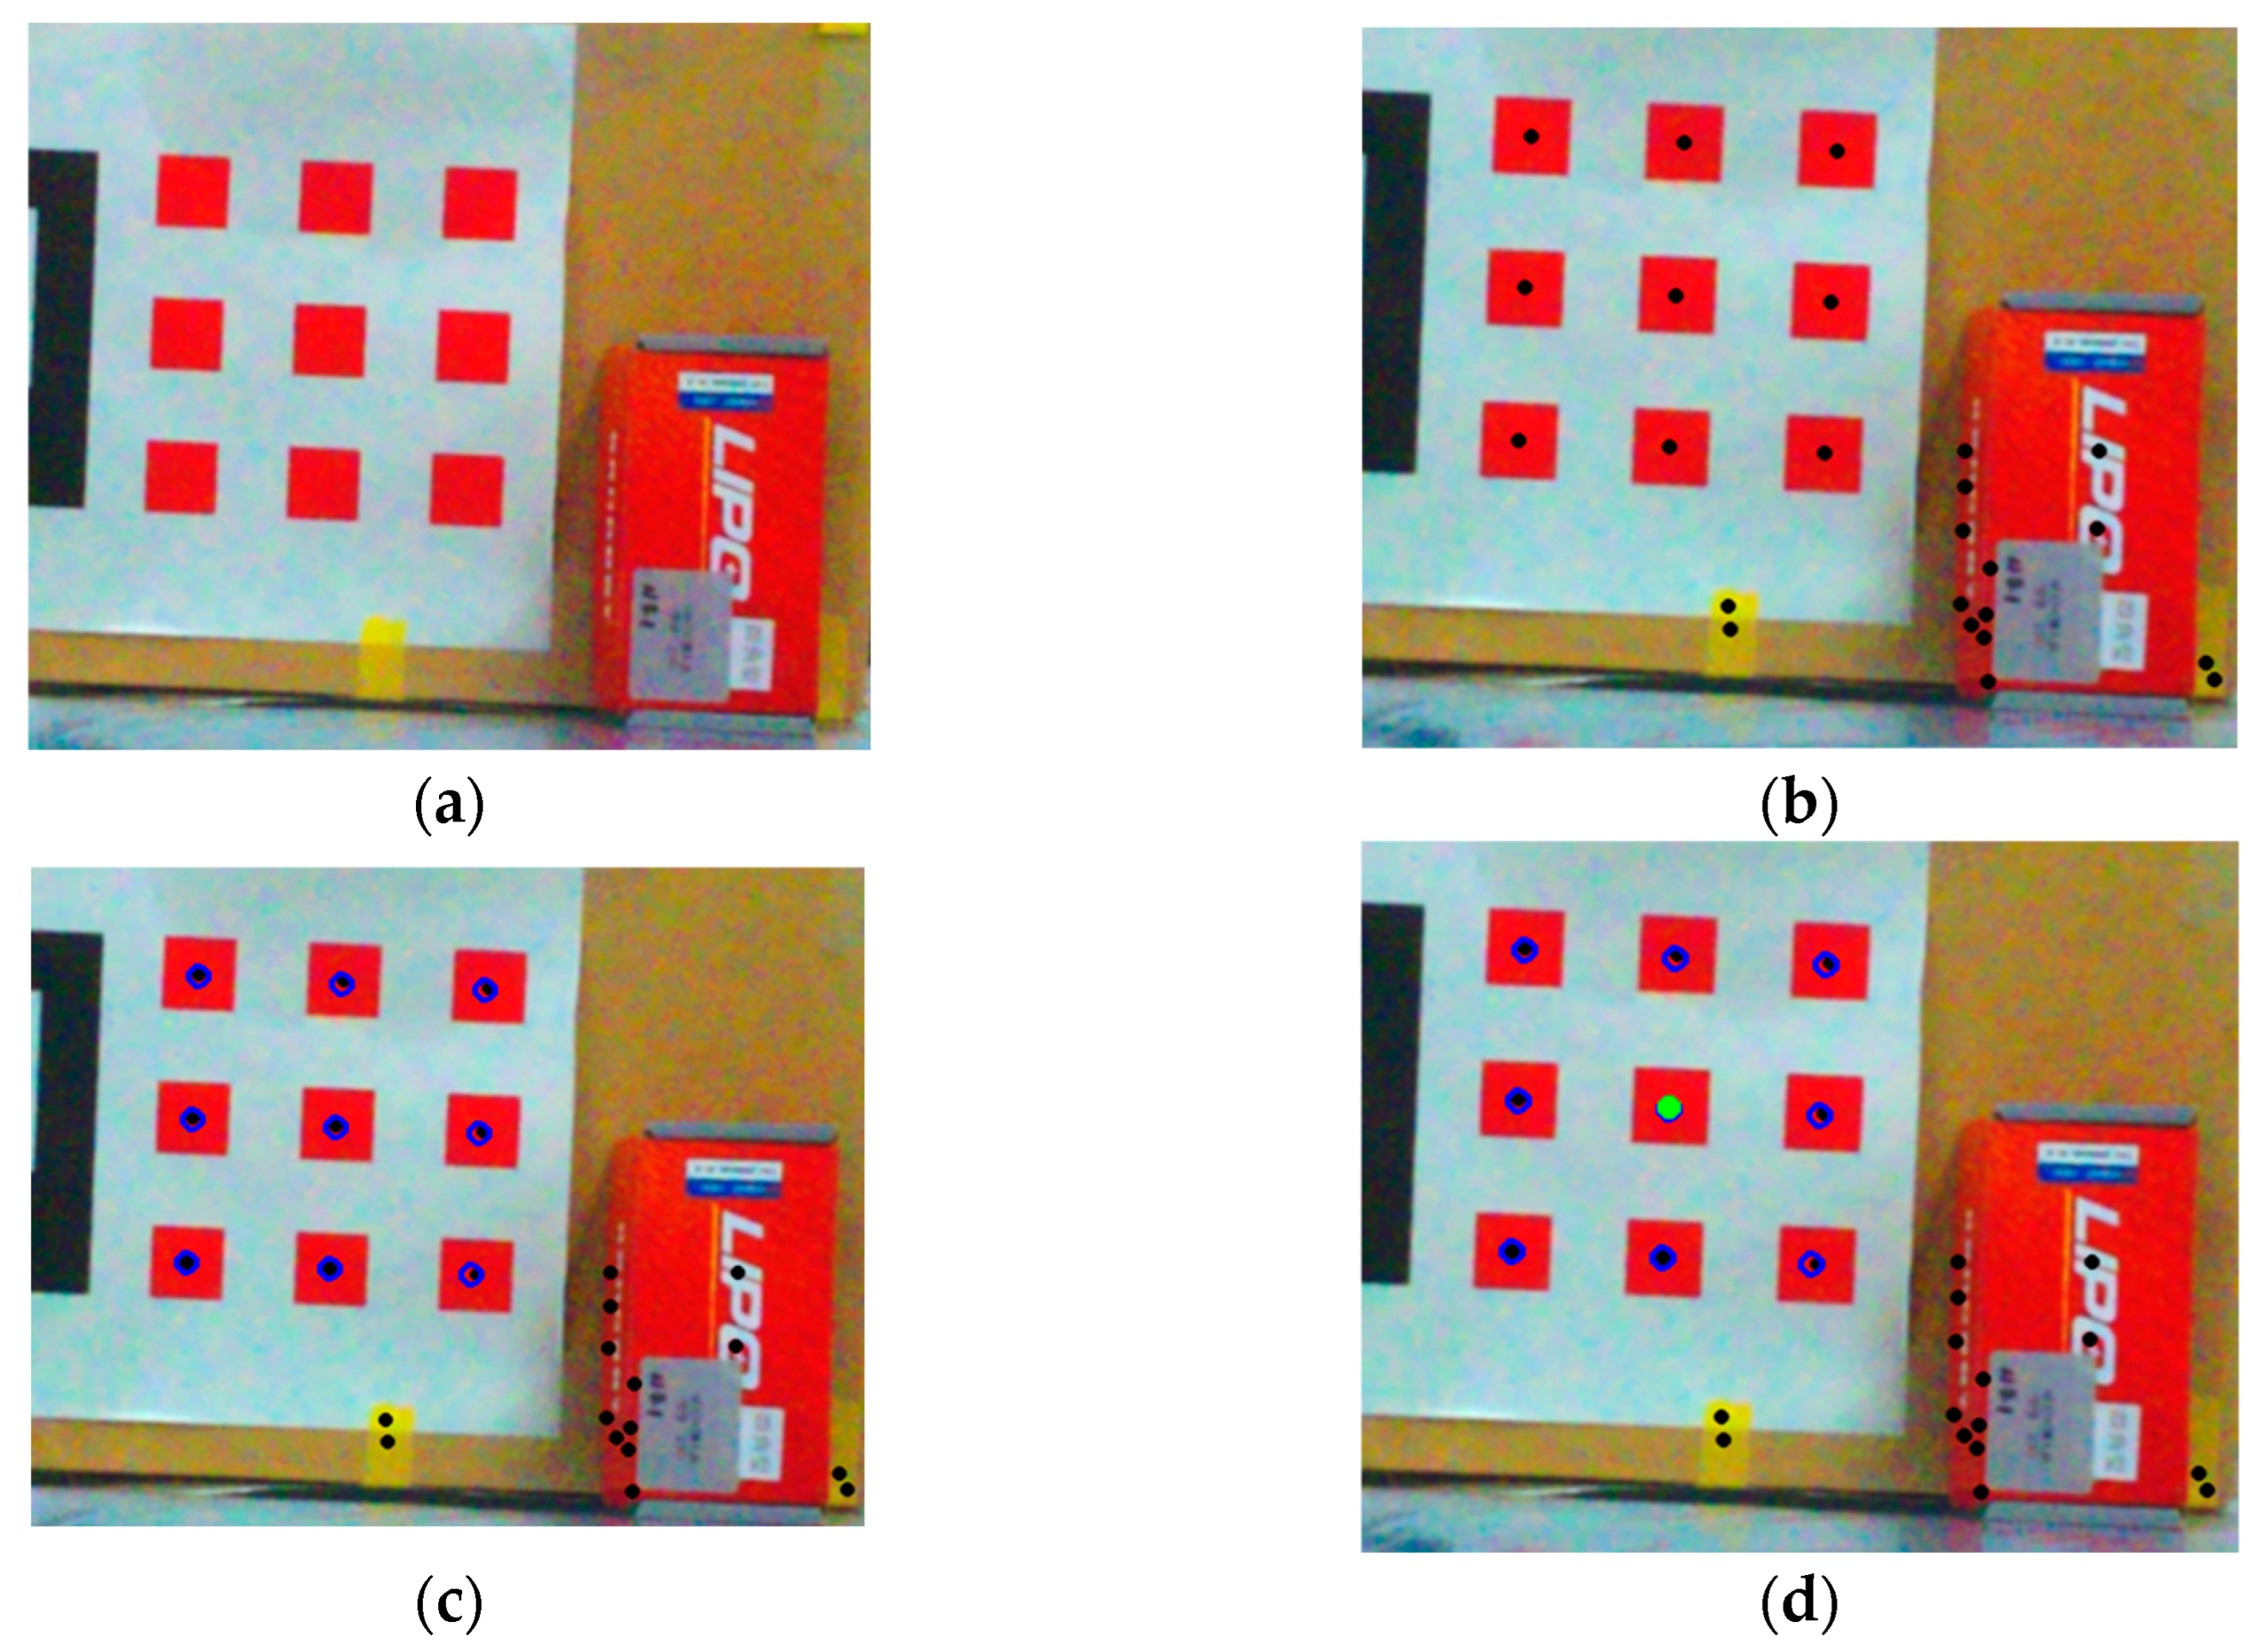
We have adopted color markers that utilize color information as a marker and avoid the use of contour information. The rationale behind this approach is that the degradation of color information is minimal in motion blur and low-resolution markers. However, color information alone is not enough to distinguish markers from objects or noise that has similar colors to those of the markers. For example, if a red color marker is used, color information alone would not be sufficient to distinguish the marker from a leaf of the same red color. To solve this issue, we propose a new method to detect only multiple color markers using two types of information: the predicted multiple color marker placement information and the color information. Based on the methods presented above, this study presents an image processing-based direction detection sensor that can be applied in a small fixed-wing UAV.
This paper is configured as follows:
Section 2 gives a brief overview of conventional direction detection technologies, which have been or can be applied to ground station direction detection.
Section 3 describes the proposed method in detail, and
Section 4 presents the performance requirements of the proposed method.
Section 5 presents the experimental results and analysis, and finally,
Section 6 concludes with discussing the validity of the proposed method.
2. Conventional Direction Detection Technology
There are many direction detection technologies, and some of them can be applied to wireless relay systems, albeit with some issues. As for the direction detection of ground stations, there are two methods: one without markers and the other with markers.
2.1. Non-Marker-Based Approaches
Non-marker-based approaches frequently utilize the strength of the signal transmitted from the ground station as a means of detecting the direction of the ground station. Though these have been highly reliable, they require heavier equipment for more accurate detection and a corresponding signal transmitter on the ground station side.
The most straightforward method for detecting signals from a ground station is through signal detection [
7]. The process of signal detection utilizes the Automatic Gain Control (AGC) signal of a digital receiving tuner, with the objective of measuring the strength of the signal received by the antenna.
Radio frequency (RF) sensors quantify the angular deviation between the direction of the beacon wave transmitted from a ground station and the sensor’s main axis. RF sensors are primarily employed for antenna control in satellite communications [
7]. RF sensors comprising multiple power feed systems determine the direction of the beacon wave by calculating the difference in the received power for each feed system. Consequently, high-precision RF sensors cause an increase in weight and therefore cannot be equipped on a small fixed-wing UAVs.
The approach that uses signal strength to detect the ground station direction requires a device that transmits signals to the ground station. The installation of such a signal transmitter affects the cost of building a radio relay system and may cause operational feasibility problems. In addition, the installation of signal transmitters that require power may compromise the independence of the video transmission system using small fixed-wing UAVs. In particular, the signal transmitter may not function in certain environments, such as during disasters. In addition, this approach carries the risk of signal interference. Especially in congested wireless environments, such as urban areas, the accuracy of signal detection may be compromised by surrounding wireless systems. Given these concerns, the non-marker-based approach risks compromising the operational flexibility of small fixed-wing UAVs.
2.2. Marker-Based Approaches
A marker-based approach detects the direction of a ground station indirectly, wherein markers are placed on the ground stations. There are two methods for marker detection: one using contour information and the other using other methods.
An AR marker is detected by acquiring contour information through image processing. AR markers cause lower error detection because of the use of contour information, and the position of a marker can be determined more precisely. For instance, an ArUco marker relies on the thresholding of image contours and polygon extraction to detect markers from input images. Conversely, if the contours are blurred due to low resolution or motion, the performance of marker detection is significantly degraded. In fact, it has been observed that the detection performance of normal ArUco markers degrades as motion blur increases in intensity [
8]. A number of studies address this issue. For instance, a method for detecting markers that are not identified due to motion blur has been proposed using deep learning (DL) [
9]. DL is a machine learning technique employed for object detection in the field of image processing. Another approach utilizes circular markers for the detection of unclear marker images in underwater environments [
10].
Given that AR markers are detected and tracked as objects within an image rather than as markers, the technique of object tracking, which is an image processing method for monitoring specific objects in a degraded image, can be employed. This work concerns the tracking of moving objects, such as cars, in an image. One example of object tracking is optical flow, which can estimate the vector of movement of an object, such as a marker. Indeed, Daniel D. Doyle et al. demonstrated that a camera attached to a two-axis gimbal can track a small UAV using optical flow [
11].
5. Experiments
To confirm the validity of the proposed method and evaluate whether it meets the target performance, experiments corresponding to following three target criteria were conducted: (1) the minimum marker size, (2) the marker detection accuracy, and (3) the maximum motion blur.
5.1. Configuration of Experimental System
Table 3 enumerates the apparatus utilized in the experiment. A Raspberry Pi 4B (manufacturer: Raspberry Pi Ltd., Cambridge, UK) was employed as the computing device for image processing and the calculation of RCM orientation. The camera used to capture images was a V2 Camera Module with a 62.2 × 48.8 [deg.] field of view and a focal length of 3.04 [mm].
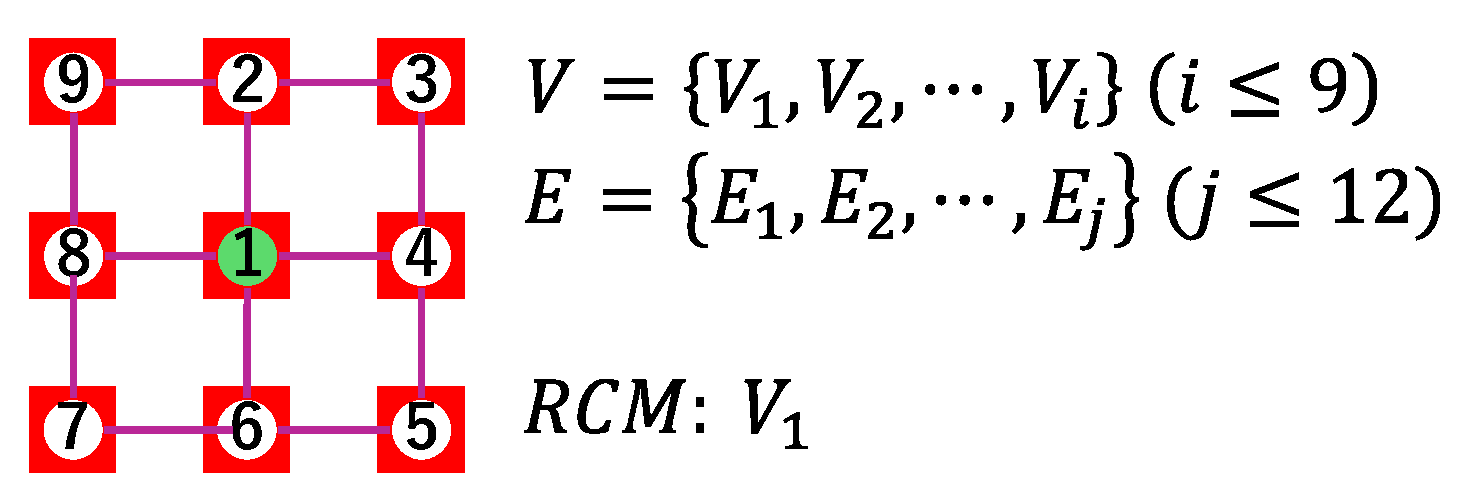
The color markers utilized in the experiment were arranged according to the pattern depicted in
Figure 4. Each marker was a square with a side length of 26 mm, and each marker was positioned at a distance of 26 mm from its neighbor. The camera attitude angle and camera coordinates required for the proposed method were estimated using the AR markers. There are two reasons for this. Firstly, GPS signals did not reach the room. Secondly, the position error of the inertial navigation system was 3σ = ±3 m, which was too large compared to the scale of the room. In this experiment, we used ArUco markers [
14], a type of AR marker, to estimate the camera posture.
In the experiments conducted to evaluate the marker detection accuracy of the proposed method and the maximum motion blur that the proposed method could detect, a high-precision rotary table was employed to provide the angles at which markers were detected or the angular velocity to the camera. The high-precision rotary table was a table that could measure the driving angle accumulated from the startup time and could rotate at any angular velocity.
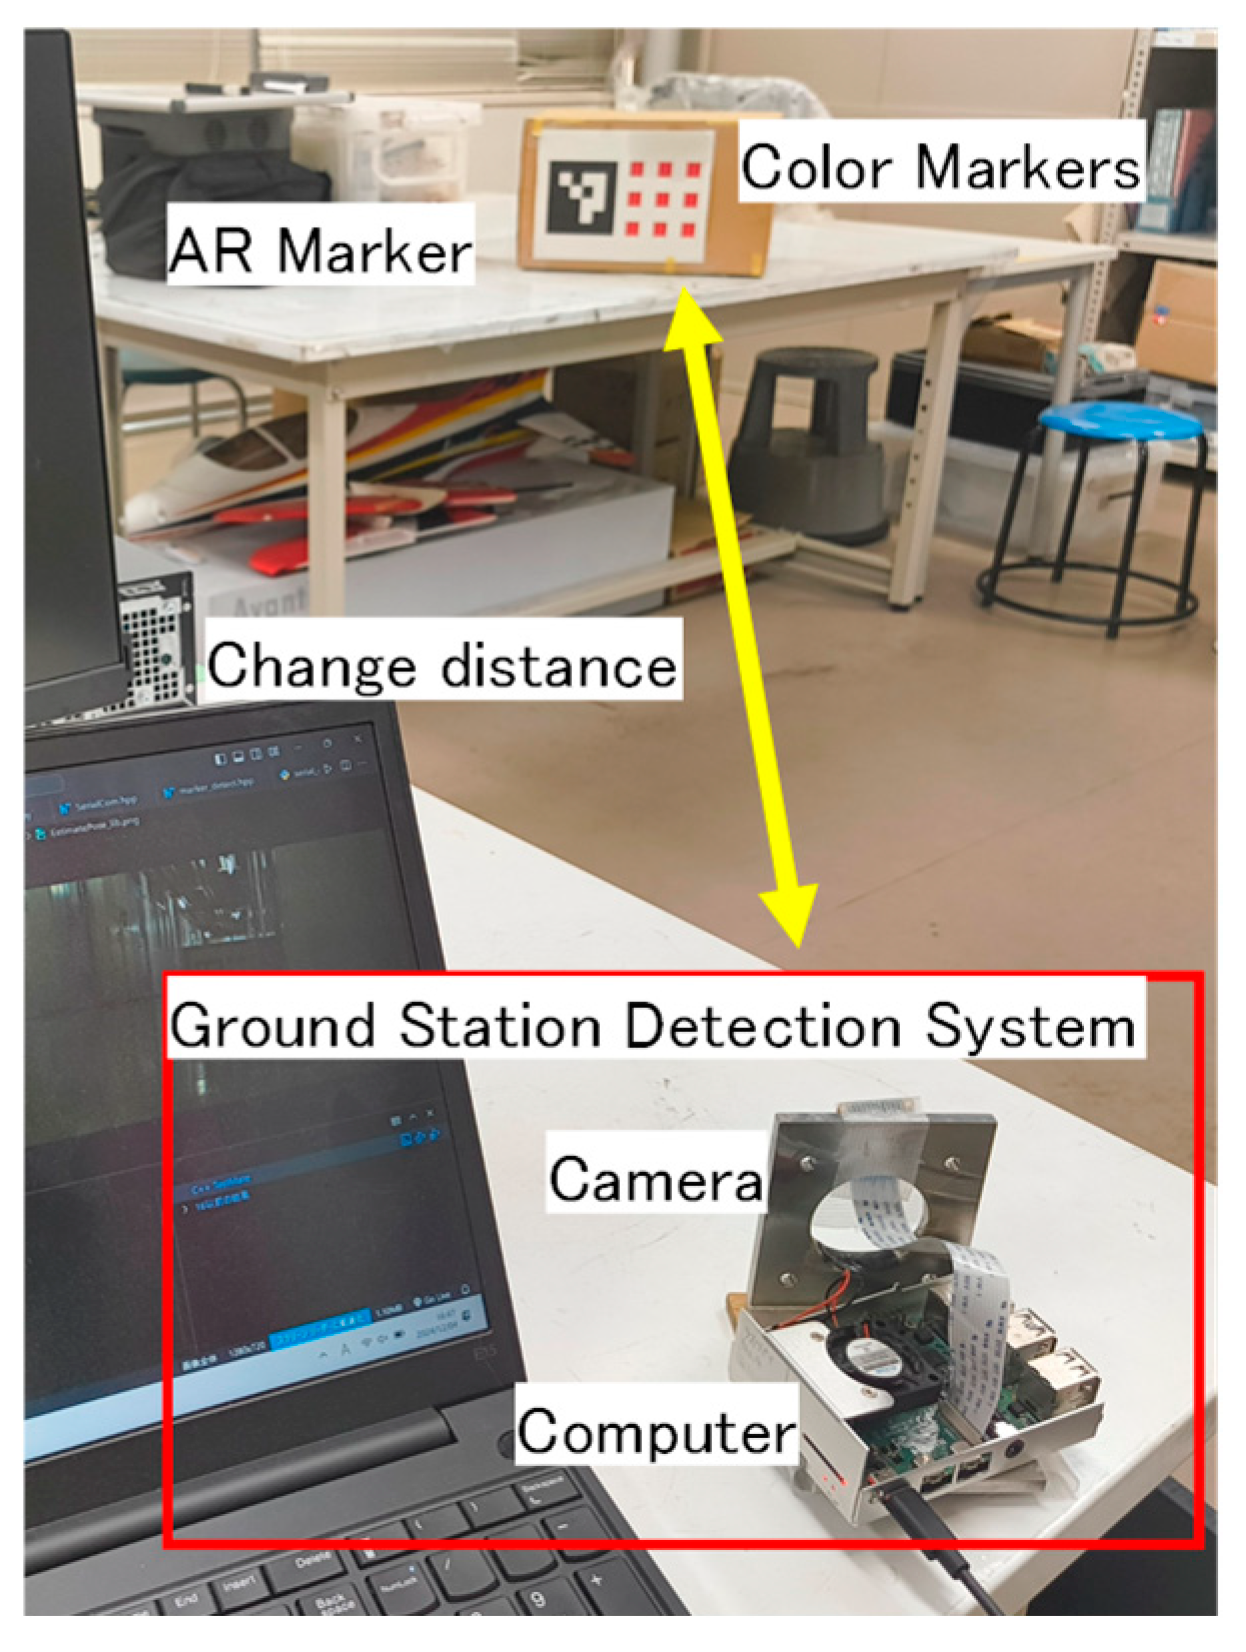
5.2. Experiment to Evaluate Minimum Detectable Marker Size
Experiments were conducted to evaluate the detection performance of the RCM for small, low-resolution markers in images. In the experiment, the image size of the color markers was varied by changing the distance between the camera and the color markers. RCM detection was performed 100 times for each image size, and the detection rate was measured. The experimental system is depicted in
Figure 10.
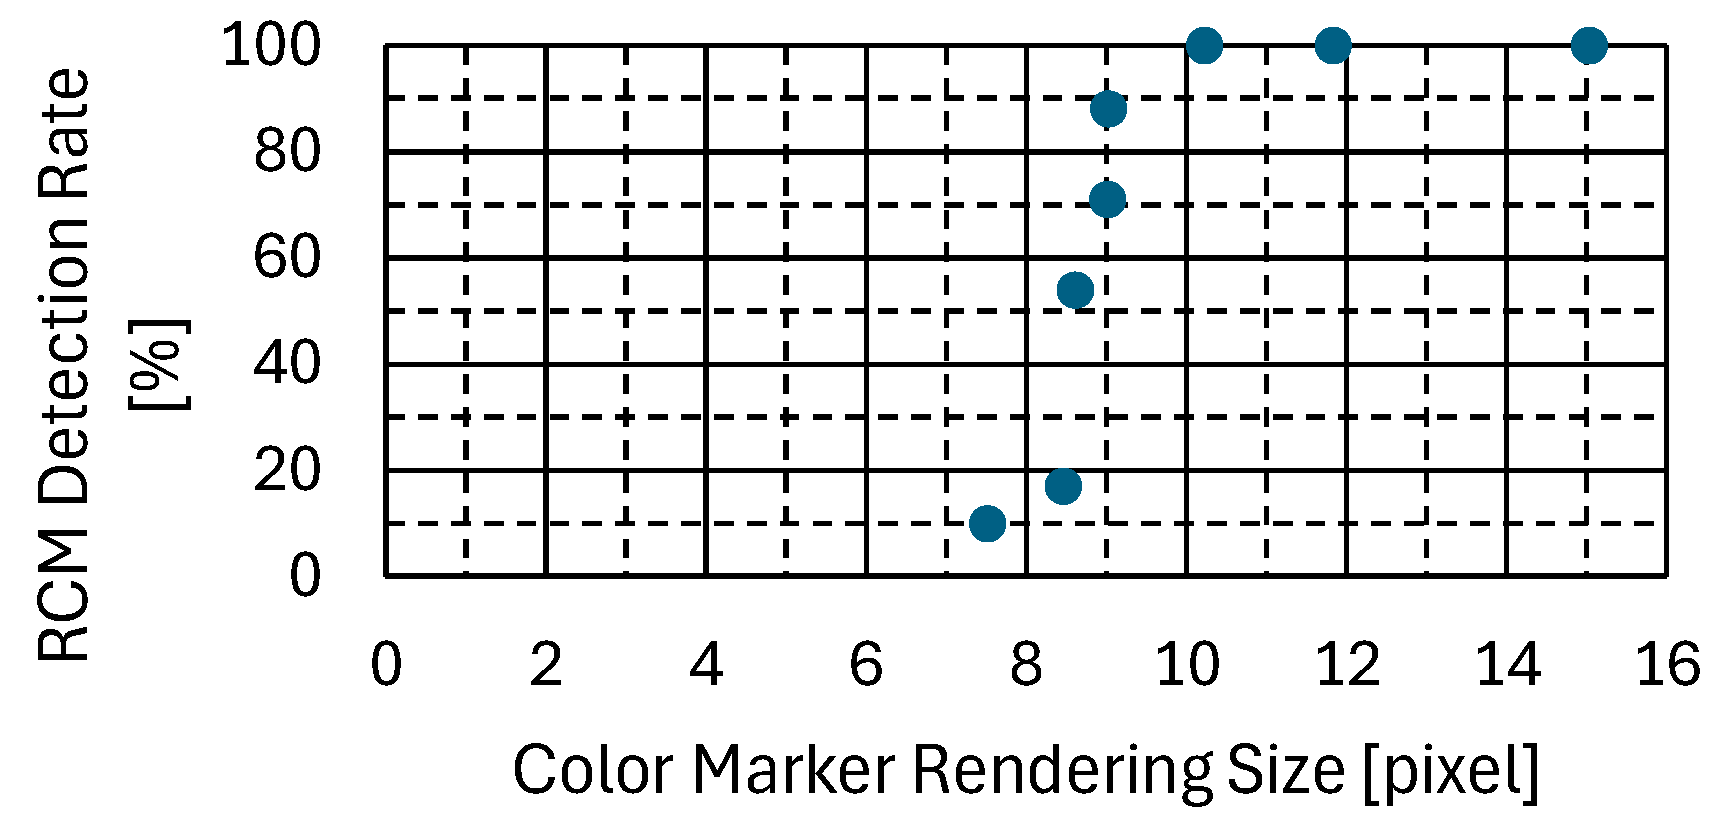
Figure 11 illustrates the proportion of RCMs identified by the proposed methodology for each color marker rendering size, thereby confirming that the detection rate of the proposed methodology declines markedly for markers smaller than 10.2 pixels.
Additional experiments were conducted to verify the effect of inaccuracies in attitude estimation with the ArUco markers used in the experiments on the proposed method. The experimental setup and configuration were the same as in
Figure 10, but RCM detection was performed with noise added to the AR marker attitude estimation results. The noise was based on the value from the inertial navigation system, and an error of ±0.5 degrees with respect to the attitude angle and ±40 mm with respect to the spatial coordinate system was added. The results of the additional experiment are shown in
Figure 12.
Figure 12 shows that the minimum detectable marker size remained unchanged at about 10 pixels in the additional experiment. In other words, it was confirmed that deviation in the attitude angle used in RCM detection can be tolerated to some extent. As demonstrated in
Table 2, the requisite detection performance of the proposed methodology for low resolution is less than 14.5 pixels. Consequently, the proposed methodology is capable of attaining the necessary performance.
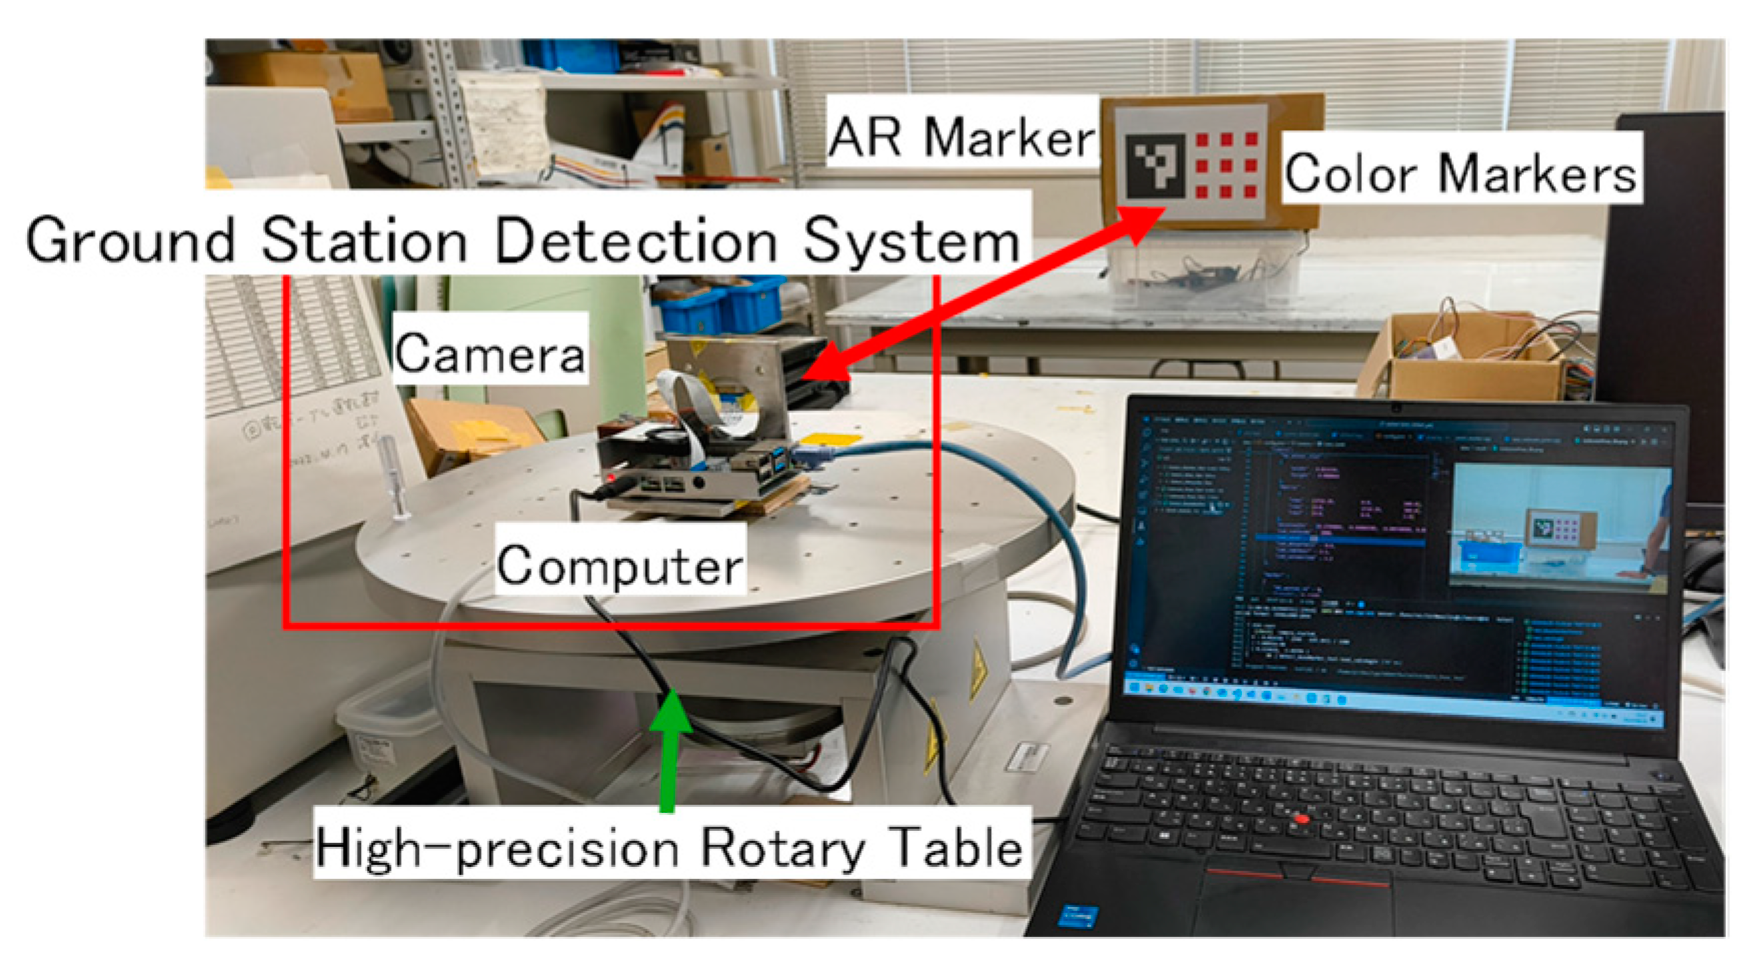
5.3. Experiments to Evaluate Marker Detection Accuracy
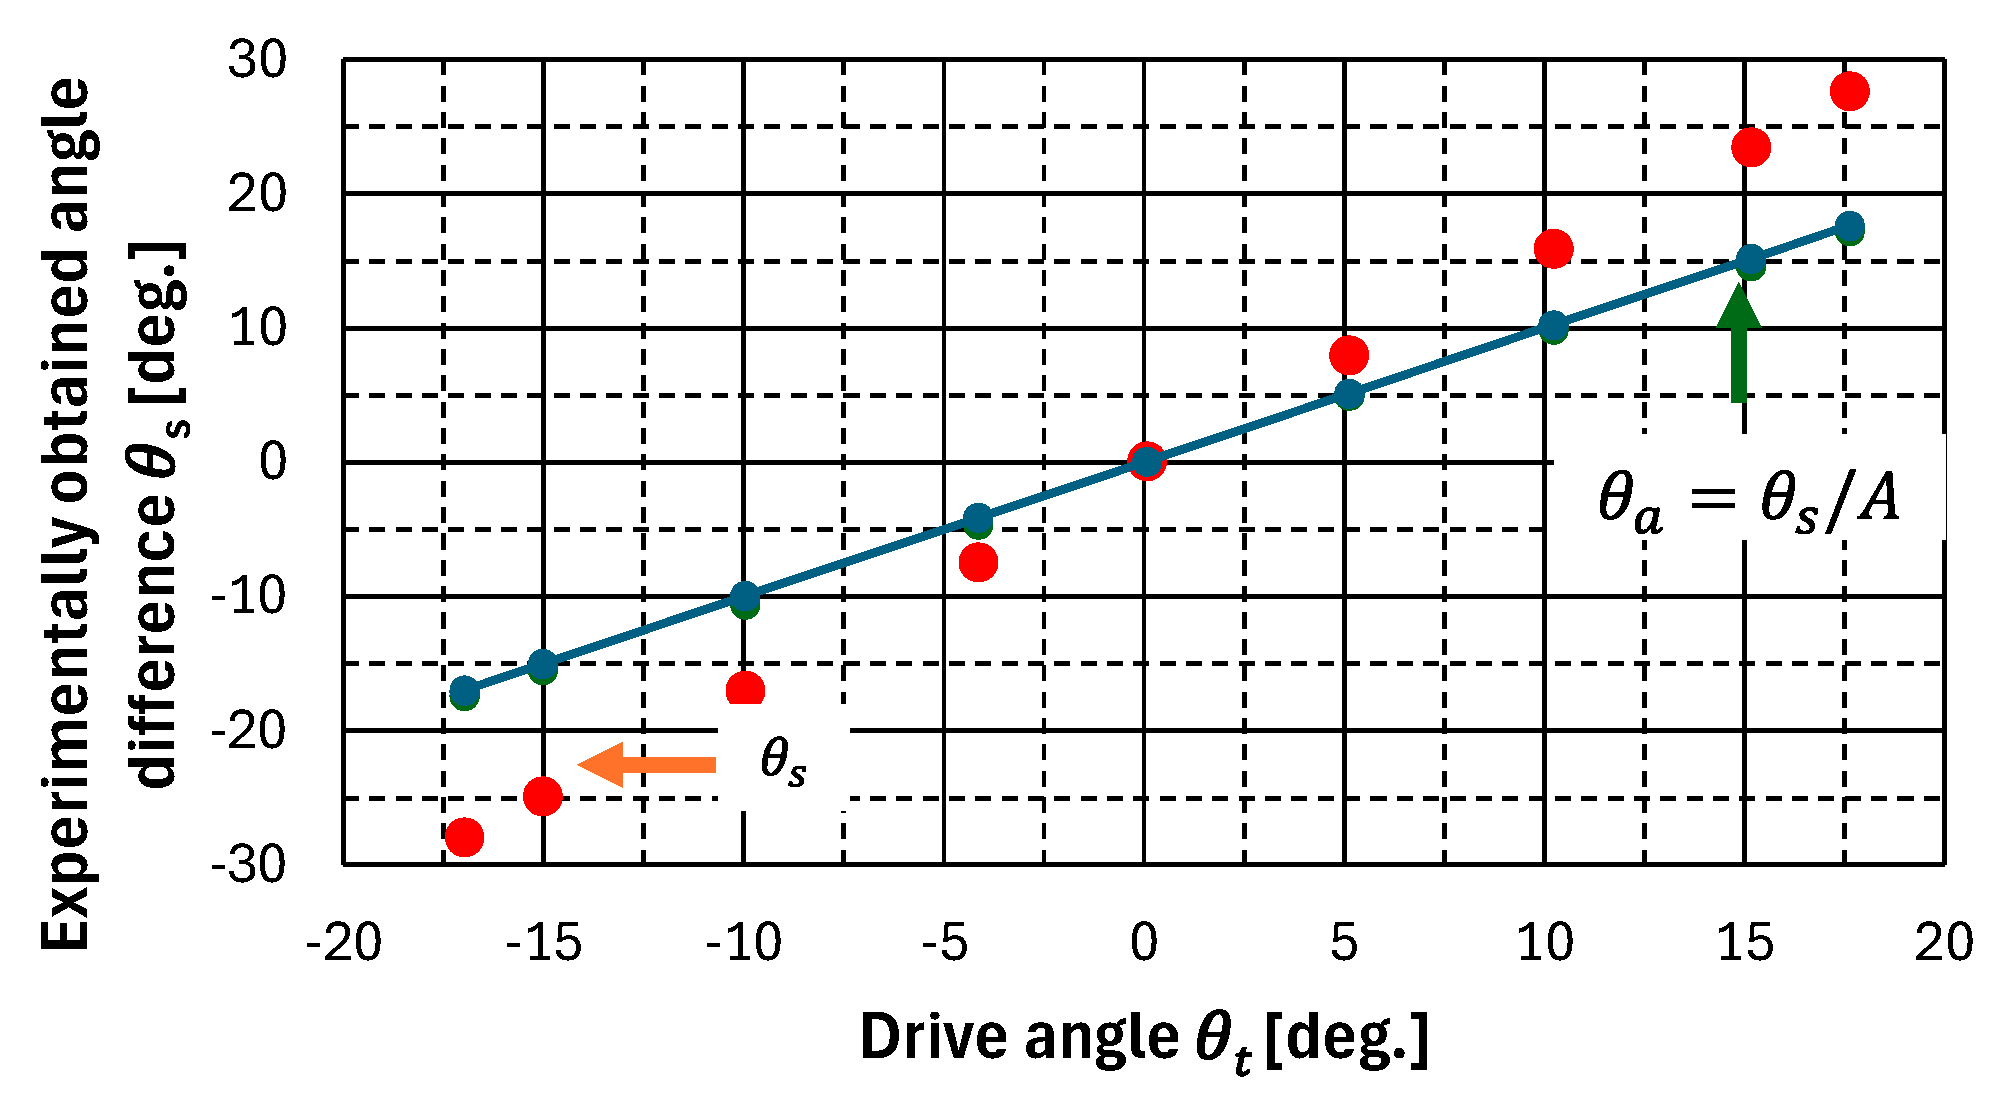
The objective of this evaluation was to ascertain whether the proposed method was capable of detecting the RCM and whether the accuracy of the RCM direction calculated from the RCM coordinates met the requisite performance standards. In the experiment, the ground station detection system was installed in such a way that the RCM was centered within the image. Furthermore, the ground station detection system was rotated using a high-precision rotary table that was capable of measuring the rotation angle. The discrepancy between the initial detection angle of the experimental system and the angle obtained after high-precision rotary table operation, denoted as
, was compared with the drive angle of the high-precision rotary table,
. The experimental system is illustrated in
Figure 13.
The relationship between the angle
obtained from the ground station detection system and the drive angle
measured from the high-precision rotary table is shown by the red marker in
Figure 14. The experimentally obtained angle
is considered to have a scale factor added to the actual drive angle
. Therefore, to obtain higher detection accuracy, it was corrected using Equation (12).
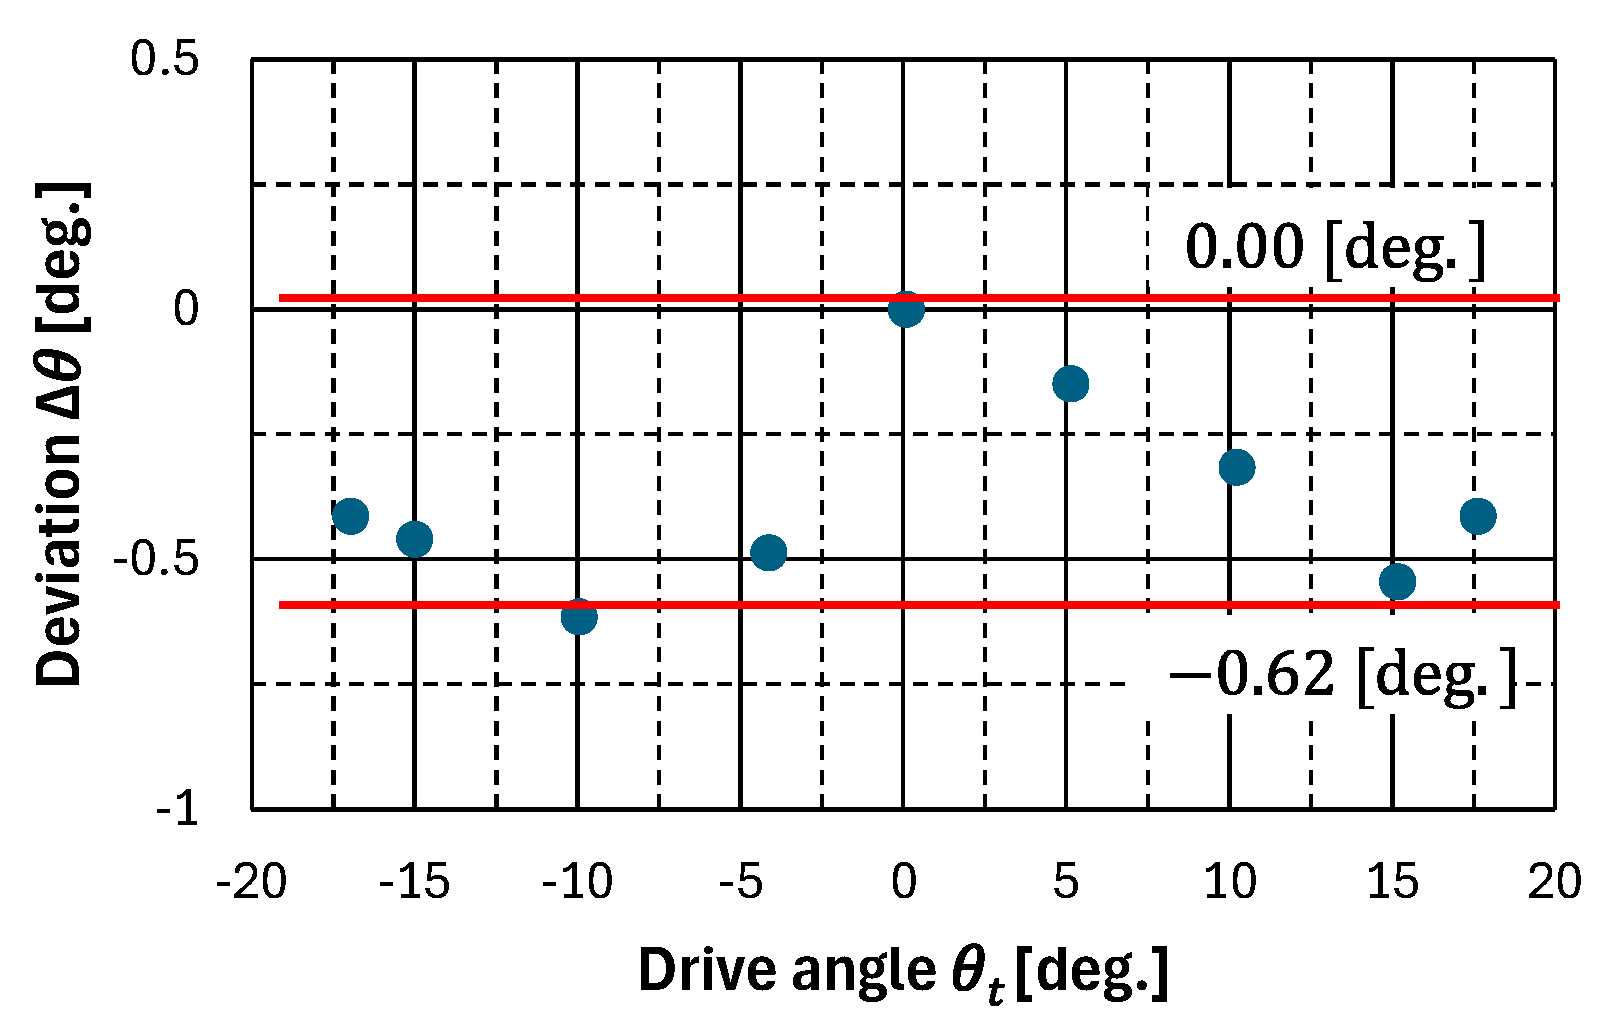
The deviation
between the corrected detection angle
and the drive angle
is shown in
Figure 15. The measurement error of the ground station detection system in the experimental system was 0.62 [deg.]. However, the field-of-view angle of 26.5 [deg.] of the camera used in the experiment is different from that of 5.1 [deg.] of the camera used to calculate the target performance. Therefore, to compare the target performance with the experimental results, the scales were adjusted using Equation (13).
As shown in Equation (13), the proposed method had a marker direction detection accuracy of 0.12 [deg.]. The proposed method was required to have an accuracy better than 0.14 [deg.]. Therefore, the proposed method met the required performance standard.
5.4. Experiment to Evaluate Maximum Detectable Motion Blur
The objective is to ascertain whether RCM can be discerned in a compact fixed-wing UAV that is traversing the atmosphere under the influence of anticipated motion blur. As previously outlined in
Section 4.3, the degree of motion blur increased in proportion to the angular velocity imparted to the camera. In the course of our experiments, we utilized a high-precision rotary table that was capable of maintaining a constant angular velocity to simulate the angular velocity exerted by a small fixed-wing UAV on a ground station detection system. The ground station detection system was positioned on the high-precision rotary table. The maximum angular velocity at which the ground station detection system was unable to detect the RCM was determined, and the marker detection performance in the presence of motion blur was evaluated using Equation (9). The experimental system is illustrated in
Figure 16. The color markers were installed with a drawing size of 15 pixels, taking the operating environment into account.
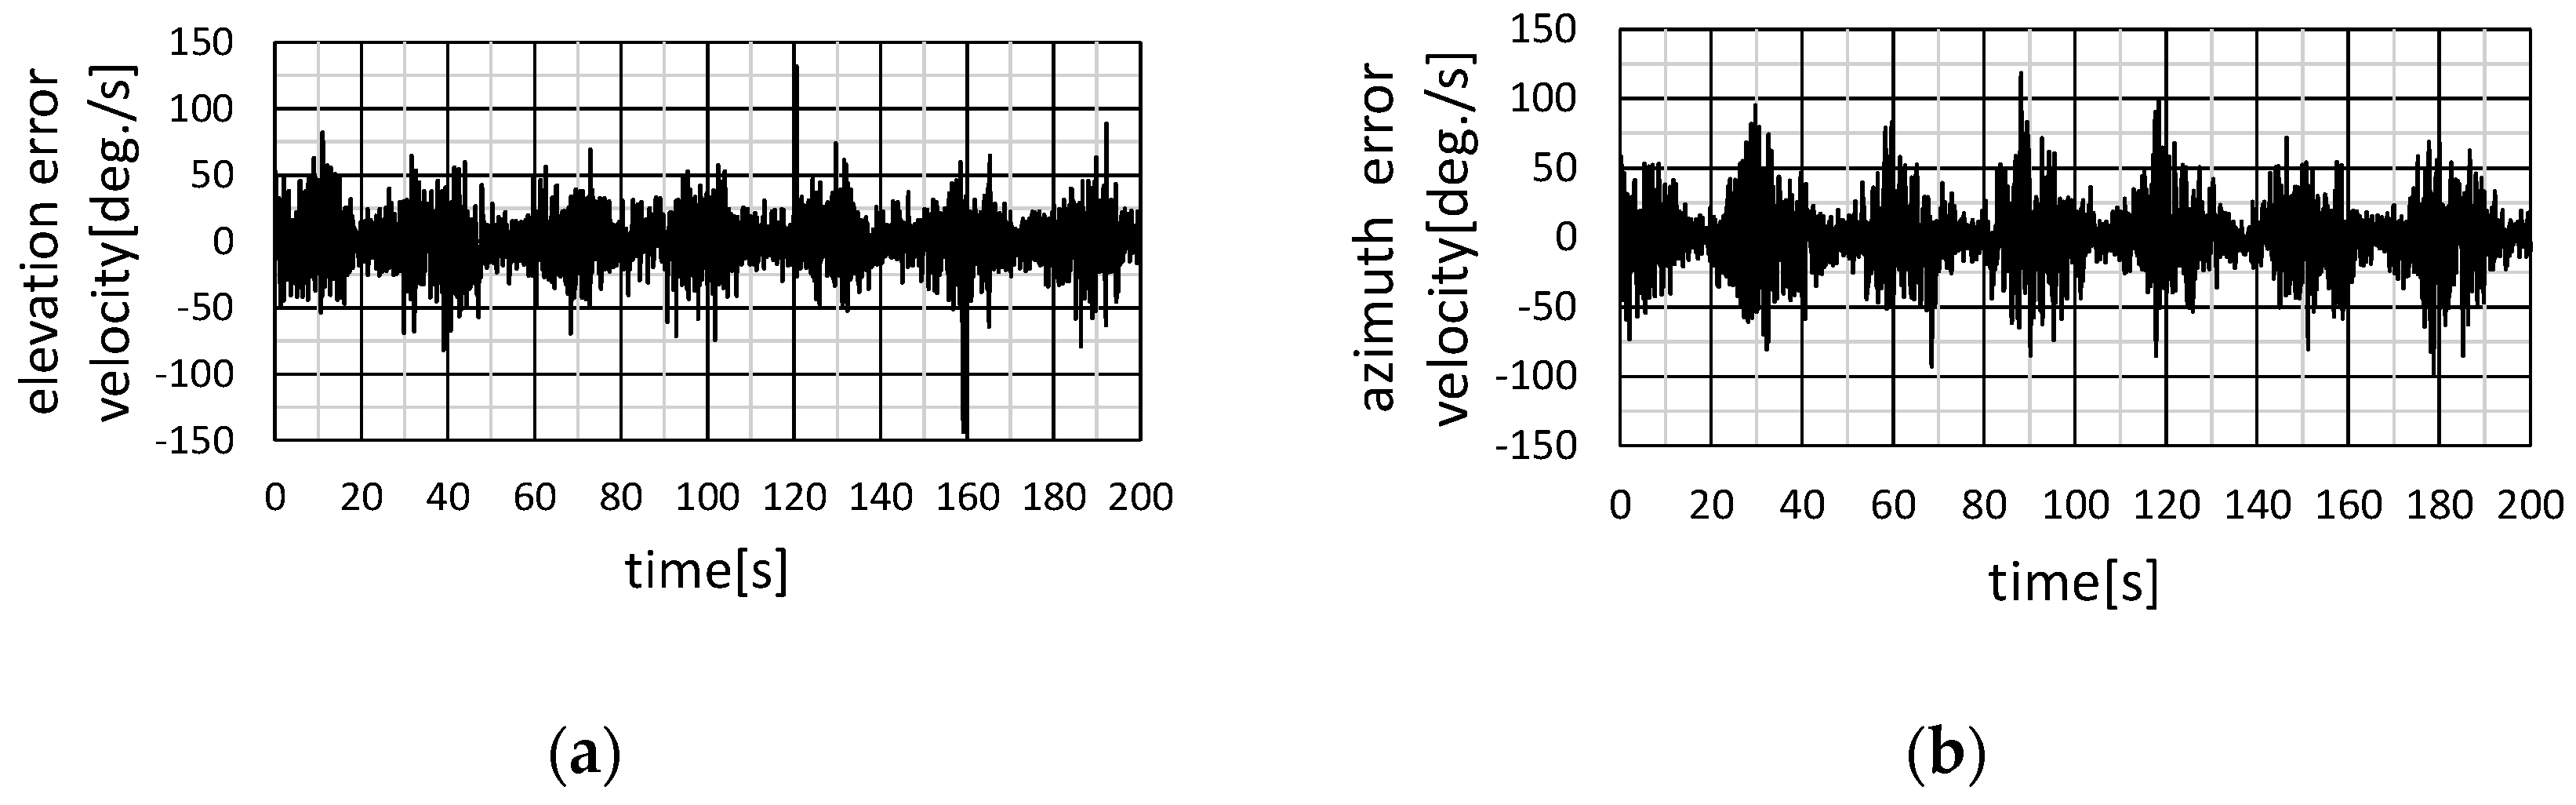
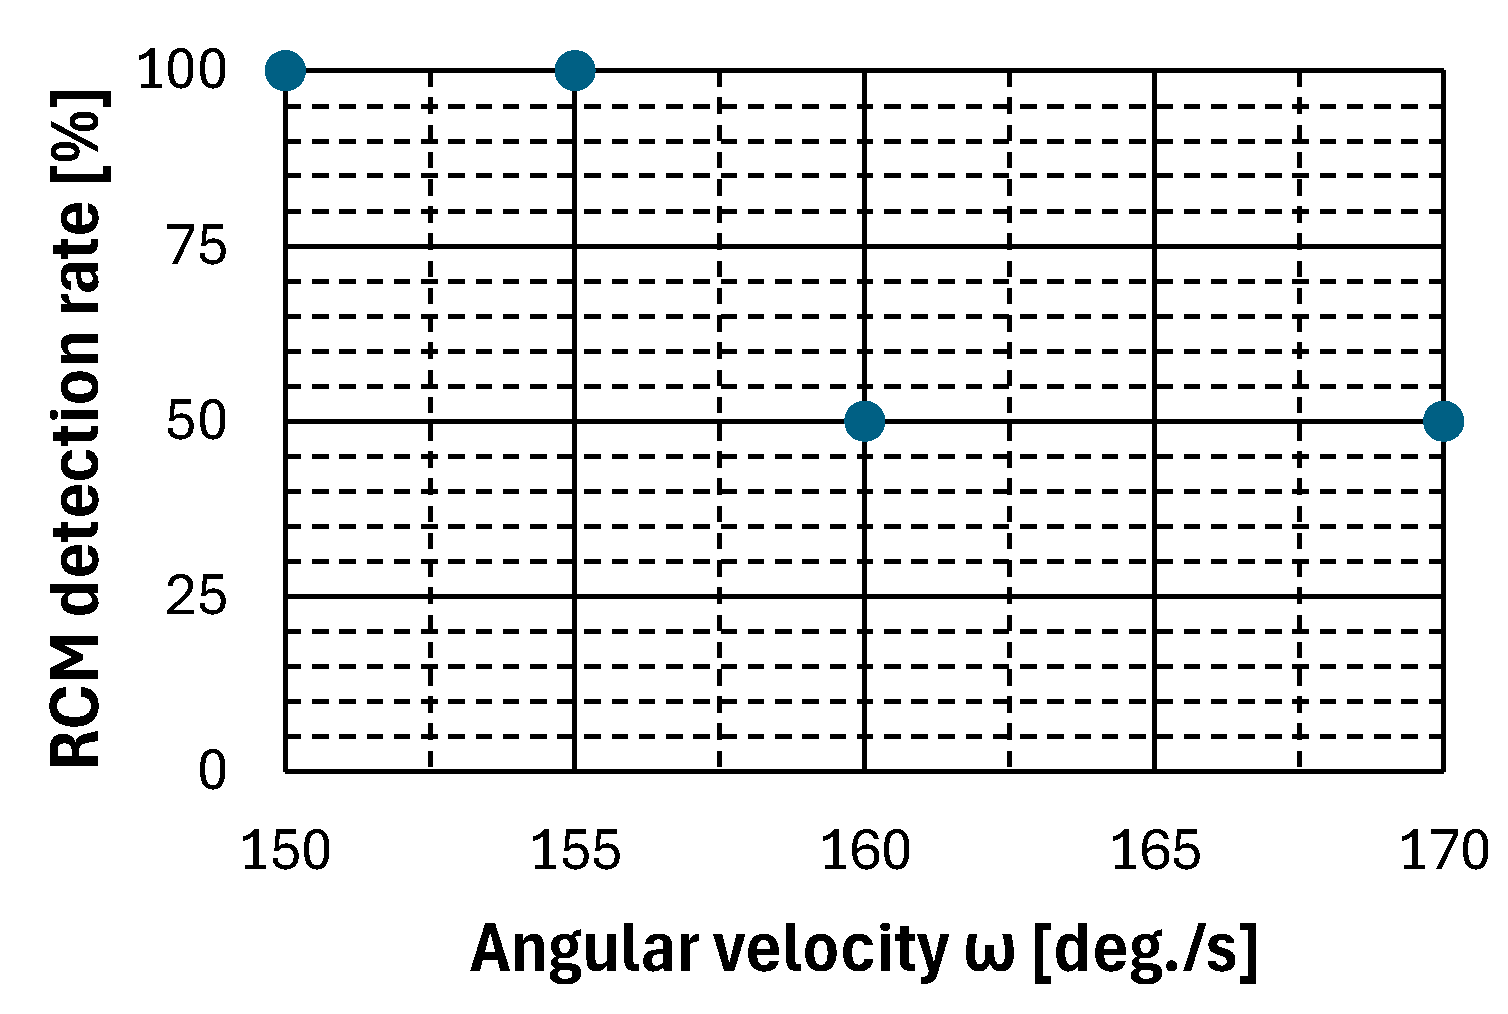
Figure 17 shows the RCM detection probability for the angular velocity from the experiment with the UAV. Based on the experimental results shown in
Figure 17, all frames in which the RCM was drawn were detectable up to an angular velocity of 155 [deg./s], and half of the frames were undetectable at angular velocities of 160 [deg./s] or higher. Therefore, the proposed method was capable of detecting the RCM up to an angular velocity of 155 [deg./s]. Based on these results, the strength of motion blur was calculated using Equation (10). The formula is shown in Equation (14).
The calculation results show that the marker detection performance of the proposed method against motion blur is 0.0175 [-], which exceeds the required performance of 0.0120 [-].
Based on the experimental results shown in
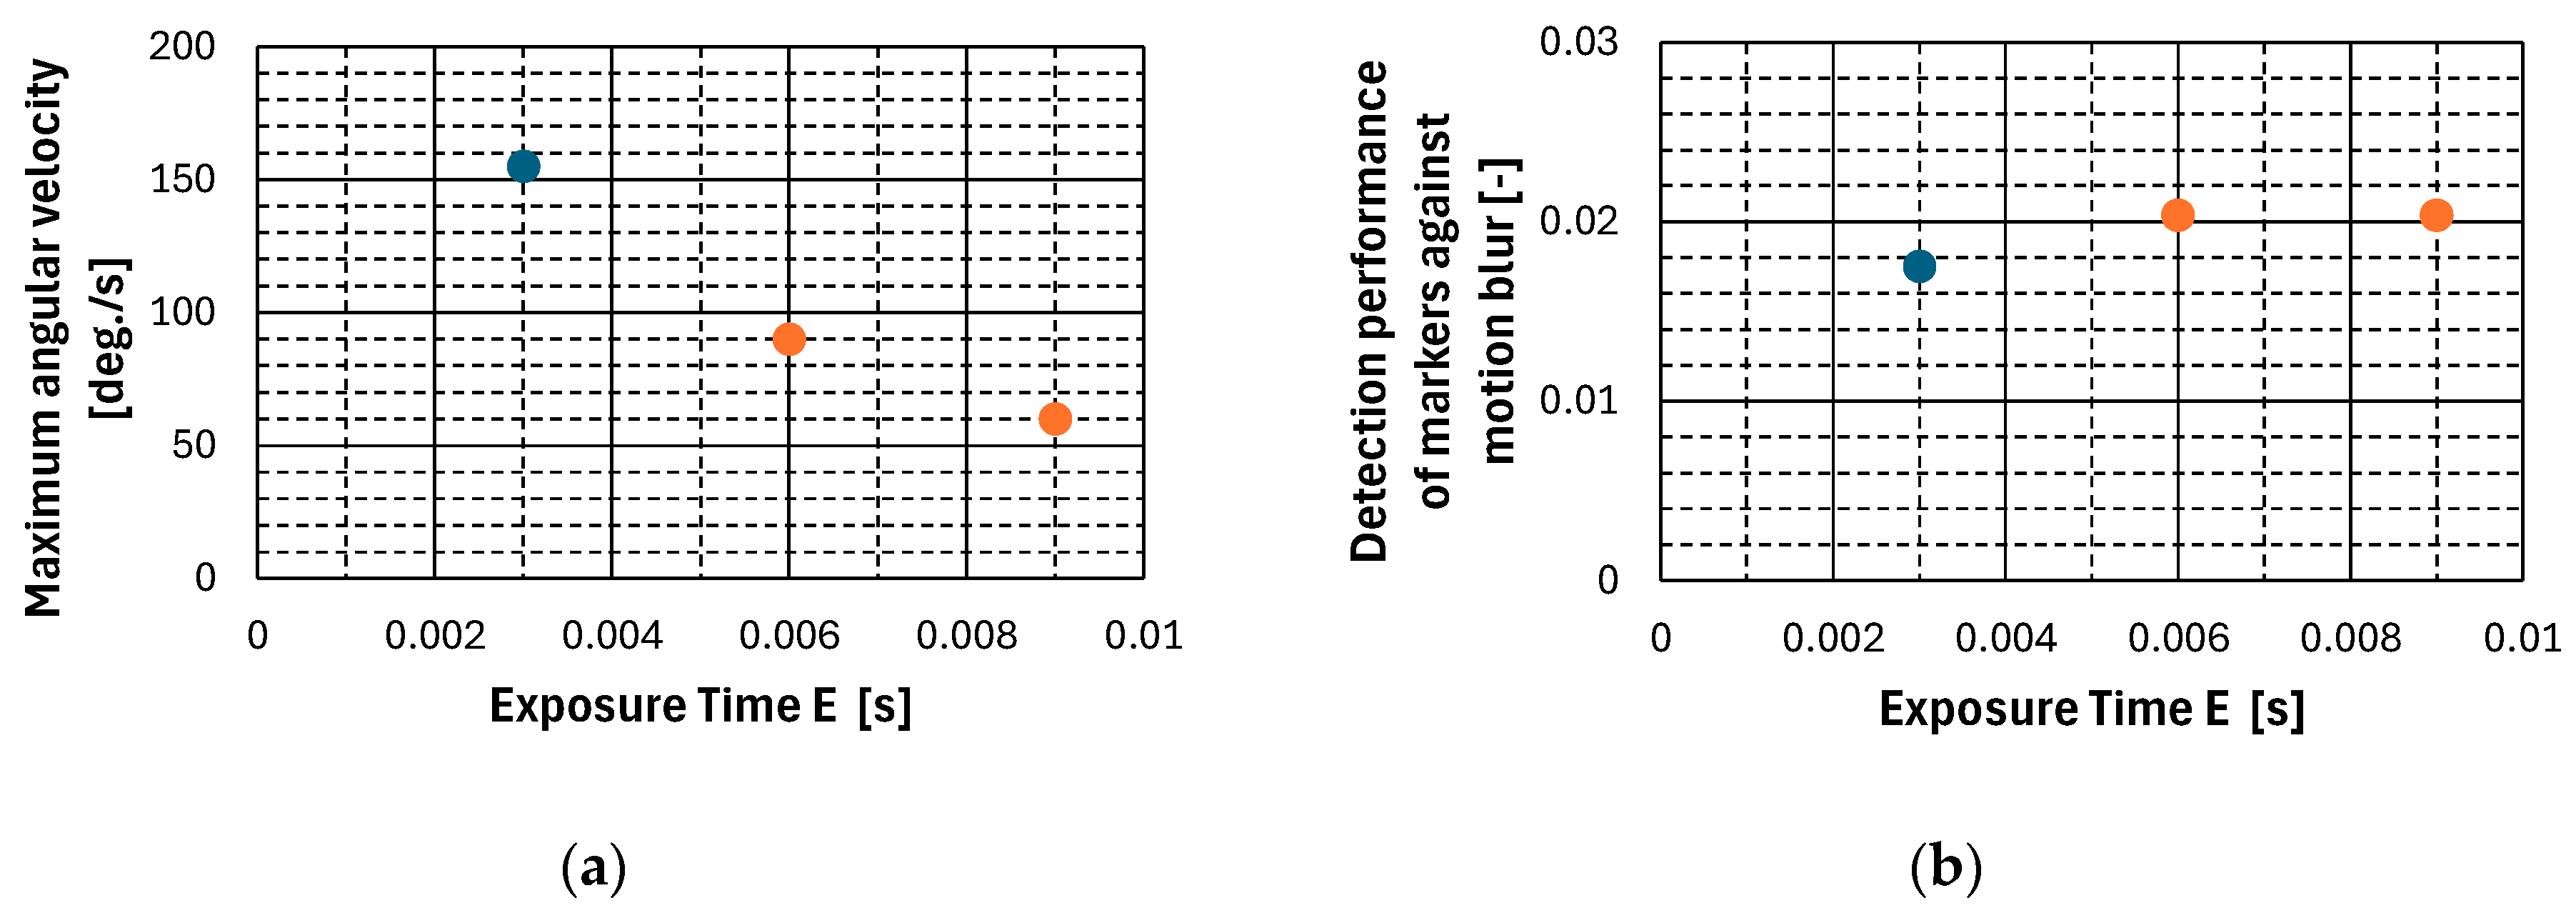
Figure 17, additional experiments were conducted to confirm the effect of the variation in exposure time, as indicated in Equation (14), on motion blur tolerance. In these experiments, the same configuration of equipment was used to measure motion blur resistance when the camera exposure time was set to 0.006 [s] and 0.009 [s]. The relationship between the maximum angular velocity at which the RCM could be detected and each exposure time is shown in
Figure 18a, and the motion blur intensity at each time is summarized in
Figure 18b.
In
Figure 18, the blue markers represent the results of the experiment shown in
Figure 17, while the orange markers represent the results of the additional experiment. The results of the additional experiment indicate that the RCM can be detected up to a maximum angular velocity of 90 [deg./s] when the exposure time is 0.006 [s] and up to 60 [deg./s] when the exposure time is 0.009 [s]. This shows that as the exposure time increases, the maximum angular velocity at which the RCM can be detected decreases, narrowing the sensor’s applicable range. On the other hand, the motion blur intensity at each exposure time setting remained consistent at 0.0204 [-] in both cases. In other words, the motion blur intensity generated in the image at each exposure time setting was the same, indicating that motion blur tolerance does not change with exposure time variation in the proposed method.
5.5. Summary of Performance
The performance requirements of the ground station detection system, as presented in
Section 4, are compared with the results of the three experiments in
Section 5.2,
Section 5.3 and
Section 5.4 and summarized in
Table 4. For comparison with the performance of the proposed method, the performance of AR markers obtained using a similar experimental system is also presented in
Table 4.
As shown in
Table 4, the proposed method achieved the required performance in all three performance categories.
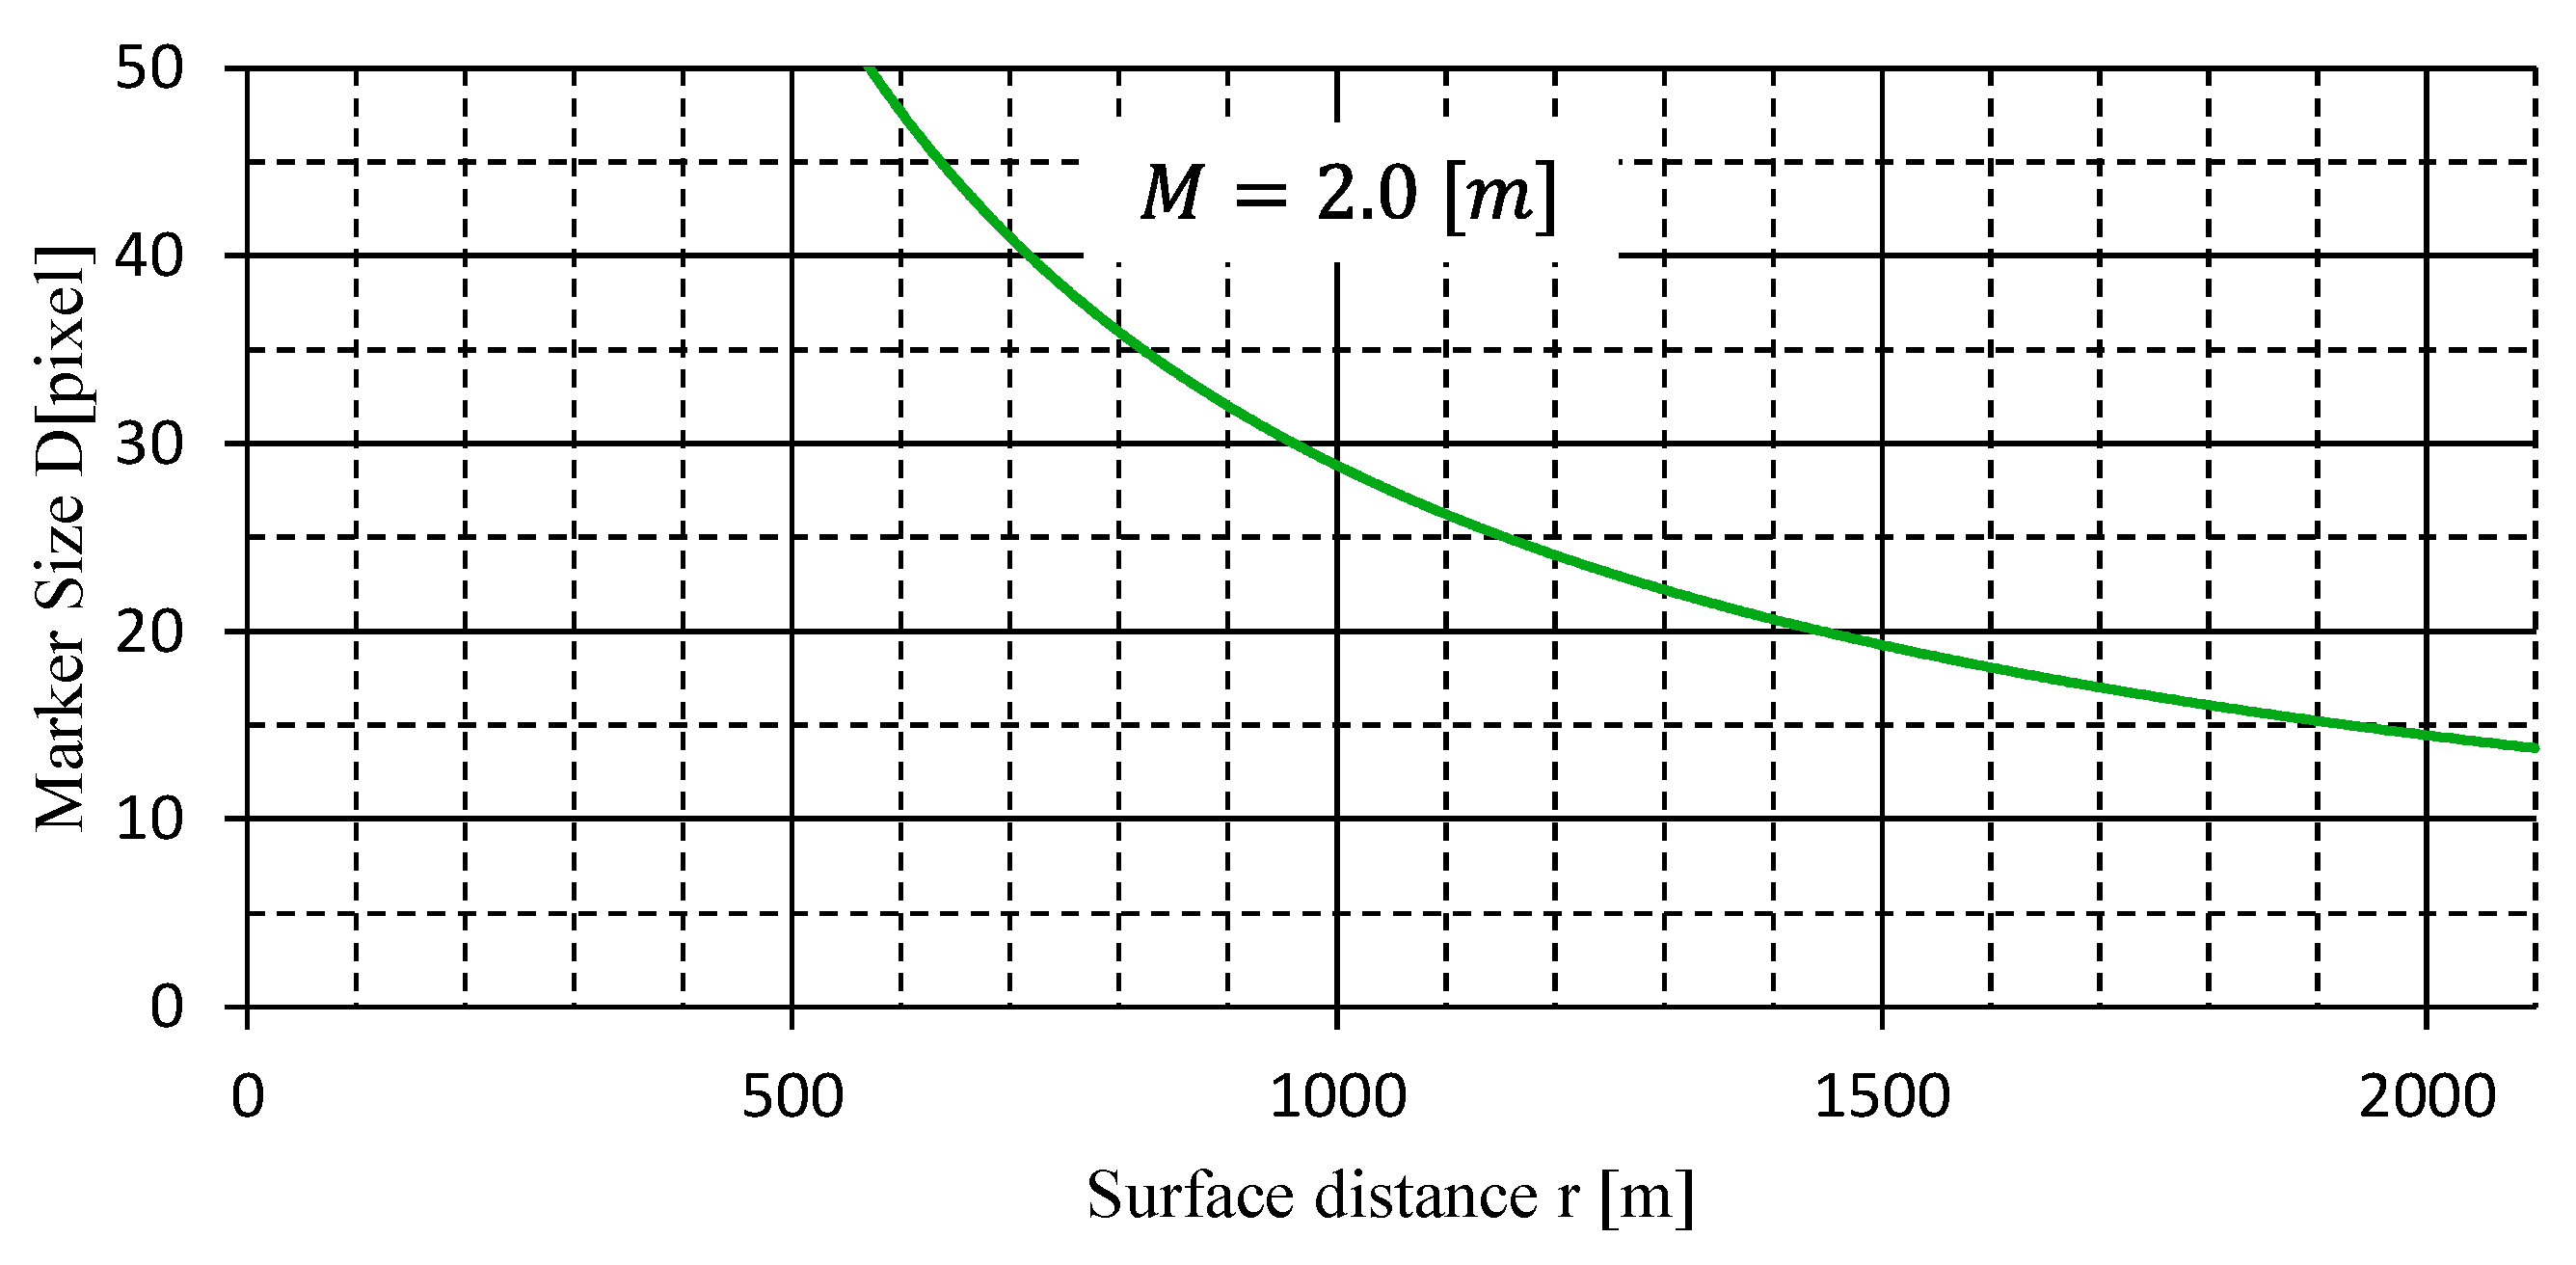
In terms of detection performance for low-resolution markers, the proposed method was found to be able to detect RCMs up to a marker size of 10.2 [pixels]. This corresponds to the detection of a 2 [m] diameter color marker at an altitude of 100 [m] above the ground and at a ground distance of 2839 [m]. Since the expected operational range is 2000 [m], the sensor system has enough of a margin. Its performance is half that of AR markers in terms of marker drawing size.
The proposed method also has a marker direction detection accuracy of 0.12 [deg.], which is 0.02 [deg.] more accurate than the required accuracy. It can therefore be used for antenna control in the range of ±0.29 [deg.]. However, when compared to AR markers, the detection accuracy was found to be inferior, entailing twice as much error.
The proposed method’s marker detection performance for motion blur was 0.175 [-]. This performance is found to be applicable to angular velocities up to 29.8 [deg./s] in the assumed operational environment.
5.6. Limitations of the Proposed Method
It has been observed that the proposed method fails to detect RCMs under several conditions. The main reasons for this are motion blur, changes in ambient light, and the partial obstruction of the markers.
First, regarding motion blur, according to the performance evaluation results shown in
Table 4, the proposed method fails to detect RCMs when the motion blur intensity exceeds 0.0175. This is because motion blur alters the color of the color markers, making color discrimination difficult.
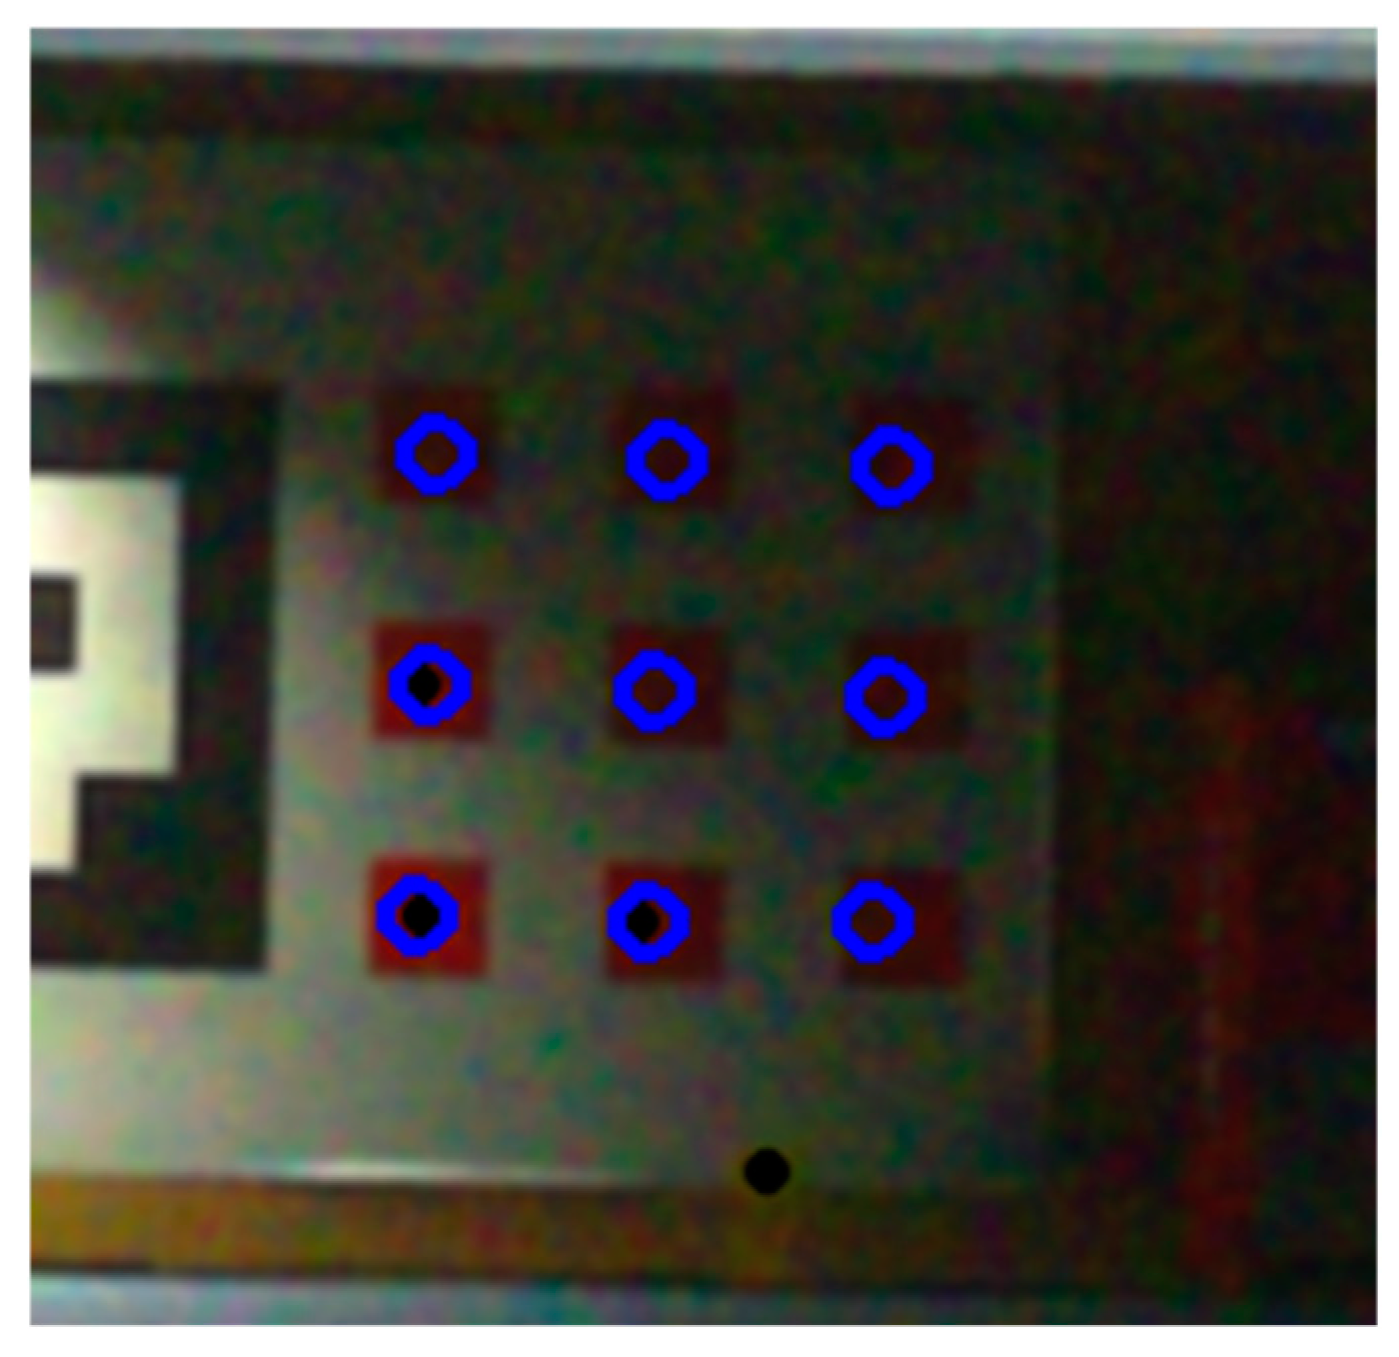
Figure 19 shows an image in which RCM detection fails due to motion blur.
Second, RCM detection may fail due to the discoloration of the color markers caused by changes in ambient light. Specifically, when lighting is inadequate, such as at night, the color of the markers changes due to insufficient ambient light, which leads to RCM detection failure. In
Figure 20, RCM detection fails because the color marker at the predicted location (circled in blue) is too dark.
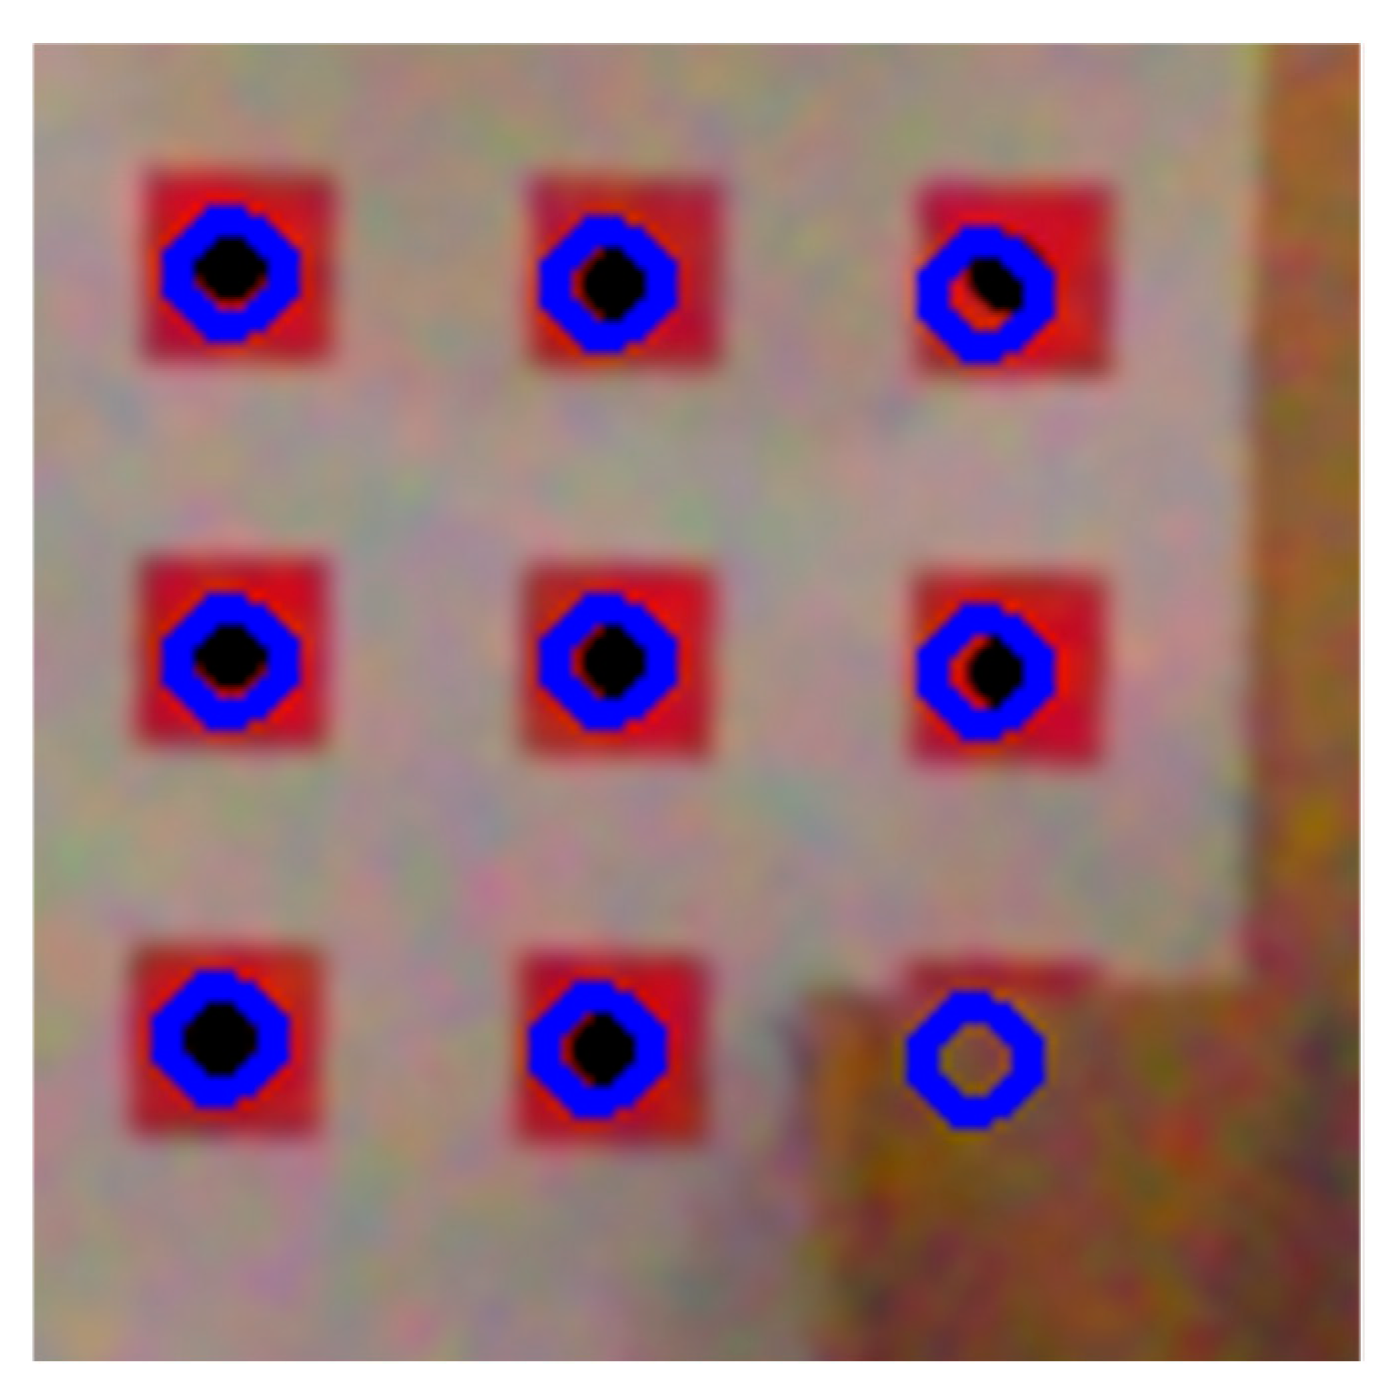
Finally, RCM detection may fail when a portion of the color marker is completely obscured. As shown in
Figure 21, if part of the color marker is missing, the detection program determines that the error exceeds the tolerance during the matching process and concludes that RCM detection has failed.
These causes of detection failure can be categorized according to two main factors: first, environments where the color markers become discolored, and second, environments where the color markers are not visible in the image. Discoloration can be counteracted to some extent by adjusting the color gamut applied to the markers. However, in environments where the color markers are completely invisible, there are physical limitations on the system. For example, although the placement pattern of the color markers in the proposed method offers a certain degree of flexibility, depending on the camera’s field of view (FoV) and the distance from the markers, the markers may fall outside the FoV. In such cases, optimizing the camera’s FoV and the placement of markers is required to prevent poor system performance.
6. Conclusions
In this paper, a system for detecting multiple color markers by image processing and detecting the direction of a ground station based on the location information of the markers was proposed, and its performance was evaluated for a wireless relay system using a small fixed-wing UAV for image transmission. Though color markers are robust to low resolution and motion blur due to their detection principle, they are prone to false detection in noisy natural images and cannot detect only color markers installed at ground stations. In this study, we proposed a method to detect only the color markers in captured images by calculating the placement patterns of the markers in the image based on the relative positions and coordinates of the markers and cameras, and matching them with the captured images to construct a ground station detection system. Based on the assumed operational environment of the wireless relay system, we determined the performance requirements for low resolution, marker direction detection accuracy, and motion blur, and evaluated whether the constructed ground station detection system achieves the required performance. The results were as follows: (1) the system was able to detect markers with 1.4 times lower resolution than the required performance standard; (2) the system was able to detect marker direction more accurately than the required performance standard by 0.02 [deg.]. This has enabled us to construct a basic ground station detection system for establishing a wireless relay system using a small fixed-wing UAV.
Although the proposed method has achieved good results in ground experiments, its performance under flight conditions has not yet been verified. In outdoor flight, changes in ambient light may cause the discoloration of the acquired images, and during circling flight, the wing may hide the color markers due to the bank angle. Additionally, the camera may be subjected to unexpected angular velocities due to aircraft engine vibration. Furthermore, the placement pattern of the color markers depends on the camera’s field of view (FoV) and the distance from the markers, which could cause the markers to move out of the FoV and fail to be detected. If RCMs cannot be detected due to these factors, a method is needed either to correct the image using deep learning (DL) or to detect RCMs directly using DL.
Moreover, there is room for improvement in the onboard computation of small fixed-wing UAVs. For example, dedicated hardware such as an Application-Specific Integrated Circuit (ASIC) could be utilized to reduce the power consumption of the sensor system, extend the UAV’s flight time, and improve its operability.
In future research, it will be important to prioritize flight experiments to verify system performance in real-world environments. Additionally, evaluating system robustness in various flight environments and making adjustments to mitigate potential problems related to visibility and environmental conditions will be critical for future success.


