Article

Dynamics Simulation and Optimization of Gliding Tail Decoy

1
The Institute of Engineering Thermophysics, Chinese Academy of Sciences, Beijing 100190, China
2
University of Chinese Academy of Sciences, Beijing 100049, China
3
National Key Laboratory of Science and Technology on Advanced Light-Duty Gas-Turbine, Beijing 100190, China
*
Author to whom correspondence should be addressed.
Aerospace 2025, 12(3), 212; https://doi.org/10.3390/aerospace12030212
Submission received: 20 January 2025 / Revised: 3 March 2025 / Accepted: 5 March 2025 / Published: 6 March 2025

Abstract

:
In this paper, a gliding tail decoy for a UAV is proposed, which can be discarded as a decoy when the UAV encounters danger. Based on an aerodynamic model of the tail decoy, a nonlinear dynamics model of the tail decoy gliding in the air is generated, and a three-layer pyramid general design architecture of the tail decoy is established. In order to subsequently analyze the dynamic characteristics and gliding trajectory of the gliding tail decoy, a gliding trajectory simulation software is developed based on the dynamics model of the gliding tail. Selecting the pre-optimized tail shape as the research object, and analyzing the influence of deployment speed and deployment posture angle on the tail trajectory, it was found that a deployment speed of 60 m/s and a deployment posture angle of 8° are more conducive to the tail obtaining a larger gliding distance. In addition, the effectiveness of the optimization method for the gliding tail in this article was verified. It was found that after optimizing the shape of the gliding tail, the lift coefficient increased in the range of 0°~14°, and the gliding distance increased by 4.2%.

1. Introduction

Releasing interference decoys is an important means of aircraft penetration, and interference decoys can perform reconnaissance, jamming, and other tasks during aircraft penetration. Research on interference decoys has attracted attention from various countries [1,2,3]. The flight trajectory of the decoy in the air after release is related to whether it can effectively interfere with enemy air defense firepower, but the flight trajectory and aerodynamic shape have a strong coupling relationship. Therefore, the integrated optimization of the aerodynamic shape and glide trajectory of the decoy is one of the design difficulties. A large number of studies have been conducted in academia on the coupled aerodynamic and trajectory optimization of aircraft. However, relatively few studies have been conducted on the dynamic modeling and trajectory optimization of decoys; from this research, some design optimization methods for decoys, being unpowered gliding vehicles, can be drawn.
The dynamics model is the basis of flight trajectory simulation, and an accurate dynamics model is directly related to the simulation verification accuracy. Regarding the dynamics modeling and simulation of towed decoys, Paul [4] investigated traction decoys, constructed a dynamics model for the coupling of flexible cables and rigid decoys, and proposed a synergistic optimization method for traction cables and decoys, which simulated the precise deployment process of the decoys at sea. On this basis, Ma [5] proposed a tension recursive algorithm, based on the dynamic equation of airborne towed decoys, to achieve rapid prediction of the dynamic response characteristics of towed decoys. By optimizing the distance between the towing point and the center of gravity of towed decoys through simulation, the stability of the towed decoys during the accompanying flight was ensured. Su [6] studied the stability of the disturbance-resistant trajectory of flexible cables during the aerial recovery process of UAVs under various unknown airflow disturbances. A nonlinear dynamic model of the towed cone sleeve was established, and a high-order, sliding mode, anti-interference controller design method, based on finite time convergence, was proposed through forward feedback compensation of disturbances to achieve anti-interference motion control of the towed cone sleeve.
All of the above papers modeled and simulated the dynamics of towed decoys, but the gliding tail decoy studied in this paper is released without cable traction, so it is necessary to construct the dynamics model of the gliding tail decoy without cable traction, and to optimize the shape of the tail so that it can glide stably in the air. There are few academic studies on the dynamic modeling and shape optimization of glider tails. However, there are more studies on the dynamic characteristics and shape optimization of unpowered gliding vehicles with conventional layouts, which can provide a reference for the research in this paper. Mahmood [7] investigated an unpowered glide bomb with an inverted Y-shaped layout, and optimized the maximum glide distance of the glide bomb by combining homogeneous Control Vector Parameterization (CVP) and time scales. Pan [8] studied the dynamic and static characteristics of an air-launched underwater vehicle, established a dynamic simulation platform based on MATLAB 2018, generated the dynamic glide data of an air-launched underwater vehicle, and analyzed the effects of different wing areas and projection conditions on the glide trajectory. Liano [9] aimed to solve the divergence problem of the tail’s free gliding attitude in high-angle-of-attack state, and established a simplified model of high-order yaw motion to realize the accurate solution of the projectile attitude in the high-angle-of-attack oscillation state. Hu [10] proposed a maneuver mode analysis and modeling method, based on a vector regression model, from the perspective of maneuvering penetration during the gliding phase of hypersonic aircraft. The coupling relationship of maneuver characteristic parameters was decomposed using the vector regression method to achieve parameter modeling and control mode analysis of the hypersonic aircraft’s gliding maneuver mode. Liu [11] optimized the shape of a biomimetic gliding aircraft based on the spin stable flight ability of winged seeds, and introduced a machine learning module into the optimization architecture to establish an aerodynamic replacement model, based on the fusion of a radial basis function neural network and a numerical simulation dataset. Aerodynamic optimization was carried out using a multi-island genetic algorithm, and the optimized shape of the biomimetic aircraft was obtained. Compared with the original shape, the aerodynamic efficiency of the optimized model was improved by more than 50%. Tian [12] established a total energy consumption model for underwater gliders, to address the impact of motion parameters on gliding trajectories. Through comparative simulation, the monotonicity of the total energy consumption model regarding the gliding angle and sliding speed was verified, and the optimal gliding angle and sliding speed were obtained under the premise of maximum navigation efficiency. Yang [13] proposed a hydrodynamic shape optimization method for underwater gliders based on an approximate model. The sensitivity of hydrodynamic performance to shape and size was analyzed based on the constructed hydrodynamic approximate model. The principle of minimizing energy consumption was adopted to obtain the optimal wing shape under different water entry conditions.
The above paper investigates the dynamics modeling and shape optimization of an unpowered gliding vehicle. However, in order to meet the specific mission requirements, further comprehensive optimization of the gliding trajectory of the vehicle is needed. To address the above problems, Luo [14] proposed a trajectory planning algorithm for hypersonic vehicle re-entry trajectory optimization, based on an improved sequential convex function, in order to enable the vehicle to successfully fly over the enemy’s defensive region, achieving high trajectory calculation accuracy and an optimal trajectory. Tong [15] studied a flight trajectory optimization method for high-speed vehicles under the constraints of multiple static no-fly zones, and designed a high-speed maneuvering target penetration strike method, based on the artificial potential energy method. It not only avoided trajectory oscillations due to fuzzy heading judgment in the tangential direction of the obstacle region, but also greatly reduced the inherent conflict between obstacle avoidance and target accessibility. Sahoo [16] proposed a missile shape and trajectory optimization method based on the Kouda design method. The population size, inertia weights, and acceleration coefficients of the PSO were optimized using the Kouda design method. Then, the optimized PSO algorithm was used to predict the glide trajectory of a missile under different shape conditions, and the maximum glide distance of the trajectory was achieved by optimizing the launch angle of attack. Chen [17] introduced the application of the Gray Wolf algorithm in flight trajectory optimization, analyzed the effect of the initial deployment altitude on the flight trajectory, and verified the feasibility of the proposed method to solve the optimal trajectory through simulation. Kumar [18] proposed a trajectory optimization formulation for a gliding hypersonic vehicle to achieve maximum range under various flight and impact constraints, and introduced a genetic algorithm module to solve the dynamic optimization problem, in order to generate a maximum-range trajectory under flight constraints. Luo [19] proposed a gliding trajectory optimization method that coupled geometric shape and dynamics to solve complex problems in the planning of hypersonic vehicle maneuvering and trajectory changes, using traditional dynamic methods. The method minimized the trajectory angle as the cost function, achieving high-stability gliding and trajectory changes with the least number of rolling cycles. Chudej [20] studied the comprehensive trajectory optimization problem of a gliding UAV under the influence of updrafts, and the gliding performance of the aircraft was improved by 20%. Coutinho [21] studied the optimal gliding trajectory problem of gliders, linearized the flight dynamics of gliders, and proposed a mixed integer nonlinear programming model to solve the matching problem between the optimal trajectory of gliders and target detection in disaster relief scenarios.
Unlike the decoys addressed in the abovementioned studies, conventional jamming decoys need to be carried by the vehicle, adding extra weight to the vehicle. Taking inspiration from the gecko discarding its tail for escape, this paper uses the vehicle’s ducted tail as a decoy. When the UAV enters the enemy’s defense area, the UAV increases the rear swept angle of the wing, discards the tail, and uses the tail to glide in the air, in order to decoy the enemy’s defense force and win enough time for the UAV to fly over the defense area. This gliding tail decoy is an unpowered gliding vehicle with an unconventional layout, which is different from a towed decoy, and requires the construction of a nonlinear dynamics model in the state of no cable towing. Moreover, there is a strong coupling relationship between the gliding trajectory and the aerodynamic shape of the tail decoy, which requires a different approach to that of traditional flight trajectory optimization, and requires comprehensive optimization of the gliding trajectory and the aerodynamic shape of the tail decoy.
Therefore, this article constructs a comprehensive optimization framework for the shape and trajectory of gliding tail decoys that imitates the tail cutting action of geckos, and achieves dual optimization of the aerodynamic shape and gliding trajectory of the gliding tail through simulation methods. The specific contributions are as follows:
(1)
A gliding tail decoy imitating a gecko’s abandoned tail is designed, and a three-layer pyramid tail decoy overall optimization architecture is constructed. Among the layers, the task profile layer serves as the top-level requirement input, extracting the task feature parameters that the tail decoy needs to meet as constraints for the aerodynamic and ballistic coupling design of the tail. The coupling optimization layer is the intermediate coupling layer for tail trajectory parameters, aerodynamic data, and shape data. The bottom layer is the parameterized modeling and surrogate model layer. By parameterizing the shape of the tail wing and using CFD simulation tools to obtain aerodynamic data of the tail wing under typical working conditions, the surrogate model is used to generate aerodynamic data of the tail wing in the full sample space, which are input into the coupling optimization layer as necessary parameter support for trajectory calculation.
(2)
Parameterized modeling and aerodynamic model construction of the tail decoy are carried out to generate a nonlinear dynamic model of the tail decoy gliding in the air. On this basis, a mathematical model of the UAV flying over the defense area is established. In order to achieve closer similarity to the real environment, system model bias, aerodynamic bias, and meteorological bias are introduced in the modeling process. A trajectory calculation model is constructed, and glide trajectory simulation software is developed, which lays the foundation for the optimization of the aerodynamic shape and trajectory coupling of the gliding tail.
(3)
Taking the tail decoy before optimization as the research object, the effects of different deployment conditions on the gliding trajectory are analyzed. A comprehensive optimization method of the gliding tail based on a surrogate model is constructed, and its effectiveness is verified by simulation. Meanwhile, with the help of a CFD calculation tool, the principle of improving the gliding distance after optimizing the tail profile is explained.
The rest of this article is organized as follows. Section 2 describes the design concept and overall optimization architecture of this paper. Section 3 constructs the mathematical model and optimization process of the tail gliding in non-cooperative environment. Section 4 analyzes the influence of initial deployment conditions on the gliding trajectory through numerical simulation, and verifies the tail optimization with specific scenarios. Section 5 summarizes the research in the previous chapters and provides some engineering guidance.

2. Problem Description

2.1. Design Concept

The gecko is an interesting creature in nature, as shown in Figure 1a. When encountering danger, geckos will discard their tails and attract the attention of predators through rapid twisting of their tails, allowing them to quickly escape danger. As shown in Figure 1c, UAVs may encounter similar situations during long-distance flight missions. In order to increase the cruising distance during the cruising phase, a flight mode with a high aspect ratio and a high lift-to-drag ratio will be adopted. However, after flying to the enemy’s air defense zone, it is necessary to reduce the aspect ratio and quickly penetrate the defense. After successful penetration, the UAV will quickly cruise to the mission area to carry out the next combat mission. In order to improve the penetration probability of UAVs, taking inspiration from gecko tail breakage, a gliding tail decoy is proposed, as shown in Figure 1b. During the cruising phase of the UAV, the UAV adopts a high-aspect-ratio aerodynamic layout, and the tail is connected to the fuselage to provide longitudinal stability and control torque for the UAV. During the penetration phase, the UAV increases the rear wing angle and discards the tail wing, using the opportunity of the tail wing gliding in the air to lure the enemy’s air defense firepower and gain sufficient time for the UAV’s penetration.

2.2. Coupling Design and Optimization Problems

After the tail wing is discarded as a decoy, its flight trajectory in the air directly affects the success rate of UAV penetration. Moreover, the aerodynamic characteristic parameters of the tail wing are closely related to its flight trajectory in the air. Optimizing the aerodynamic characteristic parameters and trajectory parameters of the tail decoy simultaneously is a typical problem of coupling aerodynamic characteristic parameters with gliding trajectory design. As a result, an integrated design framework for the aerodynamic profile and glide trajectory of a tail decoy is established. As shown in Figure 2, the overall design architecture of the pyramid is divided into three layers. The task profile layer is the top-level requirement input end. By sorting out typical task scenario requirements, the task feature parameters that the tail decoy needs to meet are extracted as constraints for the aerodynamic and trajectory coupling design of the tail wing. The coupling optimization layer is the intermediate coupling layer for tail trajectory parameters, aerodynamic data, and shape data. The bottom layer is the parameterized modeling and surrogate model layer. By parameterizing the shape of the tail wing, CFD simulation tools are used to obtain aerodynamic data of the tail wing under typical working conditions. Finally, the surrogate model is used to generate aerodynamic data of the tail wing in the full sample space, which are input into the coupling optimization layer as necessary parameter support for trajectory calculation.
In the overall design architecture of the pyramid mentioned above, there are two main optimization problems involved. The first aspect is that under non-cooperative deployment conditions, after the tail wing is deployed as a decoy, the optimization of the tail decoy trajectory can buy enough time for the UAV to penetrate the defense. The second aspect is based on the constraints of flight trajectory, using parametric modeling and surrogate modeling methods to quickly obtain an aerodynamic shape of the tail wing that meets the requirements of the trajectory design.

3. Mathematical Model of Gliding Tail in Non-Cooperative Environment

3.1. Shape Parameterization and Aerodynamic Model

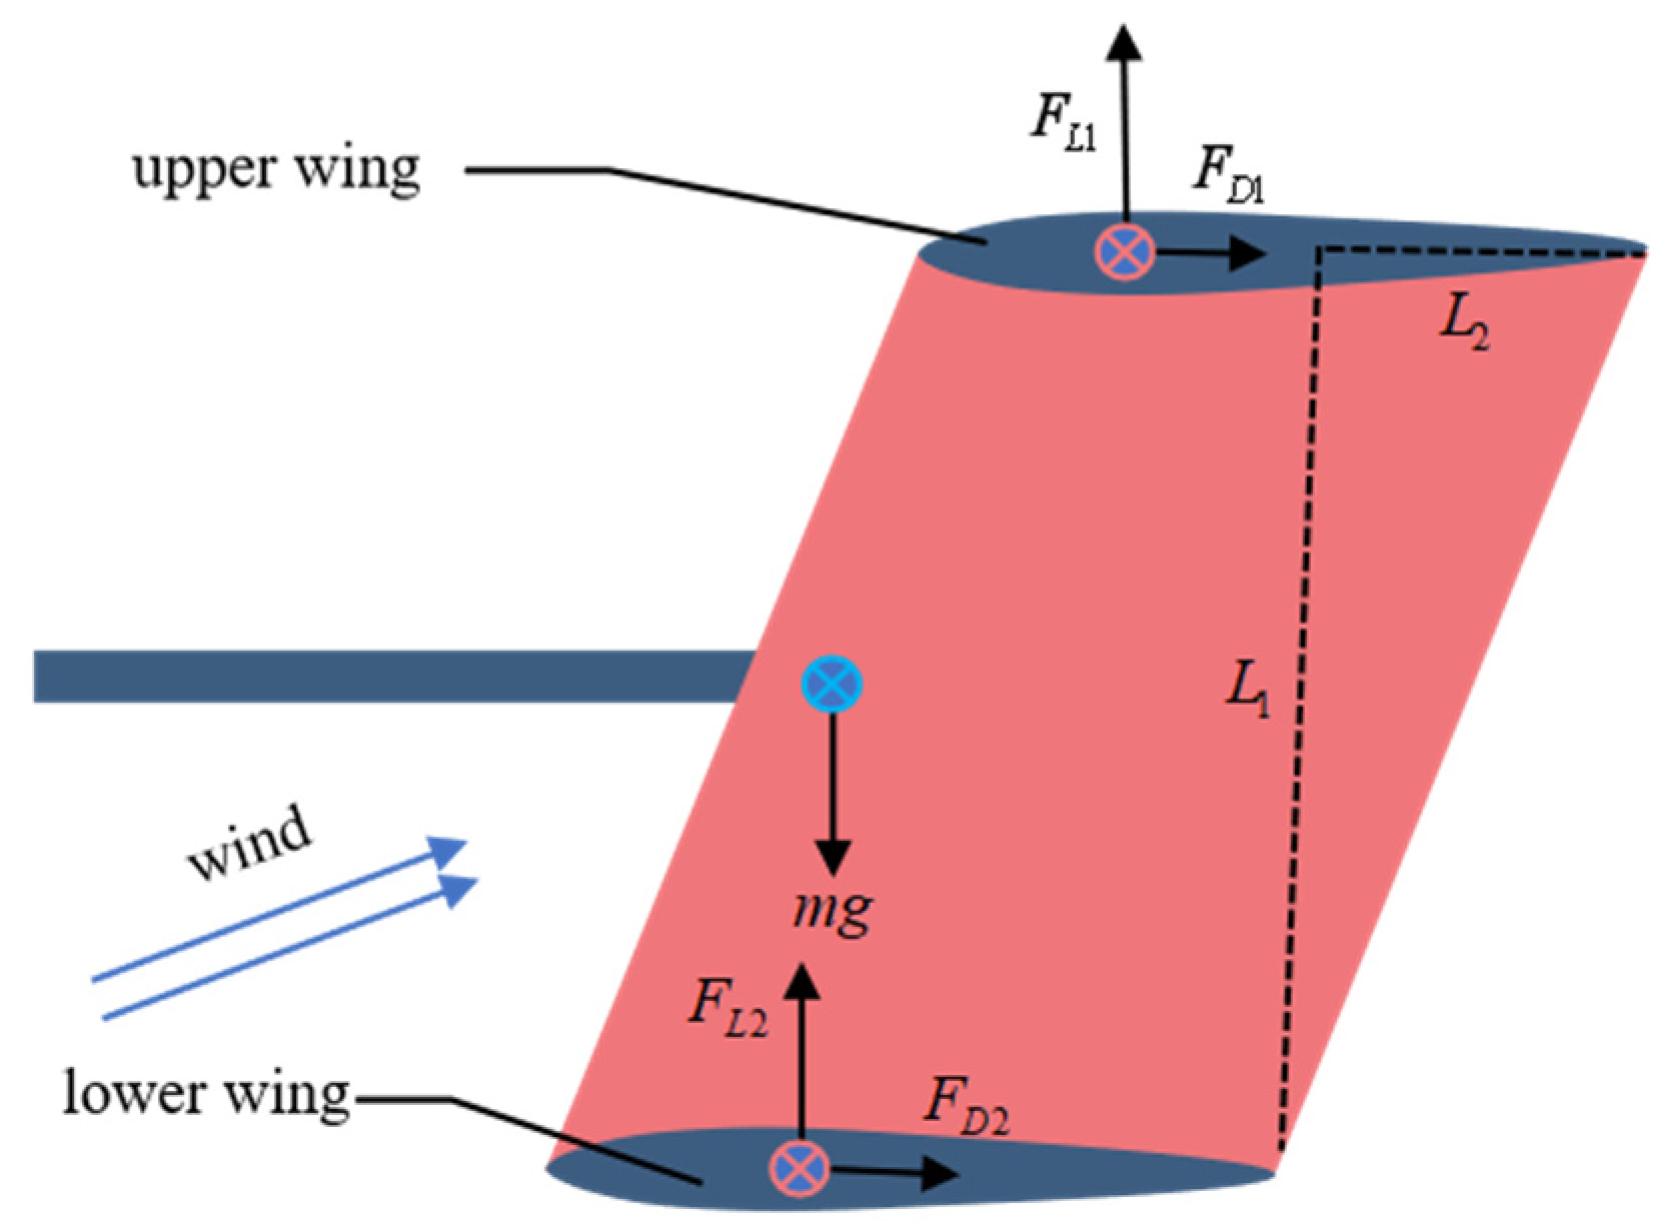
As shown in Figure 3, the tail decoy in this paper is a ducted tail, based on the authors’ previous research results [22,23]. The relative position of the upper and lower airfoils of a ducted tail affects its aerodynamic performance, which, in turn, affects the trajectory of the tail decoy as it glides through the air. Therefore, the relative positions of the upper and lower airfoils of the tail decoy are parametrically modeled, and the forces acting on them are analyzed.
The relative positions of the upper and lower airfoils are described by means of the parameters L 1 and L 2 . The parameter L 1 denotes the vertical distance between the chord lines in the upper and lower airfoils. The parameter L 2 represents the horizontal distance between the upper and lower airfoil trailing edges, and is positive when the upper airfoil’s trailing edge is in front of the lower airfoil’s trailing edge.
The gliding tail relies solely on aerodynamics to change its flight trajectory, with no energy loss during the flight process. Therefore, the weight m of the gliding tail is constant, and the gravitational acceleration g is constant. To simplify the model, it is assumed that the position of the center of gravity remains unchanged.
The aerodynamic forces experienced by a gliding tail during flight include lift, drag, and lateral forces. As this article only studies the vertical flight profile of the tail, the lateral forces are ignored. The expression is as follows:
F X = F D = F D 1 + F D 2 = 0.5 ρ v 2 S C D F Z = F L = F L 1 + F L 2 = 0.5 ρ v 2 S C L
In Equation (1), ρ is the air density, S is the reference area, and C D and C L are the drag coefficient and lift coefficient, respectively. In this article, the aerodynamic coefficients under different operating conditions are obtained through CFD calculations and surrogate models.

3.2. Dynamic Model of Gliding Tail

To simplify the problem, only the motion of the UAV in the vertical section is considered, and there is no movement or rotation of the UAV body in the roll and yaw directions. Therefore, the nonlinear dynamic equations of the gliding tail are as follows:
u ˙ = w q g sin θ + F x m w ˙ = u q + g cos θ + F z m
q ˙ = M / I y
x ˙ g = u cos θ + w sin θ h ˙ = u sin θ w cos θ
The definitions of each symbol in the above equation are shown in Table 1:

3.3. Modeling of Non-Cooperative Environmental Elements

UAV penetration is a process of confrontation, and the defensive element is a typical non-cooperative element. This article simplifies the defensive area of the defending side into a hemisphere with a radius of R . It is assumed that the initial velocity after the tail decoy is released is V 1 , and then the UAV accelerates through the defended area at velocity V 2 . At this time, the initial gliding altitude of the tail decoy is H 1 , and the cruising altitude of the UAV is H 2 . To simplify the problem, assuming that the tail decoy has sufficient infrared and visible light deception capabilities after being released, the UAV needs to meet the following conditions in order to complete the penetration mission:
x 2 + y 2 + z 2 = R 2 T b = 2 R 2 H 2 2 V 2 0 0 T B ( u 1 t + Δ u 1 t Δ t ) d t 2 R 2 H 2 2 0 0 T B ( w 1 t + Δ w 1 t Δ t ) d t H 1
In the formula, T b represents the time required for the UAV to penetrate. The parameter u 1 t denotes the component of V 1 t in the X-axis direction. The parameter w 1 t denotes the component of V 1 t in the Z-axis direction. The parameter Δ u 1 t represents the acceleration of V 1 t in the X-axis direction. The parameter Δ w 1 t represents the acceleration of V 1 t in the Z-axis direction. The parameter Δ t indicates the time step. The parameter V 1 t denotes the velocity of the tail decoy at moment t . During the UAV’s penetration process, the tail decoy needs to glide and wander within the defensive area, so the tail wing needs to satisfy the constraint of the third and fourth term in Formula (5). However, in real flight, there are a large number of uncertain factors. In order to make it more similar to a real situation, system model deviation, aerodynamic deviation, and meteorological deviation are introduced in the modeling process, specifically, as follows:
(1)
System model deviation. Random interference causes deviations between the actual penetration process and theoretical calculations, resulting in random disturbances in the tail decoy. These random disturbances mainly affect u 2 t and w 2 t in Formula (5), Therefore, process noise is added. As shown in Equation (6), u 2 a c t and w 2 a c t are the true gliding velocity components, and ε u 2 t and ε w 2 t are the Gaussian noise of the simulated interference.
u 2 a c t = u 2 t + ε u 2 t w 2 a c t = w 2 t + ε w 2 t
(2)
Aerodynamic deviation. The aerodynamic parameters in this article are obtained through CFD calculations and surrogate models, and are inevitably different from the real flight state. However, the aerodynamic parameters have similarities with the variation in the Mach number and angle of attack. Therefore, the aerodynamic deviation model can be simplified as Equation (7).
C D = ( 1 + N D σ C D ) C D N C L = ( 1 + N L σ C L ) C L N
In Equation (7), N D and N L are both random numbers with a mean of 0 and a variance of 1. C D N and C L N are the reference values for the drag and lift force coefficients, respectively. σ C D and σ C L represent the degree to which the aerodynamic coefficient deviates from the reference value. If the 3 σ confidence intervals of the deviation value are 6% of the reference value, then the following is true:
σ C D = σ C L = σ C C = 6 % 3 = 0.02
(3)
Meteorological deviation. In most cases, gliding trajectory calculations use standard meteorological conditions, but there are differences between the actual flying environment and the standard weather, mainly reflected in deviations in state variables such as density and temperature. Due to the fact that temperature mainly affects the calculation of sound velocity, which, in turn, affects the value of the Mach number Ma, and the aerodynamic coefficient is obtained through Ma interpolation, temperature deviation will affect the calculation of aerodynamic parameters. Therefore, temperature deviation can be attributed to aerodynamic deviation. This article only models the deviation of air density. Equations (7) and (8) in reference [24] provide the deviation of the actual air density from the reference value, and the ratio of the standard deviation to the reference value of air density can be approximated as Equation (9).
σ ρ ( h ) = 0.003517 exp ( h 26629.77 )
Therefore, the air density in the real environment can be approximated as Equation (10).
ρ = ( 1 + N ρ σ ρ ) ρ N
In Equation (10), N ρ is a random number with a mean of 0 and a variance of 1, and ρ N is the reference value for air density.

3.4. Optimization of Process

The design of the tail decoy needs to meet multiple indicators for penetration missions. This article mainly focuses on the flight performance of a tail decoy deployed within a certain range of altitude, speed, and angle of attack. The relative positions of the upper and lower airfoils of the tail decoy are optimized to ensure that the tail glides in the air for the distance and time required for the penetration mission. Therefore, the optimization objective function of the gliding tail is as follows:
f i n d   X = L 1 , L 2 , C L , C D , C M max   Y = 0 T B ( u 1 t + Δ u 1 t Δ t ) d t 0 T B ( w 1 t + Δ w 1 t Δ t ) d t s . t x 2 + y 2 + z 2 = R 2 T b = 2 R 2 H 2 2 V 2 0 0 T B ( u 1 t + Δ u 1 t Δ t ) d t 2 R 2 H 2 2 0 0 T B ( w 1 t + Δ w 1 t Δ t ) d t H 1
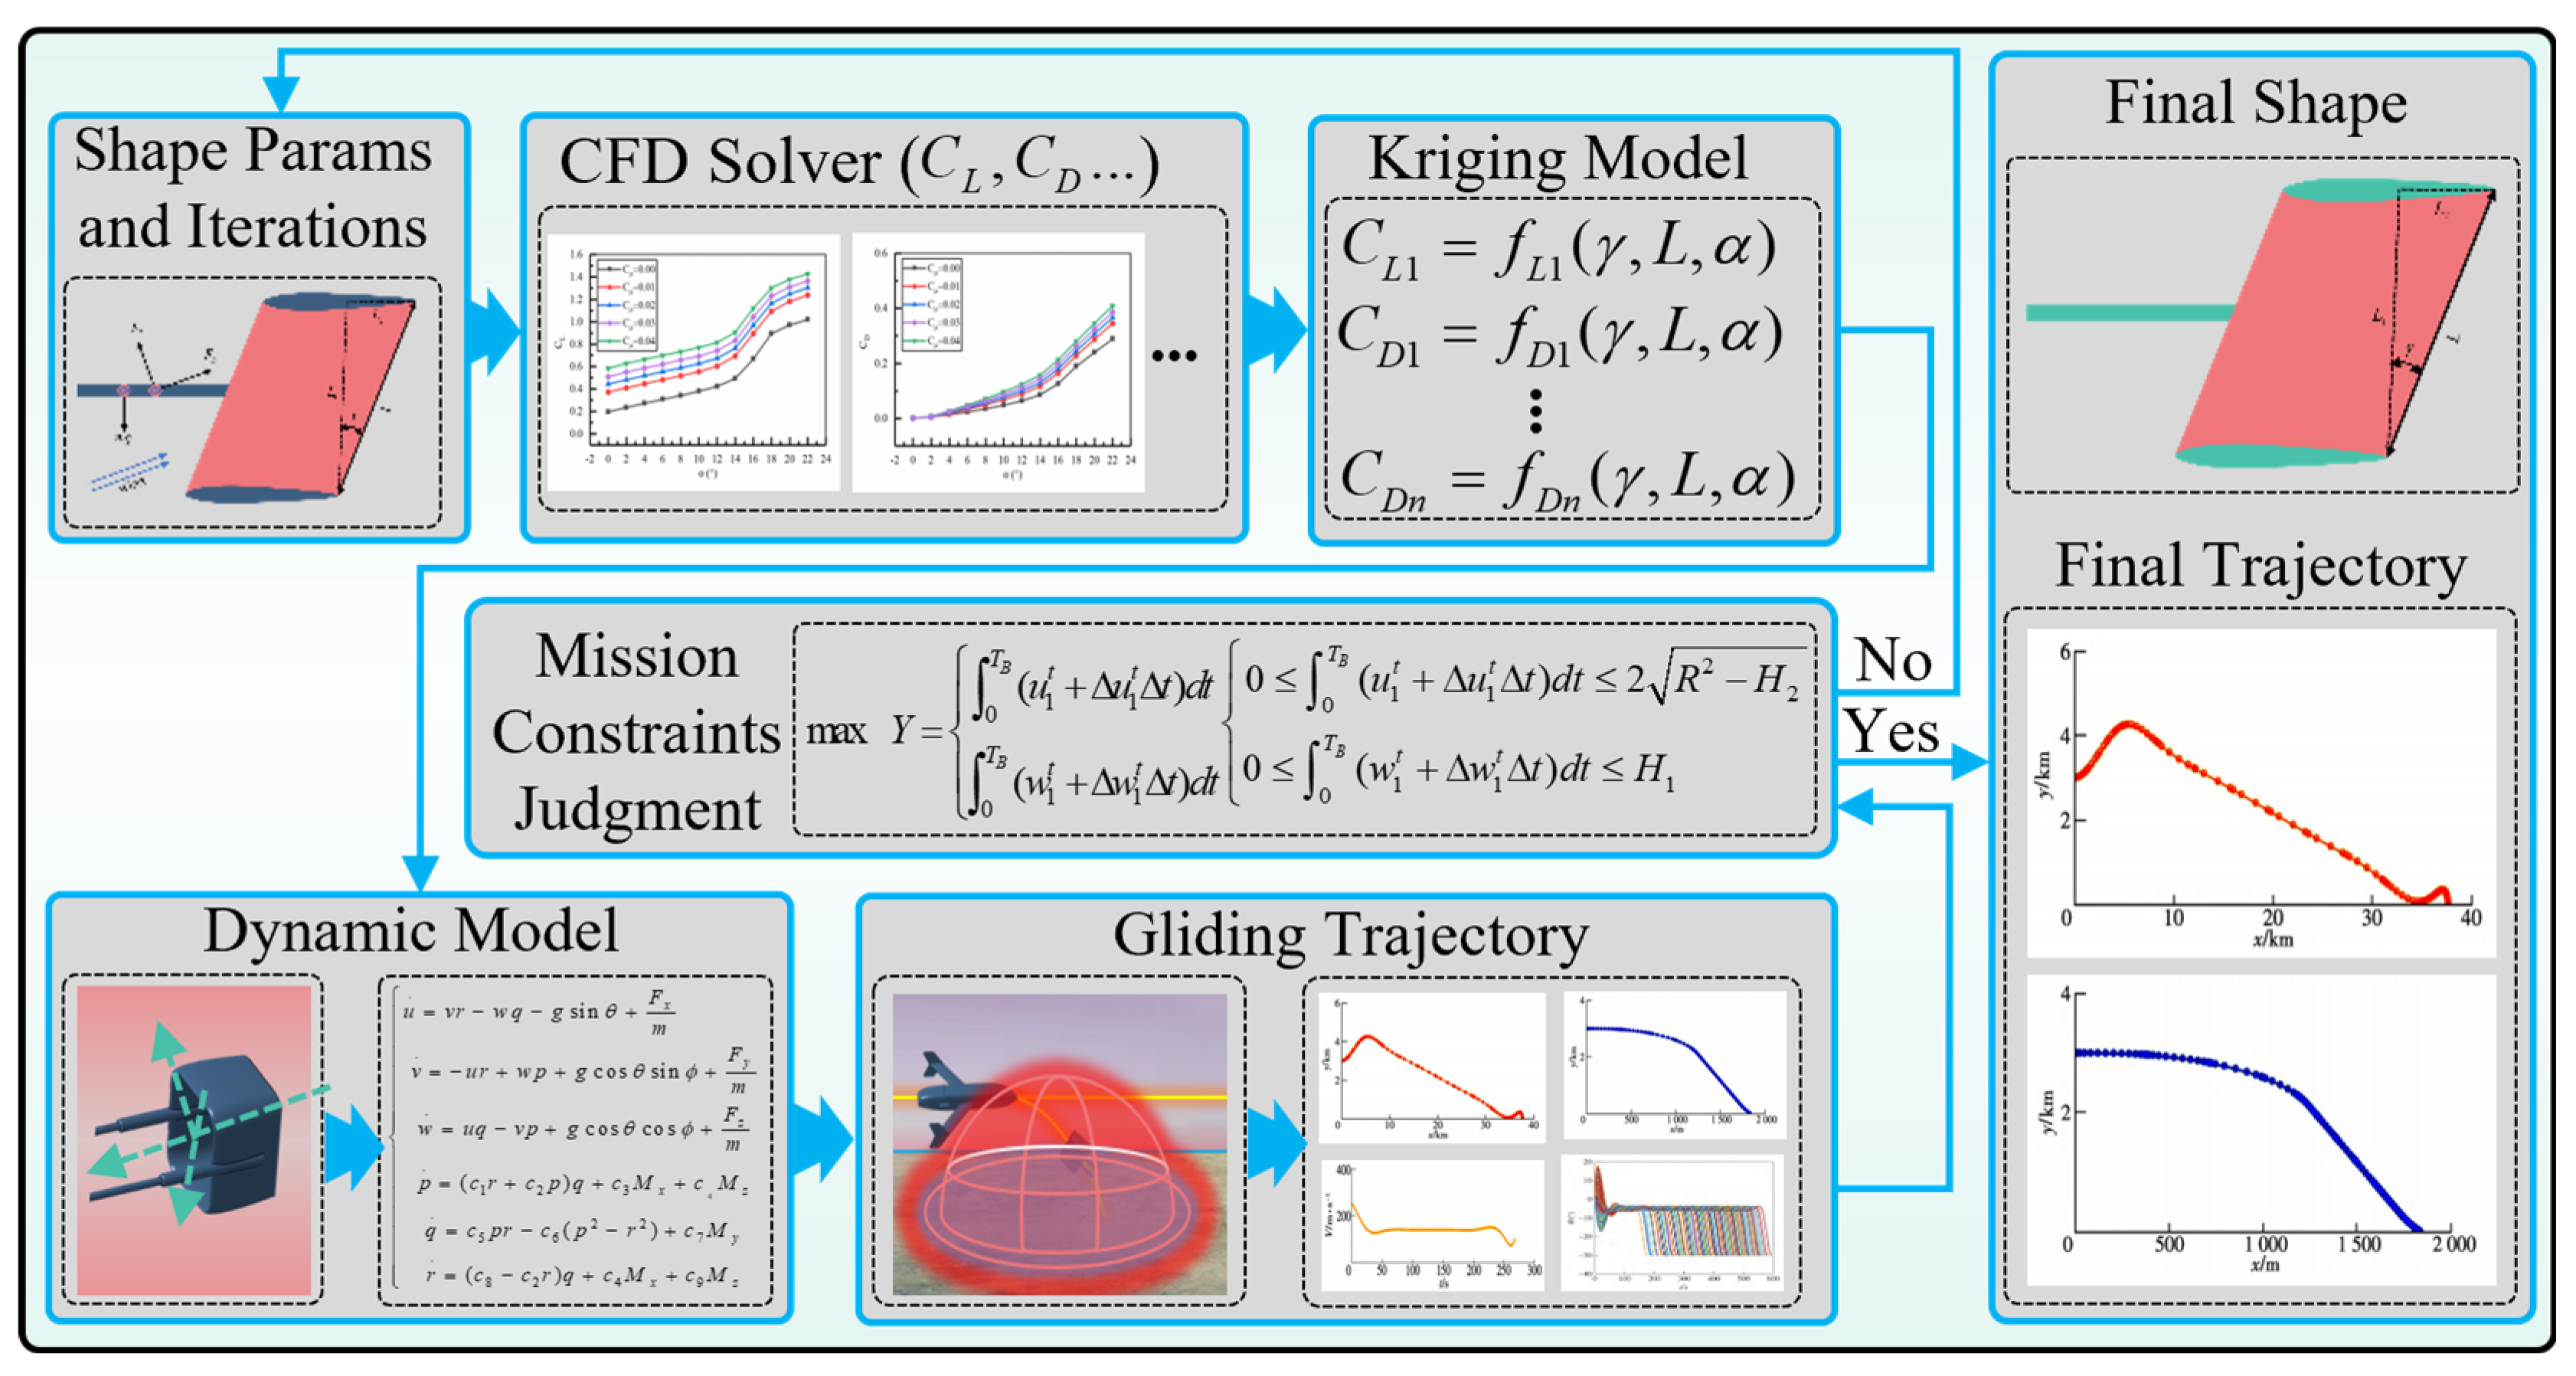
The specific optimization process is shown in Figure 4. Firstly, the steps described in Section 3.1 are followed to parameterize the shape of the tail decoy, and L 1 and L 2 are used as optimization parameters. They are divided into n equal parts within the range of L 1 min L 1 L 1 max and L 2 min L 2 L 2 max . Then, the aerodynamic parameters of the tail decoy are calculated under different shape conditions using the commercial software Ansys Fluent 2021 R1, and the spatial discretization is calculated using the Riemann–Oreskovich–Eager (ROE) format of second-order windward MUSCL (Monotone Upstream Centered Scheme for Conservation Laws) interpolation. The temporal discretization and advancement are performed using the implicit AF (Approximate Factorization) method. The coupled Shear-Stress Transport ( k ω SST) turbulence model is used to solve the Reynolds-Averaged Navier–Stokes (RANS) equations. Among them, the k ω SST turbulence model is a two-equation hybrid model that has been widely used in engineering, which uses the standard k ω model for calculations in the pure turbulence region away from the wall, and retains the robustness of the Wilcox k ω model in the near-wall region using a variety of pressure gradient boundary layer problems.
Next, the aerodynamic data under different state variables ( L 1 , L 2 , α , H , V ) are fitted using the Kriging surrogate model, and the gliding trajectory of the tail decoy is solved based on the aerodynamic data and the dynamic model of the tail decoy. The dynamic model of the gliding tail is detailed in Section 3.2. In order to be close to the real environment, the model error in Section 3.3 is introduced on the basis of the dynamic model in Section 3.2, and trajectory data of the tail decoy gliding in the air are generated. In this paper, the method for solving the tail decoy trajectory uses the glide trajectory solving software written using Qt Creator4.12.2 software. The glide trajectory solver software is detailed in Section 4.1.
Finally, the trajectory data are examined to see whether they satisfy the task constraints constructed in Section 3.3. If the task constraint conditions are met and the trajectory range is the maximum, the shape and trajectory data at this time are the final tail shape and trajectory. If the above conditions are not met, iterative calculations are performed again.

4. Analysis of Simulation Calculations and Results

4.1. Gliding Trajectory Simulation Software

As shown in Figure 5, the trajectory simulation software is a flight trajectory simulation software developed based on the gliding tail model. It is an important computational tool for comprehensive optimization of a gliding tail. This software integrates the aerodynamic model, dynamic model, system model deviation, aerodynamic deviation, meteorological deviation, and other elements of the gliding tail, including parameter settings, aerodynamic data loading, trajectory data visualization, trajectory data saving, and other modules. Based on the initial deployment conditions and aerodynamic data set by the gliding tail, the gliding trajectory of the tail in the air can be simulated and generated.

4.2. Influence of Initial Deployment Conditions on Trajectory of Tail Wing

Assuming that the UAV needs to complete a penetration within 10 s after releasing the tail decoy, and that the tail decoy will undergo unpowered gliding flight, the initial deployment conditions will directly affect the gliding trajectory of the tail decoy in the air. Selecting the pre-optimized shape of the tail as the research object, we analyzed the effect of the initial deployment conditions on its gliding trajectory; the shape data of the research object are shown in Table 2.

4.2.1. Impact of Deployment Posture Angle

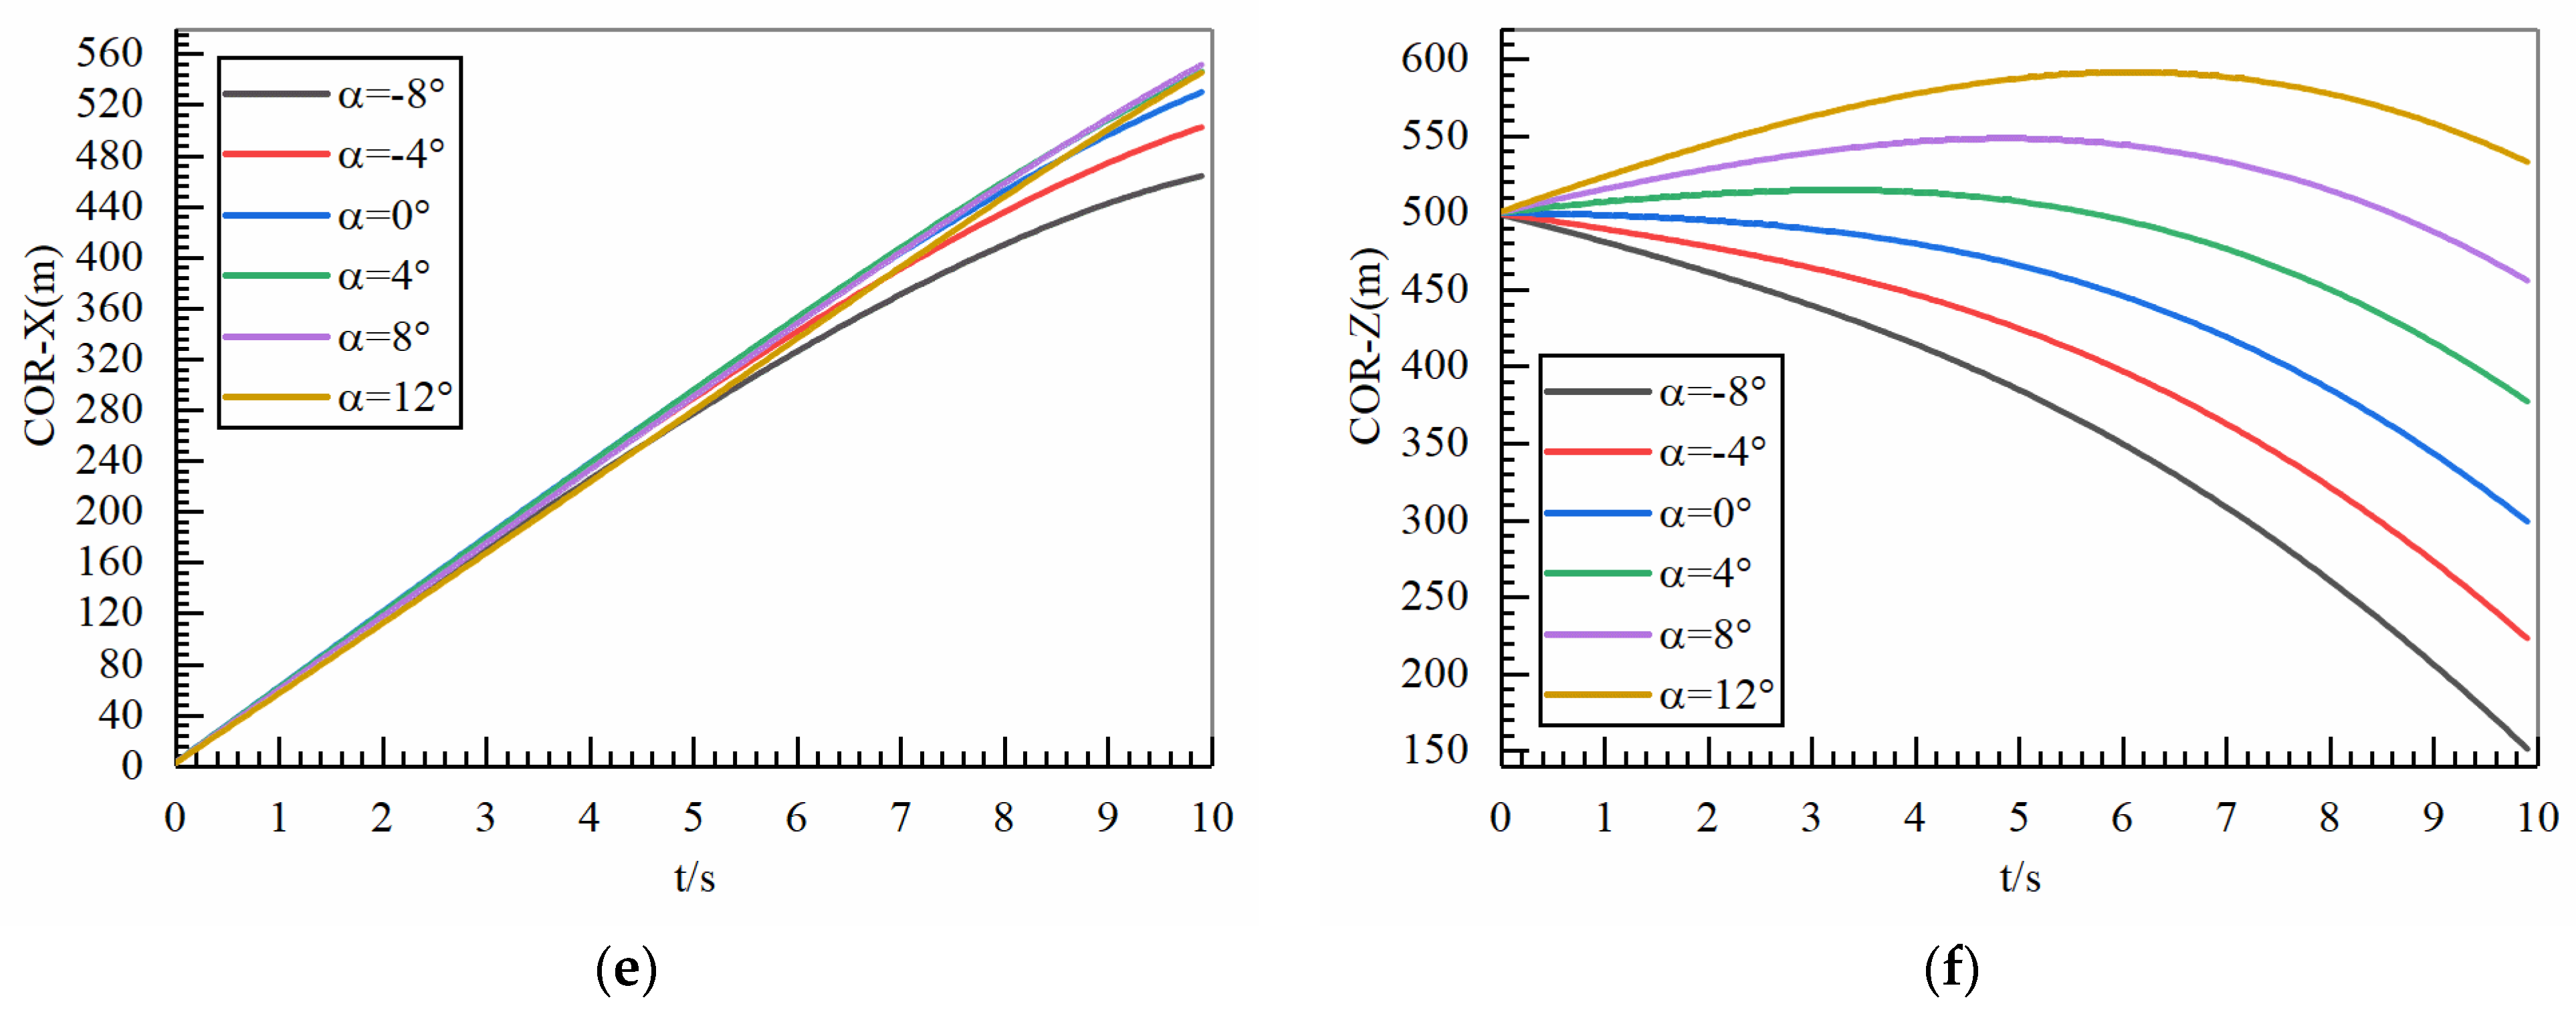
Firstly, the initial velocity of the tail after being deployed is 60 m/s, and the initial height is 500 m. The impact of the deployment posture angle on the trajectory of the tail is analyzed, where the posture angle represents the angle between the chord line in the tail and the horizontal plane. As shown in Figure 6a, when the delivery time t = 0 s, as the delivery posture angle gradually increases, the velocity of the ducted tail wing in the X-axis direction gradually decreases. When the deployment time t = 10 s, after the UAV body flies through the defense, the maximum speed of the tail wing in the X-axis direction is achieved when the initial deployment posture angle of the tail wing is 4°. When the initial deployment posture angle of the tail wing is −8°, the speed of the tail wing in the X-axis direction is the smallest. Moreover, the velocity of the tail decoy in the X-axis direction is generally greater than the other deployment posture angles at time t = 0 s~10 s and with an initial deployment posture angle of 4°. As shown in Figure 6b, when the deployment time t = 0 s, as the deployment posture angle gradually increases, the velocity of the ducted tail wing in the Z-axis direction gradually increases. However, due to the influence of gravity, the velocity of the tail wing in the Z-axis direction decreases with an increase in gliding time. When the simulation time t = 10 s, after the UAV body flies through the defense, and when the initial deployment posture angle of the tail wing is 12°, the speed of the tail wing in the Z-axis direction is the highest, indicating that a 12° deployment posture angle is more conducive to the tail wing obtaining a higher gliding height. As shown in Figure 6c, by further analyzing the gliding speed of the tail, it is found that the gliding speed of the tail decreases as the deployment posture angle increases. By analyzing Figure 6d, as the posture angle of the tail fin increases, the posture angle decreases with the same gradient during tail glide. It is found that under different initial deployment posture angle conditions, the change in the posture angle of the tail wing during gliding shows a consistent trend. By analyzing Figure 6e, it is found that when the initial deployment angle is 4°, the tail has the maximum gliding range within 10 s, reaching 547.3 m. However, by analyzing Figure 6f, it is found that when the initial deployment angle is 12°, the maximum gliding height of the tail at 10 s is more favorable for the tail to glide in the air.

4.2.2. Impact of Deployment Speed

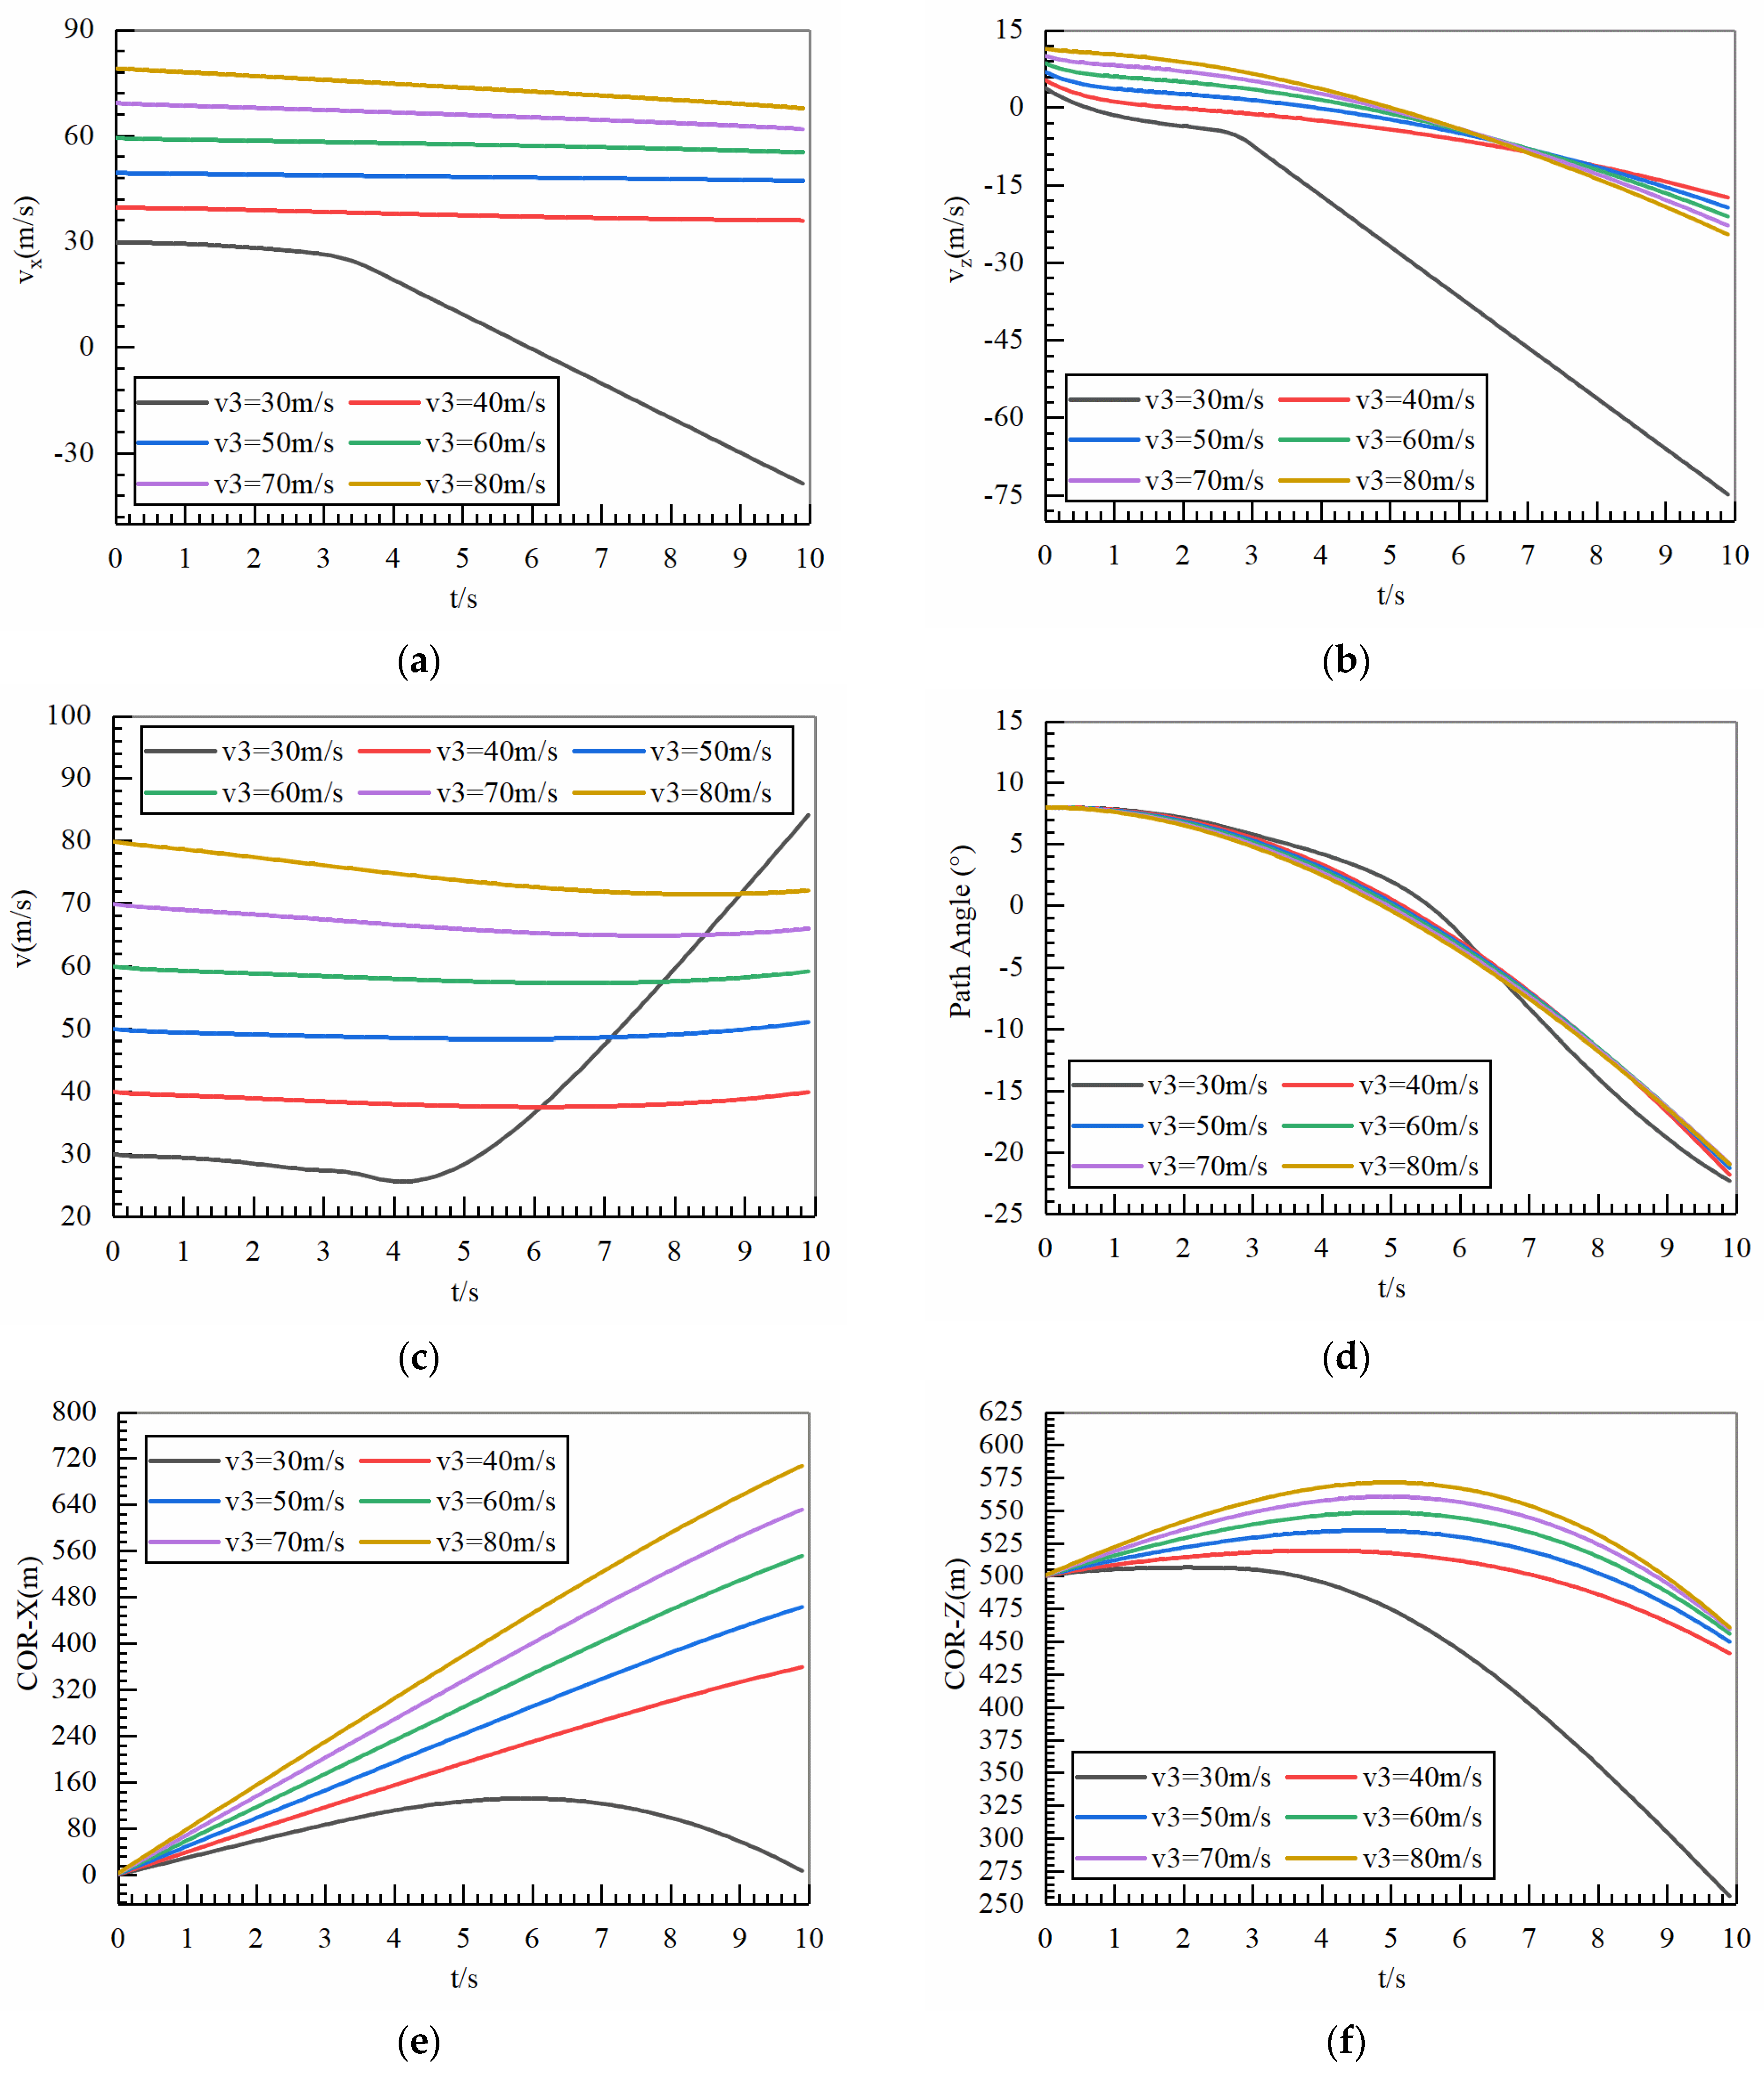
Firstly, the tail fin is deployed at a height of 500 m with a deployment posture angle of 4°, and the impact of deployment speed on the tail fin trajectory is analyzed. As shown in Figure 7a, as the deployment speed gradually decreases from 80 m/s to 30 m/s, the velocity of the tail decoy in the X-axis direction gradually decreases. Especially when the deployment speed is 30 m/s, after 3 s of deployment, the speed in the X-axis direction of the tail decoy rapidly decreases, and even a negative X-axis speed phenomenon occurs, indicating that the tail fin has a U-turn phenomenon in the air, which is not conducive to its gliding in the air. As shown in Figure 7b, when the deployment time t = 0 s, with a gradual increase in deployment speed, the velocity of the tail decoy in the Z-axis direction gradually increases. However, due to the influence of gravity and aerodynamic forces at different angles of attack, the velocity of the tail decoy in the Z-axis direction decreases with an increase in gliding time. When the simulation time t = 10 s, after the UAV body flies through the defense, the maximum speed of the tail wing in the Z-axis direction is achieved when the initial deployment speed of the tail wing is 40 m/s. As shown in Figure 7c, through further analysis of the gliding speed of the tail wing, it is found that as the speed increases, and due to the unpowered gliding of the tail wing, its gliding speed gradually decreases. However, when the deployment speed is 30 m/s, the aerodynamic force generated is not sufficient to overcome gravity and glide in the air. Gravity is the main factor, so the gliding speed of the tail wing increases instead. By analyzing Figure 7d, it can be found that the trend of the posture angle change during tail gliding is consistent with the increase in tail deployment speed. However, an exception is made when the deployment speed v = 30 m/s. Compared with other deployment speeds, the posture angle of the tail is more variable in the gliding process, because the tail glides at a smaller speed and does not generate enough lift to overcome its own gravity. By analyzing Figure 7e, it is found that when the initial deployment speed is 80 m/s, the tail fin has the maximum gliding range within 10 s, reaching up to 703 m. By analyzing Figure 7f, it is found that when the initial deployment speed is 40 m/s, the maximum gliding height of the tail fin occurs at 10 s, which is more conducive to the tail fin gliding in the air.
When the tail fin is deployed at a height of 500 m and the deployment posture angle increases to 8°, the impact of deployment speed on the tail fin trajectory is analyzed. As shown in Figure 8a, as the deployment speed gradually decreases from 80 m/s to 30 m/s, the variation trend of the velocity of the tail in the X-axis direction is similar to that seen in Figure 7a. As shown in Figure 8b, with a gradual increase in deployment speed, the velocity of the ducted tail wing in the Z-axis direction gradually increases, and the trend of velocity change in the Z-axis direction is similar to that seen in Figure 7b. As shown in Figure 8c, through further analysis of the gliding speed of the tail wing, it can be seen that the trend of speed change is similar to that seen in Figure 7c. By analyzing Figure 8d, it can be seen that as the speed of tail fin deployment increases, the posture angle gradually decreases during the gliding process of the tail fin, which is consistent with Figure 7d. By analyzing Figure 8e, it is found that when the initial deployment speed is 80 m/s, the tail fin has the maximum gliding range within 10 s, reaching 718 m, and the trend of change is similar to that seen in Figure 7e. By analyzing Figure 8f, it is found that when the initial deployment speed is 80 m/s, the tail fin has the highest gliding height at 10 s, which is more conducive to gliding in the air. This indicates that although deployment speed is the main factor affecting gliding range and altitude, an 8° deployment posture angle is more conducive to obtaining a larger gliding height at a deployment speed of 80 m/s.

4.3. Comprehensive Verification of Tail Optimization

It was assumed that the radius of the enemy’s defense area was 707 m and the UAV’s flight speed was 100 m/s. According to the impact of the deployment factors on the gliding trajectory, as described in Section 4.2, a deployment speed of 60 m/s and a deployment posture angle of 8° were selected. Then, the shape of the tail wing and gliding trajectory were optimized according to the optimization process in Section 3.4. The optimized tail shape is shown in Table 3. At this point, the optimized trajectory was compared to the trajectory before optimization (L1 = 100% L, L2 = 0% L), as shown in Figure 9.
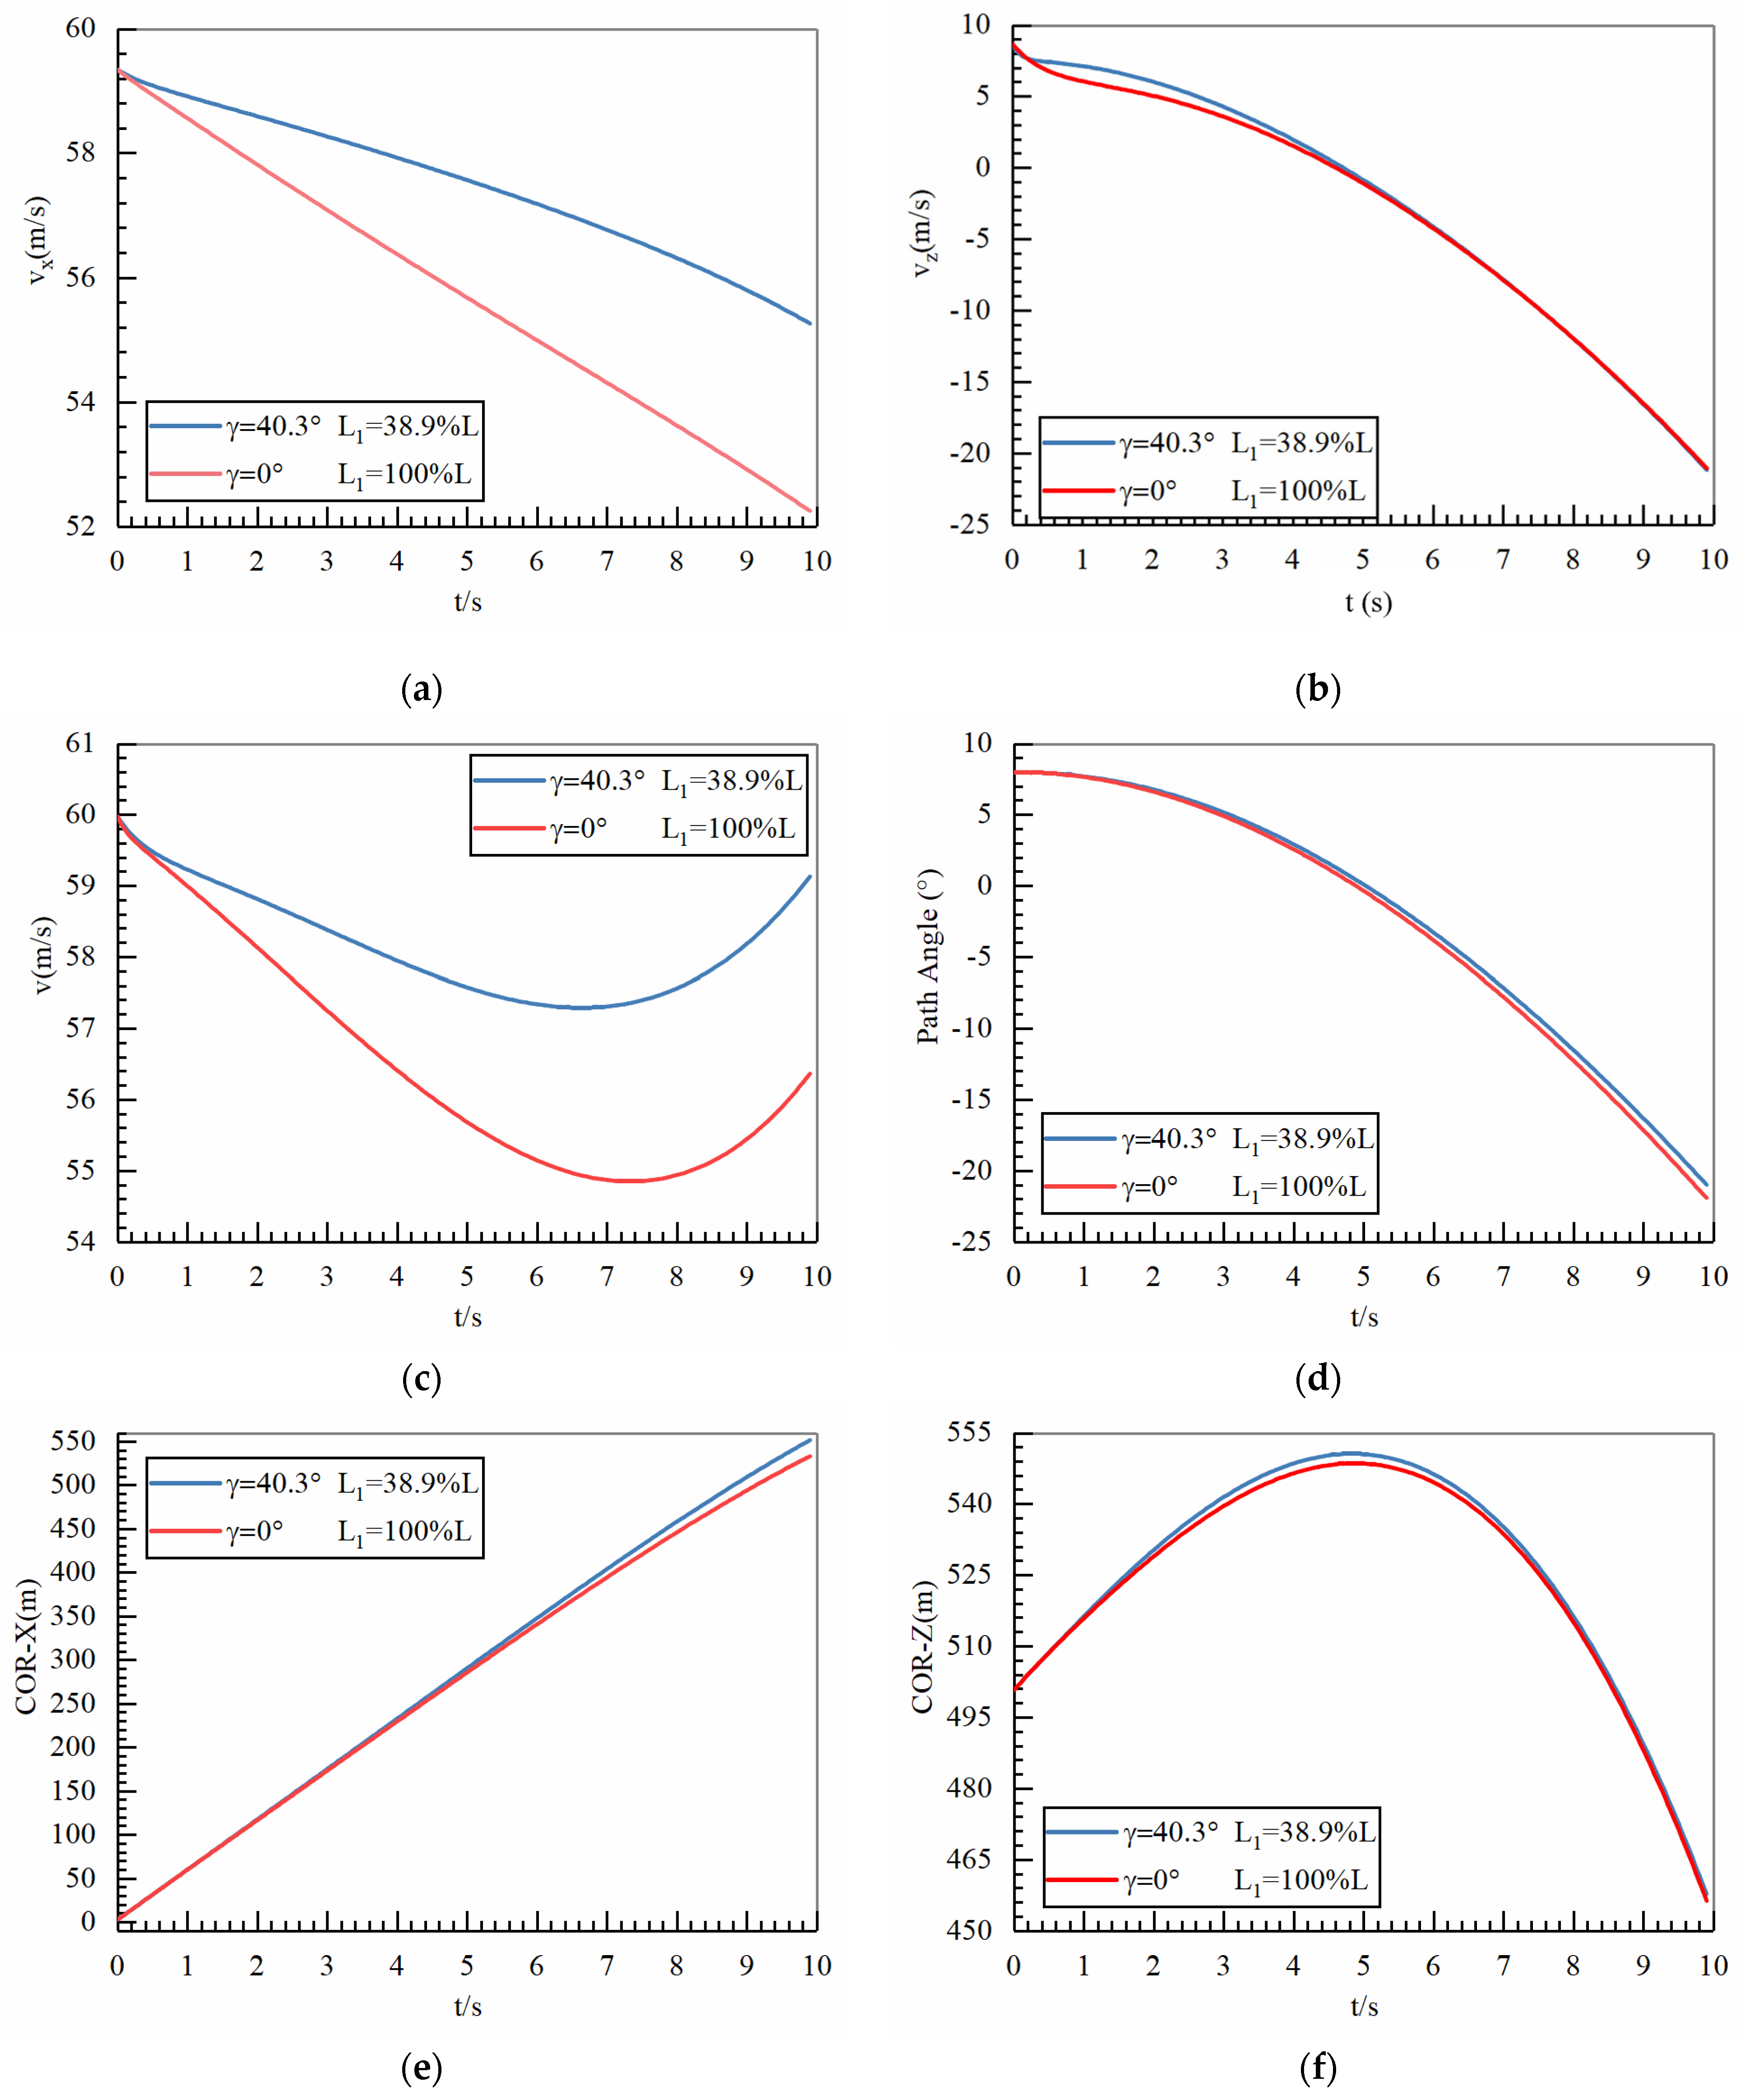
As shown in Figure 9a, the rate of the decrease in velocity of the optimized trajectory in the X-axis direction slows down, and the overall velocity in the X-axis direction is larger than that before the optimization, which is more conducive to the tail gliding for a longer distance. As shown in Figure 9b, the velocity of the optimized trajectory in the Z-axis direction is greater than that of the initial trajectory before t = 5 s. At this time point, the angle of attack of the ducted tail is between 0 and 8°, indicating that within this range, the lift coefficient of the optimized tail is greater than that of the pre-optimized tail. As shown in Figure 9c, further analysis of the speed of the tail wing during gliding in the air reveals that the optimized gliding speed is higher than the pre-optimization gliding speed, which is beneficial for enabling the tail wing to glide longer distances and heights in the air, and to gain sufficient time for the UAV’s penetration. Further analysis of the changes in the trajectory inclination angle of the tail wing during gliding, as shown in Figure 9d, shows that the trend of change is consistent between the optimized and pre-optimized trajectory inclination angles, indicating that the optimized trajectory does not have a significant impact on the tail wing gliding posture, which is beneficial for enabling the tail wing to glide smoothly, without sudden changes in posture angle. As shown in Figure 9e, the optimized trajectory has a larger gliding distance, with a 4.2% increase in gliding distance. As shown in Figure 9f, the optimized flight trajectory is also higher than the pre-optimization one in the altitude direction. Overall, under the same deployment conditions, the shape of the optimized tail is more conducive to its gliding in the air.
In order to further analyze the mechanism involved, the aerodynamic parameters of the tail decoy were calculated under the conditions of a deployment speed of 60 m/s using the commercial software Ansys Fluent 2021 R1, and the spatial discretization was calculated using the Riemann–Oreskovich–Eager (ROE) format of second-order windward MUSCL (Monotone Upstream Centered Scheme for Conservation Laws) interpolation. The temporal discretization and advancement were performed using the implicit AF (Approximate Factorization) method. The coupled Shear-Stress Transport ( k ω SST) turbulence model was used to solve the Reynolds-Averaged Navier–Stokes (RANS) equations. Among them, the k ω SST turbulence model is a two-equation hybrid model that has been widely used in engineering, which uses the standard k ω model for calculations in the pure turbulence region away from the wall, and retains the robustness of the Wilcox k ω model in the near-wall region using a variety of pressure gradient boundary layer problems.
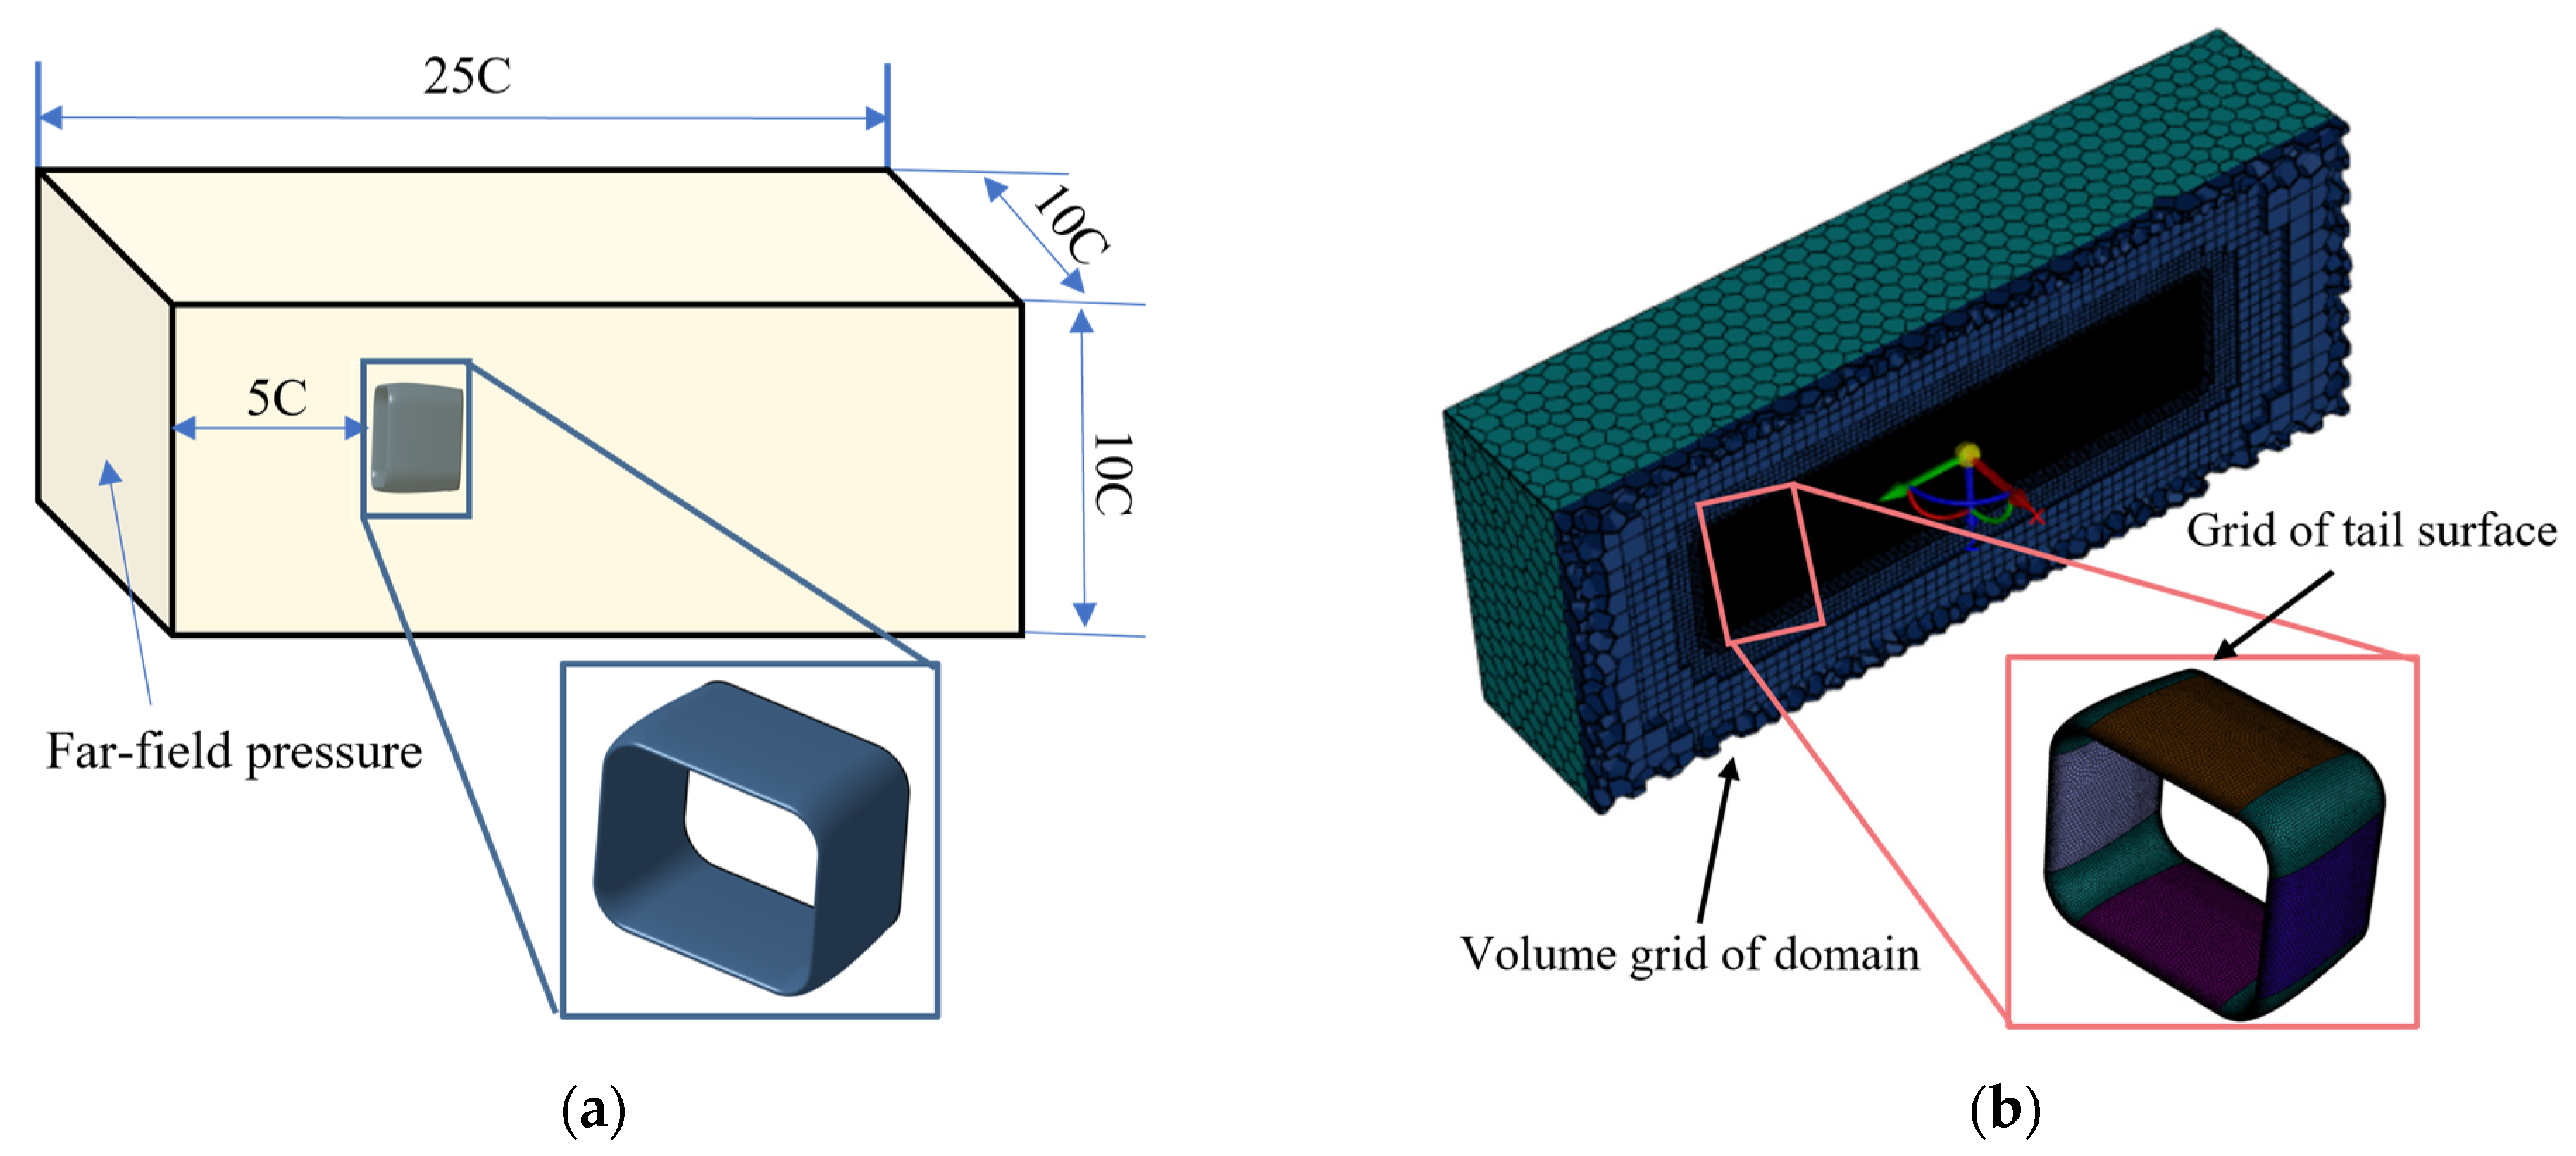
When solving for the aerodynamic parameters using Ansys Fluent 2021 R1, in order to verify whether the meshing and numerical simulation methods were independent of each other, the tail before optimization was selected as the verification object. Reference [25] points out that in any CFD study, selecting the appropriate domain size and shape is important, and the domain should be large enough to induce turbulence dissipation and wake and wing tip vortex formation effects, causing reverse/backflow. As shown in Figure 10a, the computational domain is a rectangular body. The boundary conditions of the computational area are far-field pressure, and the walls are bounded by a no-slip mesh. By using the chord length C = 0.2 m, the height, lateral length, and width of the computational domain are 10 C, 25 C, and 10 C, respectively. Figure 10b shows the mesh model, which adopts the Poly-Hexcore unstructured hybrid mesh, and the thickness of the first layer of the wall is 3 × 10⁻⁶ m. Taking into account factors such as the geometric dimensions, boundary conditions, computational accuracy, and computational resources of the tail decoy, local mesh encryption was performed around the tail.
Then, computational mesh models with different sparsities were established, and mesh-independence verification and numerical simulation accuracy assessments were carried out. Typical operating conditions were selected for validation, specifically a height of H = 500 m, an inlet velocity of 60 m/s, a reference area of S = 0.04 m2, and an angle of attack of α = 8°. Table 4 lists the aerodynamic parameters calculated from different precision meshes. Taking the results of the fine mesh calculation as a reference, the error of the lift coefficient calculated by the medium mesh is small, within 1.02%. The drag coefficient has an error of 3.23%, which is related to the large gap between the grid height of the boundary layer and the grid scale of the refined area. Considering the computational efficiency, this paper selects the medium meshes as the subsequent computational meshes.
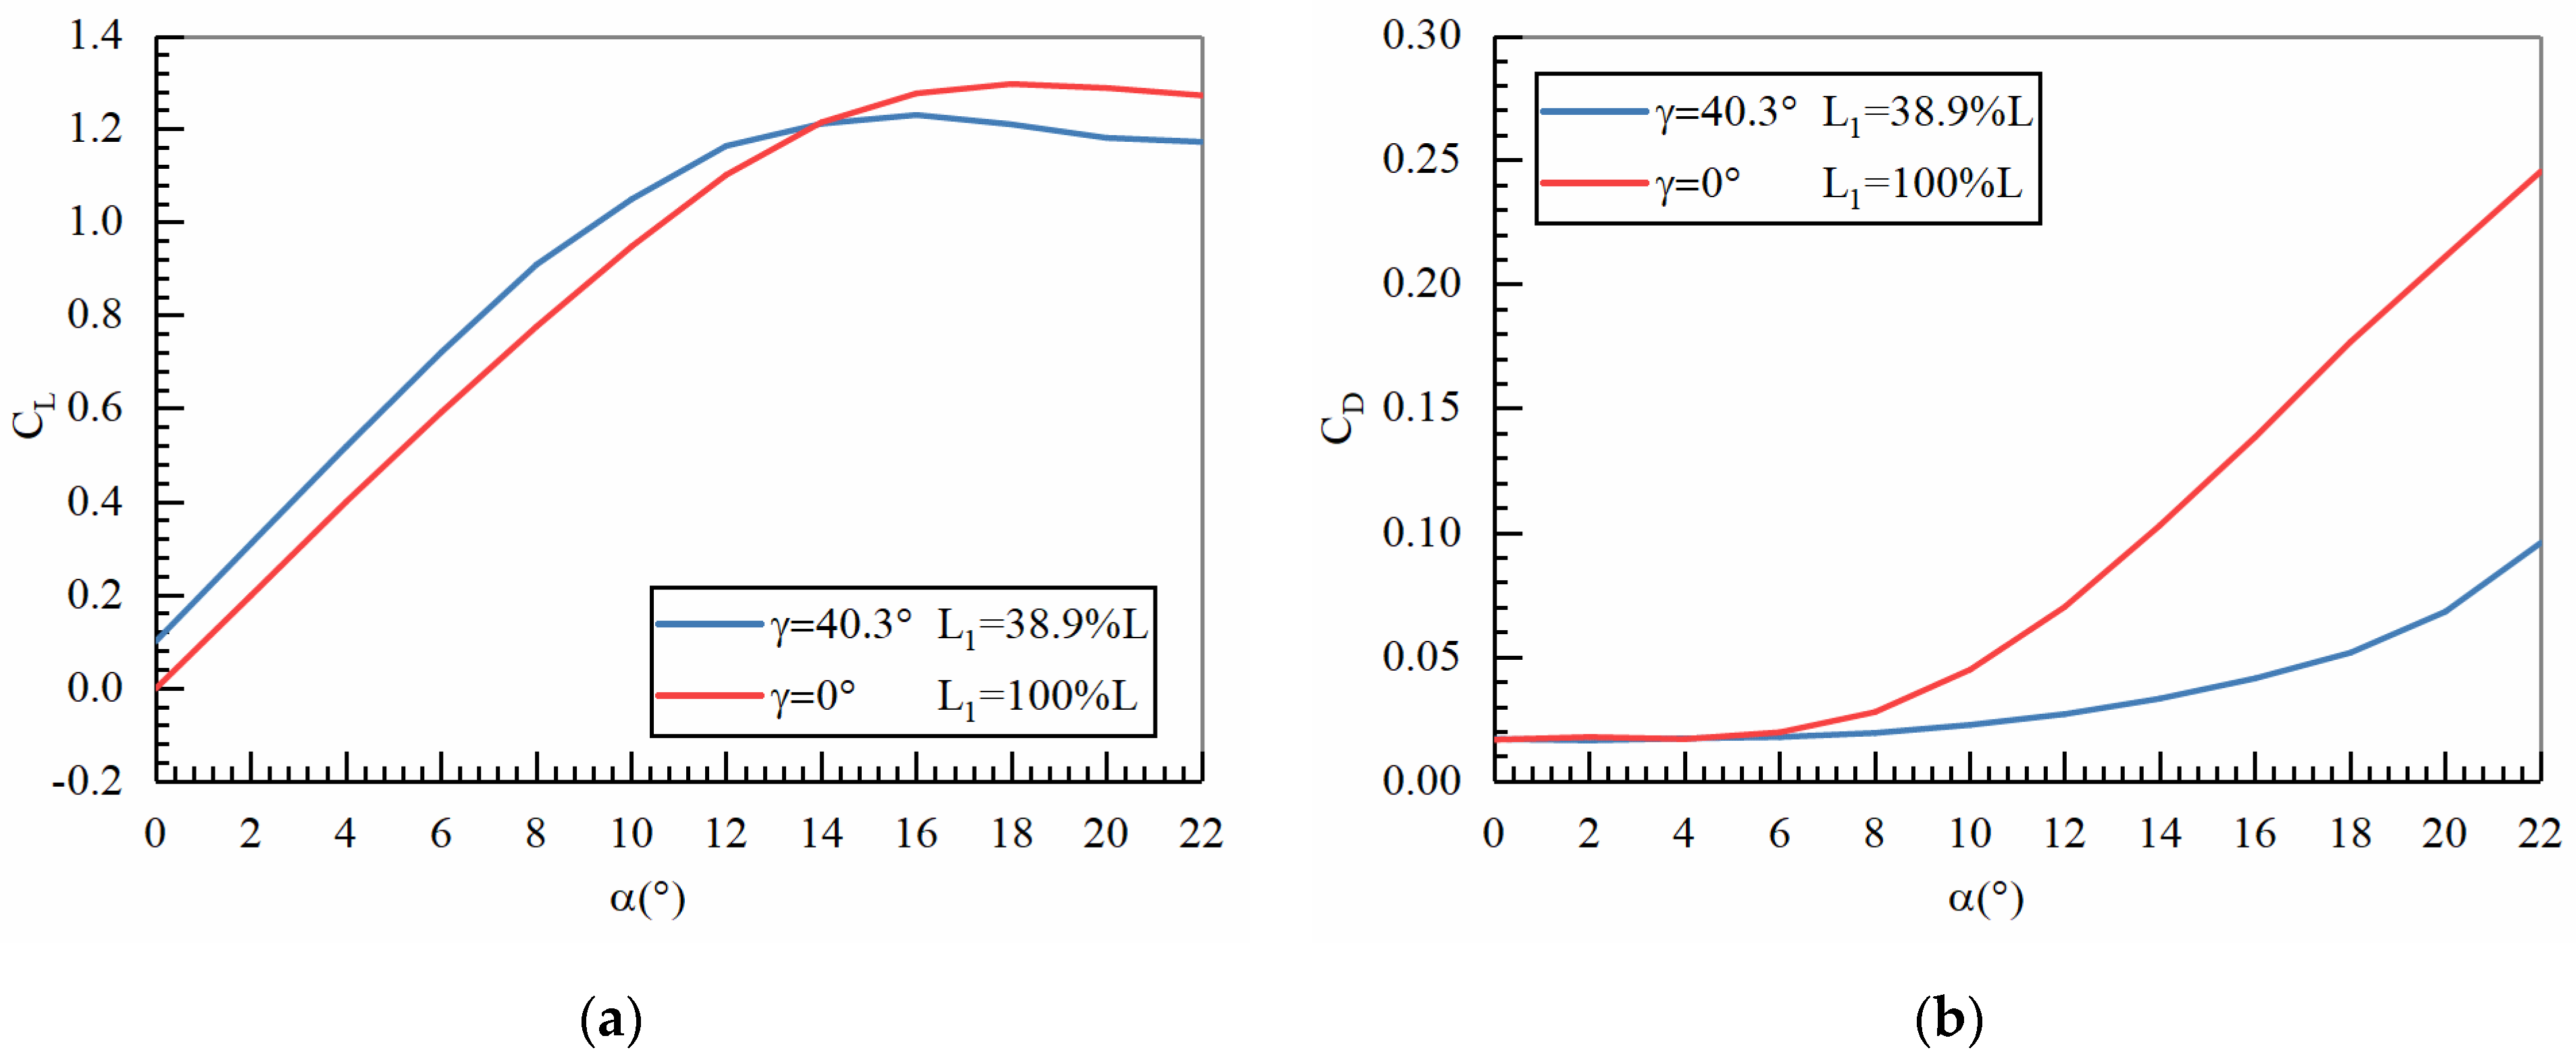
After verifying mesh-independence, the aerodynamic performance of the tail shape before and after optimization at different angles of attack was compared and analyzed. As shown in Figure 11a, after optimizing the shape of the tail wing, the lift coefficient increases in the range of 0°~14°, but decreases with an angle of attack of 14°. As shown in Figure 11b, the difference in the drag coefficient is not significant within the range of 0°~10°. At high angles of attack, the optimized tail drag coefficient decreases. In summary, due to the improved lift coefficient and reduced drag coefficient of the optimized tail, the gliding distance of the optimized tail is longer.
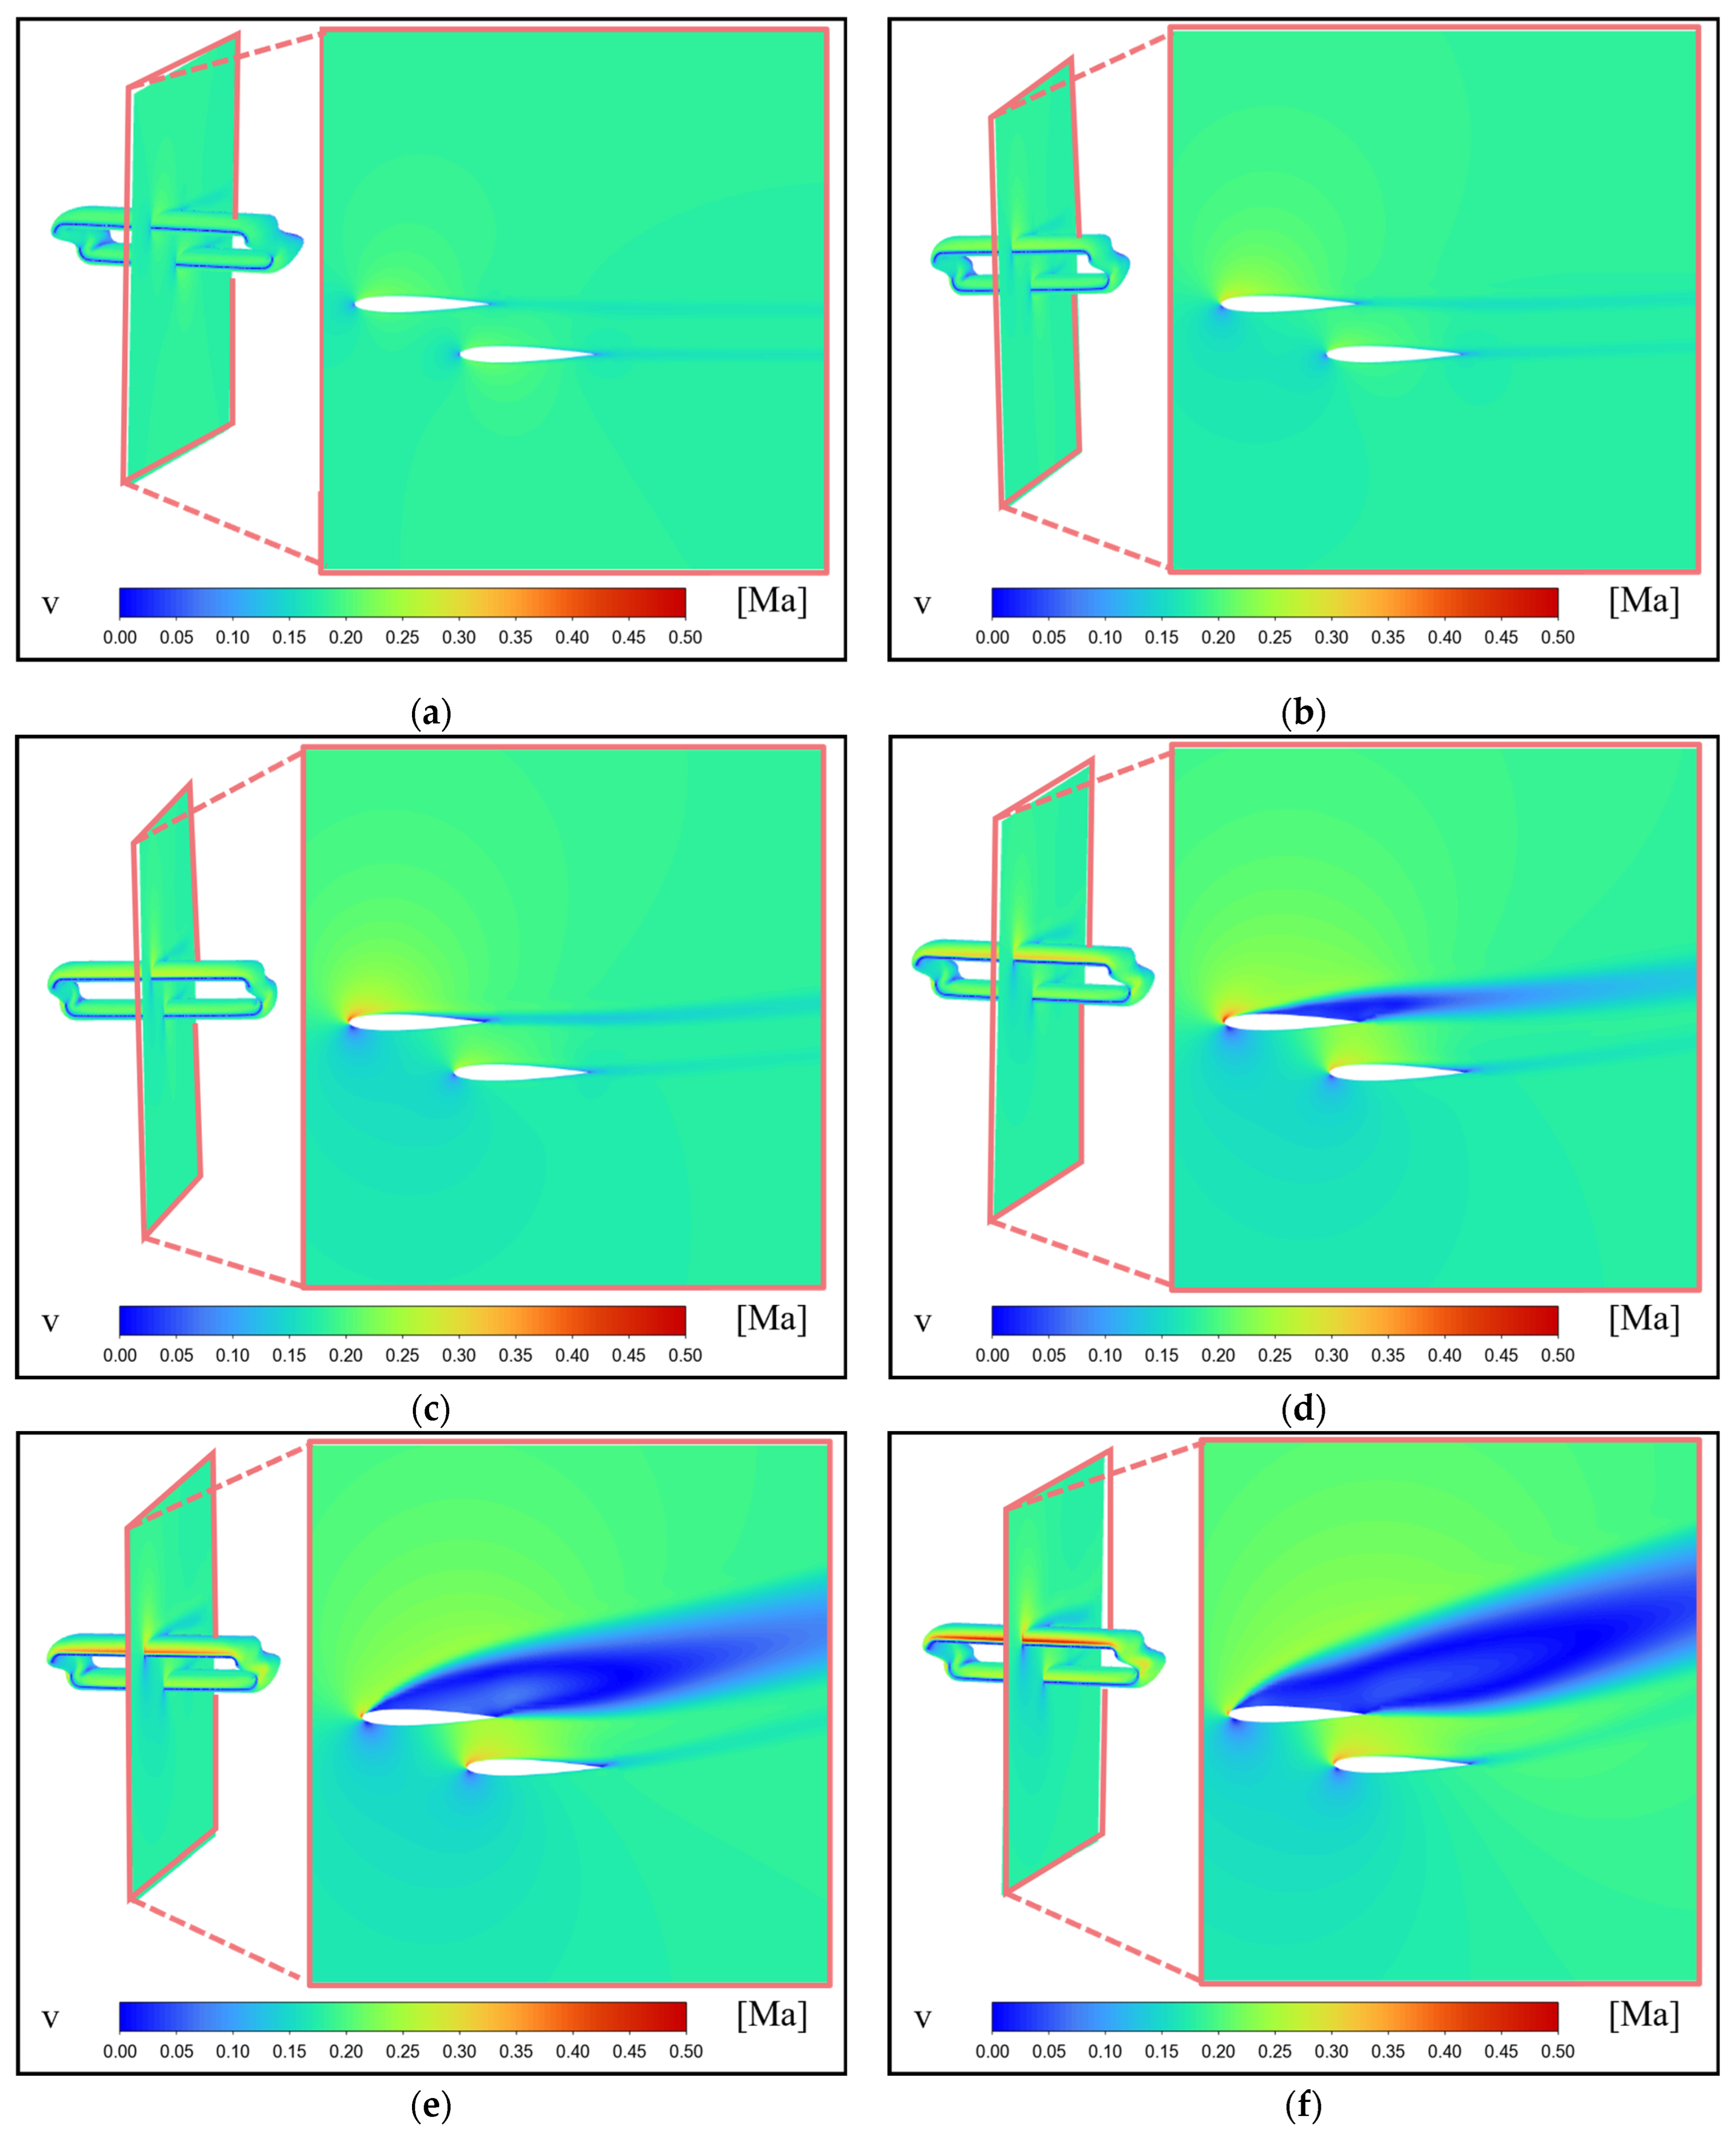
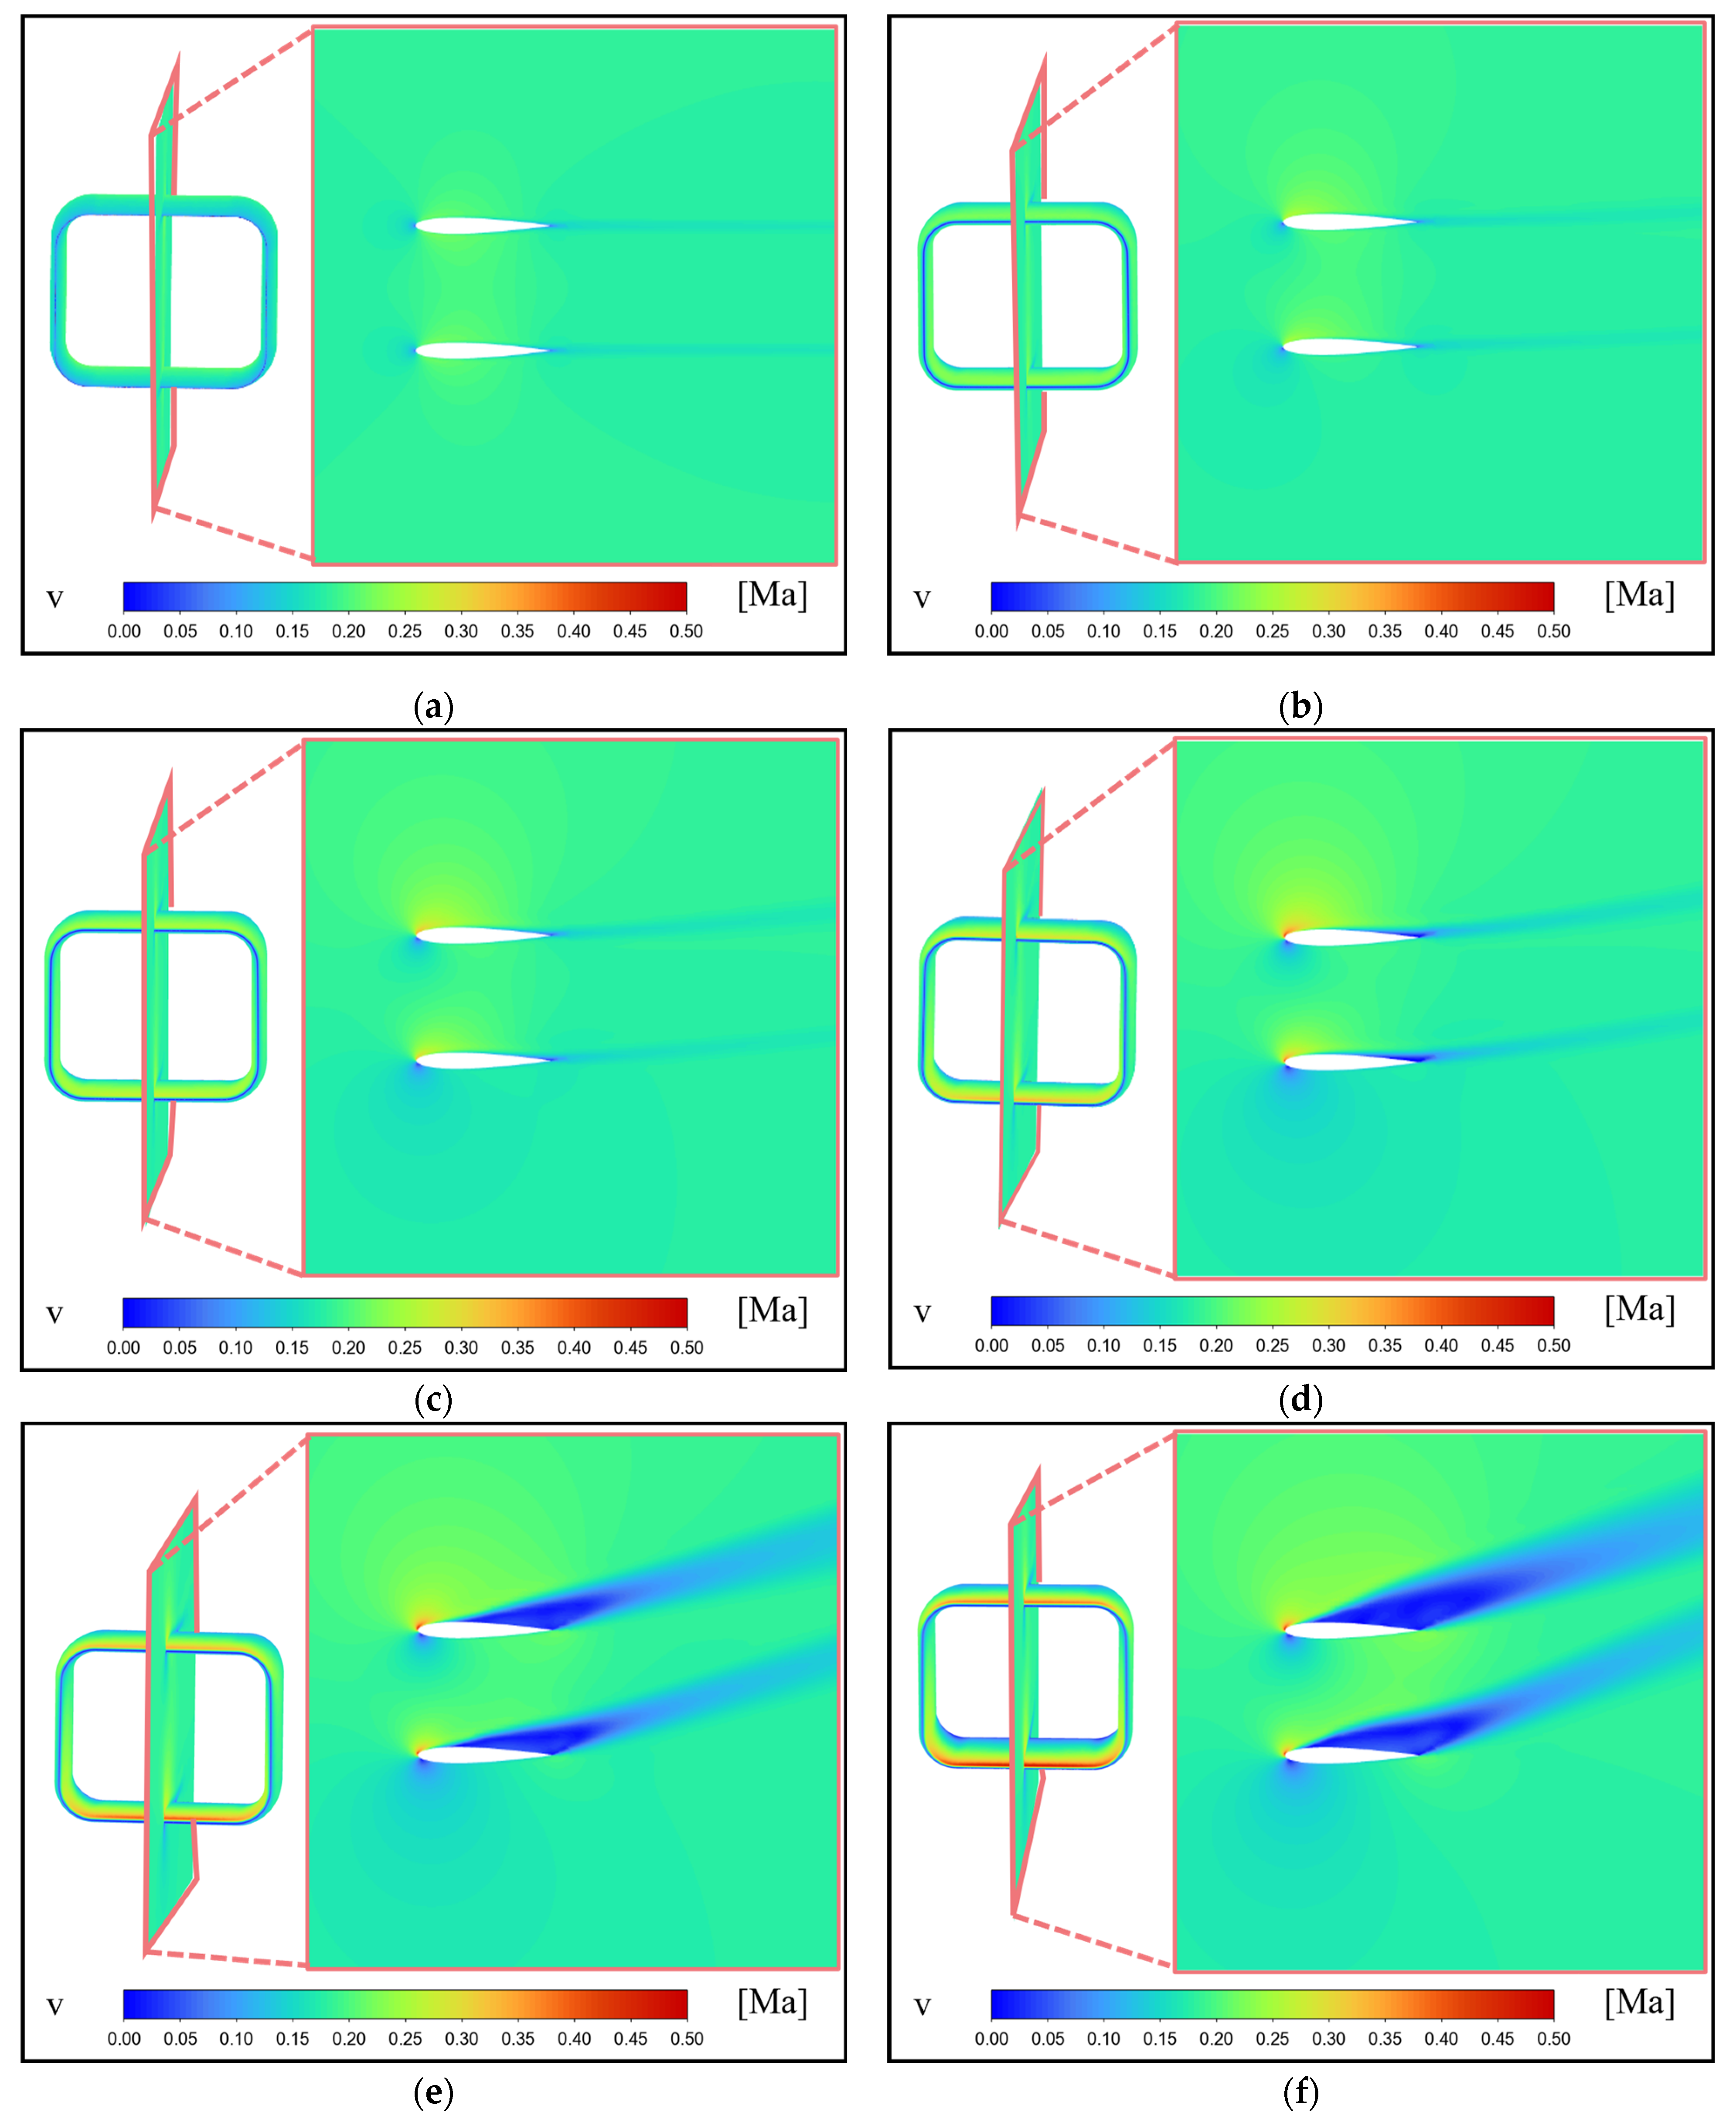
In order to further analyze the reasons for the increase in lift coefficient caused by the optimized shape of the tail wing, a comparative analysis was conducted on the velocity cloud maps of the optimized tail wing and the original tail wing at an incoming flow velocity of 60 m/s. As shown in Figure 12a, after optimization, the duct formed between the upper and lower wing surfaces narrows, causing the airflow to accelerate inside the duct, and resulting in a velocity difference between the upper and lower wing surfaces of the tail at a 0° angle of attack, which, in turn, generates a pressure difference, allowing the tail to generate a lift coefficient at a 0° angle of attack. As shown in Figure 12b–d, with an increase in the angle of attack, the velocity difference between the upper and lower wing surfaces of the tail gradually increases, and the lift coefficient also gradually increases, until the angle of attack reaches 12°. The upper wing surface of the tail experiences a stall phenomenon, but the lower wing surface does not, causing the lift coefficient to continue to increase. As shown in Figure 12e,f, as the angle of attack continues to increase, the upper wing surface of the tail completely stalls. Although the lower wing surface does not stall, the lift coefficient of the lower wing surface is canceled out by the stalling effect of the upper wing surface, resulting in a decrease in the overall lift coefficient of the tail in an angle of attack range of 16°~20°.
The velocity cloud map before tail optimization is shown in Figure 13. In the 0° angle of attack state (as shown in Figure 13a), the distance between the upper and lower wing surfaces of the tail is large, and the acceleration effect of the airflow in the duct is not significant. Compared with Figure 12a, there is no velocity difference between the upper and lower wing surfaces of the pre-optimized tail at a 0° angle of attack. Therefore, the lift coefficient of the optimized tail at a 0° angle of attack is greater than that of the pre-optimized tail. As shown in Figure 13b–d, as the angle of attack increases, the velocity difference between the upper and lower wing surfaces of the tail gradually increases, until the angle of attack reaches 12°. At the same time, stalling occurs on both the upper and lower wing surfaces of the tail. The lift coefficient of the pre-optimized tail in the angle of attack range of 0° to 12° is smaller than that of the optimized tail. As shown in Figure 13e,f, as the angle of attack continues to increase, the stalling area on the upper and lower wing surfaces of the tail increases, but it is not completely stalled. Compared with Figure 12e,f, the stalling area is smaller, resulting in a higher overall lift coefficient of the tail wing than the optimized lift coefficient in the angle of attack range of 16°~20°.
In summary, by optimizing the shape and gliding trajectory of the ducted tail, it is possible to improve the aerodynamic performance of the gliding tail, while obtaining a gliding trajectory with a longer range, providing sufficient deception time for the UAV body to penetrate.

5. Conclusions

This article proposes a tail decoy that mimics the gecko tail cutting phenomenon. Taking the tail decoy as the research object, an optimization framework for the shape and trajectory of the tail decoy is established. We have developed a trajectory calculation software for gliding tail fins, analyzed the influence of gliding tail fin deployment conditions on gliding trajectory, and, based on the optimization method proposed in this paper, achieved dual optimization of gliding tail fin shape and gliding trajectory through simulation. The conclusions are as follows:
(1)
The overall optimization architecture of the three-layer pyramid tail decoy established in this article integrates the task driven layer, aerodynamic and trajectory coupling optimization layer, parameterized modeling, and surrogate model layer, providing a top-level design architecture for the coupling optimization of the aerodynamic shape and gliding trajectory of the tail decoy.
(2)
Selecting the pre-optimized ducted tail shape as the research object, the influence of deployment speed and deployment posture angle on the tail trajectory was analyzed. It was found that a deployment speed of 60 m/s and a deployment posture angle of 8° were more conducive to the tail obtaining a larger gliding distance. In addition, the optimization method of the gliding tail in this article was verified. It was found that using the optimization method proposed in this article, after optimizing the shape of the gliding tail, the lift coefficient increased in the range of 0°~14°, and the optimized gliding distance increased by 4.2%.

Author Contributions

Investigation, H.J. Conceptualization, H.J. and H.Z. (Hong Zhou). Methodology H.J. and S.H. Validation, H.J. and. S.H. Writing—original draft preparation, H.J. Visualization, H.Z. (Hong Zhou) and H.Z. (Huilong Zheng). All authors have read and agreed to the published version of the manuscript.

Funding

This research was funded by the National Key Laboratory Fund for Light Turbine Power (E31H890206).

Data Availability Statement

The data presented in this study are available upon request from the corresponding author.

Acknowledgments

The authors would like to sincerely thank the relevant organizations and institutions for their support of this study.

Conflicts of Interest

The authors declare no conflicts of interest.

References

  1. Deyoe, E.A.; Ulmer, J.L.; Kirchhoff, R.A. System and Method for Sensory Defect Simulation; 2010 US07788075B2, USA.
  2. Klass, P.J. IDECM’s ‘smart’ Towed Decoy Likely to Be Used Widely. Aviat. Week Space Technol. 1996, 154. [Google Scholar]
  3. Ma, D.; Liu, Y.; Lin, P. Study of Dynamic Characteristics of Aeronautic Towed Decoy System. Hangkong Xuebao/Acta Aeronaut. Astronaut. Sin. 2014, 35, 161–170. [Google Scholar]
  4. Williams, P.; Sgarioto, D.; Trivailo, P.M. Constrained Path-Planning for an Aerial-Towed Cable System. Aerospaceence Technol. 2008, 12, 347–354. [Google Scholar] [CrossRef]
  5. Ma, D.; Wang, S.; Yang, M.; Dong, Y. Dynamic Simulation of Aerial Towed Decoy System Based on Tension Recurrence Algorithm. Chin. J. Aeronaut. 2016, 29, 1484–1495. [Google Scholar] [CrossRef]
  6. Su, Z.; Li, C.; Liu, Y. Anti-Disturbance Dynamic Surface Trajectory Stabilization for the Towed Aerial Recovery Drogue under Unknown Airflow Disturbances. Mech. Syst. Signal Process. 2021, 150, 107342. [Google Scholar] [CrossRef]
  7. Mahmood, A.; ur Rehman, F. Optimal Standoff Distance of Subsonic Unpowered Gliding Vehicle. Results Control Optim. 2023, 12, 100259. [Google Scholar] [CrossRef]
  8. Pan, C. Design and Simulation of Ex-Range Gliding Wing of High Altitude Air-Launched Autonomous Underwater Vehicles Based on SIMULINK. Chin. J. Aeronaut. Astronaut. 2013, 26, 319–325. [Google Scholar] [CrossRef]
  9. Liaño, G.; Castillo, J.L.; García-Ybarra, P.L. Nonlinear Model of the Free-Flight Motion of Finned Bodies. Aerosp. Sci. Technol. 2014, 39, 315–324. [Google Scholar] [CrossRef]
  10. Hu, Y.; Gao, C.; Li, J.; Jing, W. Maneuver Mode Analysis and Parametric Modeling for Hypersonic Glide Vehicles. Aerosp. Sci. Technol. 2021, 119, 107166. [Google Scholar] [CrossRef]
  11. Liu, C.; Feng, C.; Liu, L.; Wang, T.; Zeng, L.; Li, J. Aerodynamic Shape Optimization of a Pterocarya Stenoptera Seed Based Biomimetic Aircraft Using Neural Network. Aerosp. Sci. Technol. 2024, 155, 109737. [Google Scholar] [CrossRef]
  12. Tian, X.; Zhang, H.; Zhou, H.; Zhang, L. Synthesis Optimization of Underwater Glider Motion Parameters Based on the Total Energy Consumption Model. Ocean Eng. 2024, 297, 117103. [Google Scholar] [CrossRef]
  13. Yang, M.; Wang, Y.; Yang, S.; Zhang, L.; Deng, J. Shape Optimization of Underwater Glider Based on Approximate Model Technology. Appl. Ocean Res. 2021, 110, 102580. [Google Scholar] [CrossRef]
  14. Luo, Y.; Wang, J.; Jiang, J.; Liang, H. Reentry Trajectory Planning for Hypersonic Vehicles via an Improved Sequential Convex Programming Method. Aerosp. Sci. Technol. 2024, 149, 109130. [Google Scholar] [CrossRef]
  15. Tong, X.; Song, J.; Li, W.; Xu, C. Penetration Game Strategy of High Dynamic Vehicles with Constraints of No-Fly Zones and Interceptors. Eng. Appl. Artif. Intell. 2024, 136, 109018. [Google Scholar] [CrossRef]
  16. Sahoo, S.; Dalei, R.K.; Rath, S.K.; Sahu, U.K. Selection of PSO Parameters Based on Taguchi Design-ANOVAANN Methodology for Missile Gliding Trajectory Optimization. Cogn. Robot. 2023, 3, 158–172. [Google Scholar] [CrossRef]
  17. Chen, G.; Zhang, W.; Qi, L.; Xue, H.; Huang, W.; Hu, J. Constrained Multi-Objective Trans-Media Maneuver Trajectory Optimization for Morphing Unmanned Aerial-Underwater Vehicles. Ocean Eng. 2024, 299, 117380. [Google Scholar] [CrossRef]
  18. Kumar, G.N.; Penchalaiah, D.; Sarkar, A.K.; Talole, S.E. Hypersonic Boost Glide Vehicle Trajectory Optimization Using Genetic Algorithm—ScienceDirect. IFAC-Pap. 2018, 51, 118–123. [Google Scholar]
  19. Luo, W.; Lei, G.; Zheng, X.; Li, Y.; Lai, C. Rapid Reentry Trajectory Planning Based on Geometric-Dynamic Method. J. Eng. Res. 2023, 11, 227–235. [Google Scholar] [CrossRef]
  20. Chudej, K.; Klingler, A.L.; Britzelmeier, A. Flight Path Optimization of a Hang-Glider in a Thermal Updraft. IFAC Pap. 2015, 48, 808–812. [Google Scholar] [CrossRef]
  21. Coutinho, W.P.; Fliege, J.; Battarra, M. Glider Routing and Trajectory Optimisation in Disaster Assessment. Eur. J. Oper. Res. 2017, 274, 1138–1154. [Google Scholar] [CrossRef]
  22. Jia, H.; Zheng, H.; Zhou, H.; Huo, S. Optimal Selection of Active Jet Parameters for a Ducted Tail Wing Aimed at Improving Aerodynamic Performance. Aerospace 2024, 11, 851. [Google Scholar] [CrossRef]
  23. Jia, H.; Zheng, H.; Zhou, H.; Zhang, Q. Aerodynamic Optimization and Characterization of a Ducted Tail for a Box-Launched Aircraft. Appl. Sci. 2024, 14, 6496. [Google Scholar] [CrossRef]
  24. Chen, Q.; Wang, Z.; Chang, S.; Shu, J. Optimal Trajectory Design Under Uncertainty for a Gliding Guided Projectile. Acta Aeronaut. Astronaut. Sin. 2014, 35, 2593–2604. [Google Scholar]
  25. Ejeh, C.; Afgan, I.; Shittu, R.; Sakirudeen, A.; Anumah, P. Investigating the Impact of Velocity Fluctuations and Compressibility to Aerodynamic Efficiency of a Fixed-Wing Aircraft. Results Phys. 2020, 18, 103263. [Google Scholar] [CrossRef]
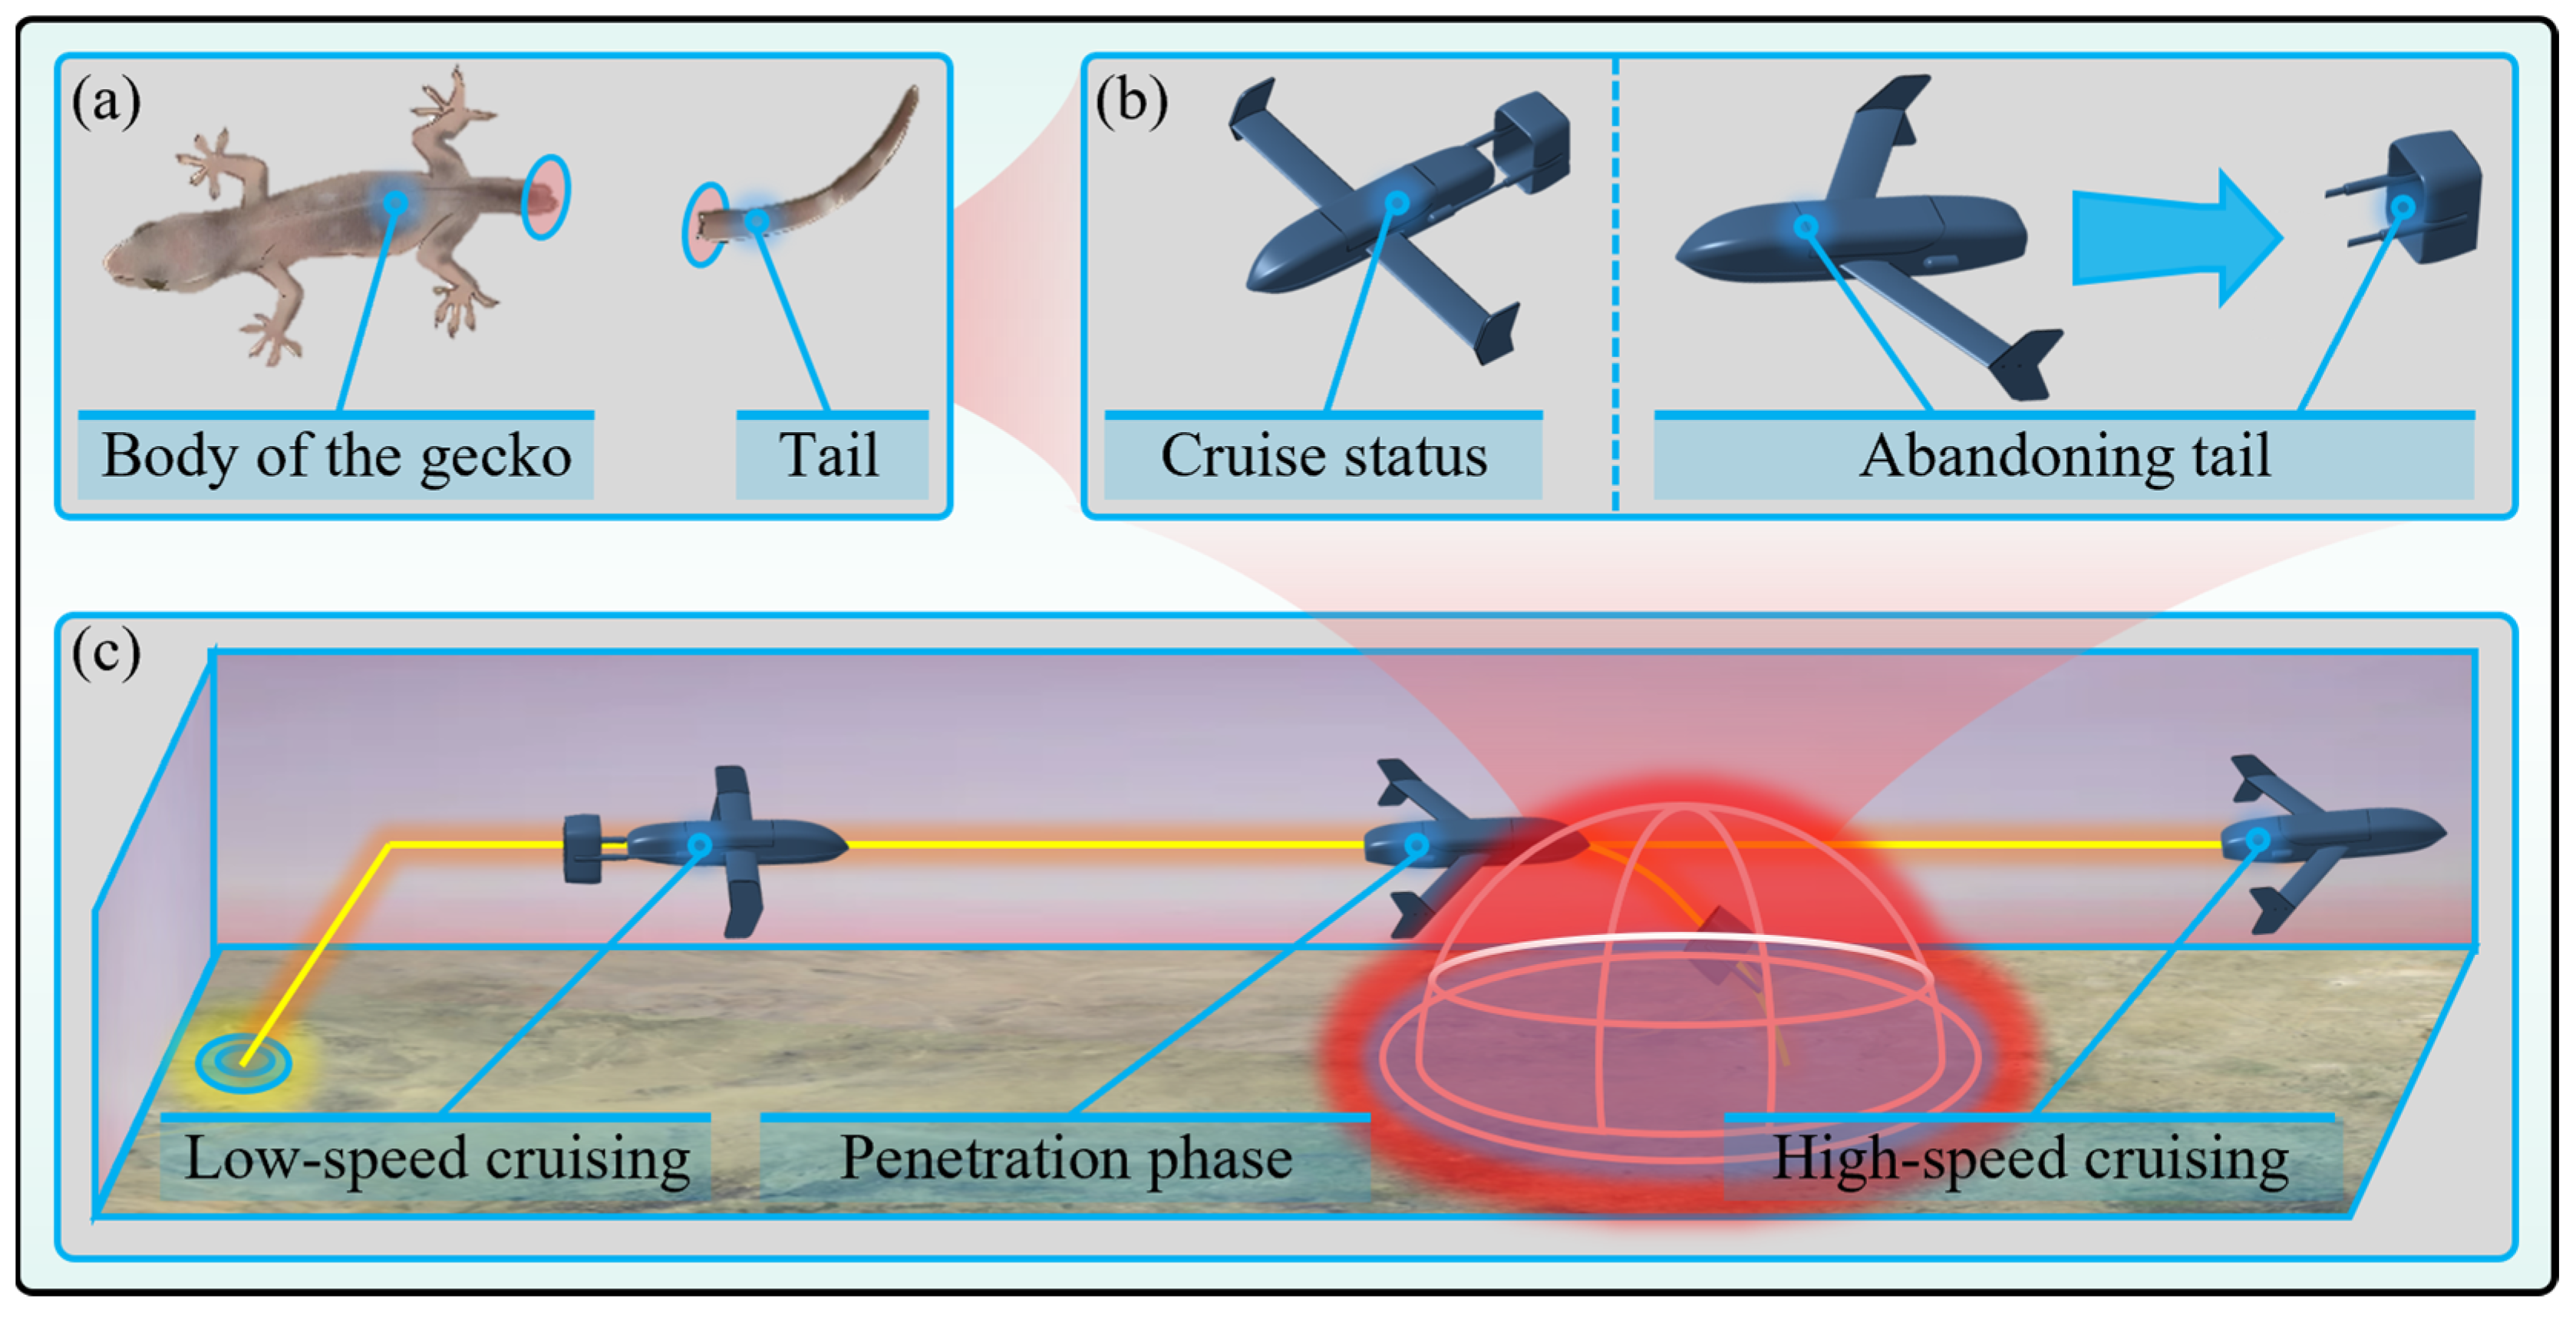
Figure 1. Concept of UAV penetration with imitation of severed gecko tail. (a) Geckos discard their tails and attract the attention of predators through rapid twisting of their tails (b) Glide tail decoy concept (c) UAV penetration process.
Aerospace 12 00212 g001
Figure 2. Overall design framework diagram.
Aerospace 12 00212 g002
Figure 3. Parameterization and force analysis of tail wing.
Aerospace 12 00212 g003
Figure 4. Optimization flowchart for tail shape and trajectory.
Aerospace 12 00212 g004
Figure 5. Architecture of gliding trajectory simulation software.
Aerospace 12 00212 g005
Figure 6. Influence of posture angle change on trajectory when throwing speed is 60 m/s. (a) Vx variation curve. (b) Vz variation curve. (c) V variation curve. (d) Pitch angle variation curve. (e) Gliding distance variation curve. (f) Gliding altitude variation curve.
Aerospace 12 00212 g006aAerospace 12 00212 g006b
Figure 7. Impact of changes in deployment speed on trajectory at posture angle of 4°. (a) Vx variation curve. (b) Vz variation curve. (c) V variation curve. (d) Pitch angle variation curve. (e) Gliding distance variation curve. (f) Gliding altitude variation curve.
Aerospace 12 00212 g007
Figure 8. Impact of changes in deployment speed on trajectory at posture angle of 8°. (a) Vx variation curve. (b) Vz variation curve. (c) V variation curve. (d) Pitch angle variation curve. (e) Gliding distance variation curve. (f) Gliding altitude variation curve.
Aerospace 12 00212 g008
Figure 9. Optimized trajectory comparison. (a) Vx variation curve. (b) Vz variation curve. (c) V variation curve. (d) Pitch angle variation curve. (e) Gliding distance variation curve. (f) Gliding altitude variation curve.
Aerospace 12 00212 g009
Figure 10. Computational domain and computational meshes. (a) Computational domain. (b) Computational meshes.
Aerospace 12 00212 g010
Figure 11. Comparison of aerodynamic performance of optimized tail fins. (a) Comparison of lift coefficients. (b) Comparison of drag coefficients.
Aerospace 12 00212 g011
Figure 12. Velocity cloud map after tail optimization. (a) α = 0 ° . (b) α = 4 ° . (c) α = 8 ° . (d) α = 12 ° . (e) α = 16 ° . (f) α = 20 ° .
Aerospace 12 00212 g012
Figure 13. Velocity cloud map before tail optimization. (a) α = 0 ° . (b) α = 4 ° . (c) α = 8 ° . (d) α = 12 ° . (e) α = 16 ° . (f) α = 20 ° .
Aerospace 12 00212 g013
Table 1. List of parameter variables.
SymbolParameterValueUnit
u Velocity in X-axis direction_m/s
w Velocity in Z-axis direction_m/s
q Angular velocity in Y-axis direction_rad/s
θ Pitch angle_°
F x Resultant force in X-axis direction_N
F z Resultant force in Z-axis direction_N
M Resultant moment in Y-axis direction_N.m
x g Distance in X-axis direction_m
h Distance in Z-axis direction_m
I y Y-axis moment of inertia_kg·m2
m Tail weight1g
g Gravitational acceleration9.8m/s2
Table 2. The shape data of the research object.
Overall ShapeSymbolParameterValueUnit
Aerospace 12 00212 i001AirfoilAirfoils of upper and lower wingsNACA0012_
c A Chord length200mm
L 1 Vertical distance 100 % × c A mm
L 2 Horizontal distance 0 % × c A mm
Table 3. Optimized shape.
Overall ShapeSymbolParameterValueUnit
Aerospace 12 00212 i002AirfoilAirfoils of upper and lower wingsNACA0012_
c A Chord length200mm
L 1 Vertical distance 38.9 % × c A mm
L 2 Horizontal distance 84.8 × c A mm
Table 4. Mesh-independent analysis.
ParametersNumber of Coarse MeshesNumber of Medium MeshesNumber of Refined Meshes
Number of meshes756,0001,687,0003,175,000
Lift coefficient of tail0.77320.75960.7519
Drag coefficient of tail0.03970.03840.0372
Disclaimer/Publisher’s Note: The statements, opinions and data contained in all publications are solely those of the individual author(s) and contributor(s) and not of MDPI and/or the editor(s). MDPI and/or the editor(s) disclaim responsibility for any injury to people or property resulting from any ideas, methods, instructions or products referred to in the content.