Abstract
Prediction of aircraft aerodynamic parameters is crucial for aircraft design, yet traditional computational fluid dynamics methods remain time-consuming and labor-intensive. This work presents a novel model, the image and state information-based attention-enhanced physics-informed neural network (ISA-PINN), which significantly improves prediction accuracy. Our model incorporates the following innovations: the designed attention module dynamically extracts hidden features from pattern data while selectively focusing on relevant dimensions of target information. Meanwhile, the image-information fusion module combines multi-scale geometric features derived from aircraft images to enhance the overall prediction accuracy. By embedding aerodynamic equations, the model maintains physical consistency while enhancing interpretability. Extensive experiments validate the effectiveness of our model for rapid aircraft aerodynamic parameter prediction, achieving a significant reduction in prediction error that improves performance by 29.25% in RMSE and 37.99% in MRE compared to existing methods. A 6.12% error increase on the test set confirms the model’s robust generalization ability.
1. Introduction
In aircraft design, the ability to rapidly and accurately determine aerodynamic parameters holds paramount importance, as these parameters critically influence performance optimization, safety evaluation, and operational efficiency. Conventional approaches for acquiring such parameters, primarily flight experiments, computational fluid dynamics simulations (CFD) [1,2], and wind tunnel testing [3,4]. However, these methods are constrained by prohibitive costs, extended timelines, and technical complexities, thereby underscoring the urgency for more efficient methodologies.
As computer science continues to advance, deep learning techniques based on large datasets have been widely applied across various domains [5,6]. Following this trend, many scholars have employed data-driven approaches for aerodynamic parameter prediction. Tao [7] proposed a backpropagation neural network integrated with a genetic algorithm for predicting aerodynamic parameters. Zheng [8] proposed an intelligent aerodynamic parameter identification method based on bidirectional long short-term memory (LSTM) networks. Yuan [9] used multi-task learning neural networks (MTLNNs) to directly predict the aerodynamic parameters of missiles. However, these methods are constrained by limited data sources, preventing them from utilizing multi-source data available in flight environments to enhance prediction accuracy.
Among these developments in deep learning, the evolution of convolutional neural networks (CNNs) is particularly representative [10,11]. Yilmaz and German [12] developed a CNN approach to predict airfoil pressure distributions based directly on geometric coordinates. Zhang [13] employed CNNs to learn the lift coefficients of airfoils with various shapes under multiple combinations of Mach numbers, Reynolds numbers, and angles of attack. Zhu [14] incorporated the angle of attack and Mach number as RGB primary color values into the aircraft configuration images to predict the lift and drag coefficients of the aircraft. Chai [15] proposed a method based on data transformation and CNNs, establishing a nonlinear mapping relationship between ice shapes and aerodynamic parameters. However, these methods only utilize image information and lack physical constraints when applied in complex environments.
The attention mechanism allows models to selectively focus on important parts of input data, thereby enhancing their ability to process complex information and improving model performance. Bahdanau [16] first proposed the attention mechanism and applied it to neural machine translation tasks, after which Vaswani et al. [17] introduced the transformer architecture, revolutionizing the field of deep learning. Zuo [18] introduced a deep attention network-based method for the rapid reconstruction of incompressible steady flow fields around airfoils. Wang [19] proposed a self-attention generative network called SAG-FlowNet, addressing the limitations of CNN methods in capturing global flow field features in airfoil design. However, attention mechanisms have been rarely applied to aerodynamic parameter prediction. To our best knowledge, there is currently no research applying cross-attention mechanisms to this task.
Physics-informed neural network (PINNs) [20] integrate physical constraints into the loss function, offering advantages such as low data dependency and guaranteed physical consistency, making them particularly suitable for aircraft parameter prediction tasks characterized by limited experimental data and stringent physical constraints. Xiao [21] investigated the application principles of hard boundary constraints in PINN-based fluid flow prediction. Ren [22] extended PINNs to compressible steady aerodynamic flow learning and prediction under high Reynolds numbers, enhancing their capability in modeling complex flow scenarios. Lin [23] applied a PINN to missile aerodynamic parameter prediction with comparative analysis against traditional MTLNNs. Liu [24] proposed an innovative airfoil shape optimization framework combining CNNs, PINNs, and deep reinforcement learning, demonstrating significant improvements in aerodynamic performance. However, the physics laws currently applied to PINNs are still relatively simple. Meanwhile, the majority of existing studies have not yet attempted to simultaneously process both image and state information.
This paper proposes an innovative ISA-PINN model, which creatively integrates image and state information using cross-attention mechanisms and a convolutional module, while incorporating a PINN as a physical constraint to ensure accurate aerodynamic parameter prediction. First, the aircraft’s geometric parameters, flight conditions (angle of attack and Mach number), and aircraft configuration images serve as inputs. These are processed through multi-head cross-attention modules (MHCA) and a convolutional module, while integrating physics-informed networks as loss constraints, to generate the corresponding aerodynamic parameters. The main contributions of this paper are as follows:
- To our best knowledge, we are the first to incorporate cross-attention mechanisms into a PINN for aerodynamic parameter prediction tasks. Based on current flight condition states and aircraft configurations, the network can simultaneously attend to information across multiple dimensions, enabling the model to accurately capture key patterns in complex fluid dynamics phenomena.
- We designed an innovative architecture for processing image and state information. Through cross-attention modules and a convolutional module, our approach effectively fuses image and state information, improving prediction accuracy compared to using state information alone.
- We demonstrated the effectiveness of this innovative architecture through experiments and verified the impact of different modules through ablation studies. This architecture achieves improved accuracy compared to previous methods for aerodynamic parameter prediction.
The structure of this work is arranged as follows: Section 2 reviews related work in the field. Section 3 details the overall architecture of the ISA-PINN framework, along with its attention mechanism module, image state fusion module, and PINN module. Section 4 compares the effectiveness of three methods and evaluates the performance of each module, while also designing experiments to validate the optimal number of heads for the MHCA module and the generalization capability of the model. Section 5 summarizes the completed work.
2. Related Work
2.1. Attention Mechanisms
The attention mechanism is a key innovation in deep learning that closely relates to processing complex aerodynamic data in our research. It mimics selective focus in human cognition, enabling models to process complex information effectively. The mathematical formulation involves query–key–value triples as follows:
The attention weights are derived by computing softmax-normalized similarity scores between query and key vectors, scaled by for numerical stability.
In self-attention [17], Q, K, and V are linear projections from the same input sequence, allowing elements to attend to others within that sequence. In cross-attention [16], Q comes from the target sequence while K and V derive from the source sequence, enabling inter-sequence attention. Single-head attention [25] employs one attention unit, whereas multi-head attention [17] runs parallel units that attend to different representation subspaces simultaneously, capturing richer feature relationships. Multi-head attention is formulated as follows:
where . W matrices are learnable weights, and , , and represent the key dimension, value dimension, and model dimension, respectively, with h being the number of attention heads. Our research leverages the parallel capabilities of multi-head attention and optimizes it specifically for aerodynamic prediction tasks.
2.2. Aerodynamic Parameter Prediction
When designing aircraft, rapid and accurate prediction of aerodynamic parameters for various aircraft configurations is required. Yuan et al. [9] implemented an MTLNN model to predict aerodynamic parameters. Building upon this approach, Lin et al. [23] integrated PINN by embedding the physical equation into the model architecture.
where represents the normal force coefficient, denotes the center of pressure location, and is the pitching moment coefficient. While previous work expanded geometric input variables from 5 to 13 parameters (Figure 1), these approaches fail to leverage visual information from aircraft configurations. Our proposed ISA-PINN addresses this limitation by integrating both numerical data and image information, significantly enhancing prediction accuracy across aerodynamic coefficients.
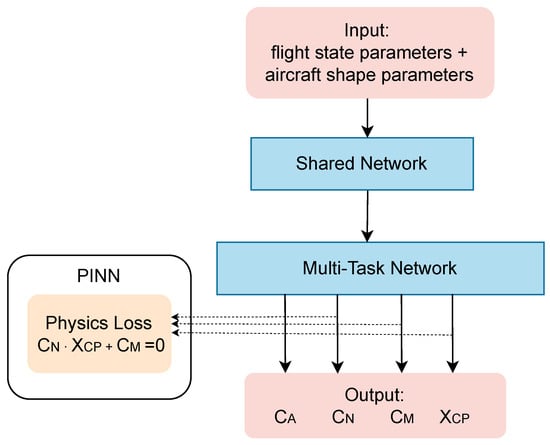
Figure 1.
PINN structure for aerodynamic parameter prediction.
3. Methodology
This study introduces an ISA-PINN, a novel model for aerodynamic parameter prediction of aircraft. The model consists of three key components: a novel MHCA module for dynamically processing data through extracted modalities (Section 3.1), an image-information Fusion module for integrating image and state data (Section 3.2), and a PINN framework for physical information constraints (Section 3.3).
Figure 2 illustrates the comprehensive architecture of the proposed ISA-PINN model. The flowchart shows a sequential processing pipeline that begins with state data as input. State data are input into the first MHCA module, which can adaptively process data to learn key feature patterns based on flight conditions. Subsequently, the feature vectors along with the image data are input into the image-information fusion module, which can fuse image and state data, while enabling the system to focus on relevant features at different scales. The feature vectors are then fed into the second MHCA module, which enables the data to learn feature patterns of different aircraft configurations similarly. The PINN module provides parameter updates to both the image-information fusion module and attention modules through the backpropagation algorithm, ensuring physical consistency in predictions.
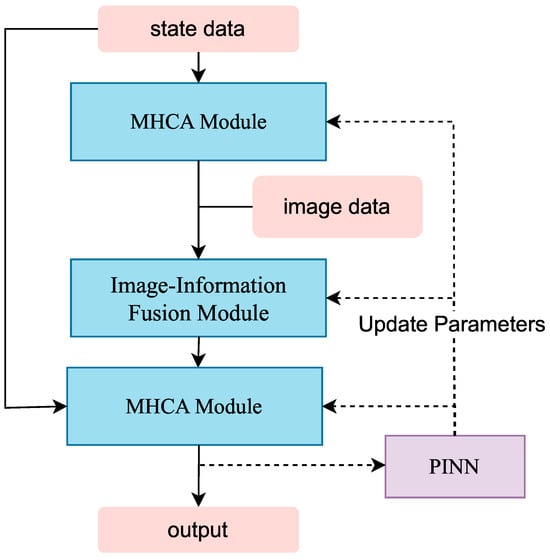
Figure 2.
The proposed ISA-PINN architecture.
3.1. Multi-Head Cross-Attention Module
We design a novel MHCA module shown in Figure 3, which is capable of dynamically learning and extracting multi-dimensional latent patterns from pattern data (such as flight conditions or aircraft configurations), and intelligently adjusting focus on different information dimensions of the target data accordingly. The gated residual module ensures a balance between the original input information and the features transformed by attention.
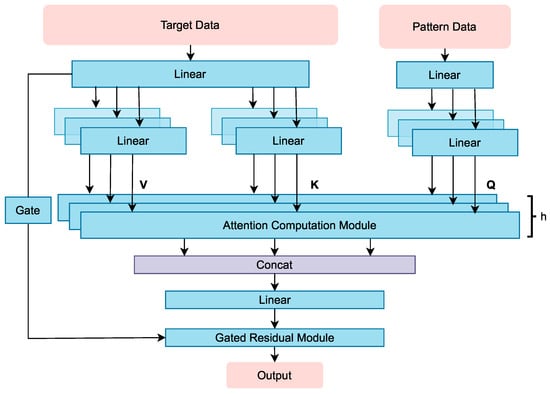
Figure 3.
MHCA module.
Target data and pattern data are first processed through individual linear layers to transform them into representations of dimension. Subsequently, these transformed target data are projected through additional linear layers into key (K) and value (V) representations, while the transformed pattern data are further processed into queries (Q) through their own linear projection pathway. These representations converge in the attention computation module, whose formula is shown in Equation (1).
After attention computation, features from all heads are concatenated, projected through a linear layer to transform the output into appropriate dimensions, and then passed through a gated residual module. This gated residual module incorporates a gating mechanism that learns coefficient to dynamically balance the importance of original information and attention output, as shown in the following formulas:
For the multi-head model, we adopt the conventional design [17], where , distributing the model dimensions evenly across attention heads. When selecting model dimensions, the choice of reflects a critical trade-off between expressiveness and efficiency. Empirical evidence from landmark studies [17,26,27] has demonstrated that relatively modest values (such as 64) provide sufficient representational power while maintaining computational tractability across diverse applications.
For the selection of the number of attention heads H, empirical values of 4–8 are commonly used [28,29]. In this method, a supervised K-means clustering algorithm is implemented (see Appendix A). Experiments demonstrate that pre-extracting hidden patterns through clustering helps improve the model’s prediction accuracy (see Section 4.4). By visualizing the attention weights (see Section 4.2), we observe that the MHCA modules demonstrate high interpretability, revealing how the model dynamically processes data in response to varying flight conditions and aircraft configurations.
3.2. Image-Information Fusion Module
The aircraft platform exhibits rich geometric characteristics, such as wingspan, sweep angle, relative thickness, and contour profiles. These characteristics span multiple scales and interact in complex ways to determine aerodynamic performance. In this section, we utilize a spatial-channel (SC) attention module to extract image feature information and an image-information fusion module (see Figure 4) for integrating multi-scale features. This combined approach enables our model to effectively capture both fine-grained local details and global structural information critical for accurate aerodynamic prediction. The SC attention mechanism can be formalized as follows:
where and represent the spatial and channel attention maps, respectively, ⊙ denotes element-wise multiplication, and ⊗ represents the broadcasting multiplication operation.
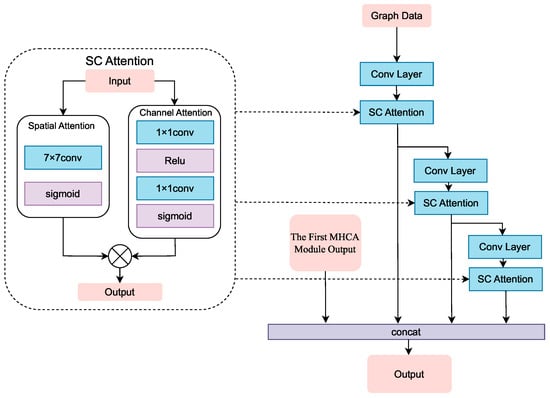
Figure 4.
Image-information fusion module.
The spatial attention uses a convolution to model global spatial relationships, creating a map that highlights significant locations, a size chosen to capture aerodynamically relevant structures efficiently. Meanwhile, channel attention employs global average pooling to generate channel-wise descriptors reflecting feature importance. The final attention weights combine these maps through element-wise multiplication, adaptively emphasizing informative features across both spatial and channel dimensions. Regarding the selection of convolution kernel size, the research [30] compared and convolution kernels, with experimental results showing that outperforms , as the larger receptive field helps the model determine which spatial regions are important, which is essential for our analysis of aircraft configurations.
The image-information fusion module is a pyramid-structured module designed to extract multi-scale geometric features from the input image, capturing both local details and global structures. Image data initially pass through a convolutional layer before being refined by the SC attention mechanism. This process repeats across multiple levels, with each subsequent layer extracting increasingly abstract features through additional convolution and SC attention operations. Built upon a pre-trained backbone, this module generates high-quality feature representations by progressively fusing features across different abstraction levels, providing image-augmented feature inputs for the second MHCA module.
3.3. Physics-Informed Neural Networks
PINNs represent a pioneering approach in scientific machine learning that incorporates physical laws directly into the neural network architecture [20]. Unlike traditional data-driven methods, PINNs minimize a physics-based loss term derived from governing equations during the training process, as illustrated in Figure 5. In the context of aerodynamic analysis, we leverage fundamental aerodynamic relationships as physics constraints:
where denotes the lift coefficient, represents the drag coefficient, is the normal force coefficient, is the axial force coefficient, is the angle of attack, is the pressure center position parameter, and is the pitching moment coefficient. These equations encode the fundamental force balance and moment equilibrium principles that govern aircraft aerodynamics, ensuring our predictions adhere to established physical laws regardless of the complexity of the aircraft configuration.
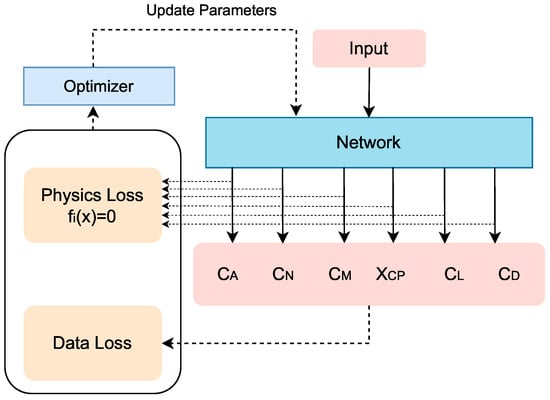
Figure 5.
PINN module.
The training methodology employs a composite loss function that balances empirical data fidelity with physical consistency:
where measures the deviation between predicted and actual aerodynamic parameters from experimental or computational data, while quantifies violations of the physical constraints . The hyperparameter controls the relative importance of physical consistency versus data fitting. This physics-guided regularization significantly improves generalization performance and reduces the data requirements for accurate prediction, particularly valuable in aerodynamic analysis where high-fidelity data acquisition is expensive and time-consuming.
4. Results and Discussion
This section evaluates our ISA-PINN model through the following experiments: the details of the datasets used in our experiments (see Section 4.1); performance assessment against experimental data and convergence metrics (see Section 4.2); selection of the optimal number of heads for the MHCA model (see Section 4.3); visualization of module-specific attention patterns and feature transformations (see Section 4.4); ablation studies quantifying individual component contributions (see Section 4.5); investigation of model generalization capability (see Section 4.6). These results validate the effectiveness of our model for aerodynamic parameter prediction.
4.1. Dataset
To achieve accurate prediction of aircraft aerodynamic characteristics, we employed the industry-standard aerodynamic analysis software DATCOM (1997 FORTRAN 90 version) for dataset generation. DATCOM offers distinct advantages through its empirical and semi-empirical methodologies, providing rapid aerodynamic coefficient estimation across diverse flight regimes. Its proven reliability in preliminary aircraft design makes it an ideal data source, delivering consistent aerodynamic solutions while avoiding the prohibitive computational costs of high-fidelity CFD simulations. Using DATCOM, we established a comprehensive dataset of 116,000 high-fidelity samples spanning diverse aircraft configurations and their corresponding performance metrics. Each sample consists of two complementary components: a 16D numerical feature vector describing the aircraft’s geometric and flight parameters (detailed in Table 1), and a corresponding 2D cross-sectional image representation (illustrated in Figure 6).

Table 1.
Input parameters and the physical meanings for aerodynamic prediction.
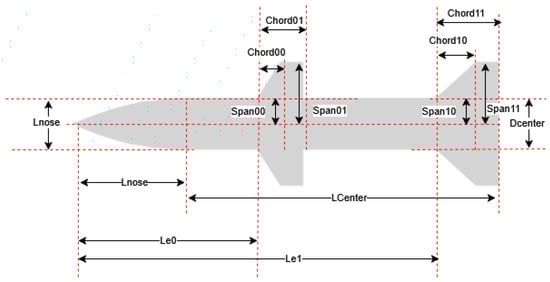
Figure 6.
Aircraft configuration structure diagram.
The dataset incorporates 3125 distinct aircraft configurations, with each configuration evaluated across a comprehensive flight envelope defined by eight angles of attack ( ranging from 0° to 35° in 5° increments) and five Mach numbers ( = 0.5, 0.8, 1.2, 2, and 2.5). This systematic sampling strategy yields 40 operating points per configuration, enabling our models to capture both subsonic and supersonic aerodynamic behaviors across various attitude conditions.
Prior to model training, numerical features were normalized using min–max scaling to mitigate the impact of different physical units, while image data underwent standardization procedures to ensure consistent input quality. The dataset was partitioned into training (90%), validation (5%), and test (5%) sets using stratified sampling based on and configuration distributions, ensuring a representative assessment of model performance across the entire design and flight envelope space.
4.2. Performance Evaluation and Comparative Analysis
We conducted a comprehensive evaluation of the ISA-PINN model using rigorous experimental protocols. The model was trained on a dataset comprising 116,000 samples over 50 epochs using a hybrid optimization approach that alternated between Adam (learning rate: ) and L-BFGS (learning rate: ) optimizers. Network parameters were initialized using Xavier initialization. Hyperbolic tangent (tanh) activation functions were employed throughout the network architecture. To prevent overfitting, regularization with a coefficient of was applied to all trainable parameters.
Performance assessment was conducted using the root mean square error (RMSE) metric, defined as follows:
Additionally, mean relative error (MRE) was used, defined as follows:
where represents the ground truth value, and denotes the predicted value for the i-th sample.
Figure 7 illustrates the comparative analysis between predicted and experimental values for six critical aerodynamic parameters across the angle of attack. The model demonstrates excellent predictive capability. The quantitative performance assessment yields impressively low error metrics across all key aerodynamic parameters, with RMSE and MRE values, respectively, of the normal force coefficient ( = 0.00376, 0.90%), pitching moment coefficient ( = 0.00322, 0.85%), axial force coefficient ( = 0.00412, 0.97%), center of pressure position ( = 0.00159, 0.74%), lift coefficient ( = 0.00439, 1.02%), and drag coefficient ( = 0.00312, 0.89%). These MRE values, all below 1.1%, confirm the model’s high prediction accuracy.
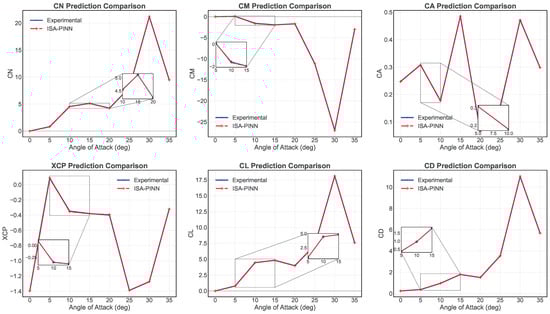
Figure 7.
Comparison of experimental and predicted aerodynamic parameters across angles of attack ().
Figure 8a depicts the convergence characteristics of the model through the evolution of data loss, physics-informed loss, and total loss during the training process. Figure 8b provides deeper insight by decomposing the physics-informed loss into its constituent components, representing the three fundamental aerodynamic constraints incorporated into the model. The convergence behavior reveals that the model achieves stability after approximately 30 epochs, with the physics-informed loss terms asymptotically approaching small values, indicating successful integration of physical principles into the learning process.
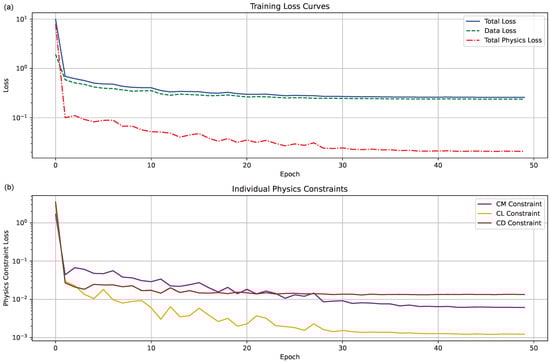
Figure 8.
(a) Training loss curve. (b) Individual physics loss curve.
Figure 9 presents a comparative analysis of prediction accuracy for six critical aerodynamic parameters across multiple test conditions. The MTLNN provides baseline prediction capabilities, while the PINN incorporates governing equations through additional loss terms. As illustrated in the figure, both MTLNN and PINN models manifest considerable error values at particular angles of attack relative to the ISA-PINN methodology.
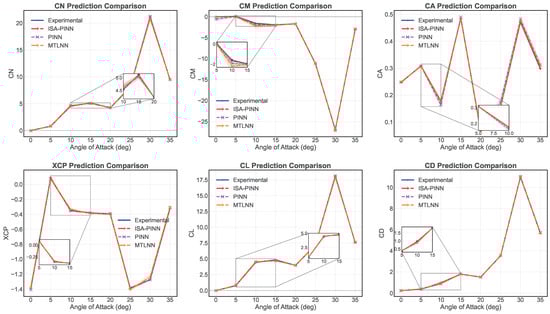
Figure 9.
Comparative predictions of the ISA-PINN, PINN, and MTLNN models for six aerodynamic parameters ().
Figure 10 compares the constraint error of the physical constraint across three models at different angles of attack. The ISA-PINN model maintains the lowest constraint error throughout the entire angle range, with error values consistently below 0.05. In this set of experiments, the PINN performs poorly in the low angle region (0°), while the MTLNN exhibits large constraint error peaks in the medium to high angle regions (10° and 30°), reaching as high as 1.2. This demonstrates that the enhancement of the PINN through the ISA-PINN approach is effective. This also indicates that solely using physical information as a training constraint may result in an inability to balance data loss and physical information loss at certain points, such as at an angle of attack of .
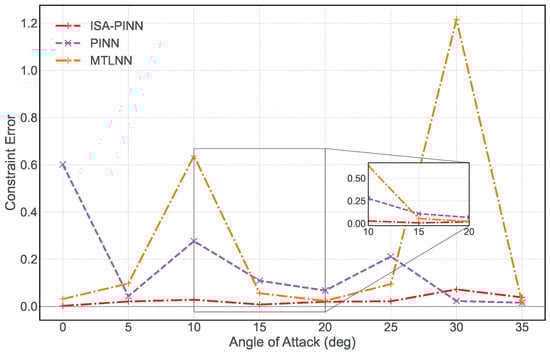
Figure 10.
Physical constraint error comparison at different angles of attack ().
The bar chart in Figure 11 clearly demonstrates that the proposed ISA-PINN model achieves superior performance across all parameters, with an RMSE of 0.00335, compared to 0.00433 for the PINN (29.25% improvement) and 0.00573 for the MTLNN (71.04% improvement). Similarly, the MRE comparison in Figure 12 confirms this trend, with the ISA-PINN achieving an average MRE of only 0.895%, while the PINN and MTLNN demonstrate higher error rates of 1.235% and 1.678%, representing performance gaps of 37.99% and 87.49%, respectively. The ISA-PINN model demonstrates overall improvement compared to the MTLNN, and through additional physical constraints, it achieves significant enhancements in the prediction of , , and compared to the baseline PINN. Additionally, analyzing these results in conjunction with Figure 10, the incorporation of aircraft configuration images as input augments the model’s capability to predict non-physically constrained parameters.
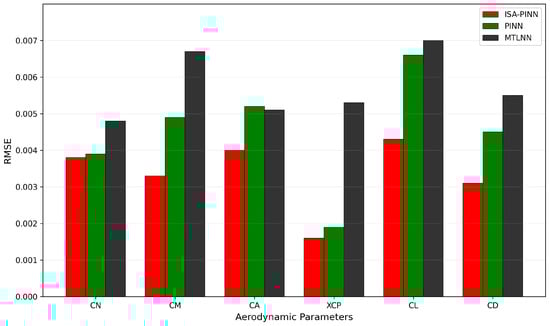
Figure 11.
Aerodynamic parameter prediction RMSE error comparison between different models.
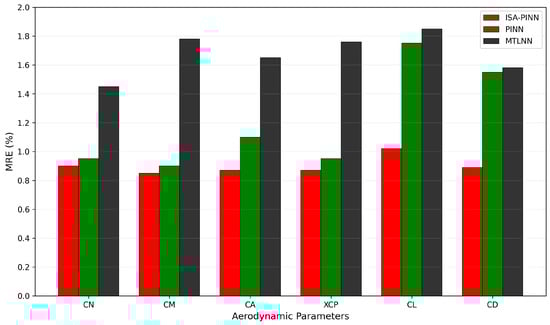
Figure 12.
Aerodynamic parameter prediction MRE error comparison between different models.
To assess model scaling efficiency, we analyzed six training sets with sample sizes ranging from 10,000 to 116,000. Figure 13 reveals that while accuracy improves with more training data, the benefits diminish notably beyond 50,000 samples. Increasing from 50,000 to 116,000 samples yields only 8–12% RMSE reduction while training time increases linearly (reaching 6 min per epoch at maximum size). This identifies an optimal operational point at approximately 50,000 samples, where computational cost and prediction accuracy are effectively balanced for practical applications.
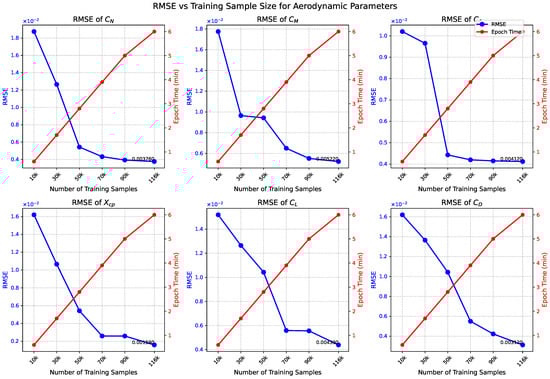
Figure 13.
RMSE and training time trade-off for aerodynamic parameter prediction models.
4.3. The Optimal Number of Attention Heads
We employed the supervised K-means clustering algorithm to perform clustering separately on two sets of relationships: first, between flight conditions and aerodynamic parameters, and second, between aircraft configurations and aerodynamic parameters. Figure 14 shows the silhouette scores for the clustering of flight conditions and aerodynamic parameters. It can be seen that four clusters yield the best performance with a silhouette score of 0.364, though six clusters also present a viable alternative with a comparable score of 0.353, suggesting multiple effective partitioning schemes exist for flight condition data. Figure 15 shows the silhouette scores for the clustering of aircraft configurations and aerodynamic parameters, with four clusters providing markedly superior performance (0.205) compared to other cluster numbers. This distinct peak in the silhouette score indicates that aircraft configuration data have an intrinsic structure that is optimally captured with four clusters, while silhouette scores significantly decrease when the number of clusters exceeds six.
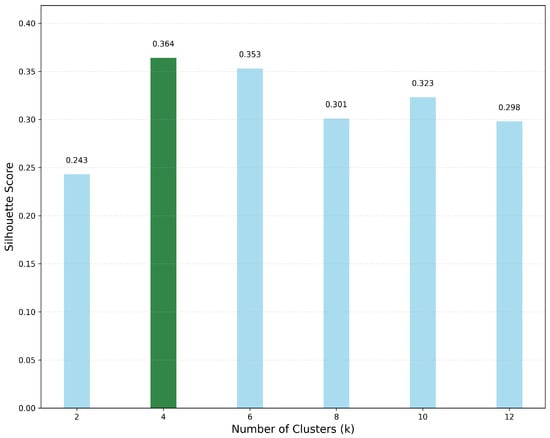
Figure 14.
Silhouette score of the first MHCA module under different clusters.
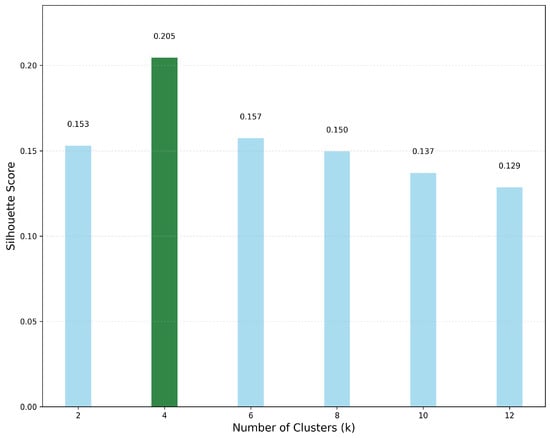
Figure 15.
Silhouette score of the second MHCA module under different clusters.
Further analysis of these figures reveals distinct patterns in aerodynamic behavior. In Figure 16, the radar chart demonstrates how aerodynamic parameters (, , , , , and ) vary across different flight conditions, with Cluster 3 exhibiting notably higher values for and . Similarly, Figure 17 illustrates the influence of aircraft configurations on aerodynamic characteristics, where Cluster 4 demonstrates markedly broader distribution across all parameters, particularly in the and regions. This clustering analysis effectively captures the fundamental relationships between flight conditions, aircraft configurations, and their corresponding aerodynamic responses, providing valuable insights for subsequent modeling efforts.
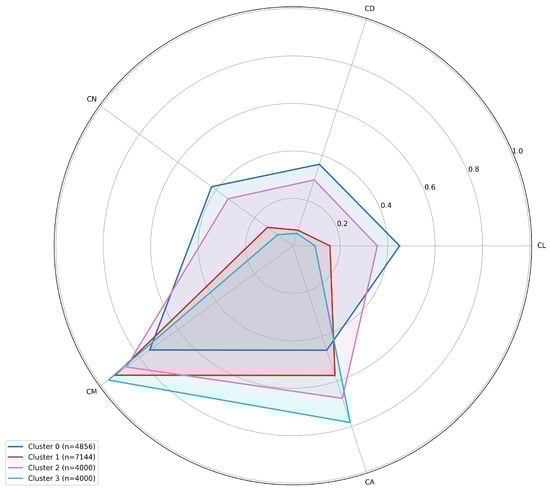
Figure 16.
Aerodynamic parameter distribution through flight conditions.
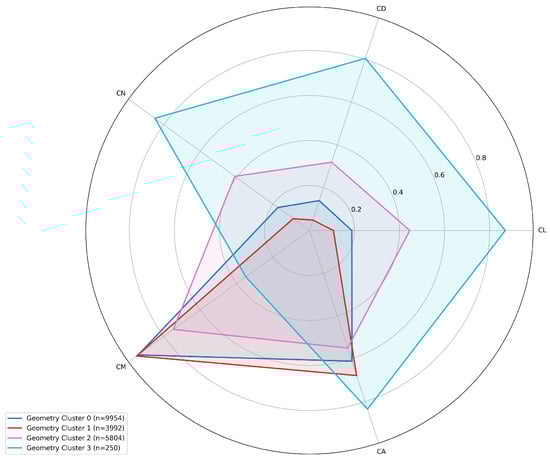
Figure 17.
Aerodynamic parameter distribution through aircraft configurations.
For the selection of the number of attention heads, we used the MRE value of the parameter as the evaluation metric. We tested the first and second MHCA modules separately. When testing one module, the number of heads for the other module was set to the optimal number determined by the supervised K-means clustering algorithm.
Figure 18 shows the selection process for the first MHCA module, where four heads proved to be the optimal choice. Compared to using eight heads, the MRE improved from 0.89 to 0.87, indicating that dividing flight states into four clusters is optimal.
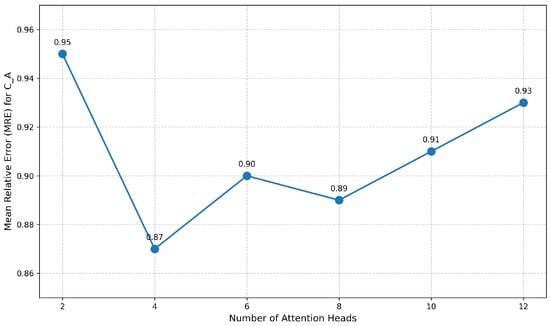
Figure 18.
Aerodynamic parameter distribution in four clusters.
Figure 19 shows the selection process for the second MHCA module, which aligns with the optimal algorithm’s calculation. Both four and six heads emerged as optimal solutions. Due to the complexity of aircraft configurations, increasing the number of heads beyond four does not significantly reduce performance. Without further explanation, in other experiments, we set the number of attention heads to four for both MHCA modules.
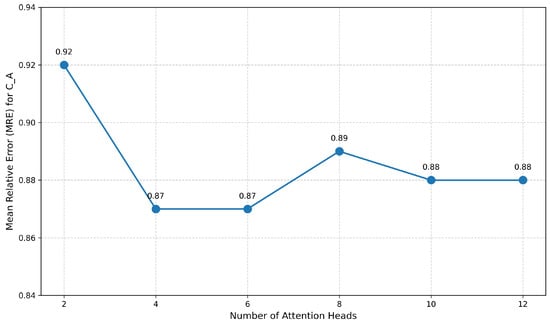
Figure 19.
Aerodynamic parameter distribution in four clusters.
4.4. Module Effectiveness Analysis
The effectiveness of the first MHCA module is evidenced by the specialized attention patterns shown in Figure 20. The visualization reveals that each attention head autonomously learns to focus on distinct aerodynamic regimes defined by combinations of the angle of attack () and Mach number (). Heads 1 and 2 demonstrate strong attention activation for high-angle, transonic conditions ( = 35°, = 1.2), while head 3 specializes in supersonic flow regimes ( = 2.5). Head 4 exhibits more distributed attention across multiple subsonic and transonic conditions.
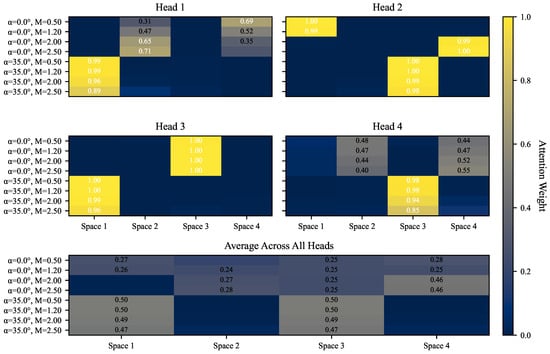
Figure 20.
Attention weight distribution across different heads in the first MHCA module.
Figure 21 presents the attention weight distribution across flow regions for a moderate-angle, transonic flight condition (, ). The radar visualization reveals distinct specialization patterns: head 3 demonstrates the strongest focus on space 1, head 1 prioritizes space 2, head 4 shows light activation in space 3, while head 2 exhibits more balanced distribution with a slight preference for space 4. This complementary attention allocation illustrates how the multi-head mechanism effectively partitions the feature space to capture different aspects of the flow field. The average pattern (shown in red) indicates a relatively balanced distribution across all spaces.
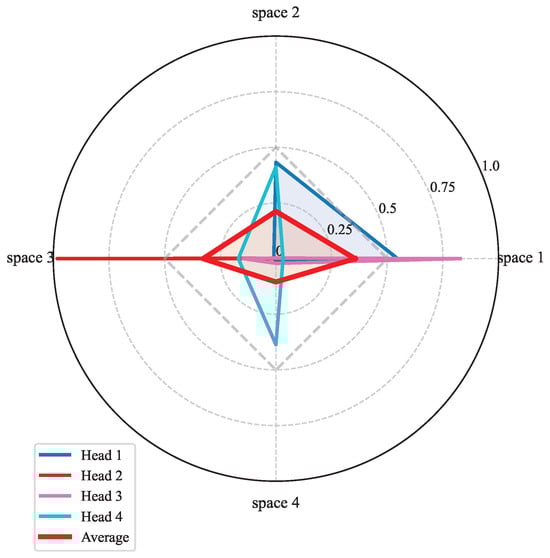
Figure 21.
Attention head distribution at and .
Figure 22 demonstrates the effectiveness of the multi-head attention mechanism across different flight regimes. The radar chart reveals distinct specialization patterns for each attention head when processing aerodynamic information. Head 1 focuses primarily on space 1 and space 2, while Head 2 prioritizes space 3 with moderate attention to space 1. Head 3 exhibits strong attention specifically to space 1, and Head 4 shows a more balanced attention pattern with emphasis on spaces 2 and 4. The average attention (shown in red) indicates an overall preference toward space 1 and space 3. This specialized attention distribution highlights the module’s capability to extract and process geometry-specific features, enabling comprehensive interpretation of how different aircraft structural elements influence aerodynamic behavior.
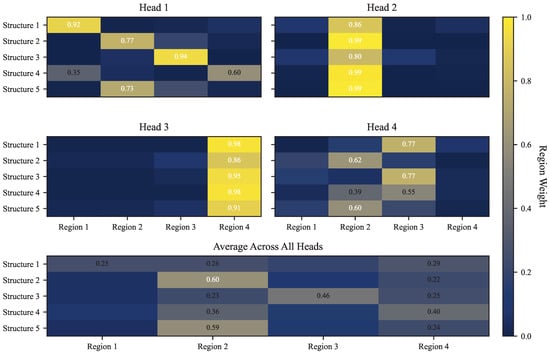
Figure 22.
Attention weight distribution across different heads in the second MHCA module.
Figure 23 illustrates feature activation evolution through our image-information fusion module. Starting from the aircraft silhouette (stage 0), the module progressively refines representations across three stages. Stage 1 highlights the primary fuselage structure, while stage 3 reveals sophisticated activation patterns around aerodynamically critical surfaces. This progression demonstrates the module’s ability to systematically extract and enhance boundary-sensitive features essential for accurate aerodynamic prediction.
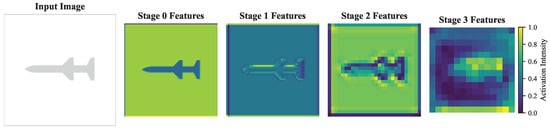
Figure 23.
Feature activation evolution through the image-information fusion module.
To rigorously evaluate the contribution of the PINN module, we compared the performance of our complete model against a model without the physical constraint mechanisms provided by the PINN module. Figure 24 presents experimental values alongside predictions from both the complete ISA-PINN model and the physics-uninformed model across different angles of attack, which reveals that the physics-uninformed model exhibits substantially higher error metrics for critical stability parameters (, , and ). Interestingly, the differences are less pronounced for integrated force coefficients (, , and ). This performance disparity highlights the crucial role of physics constraints in accurately modeling complex force and moment characteristics.
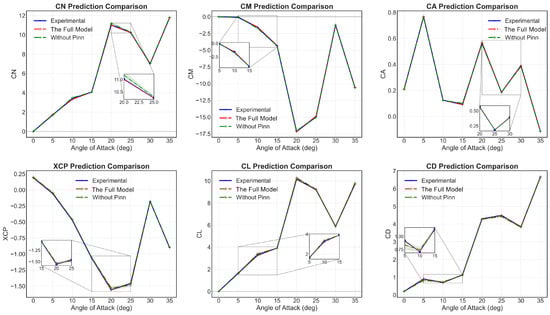
Figure 24.
Comparison of aerodynamic parameter predictions: full model vs. model without a PINN ().
4.5. Ablation Studies
To validate the effectiveness of our proposed architecture, we conducted comprehensive ablation studies across five model configurations: a full model, a model without the first MHCA module (no first MHCA model), a model without the second MHCA module (no second MHCA model), a model without both MHCA modules (neither MHCA model), and a model without the image-information fusion module (no image model).
Figure 25 presents the training loss comparison across these configurations. The full model consistently demonstrates superior convergence behavior throughout the training process. Models with partial MHCA modules show intermediate performance, while models without both MHCA modules exhibit the highest loss values and notable instability during training, particularly in the physics constraint loss component. This indicates that the multiple patterns of data extracted by the MHCA module can effectively guide the direction of data training. This performance degradation confirms that our MHCA module significantly enhances training stability and convergence efficiency. Interestingly, the no image configuration shows competitive final performance despite slower initial convergence, suggesting that while visual features provide valuable initialization guidance, the model can still extract critical aerodynamic patterns from alternative input modalities.
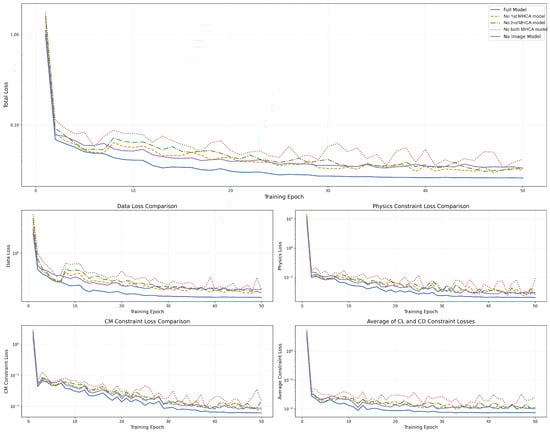
Figure 25.
Ablation study: training loss comparison across different models.
Figure 26 quantifies each component’s contribution through final loss comparison across model variants. The full model achieves the lowest total and physics losses (0.26 and 0.02), while the model without either MHCA modules shows markedly degraded performance (0.41 and 0.09), particularly in satisfying physical constraints. Individual attention mechanism removal (no first MHCA model and no second MHCA model) results in a moderate performance decline. The no image variant maintains reasonable performance (0.33 total loss) despite lacking visual input, confirming that while visual features enhance results, the MHCA module plays the critical role in ensuring physical consistency and prediction accuracy in aerodynamic flow modeling.
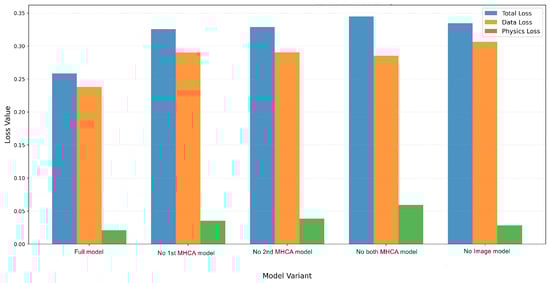
Figure 26.
Comparative analysis of loss components for different model configurations.
Table 2 shows the performance comparison of different model architectures. From the RMSE and MRE metrics, it can be seen that the full model performs best. The first MHCA module plays a significant role in reducing MRE, while the effect of the second MHCA module is similar to removing both MHCA modules. This might be because the second MHCA processes information in the middle to later stages of the entire model, and for data that have already been highly feature-extracted, the cross-attention mechanism based on the aircraft shape provides limited performance improvement. Meanwhile, ablation studies reveal that removing individual attention components incrementally degrades accuracy, while simultaneously removing both MHCA modules causes significant training instability and convergence issues, which also indirectly demonstrates the role of data processing by the MHCA module in stabilizing training.
Table 2.
Performance comparison of different model architectures.
Although the model without the image-information fusion module offers 60.5% reduced training time (from 3.8 h to 1.5 h), this comes at a substantial cost to model accuracy and stability, confirming the critical role of our attention-based fusion approach. It is worth noting that the computation time of traditional CFD methods typically requires tens to hundreds of hours [31]. Although our ISA-PINN model increases the computation time compared to the original PINN, it can still save computational time by two orders of magnitude, greatly improving the efficiency of aerodynamic parameter prediction for aircraft.
4.6. Model Generalization Capability
Model generalization capability refers to the ability of a machine learning model to maintain good predictive performance when facing unseen data. A model with good generalization capability not only performs well on training data but also maintains stable prediction accuracy on test sets or in practical application scenarios. This study evaluates the generalization capability of the proposed method by comparing the performance differences between training and test sets.
Figure 27 shows the comparative predictions of the training set and test set for six aerodynamic parameters, while Figure 28 shows the RMSE and MRE of aerodynamic parameters under generalization testing. As can be observed, due to the incorporation of physical information constraints and additional image information as auxiliary inputs, the ISA-PINN model demonstrates relatively strong generalization capability. The overall generalization errors of the model average 6.12%. Comparatively, the generalization errors for , , and are smaller, while the generalization errors for , , and are larger. Possible reasons for this difference include physical constraints, which may be more effective in capturing the underlying principles governing , , and , making these parameters more predictable in unseen conditions. The complexity of the physical relationships governing , , and might require more training data or different model architectures to achieve the same level of generalization performance, or they might be more sensitive to subtle variations in flow conditions that were not fully represented in the training dataset. Overall, the ISA-PINN demonstrates good generalization capability.
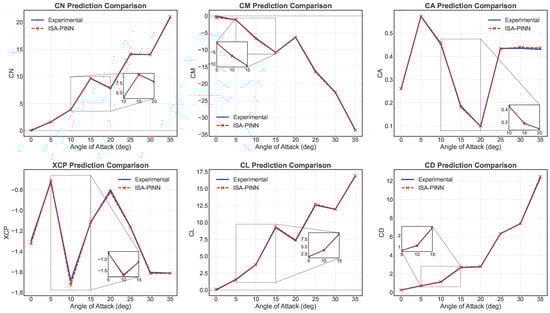
Figure 27.
Comparative predictions of the training set and test set for aerodynamic parameters ().
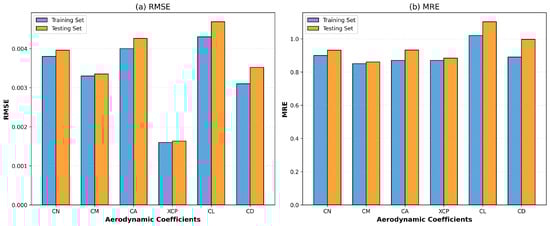
Figure 28.
RMSE and MRE of aerodynamic parameters under generalization testing.
5. Discussion
In this work, an ISA-PINN model was proposed for aerodynamic parameter prediction of aircraft, integrating two MHCA modules, an image-information fusion module, and PINN methodology. The model demonstrates accurate prediction capabilities across various aircraft configurations, offering a novel approach for rapid aerodynamic computation. The proposed MHCA module dynamically extracts latent features from pattern data while adjusting focus on relevant target information dimensions. The image-information fusion module integrates multi-scale geometric information from aircraft images to enhance prediction accuracy. Additionally, physics-informed components ensure predictions comply with fundamental aerodynamic principles, maintaining physical consistency despite limited training data. Experimentally, the ISA-PINN demonstrated improvements of 29.25% in RMSE and 37.99% in MRE compared to the baseline PINN. Meanwhile, a mere 6.12% increase in error on the test set validates the model’s strong generalization capability.
Future research directions include incorporating high-fidelity CFD data to improve prediction reliability and utilizing generative networks to synthesize additional high-confidence data from limited CFD samples. Additionally, the investigation of optimal attention module placement within the model architecture and the use of more complex physical constraints present an opportunity for performance enhancement. These avenues of exploration hold significant promise for advancing the capabilities and applications of aerodynamic prediction frameworks.
Author Contributions
Conceptualization, Y.K. and H.L.; Funding acquisition, X.L. and H.L.; Investigation, Y.K.; Methodology, Y.K.; Project administration, X.L.; Resources, Y.K.; Software, Y.K.; Supervision, X.L. and H.L.; Validation, Y.K.; Writing—original draft, Y.K.; Writing—review and editing, H.L. and X.L.; Visualization, H.L.; Data curation, Y.K.; Formal analysis, Y.K. All authors have read and agreed to the published version of the manuscript.
Funding
This research was funded by the National Natural Science Foundation of China (NSFC) OF FUNDER grant numbers 62203057 and 92371207.
Data Availability Statement
Data are contained within the article.
Conflicts of Interest
The authors declare no conflicts of interest.
Appendix A. Supervised K-Means Clustering Algorithm
Supervised clustering [32] represents a hybrid approach that simultaneously considers input features (independent variables) and output responses (dependent variables) during the clustering process, enabling the identification of sample groups with similar input–output behaviors.
The core of supervised clustering lies in constructing a joint distance measure that appropriately integrates distance information from both input and output spaces. Given a collection of data points with input features and corresponding output values , the supervised distance between two data points and can be expressed as follows:
where and are distance measures defined in the input and output spaces, respectively, and is a balancing parameter that controls the relative importance weight of input and output spaces. For efficient implementation within the K-means framework [33], this joint distance can be realized by creating a weighted combined feature space Z, where each data point is represented as follows:
This transformation ensures that the Euclidean distance in the combined space Z is mathematically equivalent to the weighted joint distance in the original spaces. The supervised K-means clustering algorithm is shown as follows:
| Algorithm A1 Supervised K-means clustering. |
|
The quality of the clustering results can be evaluated using internal assessment metrics such as the silhouette score:
where is the average distance between sample i and other samples in the same cluster, and is the average distance between sample i and samples in the nearest different cluster. By calculating the average silhouette score across number of clusters k, the optimal parameter combination can be determined:
References
- Blocken, B.; Stathopoulos, T.; Carmeliet, J. CFD simulation of the atmospheric boundary layer: Wall function problems. Atmos. Environ. 2007, 41, 238–252. [Google Scholar] [CrossRef]
- Wang, Z.J.; Fidkowski, K.; Abgrall, R.; Bassi, F.; Caraeni, D.; Cary, A.; Deconinck, H.; Hartmann, R.; Hillewaert, K.; Huynh, H.T.; et al. High-order CFD methods: Current status and perspective. Int. J. Numer. Methods Fluids 2013, 72, 811–845. [Google Scholar] [CrossRef]
- Yangwen, X.; Qi, L.; Yaqing, Z.; Bin, L. Model aerodynamic tests with a wire-driven parallel suspension system in low-speed wind tunnel. Chin. J. Aeronaut. 2010, 23, 393–400. [Google Scholar] [CrossRef]
- Ximing, Y.; Nan, L.; Chengpeng, G.; Ying, Z.; Jian, S.; Ge, Z.; Xianpeng, Y.; Jin’ge, Y.; Liangxue, H. A survey of aeroelastic wind tunnel test techonlogy of flight vehicles. Acta Aerodyn. Sin. 2018, 36, 995–1008. [Google Scholar]
- Kingma, D.P.; Welling, M. Auto-encoding variational bayes. arXiv 2013, arXiv:1312.6114. [Google Scholar]
- Graves, A. Long short-term memory. In Supervised Sequence Labelling with Recurrent Neural Networks; Springer: Berlin/Heidelberg, Germany, 2012; pp. 37–45. [Google Scholar] [CrossRef]
- Tao, C.; Chen, D.; Songyan, W.; Ming, Y. Aerodynamic parameter fitting based on BP neural network and hybrid optimization algorithm. In Proceedings of the 11th World Congress on Intelligent Control and Automation, Shenyang, China, 29 June–4 July 2014; IEEE: Piscataway, NJ, USA, 2014; pp. 4961–4964. [Google Scholar]
- Zheng, T.; Cai, W.; Chen, K.; Xu, X.; Gu, J. An LSTM-based aerodynamic parameter recognition method for skip gliding targets. In Proceedings of the Seventh Asia Pacific Conference on Optics Manufacture and 2021 International Forum of Young Scientists on Advanced Optical Manufacturing (APCOM and YSAOM 2021), Hong Kong, China, 13–16 August 2021; SPIE: Washington, DC, USA, 2022; Volume 12166, pp. 899–906. [Google Scholar]
- Yuan, Z.; Zhang, G.; Cui, M.; Tang, W. Prediction of Missile Aerodynamic Parameters Based on Neural Network. Aero Weapon. 2020, 27, 28–32. [Google Scholar]
- Krizhevsky, A.; Sutskever, I.; Hinton, G.E. Imagenet classification with deep convolutional neural networks. In Proceedings of the Advances in Neural Information Processing Systems, Lake Tahoe, NV, USA, 3–6 December 2012. [Google Scholar]
- He, K.; Zhang, X.; Ren, S.; Sun, J. Deep residual learning for image recognition. In Proceedings of the IEEE Conference on Computer Vision and Pattern Recognition, Las Vegas, NV, USA, 27–30 June 2016; pp. 770–778. [Google Scholar]
- Yilmaz, E.; German, B. A convolutional neural network approach to training predictors for airfoil performance. In Proceedings of the 18th AIAA/ISSMO Multidisciplinary Analysis and Optimization Conference, Denver, CO, USA, 5–9 June 2017; p. 3660. [Google Scholar]
- Zhang, Y.; Sung, W.J.; Mavris, D.N. Application of convolutional neural network to predict airfoil lift coefficient. In Proceedings of the 2018 AIAA/ASCE/AHS/ASC Structures, Structural Dynamics, and Materials Conference, Kissimmee, FL, USA, 8–12 January 2018; p. 1903. [Google Scholar]
- Zhu, K.; Liu, X.; Cao, F. Prediction of lift and drag coefficients for aircrafts based on CNN-ATT. In Proceedings of the 2023 China Automation Congress (CAC), Chongqing, China, 17–19 November 2023; IEEE: Piscataway, NJ, USA, 2023; pp. 792–798. [Google Scholar]
- Chai, C.; Wang, Q.; Yi, X.; Guo, L. Aerodynamic parameters prediction of airfoil ice accretion based on convolutional neural network. Flight Dyn. 2021, 39, 13–18. [Google Scholar]
- Bahdanau, D.; Cho, K.; Bengio, Y. Neural machine translation by jointly learning to align and translate. arXiv 2014, arXiv:1409.0473. [Google Scholar]
- Vaswani, A.; Shazeer, N.; Parmar, N.; Uszkoreit, J.; Jones, L.; Gomez, A.N.; Kaiser, Ł.; Polosukhin, I. Attention is all you need. In Proceedings of the 31st Conference on Neural Information Processing Systems (NIPS 2017), Long Beach, CA, USA, 4–9 December 2017. [Google Scholar]
- Zuo, K.; Ye, Z.; Zhang, W.; Yuan, X.; Zhu, L. Fast aerodynamics prediction of laminar airfoils based on deep attention network. Phys. Fluids 2023, 35, 037127. [Google Scholar] [CrossRef]
- Wang, X.; Jiang, Y.; Li, G.; Zhang, L.; Deng, X. Sag-flownet: Self-attention generative network for airfoil flow field prediction. Soft Comput. 2024, 28, 7417–7437. [Google Scholar] [CrossRef]
- Raissi, M.; Perdikaris, P.; Karniadakis, G.E. Physics-informed neural networks: A deep learning framework for solving forward and inverse problems involving nonlinear partial differential equations. J. Comput. Phys. 2019, 378, 686–707. [Google Scholar] [CrossRef]
- Xiao, Z.; Ju, Y.; Li, Z.; Zhang, J.; Zhang, C. On the Hard Boundary Constraint Method for Fluid Flow Prediction based on the Physics-Informed Neural Network. Appl. Sci. 2024, 14, 859. [Google Scholar] [CrossRef]
- Ren, X.; Hu, P.; Su, H.; Zhang, F.; Yu, H. Physics-informed neural networks for transonic flow around a cylinder with high Reynolds number. Phys. Fluids 2024, 36, 036129. [Google Scholar] [CrossRef]
- Lin, J.; Zhou, L.; Wu, P.; Yuan, W.; Zhou, Z. Rapid prediction technology of missile aerodynamic characteristics based on PINN model. J. Beijing Univ. Aeronaut. Astronaut. 2023, 49, 2669–2678. [Google Scholar]
- Liu, Y.Y.; Shen, J.X.; Yang, P.P.; Yang, X.W. A CNN-PINN-DRL driven method for shape optimization of airfoils. Eng. Appl. Comput. Fluid Mech. 2025, 19, 2445144. [Google Scholar] [CrossRef]
- Luong, M.T.; Pham, H.; Manning, C.D. Effective approaches to attention-based neural machine translation. arXiv 2015, arXiv:1508.04025. [Google Scholar]
- Devlin, J.; Chang, M.W.; Lee, K.; Toutanova, K. Bert: Pre-training of deep bidirectional transformers for language understanding. In Proceedings of the 2019 Conference of the North American Chapter of the Association for Computational Linguistics: Human Language Technologies, Volume 1 (Long and Short Papers), Minneapolis, MN, USA, 2–7 June 2019; pp. 4171–4186. [Google Scholar]
- Dosovitskiy, A.; Beyer, L.; Kolesnikov, A.; Weissenborn, D.; Zhai, X.; Unterthiner, T.; Dehghani, M.; Minderer, M.; Heigold, G.; Gelly, S.; et al. An image is worth 16 × 16 words: Transformers for image recognition at scale. arXiv 2020, arXiv:2010.11929. [Google Scholar]
- Xu, H.; Zhu, X.; Matai, R.; Barati Farimani, A. Learning interaction dynamics with physics-informed attention networks for fluid flow applications. Phys. Rev. Fluids 2021, 6, 074501. [Google Scholar]
- Chen, Y.; Hosseini, B.; Owhadi, H.; Stuart, A.M. Physics-informed neural networks for fluid dynamics: A comprehensive review. Comput. Methods Appl. Mech. Eng. 2022, 393, 114783. [Google Scholar]
- Woo, S.; Park, J.; Lee, J.Y.; Kweon, I.S. Cbam: Convolutional block attention module. In Proceedings of the European Conference on Computer Vision (ECCV), Munich, Germany, 8–14 September 2018; pp. 3–19. [Google Scholar]
- Kochkov, D.; Smith, J.A.; Alieva, A.; Wang, Q.; Brenner, M.P.; Hoyer, S. Machine learning–accelerated computational fluid dynamics. Proc. Natl. Acad. Sci. USA 2021, 118, e2101784118. [Google Scholar] [CrossRef] [PubMed]
- Kutz, J.N. Data-Driven Modeling & Scientific Computation: Methods for Complex Systems & Big Data; OUP Oxford: Oxford, UK, 2013. [Google Scholar]
- MacQueen, J. Some methods for classification and analysis of multivariate observations. In Proceedings of the Fifth Berkeley Symposium on Mathematical Statistics and Probability, Volume 1: Statistics; University of California Press: Berkeley, CA, USA, 1967; Volume 5, pp. 281–298. [Google Scholar]
Disclaimer/Publisher’s Note: The statements, opinions and data contained in all publications are solely those of the individual author(s) and contributor(s) and not of MDPI and/or the editor(s). MDPI and/or the editor(s) disclaim responsibility for any injury to people or property resulting from any ideas, methods, instructions or products referred to in the content. |
© 2025 by the authors. Licensee MDPI, Basel, Switzerland. This article is an open access article distributed under the terms and conditions of the Creative Commons Attribution (CC BY) license (https://creativecommons.org/licenses/by/4.0/).