Abstract
The ignition and extinction performances of an engine’s combustion chamber are crucial for its overall performance, reliability, fuel efficiency, and environmental impact. This study focuses on a central staged dual-swirl direct mixing combustor’s ignition and extinction performances. The goal is to construct a network surrogate prediction model estimating the ignition and extinction boundaries in the central staged dual-swirl direct mixing combustor. The experimental results indicate that the minimum ignition fuel–air ratio of the combustor initially increases and then decreases with increasing inlet temperature. In contrast, the extinction fuel–air ratio decreases with increasing inlet temperature. The ignition fuel–air ratio decreases as the inlet pressure increases, while the extinction fuel–air ratio also decreases with increasing inlet pressure. The minimum ignition fuel–air ratio initially decreases and then increases as the inlet flow rate increases. Similarly, the extinction fuel–air ratio decreases with increasing inlet flow rate. Additionally, both the ignition and extinction fuel–air ratios decrease with increasing pilot and main stage swirl intensity. The constructed neural network model comprises an output layer representing the ignition and extinction fuel–air ratios and an input layer including variables such as inlet temperature, pressure, flow rate, and pilot and main swirl intensity. During training, the model achieved a final relative error of 0.4%, with a relative error of 0.3% for the ignition fuel–air ratio and 0.5% for the extinction fuel–air ratio. During validation, the relative error was 1.7%, with a relative error of 1.1% for the ignition fuel–air ratio and 2.1% for the extinction fuel–air ratio. The neural network model demonstrates its effectiveness in accurately predicting the numerical values of the ignition and extinction fuel–air ratios, indicating its potential for engineering predictions in the context of central staged dual-swirl direct mixing combustors.
1. Introduction
The combustor, a vital component of aerospace engines, is often referred to as the engine’s “heart” [1]. Reliable ignition during startup, whether on the ground or in the air, is a critical design requirement, and preventing blowout is essential for operational safety. Therefore, the ignition and blowout characteristics significantly impact the engine’s overall performance and safety.
Driven by growing environmental concerns and advancements in military technology, both civil and military aviation engine combustor designs are constantly evolving to achieve lower pollution levels and higher fuel–air ratios [1].
In the case of low-pollution combustors, increasing the percentage of combustion air helps reduce the combustion zone temperature under high operating conditions, thereby mitigating NOx emissions from the combustor. Similarly, for high fuel–air ratio combustors, a higher combustion air percentage is necessary to control smoke generation. However, regardless of the intended purpose, increasing the combustion air percentage inevitably leads to a relative deterioration in the ignition/blowout performance of the combustor.
With the emergence of new-generation advanced combustors, conventional research on ignition/blowout in combustors is insufficient to support the development of novel high-temperature-rise, low-pollution combustors. Therefore, further investigations are necessary to study the ignition/blowout performance of these advanced combustors.
Extensive research has been conducted worldwide to develop prediction models for determining the ignition/blowout boundaries of swirling flames in aircraft engines. In the early stages, the focus was primarily on analyzing and summarizing a large volume of experimental data to predict the ignition/blowout boundaries of combustors with different structures and operating conditions. This was achieved mainly through the use of semi-empirical formulas. Noteworthy models that emerged from this research include Longwell’s homogeneous stirred reactor model [2,3,4], Zukoski’s characteristic time model [5,6,7,8], and Lefebvre’s empirical ignition/blowout formula [9,10,11,12].
As numerical simulation techniques advanced, researchers started combining the results of numerical simulations with semi-empirical formulas to develop more accurate prediction models. Among these models, Mongia’s ignition/blowout prediction model stands out as one of the most prominent in the field. The integration of numerical simulation results with empirical formulas has led to the development of prediction models that offer improved accuracy in predicting the ignition and blowout characteristics of combustors.
A crucial parameter in combustion studies is the fuel–air ratio (FAR), defined as follows:
where is the mass flow rate of the fuel, and is the mass flow rate of the air. In this study, FAR variations play a key role in analyzing ignition and flameout limits. Additionally, the terms Lean Limit of Operation (LLO) and lean blowout (LBO) are used to characterize the stability limits of the combustor.
Lefebvre conducted extensive research on ignition/blowout in gas turbine combustors. Through analysis of a large amount of experimental data, he derived the following formula for the lean fuel ignition/blowout fuel–air ratio.
where A and B are constants whose values depend on the geometric dimensions of the combustor, mixing characteristics, and air quantity in the primary combustion zone. VC represents the volume of the primary combustion zone (m3), is the mass flow rate of air in the combustion chamber (kg/s), P3 is the inlet air pressure of the combustor (Pa), T3 is the inlet air temperature of the combustor (K), SMD is the average droplet diameter of the fuel (μm), is the effective evaporation constant of the fuel (m2/s), and is the lower heating value of the fuel (J/kg).
The Mellor team at Purdue University [13,14,15,16,17,18], based on Zukoski’s characteristic time theory, conducted research and successfully applied it to the prediction of lean blowout in swirl-stabilized combustors. The developed prediction formula is shown below [19].
where represents the quenching time (s), prime is the chemical reaction time, and prime is the fuel evaporation time (s).
The prediction model for the lean blowout boundary was initially proposed by Longwell, applying the homogeneous stirred reactor model to a bluff flame holder. The term bluff refers to a bluff body, which is a non-streamlined object placed in a flow to create recirculation zones for flame stabilization. It considers the recirculation zone downstream of the bluff as a uniform stirred reactor and derives the blowout boundary. Lefebvre made improvements to the homogeneous stirred reactor model and obtained a lean blowout prediction model applicable to aircraft engine combustors. The formula is as follows:
where μ is the dynamic viscosity, p is the pressure, d is the characteristic length, and ϕ is the equivalence ratio.
Samuelsen [20,21] made significant improvements to Lefebvre’s lean blowout model, enhancing its accuracy by 14%. Hu, based on experimental results of flame imaging, further refined Lefebvre’s lean blowout model and introduced the flame volume characteristic curve method.
During the 1980s, Mongia and Rizk [22,23,24] combined Lefebvre’s semi-empirical formula with numerical simulations to develop a multidimensional empirical analysis method. They utilized advanced numerical simulation techniques to construct a comprehensive mathematical model for evaluating combustor performance.
In addition to the lean blowout models specifically designed for aircraft engine combustors mentioned above, there are also blowout models tailored for specific combustion devices. For instance, Driscoll [25,26] proposed the Da model for high-speed cavity flows. The Da model refers to the Damköhler number model, which characterizes the ratio of chemical reaction time to flow residence time. It is widely used to predict flame stability in high-speed cavity flows. Huang Xia [27] introduced the velocity matching model for laminar premixed flames, and Shouse and Sturgess [28,29,30,31,32,33] developed a composite computational model for predicting lean blowout boundaries in combustors. These approaches involve solving the flow processes and chemical reaction processes inside the combustor separately, treating the mixing time and chemical reaction time as distinct factors.
The current study considers a single-model central staged direct mixing (CS-DM) combustor that includes all key features of the modern combustors, designed for a quick temperature rise and low emission of pollutants. Compared to traditional rich-burn combustors, CS-DM combustors face specific challenges related to ignition and blowout due to their unique staged design. The pilot stage swirl can entrain a portion of the primary stage air into the flame root region, altering the flow structure and potentially leading to localized or global blowout. Figure 1 illustrates the geometric configuration and typical flow structure of the CS-DM combustor.
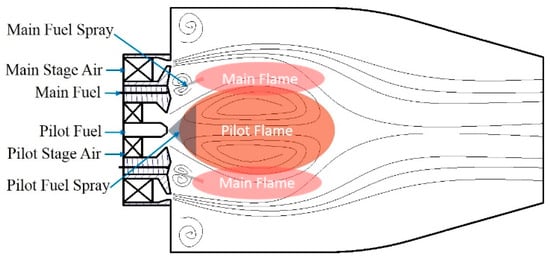
Figure 1.
Structure and typical flow structure of a CS-DM combustor.
Currently, most research efforts focus on improving classical ignition and blowout semi-empirical models by calibrating model parameters through experimental studies. However, these models are no longer applicable to advanced low-emission and high-temperature-rise combustors. Furthermore, there is a lack of a comprehensive model that integrates the ignition and blowout performance with key structural parameters of the combustor. This study aims to address these gaps by investigating the ignition and blowout mechanisms in advanced combustors and developing accurate and reliable predictive models.
The current study focuses on the ignition and extinction performance of a CS-DM combustor, which incorporates key features of modern combustors designed for rapid temperature rise and low pollutant emissions. The goal of this study is to construct a neural network-based prediction model for the ignition and extinction fuel–air ratios (FARs) under varying operating conditions, including inlet temperature, pressure, flow rate, and swirl intensity. To achieve this goal, experimental investigations were conducted on a single-tube CS-DM combustor, followed by the development and validation of a surrogate model using a multilayer perceptron (MLP) neural network. The paper is organized as follows: Section 2 describes the experimental setup and methodology, Section 3 presents the results and discussion, and Section 4 concludes with the key findings and implications for future research.
2. Materials and Methods
2.1. Physical Model
The central staged direct mixing (CS-DM) combustor, as shown in Figure 1, consists of a central pilot stage and a surrounding main stage. The pilot stage, equipped with a swirler and simplex fuel injector, generates a flame kernel that stabilizes the combustion process. The main stage, comprising nine coaxial airblast atomizers, enhances fuel–air mixing and ensures uniform combustion. The head end of the combustor, where the pilot and main stages are located, plays a critical role in flame stabilization and pollutant control.
Key terms used in this study are defined as follows:
- Flame kernel: the initial ignition region where the flame is established.
- Simplex: a type of fuel injector used in the pilot stage.
- Head end: the upstream section of the combustor where fuel and air are introduced.
- Pilot stage: the central section responsible for flame stabilization.
- Main stage: the outer section responsible for fuel–air mixing and combustion.
- MLDI dome: a multi-point lean direct-injection dome used in modern combustors.
- Primary zone: the region where the majority of combustion occurs.
- Vorticity angle: the angle of the swirling flow, which influences flame stability.
- Vorticity intensity: a measure of the strength of the swirling flow.
- Swirl intensity: a parameter describing the rotational momentum of the flow.
The CS-DM combustor differs from previous-generation combustors by its ability to achieve rapid temperature rise and low emissions through enhanced fuel–air mixing and flame stabilization.
The pilot stage comprising a swirler and a simplex is similar to the single MLDI dome. It is located in the center of the CS-DM combustor, around the pilot and embraced by the main stage. There are nine coaxial airblast atomizers in the main stage. At low operating conditions, the pilot stage works only under local rich fuel conditions. So, we can widen the combustor lean ignition and blowout limits. At high operating conditions, both the pilot and main stages work together, so that the primary zone is in lean fuel. Thus, the emission of the combustor can be reduced.
There are three variation schemes for the sub-mode vorticity intensity and main-mode vorticity intensity in the experimental study. The sub-mode vorticity angles are 35°, 40°, and 45°, corresponding to vorticity intensities of 0.516, 0.615, and 0.728, respectively. The main-mode vorticity angles are 40°, 45°, and 50°, corresponding to vorticity intensities of 0.722, 0.868, and 1.032, respectively. The geometric vorticity number of the vortex generator is defined as follows:
where is the hub diameter, is the swirler diameter, and θ is the swirl angle. This parameter quantifies the strength of the swirling flow and its impact on flame stability.
2.2. Test Rig
The test rig is shown in Figure 2. It consists of an inlet measuring section, combustion section, and outlet measuring section. The temperature and pressure sensor placement on the inlet measuring section are determined to measure the inlet flow temperature (T3) and pressure (P3). The combustion section consists of the CS-LDI dome, the dome flange, the liner, and the casing, which is the core of the test rig. An ignitor and thermocouples are located on the casing. The outlet measuring section is located below the combustion sector. There are pressure sensors, temperature sensors, and a gas sampling rake placed on it to measure the outlet pressure (P4), the outlet temperature (T4), and the species concentration of the hot gas. The measuring accuracy is shown in Table 1. The combustion section has a length of 500 mm and a diameter of 200 mm. The fuel used in the experiments is Jet-A, a standard aviation fuel with a lower heating value of 43.2 MJ/kg. The fuel spray characteristics were measured using a Malvern Spraytec laser diffraction system. The Sauter mean diameter (SMD) of the fuel droplets was found to be 35 µm, with a spray cone angle of 90° and a penetration length of 50 mm at an injection pressure of 1.0 MPa. These parameters were kept constant throughout the experiments to ensure consistent fuel–air mixing conditions. An automotive-grade spark igniter with a discharge energy of 12 J was used for ignition. The igniter was positioned 20 mm downstream of the fuel injector to ensure reliable flame kernel initiation. The spark frequency was set to 1 Hz, and the ignition timing was synchronized with the fuel injection cycle.
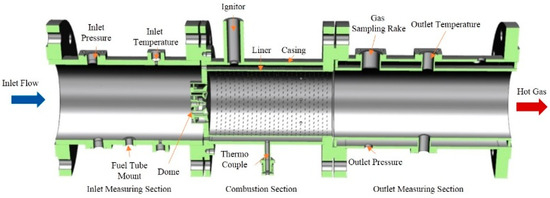
Figure 2.
A schematic of the CS-DM combustor test rig.

Table 1.
Uncertainties on the measurements.
2.3. The Multilayer Perceptron
The neural network is a computational model that simulates the structure and functionality of the human neural system. It consists of interconnected neurons and has the capability to learn from input data, extract features, and perform tasks such as classification or regression. A typical neural network consists of input layers, hidden layers, and output layers. The input layer receives raw data, the hidden layers extract and transform features, and the output layer produces the desired output, such as classification or regression predictions [34].
There are several common neural network models, including the multilayer perceptron (MLP), Convolutional Neural Network (CNN), and Recurrent Neural Network (RNN). The MLP is a fundamental neural network model composed of multiple fully connected layers.
The multilayer perceptron (MLP) is a feedforward neural network consisting of an input layer, hidden layers, and an output layer. The input layer receives variables such as inlet temperature, pressure, and flow rate, while the output layer predicts the ignition and extinction fuel–air ratios. The hidden layers, each containing 10 neurons, use the hyperbolic tangent activation function to model non-linear relationships. The network is trained using the backpropagation algorithm with the sum of squared errors (SSE) as the loss function.
2.4. Experimental Design
In this study, we considered five crucial independent variables: pilot swirl intensity, main swirl intensity, inlet temperature, inlet pressure, and inlet flow rate. However, conducting experiments for all possible combinations of these variables would be impractical due to resource and time constraints. To overcome this limitation, we employed an orthogonal experimental design method.
Orthogonal experimental design is a systematic approach used to determine the factors that influence the output results of a process or system. It allows for efficient exploration of the parameter space by selecting a subset of representative experiments. The key objective is to identify the key factors and their interactions while minimizing the number of experiments required.
The design process involves selecting appropriate experimental factors and levels and combining them into a series of experiments based on an orthogonal table. This ensures that each experiment independently determines the effects of certain factors, while also considering the interactions between factors. By following this approach, we can draw meaningful conclusions from a limited number of experiments and enhance the efficiency of our research.
Using orthogonal experimental design, we can systematically vary the independent variables and observe their effects on the dependent variables (ignition/extinction fuel–air ratios). This enables us to identify the significant factors and their optimal levels, providing valuable insights into the ignition/extinction performance of the combustor.
An orthogonal experimental design was employed to efficiently explore the effects of five key factors: pilot swirl intensity, main swirl intensity, inlet temperature, inlet pressure, and inlet flow rate. A total of 9 research scenarios were designed by combining three levels of pilot swirl intensity (35°, 40°, 45°) and main swirl intensity (40°, 45°, 50°). For each scenario, 49 experimental sets were conducted, covering a wide range of operating conditions, as shown in Table 2.
Table 2.
Orthogonal design for studying aerodynamic parameters of incoming flow conditions.
The orthogonal design ensures that the interactions between factors are considered while minimizing the number of experiments. The results from this design are used in Section 3.1, Section 3.2, Section 3.3, Section 3.4 and Section 3.5 to analyze the individual effects of each factor on ignition and extinction performance.
3. Results and Discussion
3.1. The Effect of Incoming Flow Temperature Variation on Ignition/Extinction Performance
In this section, experimental research was conducted on a CS-DM single-tube combustor with specific design parameters, including a pilot stage swirl angle of 35° and a main stage swirl angle of 50°. The experiments were conducted by maintaining a constant inlet air flow rate of 0.06 kg/s and atmospheric pressure, while varying the inlet temperature of the combustor within a range of 300 K to 380 K, with a 10 K increment.
The main objective of the study was to investigate the effects of inlet temperature variation on the ignition and flameout performance of the combustor. By determining the ignition and flameout limits at different inlet temperatures, a comprehensive analysis of the combustor’s response to changes in inlet temperature was conducted. This analysis aimed to provide insights into the ignition and flameout characteristics under different thermal conditions.
For detailed information on the specific research conditions and experimental results, including the ignition and flameout limits at different inlet temperatures, please refer to Appendix A. The experimental data presented in Appendix A will offer a comprehensive understanding of the combustor’s behavior and its sensitivity to changes in inlet temperature.
Figure 3 shows the ignition/flameout boundary curves of the CS-DM combustor at different inlet temperatures.
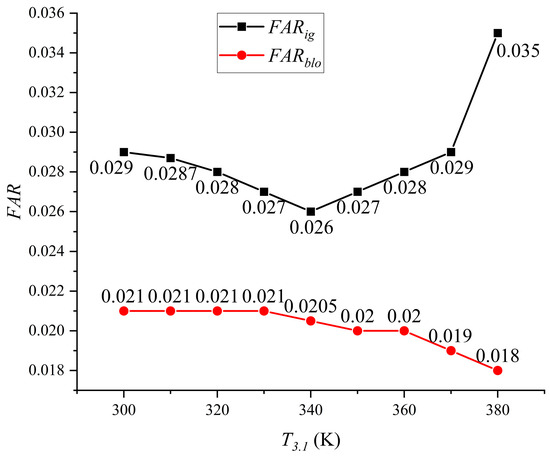
Figure 3.
Ignition and extinction boundaries of the combustor at different incoming flow temperatures. The X-axis represents the inlet air temperature, and the Y-axis shows the overall fuel–air ratio (FAR), defined as the total fuel mass flow rate divided by the total air mass flow rate.
Based on the graph, it can be observed that the minimum ignition fuel–air ratio of the combustor generally falls within the range of 0.026 to 0.035. At an inlet temperature of 340 K, the combustor achieves the lowest ignition fuel–air ratio of 0.026, while at an inlet temperature of 380 K, the ignition fuel–air ratio reaches 0.035. The trend of the minimum ignition fuel–air ratio initially decreases and then increases as the inlet temperature increases.
Within the range of inlet temperature variation from 300 K to 340 K, the minimum ignition fuel–air ratio gradually decreases from 0.029 to 0.026. Additionally, higher temperatures accelerate fuel evaporation rates, promoting finer droplet atomization and more homogeneous fuel–air distribution. The increased air velocity elevates the momentum of the fuel spray, reducing the characteristic penetration time and enabling deeper penetration into the ignition zone. This ensures a more concentrated fuel–air mixture near the spark location, facilitating flame kernel initiation. Consequently, the initial flame kernels are generated more easily, leading to a decrease in the ignition fuel–air ratio.
The results suggest that there exists an optimal inlet temperature for achieving the lowest ignition fuel–air ratio. Beyond this optimal temperature, further increases in the inlet temperature may lead to reduced flame kernel formation and increased difficulty in achieving ignition, resulting in a higher ignition fuel–air ratio. It is important to consider the optimal temperature range to ensure reliable ignition and efficient combustion in practical applications.
Regarding the flameout fuel–air ratio of the combustor, it is observed that it typically falls within the range of 0.018 to 0.021. Specifically, when the inlet temperature is 380 K, the lean flameout fuel–air ratio reaches its lowest value of 0.018. Within the inlet temperature range of 300 K to 360 K, the lean flameout fuel–air ratio of the combustor remains relatively stable, ranging from 0.02 to 0.021. This is because the small variation in the inlet temperature has a minimal impact on the thermal flow field inside the combustor, resulting in little change in the lean flameout performance within this range.
However, as the inlet temperature further increases, a slight decrease in the lean flameout fuel–air ratio is observed. This can be attributed to the increased flow velocity and recirculation rate caused by the higher inlet temperature. The higher flow velocity and recirculation rate lead to more fuel accumulation in the recirculation region, resulting in an increase in the local fuel–air ratio and a decrease in the lean flameout fuel–air ratio of the combustor.
It is worth noting that the lean flameout performance of the combustor is relatively stable within a certain range of inlet temperatures. This indicates that the design of the combustor is robust in terms of lean flameout resistance under varying inlet temperature conditions. However, it is still essential to consider the optimal operating temperature range to ensure stable and reliable combustion in practical applications.
In comparison with the flameout performance, the ignition performance of the CS-DM combustor is more sensitive to changes in the total inlet temperature of the combustor.
3.2. The Effect of Incoming Flow Pressure Variation on Ignition/Extinction Performance
In this study, a CS-DM single-tube combustor with a pilot stage swirl angle of 35° and a main stage swirl angle of 50° was investigated. The experiments were conducted with a fixed inlet air flow rate of 0.06 kg/s and a constant inlet temperature of 300 K. However, the inlet pressure of the combustor was varied in the range of 105 kPa to 130 kPa, with a 5 kPa increment. By determining the ignition/flameout limits at different pressures, the impact of inlet pressure on the ignition/flameout performance of the combustor was analyzed. For specific research conditions and experimental results, please refer to Appendix A.
Figure 4 shows the ignition/flameout boundary curves of the CS-DM combustor at different inlet pressures.
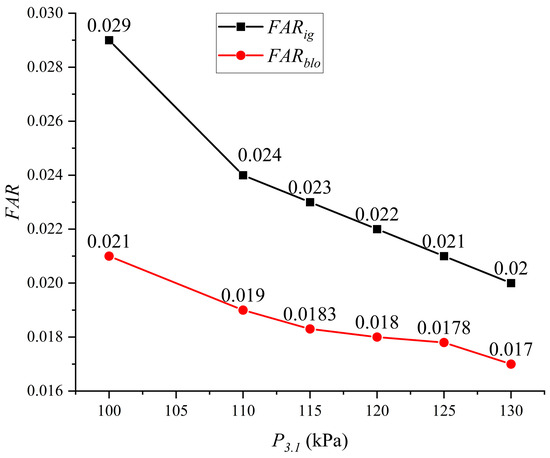
Figure 4.
Ignition and extinction boundaries of the combustor at different incoming flow pressures.
From the graph, it can be observed that the ignition fuel–air ratio of the combustor gradually decreases as the inlet pressure increases. Within the experimental range, the minimum ignition fuel–air ratio decreases from 0.029 to 0.020. When the inlet pressure reaches 130 kPa, the combustor reaches its lowest ignition fuel–air ratio of 0.020. This indicates that increasing the pressure has a positive effect on the ignition performance, which is consistent with existing research findings. Previous experimental data, whether for homogeneous mixtures, ideal flow systems, or practical combustors, all demonstrate that increasing the inlet pressure reduces the minimum ignition energy of the combustor. The influence of pressure on the minimum ignition energy is weakened for non-uniform fuel–air mixtures, depending on the extent to which the fuel evaporation rate controls the ignition process. When the ignition process is mainly controlled by the chemical reaction rate, the effect of pressure on the minimum ignition energy is more significant. However, when the ignition process is primarily controlled by the evaporation rate, the impact of pressure on the minimum ignition energy is weaker. The exponent relating the minimum ignition energy to pressure typically ranges from −0.5 to −2.0, and approaches −0.5 when the pressure or fuel–air ratio decreases. The analysis in this study regarding the influence of pressure variation on the minimum ignition fuel–air ratio of the combustor is consistent with the existing research.
Regarding the lean blowout fuel–air ratio of the combustor, it can be observed that as the inlet pressure increases, the lean blowout fuel–air ratio of the combustor slightly decreases, ranging from 0.021 to 0.017. When the inlet pressure reaches 130 kPa, the combustor reaches its lowest lean blowout fuel–air ratio of 0.017. However, compared to the minimum ignition fuel–air ratio, the lean blowout fuel–air ratio is less sensitive to pressure. This indicates that the influence of pressure on the lean blowout performance of the combustor is relatively minor compared to its impact on ignition. Other factors, such as the flow field structure and fuel–air mixing characteristics, may play a more significant role in determining the lean blowout fuel–air ratio.
3.3. The Effect of Incoming Flow Rate Variation on Ignition/Extinction Performance
In this section, a CS-DM single-tube combustor with a pilot stage swirl angle of 35° and a main stage swirl angle of 50° was investigated. The experiments were conducted with atmospheric pressure maintained as the inlet pressure, and the inlet temperature was kept constant at 300 K. The inlet flow rate of the combustor was varied from 0.060 kg/s to 0.12 kg/s, with increments of 0.01 kg/s. By analyzing the ignition/extinction limits at different flow rates, the influence of the inlet flow rate on the ignition/extinction performance of the combustor was examined. For specific operating conditions and detailed experimental results, please refer to Appendix A.
Figure 5 displays the ignition/extinction boundary curves of the center-staged swirl lean premixed combustor at different inlet flow rates.
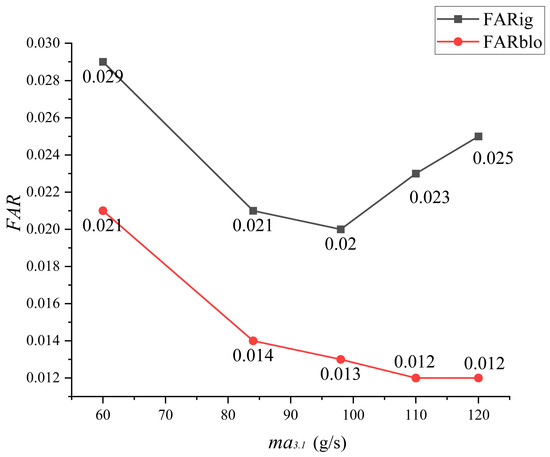
Figure 5.
Ignition and extinction boundaries of the combustor at different incoming flow rates.
From the graph, it can be observed that the minimum ignition fuel–air ratio of the combustor ranges from 0.020 to 0.025 as the inlet air flow rate varies. Initially, as the inlet flow rate increases, the minimum ignition fuel–air ratio decreases, reaching its lowest value of 0.020 at an inlet flow rate of 0.1 kg/s. However, beyond that point, the minimum ignition fuel–air ratio starts to increase, reaching a value of 0.025 at an inlet flow rate of 0.12 kg/s.
The variation in the inlet flow rate affects the ignition performance of the combustor through two main factors. Firstly, at a fixed fuel–air ratio, an increase in the inlet flow rate results in a higher fuel flow rate. This increase in nozzle pressure differential improves fuel atomization, leading to smaller droplet sizes and enhanced ignition performance. However, in practice, the fuel–air ratio is adjusted during experiments (as shown in Figure 5), and the observed trends account for this dynamic variation. Secondly, an increase in the air flow rate leads to a higher average flow velocity inside the combustor. This extended flow velocity downstream promotes a higher energy release from the spark discharge, thus reducing the heat and reactive material losses. However, it is important to note that this effect is counteracted by the convective losses associated with the increased flow velocity. Studies have indicated that to maintain the same ignition performance, an increase in the flow velocity within the combustor must be accompanied by an increase in ignition energy or a decrease in fuel droplet size. Additionally, the increased velocity within the combustor results in a shorter diffusion propagation time for the spark core within the main combustion zone. Consequently, the increase in inlet velocity is not favorable for the ignition performance of the combustor.
Based on the experimental findings of this study, it can be concluded that the variation in the inlet flow rate has a significant impact on the ignition performance of the combustor. As the inlet flow rate increases from 0.06 kg/s to 0.1 kg/s, the primary factor influencing the ignition performance is the increase in fuel flow rate, leading to a decrease in the minimum ignition fuel–air ratio of the combustor. This decrease is attributed to improved fuel atomization and reduced fuel droplet size, enhancing the ignition process.
However, as the inlet flow rate continues to increase beyond 0.1 kg/s, the dominant factor shifts to the higher average flow velocity inside the combustor. At higher flow velocities, the convective transport of spark energy downstream increases the effective ignition volume. This reduces localized heat losses and improves flame kernel growth, despite the fixed physical position of the igniter. Nonetheless, the convective losses caused by the higher flow velocity counteract these benefits. Consequently, the second factor becomes more influential, leading to an upward trend in the ignition fuel–air ratio of the combustor.
The results demonstrate that the impact of the inlet flow rate on the ignition performance of the combustor is influenced by the interplay between the fuel flow rate and the average flow velocity inside the combustor. The initial decrease in the minimum ignition fuel–air ratio is primarily driven by improved fuel atomization, while the subsequent increase is attributed to the counteracting effects of flow velocity and convective losses.
In the context of the lean blowout fuel–air ratio of the combustor, the experimental results of this study indicate a consistent decrease in the lean blowout fuel–air ratio as the inlet flow rate of the combustor increases. When the inlet flow rate reaches 0.12 kg/s, the lean blowout fuel–air ratio of the combustor reaches its lowest value of 0.012. This decrease can be attributed to the increased flow velocity within the combustor, which enhances the recirculation flow and creates a localized fuel-rich region in the central recirculation zone. This, in turn, leads to a more favorable fuel–air mixture and contributes to a lower lean blowout fuel–air ratio.
Overall, the variation in the inlet flow rate has a significant influence on both the ignition performance and the lean blowout characteristics of the central staged lean direct-injection combustor. These findings provide valuable insights for understanding and optimizing the combustion process in such combustors.
In summary, the observed trend in the variation of the inlet flow rate and its impact on the ignition performance of the central staged lean direct-injection combustor can be attributed to multiple factors. The increased flow velocity within the combustor enhances the recirculation flow and fuel atomization, improving flame stability. However, it also leads to the formation of a localized fuel-rich region in the central recirculation zone, resulting in a decrease in the lean blowout fuel–air ratio.
Overall, the variation in the inlet flow rate has a complex influence on the combustion process within the central staged lean direct-injection combustor. It affects factors such as fuel concentration distribution and flame stability, which ultimately determine the ignition performance and lean blowout characteristics of the combustor. These findings contribute to a deeper understanding of the combustion process in such combustors and provide valuable insights for optimizing their design and operation.
3.4. The Effect of Pilot Stage Swirl Intensity on Ignition/Extinction Performance
In this study, we conducted experimental research on a CS-DM combustor with pilot stage swirl angles of 35°, 40°, and 45°, and a main stage swirl angle of 40°. The main objective was to investigate how the intensity of the pilot stage swirl affects the ignition and extinction performance of the combustor. Throughout the experiments, the inlet flow pressure was maintained at atmospheric pressure, while the inlet flow temperature was held constant at 300 K.
To analyze the impact of the pilot stage swirl intensity, we varied the inlet flow rate of the combustor within the range of 0.060 kg/s to 0.12 kg/s, with a step size of 0.01 kg/s. By determining the ignition and extinction limits for different pilot stage swirl intensities, we gained valuable insights into the combustion behavior of the combustor.
For more detailed information on the specific experimental conditions and results, please refer to Appendix A.
Figure 6 illustrates the curve representing the ignition/extinction boundary of the combustor as the pilot stage swirl intensity varies.
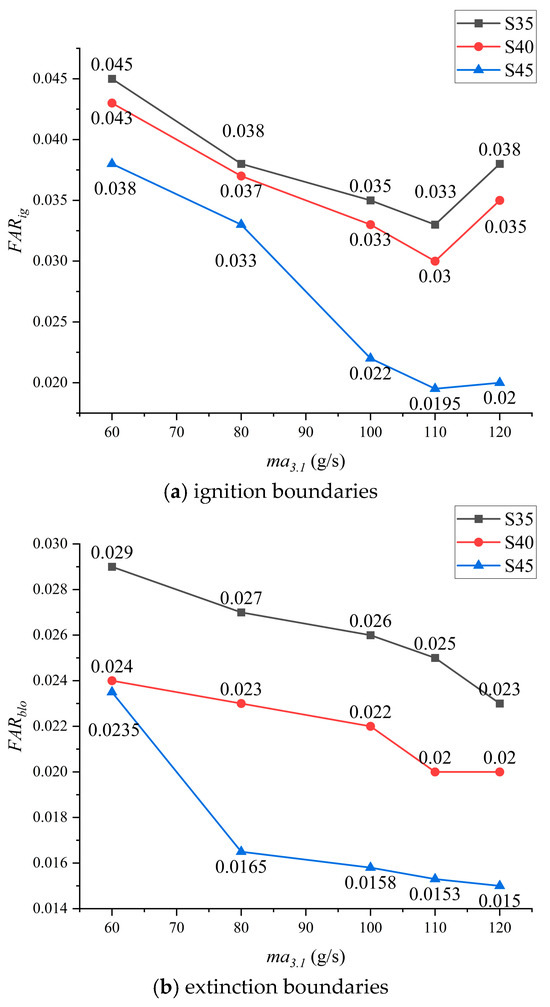
Figure 6.
Ignition and extinction boundaries of the combustor at different swirl intensity levels of the pilot stage.
From the figure, it is clear that as the pilot stage swirl intensity of the combustor increases, the minimum fuel–air ratio for ignition/extinction progressively decreases. This trend can be attributed to the formation of a larger recirculation zone within the combustor and the intensified recirculation, which enhance the mixing of fuel and air. As a result, a more uniform distribution of fuel is achieved within the combustor, leading to improved ignition capability. The homogeneous mixture of fuel and air facilitates efficient combustion reactions.
When the pilot stage swirl angle is 35°, the minimum fuel–air ratio for ignition is 0.033, and the minimum fuel–air ratio for extinction is 0.020. Notably, with a pilot stage swirl angle of 45°, the combustor reaches its lowest ignition fuel–air ratio of 0.020 and its lowest extinction fuel–air ratio of 0.012.
In summary, as the pilot stage swirl intensity increases, the fuel–air mixture becomes more uniform inside the combustor, facilitating combustion reactions and reducing the minimum fuel–air ratio for ignition. This observation aligns with the findings in Section 4 of this paper, suggesting that the variation in pilot stage swirl intensity consistently affects the ignition/extinction performance of the combustor. This indicates that the cooling air in this study does not directly participate in the combustion reactions within the combustor but primarily influences the flow rate, which subsequently impacts the numerical values of the ignition/extinction fuel–air ratio of the combustor.
From the figure, it is evident that the ignition boundary of the combustor exhibits a decreasing trend followed by an increasing trend as the inlet air flow rate increases for all three configurations. Interestingly, the lowest ignition boundary values for all three configurations are observed at an inlet flow rate of 0.11 kg/s. This indicates that there is an optimal inlet flow rate at which the combustor has the highest likelihood of successful ignition.
Additionally, the extinction boundary of the combustor continuously decreases as the inlet flow rate increases for all three configurations. This suggests that as the flow rate increases, the combustor becomes less prone to flame extinction, indicating a wider range of stable combustion.
These findings demonstrate the significant influence of the inlet air flow rate on the ignition and extinction performance of the combustor under different configurations.
3.5. The Effect of Main Stage Swirl Intensity on Ignition/Extinction Performance
In this study, experimental research was conducted on a CS-DM single-tube combustor with a pilot stage swirl angle of 35° and main stage swirl angles of 40°, 45°, and 50°. The experiments were performed with the inlet pressure maintained at atmospheric pressure and the inlet temperature kept constant at 300 K. The inlet flow rate to the combustor was varied from 0.060 kg/s to 0.12 kg/s, with a step size of 0.01 kg/s. The objective was to investigate the influence of the main stage swirl angle on the ignition/extinction performance of the combustor. By obtaining the ignition/extinction limits for different main stage swirl angles at various inlet flow rates, valuable insights into the combustion behavior of the combustor were gained. For more specific details regarding the experimental conditions and results, please refer to Appendix A.
Figure 7 illustrates the ignition/extinction boundaries of the combustor as the main stage swirl angle varies.
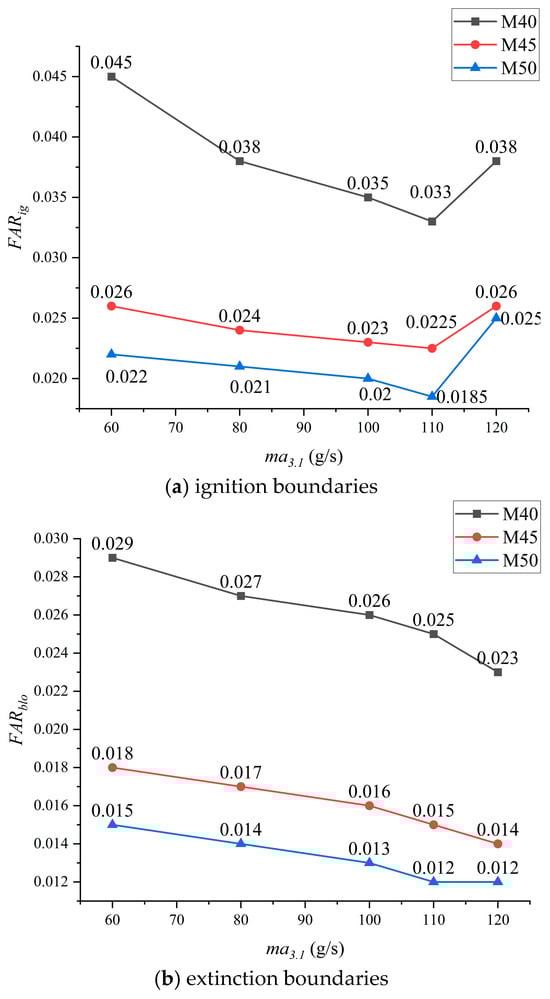
Figure 7.
Ignition and extinction boundaries of the combustor at different swirl intensity levels of the main stage.
From the graph, it is evident that as the main stage swirl angle of the combustor increases, the minimum ignition fuel–air ratio of the combustor continuously decreases. When the main stage swirl angle is 50°, the combustor reaches its lowest ignition fuel–air ratio of 0.020. This is due to the increased tangential velocity resulting from a higher main stage swirl angle, which in turn affects the pilot stage swirl and enhances its tangential velocity. As a result, the size of the central recirculation zone in the combustor expands, leading to a more uniform mixture of fuel and air. A more uniform fuel spray promotes better fuel–air interaction, thereby enhancing the ignition performance. Therefore, the ignition fuel–air ratio of the combustor decreases with an increase in the main stage swirl angle.
Comparing the variations in the minimum ignition fuel–air ratio among the three configurations, it can be observed that the difference in the minimum ignition fuel–air ratio is smaller between configurations M45 and M50, while configuration M40 exhibits the largest difference. This suggests that as the main stage swirl angle increases, the difference in ignition performance becomes less pronounced, which is consistent with the results of fuel distribution inside the combustor discussed in the previous sections.
The variation pattern of the extinction fuel–air ratio in the combustor follows a similar trend to that of the ignition fuel–air ratio. From the graph, it can be observed that the ignition boundary of the combustor initially decreases and then increases as the inlet air flow rate increases for all three configurations.
3.6. Construction of Ignition/Extinction Engineering Prediction Model Based on Surrogate Modeling
In this study, a multilayer perceptron (MLP) neural network is employed to perform regression analysis on the experimental data of ignition/extinction fuel–air ratios in the central staged lean direct-injection combustor. The dataset was divided into a training set (70%) and a validation set (30%) using stratified random sampling. The validation set spans the same parameter ranges as the training set (e.g., inlet temperature: 300–400 K, pressure: 100–200 kPa) to ensure the model’s generalizability across the entire operating envelope.
The input layer of the neural network includes covariates such as the pilot stage swirl intensity, main stage swirl intensity, inlet air temperature, inlet air pressure, and inlet air flow rate. These variables serve as the input features for the neural network. The output layer of the neural network comprises variables representing the ignition fuel–air ratio and extinction fuel–air ratio, which are the target variables for regression prediction.
The neural network architecture consists of two hidden layers, each containing 10 hidden units. The hidden layers are responsible for extracting and transforming the input features to capture complex patterns and relationships within the data. The activation function used in both the hidden layers and output layer is the hyperbolic tangent function, which introduces non-linearity into the network and allows for the modeling of non-linear relationships between the input and output variables.
The neural network structure employed in this study is depicted in Figure 8, illustrating the flow of information from the input layer through the hidden layers to the output layer. The neural network is trained using the training set data, and its performance is evaluated and validated using the validation set data.
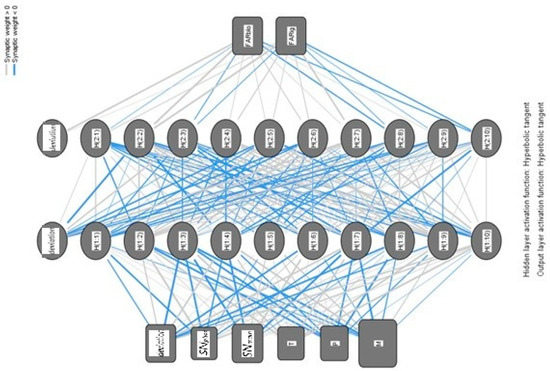
Figure 8.
Neural network architecture diagram.
The sum of squared errors (SSE) is chosen as the error function for the output layer of the neural network in this study. SSE is a commonly used error function in regression models, which measures the squared differences between the predicted values and the true values of the model. It provides an overall measure of the discrepancies between the predicted and true values.
The SSE is calculated by summing up the squared differences between each predicted value and its corresponding true value. By squaring the differences, larger errors are amplified, giving more weight to outliers or significant deviations between predicted and true values.
Using the SSE as the error function allows for the evaluation of the model’s goodness of fit. A smaller SSE indicates a better fit, as it implies that the predicted values are closer to the true values. The neural network training process involves adjusting the model parameters to minimize the SSE iteratively. This optimization process aims to improve the model’s ability to accurately predict the target variables and enhance its overall performance.
Minimizing the SSE helps the neural network to reduce the overall error between predicted and true values, ultimately improving the model’s accuracy and the quality of its predictions.
In this study, the neural network was trained to achieve a final relative error of 0.4%. The relative error for the ignition fuel–air ratio was 0.3%, indicating that the predicted values were, on average, within 0.3% of the true values. Similarly, the relative error for the extinction fuel–air ratio was 0.5%, suggesting that the predicted values for this variable were within 0.5% of the true values.
During the validation process, the relative error was slightly higher, measuring 1.7%. The ignition fuel–air ratio had a relative error of 1.1%, while the extinction fuel–air ratio had a relative error of 2.1%. Despite these slightly higher errors, the neural network still provided accurate predictions compared to the experimental values.
Figure 9 displays a comparison between the experimental values and the predictions made by the neural network for the ignition/extinction fuel–air ratios. From the figure, it is evident that the predictions closely align with the experimental values. The neural network demonstrates its effectiveness in accurately predicting the numerical values of the ignition/extinction fuel–air ratios, indicating its reliability and accuracy in this context.
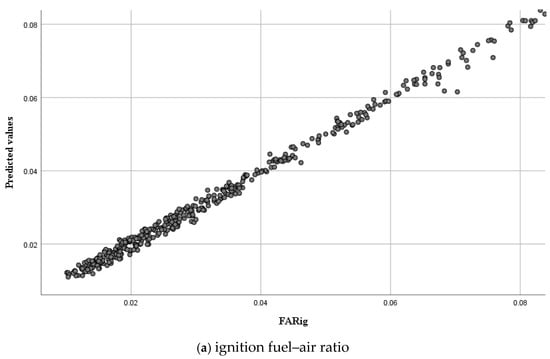
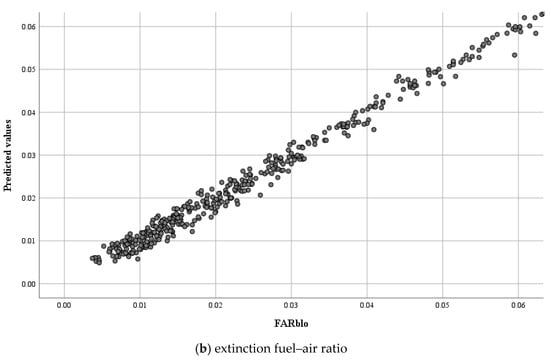
Figure 9.
Comparison between experimental results of ignition/extinction fuel–air ratios and predicted results by the neural network.
4. Conclusions
This paper presents experimental research on the ignition and extinction performance of a CS-DM (central staged direct mixing) single-tube combustor, aiming to investigate the effects of main and pilot stage swirl intensities as well as incoming airflow parameters on the combustion characteristics. The study identifies the key parameters that significantly impact the ignition and extinction performance of the combustor. Furthermore, a neural network approach is employed to establish a predictive model that relates the combustor’s ignition and extinction performance to these key parameters. The resulting neural network models have the key parameters as inputs and the ignition fuel–air ratio and extinction fuel–air ratio as outputs. The main conclusions of this study are as follows:
(1) The influence laws of the key parameters on the ignition/extinction performance of the single-tube combustor are obtained through comprehensive experimental research. It is observed that when the incoming flow temperature is below 340 K, the ignition fuel–air ratio decreases as the temperature increases. However, once the incoming flow temperature exceeds 340 K, the ignition fuel–air ratio shows a decreasing trend, while the extinction fuel–air ratio continues to decrease with further temperature increases. Moreover, both the ignition fuel–air ratio and extinction fuel–air ratio decrease as the incoming flow pressure increases. When the incoming flow rate increases, the ignition fuel–air ratio initially decreases and then exhibits an increasing trend, whereas the extinction fuel–air ratio consistently decreases. Furthermore, the ignition/extinction fuel–air ratio demonstrates a continuous decrease with an increase in the main and pilot stage swirl intensity.
(2) In order to further analyze the ignition/extinction characteristics of the center-staged direct-injection combustor, a multilayer perceptron neural network proxy model is employed. This model uses the experimental results as a basis and consists of an output layer representing the ignition fuel–air ratio and extinction fuel–air ratio, and an input layer comprising the incoming flow temperature, pressure, flow rate, and main/sub-mode vorticity intensities. The neural network model achieves a remarkable final training relative error of 0.4%, with specific relative errors of 0.3% for the ignition fuel–air ratio and 0.5% for the extinction fuel–air ratio. The validation relative error is determined to be 1.7%, with relative errors of 1.1% for the ignition fuel–air ratio and 2.1% for the extinction fuel–air ratio. These results validate the efficacy of the neural network model in accurately predicting the ignition/extinction fuel–air ratios based on the key parameters.
The findings of this study provide a foundation for optimizing the design and operation of next-generation combustors. Specifically, the neural network model can be integrated into engine design tools to predict ignition and extinction limits under varying conditions, reducing development costs and time. Future research should focus on extending the model’s applicability to multi-nozzle combustors and alternative fuels, as well as validating its performance under extreme conditions, such as high-altitude relight or transient operation.
Author Contributions
Methodology, N.J.; validation, Y.W. (Yinhui Wang), Y.Z. and Y.W. (Yuqing Wang); writing—original draft preparation, P.Z.; writing—review and editing, W.L.; project administration, N.J.; funding acquisition, W.L. All authors have read and agreed to the published version of the manuscript.
Funding
This research received no external funding.
Data Availability Statement
The data has been provided in the appendix.
Conflicts of Interest
The authors declare no conflict of interest.
Appendix A
Table A1.
Single-combustor ignition/extinction performances test data.
Table A1.
Single-combustor ignition/extinction performances test data.
| SNpilot | SNmain | T3.1 | P3.1 | Ma3.1 | FARig | FARblo |
|---|---|---|---|---|---|---|
| 0.516 | 1.0319 | 300 | 103 | 60 | 0.022 | 0.015 |
| 0.516 | 1.0319 | 300 | 103 | 84 | 0.021 | 0.014 |
| 0.516 | 1.0319 | 300 | 103 | 98 | 0.02 | 0.013 |
| 0.516 | 1.0319 | 300 | 103 | 110 | 0.023 | 0.012 |
| 0.516 | 1.0319 | 300 | 103 | 120 | 0.025 | 0.012 |
| 0.516 | 1.0319 | 300 | 103 | 60 | 0.029 | 0.021 |
| 0.516 | 1.0319 | 310 | 103 | 60 | 0.0287 | 0.021 |
| 0.516 | 1.0319 | 320 | 103 | 60 | 0.028 | 0.021 |
| 0.516 | 1.0319 | 330 | 103 | 60 | 0.027 | 0.021 |
| 0.516 | 1.0319 | 340 | 103 | 60 | 0.026 | 0.0205 |
| 0.516 | 1.0319 | 350 | 103 | 60 | 0.027 | 0.02 |
| 0.516 | 1.0319 | 360 | 103 | 60 | 0.028 | 0.02 |
| 0.516 | 1.0319 | 370 | 103 | 60 | 0.029 | 0.019 |
| 0.516 | 1.0319 | 380 | 103 | 60 | 0.035 | 0.018 |
| 0.516 | 1.0319 | 300 | 103 | 60 | 0.029 | 0.021 |
| 0.516 | 1.0319 | 300 | 110 | 60 | 0.024 | 0.019 |
| 0.516 | 1.0319 | 300 | 115 | 60 | 0.023 | 0.0183 |
| 0.516 | 1.0319 | 300 | 120 | 60 | 0.022 | 0.018 |
| 0.516 | 1.0319 | 300 | 125 | 60 | 0.021 | 0.0178 |
| 0.516 | 1.0319 | 300 | 130 | 60 | 0.02 | 0.017 |
| 0.516 | 0.8684 | 300 | 103 | 60 | 0.045 | 0.029 |
| 0.516 | 0.8684 | 300 | 103 | 80 | 0.038 | 0.027 |
| 0.516 | 0.8684 | 300 | 103 | 100 | 0.035 | 0.026 |
| 0.516 | 0.8684 | 300 | 103 | 110 | 0.033 | 0.025 |
| 0.516 | 0.8684 | 300 | 103 | 120 | 0.038 | 0.023 |
| 0.516 | 0.7217 | 300 | 103 | 60 | 0.026 | 0.018 |
| 0.516 | 0.7217 | 300 | 103 | 80 | 0.024 | 0.017 |
| 0.516 | 0.7217 | 300 | 103 | 100 | 0.023 | 0.016 |
| 0.516 | 0.7217 | 300 | 103 | 110 | 0.0225 | 0.015 |
| 0.516 | 0.7217 | 300 | 103 | 120 | 0.026 | 0.014 |
| 0.6149 | 0.8684 | 300 | 103 | 60 | 0.043 | 0.024 |
| 0.6149 | 0.8684 | 300 | 103 | 80 | 0.037 | 0.023 |
| 0.6149 | 0.8684 | 300 | 103 | 100 | 0.033 | 0.022 |
| 0.6149 | 0.8684 | 300 | 103 | 110 | 0.03 | 0.02 |
| 0.6149 | 0.8684 | 300 | 103 | 120 | 0.035 | 0.02 |
| 0.728 | 0.8684 | 300 | 103 | 60 | 0.038 | 0.0235 |
| 0.728 | 0.8684 | 300 | 103 | 80 | 0.033 | 0.0165 |
| 0.728 | 0.8684 | 300 | 103 | 100 | 0.022 | 0.0158 |
| 0.728 | 0.8684 | 300 | 103 | 110 | 0.0195 | 0.0153 |
| 0.728 | 0.8684 | 300 | 103 | 120 | 0.02 | 0.015 |
References
- Jin, R.; Suo, J. Gas Turbine Combustion; Aviation Industrial Publishing House: Beijing, China, 2016. [Google Scholar]
- Longwell, J.P.; Weiss, M.A. High Temperature Reaction Rates in Hydrocarbon Combustion. Ind. Eng. Chem. 1955, 47, 1634–1643. [Google Scholar] [CrossRef]
- Longwell, J.P.; Frost, E.E.; Weiss, M.A. Flame Stability in Bluff Body Recirculation Zones. Ind. Eng. Chem. 1953, 45, 1629–1633. [Google Scholar] [CrossRef]
- Longwell, J.P. Selected Combustion Problem Fundamentals and Aeronautical. In Proceedings of the AGARD NATO Combustion Colloquium, Cambridge, UK, 7–11 December 1953. [Google Scholar]
- Zukowski, E.E.; Marbel, F.E. The role of wake transition in the process of flame stabilization on bluff bodies. In Proceedings of the AGARD Combustion Researches and Reviews, Liege, Belgium, 9 December 1955. [Google Scholar]
- Zukowski, E.E. Flame Stabilization on Bluff Bodies at Low and Intermediate Reynolds Numbers. Ph.D. Dissertation, California Institute of Technology, Pasadena, CA, USA, 1954. [Google Scholar]
- Foster, J.R. Effects of Combustion Chamber Blockage on Bluff Body Flame Stabilization. Ph.D. Dissertation, California Institute of Technology, Pasadena, CA, USA, 1956. [Google Scholar]
- Ames, L.E. Interference Effects Between Multiple Bluff Body Flame Holders. Ph.D. Dissertation, California Institute of Technology, Pasadena, CA, USA, 1956. [Google Scholar]
- Ballal, D.R.; Lefebvre, A.H. A general model of spark ignition for gaseous and liquid fuel-air mixtures. Symp. Combust. 1981, 18, 1737–1746. [Google Scholar] [CrossRef]
- Ballal, D.R.; Lefebvre, A.H. The influence of flow parameters on minimum ignition energy and quenching distance. Symp. (Int.) Combust. 1975, 15, 1473–1481. [Google Scholar] [CrossRef]
- Ballal, D.R.; Lefebvre, A.H. The influence of spark discharge characteristics on minimum ignition energy in flowing gases. Combust. Flame 1975, 24, 99–108. [Google Scholar] [CrossRef]
- Ballal, D.R.; Lefebvre, A.H. Gas Turbine Combustion: Alternative Fuels and Emissions; CRC Press: New York, NY, USA, 2010. [Google Scholar]
- Peters, J.E. Predicted TF41 performance with the AGARD research fuel. J. Aircr. 2015, 21, 787–791. [Google Scholar] [CrossRef]
- Schmidt, D.A.; Mellor, A.M. Characteristic Time Correlation for Combustion Inefficiency from Alternative Fuels. J. Energy 1979, 3, 167–176. [Google Scholar] [CrossRef]
- Duffy, K.P. Characteristic Time Model Development for Direct Injection Diesel Engines; Vanderbilt University: Nashville, TN, USA, 1998. [Google Scholar]
- Leonard, P.A.; Mellor, A.M. Correlation of Lean Blowoff of Gas Turbine Combustors Using Alternative Fuels. J. Energy 1983, 7, 729–732. [Google Scholar] [CrossRef]
- Mellor, A.M.; Jarymowycz, T.A. Correlation of lean blowoff in an annular combustor. J. Propuls. Power 2011, 2, 190–192. [Google Scholar]
- Mellor, A.M. Design of Modern Turbine Combustors; Academic Press: London, UK, 1990. [Google Scholar]
- Plee, S.; Mellor, A.M. Flame Stabilization in Simplified Prevaporizing, Partially Vaporizing, and Conventional Gas Turbine Combustors. J. Energy 2013, 2, 346–353. [Google Scholar] [CrossRef]
- Samuelsen, G.S.; Mcdonell, V.G.; Couch, P.M. Characterization of Flameholding Tendencies in Premixer Passages for Gas Turbine Applications. In Proceedings of the AIAA/ASME/SAE/ASEE Joint Propulsion Conference & Exhibit, Fort Lauderdale, FL, USA, 11–14 July 2004. [Google Scholar]
- Ateshkadi, A.; Mcdonell, V.G.; Samuelsen, G.S. Lean blowout model for a spray-fired swirl-stabilized combustor. Proc. Combust. Inst. 2000, 28, 1281–1288. [Google Scholar] [CrossRef]
- Rizk, N.K.; Mongia, H.C. Gas turbine combustor design methodology. In Proceedings of the 22nd Joint Propulsion Conference, Huntsville, AL, USA, 16–18 June 1986. [Google Scholar]
- Rizk, N.K.; Mongia, H.C. Three-dimensional analysis of gas turbine combustors. J. Propuls. Power 2011, 7, 445–451. [Google Scholar] [CrossRef]
- Mongia, H. Perspective of Combustion Modeling for Gas Turbine Combustors. In Proceedings of the 42nd AIAA Aerospace Sciences Meeting and Exhibit, Reno, NV, USA, 5–8 January 2004. [Google Scholar]
- Rasmussen, C.C.; Driscoll, J.F. Blowout limits of flames in high-speed airflows: Critical damkohler number. In Proceedings of the 44th AIAA/ASME/SAE/ASEE Joint Propulsion Conference and Exhibit, Hartford, CT, USA, 21–23 July 2008. NO. 2008-4571. [Google Scholar]
- Driscoll, J.F.; Rasmussen, C.C. Correlation and Analysis of Blowout Limits of Flames in High-Speed Airflows. J. Propuls. Power 2005, 21, 1035–1044. [Google Scholar] [CrossRef]
- Huang, X.; Huang, Y.; Wang, F.; Hu, B. Bunsen Flame Blow-Off: Velocity-Matching Method. In Proceedings of the ASME 2011 Turbo Expo: Turbine Technical Conference and Exposition, Vancouver, BC, Canada, 6–10 June 2011. [Google Scholar]
- Sturgess, G.; Gogineni, S.; Shouse, D. Influences of airblast-atomizing fuel injector design on primary zone flame characteristics at blowout. In Proceedings of the 35th Aerospace Sciences Meeting and Exhibit, Reno, NV, USA, 6–10 January 1997. [Google Scholar]
- Sturgess, G.J.; Heneghan, S.P.; Vangsness, M.D.; Ballal, D.R.; Lesmerises, A.L.; Shouse, D. Effects of Back-Pressure in a Lean Blowout Research Combustor. J. Eng. Gas Turbines Power 1992, 115, 486–498. [Google Scholar] [CrossRef]
- Gogineni, S.; Shouse, D.; Frayne, C.; Stutrud, J.; Sturgess, G. Combustion Air Jet Influence on Primary Zone Characteristics for Gas-Turbine Combustors. J. Propuls. Power 2015, 18, 407–416. [Google Scholar] [CrossRef]
- Sturgess, G.; Shouse, D. A hybrid model for calculating lean blowouts in practical combustors. In Proceedings of the 32nd Joint Propulsion Conference and Exhibit, Lake Buena Vista, FL, USA, 1–3 July 1996. [Google Scholar]
- Sturgess, G.J.; Sloan, D.G.; Lesmerises, A.L.; Heneghan, S.P.; Ballal, D.R. Design and Development of a Research Combustor for Lean Blow-Out Studies. J. Eng. Gas Turbines Power 1990, 114, 13–19. [Google Scholar] [CrossRef]
- Switzer, G.; Sturgess, G.; Sloan, D.; Shouse, D. Relation of CARS temperature fields to lean blowout performance in an aircraft gas turbine generic combustor. In Proceedings of the 30th Joint Propulsion Conference and Exhibit, Indianapolis, IN, USA, 27–29 June 1994. [Google Scholar]
- Yang, H.; Yang, Q.; Mu, Z.; Du, X.; Chen, L. Optimal Design of Three-Dimensional Circular-to-Rectangular Transition Nozzle Based on Data Dimensionality Reduction. Energies 2022, 15, 9316. [Google Scholar] [CrossRef]
Disclaimer/Publisher’s Note: The statements, opinions and data contained in all publications are solely those of the individual author(s) and contributor(s) and not of MDPI and/or the editor(s). MDPI and/or the editor(s) disclaim responsibility for any injury to people or property resulting from any ideas, methods, instructions or products referred to in the content. |
© 2025 by the authors. Licensee MDPI, Basel, Switzerland. This article is an open access article distributed under the terms and conditions of the Creative Commons Attribution (CC BY) license (https://creativecommons.org/licenses/by/4.0/).