Article

Scalability of eVTOL Systems: Insights from Multi-Pad Configurations and CPN Analysis

Faculty of Transport, Warsaw University of Technology, 75 Koszykowa St., 00-662 Warsaw, Poland
*
Author to whom correspondence should be addressed.
Aerospace 2025, 12(2), 147; https://doi.org/10.3390/aerospace12020147
Submission received: 18 January 2025 / Revised: 9 February 2025 / Accepted: 14 February 2025 / Published: 15 February 2025
(This article belongs to the Section Air Traffic and Transportation)

Abstract

:
Electric vertical takeoff and landing (eVTOL) technology can improve connectivity while minimizing reliance on traditional ground-based transportation systems. However, the rapid growth in eVTOL adoption brings challenges in managing landing pad operations and scheduling routes effectively. This study aims to analyze eVTOL landing operations and provide a framework for evaluating system performance under different configurations. Key objectives include (i) identifying bottlenecks in landing pad operations, (ii) proposing improvements to enhance scalability and efficiency through multi-route and multi-pad configurations, and (iii) assessing the impact of operational parameters, such as increased horizontal speed, on overall performance. A simulation analysis was conducted using an original model developed with colored, timed Petri net technology. This methodology aligns with the principles of probabilistic modeling and queuing systems. The experiments provided a comprehensive analysis of the factors influencing the scalability and efficiency of eVTOL operations. A key finding across all experiments is the identification of the “Landing Confirmed—Move to V” as a consistent bottleneck stage. While increasing routes and pads significantly alleviates arrival delays, it does not address identified bottlenecks, which require innovative solutions such as route optimization or speed enhancements. The results underscore the importance of a robust and adaptable framework to support the increasing demand for eVTOL traffic. Urban planners and policymakers can utilize these findings to prioritize the development of vertiports capable of supporting this expanding mode of transportation. The scalability demonstrated in this study validates the feasibility of eVTOL systems as a viable solution for urban mobility.

1. Introduction

Urban air mobility (UAM) is emerging as a transformative solution to alleviate traffic congestion and address environmental concerns, with electric vertical takeoff and landing (eVTOL) technology playing a pivotal role in enabling efficient, point-to-point urban transit [1,2]. By offering an alternative to conventional ground transportation, eVTOLs have the potential to enhance urban connectivity and streamline mobility [3]. However, integrating eVTOL operations into urban infrastructure presents significant challenges, particularly in managing vertiport scheduling, optimizing landing pad usage, and ensuring seamless operational efficiency [4,5]. As the demand for eVTOL services grows [6], effective scheduling strategies become critical to maintaining scalable and reliable UAM operations.
Unlike small drones that benefit from flexible takeoff and landing locations, eVTOLs require dedicated ground infrastructure known as vertiports. These range from simple landing pads atop buildings to complex multi-level facilities that redefine urban architecture and mobility planning. A key challenge in the scalability of UAM operations is the limited availability of vertiports and landing pads, which can create operational bottlenecks during peak traffic hours. The constraints posed by infrastructure limitations, coupled with high-density terminal airspace and battery endurance considerations, necessitate innovative scheduling solutions to ensure efficient resource utilization [7,8].
Current scheduling models often struggle to scale effectively, leading to congestion, increased delays, and inefficient resource allocation. Traditional approaches lack the flexibility to adapt to dynamic traffic patterns and fail to account for interdependencies between route planning, pad configurations, and real-time operational parameters [1,9]. Additionally, existing frameworks do not fully incorporate infrastructural and regulatory constraints, limiting their adaptability in real-world scenarios [10]. Addressing these inefficiencies requires a robust scheduling mechanism that optimizes vertiport throughput while minimizing delays.
This study seeks to bridge the gap between infrastructure expansion and operational efficiency by analyzing one of the existing vertiport scheduling frameworks and identifying operational bottlenecks. We employ Petri nets to evaluate system performance across multi-route and multi-pad configurations to achieve this. The key objectives of this research include the following:
  • Identifying bottlenecks in vertiport landing operations and scheduling.
  • Investigating the effects of common expansions in vertiports, such as adding routes and pads, and their impact on the bottlenecks.
  • Evaluating the impact of operational parameters, such as increased horizontal speed, on overall performance.
This study contributes to the ongoing discourse on UAM scalability and operational efficiency by focusing on these objectives. The findings presented herein will support the effective management of vertiports, improving eVTOL operations’ reliability and the overall passenger experience. This research establishes a foundation for scalable and efficient vertiport operations through a data-driven approach, ensuring their successful integration into future urban mobility systems.
The remainder of this paper provides a comprehensive analysis and simulation of landing operations and the scheduling challenges involved. First, we review the existing literature on eVTOL scheduling and the possibility of using Petri nets to evaluate these models. We then introduce the selected vertiport operations model, including using Petri nets for system modeling. The study further presents simulation experiments and results, discussing the impact of different configurations on operational performance. Finally, we conclude with key findings and recommendations for future research, ensuring a structured approach to integrating eVTOL operations into urban landscapes.

2. Materials and Methods

This section explores the application of colored Petri nets (CPNs) in modeling vertiport operations for eVTOL traffic management. It begins with a fundamental overview of Petri nets, their structure, and key properties, followed by an explanation of how CPNs enhance system representation through colored tokens and timed transitions. The formal definition of the CPN model used in this study is presented, detailing the elements governing eVTOL movement, operational constraints, and hierarchical modeling for efficient system analysis.

2.1. Petri Nets

The concept of Petri nets for describing concurrent processes using simple graphical notation was first presented in [11]. Thanks to its intuitive graphical modeling language and advanced formal analysis methods, Petri nets found wide applications—initially for modeling operating systems, distributed databases, and other computer issues. Over time, the field of applications has expanded considerably, covering more areas, including transportation applications and safety theory. Particularly important for the development of applications was the introduction of the ability to model time and distinguishable tokens to Petri nets, which correspond to data types found in programming languages [12,13]. They form a class of high-level Petri nets ideal for modeling and analyzing complex, concurrent, and stochastic systems, such as eVTOL traffic operations. By associating colors (data types) with tokens, CPNs provide a detailed and dynamic way to capture system behavior, enabling the representation of distinct eVTOL states and attributes throughout their operational lifecycle.
A crucial aspect in favor of using Petri nets in applied scientific research is the fact that a model realized in the form of a Petri net is not only a graphical representation of the system under study, but it is also possible to simulate the operation of the network, so it is possible to study the operation of this system by observing changes in its states over time [14]. This is particularly important in the context of transportation systems such as UAM. This is because such systems are characterized by continuous time and discrete states, which makes discrete simulation a practical approach in these situations [15].
One can define Petri nets as having specific properties that differ depending on the needs. However, there is a set of features that are common to such networks. The basis for building Petri nets is a bipartite graph consisting of two disjoint vertex sets called places and transitions. Edges in such a graph are directed. Thus, a characteristic feature of the graph used in Petri nets is that arcs must connect different types of vertices.
Places in a Petri net are a set of graph vertices describing possible states of the system under study. These states can be associated with specific numerical quantities or logical conditions depending on the interpretation. In graphical notation, places are denoted by an ellipse or a circle. Transitions in a Petri net are a set of graph vertices describing events (actions, activities) that modify the state of the system under study. In graphical notation, transitions are denoted by rectangles.
Edges in a Petri net are directed, so they are arcs. They describe the relationship between the states of the system under study and the events that modify them. On the one hand, the arcs indicate when an event can occur. Thus, they describe the conditions necessary for the occurrence of an event. On the other hand, the arcs indicate those states which inhibit the event. At the same time, the arcs indicate what state change the event will cause. In graphical notation, the arcs are indicated by lines followed by arrows or circles.

2.2. Modeling Vertiport Operations with Colored Petri Nets

Formally, a CPN used in this study is defined as follows:
S V P T = P , T , I , O , H , M 0 , τ , Γ , C , G , E , R , r 0
where
P—set of places;
T—set of transitions, T P = ;
I, O, and H are functions of input, output, and inhibitors, respectively;
I, O, H: TB(P), where B(P) is a multiset over the set P. Multisets differ from classical sets in that individual elements can occur multiple times in a multiset.
Given a transition t T , one can define the following:
t + = p P : I p , t > 0 —the set of inputs of transition t;
t = p P : O t , p > 0 —the set of outputs of transition t;
t o = p P : H p , t > 0 —the set of inhibitors of transition t.
M 0 : P Z + —the initial marking, i.e., a function that assigns a non-negative integer to each place. We also say that the marking determines the number of tokens allocated to each place.
The initial marking, together with the rules that determine the dynamics of the network, that is, the rules for changing markings, determine all possible markings achievable from M0 or markings that can occur if the initial marking is M0. The same network, but with different initial markings, will describe different systems.
A transition t is called active at marking M if and only if
p t + , M p I p , t p t o , M p < H p , t
Transition activity is a prerequisite for its firing, which means realizing an event (execution of an action). The firing of a transition t, active at the marking M, results in the removal from each place p, belonging to the set t + , of as many markers as specified by the function I p , t and the addition to each place p from the set t of as many markers as specified by the function O t , p , that is, it results in a change of marking to M such that
M p = M p + O t , p I p , t , p t + p t
This relationship is written abbreviated M [ t M . We then say that M is reachable directly from M. If such a change requires firing a sequence of transitions σ, then we say that M is reachable from M and write M [ σ M .
In this study, each place p P represents a distinct phase of eVTOL landing, such as arrival, waiting, landing, or ground handling. Tokens in these places represent individual eVTOLs, with attributes such as arrival times, assigned landing pads, and operational states. The transitions t T capture the events that move tokens (eVTOLs) between states, such as clearance for landing or completion of ground handling.
The framework incorporates timed transitions to accurately model the temporal aspects of eVTOL operations. Each transition is associated with the following:
τ : T R + —delay function, determining the static delay τ(t) of transition t, where τ(t) specifies the time required for an event, such as the duration of landing or the clearance interval between consecutive arrivals. The mentioned timing mechanism ensures that the model reflects real-world constraints, such as maintaining a minimum separation time tsep to avoid congestion and ensure safety. For example, in the landing phase, tokens must wait at a place until the associated transition’s delay has elapsed. This models the temporal dependency between consecutive eVTOL operations, ensuring the system adheres to operational constraints like the 90 s separation time.
Г—non-empty finite set of colors, each of which can be a timed set; that is, one whose elements are pairs consisting of a color and a timestamp;
C—a function that determines tokens of what color can be stored at a given place, C : P Γ ;
G—a function that specifies the conditions that must be met for a transition to be fired; these are expressions, called guards, containing constants and variables of types belonging to Г, for which a valuation can be made that results in a logical value;
E—a function describing so-called arc weights, which means an expression containing constants and variables of types belonging to Г, for which a valuation can result in a multiset over the type of color assigned to the location at the beginning or end of the arc.
Generally, color in a colored Petri net can be interpreted broadly and flexibly. Any color belonging to Г can be any data structure, including complex ones.
R set of timestamps (also called timepoints), closed due to the addition operation, R R ;
r0—initial time, r 0 R .
In timed nets, it is necessary to realize the so-called model clock, which determines the local flow of time. It is usually realized using timestamps, generally associated with network tags. This clock is used to determine which transition can be activated. The prerequisite for this is the existence, at the input points of the transition, of marking in which all timestamps are less than or equal to the local time.
In colored timed Petri nets, the meaning of marking M changes concerning timed colors. In this case, marking consists of the number of tokens with the determination of their timestamps, which can differ for each token. For non-timed colors, marking consists only of the number of tokens of a specific color.
The system’s state modeled by a colored timed Petri net is called a pair M , r , with M being the marking and r R being the timestamp.
CPNs support hierarchical modeling, which allows complex systems to be decomposed into subnets, making them easier to manage and analyze [16]. For eVTOL landing operation, the model is divided into modules representing distinct processes, such as arrival sequencing, landing pad allocation, and delay absorption. Each module operates as an independent subnet connected to the more extensive system through substitution transitions.

3. Vertiport Operations Model

To effectively model vertiport operations for eVTOL traffic management, this section integrates airspace design principles with a colored Petri net (CPN) framework. It begins by outlining the structured approach to managing eVTOL arrivals and departures, including airspace organization, metering fixes, and separation requirements. The discussion then shifts to the CPN representation of the operational framework, detailing its components, transition logic, and the sequential steps involved in the landing process. Stochastic modeling techniques, such as probability density functions (PDFs) and cumulative distribution functions (CDFs), are introduced to generate realistic arrival patterns. Finally, the methodology for integrating these probabilistic inputs into the CPN model and running simulations to assess vertiport capacity and efficiency is presented.

3.1. Airspace Design and Operational Framework

This study’s airspace design and operational framework is based on an established structure for managing eVTOL traffic at vertiports, as detailed in [17]. This approach features metering fixes for arrival and departure positioned at a radius (r) from the vertiport to enforce time-based separation and reduce congestion near the landing pads. These metering fixes are gates that absorb delays in low-density areas, ensuring systematic sequencing of arrivals and departures.
EVTOL arrivals are initiated from a cruise phase at a radius (R) of 3500 m from the vertiport. The flight path includes a continuous descent phase to one of two approach fixes, followed by a horizontal flight segment (d = 135 m) and a vertical altitude descent (h = 200 m). The final approach area, modeled as a circular region with a radius (r = 400 m), incorporates two approach fixes (A and B), spaced at one-quarter of the final approach area’s circumference. Each approach fix is assigned to a dedicated landing pad to ensure independent and conflict-free operations. A minimum time separation (tsep = 90 s) [17] is imposed between consecutive arrivals at a fix. This provides adequate lateral separation (305 m) and prevents multiple eVTOLs from simultaneously occupying the vertical descent phase, allowing sufficient time for landing pad clearance.
Our study aimed to determine the system’s maximum capacity, so a steady (but safety-compliant) inflow of objects to be served should be assumed. The assumption of a 90 s interval is based on established research, including [18], which conducted an exploratory analysis of airspace throughput in urban air mobility systems, as well as [17], which studied rolling-horizon arrival scheduling for eVTOLs. These studies incorporate similar assumptions to ensure safe and efficient airspace management.
In our model, the 90 s interval is specifically applied to maintain a minimum lateral separation of 1000 ft (305 m) [18], preventing two or more eVTOLs from simultaneously occupying the vertical flight phase. Furthermore, the software implementation is designed as a validation check rather than a fixed constraint, meaning that no additional delay is imposed if operations naturally meet this minimum threshold. This approach ensures flexibility and adherence to safe separation standards within the modeled system.
The design of the arrival airspace above considers the operational flight characteristics and performance capabilities of the EHang 184. This autonomous aerial vehicle follows a wingless multirotor configuration designed to carry a single passenger. It features eight electric motors with a total power output of 152 kW and a battery capacity of 14.4 kWh. The EHang 184 achieves an average cruise speed of 100 km/h, with a total flight time of approximately 25 min and a practical range of 42 km. Due to its large disk actuator area, it is highly efficient in hover, making it well suited for short-range urban missions where vertical takeoff and landing capabilities are critical [19].
A comparable eVTOL alternative with similar operational characteristics is the Volocopter 2X. Like the EHang 184, it is a wingless multirotor designed for urban air mobility, emphasizing vertical takeoff, hover efficiency, and maneuverability in constrained airspace. It shares the same fundamental principles of a large disk actuator area, which optimizes hover performance. The Volocopter 2X is already undergoing certification and has demonstrated capabilities similar to the EHang 184, reinforcing its viability as an alternative [19].
The model remains applicable to any eVTOL that meets the defined operational parameters, particularly the required speeds for efficient vertiport integration, rather than being limited to specific vehicle types.
The adopted airspace structure around the vertiport is shown in Figure 1.

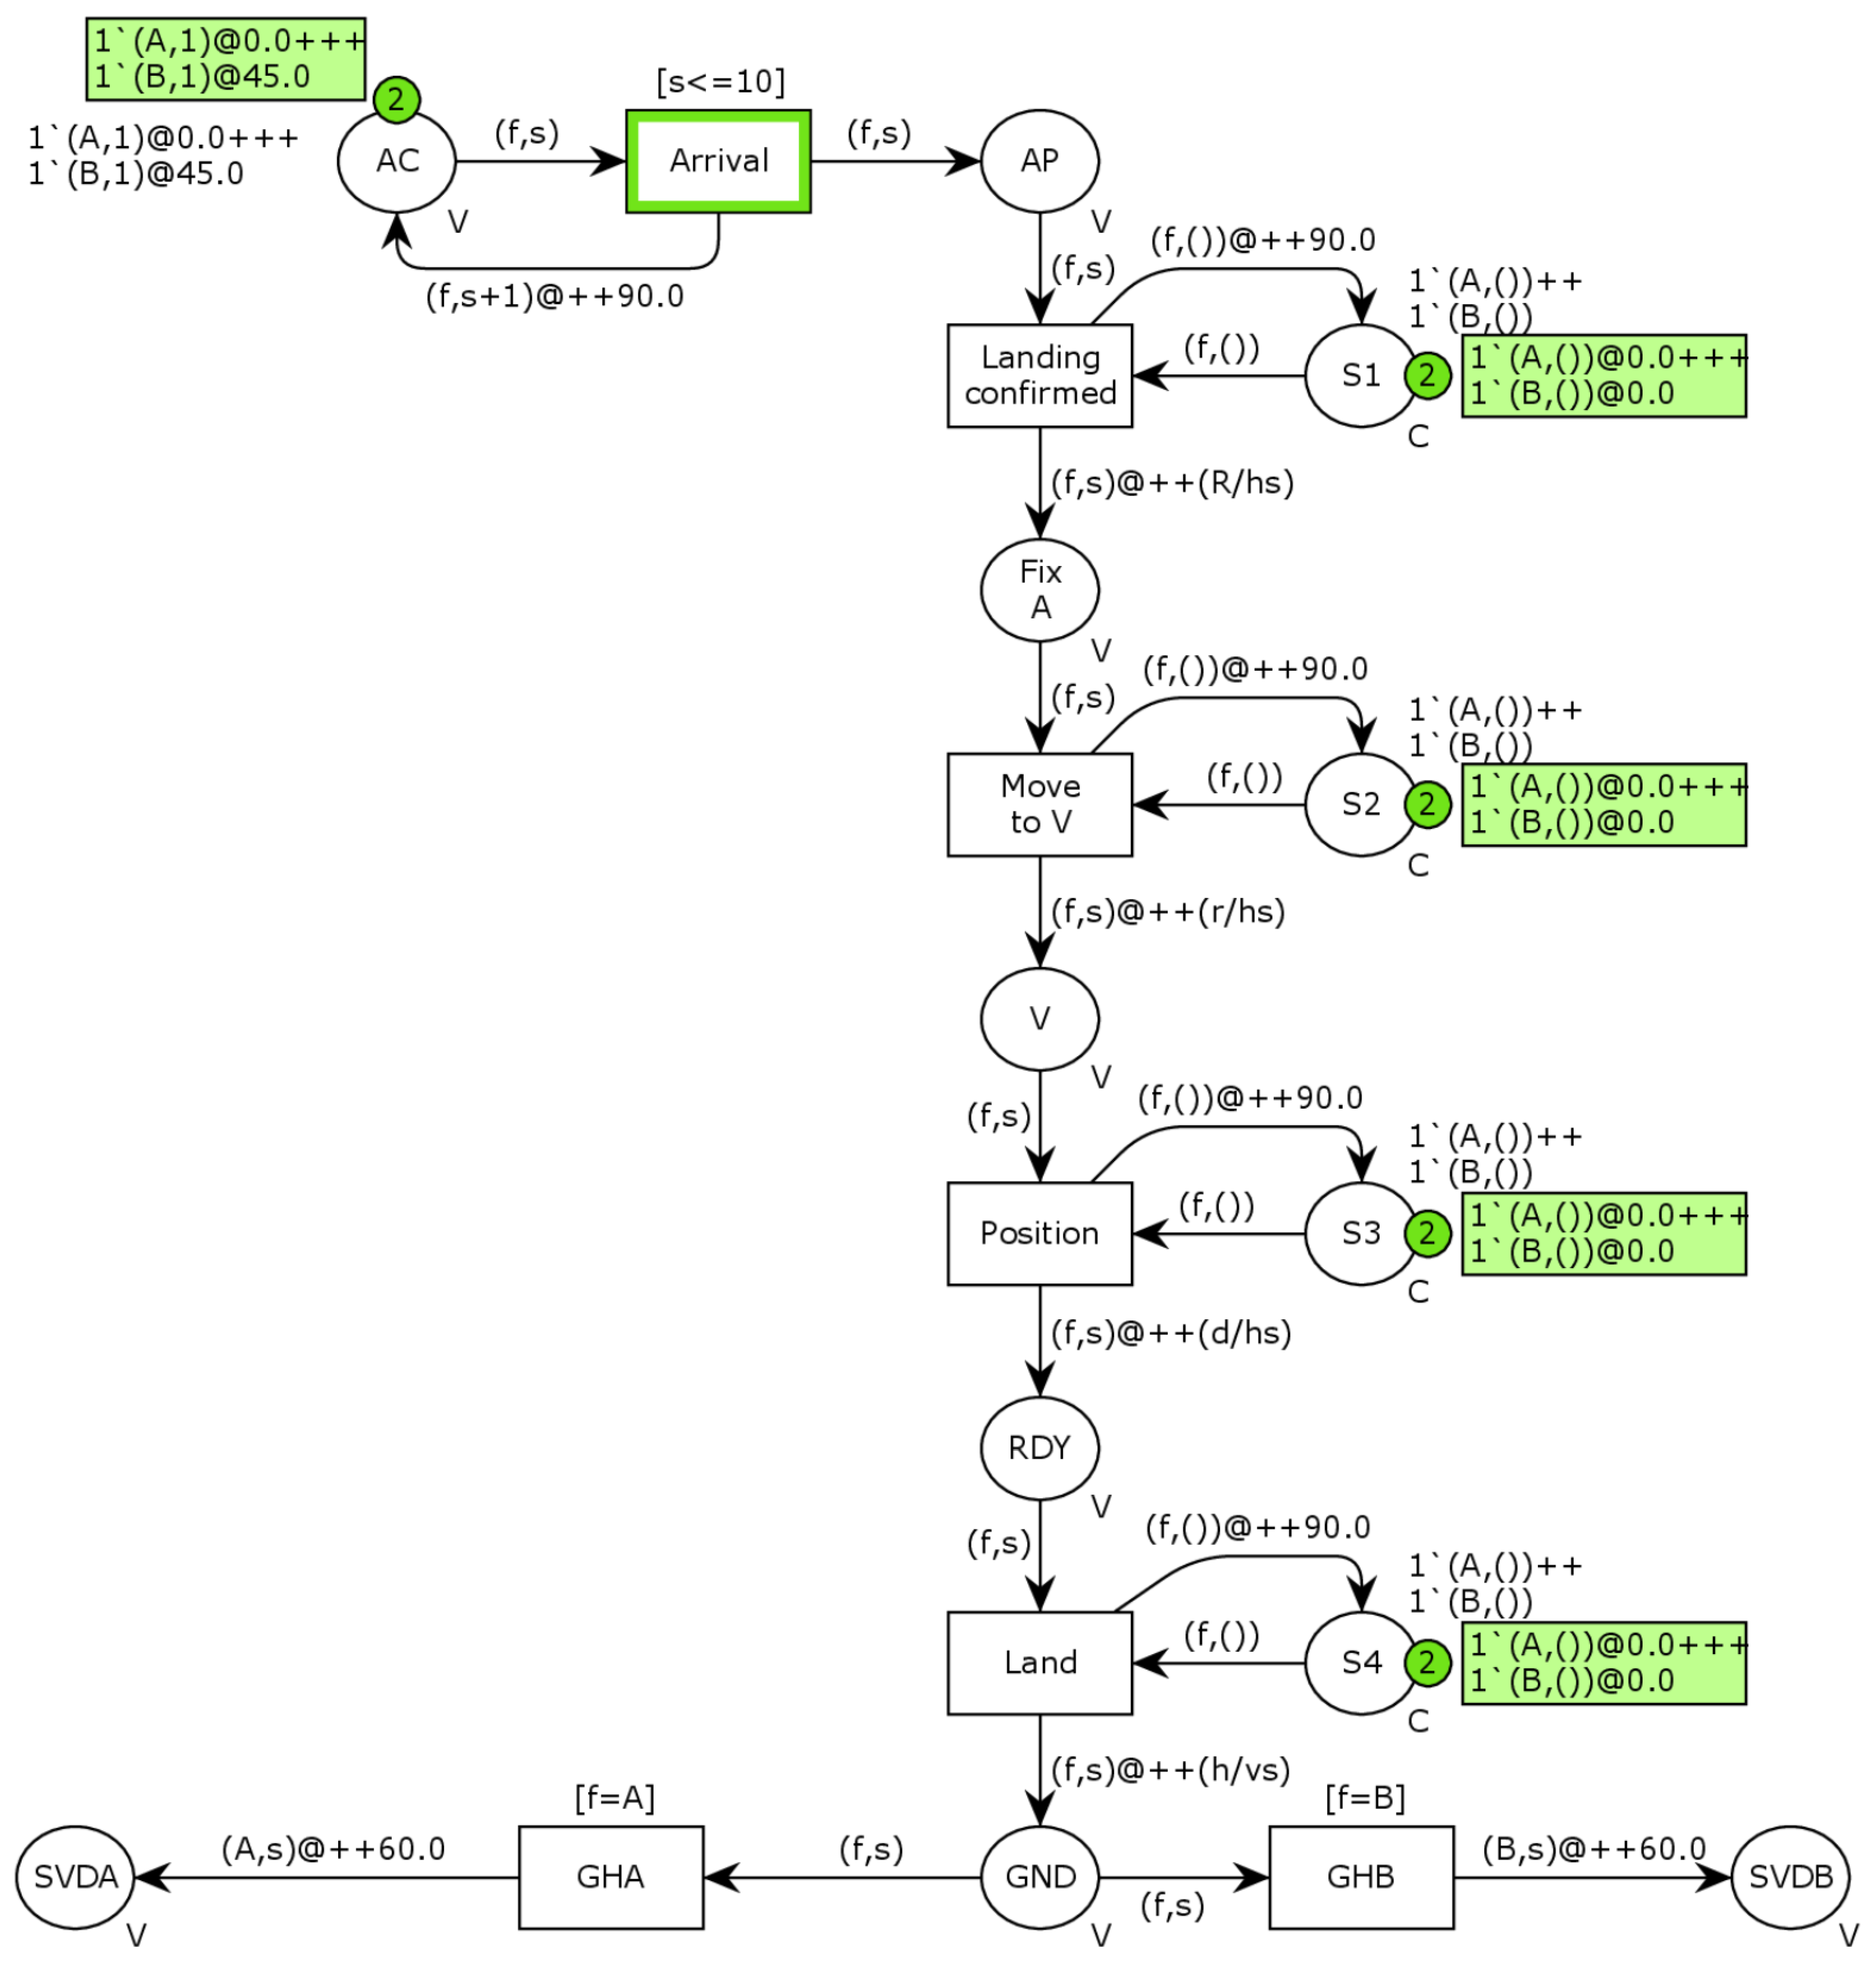
3.2. Pet Net Representation of the Operational Framework

The basic form of the model representing a single service line with two landing pads as a colored timed Petri net is shown in Figure 2.
The set of transitions in this model consists of seven elements, representing key activities related to aircraft operations, ground handling, and vertiport area management services. The “Arrival” transition signifies the aircraft’s entry into the system, initiating its movement through the service line. “Landing confirmed” represents verifying a successful landing, ensuring the aircraft is ready for further processing. “Fix A” serves as a checkpoint, aligning the aircraft for subsequent steps, while “Move to V” handles repositioning within the system. The “Position” transition ensures proper alignment before the final descent, culminating in “Land”, which marks the aircraft’s touchdown at the designated landing pad. “GHA” and “GHB” are transitions representing ground handling at two pads.
The model also defines a set of 12 places that capture the system’s various states and traffic conditions. For instance, “AC” represents the state when the aircraft has reached the initial holding area for arriving aircraft. At the same time, “AP” marks the state when the aircraft has reached the position where it should wait for landing instructions. The places labeled S1 through S4 play an auxiliary role, controlling the execution of individual transitions and ensuring appropriate separations to maintain operational safety.
Arcs in the model establish the conditions required for transitions to occur. Those directed toward a transition define the necessary prerequisites before an action can be triggered, while arcs leading away indicate the system changes resulting from the execution of each step. The green rectangles highlight key markers related to fixes A and B, specifying the earliest times at which transitions can take place. Each token, denoted by the “@” symbol followed by a timestamp, represents the system’s timing constraints. As the model in Figure 2 depicts the initial state, most timestamps are set at 0.0, meaning no immediate restrictions delay the execution of operations.
Table 1 summarizes the sequential steps and corresponding descriptions of the eVTOL landing process, highlighting key phases from arrival at the vertiport airspace to the completion of ground handling operations.
Stochastic features are integrated into the model through random distributions applied to transition firing times. For instance, arrival times at approach fixes are generated using probability density functions (PDFs) and cumulative distribution functions (CDFs), reflecting the inherent variability in eVTOL traffic [20].
An example of the input data used is shown in Figure 3. It is assumed that the traffic was not uniform but that there were two peaks—morning and afternoon. Figure 3 illustrates the relative demand probability of eVTOL arrivals across different hours of the day. Local maxima (red) indicate peak demand periods, while local minima (blue) highlight lower activity hours. The demand distribution follows a multi-peak pattern, reflecting typical urban transportation needs.
The model was implemented using CPN Tools v4.0.1, a specialized software environment for designing, simulating, and analyzing CPNs. CPN Tools facilitates the graphical representation of the model while providing robust mechanisms for state space analysis, ensuring key properties such as boundedness, liveness, and deadlock freedom [16]. The simulation capabilities enabled the evaluation of eVTOL traffic under various operational scenarios, such as different arrival rates and configurations with multiple landing pads. By leveraging the timed and stochastic features of CPNs, this study was able to analyze critical parameters, such as pad utilization, separation times, and delay absorption, providing valuable insights into the optimization of vertiport operations. Recent applications of CPNs in aviation systems, such as drone inspection methods [20] or aircraft landing sequence evaluation [21], further underscore their relevance and effectiveness in this domain.

3.3. Stochastic Arrivals Generation Using PDF and CDF

The arrival generation process for eVTOLs in this study involves determining the total number of arrivals per day (N), distributing these arrivals across hours using a probability density function (PDF), and generating specific arrival times within each hour using a cumulative distribution function (CDF). The mentioned method ensures a realistic and controllable traffic flow pattern. The total number of daily arrivals, N, is set manually for each scenario based on iterative testing to determine the maximum capacity the model can handle. This approach reflects practical considerations in scenario-based testing, as emphasized in the probabilistic modeling literature [22,23].
Hourly distributions are modeled using a composite PDF:
f h t = i = 1 3 1 σ i 2 π e 1 2 t μ i σ i 2
where μ i and σ i represent the mean and standard deviation of the i-th traffic peak. These parameters reflect distinct traffic peaks throughout the day. The PDF is normalized to ensure
0 24 f h t d t = 1
The number of arrivals for each hour N h is calculated as follows:
N h = N · f h t
where · ensures integer values suitable for the model.
The specific arrival times are determined within each hour using the CDF derived from the PDF. For each hour h , the CDF is as follows:
F h t = 0 t f h x d x
Arrival times for each eVTOL in hour h are then generated as follows:
t h , i = h · 3600 + u i · 3600
where u i represents a uniformly distributed random variable with a mean of 0 and standard deviation of 1, U 0,1 .
The methodology aligns with principles of probabilistic modeling and queuing systems, as outlined in previous works on stochastic processes and inventory models [23,24]. This ensures a balance between mathematical accuracy and practical application.

3.4. Integration of Arrival Data and Simulation in CPN

The methodological approach combines an airspace framework adapted from previous research [17] and a colored Petri net (CPN) model designed in CPN Tools to simulate eVTOL arrivals and landings. For each experiment (described in subsequent sections), the goal was to determine an optimal daily arrival count that could be processed fully within a 24 h operational period tailored to various experimental scenarios.
A preliminary estimate of the total number of eVTOL arrivals per day was conducted based on the specific parameters of each scenario. This initial estimate was refined using a heuristic approach, iteratively adjusted to ensure the model could process all arrivals entirely within 24 h while also considering additional constraints such as the minimum 90 s interval between consecutive arrivals, the restriction that only one eVTOL can occupy any stage other than the arrival line at a time, and the turnaround time required for each eVTOL. The estimated daily arrival count was distributed over 24 h using a probability density function (PDF) incorporating key traffic patterns. The PDF reflected peaks in demand, aligning with realistic operational surges. As mentioned, two primary traffic peaks were considered to distribute the total arrivals across the day, ensuring a realistic temporal representation of traffic density.
The arrivals were refined within each hour using a cumulative distribution function (CDF) to assign specific arrival times. This ensured that eVTOL arrivals were not clustered arbitrarily but followed a stochastic distribution reflective of real-world operations.
The generated arrival data, including specific arrival times and attributes, was input into the CPN model. The CPN framework simulated the sequential and concurrent processes of eVTOL operations, such as landing pad allocation and delay absorption, to evaluate whether the total arrivals could be successfully processed within the operational constraints.
After running the simulation, if the arrival count exceeded the system’s capacity (i.e., arrivals could not be processed within 24 h), the daily arrival estimate was decreased, and the distribution process was repeated. Conversely, if the system processed all arrivals comfortably, the estimate was increased to explore the upper limits of the model’s capacity. This iterative refinement ensured that the chosen arrival count accurately represented a realistic yet challenging workload.
In scenarios with lower arrival counts, the density of arrivals during peak periods was evaluated to ensure the model remained sufficiently dynamic. When necessary, additional tests were conducted with slightly increased arrival counts to confirm the robustness of the system’s performance under varying conditions.

4. Simulation Experiments

A set of simulation experiments was designed to analyze vertiport landing system performance under varying configurations. The section begins by assessing scalability through incremental increases in routes and landing pads and then evaluating the impact of additional landing pads with fixed routes. Next, the combined effect of scaling routes and pads is explored to measure overall system improvements. The final experiment investigates how increasing horizontal speed influences efficiency, particularly in addressing key bottlenecks.

4.1. Overview of Simulation Experiments

Four experiments were conducted to evaluate the vertiport landing system’s scalability, resource allocation, and operational efficiency under varying routes and landing pad configurations. The primary objective was to identify operational bottlenecks and assess the impact of configuration adjustments on the landing operation of vertiport. The experiments were implemented using a colored Petri net (CPN) model in CPN Tools software, with stochastic arrival distributions based on probability density functions (PDFs) and cumulative distribution functions (CDFs). The simulation maintained consistent airspace structure, vehicle constraints, and safety conditions across all tests, allowing precise isolation of each variable’s effect. The experiments are as follows:
  • Incremental Increase of Routes and Pads
This experiment assessed the scalability of landing operations by gradually increasing the number of routes and landing pads from 1R1P (one route, one pad) to 6R6P. Performance metrics were measured across different stages of the operational process.
2.
Effect of Increased Pads with Fixed Routes
The second experiment isolated the impact of increasing the number of landing pads while keeping the number of routes constant. The configurations 1R1P and 1R4P (one route, four pads) were compared using identical arrival schedules.
3.
Combined Scalability of Routes and Pads
This experiment evaluated the combined effect of simultaneously increasing both routes and landing pads. Consistent arrival patterns were used across configurations ranging from 1R1P to 6R6P.
4.
Impact of Horizontal Speed
The final experiment explored the effect of increasing horizontal speed ( h s ) on operational efficiency. The 1R1P configuration was tested with normal speed and a 10% increase in h s to measure time savings and system performance.
Table 2 summarizes the experimental conditions, key variable adjustments, and performance metrics.

4.2. Experiment 1: Incremental Increase of Routes and Pads

Configurations were incrementally adjusted from 1R1P to 6R6P to evaluate the scalability of landing operations. Arrival patterns were generated using the mentioned combination of probability density functions (PDFs) to define hourly arrival rates and cumulative distribution functions (CDFs) to assign specific arrival times. Each configuration was analyzed to assess throughput and stage-wise performance under increasing infrastructure.
The results indicate a significant increase in throughput with the addition of routes and landing pads, as mentioned in Table 3. It is important to note that Table 3 presents average parameters, except for the Number of Arrivals (24 h), which represents actual values. The system processed 115 arrivals in 24 h under the 1R1P configuration, which scaled to 699 arrivals under the 6R6P setup. Despite this scalability, certain stages exhibited delays, particularly “Arrival—Landing Confirmed” and “Landing Confirmed—Move to V.”
The number of arrivals processed in 24 h was scaled proportionally with the addition of routes and landing pads, demonstrating the system’s capacity to handle increased traffic with infrastructure expansion. However, diminishing returns were observed, which could be related to the stochastic distribution of arrivals in each hour, leading to a higher likelihood of high-density periods as the number of arrivals increases.
The “Arrival—Landing Confirmed” stage consistently showed average non-zero delays of about 550 s. Table 4 illustrates each setup’s average “Arrival to Landing” duration and the number of arrivals that experienced queuing at this stage.
The “Landing Confirmed—Move to V” stage emerged as a bottleneck, accounting for the longest processing times, with an average of 593.22 s across configurations. This duration T is governed by
T = R h s
where R represents the horizontal distance traveled as mentioned in the model structure, and h s represents the horizontal speed of the eVTOL.
Optimizing infrastructure to reduce horizontal distances and enhancing vehicle capabilities to increase speeds are critical steps to improve this stage. Other stages, such as “Move to V—Position” and “Position—Land”, exhibited consistent performance across configurations, indicating their robustness and ability to scale with infrastructure.

4.3. Experiment 2: Effect of Increased Pads with Fixed Routes

This experiment analyzed the impact of increasing the number of landing pads while keeping the number of routes constant. Configurations ranging from 1R1P (one route, one pad) to 1R4P (one route, four pads) were tested using identical arrival schedules to isolate the effect of additional landing pads on system performance. The experiment was not extended further as no significant changes in performance were observed beyond the tested configurations. The results indicate minimal changes in average processing times across most stages, with differences much smaller than two digits after the decimal point.
The results suggest that increasing the number of landing pads has an almost negligible impact on overall system efficiency when other factors, such as route configurations and horizontal speed, remain constant. The highly minor reductions in processing times highlight that while additional infrastructure may offer some efficiency gains, these improvements are insignificant compared to the influence of other variables. The “Landing Confirmed—Move to V” stage, identified as a critical bottleneck, remained unchanged at 593.22 s across both configurations. This stage is primarily governed by the horizontal distance (R) and horizontal speed ( h s ) of the eVTOLs, neither of which were altered in this experiment. Similarly, other stages, including “Move to V—Position”, “Position—Land”, “Land—GHA”, and “GHA—GHA Done”, demonstrated consistent performance, maintaining processing times of approximately 67.79 s, 22.88 s, 68.96 s, and 30 s, respectively. These observations underscore the limited impact of increasing the number of landing pads alone. This finding suggests that adding pads alone cannot resolve key bottlenecks or enhance scalability meaningfully.

4.4. Experiment 3: Combined Scalability of Routes and Pads

This experiment investigated the combined effect of increasing both routes and landing pads on landing operations performance. Configurations ranging from 1R1P (one route, one pad) to 6R6P (six routes, six pads) were evaluated using consistent arrival patterns established in Experiment 1 for 1R1P. The objective was to assess the system’s scalability and identify changes in key performance metrics as the infrastructure expanded.
The results, summarized in Table 5, which focuses on the queuing issues identified in Experiment 1, show a substantial reduction in processing and waiting times as the number of routes and pads increased. The “Arrival—Landing Confirmed” stage exhibited the most significant improvements, while other stages remained consistent across configurations.
The average duration from arrival to complete processing decreased significantly as the number of routes and pads increased, dropping from 1333 s under the 1R1P configuration to 820 s under 6R6P. This represents an approximate reduction of 38%.
The results highlight the significant impact of scaling routes and landing pads on system efficiency. The most notable improvement occurred in the “Arrival—Landing Confirmed” stage, where the average time dropped dramatically from 550.63 s in the 1R1P configuration to 37.15 s in the 6R6P setup, representing a decrease of approximately 93.25%. Additionally, the percentage of instances with zero waiting time in this stage increased from 6.03% to 88.60%, demonstrating a substantial enhancement in arrival management. Despite these advancements, the “Landing Confirmed—Move to V” stage remained a bottleneck, showing no changes across configurations. The constant duration of 593.22 s reflects its dependency on fixed parameters, such as horizontal distance (R) and horizontal speed ( h s ), which were not altered in this experiment. Similarly, subsequent stages, including “Move to V—Position”, “Position—Land”, and “Land—GHA”, exhibited consistent performance, maintaining robust operation regardless of increasing both routes and landing pads.

4.5. Experiment 4: Impact of Horizontal Speed

This experiment analyzed the effect of the horizontal speed of eVTOL on landing operations by testing the 1R1P (one route, one pad) configuration under normal conditions and with a 10% increase in horizontal speed ( h s ). The goal was to evaluate the influence of h s on time efficiency across various operational stages and overall system performance.
The results, presented in Table 6, illustrate the impact of increased h s on stage-wise performance based on the average duration of each stage.
The average duration from arrival to complete processing decreased from 1333.49 s under normal conditions to 1205.78 s, with a 10% increase in h s , resulting in a savings of approximately 9.58%.
The results demonstrate the broad effect of horizontal speed on overall operational efficiency, particularly in critical bottleneck stages. The “Landing Confirmed—Move to V” stage, previously identified as a significant bottleneck, markedly improved. The time for this stage decreased from 593.22 s to 539.29 s on average duration, a reduction of approximately 9.09%. This outcome aligns with Equation (9), where increasing h s directly reduces the duration of the stage. Beyond the bottleneck, other stages also benefited from the increased speed. The “Move to V—Position” stage exhibited a similar 9.09% reduction in average duration, decreasing processing time from 67.79 s to 61.63 s. Although this stage is less time-intensive than the bottleneck, its improvement significantly contributes to overall efficiency.
Arrival management also showed notable gains, as the “Arrival—Landing Confirmed” stage decreased from 550.63 s to 485.09 s, representing a savings of approximately 11.90%. This reflects smoother queuing and reduced congestion for incoming eVTOLs, highlighting the role of horizontal speed in facilitating transitions during high-traffic periods. Other stages, including “Position—Land” and “Land—GHA”, have almost no reductions in processing times, with no contribution to overall time savings.

5. Discussion

The experiments provide a comprehensive analysis of the factors influencing the scalability and efficiency of eVTOL landing operation at vertiport. These studies explored the effects of increasing horizontal speed, the number of routes and landing pads, and the combined impact of these variables under fixed arrival patterns.

5.1. Summary of Findings

The insights gained highlight the operational bottlenecks and areas for optimization, providing a robust foundation for advancing eVTOL infrastructure. One of the critical findings across all experiments is the identification of “Landing Confirmed—Move to V” as a consistent bottleneck stage. This stage’s duration, determined by the horizontal distance (R) and horizontal speed ( h s ), remained constant regardless of infrastructure changes.
The experiment increasing h s by 10% demonstrated that even modest speed improvements can significantly reduce total system time and delays. For instance, the average duration from arrival to complete processing for one route and one pad (1R1P) configuration decreased by approximately 9.58%, and the average time for the bottleneck stage was reduced by 9.09%. This highlights the importance of focusing on technological advancements and optimized layouts to minimize the time spent in this stage.
The introduction of additional landing pads in the 1R4P experiment showed almost no improvements in total system performance. As expected, the primary bottleneck remained unaffected, reinforcing the need for more targeted strategies to address R and h s . Despite this, adding landing pads provided some relief by distributing the load and reducing infrastructure utilization.
The most impactful experiment involved simultaneously increasing both routes and pads, scaling from 1R1P to 6R6P under a fixed arrival pattern of 115 eVTOLs per day. This approach significantly improved overall efficiency, with a reduction of 38.49% in average duration from arrival to complete processing and a dramatic 93.25% decrease in delays during the “Arrival—Landing Confirmed” stage. Notably, the percentage of arrivals with zero waiting time rose from 6.03% in 1R1P to 88.60% in 6R6P, demonstrating the effectiveness of added infrastructure in reducing queuing. The consistent performance in subsequent stages, such as “Move to V—Position” and “Position—Land” across all configurations, highlights the robustness of these processes, unaffected by scale.
Collectively, these experiments underscore the multifaceted nature of eVTOL operations. While increasing routes and pads significantly alleviates arrival delays, it does not address fixed bottlenecks like “Landing Confirmed—Move to V”, which require innovative solutions such as route optimization or speed enhancements. The interplay between infrastructure and operational parameters like speed suggests that a balanced approach is essential. Subsequent efforts should focus on embedding these findings into a cohesive strategy that maximizes scalability while maintaining efficiency.
In conclusion, these experiments illuminate the path forward for eVTOL systems. The findings provide clear evidence that strategic infrastructure development, combined with targeted technological improvements, can create a scalable and efficient foundation for the widespread adoption of eVTOL technology. This work lays the groundwork for further research into dynamic traffic patterns, external influences, and advanced operational strategies to ensure the continued evolution of this promising transportation mode.

5.2. Areas of Future Research

Building upon these findings, several avenues for future research and development emerge. Incorporating variable and stochastic traffic patterns into operational models will provide a more comprehensive understanding of vertiport’s performance under real-world conditions. This approach would account for peak demand periods and unexpected disruptions, thereby enhancing the robustness of system design.
Further research should explore the trade-offs between efficiency improvements and energy consumption or operational costs. Evaluating these trade-offs will enable the development of sustainable solutions that balance performance with environmental and economic considerations. Additionally, investigating the impact of weather conditions, such as wind, rain, and fog, on eVTOL operations will enhance system reliability and inform the resilient infrastructure design.
Integration with existing urban mobility systems represents another critical area of focus. Understanding how eVTOL operations can complement transportation networks, including trains, buses, and ride-sharing services, will maximize their potential within a multimodal mobility ecosystem. Automation and autonomous systems also hold promise for addressing operational bottlenecks. Autonomous eVTOLs and AI-driven traffic management systems at vertiports could significantly optimize operations at scale.
Finally, leveraging advanced simulation tools and real-world pilot programs will bridge the gap between theoretical research and practical application. These efforts will validate the findings of this study, ensuring their relevance and applicability to real-world scenarios. By addressing these future directions, the scalability and efficiency of eVTOL systems can be further enhanced, paving the way for widespread adoption and integration into urban transportation networks.

6. Conclusions

The findings emphasize the importance of infrastructure adaptability, operational optimization, and data-driven modeling in ensuring seamless integration of eVTOL into urban mobility networks. Key implications include the following:
  • The “Landing Confirmed—Move to V” stage consistently emerges as a bottleneck, requiring targeted interventions.
  • Key operational parameters, including horizontal distance (R) and horizontal speed (hs), play a key role in the landing procedure; optimizing the landing operation should include or at least consider these parameters.
  • Implementing probability density functions (PDFs) and cumulative distribution functions (CDFs) combined with Petri nets provides a robust framework for analyzing eVTOL traffic dynamics.
  • The study confirms that scaling from 1R1P to 6R6P configurations is feasible, demonstrating the viability of eVTOL systems for high-demand urban settings.
  • Infrastructure expansion should be complemented by intelligent traffic management, dynamic scheduling, and operational refinements to maintain efficiency as eVTOL adoption grows.
  • Expanding routes and landing pads together drastically reduces congestion and waiting times, reinforcing the importance of holistic infrastructure planning.
  • Simply increasing the number of landing pads does not significantly improve throughput unless paired with better traffic control and optimized movement strategies.

Author Contributions

Conceptualization, A.Q. and J.S.; methodology, J.S. and A.Q.; software, J.S. and A.Q.; validation, A.Q.; formal analysis, A.Q.; investigation, A.Q.; data curation, A.Q.; writing—original draft preparation, A.Q. and J.S.; visualization, J.S. and A.Q.; supervision, J.S. All authors have read and agreed to the published version of the manuscript.

Funding

This research received no external funding.

Data Availability Statement

The original contributions presented in this study are included in the article. Further inquiries can be directed to the authors.

Conflicts of Interest

The authors declare no conflicts of interest.

References

  1. Xiang, S.; Xie, A.; Ye, M.; Yan, X.; Han, X.; Niu, H.; Li, Q.; Huang, H. Autonomous eVTOL: A summary of researches and challenges. Green Energy Intell. Transp. 2024, 3, 100140. [Google Scholar] [CrossRef]
  2. Lineberger, R.; Hussain, A.; Rutgers, V. Change is in the Air: The Elevated Future of Mobility—What’s Next on the Horizon. Deloitte Insights, 2019. Available online: https://www2.deloitte.com/content/dam/Deloitte/us/Documents/energy-resources/di-the-elevated-future-of-mobility.pdf (accessed on 15 October 2024).
  3. Wild, G. Urban Aviation: The Future Aerospace Transportation System for Intercity and Intracity Mobility. Urban Sci. 2024, 8, 218. [Google Scholar] [CrossRef]
  4. Saxena, R.; Prabhakar, T.; Kuri, J.; Yadav, M. Vertiport Terminal Scheduling and Throughput Analysis for Multiple Surface Directions. arXiv 2024, arXiv:2408.01152. [Google Scholar] [CrossRef]
  5. Song, K. Optimal Vertiport Airspace and Approach Control Strategy for Urban Air Mobility (UAM). Sustainability 2023, 15, 437. [Google Scholar] [CrossRef]
  6. Ugwueze, O.; Statheros, T.; Bromfield, M.; Horri, N. Trends in eVTOL Aircraft Development: The Concepts, Enablers and Challenges. In Proceedings of the AIAA SCITECH 2023 Forum, National Harbor, MD, USA, 23–27 January 2023. AIAA Conference Paper. [Google Scholar] [CrossRef]
  7. Wu, H. Modeling Next Generation Air Traffic Control System with Petri Net. Master’s Thesis, New Jersey Institute of Technology, Newark, NJ, USA, 2011. [Google Scholar]
  8. Sng, Z.; Hansman, R. A Petri Net Framework for the Representation and Analysis of Aircraft Turnaround Operations; Report No. ICAT-2019-05; MIT International Center for Air Transportation: Cambridge, MA, USA, 2019. [Google Scholar]
  9. Littorin, H. The Future of Electric Aircraft and eVTOLs; Berg Insight: Gothenburg, Sweden, 2022. [Google Scholar]
  10. Di Mascio, P.; Celesti, M.; Sabatini, M.; Moretti, L. Fast-Time Simulations to Study the Capacity of a Traffic Network Aimed at Urban Air Mobility. Future Transp. 2024, 4, 1370–1387. [Google Scholar] [CrossRef]
  11. Petri, C. Kommunikation mit Automaten; Fakultät für Mathematik und Physik der Technischen Hochschule Darmstadt: Bonn, Germany, 1962. [Google Scholar]
  12. Szpyrka, M. Petri Nets in Modeling and Analysis of Concurrent Systems; WNT: Warszawa, Poland, 2008. (In Polish) [Google Scholar]
  13. Jensen, K.; Kristensen, L.; Wells, L. Coloured Petri Nets and CPN Tools for Modelling and Validation of Concurrent Systems. Int. J. Softw. Tools Technol. Transf. 2007, 9, 213–254. [Google Scholar] [CrossRef]
  14. Reisig, W. Understanding Petri Nets. Modeling Techniques, Analysis Methods, Case Studies; Springer: Berlin/Heidelberg, Germany, 2013. [Google Scholar]
  15. Skorupski, J. Quantitative Methods of Air Traffic Incidents Analysis; Warsaw University of Technology Publishing House: Warszawa, Poland, 2018. (In Polish) [Google Scholar]
  16. Zaitsev, D.; Shmeleva, T. Modeling with Colored Petri Nets: Specification, Verification, and Performance Evaluation of Systems; IGI Global: Hershey, PA, USA, 2019. [Google Scholar]
  17. Kleinbekman, I.; Mitici, M.; Wei, P. Rolling-horizon electric vertical takeoff and landing arrival scheduling for on-demand urban air mobility. J. Aerosp. Inf. Syst. 2020, 17, 150–159. [Google Scholar] [CrossRef]
  18. Goodrich, K.; Barmore, B. Exploratory Analysis of the Airspace Throughput and Sensitivities of an Urban Air Mobility System. In Proceedings of the 2018 Aviation Technology, Integration, and Operations Conference, Atlanta, GA, USA, 25–29 June 2018; p. 3364. [Google Scholar]
  19. Bacchini, A.; Cestino, E. Electric VTOL Configurations Comparison. Aerospace 2019, 6, 26. [Google Scholar] [CrossRef]
  20. Fedorova, A.; Beliautsou, V.; Zimmermann, A. Colored Petri Net Modelling and Evaluation of Drone Inspection Methods for Distribution Networks. Sensors 2022, 22, 3418. [Google Scholar] [CrossRef] [PubMed]
  21. Skorupski, J.; Florowski, A. Method for evaluation the landing aircraft sequence under disturbed conditions with the use of Petri Nets. Aeronaut. J. 2016, 120, 819–844. [Google Scholar] [CrossRef]
  22. Jayaprakash, O.; Gunasekaran, K.; Chandrasekaran, G.; Muralidharan, S. Probability Density Functions for Vessel Arrivals Served at Multicommodity Ports. Int. J. Pure Appl. Math. 2018, 118, 1–15. [Google Scholar]
  23. Chakravarthy, S.; Rao, B. Queuing-Inventory Models with MAP Demands and Random Replenishment Opportunities. Mathematics 2021, 9, 1092. [Google Scholar] [CrossRef]
  24. Sanglas, J.; Trinchero, P.; Painter, S.; Cvetkovic, V.; Poteri, A.; Selroos, J.; Zou, L. Significance of Low-Velocity Zones on Solute Retention in Rough Fractures. Water Resour. Res. 2024, 60, e2023WR036221. [Google Scholar] [CrossRef]
Figure 1. Adopted airspace in the model and eVTOL flight trajectory (dashed line) through numbered landing stages.
Aerospace 12 00147 g001
Figure 2. Colored timed Petri net model of a service line with two landing pads, showing different landing stages.
Aerospace 12 00147 g002
Figure 3. Hourly distribution of relative demand probability for eVTOL arrivals with two peaks.
Aerospace 12 00147 g003
Table 1. Steps and descriptions of the eVTOL landing process in the CPN model.
Start PointEnd PointStep of LandingDescription
APFix AArrival—Landing ConfirmedArrival of the eVTOL at the vertiport airspace and reception of landing confirmation.
Fix AVLanding Confirmed—Move to VApproach of the eVTOL, traveling a distance to arrive at a designated fixed point.
VRDYMove to V—PositionHorizontal approach of the eVTOL, traveling a distance to reach the position for final vertical descent.
RDYGroundPosition—LandVertical descent of the eVTOL to the designated touchdown point.
--Land—GHAThe eVTOL is officially considered landed, and ground handling operations commence.
GHA—GHA DoneExecution of ground handling operations on the eVTOL.
--Arrival—Landing ConfirmedCompletion of all ground handling operations, marking the readiness of the eVTOL for the next operation cycle.
Table 2. Experimental conditions and key parameters.
Experiment Number of Routes (R) Number of Landing Pads (P) Horizontal Speed (hs) Arrival Schedule Other Constraints Key Metrics
Analyzed
Exp. 1: Incremental increase of routes and pads 1 → 6 1 → 6 Fixed Adjusted based on max arrival capacity of each configuration using CDF and PDF method Separation time: 90 s
No weather effects
Throughput, queueing, delay factors, the impact of pad count on queuing
Exp. 2: Increased pads with fixed routes 1 1 → 4 Fixed Fixed—identified schedule for 1R1P from the first experiments Same as Exp. 1 Impact of pad count on queuing, time per stage
Exp. 3: Combined scalability of routes and pads 1 → 6 1 → 6 Fixed Fixed Same as Exp. 1 Throughput, time efficiency, scalability
Exp. 4: Impact of horizontal speed 1 1 +10% increase compared to the initial setup Fixed Same as Exp. 1 Bottleneck reduction, time savings
Table 3. Experiment 1—average duration of the service phase.
Setup Arrival—
Landing
Confirmed
[s]
Landing
Confirmed—
Move to V
[s]
Move to V—
Position [s]
Position—
Land [s]
Land—
GHA [s]
GHA—
GHA Done
[s]
Number of
Arrivals (24 h)
1R1P 550.63 593.22 67.79 22.88 68.96 30 115
2R2P 542.50 593.22 67.79 22.88 68.96 30 230
3R3P 531.60 593.22 67.79 22.88 68.96 30 349
4R4P 546.18 593.22 67.79 22.88 68.96 30 464
5R5P 541.77 593.22 67.79 22.88 68.96 30 583
6R6P 551.18 593.22 67.79 22.88 68.96 30 699
Table 4. Experiment 1: queuing and arrival-to-landing durations.
SetupNumber of Queued ArrivalsAverage Arrival to Landing [s]
1R1P1081333.49
2R2P2161325.37
3R3P3191314.47
4R4P4351329.04
5R5P5511324.64
6R6P6621334.04
Table 5. Combined effect of routes and pads on performance.
SetupArrival—Landing
Confirmed
(s)
Percentage of Not
Queued
Arrivals
1R1P550.636.03
2R2P178.0850.00
3R3P93.1572.81
4R4P69.8780.70
5R5P60.2579.82
6R6P37.4788.60
Table 6. Influence of horizontal speed on processing times.
SetupArrival—
Landing
Confirmed [s]
Landing
Confirmed—Move to V [s]
Move to V—
Position [s]
Position Land [s]Land—GHA
[s]
GHA—GHA
Done [s]
1R1P550.63593.2267.7922.8868.9630
1R1P + 10 % h s 485.09539.2961.6320.8068.9630
Disclaimer/Publisher’s Note: The statements, opinions and data contained in all publications are solely those of the individual author(s) and contributor(s) and not of MDPI and/or the editor(s). MDPI and/or the editor(s) disclaim responsibility for any injury to people or property resulting from any ideas, methods, instructions or products referred to in the content.

