Article

Research on the Impact of the Sand and Dust Ingestion Test on the Overall Performance of Turboshaft Engines

1
AECC Hunan Aviation Powerplant Research Institute, Zhuzhou 412002, China
2
School of Power and Energy, Nanchang Hangkong University, Nanchang 330063, China
3
Jiangxi Key Laboratory of Green General Aviation Power, Nanchang Hangkong University, Nanchang 330063, China
4
Engineering Research Center of Aero-Engine Technology for General Aviation, Ministry of Education, Nanchang 330063, China
*
Author to whom correspondence should be addressed.
Aerospace 2025, 12(2), 146; https://doi.org/10.3390/aerospace12020146
Submission received: 8 January 2025 / Revised: 6 February 2025 / Accepted: 11 February 2025 / Published: 14 February 2025
(This article belongs to the Section Aeronautics)

Abstract

:
Based on GJB 242A, a detailed experimental procedure for the sand and dust ingestion of a turboshaft engine was established. A specific type of turboshaft engine was used to conduct 54 h full-engine sand and dust ingestion experiments. This research studied the impact of sand and dust ingestion on the engine’s common operating line, power loss, specific fuel consumption, and gas turbine exhaust temperature, among other performance parameters. The experimental results indicate that under the same equivalent power conditions, the impact of short-term sand and dust ingestion on the engine’s common operating line is minimal; as the sand and dust ingestion time increases, the equivalent airflow decreases significantly, causing the engine’s common operating line to shift upward and the gas turbine exhaust temperature to rise, with the maximum increase reaching 27.9 °C. However, the impact of sand and dust ingestion on the gas turbine exhaust temperature at high power levels is relatively small. After completing the sand and dust ingestion test, the engine’s power loss at maximum continuous operation was approximately 11.33%, and the specific fuel consumption increased by about 6.05%. The power loss does not meet the requirement of being less than 10% as stipulated in GJB 242A. Based on the engine disassembly inspection results, subsequent improvement suggestions were proposed. The findings of this paper can provide a scientific and rational basis and reference for the sand and dust resistance design and sand ingestion testing of similar aero-engines.

1. Introduction

Helicopters, during takeoff or landing in sandy environments, often ingest sand or dust particles stirred up by the helicopter’s rotors, wake, or natural winds. Larger particles can impact and erode compressor blades, reducing efficiency; smaller particles may clog turbine cooling holes, leading to turbine blade burnout [1,2]. Additionally, dust can enter the bearing chambers, causing oil contamination and bearing wear [3,4,5,6]. The ingestion of substantial amounts of sand or dust by the engine leads to structural damage, the degradation of engine performance, and a reduction in life span, severely affecting combat effectiveness and durability [7]. According to statistics from the U.S. Department of Defense, during “Desert Storm” operations in harsh sandy environments, the fuel consumption and maintenance costs of helicopter engines increased significantly, and the actual service life of the engines was less than 20% of the designed life span [8,9].
The operational capability post sand and dust ingestion is one of the key indicators for measuring the environmental adaptability of aero-engines, and the world’s leading aviation powers have made sand and dust ingestion tests for new aero-engines a necessary part of the design- and type-approval process. In the 1980s, the American GE company completed sand and dust ingestion tests for the TF34 and CF-6 engines in accordance with MIL standards; the British Rolls-Royce completed sand and dust ingestion tests for the Olympus 593 engine according to NATO standards; Russia completed sand and dust ingestion tests for the TB2-117 engine following GOST standards [10]. China also places great emphasis on sand and dust ingestion tests for aero-engines, successively formulating national military standards such as GJB 241-87 “General Specifications for Aero Turbine Jet and Turbofan Engines” [11], GJB 242-87 “General Specifications for Aero Turbine Propeller and Turboshaft Engines” [12], and GJB 2026-94 “Requirements for Sand Ingestion Tests of Aero Turbine Jet and Turbofan Engines” [13] to regulate the requirements for sand and dust ingestion tests of aero-engines.
Sand and dust ingestion tests are crucial for assessing the sand and dust resistance of aero-engines and provide guidance for design improvements. Dunn et al. [14] conducted experimental studies on turbojet and turbofan engines in various sandy environments, demonstrating that the engine’s pressure ratio, exhaust temperature, and specific fuel consumption all deteriorated to varying degrees after ingesting a large amount of sand and dust. Ghenaier [15] used a turbofan engine for the simulation modeling of sand and dust particle ingestion, showing that the ingestion of a large number of particles caused significant erosion at the tips and edges of the first-stage fan blades, with the eroded area accounting for about three-fourths of the blade height. Wylie S et al. [16] carried out experiments with volcanic ash ingestion to study the blockage of cooling holes in high-pressure turbine blades, determining the impact pattern of volcanic ash particle size on turbine blade temperature and pressure within cooling air film holes.
Chen Ling et al. [17], in accordance with the requirements of GJB 242-87, conducted a 10 h sand and dust ingestion test on a specific turboshaft engine, indicating that as the ingestion time increased, the engine power decayed and specific fuel consumption increased, with a rise in the total temperature at the turbine exhaust. Ma Chang et al. [18] introduced a sand and dust ingestion test method, detailed the related test equipment, sand mixture ratio, and test procedures, and evaluated the test method based on the results. Chang Hongwen et al. [19] provided an overview of the requirements, methods, and media for sand and dust ingestion tests in domestic and international aviation systems. Zeng Lin et al. [10] compared the morphological characteristics of sand particles from typical regions in China with those of the American standard sand, proposing a statistical method for describing sand particle morphology. Yang Fei [20] designed a new sand and dust ingestion test device for a high-power turboprop engine and completed a 20 h whole-engine sand and dust ingestion test in 10 stages.
In 2018, China revised GJB 242A-2018 “General Specifications for Aero Turbine Propeller and Turboshaft Engines” [21] (hereinafter referred to as GJB 242A), which stipulates the specific requirements for sand and dust ingestion tests of turboshaft engines. However, to date, no turboshaft engine has passed the sand and dust ingestion test strictly according to the requirements of GJB 242A.
This paper, in accordance with the requirements of GJB 242A, for the first time in China, conducted a 54 h whole-engine sand and dust ingestion test using a specific model of a turboshaft engine. This study investigates changes in parameters such as the common operating line, power output, specific fuel consumption, and turbine exhaust temperature during the sand and dust ingestion process to verify the engine’s sand and dust resistance capability and to provide guidance for the sand and dust resistance design of other aero-engines.

2. Sand Ingestion Test Requirements of Turboshaft Engines

Based on GJB 242A of China, the requirements for the sand and dust as well as the operating conditions of the engine are listed in Table 1, Table 2 and Table 3. Also, calibration tests are required and should be conducted at the beginning, at 25 h, and at the end of the test run, respectively.
In Table 1, it can be seen that the sand and dust concentration should be equal or greater than 53 mg/m3. At the same time, the engine should run for at least 54 h with power loss and increased specific fuel consumption lower than 10%. Also, post-test inspections should reveal no signs of imminent failure. The definition of power loss is
λ = P 1 P 2 P 1 × 100 %
In Equation (1), λ is power loss, P 1 is the power of the engine before the sand and dust ingestion test, and P 2 is the power of the engine after the sand and dust ingestion test.
Detailed specifications for the sand and dust are listed in Table 2. More than 90% of the sand and dust is SiO2, i.e., crushed quartz. Generally, particles with a size larger than 63 microns and smaller than 64 microns are considered sand and dust, respectively.
The requirements for engine operating conditions are listed in Table 3, in which the test time under different operating states is given. The test engine has three operating states, which are defined by three different exhaust gas temperatures of the gas turbine. The definitions of these three states are as follows:
  • The maximum state of the engine is the highest stable state at which the engine operates normally. It is typically used during conditions such as hovering out of ground effect, high-speed-level flight, and maximum climb in helicopters. In this state, the engine parameters are relatively high and can only be utilized for a limited duration. So, the maximum state has the highest exhaust gas temperature of the three operating states;
  • The maximum continuous state is the highest state at which the engine is permitted to operate indefinitely. During flight missions, the duration of use in this condition is not subject to any restrictions. Thus, the maximum continuous state has the lowest exhaust gas temperature of the three operating states;
  • The operating parameters of the intermediate state, such as the gas generator speed, turbine inlet temperature, and output power, lie between those of the maximum continuous state and the maximum state. These parameters are selected based on the requirements of the helicopter. The exhaust gas temperature of this state lies between that of the other two.

3. Sand and Dust Ingestion Test Equipment
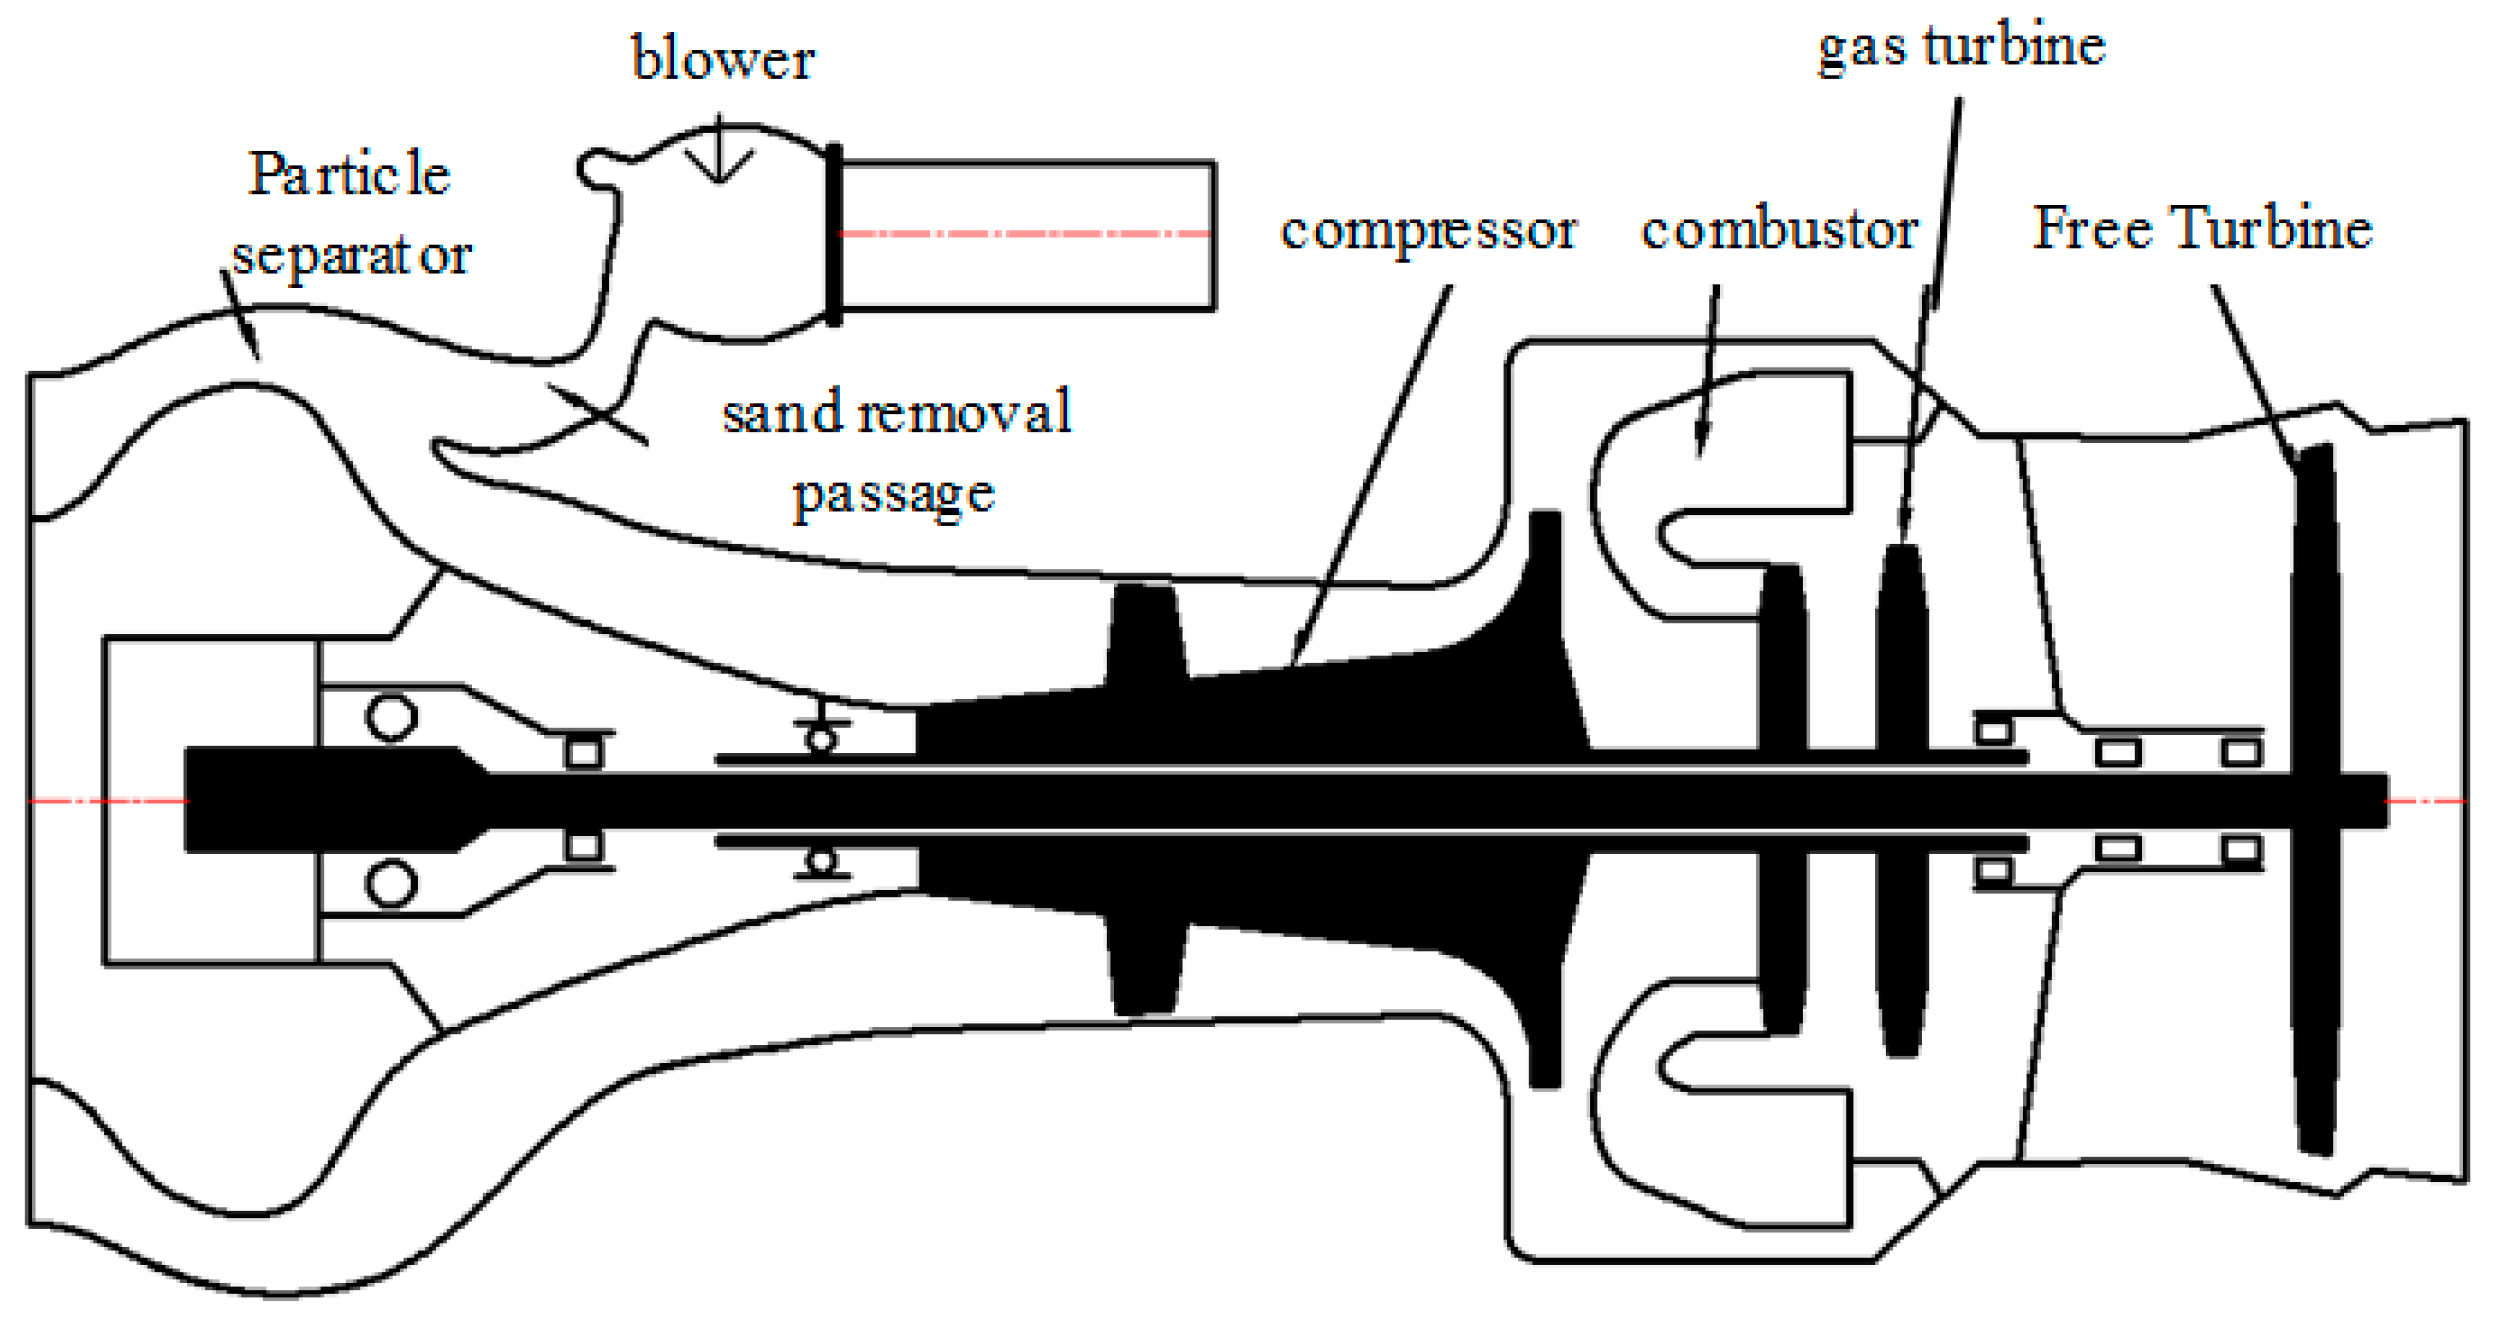
3.1. Test Engine

The test engine is a front power output turboshaft engine, consisting of a particle separator, compressor, combustion chamber, gas turbine, and free turbine, as depicted in Figure 1.

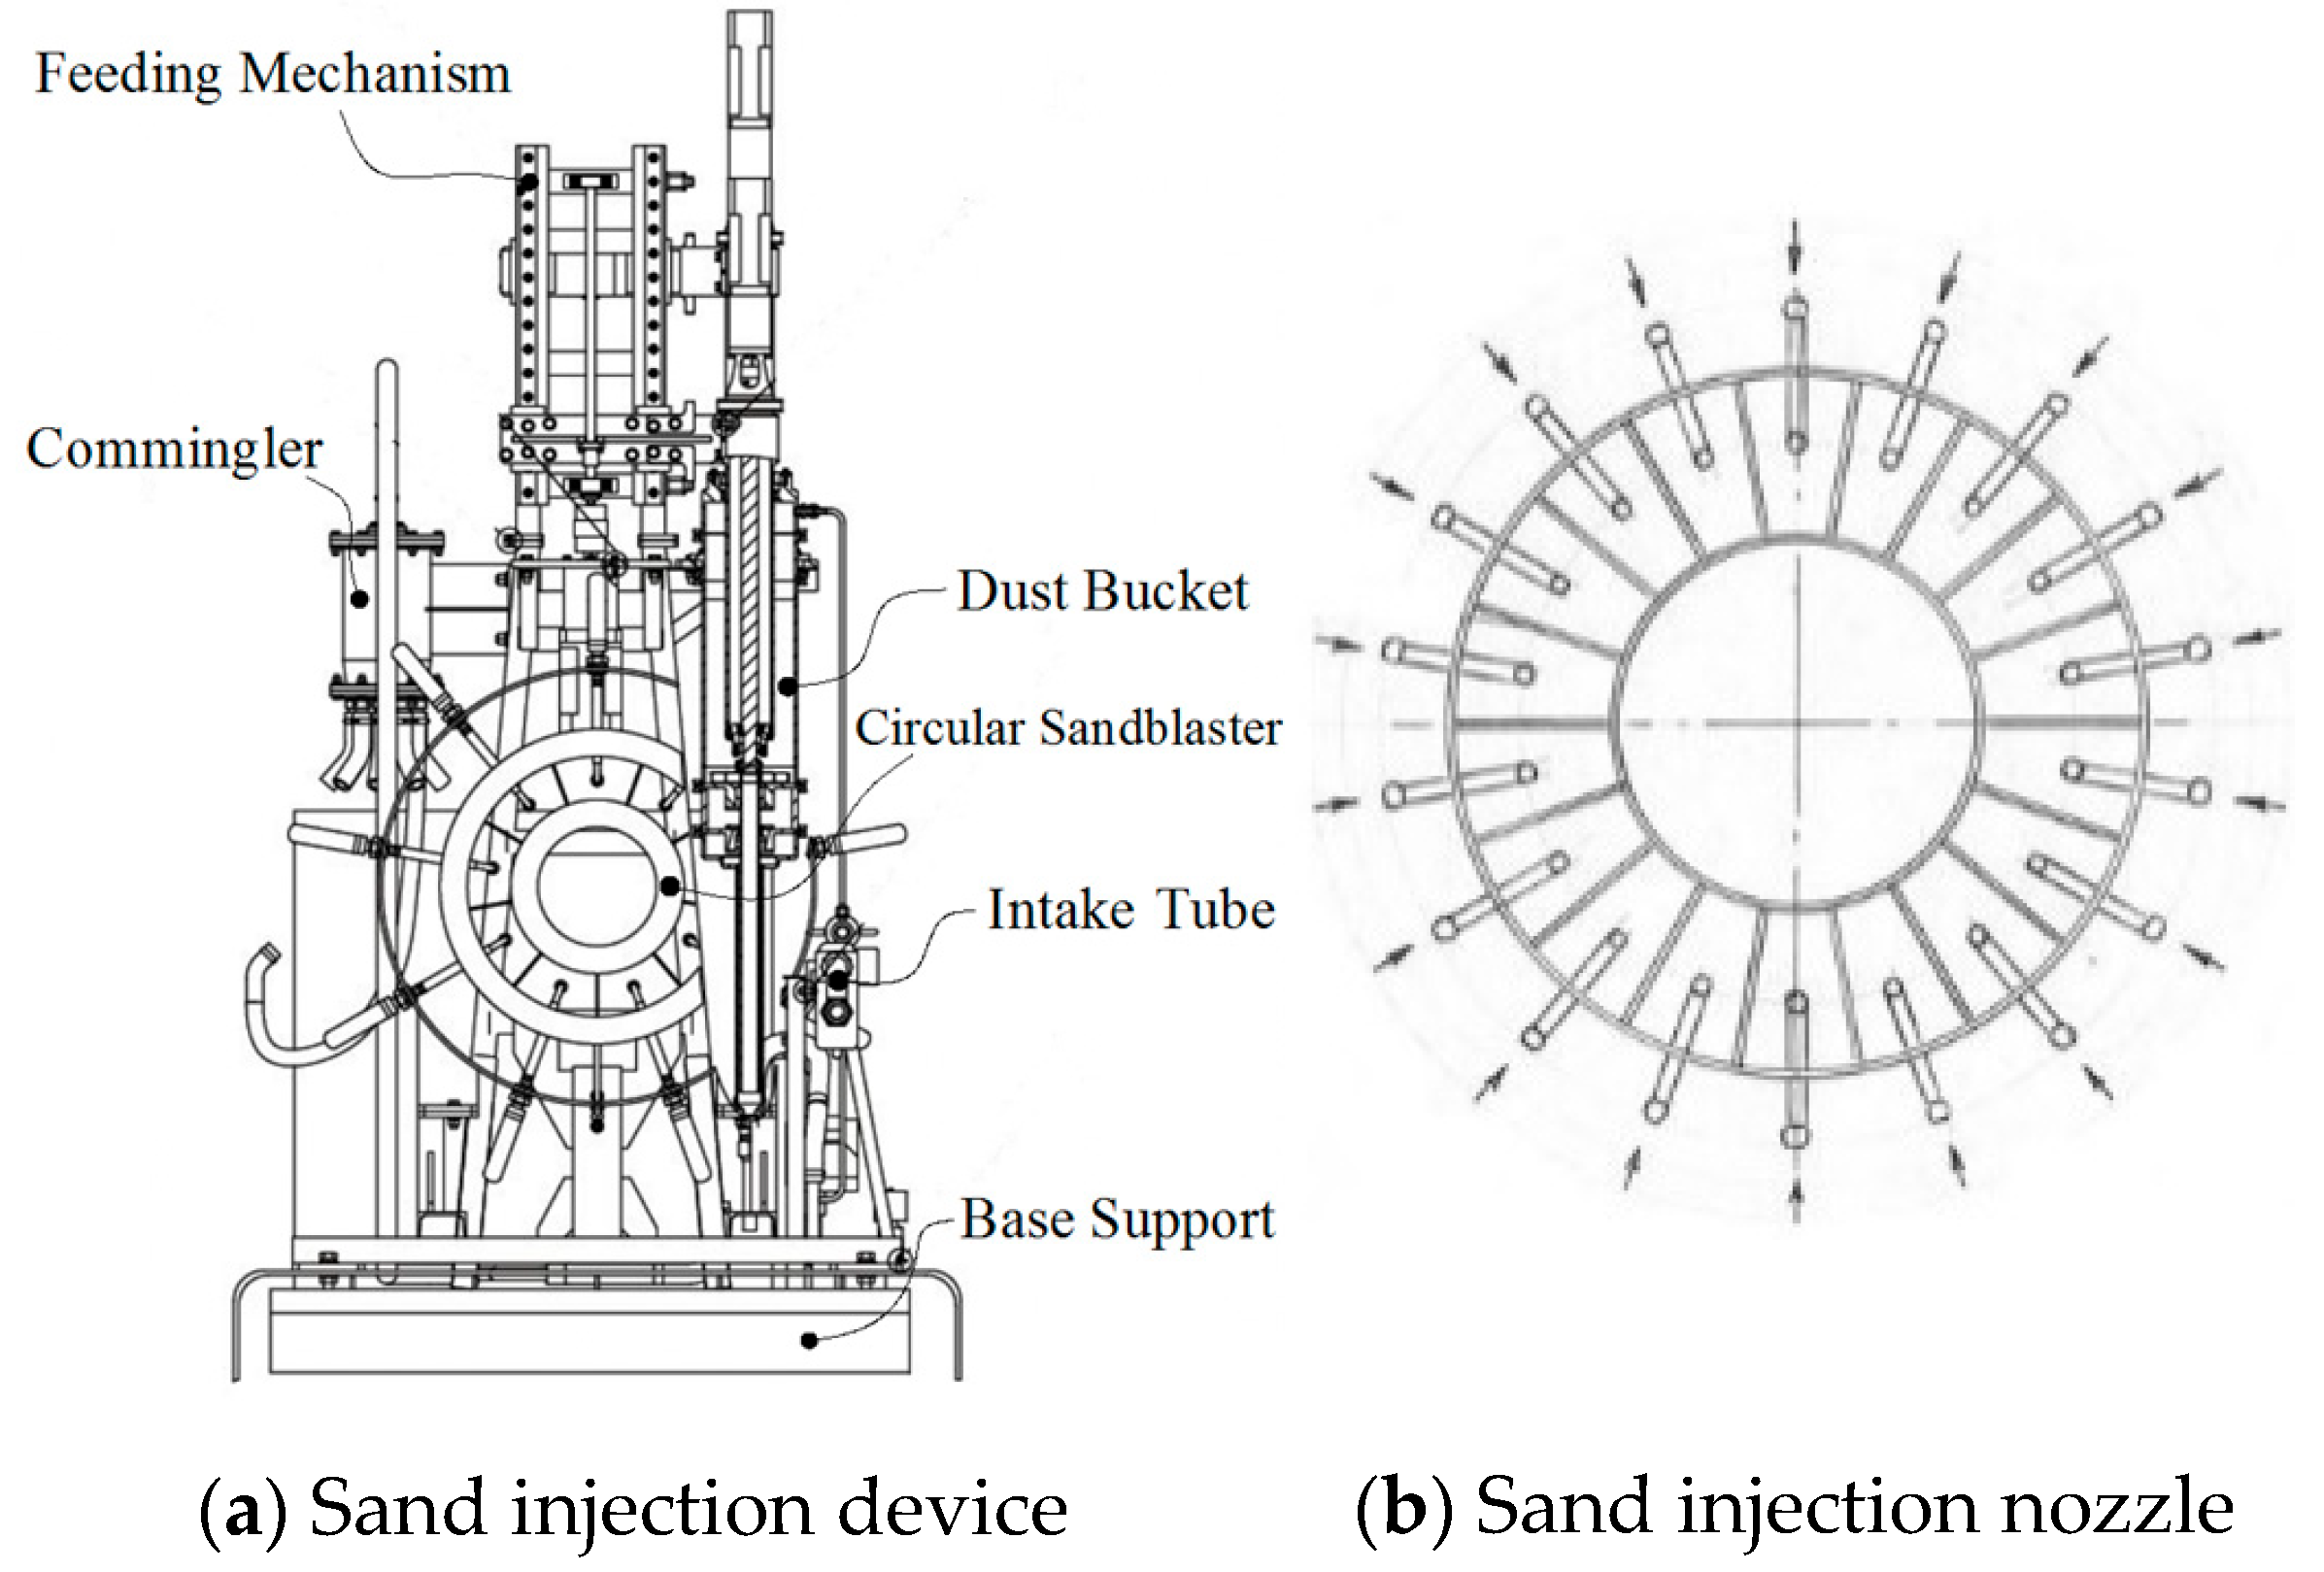
3.2. Sand and Dust Injection Test Apparatus

The sand and dust injection apparatus is utilized for introducing sand and dust into the engine to simulate the ingestion of sand and dust during actual engine operation. The apparatus mainly consists of a base support, commingler, feeding mechanism, dust bucket, intake tube, and circular sandblaster, as illustrated in Figure 2.
The sand and dust injection apparatus employs high-pressure air to propel sand and dust into the engine’s flow path, ensuring the uniformity of the sand and dust entering the engine through an annular nozzle. The feeding mechanism is driven by an electric motor, with the motor’s rotational speed regulating the amount of sand and dust injected, independent of the output pressure of the air source. During the sand ingestion test, simply adjusting the rotational speed of the motor in the sand injection device is sufficient to maintain the required sand and dust concentration.

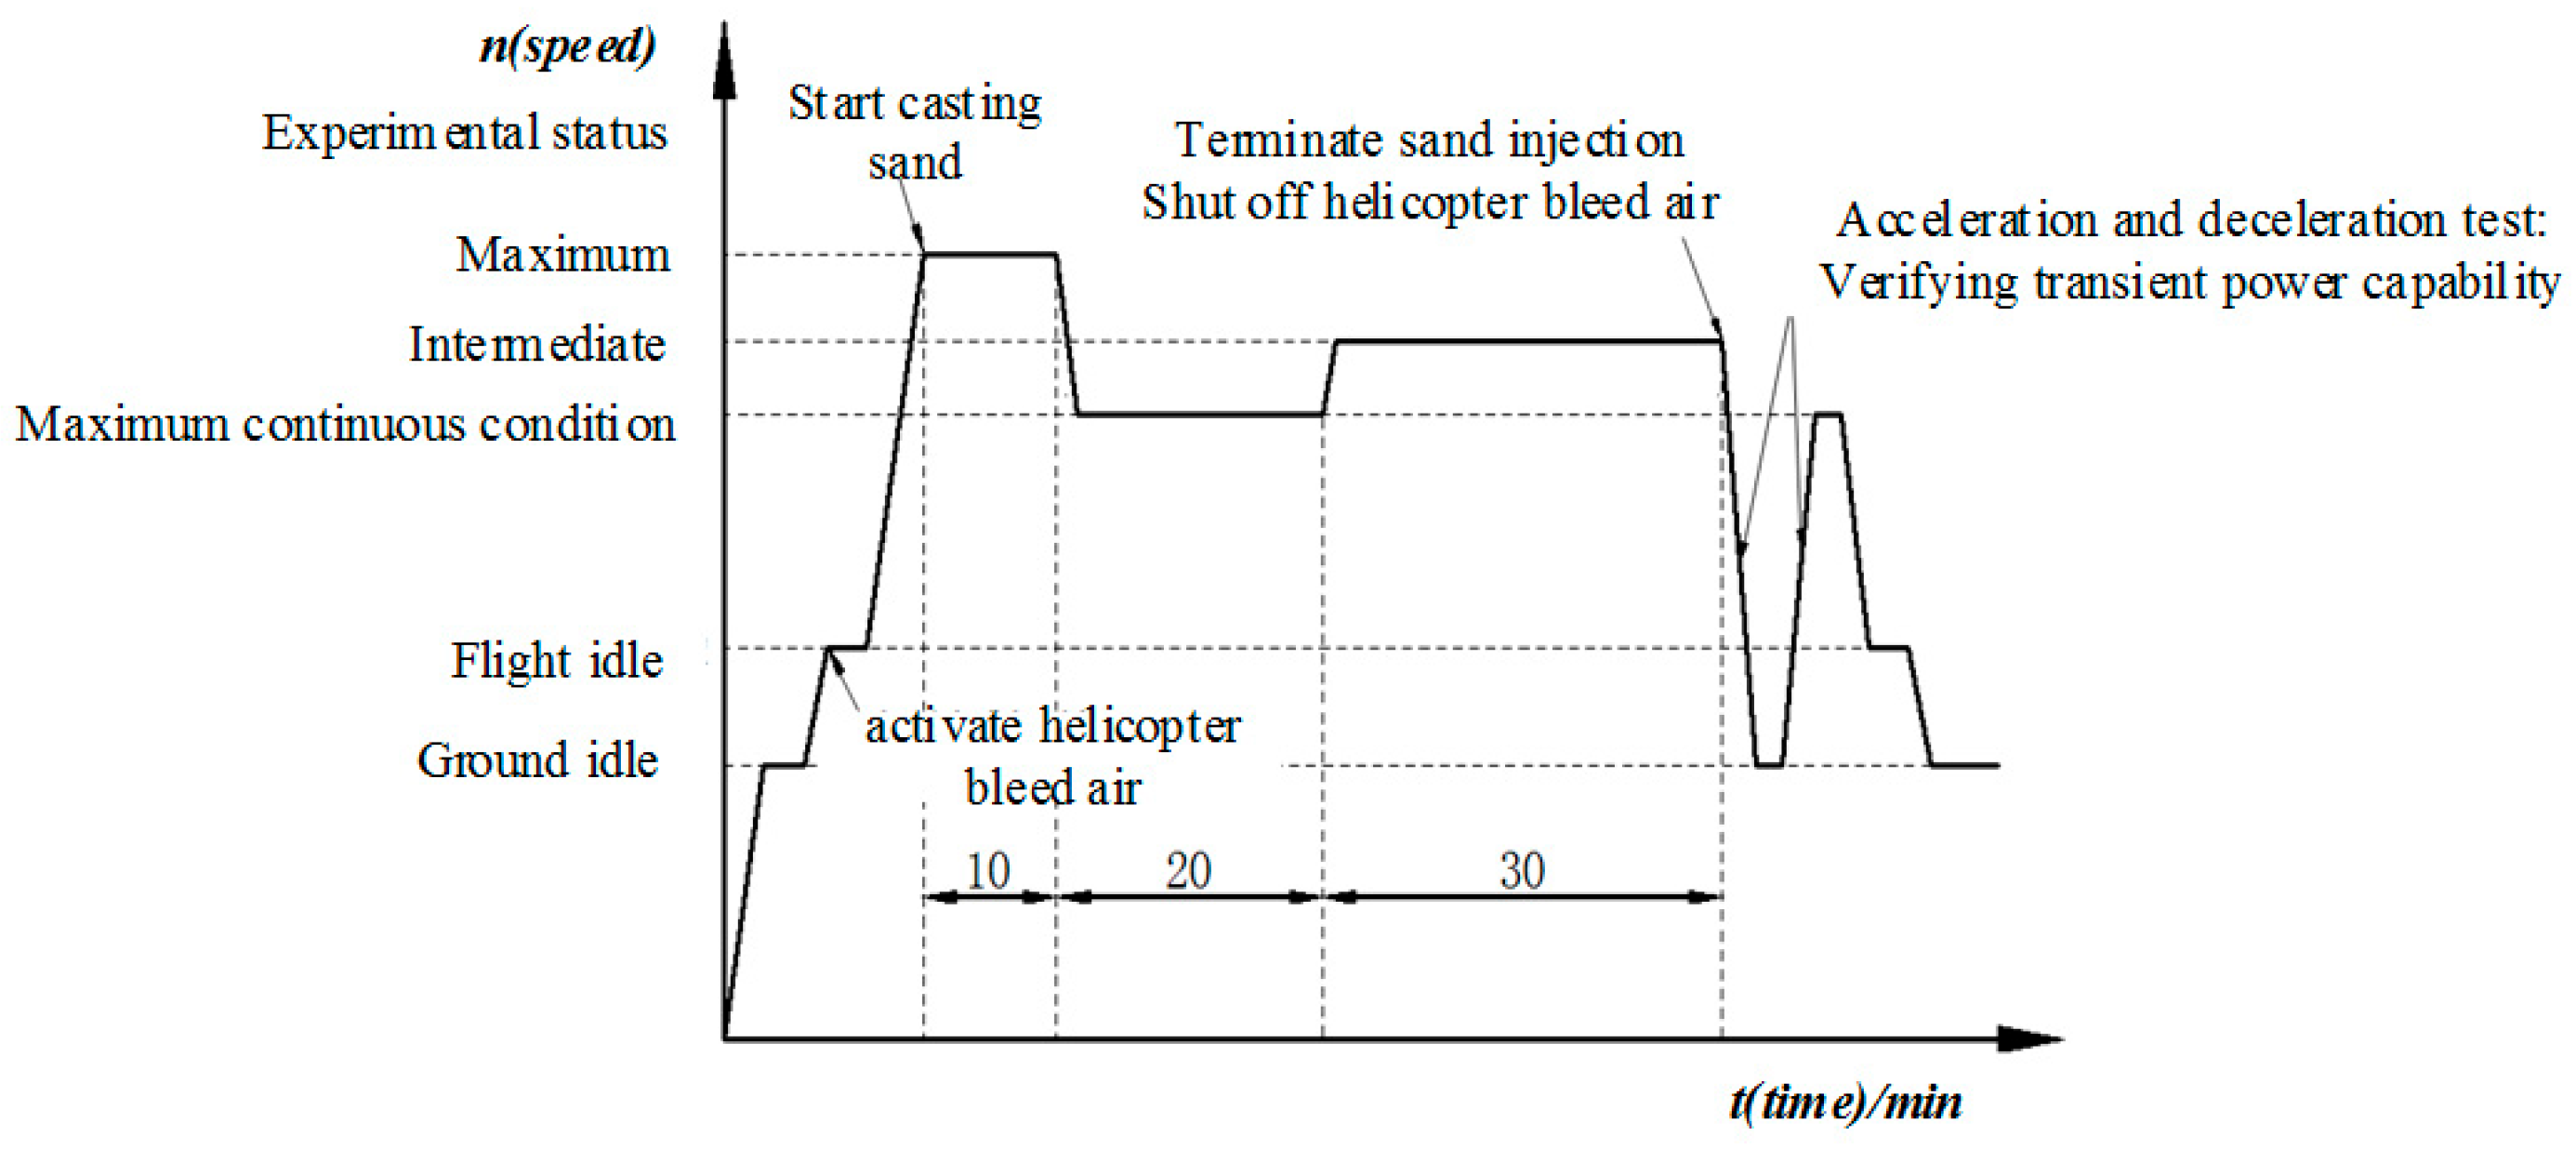
4. Experimental Procedure

In compliance with the GJB 242A standards and tailored to the specific features of the turboshaft engine, an experimental procedure for the whole-engine sand and dust ingestion test was formulated, as depicted in Figure 3. The sand and dust ingestion test is divided into 54 phases, each lasting 1 h, totaling 54 h; after every 2 phases, the engine is shut down and restarted, ensuring a minimum of 27 startups. The detailed experimental procedure is as follows:
(1)
The engine is started and sequentially advanced to ground idle and flight idle conditions;
(2)
The engine is advanced to the maximum condition to begin sand and dust introduction, which lasts for 10 min. The engine is throttled back to the maximum continuous condition, sustained for 20 min. The engine is advanced to an intermediate state, maintained for 30 min before ceasing sand and dust introduction and shutting off helicopter air bleed;
(3)
The engine is rapidly decelerated to ground idle and then quickly accelerated back to the maximum continuous condition to complete the acceleration and deceleration test, verifying the engine’s transient power capability after sand and dust ingestion;
(4)
The engine is sequentially decelerated to flight idle and ground conditions, completing one phase of the sand and dust ingestion test.
Figure 3. Sand and dust ingestion test procedure (single phase).
Aerospace 12 00146 g003

5. Experimental Results

Before the start of the sand and dust ingestion test, and at the 12 h, 22 h, 34 h, 45 h, and 54 h marks, calibration tests were conducted to better understand the changes in the engine parameters throughout the testing process. To minimize the impact of atmospheric environmental variations on the calibration test parameters, the analysis of the test results was performed under identical conversion conditions. Additionally, the parameters before and after the sand and dust ingestion test were normalized based on the baseline at the engine’s design point. Some technical terminology is utilized during the following analysis, the definitions of which are listed here for better understanding:
  • The pressure ratio refers to the ratio of the total pressure at the compressor outlet to the total pressure at the compressor inlet. Defining the pressure ratio as π c , the total pressure at the compressor outlet as p t o , and the total pressure at the compressor inlet as p t i , the pressure ratio is then given by
    π c = P t o P t i
  • The equivalent airflow refers to the conversion of the engine’s bench performance parameters, measured under various atmospheric conditions, into performance parameters under standard sea-level static conditions. Defining the airflow as W a , the equivalent airflow as W a c , and the ambient temperature and ambient pressure as T a m b and P a m b , respectively, the equivalent airflow is then given by
    W a c = W a × T a m b + 273.15 288.15 × 101325 P a m b

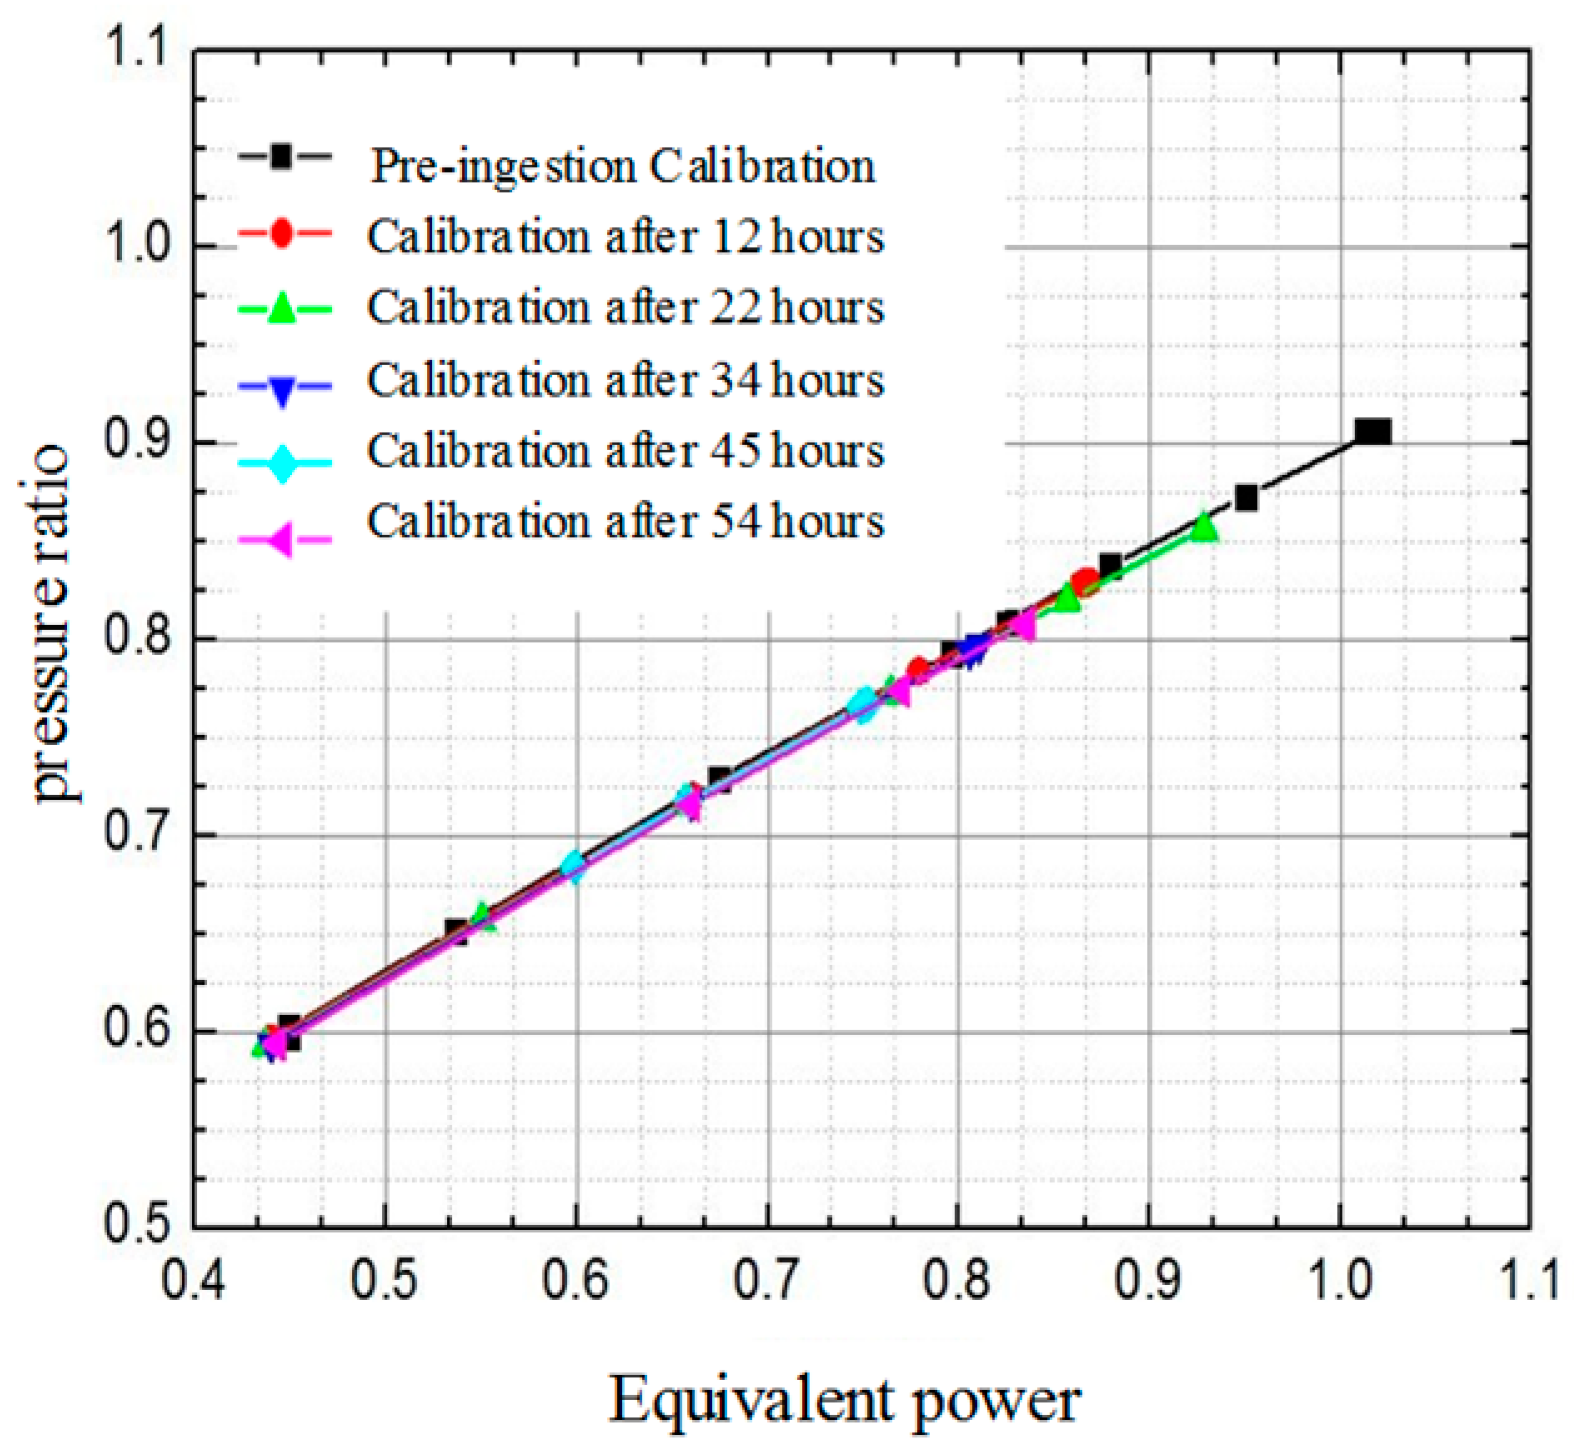
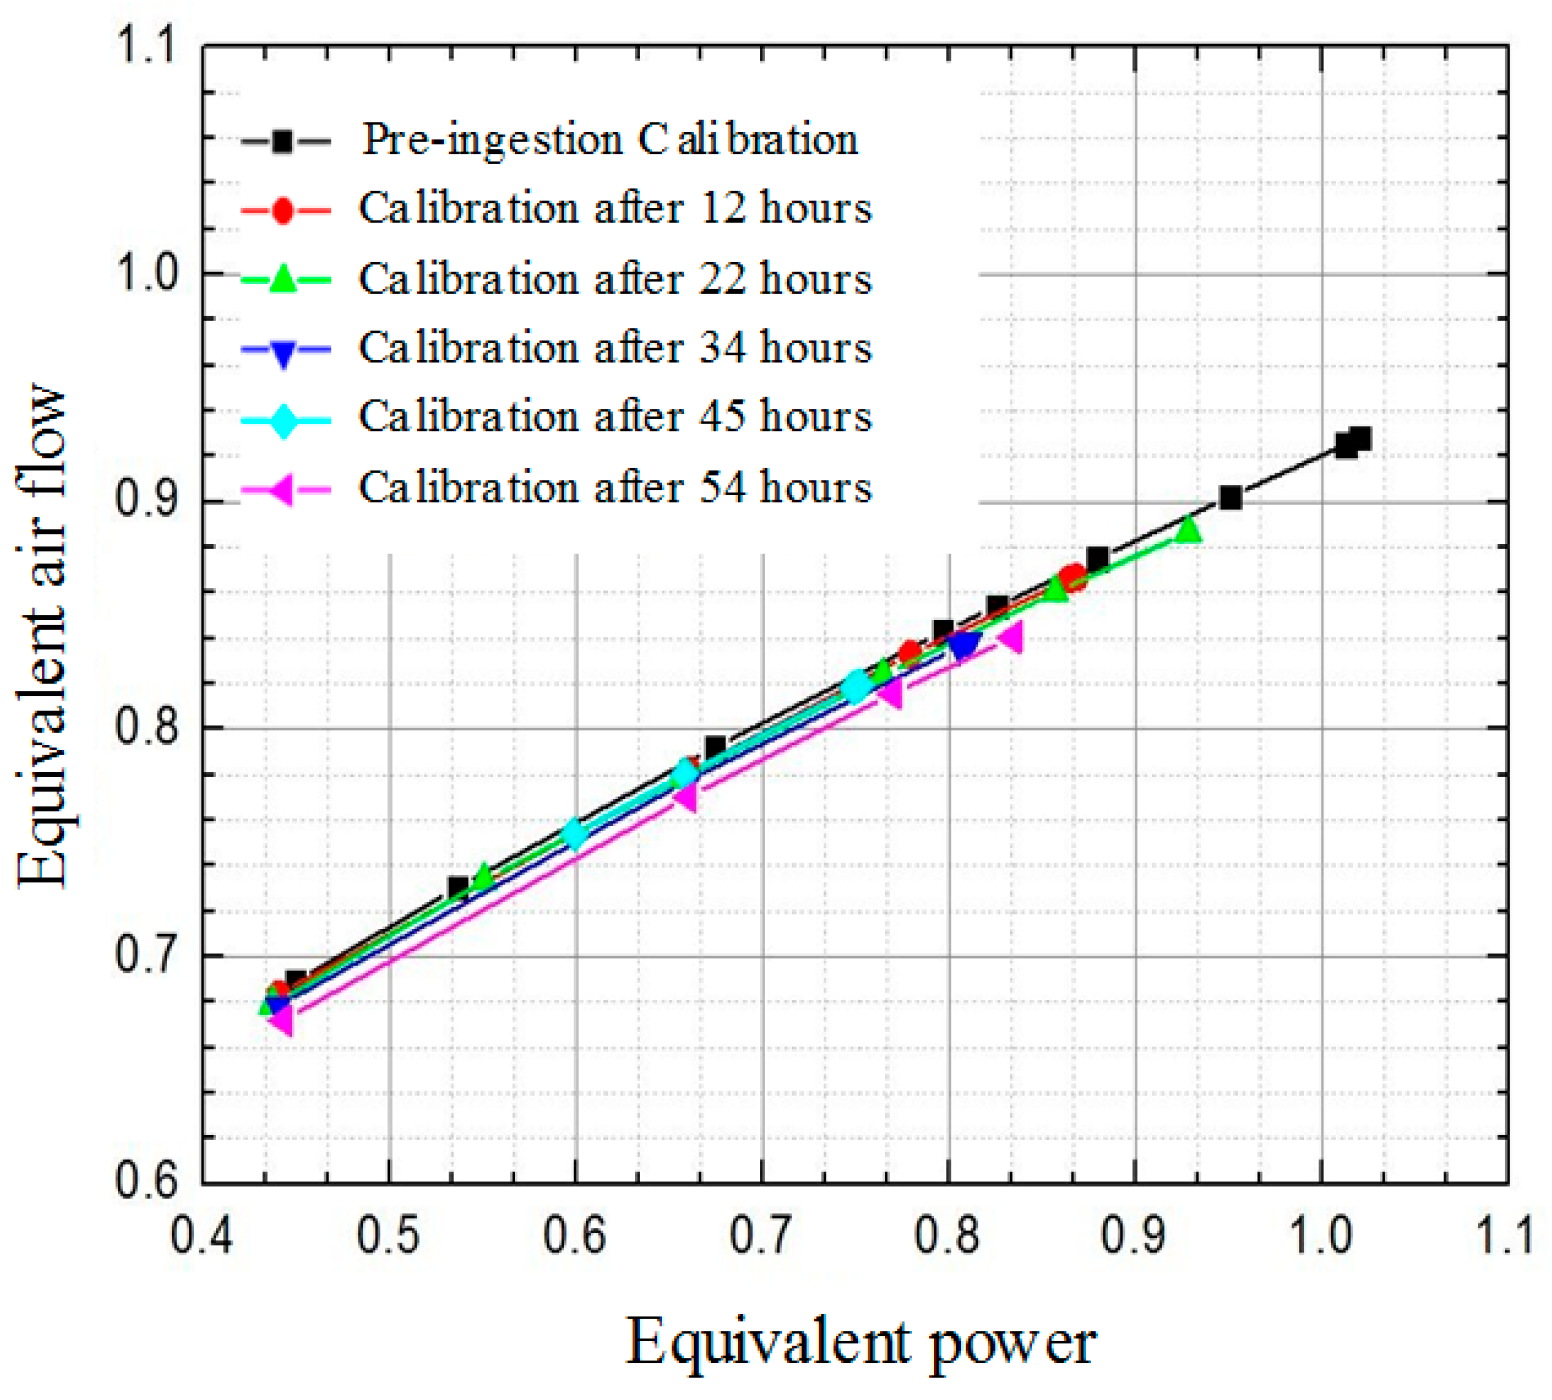
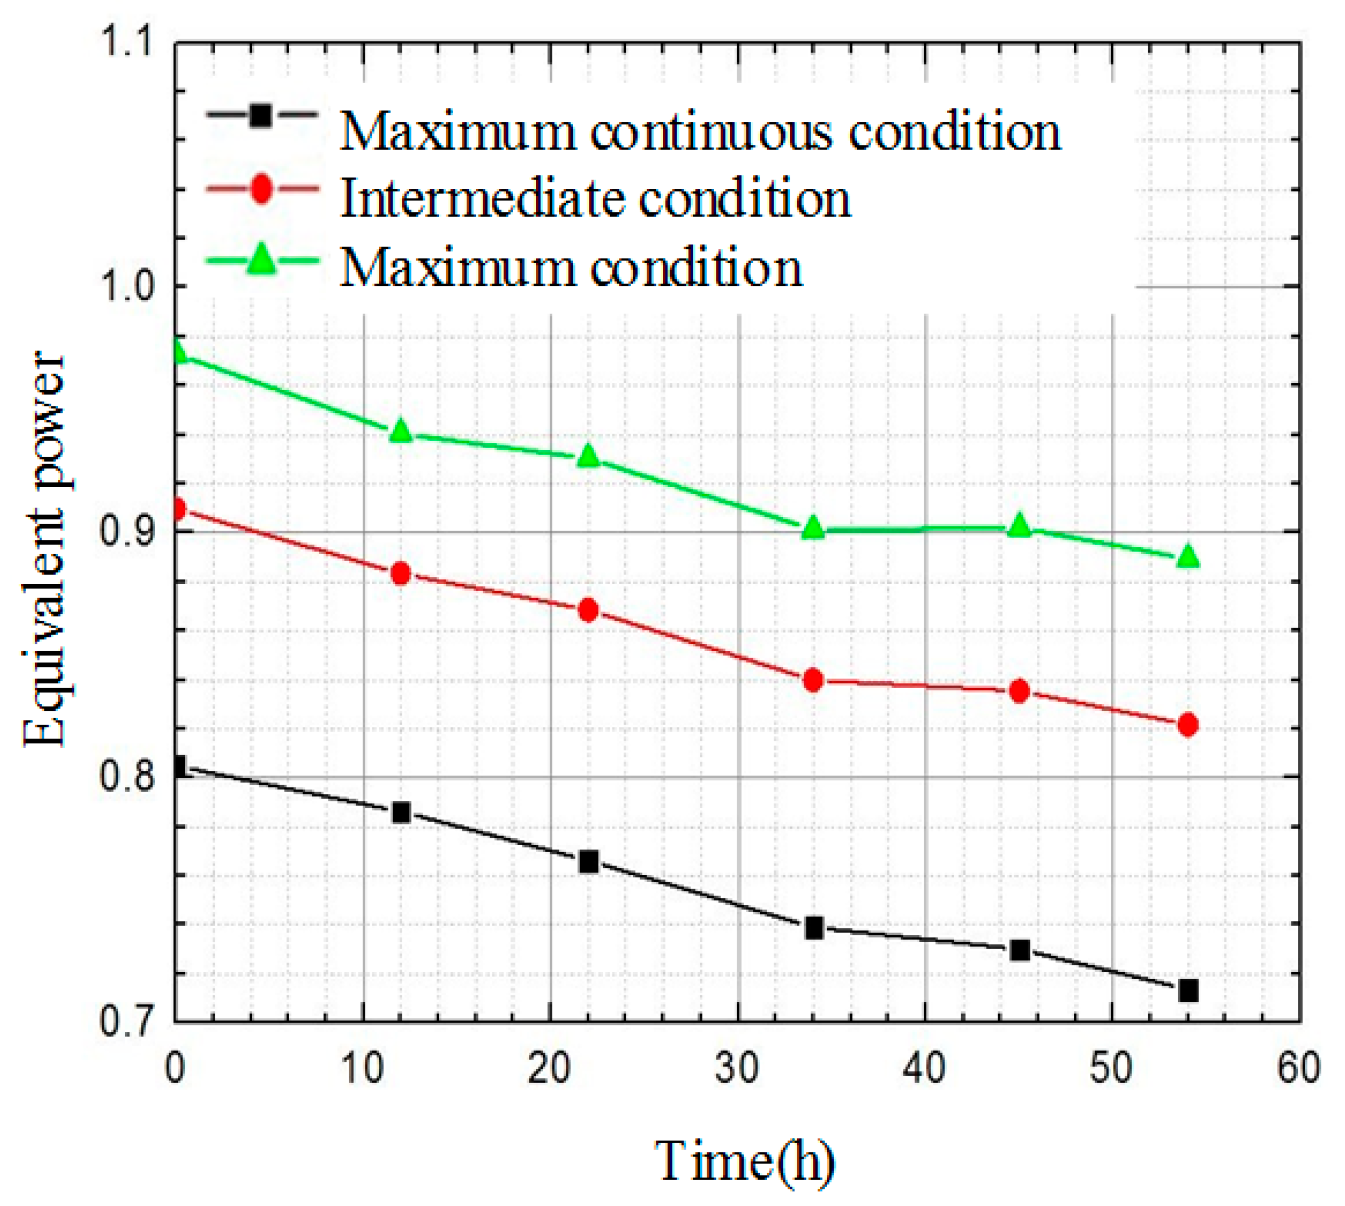
5.1. Engine Common Operating Line

The variation in the engine’s common operating line during the sand and dust ingestion test is shown in Figure 4. Within the first 45 h, the common operating line exhibits minimal change compared to pre-ingestion conditions, essentially coinciding. However, the common operating line shows a significant upward shift after 54 h.
Further analysis reveals that under the condition of constant equivalent power, the pressure ratio of the compressor remains essentially unchanged throughout the sand and dust ingestion test until completion, as shown in Figure 5; the equivalent airflow shows minimal change within the first 45 h of the test but experiences a noticeable decrease after 54 h, as depicted in Figure 6. The results indicate that the ingestion of sand and dust has a relatively minor impact on the common operating line over a short period. However, as the duration of sand ingestion increases, there is a significant reduction in the equivalent airflow, leading to an upward shift in the engine’s common operating line.

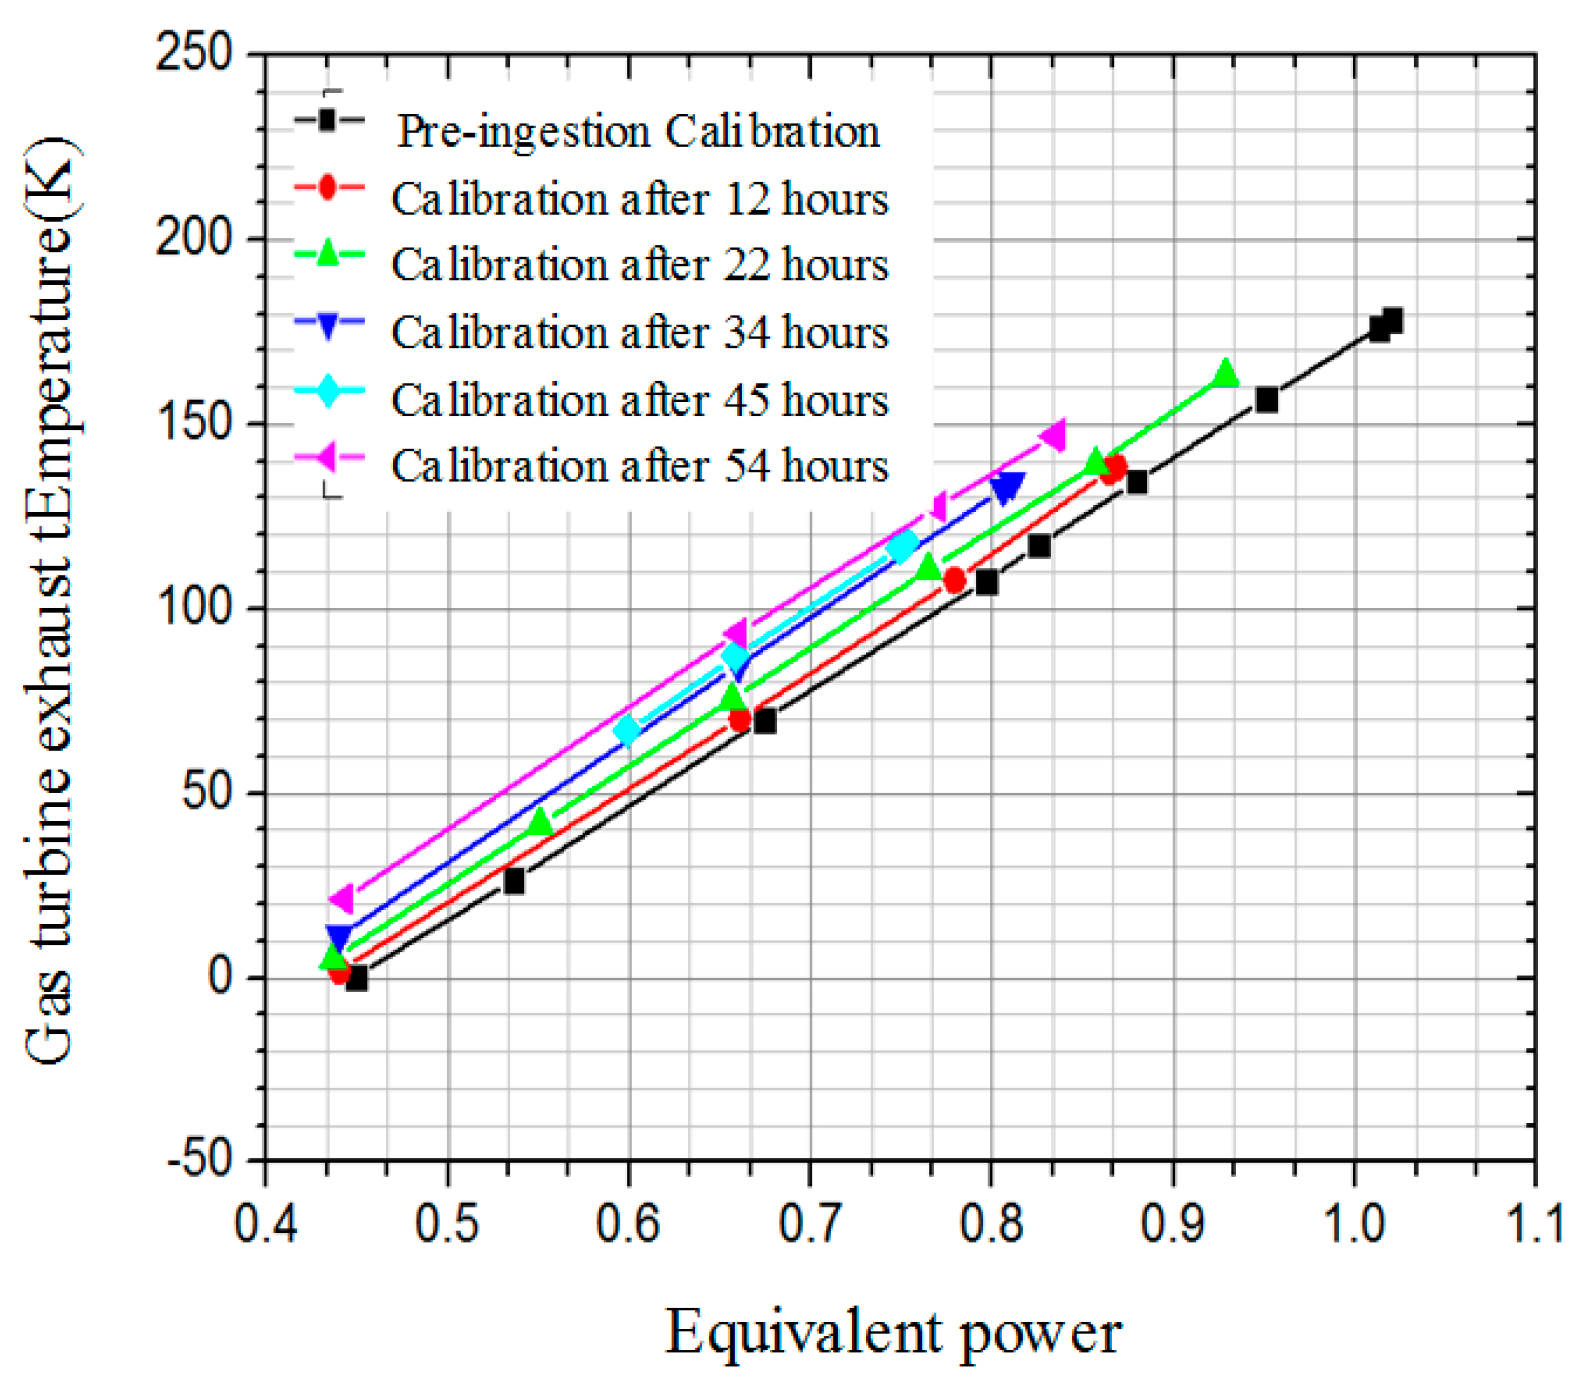
5.2. Turbine Exhaust Temperature

Under the condition of constant equivalent power, the variation curve of the engine’s gas turbine exhaust temperature (T45) with the increase in sand ingestion time is shown in Figure 7. After the 54 h sand ingestion test is completed, compared to before the test, the minimum increase in the turbine exhaust temperature is 21 °C, and the maximum increase reaches 27.9 °C. Moreover, as the engine’s equivalent power increases, the increment in T45 decreases accordingly, with details provided in Table 4. This indicates that the turbine exhaust temperature rises as the sand and dust ingestion time increases, but the impact is relatively minor at higher power states of the engine.

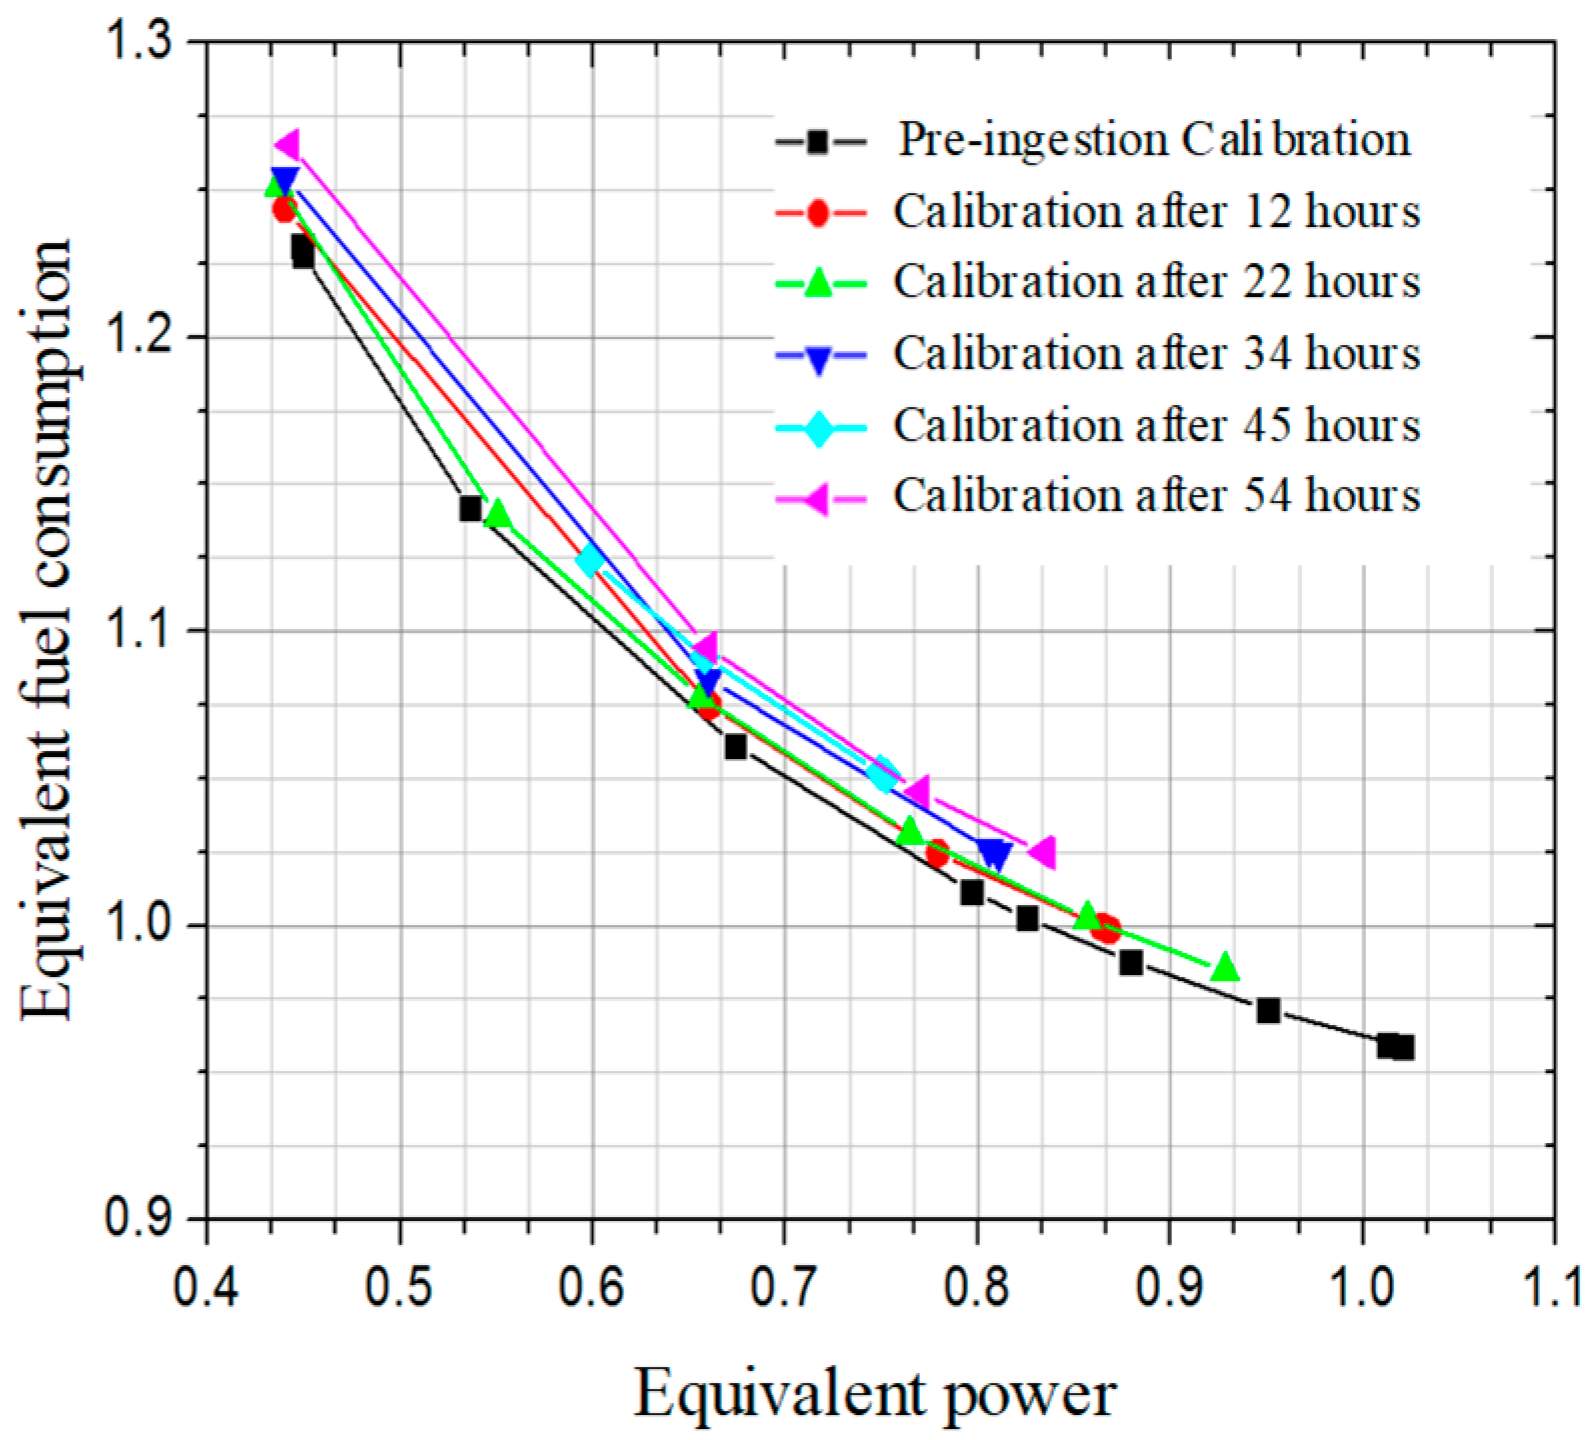
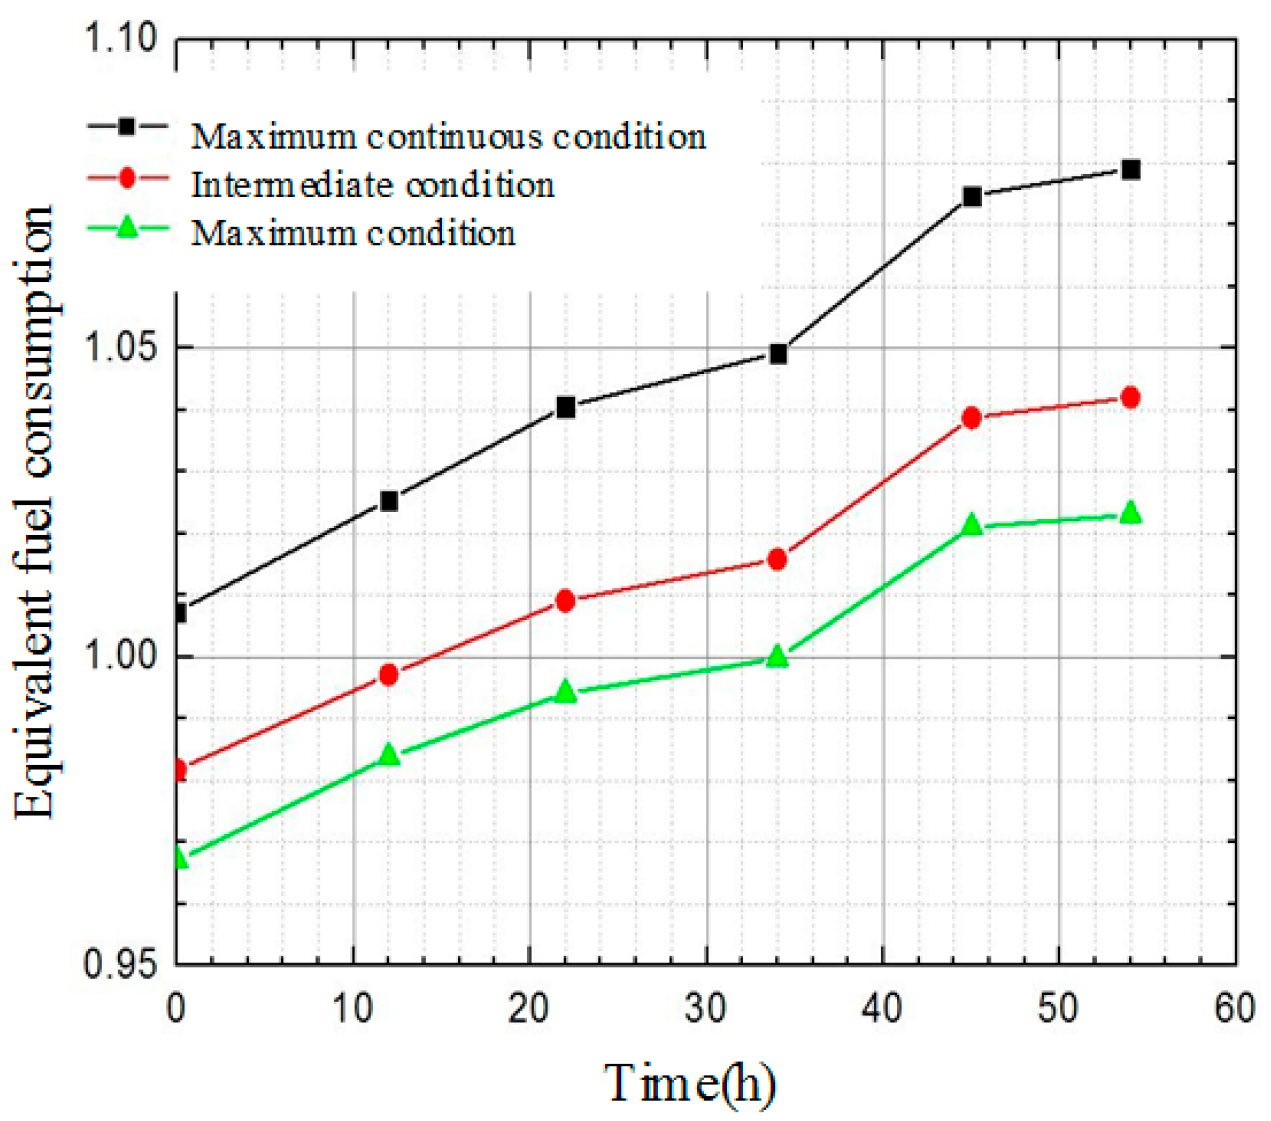
5.3. Engine Power and Specific Fuel Consumption

The variation curves of the engine power and specific fuel consumption (SFC) during the sand and dust ingestion test are depicted in Figure 8. It can be seen that the SFC increases as the sand and dust ingestion time increases.
Compared to pre-ingestion conditions, the SFC of the engine increases by 2.18%~2.55% under different equivalent power levels. Furthermore, the increase in the SFC decreases with the increase in the engine’s equivalent power, as shown in Table 5.
Under the same equivalent turbine exhaust temperature (T45) condition, the variation in the engine power and SFC with the sand and dust ingestion time is illustrated in Figure 9 and Figure 10. The analysis reveals that as the sand and dust ingestion time progresses, the engine power incurs losses to varying extents, and the SFC increases to varying extents across different operation states.
After the 54 h sand and dust ingestion test, the power loss and specific fuel consumption increase under different states are detailed in Table 6. The results indicate that in the maximum continuous condition, the engine power loss is approximately 11.33%, and the specific fuel consumption increase is about 5.06%. This meets the GJB 242A requirement that the increase in specific fuel consumption should not exceed 10% but does not meet the requirement that the power loss should not exceed 10%.
Following each phase of the sand and dust ingestion test, acceleration and deceleration tests were conducted without affecting the engine’s transient power capability. A total of 27 normal startups were completed during the test process, satisfying the relevant requirements of GJB 242A.

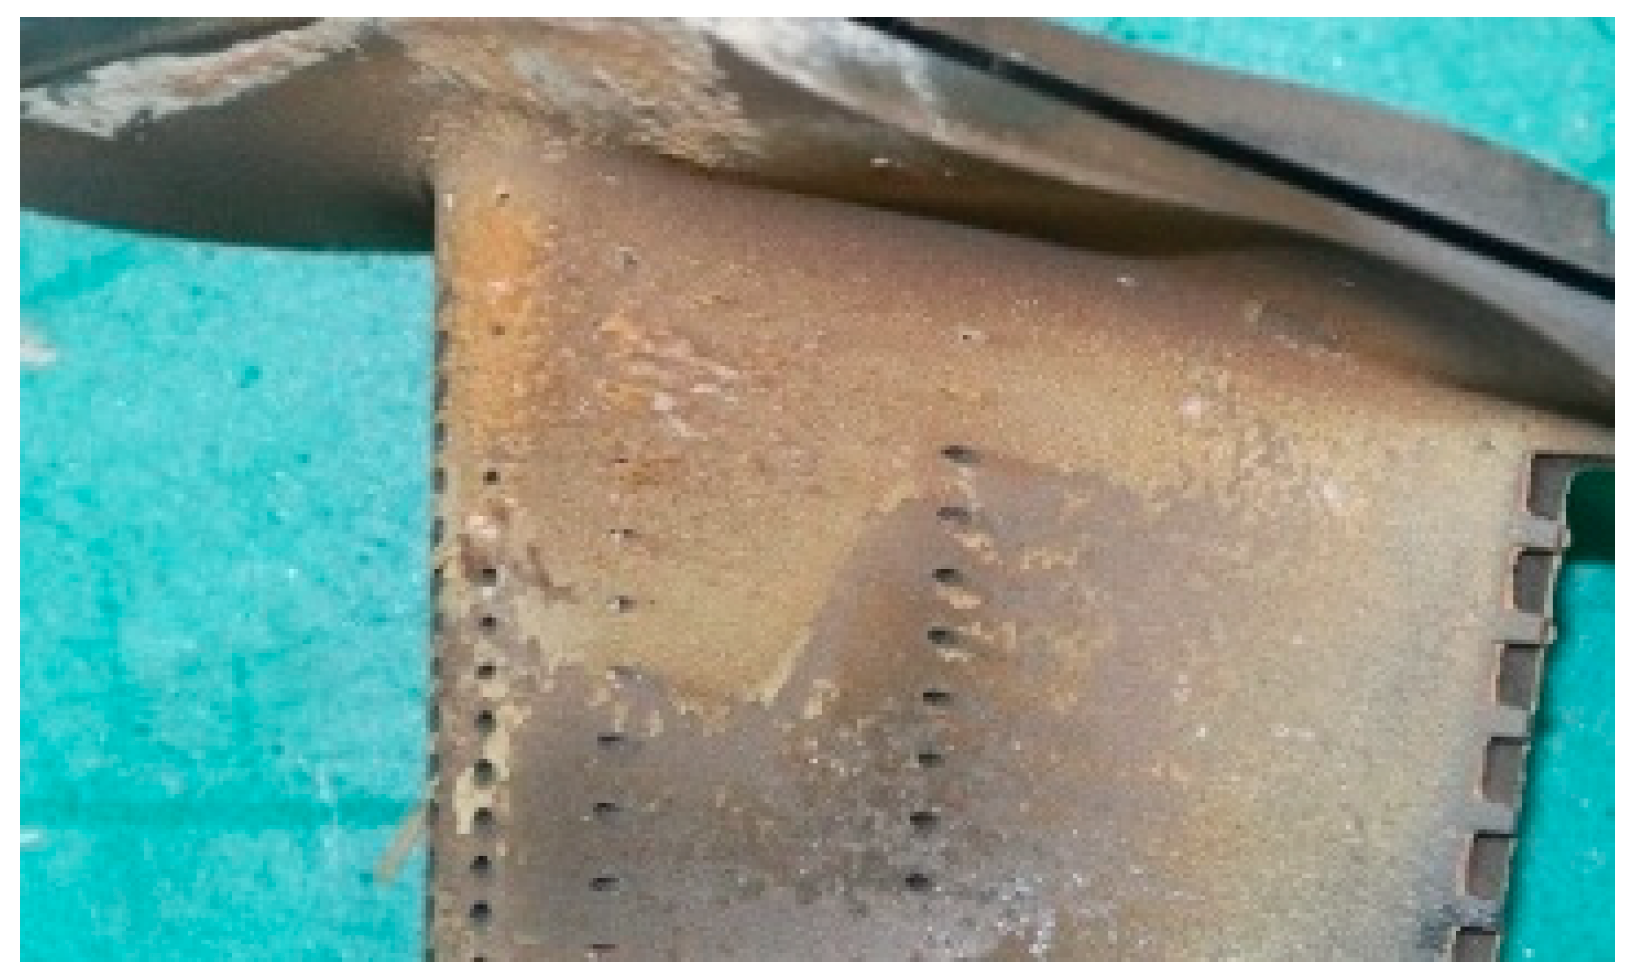
5.4. Engine Disassembly Inspection

Following the completion of the 54 h sand and dust ingestion test, the engine was disassembled for inspection. It was observed that the compressor components, including the leading edges of the axial first-stage blades, the trailing edges of the axial third-stage stator blades, and the leading edges of the centrifugal impeller inlet, exhibited varying degrees of wear, as shown in Figure 11, Figure 12 and Figure 13; the turbine components, such as the guide vanes, blades, and the internal cavity of the turbine disk, showed varying degrees of sand adhesion, hole blockage, and accumulation, as depicted in Figure 14 and Figure 15. No signs of imminent failure were found during the disassembly inspection process.
Further analysis based on the disassembly inspection indicates that the wear of the compressor flow path components, as well as the sand and dust adhesion, hole blockage, and accumulation phenomena of the turbine flow path components, has led to a certain degree of efficiency reduction in both the compressor and turbine components, thereby affecting the overall performance of the engine. Subsequent to the inspection, technical research can be conducted on the sand erosion and wear patterns of compressor blades and the preparation of anti-abrasion coatings; for the pronounced sand and dust adhesion, hole blockage, and accumulation phenomena of turbine flow path components, technical research can be conducted on the characteristics of sand deposition on turbine blade surfaces, and the optimization design of anti-sand-deposition cooling structures.

6. Conclusions

A 54 h whole-engine sand and dust ingestion test was conducted for the first time in China, in accordance with the requirements of GJB 242A. This study examined the variation patterns of performance parameters such as the engine’s common operating line, power, specific fuel consumption, and turbine exhaust temperature during the sand and dust ingestion test. The main conclusions are as follows:
(1)
A short period of sand and dust ingestion has minimal impact on the engine’s common operating line. However, there is a noticeable decrease in the equivalent airflow as the duration of sand and dust ingestion increases, consequently leading to an upward shift in the engine’s common operating line. This indicates that the engine might experience a surge after long-enough sand and dust ingestion;
(2)
As the sand and dust ingestion time increases, the turbine exhaust temperature rises correspondingly, with the maximum increase reaching 27.9 °C. However, the impact of sand and dust ingestion on the turbine exhaust temperature under high power states of the engine is relatively minor;
(3)
After the sand and dust ingestion test, the engine experienced a power loss of approximately 11.33% and an increase in SFC of about 5.06% at the maximum continuous condition. This meets the GJB 242A requirement that the increase in SFC should not exceed 10% but does not meet the requirement that power loss should not exceed 10%. The test process included 27 normal startups and did not affect the engine’s transient power capability, indicating that the engine has good sand and dust resistance;
(4)
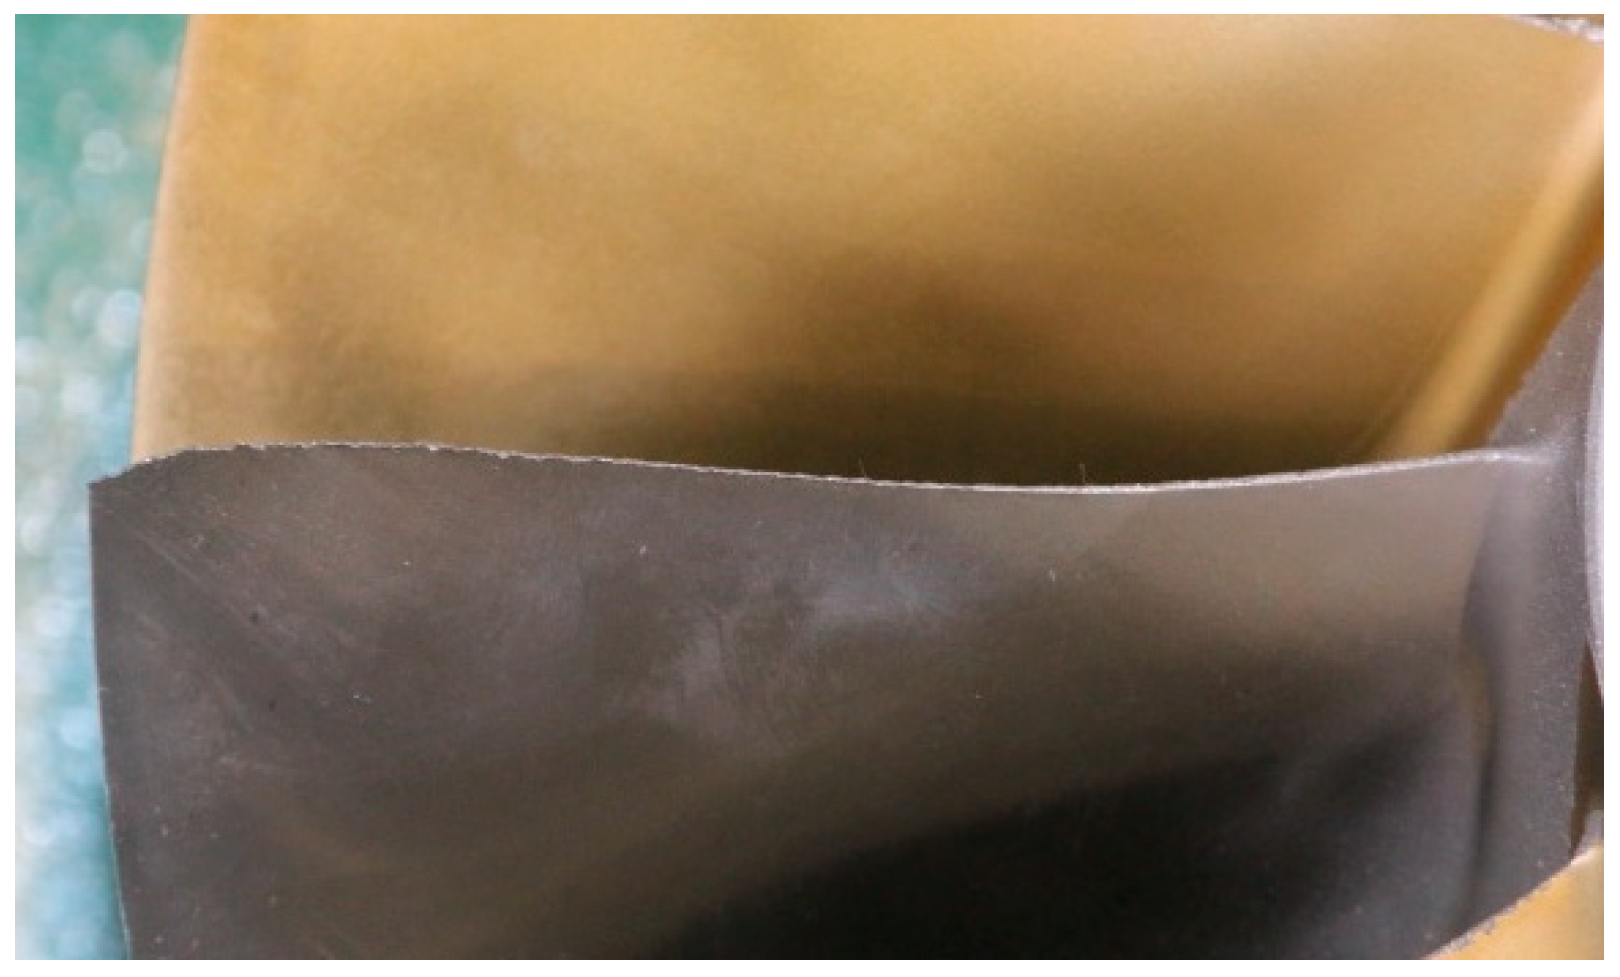
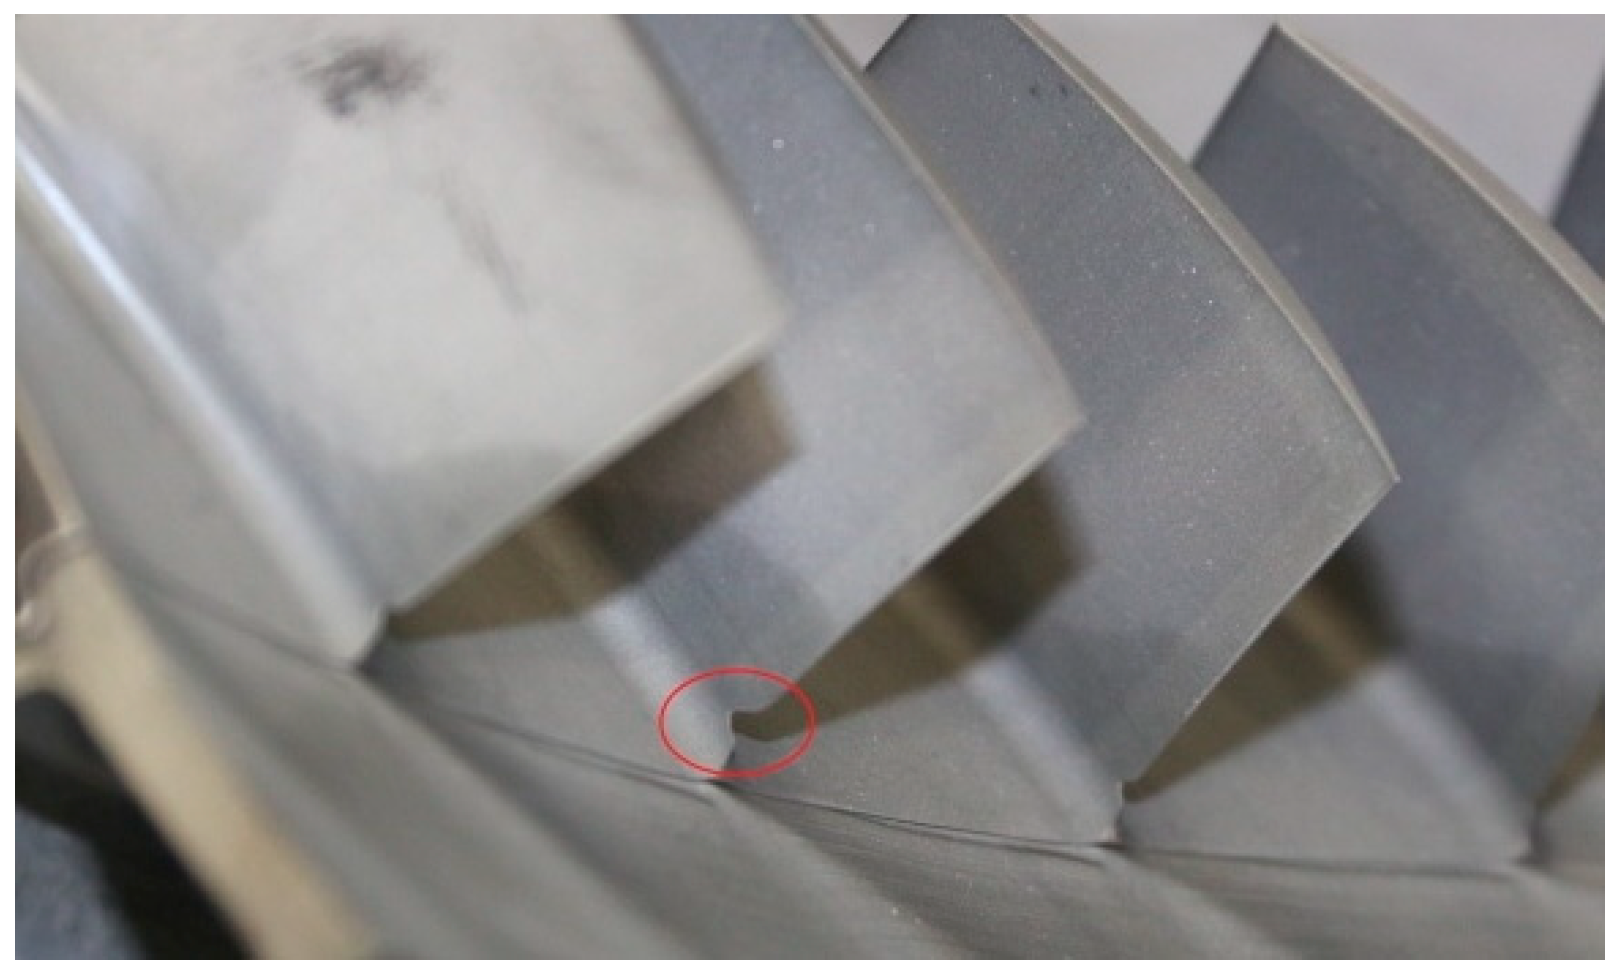
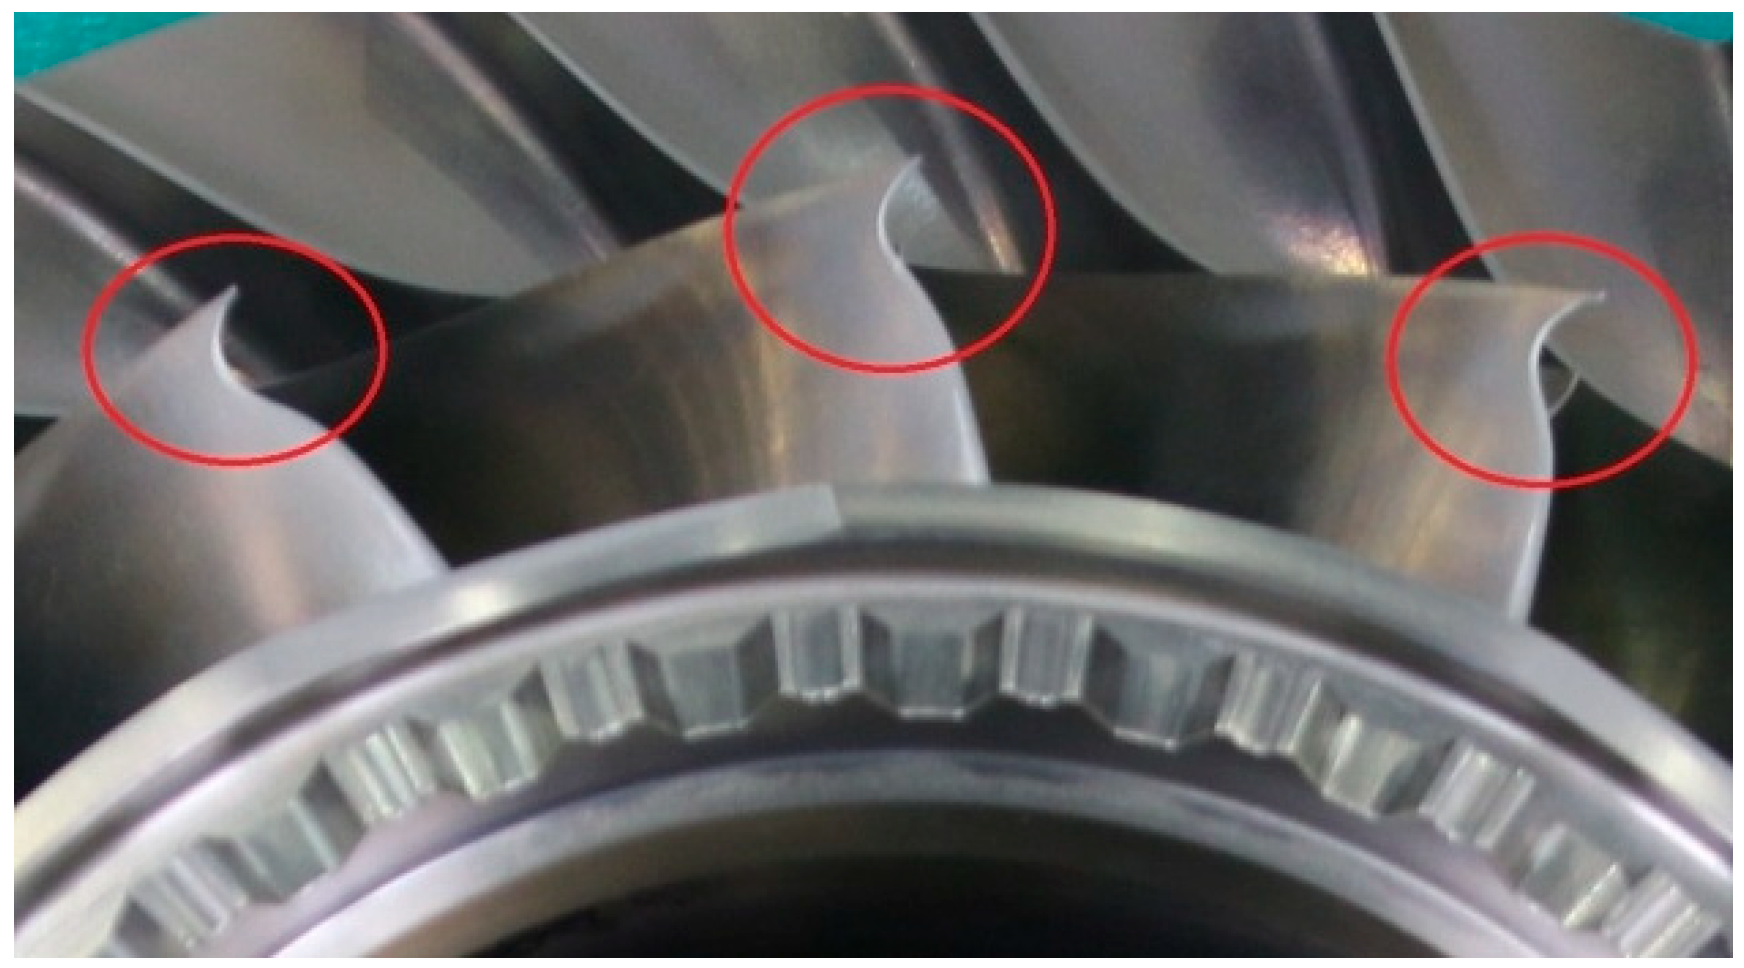
Post-ingestion disassembly inspections revealed varying degrees of wear on components of the compressor and varying degrees of sand adhesion, hole blockage, and accumulation on components of the turbine, with no signs of imminent failure detected. It is recommended that subsequent technical research be conducted on the sand erosion and wear patterns of compressor blades and the preparation of anti-abrasion coatings. Also, research on the characteristics of surface sand deposition and the optimization design of anti-sand-deposition cooling structures is suggested for the turbine blades.
The research findings of this paper can provide a reference for the sand and dust resistance design of similar turboshaft engines.

Author Contributions

Conceptualization, Q.W.; Validation, Y.W.; Formal analysis, W.Z.; Investigation, X.Y.; Writing—original draft, Z.S.; Project administration, F.W. All authors have read and agreed to the published version of the manuscript.

Funding

The research is funded by Jiangxi Key Laboratory of Green General Aviation Power grant number Ef202406366. And the APC was funded by Ef202406366.

Data Availability Statement

The datasets presented in this article are not readily available due to technical limitations.

Conflicts of Interest

The authors declare no conflict of interest.

References

  1. Ramachandran, R.C.S.; Balasubramanian, V.; Ananthapadmanabhan, P.V. Thermal cycling behaviour of plasma sprayed lanthanum zirconate based coatings under concurrent infiltration by a molten glass concoction. Ceram. Int. 2013, 39, 1413–1431. [Google Scholar]
  2. Bajracharya, T.; Acharya, B.; Joshi, C.; Saini, R.; Dahlhaug, O. Sand erosion of pelton turbine nozzles and buckets: A case study of chilime hydropower plant. Wear 2008, 264, 177–184. [Google Scholar] [CrossRef]
  3. Zhang, Z.P.; Zhang, J.; Chai, Q.; Li, C.W.; Wu, X.L. Velocity estimation for the impact object against the aero-engine blade. J. Air Force Eng. Univ. Nat. Sci. Ed. 2015, 6, 7–10. (In Chinese) [Google Scholar]
  4. Wei, X.X.; Li, G.L. The impact of sand on the blades of airplane engines. J. Beijing Inst. Technol. 2002, 471–474. (In Chinese) [Google Scholar] [CrossRef]
  5. He, G.Y.; Li, Y.H.; Chai, Y.; Zhang, Y.F.; Wang, G. Review of key issues on coating against sand erosion of aero-engine compressor blade. Acta Aeronaut. Et Astronaut. Sin. 2015, 36, 1733–1743. (In Chinese) [Google Scholar]
  6. Zeng, Q. Numerical Simulation of Sand Trajectories in Airflow Channel; Nanjing University of Aeronautics and Astronautics: Nanjing, China, 2013. (In Chinese) [Google Scholar]
  7. Saxena, S.; Jothiprasad, G.; Bourassa, C.; Pritchard, B. Numerical Simulation of particulates in multi-stage axial compressors. J. Turbomach. 2017, 139, 031013. [Google Scholar] [CrossRef]
  8. Pfledderer, L.; Pepi, M. Sand erosion test method for DOD unique environments. In Proceedings of the Tri-Service Corrosion Conference, Denver, CO, USA, 3–6 December 2007; pp. 1–24. [Google Scholar]
  9. Pepi, M.; Squillacioti, R.; Pfledderer, L.; Phelps, A. Solid particle erosion testing of helicopter rotor blade materials. J. Fail. Anal. Prev. 2012, 12, 96–108. [Google Scholar] [CrossRef]
  10. Zeng, L.; Cheng, L.; Li, N.; Chen, J.; Li, S.L. Comparison and analysis of morphology of standard sand and typical sand particle in aeroengines and swallowing test. Aeroengine 2019, 1, 97–102. (In Chinese) [Google Scholar]
  11. GJB241-1987; General Specification for Engine, Aircraft, Turbojet and Turbofan. Commission for Science, Technology and Industry for National Defense: Beijing, China, 1987. (In Chinese)
  12. GJB242-1987; General Specification for Engine, Aircraft, Turbprop and Turboshaft. Commission of Science, Technology and Industry for National Defense: Beijing, China, 1987. (In Chinese)
  13. GJB2026-1994; Requirements for Test of Sand Ingestion, Aircraft Turbojet and Turbofan Engine. Commission for Science, Technology and Industry for National Defense: Beijing, China, 1994. (In Chinese)
  14. Dunn, M.G.; Padova, C.; Moller, J.E.; Adams, R.M. Performance deterioration of a turbofan and a turbojet engine upon exposure to a dust environment. Gas Turbines Power 1987, 109, 336–343. [Google Scholar] [CrossRef]
  15. Ghenaiet, A. Study of sand partical trajictories and erosion into the First compression stage of a turbofan. J. Turbomach. 2012, 134, 051025. [Google Scholar] [CrossRef]
  16. Wylie, S.; Bucknell, A.; Forsyth, P.; Mcgilvray, M.; Gillespie, D.R.H. Reduction in flow parameter resulting from volcanic ash deposition in engine representative cooling passages. J. Turbomach. 2017, 139, 031008. [Google Scholar] [CrossRef]
  17. Chen, L.; Liu, Z.L.; Liu, Y.F. Study on sands wallow test of an aviation turboshaft engine. Aeroengine 2018, 79–82. (In Chinese) [Google Scholar]
  18. Ma, C.; Wei, H.T. An aero-engine sand swallow test method. Sci. Technol. Eng. 2015, 15, 239–242. (In Chinese) [Google Scholar]
  19. Chang, H.W.; Li, Y.J. Technical analysis of sand ingestion test on Aero-engine. Mech. Eng. 2019, 8, 126–127. (In Chinese) [Google Scholar]
  20. Yang, F.; Tian, Z.; Zhang, Z.B. Design and research of sand ingestion test device for high-power turboprop whole engine. Sci. Technol. Eng. 2020, 21, 8573–8578. (In Chinese) [Google Scholar]
  21. GJB242A-2018; General Specification for Engine, Aircraft, Turbprop and Turboshaft. Commission for Science, Technology and Industry for National Defense: Beijing, China, 2018. (In Chinese)
Figure 1. A schematic diagram of the test engine.
Aerospace 12 00146 g001
Figure 2. Sand and dust injection test apparatus.
Aerospace 12 00146 g002
Figure 4. Engine common operating line.
Aerospace 12 00146 g004
Figure 5. Compressor pressure ratio variation curve.
Aerospace 12 00146 g005
Figure 6. Equivalent airflow variation curve.
Aerospace 12 00146 g006
Figure 7. Gas turbine exhaust temperature variation curve with sand and dust ingestion time.
Aerospace 12 00146 g007
Figure 8. Engine power–SFC variation curve.
Aerospace 12 00146 g008
Figure 9. Engine power variation with sand and dust ingestion time under different conditions.
Aerospace 12 00146 g009
Figure 10. Variation in SFC with sand and dust ingestion time under different conditions.
Aerospace 12 00146 g010
Figure 11. Wear phenomenon on the inlet leading edge of the first-stage axial flow blade in the compressor.
Aerospace 12 00146 g011
Figure 12. Wear phenomenon at the trailing edge of the third-stage axial flow stator blades in the compressor.
Aerospace 12 00146 g012
Figure 13. Wear phenomenon on the inlet leading edge of the centrifugal impeller.
Aerospace 12 00146 g013
Figure 14. Sand adhesion phenomenon on turbine guide vanes.
Aerospace 12 00146 g014
Figure 15. Sand adhesion and accumulation phenomenon on turbine blades.
Aerospace 12 00146 g015
Table 1. Requirements for sand and dust contamination engine test.
Dust Concentration/(mg/m3)Test Time/(h)Power Loss/(%)Increased Fuel Consumption Rate/(%)
53541010
Table 2. Requirements for sand and dust contamination in terms of particle size.
Fine Sand Particle Size/(μm)Mass Percent/%
40~809 ± 3
20~4018 ± 3
10~2016 ± 3
5~1018 ± 3
0~539 ± 2
Note: the fine sand is composed of crushed quartz (SiO2 > 90%).
Table 3. Requirements for engine test conditions and test duration.
Engine StatusTest Time/(h)Duration/(min)Starting Times
Maximum state910No less than 27
Intermediate state2730
Maximum continuous state1820
Grand total54/No less than 27
Table 4. Variation in gas turbine exhaust temperature at different equivalent power levels.
Order NumberEquivalent Power/%T45 Increment/°C
164.727.9
286.326.5
393.724.5
410022.2
5102.921.0
Table 5. Percentage increase in engine SFC at different equivalent power levels.
Order NumberEquivalent Power/%Percentage Increase in SFC/%
164.72.55
286.32.42
393.72.32
41002.23
5102.92.18
Table 6. Variations in engine power and SFC under different conditions.
Engine StatusPower Loss/%SFC Increase/%
Maximum state11.336.05
Intermediate state9.675.02
Maximum continuous state8.604.44
Disclaimer/Publisher’s Note: The statements, opinions and data contained in all publications are solely those of the individual author(s) and contributor(s) and not of MDPI and/or the editor(s). MDPI and/or the editor(s) disclaim responsibility for any injury to people or property resulting from any ideas, methods, instructions or products referred to in the content.

