Abstract
This paper investigates and evaluates the accuracy of various empirical and semi-empirical methods for predicting aircraft wing-structure mass. Eight methods were selected and analysed using data from large passenger-transport aircraft. The required technical data variables and specifications associated with these methods of wing-mass estimation were identified. When data were unavailable, sound engineering assumptions and judgments were applied as a last resort. The root mean square percentage error (RMSPE) was employed as the comparative indicator of accuracy to compute the average discrepancy between the predicted and actual wing-mass values. The resulting RMSPE values were 10% for the Kundu method, 13% for the Torenbeek II method, 15% for the Basgall method, and 17% for the Howe and LTH methods. According to the findings, the Kundu and Torenbeek II methods achieved the highest accuracy, with nonsignificant differences in their RMSPE values. Predicted wing mass was within [−12.5%, +11.7%] of the actual wing mass in approximately 62% of the study cases, which is adequate for most conceptual and preliminary aircraft-design purposes. Predictions were within [−22.3%, +20.6%] for about 25% of cases and within [−39.0%, +29.7%] for about 13% of cases. Furthermore, more complex methods did not enhance accuracy, as essential variables for these methods are often unavailable during the early design stage, rendering their inclusion less practical. Based on the collected and analysed data, a new updated formula for estimating aircraft wing mass is introduced. In comparison to the methods previously discussed, the new formula yields a superior overall RMSPE of 11%, significantly improving the accuracy of wing-mass estimation. Specifically, the results show an RMSPE of 6.5% for aircraft with a maximum takeoff mass exceeding 300,000 kg and 13% for those with a maximum takeoff mass below 300,000 kg. The refined method proves effective for wings with an aspect ratio of up to 10, offering reasonable accuracy during the conceptual design phase. However, some discrepancies still arise when this method is applied to unconventional aircraft.
1. Introduction
In recent years, aviation has become one of the most highly technologically advanced and innovative industries in the world. From initial design concepts, engineers and researchers are working on making futuristic aircraft designs that could be a reality in the near future, including designs for aircraft that are more environmentally friendly and aerodynamically efficient. Each of these concepts explores a unique approach that has the potential to further improve fuel efficiency and decrease greenhouse gas emissions from aviation. Today’s global aircraft manufacturers are making continuous improvements that have the potential to significantly reduce aviation’s climate impact, with the key ambition of promoting a courageous vision for the future of zero-emission commercial aircraft. Aircraft manufacturers such as Boeing (B787) and Airbus (A380 and A350) are increasingly utilizing highly advanced lightweight materials such as carbon composites and cutting-edge manufacturing technologies to construct the airframe’s structural components, primarily the wing and fuselage. These advancements aim to create highly efficient aircraft wings, thereby enhancing flight performance and the passenger experience [1,2].
Wings are among the heaviest structural components of large transport aircraft. In recent years, significant attention has been devoted to developing methods for predicting wing mass, as demonstrated by numerous studies in the literature [3,4,5,6,7]. A comprehensive review of these wing-mass estimation methods and their applications in the aerospace industry is provided in reference [3]. This work offers valuable insights into the critical role of accurate wing-mass estimation during the early stages of aircraft design, as it has a major impact on overall performance, fuel efficiency, and cost-effectiveness. The authors examine various approaches, including empirical and semi-empirical methods, analytical techniques, and advanced computational methods. Furthermore, they categorize methods of wing-mass estimation into three main groups: empirical, analytical, and finite element analysis-based, as outlined by Dababneh [3]. While most studies agree with this classification, as summarized in Table 1, Elham [8] introduces an additional subcategory, addressing the challenges and technological complexities involved. The study also suggests several promising directions for future research in this area.

Table 1.
Summary of classifications of aircraft methods of wing-mass estimation.
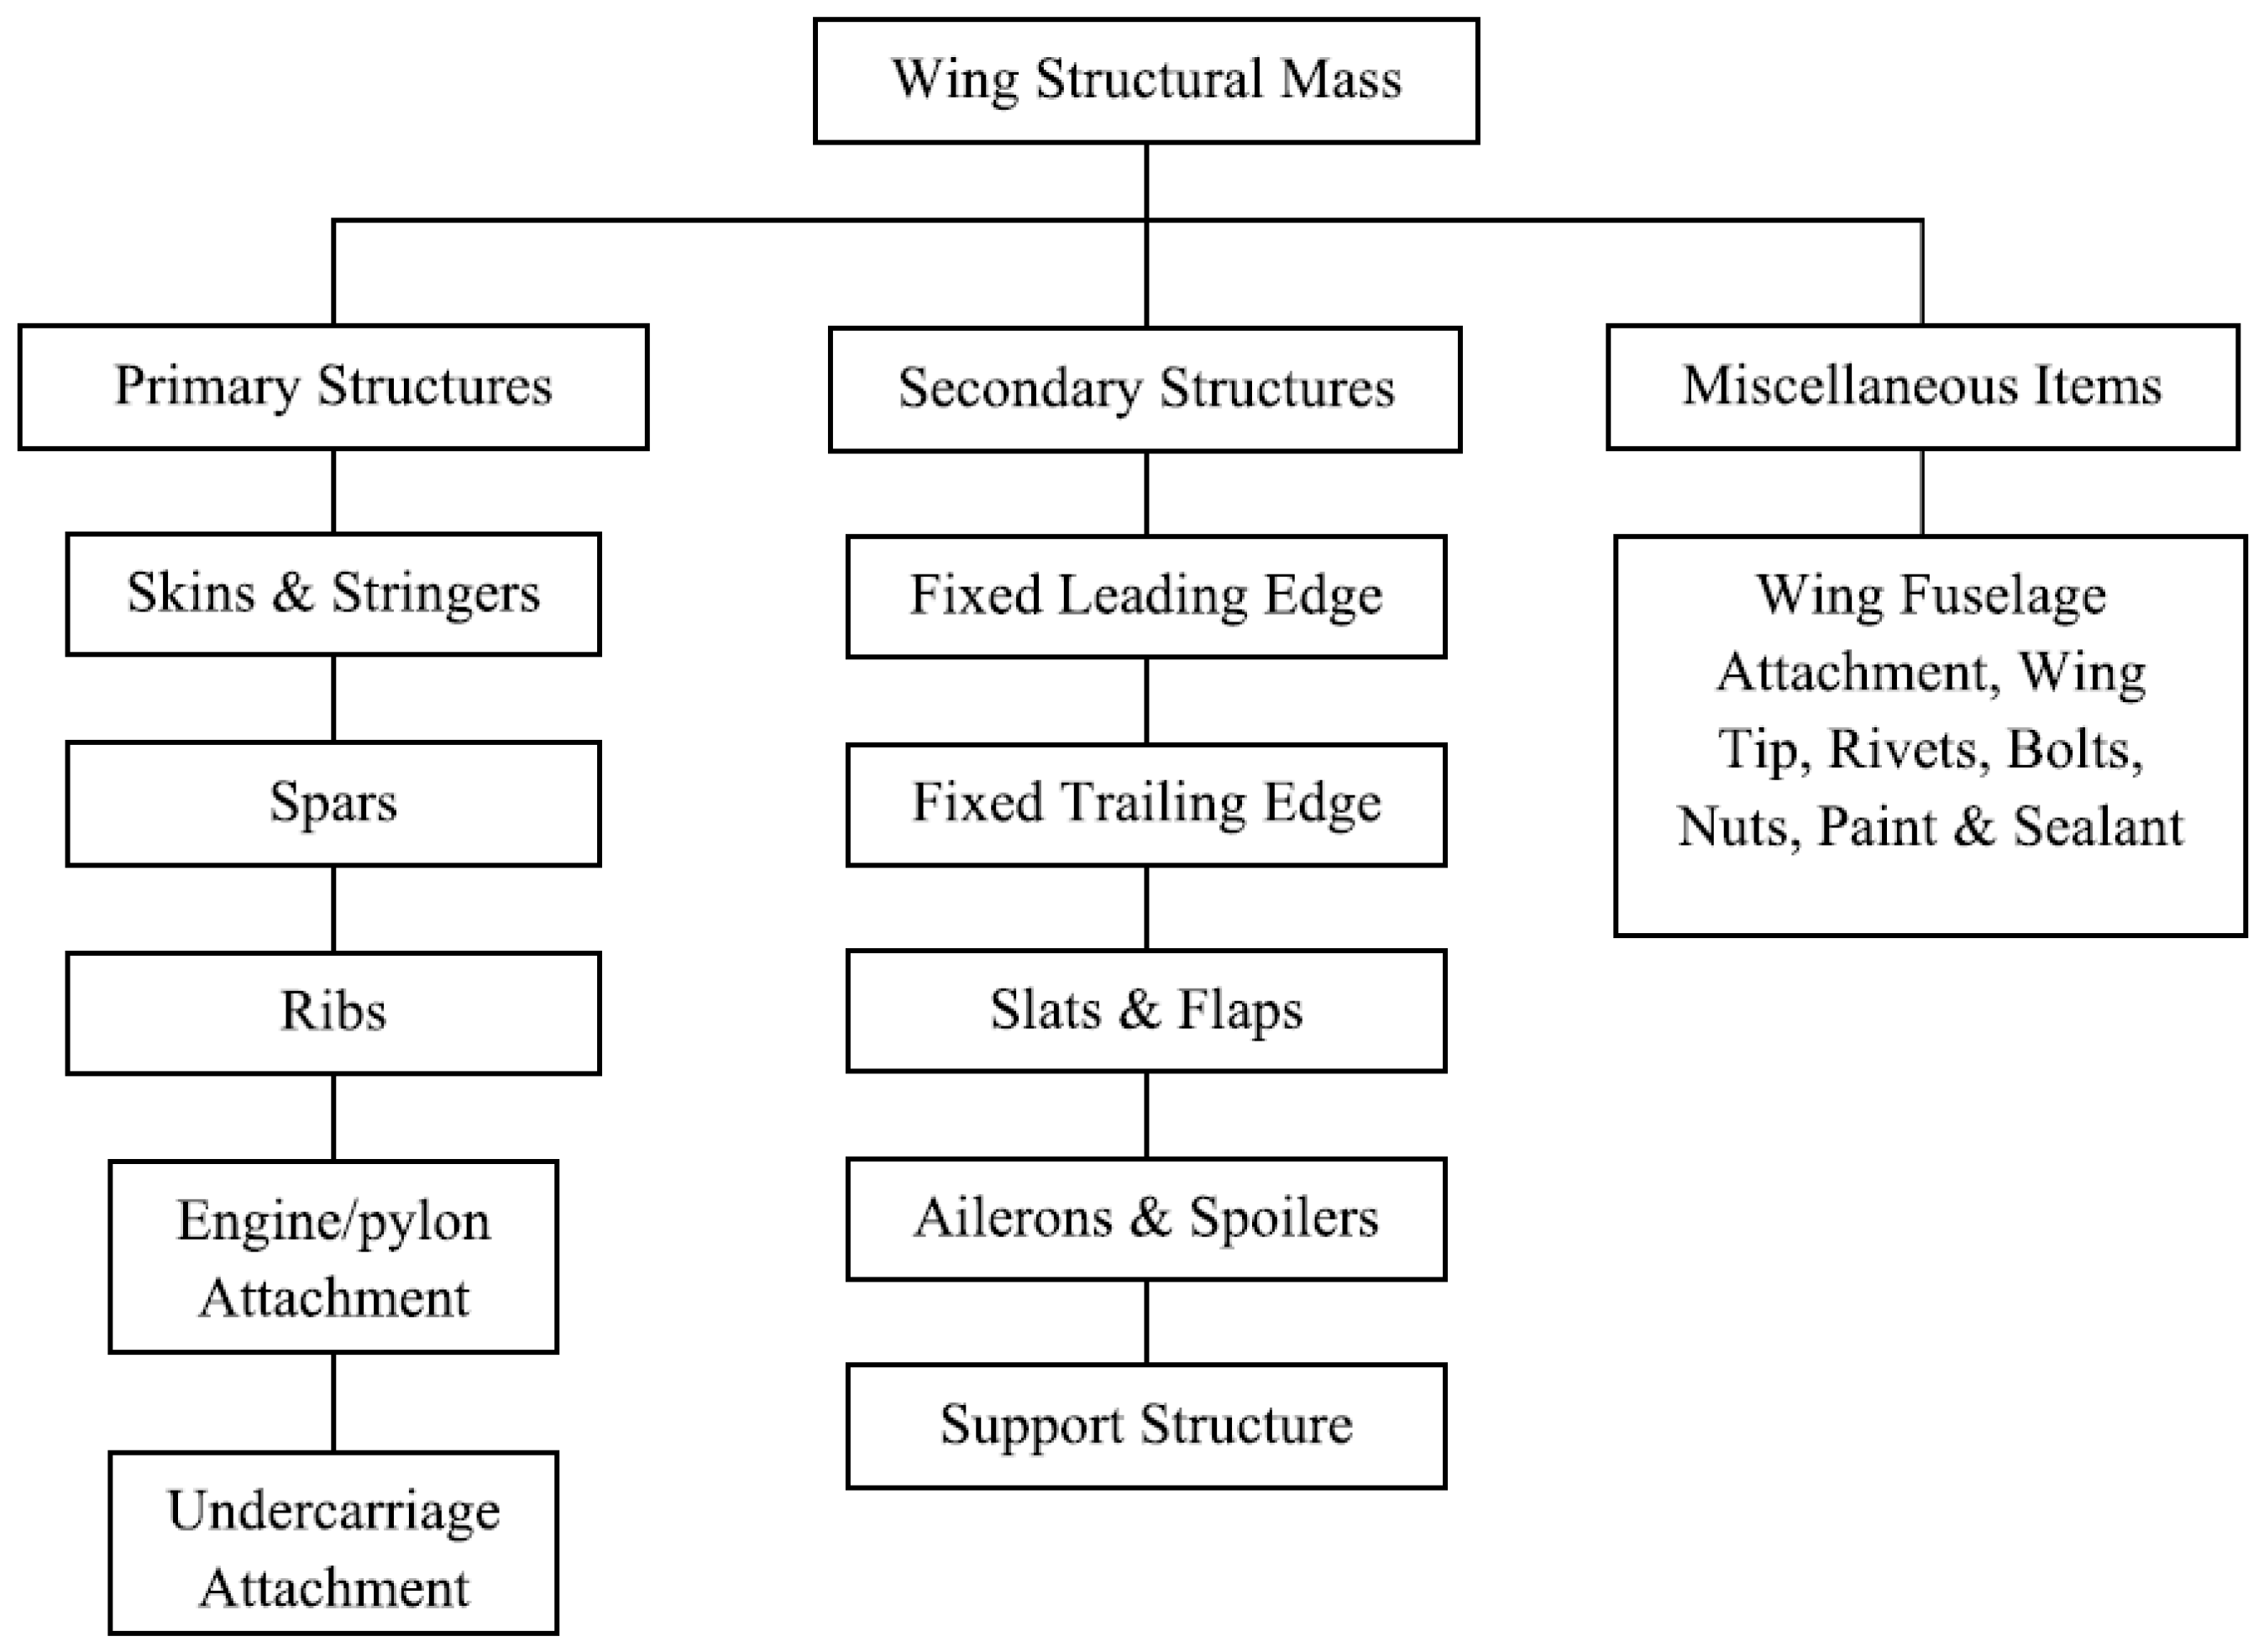
During the early stages of aircraft design, particularly in the conceptual design phase, wing-mass estimation primarily relies on statistical data derived from previously studied or constructed aircraft of similar type and manufacturer. This approach typically involves empirical mass-fraction estimates, often expressed as a percentage of the maximum takeoff mass (MTOM), which may be derived from mass equations developed from regression analyses of relevant historical data. The empirical methods of wing-mass estimation introduced by Raymer [12], Roskam [13], and Torenbeek [14] have been widely adopted by aircraft manufacturers and designers, despite certain limitations in accuracy. Over the past few decades, a variety of empirical and semi-empirical methods for wing-mass estimation have been published. For further details on early approaches, the reader is referred to [15,16,17,18,19,20,21,22,23]. These methods rely on statistical weight data from similar aircraft, incorporate aircraft geometry, and include fundamental performance equations for key design parameters. Additionally, they may integrate experimental data, making them both practical and accessible, and they are particularly useful for approximating the mass distribution of major components, especially the wing, during the conceptual design phase. Figure 1 illustrates the mass breakdown of a typical transport-aircraft wing.
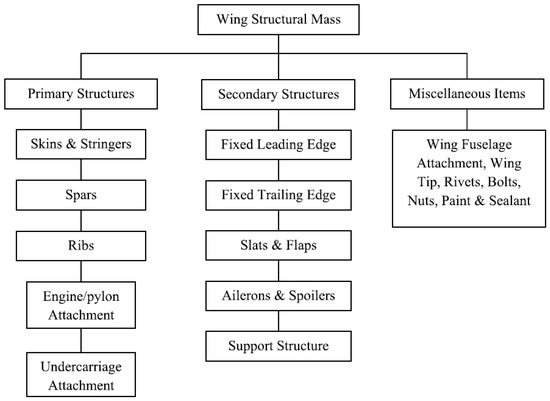
Figure 1.
Wing-mass breakdown of conventional transport aircraft [3].
As new materials, design concepts, and technologies emerge for current and future aircraft, weight estimation remains a critical step in the conceptual-design process. Both empirical and semi-empirical methods will continue to evolve, as much of the current focus is on the conceptual-design stage. Due to their ability to quickly estimate aircraft weight, which is essential for weight and balance calculations that must be completed before detailed design and structural analysis, these methods will remain favored even for advanced aircraft concepts [24]. Therefore, refining and modernizing weight-estimation techniques is crucial to ensuring their continued applicability for both current and future aircraft designs. Basgall et al. [25] compared several semi-empirical weight-estimation methods used in aircraft conceptual and preliminary design that had been developed by organizations such as Cessna, the USAF, General Dynamics, Torenbeek, and Vought (Raymer Method). These methods, based on historical data and aircraft geometry, were evaluated across various aircraft categories, including general aviation, commercial transport, military transport, and fighter aircraft. The study identified limitations, including some associated with the broad applicability of these methods to different aircraft types, outdated assumptions regarding materials and design, and inconsistencies in component inclusion. Notably, the methods often provided inaccurate estimates for components like wings and fuselages, especially in newer aircraft. To improve accuracy, the authors proposed refined methods that focus on more distinct categories of aircraft and updated trend lines, particularly for key components such as wings, which significantly impact overall weight. The authors also suggest expanding the weight trendlines to include a broader range of aircraft, beyond the limited selection of approximately six fixed-wing aircraft used in their study to compare wing weights in commercial transport aircraft.
Horvath et al. [26] evaluated several widely used regression-based weight-estimation methods, including those by Raymer [12] and Roskam [13], and compared them with the NASA Flight Optimization System (FLOPS) program [27]. The study found that many of these methods have not been updated to reflect recent advancements in materials and design. This leads to discrepancies, as regression equations are often tailored to specific datasets with limited consideration for underlying physics. A key issue identified was the lack of thorough documentation, with none of the methods specifying the datasets used in their development. This leaves designers to assess the applicability of these methods to new designs on their own. While Roskam provides input ranges for certain methods, many others lack detailed descriptions of the weight categories. Despite its complexity, the FLOPS method was found to effectively capture trends in component weight and provide reasonably accurate predictions for existing aircraft.
In the context of future aircraft concepts [4,5,28,29] such as High Aspect Ratio Wings (HARW), Box-Wing, and Blended Body Wings (BWB), for which designers may be evaluating thousands of unique configurations, numerous studies [26] emphasize that relying on high-fidelity methods like finite element analysis for precise estimation of wing structure weight becomes impractical. As a result, refined empirical or semi-empirical weight-estimation methods are preferred at the conceptual stage, as they facilitate rapid exploration of the design space. This approach allows designers to quickly identify and eliminate infeasible or weight-prohibitive designs early in the process, thereby optimizing the overall design workflow. For instance, Ma et al. [30] developed a semi-empirical weight-estimation method for Twin-Fuselage (TF) aircraft, which was applied to support the conceptual design of both medium-range and long-range TF aircraft. Another example can be found in [31], where the authors developed a semi-analytical method for estimating wing weight in High Aspect Ratio Strut-Braced Wing (SBW) aircraft. From this, a semi-empirical alternative specifically designed for use in the early stages of aircraft design was created using statistical regression techniques. Additionally, Jemitola et al. [29] developed a method to define an empirical formula for estimating the mass of the fore and aft wings of a box wing aircraft. Finite element analysis (FEA) was conducted on the structural torsion box models of the box wing aircraft, excluding the masses of the trailing and leading edges, control surfaces, and auxiliary components. The resulting masses were then obtained from this analysis. A relationship was then established between the masses of the equivalent cantilever torsion box model and the box wing. Regression analysis was used to calculate the coefficients for the fore and aft wings. By correlating the torsion-box masses of the box wing aircraft models with those of conventional aircraft wings and extending this relationship to their empirical masses, the wing-mass estimation coefficients, C1 from Howe [32], were derived for both the fore and aft wings of a medium-range box wing aircraft.
Adjusting empirical methods of wing-mass estimation for current cantilever fixed wings and non-traditional wing configurations requires recalibration using well-documented data from similar innovative designs, new design parameters, and advanced analytical tools to ensure accurate predictions for unconventional designs. For entirely new designs, new empirical constants may need to be developed through experimental or analytical studies. The incorporation of non-traditional materials, such as composites or advanced alloys, necessitates updates to account for their unique properties compared to conventional materials. Researchers [24,25,26,33,34,35] are continuously refining the methods and exploring innovative approaches to improve the precision and reliability of wing-mass predictions, addressing challenges related to new materials, complex geometries, and structural configurations. This ongoing work is crucial to advancing next-generation aircraft with lighter, stronger, and more efficient wings.
The aim of this work is to evaluate the effectiveness of various empirical and semi-empirical methods for estimating the wing-structure mass of large transport aircraft during the early stages of design and development. The study has two primary objectives. The first is to identify and select the most widely used empirical and semi-empirical wing mass prediction methods from the existing literature. Special attention is given to recognizing and documenting the required technical data variables and specifications for the selected aircraft used in these methods. The second objective is to assess the reliability of these methods in terms of their accuracy and computational efficiency for predicting wing-structure mass. Based on the collected data and analysis, a new refined empirical formula for estimating aircraft wing mass is developed, offering improved accuracy in predictions during the conceptual design phase. This paper is organized as follows. Section 2 outlines the selected methods of wing-mass estimation. In Section 3, these methods are tested across a wide range of aircraft, including the most recent large passenger-transport models for which key data were available or could be reasonably inferred. The results and the associated accuracy of each method and proposed procedure are presented and discussed in Section 4, with the goal of determining their comparative reliability. Finally, Section 5 presents the conclusions of the study.
2. Empirical and Semi-Empirical Methods of Aircraft Wing Mass Prediction
The methods analyzed in this study offer distinct approaches to estimating wing mass, providing insights for early-stage design. Selection is based on their relevance to large commercial aircraft, compatibility with the conceptual design phase, and use of readily available input data. Preference is given to methods validated by previous research, with documented accuracy for various aircraft types. Methods adaptable to new or unconventional designs, such as non-traditional wing shapes or materials, are important for next-generation aircraft studies. Widely cited methods, like those from Torenbeek and Shevell, offer a reliable benchmark due to their established credibility in the aerospace community.
2.1. Torenbeek Method I (1976)
The Torenbeek Method I utilizes empirical data and regression analysis, drawing on historical data from existing aircraft to formulate a predictive model for wing mass based on defined input parameters. This approach is particularly beneficial during the initial stages of aircraft design, when detailed structural analysis is not feasible. The accuracy of this method depends on the precision of the input parameters, which can be difficult to ascertain in the early phases of design. Additionally, the method’s dependence on historical data may restrict its extension to novel or unconventional aircraft designs. In this method [14,36], the wing-structure mass, of fixed-wing civil aircraft is estimated using a reduced statistical approximation method developed by Torenbeek in 1976 and represented by the following equation:
In Equation (1), for large transport aircraft with a maximum takeoff mass , the proportionality factor value, , and gross weight, , are as follows:
The parameter is the maximum thickness of the wing root chord; the wing planform area is ; the coefficients and are the respective structural and reference span of the wing, and their values are .
The mass calculated using Equation (1) includes the structural mass of high-lift devices and ailerons. If spoilers and speed brakes are used, the mass should be increased by 2%. The predicted mass for wing-mounted engines should be reduced by 5% or 10% depending on whether there are two or four wing-mounted engines.
2.2. Shevell Method (1983)
Shevell’s method [17] continues to be a crucial approach for aerospace engineers, especially in the early stages of aircraft design. Similar to the Torenbeek Method, it is based on empirical data but includes specific refinements to improve the precision of wing-mass estimates. By accounting for the weight of the fully stressed wingbox and utilizing a wing weight index , this method enhances the accuracy of wing-mass predictions. It also incorporates statistical analysis alongside historical data to refine mass predictions. This method is particularly useful for guiding preliminary wing design when detailed structural analysis is not yet practical. In Equation (2), which is used to calculate the total wing weight, , the first term on the right-hand side is a constant representing the secondary wing-structure weight, whereas the primary wing-structure weight is given by the second term and changes in proportion to the amount of material necessary to sustain the imposed bending forces. Equation (3) is used to calculate the wing weight index in imperial units.
where is the sweep of wing elastic axis and can be estimated as the sweep of a line midway between the front and rear spars of the wing. However, since this value is usually unknown, the wing sweep-back angle at half chord, , can be used as a good approximation.
2.3. Torenbeek Method II (1994)
This method represents an advanced iteration of the original Torenbeek Method I. It provides a refined technique for wing-mass estimation. It builds upon the empirical foundation of its predecessor by incorporating additional refinements to address previous limitations and to accommodate a wider range of aircraft types and design configurations. The Torenbeek Method II updates the empirical constants from the earlier method, leveraging recent data and an enhanced understanding of wing design and material properties. It also incorporates contemporary ultimate load factors and safety margins into the estimation process, thereby addressing discrepancies identified in prior estimations. Developed by Torenbeek in 1994, this method is the second statistical approach for estimating aircraft wing weight. It employs a semi-analytical technique, as detailed in references [16,37], and is expressed by Equation (4), as follows:
The factor 0.06 is a non-dimensional proportionality constant that accounts for average bending relief values due to wing and engine masses, structural efficiency, spar positions, and other factors. The term accounts for some bending moment relief due to wing fuel. The recommended value for the ultimate load factor, , which has a significant impact on wing weight, is 3.75. Although the sweep angle, , is theoretically related to the elastic axis, it is acceptable to approximate it using the mean quarter-chord line, , since its location is usually unknown. The term represents the ratio of the specific wing material weight, , to the mean stress level at the wing root, . For the primary structure of an aluminium-alloy wing, the term can be evaluated, according to [16], as follows:
The second term in Equation (4) represents mostly secondary structural components of the wing (flaps, ailerons, spoilers, slats, etc.), and the smeared skin thickness, , is given by Equation (6), as follows:
Although the method introduces increased complexity, its improvements in accuracy and versatility make it a significant asset for contemporary aircraft design. Nevertheless, the effectiveness of the method remains dependent on the availability and quality of empirical data, which may not fully account for all novel or highly unconventional designs.
2.4. Howe Method (2000)
The Howe Method [21,32] was developed to provide more accurate and reliable estimates of wing mass by integrating comprehensive analytical techniques with empirical data. This approach emphasizes the refinement of mass predictions through a combination of detailed structural considerations and advanced statistical analysis. This includes considerations of wing geometry, material properties, and load distribution, introducing a level of complexity beyond that seen in simpler empirical methods. In 2000, Howe derived a statistical mass-prediction method, expressed in Equation (7), where the wing mass of a specific aircraft is determined based on the number of passengers or payload mass. In this empirical approach, the wing mass is computed as a function of key geometrical and operational parameters, with the predicted mass being correlated with actual wing-mass data.
where the coefficients and in Equation (7) are defined as follows for long-range and short-/medium-range aircraft, with stands for passengers in .
- Long range, s > 5000 km
- Short/medium range: ≤ 46,000 kg
- Long-haul jet transports,
- Short-/medium-haul jet transports,
The effective wing sweep angle, , is estimated at the mean quarter chord line as . According to Howe [23], the value for the ultimate load factor, , can be estimated as 1.65 times the maximum limit load factor of a typical large transport aircraft.
2.5. Kundu Method (2010)
In his work in 2010, Kundu [11] proposed a rapid method to predict the mass of aircraft components at the conceptual design phase. The mass is expressed as a percentage of the MTOM, with all components adding up to 100% of the overall maximum takeoff mass. Even though this rapid method comes at the price of some approximation, iterations are usually required throughout the conceptual design stage when the configuration changes to predict wing mass well in advance of any detailed drawings of the parts being created. The mass fraction of MTOM for mid-sized and large aircraft is summarized in Table 2, along with a range of applicability. In the current study, the calculation was done using an average value.
Table 2.
Method of mass-fraction estimation for larger aircraft.
2.6. LTH Method (2011)
Dorbath [19], on behalf of the LTH (Luftfahrttechnisches Handbuch) organization, developed an empirical method for aircraft wing weight estimation based on statistical data, as given in Equation (8). The representative thickness-to-chord ratio term , is defined in Equation (9). The range of values for which the LTH method is valid is shown in Table 3.
Table 3.
Range of values for which the LTH method is valid.
2.7. Elham Simple Class I Method (2013)
The empirical method used is the wing-mass estimation equation derived by Elham in [8], which presents the wing mass as a function of the aircraft maximum takeoff mass, as shown in Equation (10). This equation is derived using regression data based on the analytically calculated optimum wing box mass, the actual total wing mass, the ratio of the optimum wing box mass to the total wing mass, and the aircraft’s MTOM, as detailed in [8].
2.8. Basgall Jet-Transport Method (2020)
The final empirical method used in this study is the refined wing-mass equation, which, according to Basgall et al. [25], is expected to yield more accurate mass estimations for the wing structure of jet-transport aircraft. This equation was developed by analysing the discrepancy between the calculated wing mass and the actual wing mass in relation to the takeoff mass of a set of aircraft with a maximum takeoff weights (MTOWs) of up to 430,000 lb.
3. Application of Methods for Wing-Mass Prediction
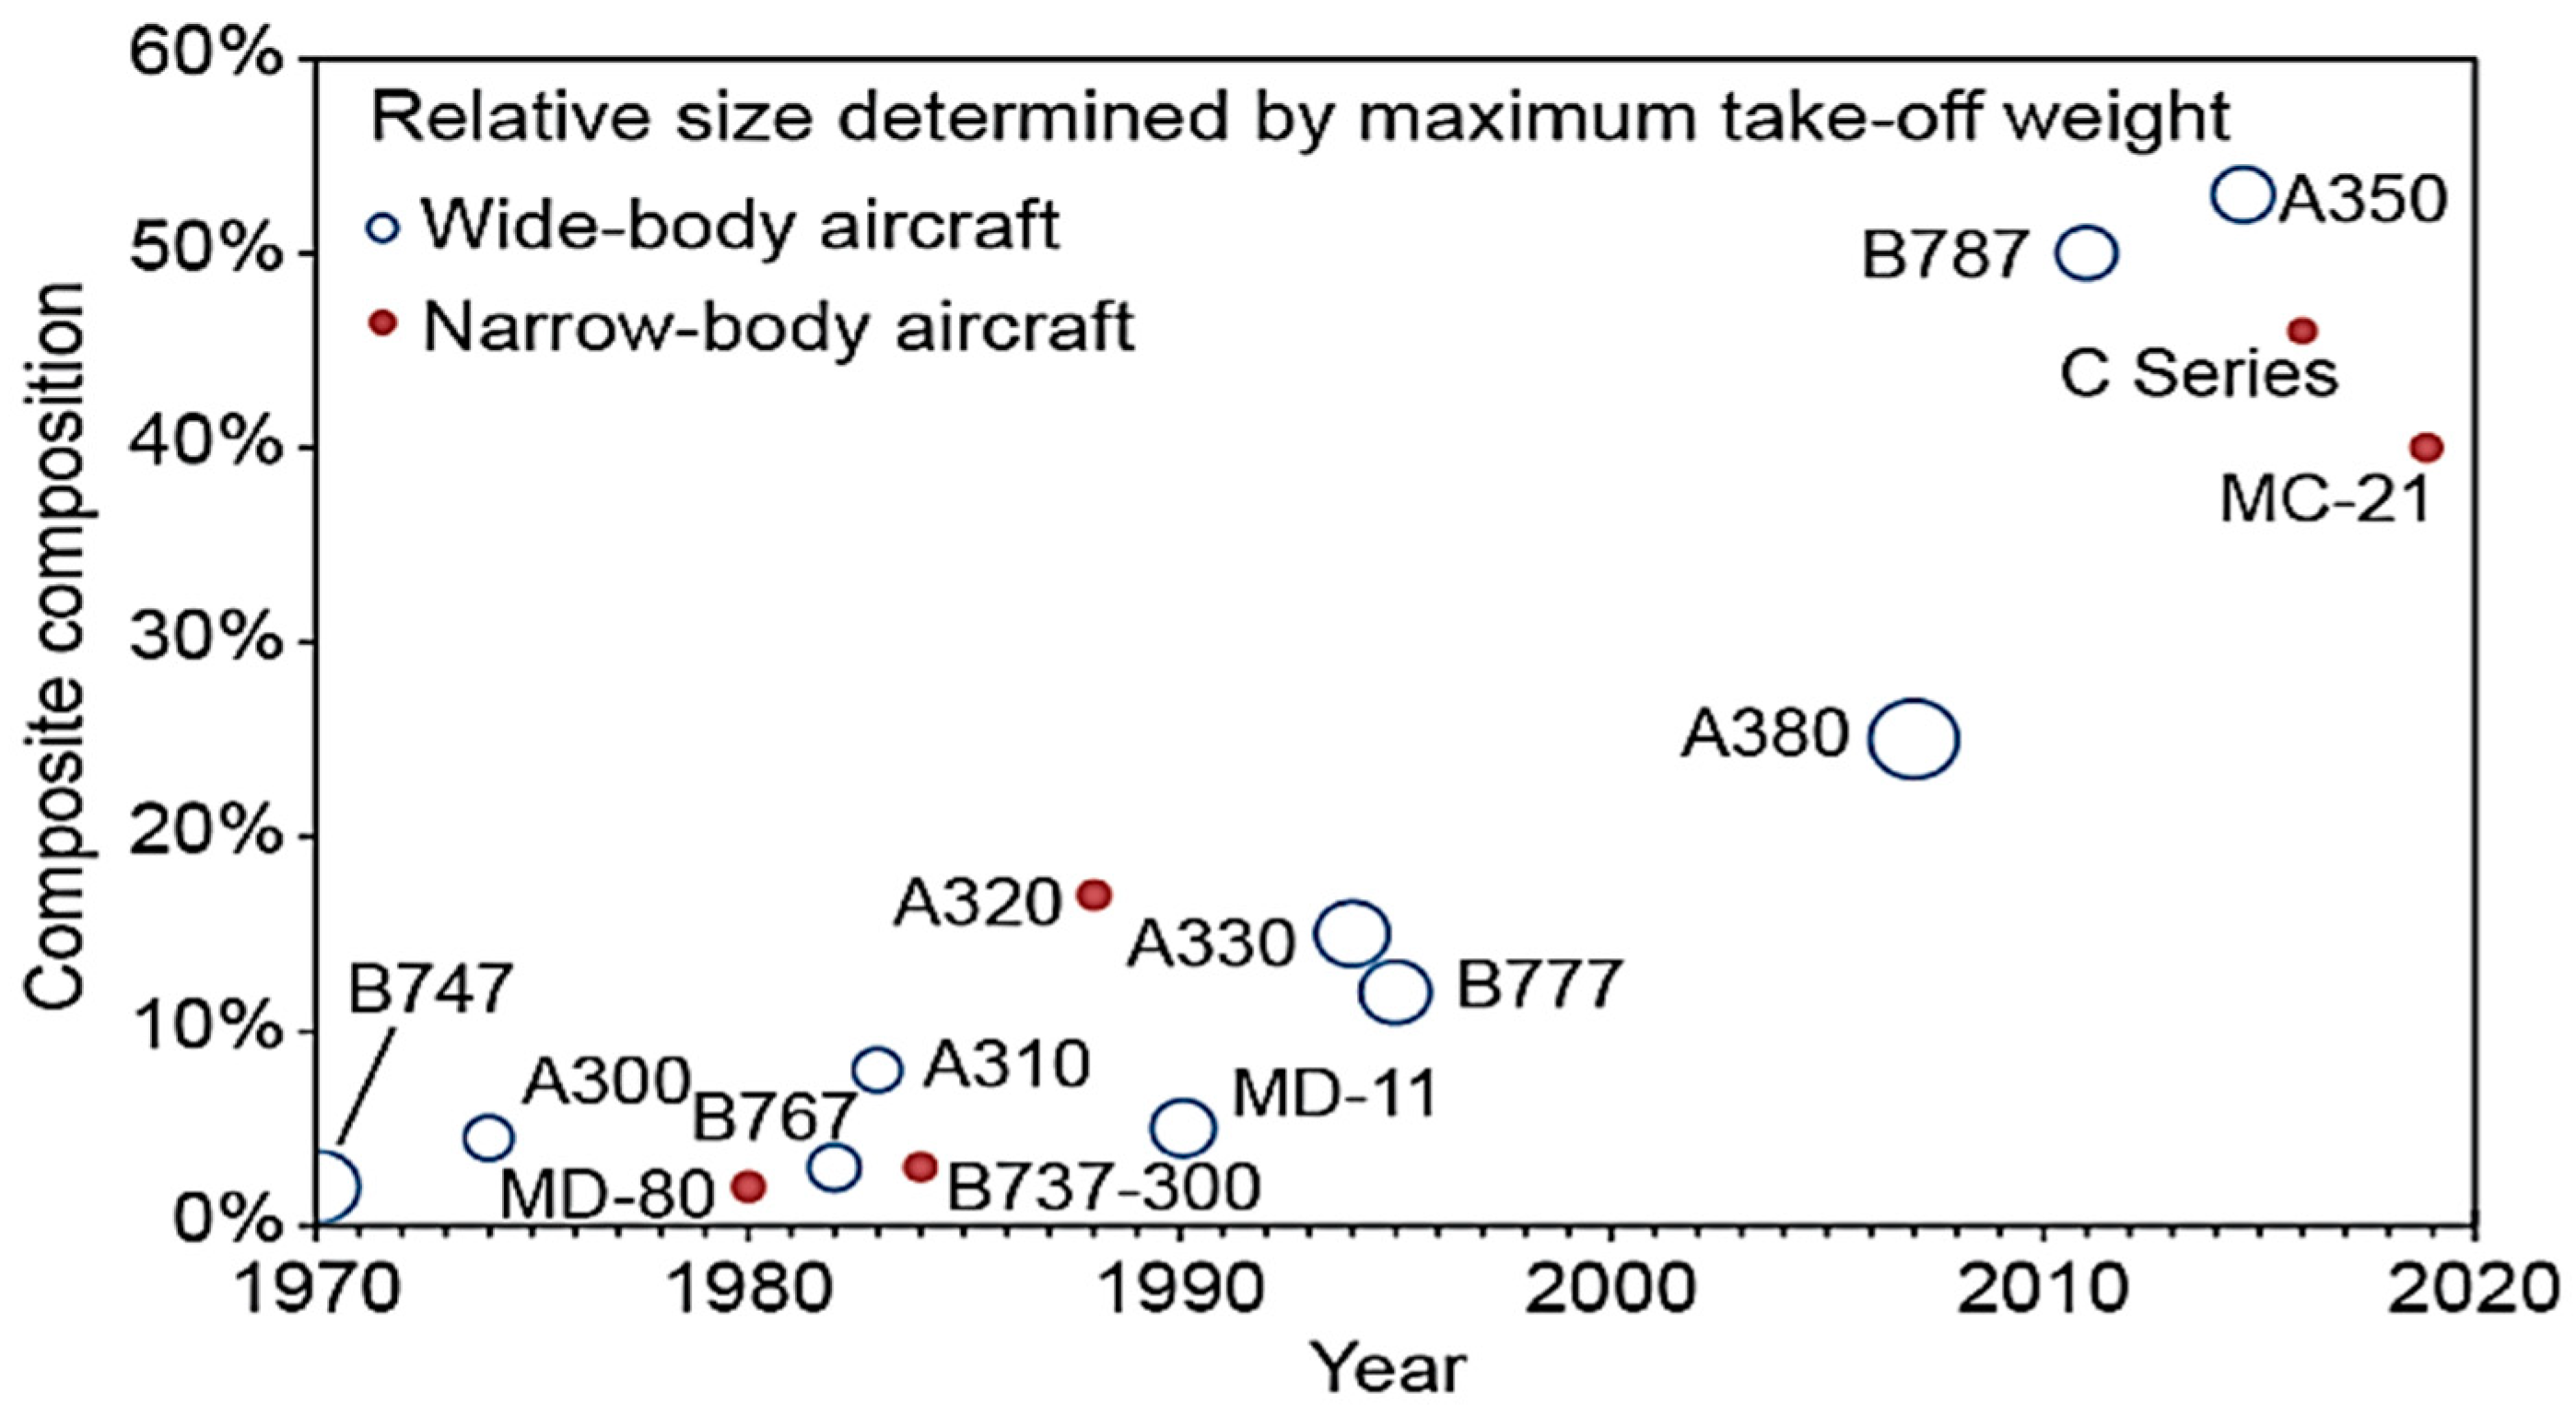
For many years, the primary materials used in aircraft airframe construction were conventional metallic alloys. Thus, almost all the wing mass data that are widely available are for aircraft made of light metallic alloys and empirical data-based prediction approaches are confined to components made of the same material. Since the 1970s, commercial aircraft structures have used composite materials more frequently, as shown in Figure 2. Currently, the most recent wide-body aircraft, such as A350 and B787, use fibre-reinforced composites for most of the airframe, and composites make up more than 50% of the structural weight of the aircraft. Similar improvements are already being made in narrow-body aircraft, which are now approaching composite compositions of over 40% [38,39].
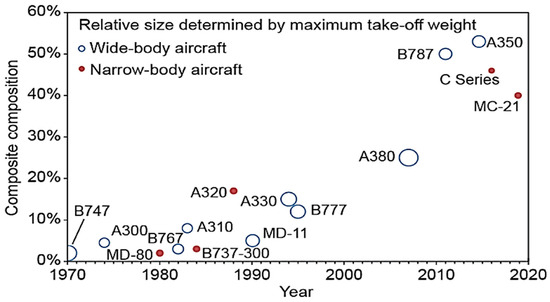
Figure 2.
Composite structural weight percentage for commercial aircraft [40].
To account for the recent introduction of composite materials in the construction of newly developed and manufactured aircraft, as shown in Table 4, several authors have introduced reduction factors. According to Howe [21], the number of primary structural joints has a significant impact on the structural mass of a composite component; it is unlikely to reach 60% of the mass of a conventional structure, and a 5% reduction in the MTOM is expected for composite moving surfaces. Nicolai [41] suggested reducing the wing mass by 20% to account for composite utilization. In his work, Dababneh [42] showed that the total structural mass saving for a composite wing over a metallic wing in a typical large transport aircraft is around 21.5%. To assess the impact of using composite materials on the aircraft early in the design process, Raymer [12] suggested modifying the operating empty-weight equation used to calculate the maximum takeoff weight. This involves applying 95% of the empty-weight fraction derived from a metal aircraft, resulting in a 9.3% reduction in takeoff weight for just a 5% decrease in empty weight.
Table 4.
Selected types of transport aircraft.
4. Comparative Analysis of Investigated Methods of Wing-Mass Estimation
The methods described in Section 2 have been used to study the transport aircraft, as detailed in Table 4, for which sufficient technical data are available as indicated in Appendix A or could reasonably be assumed using engineering judgment in the initial design stages. The results obtained are summarized in Figure 3, Figure 4, Figure 5, Figure 6, Figure 7, Figure 8, Figure 9 and Figure 10 and Table 5, respectively.
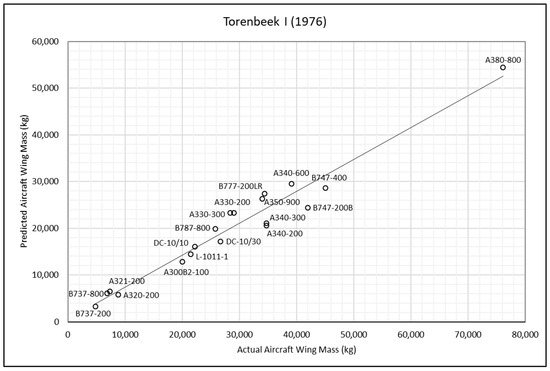
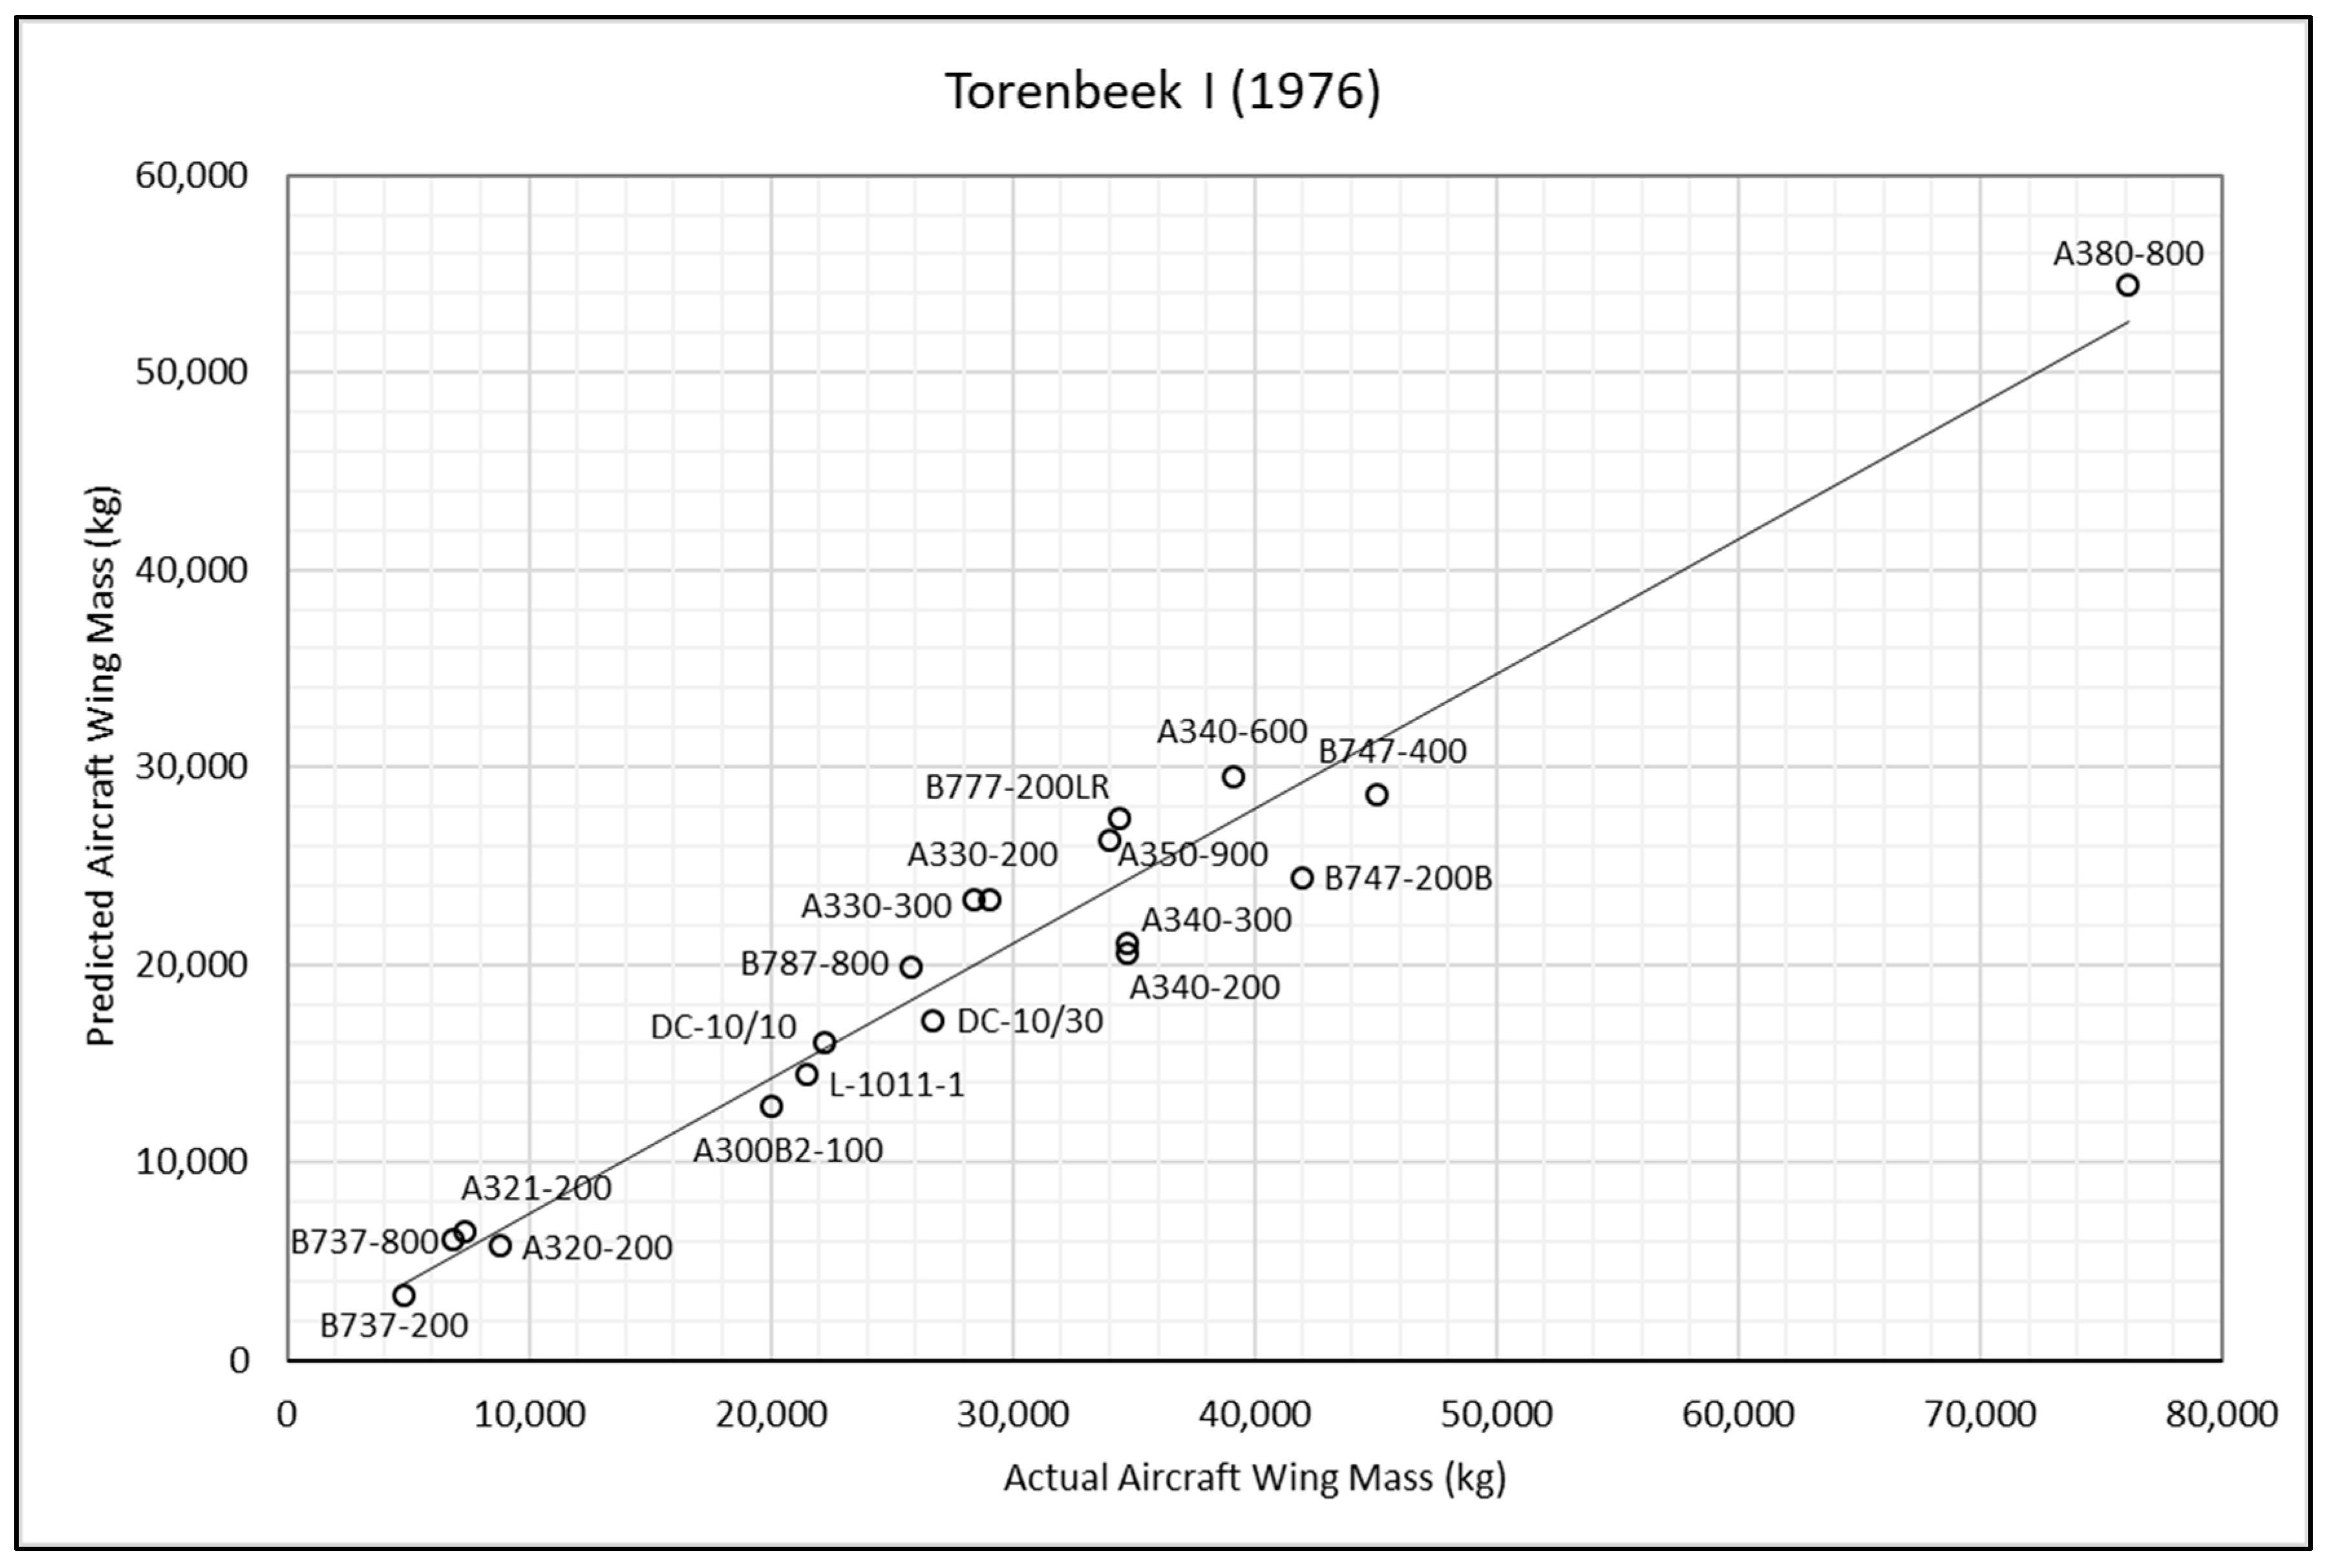
Figure 3.
Torenbeek I method—actual and predicted aircraft wing masses [14].
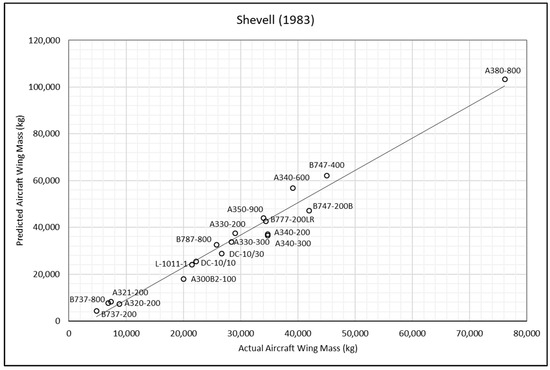
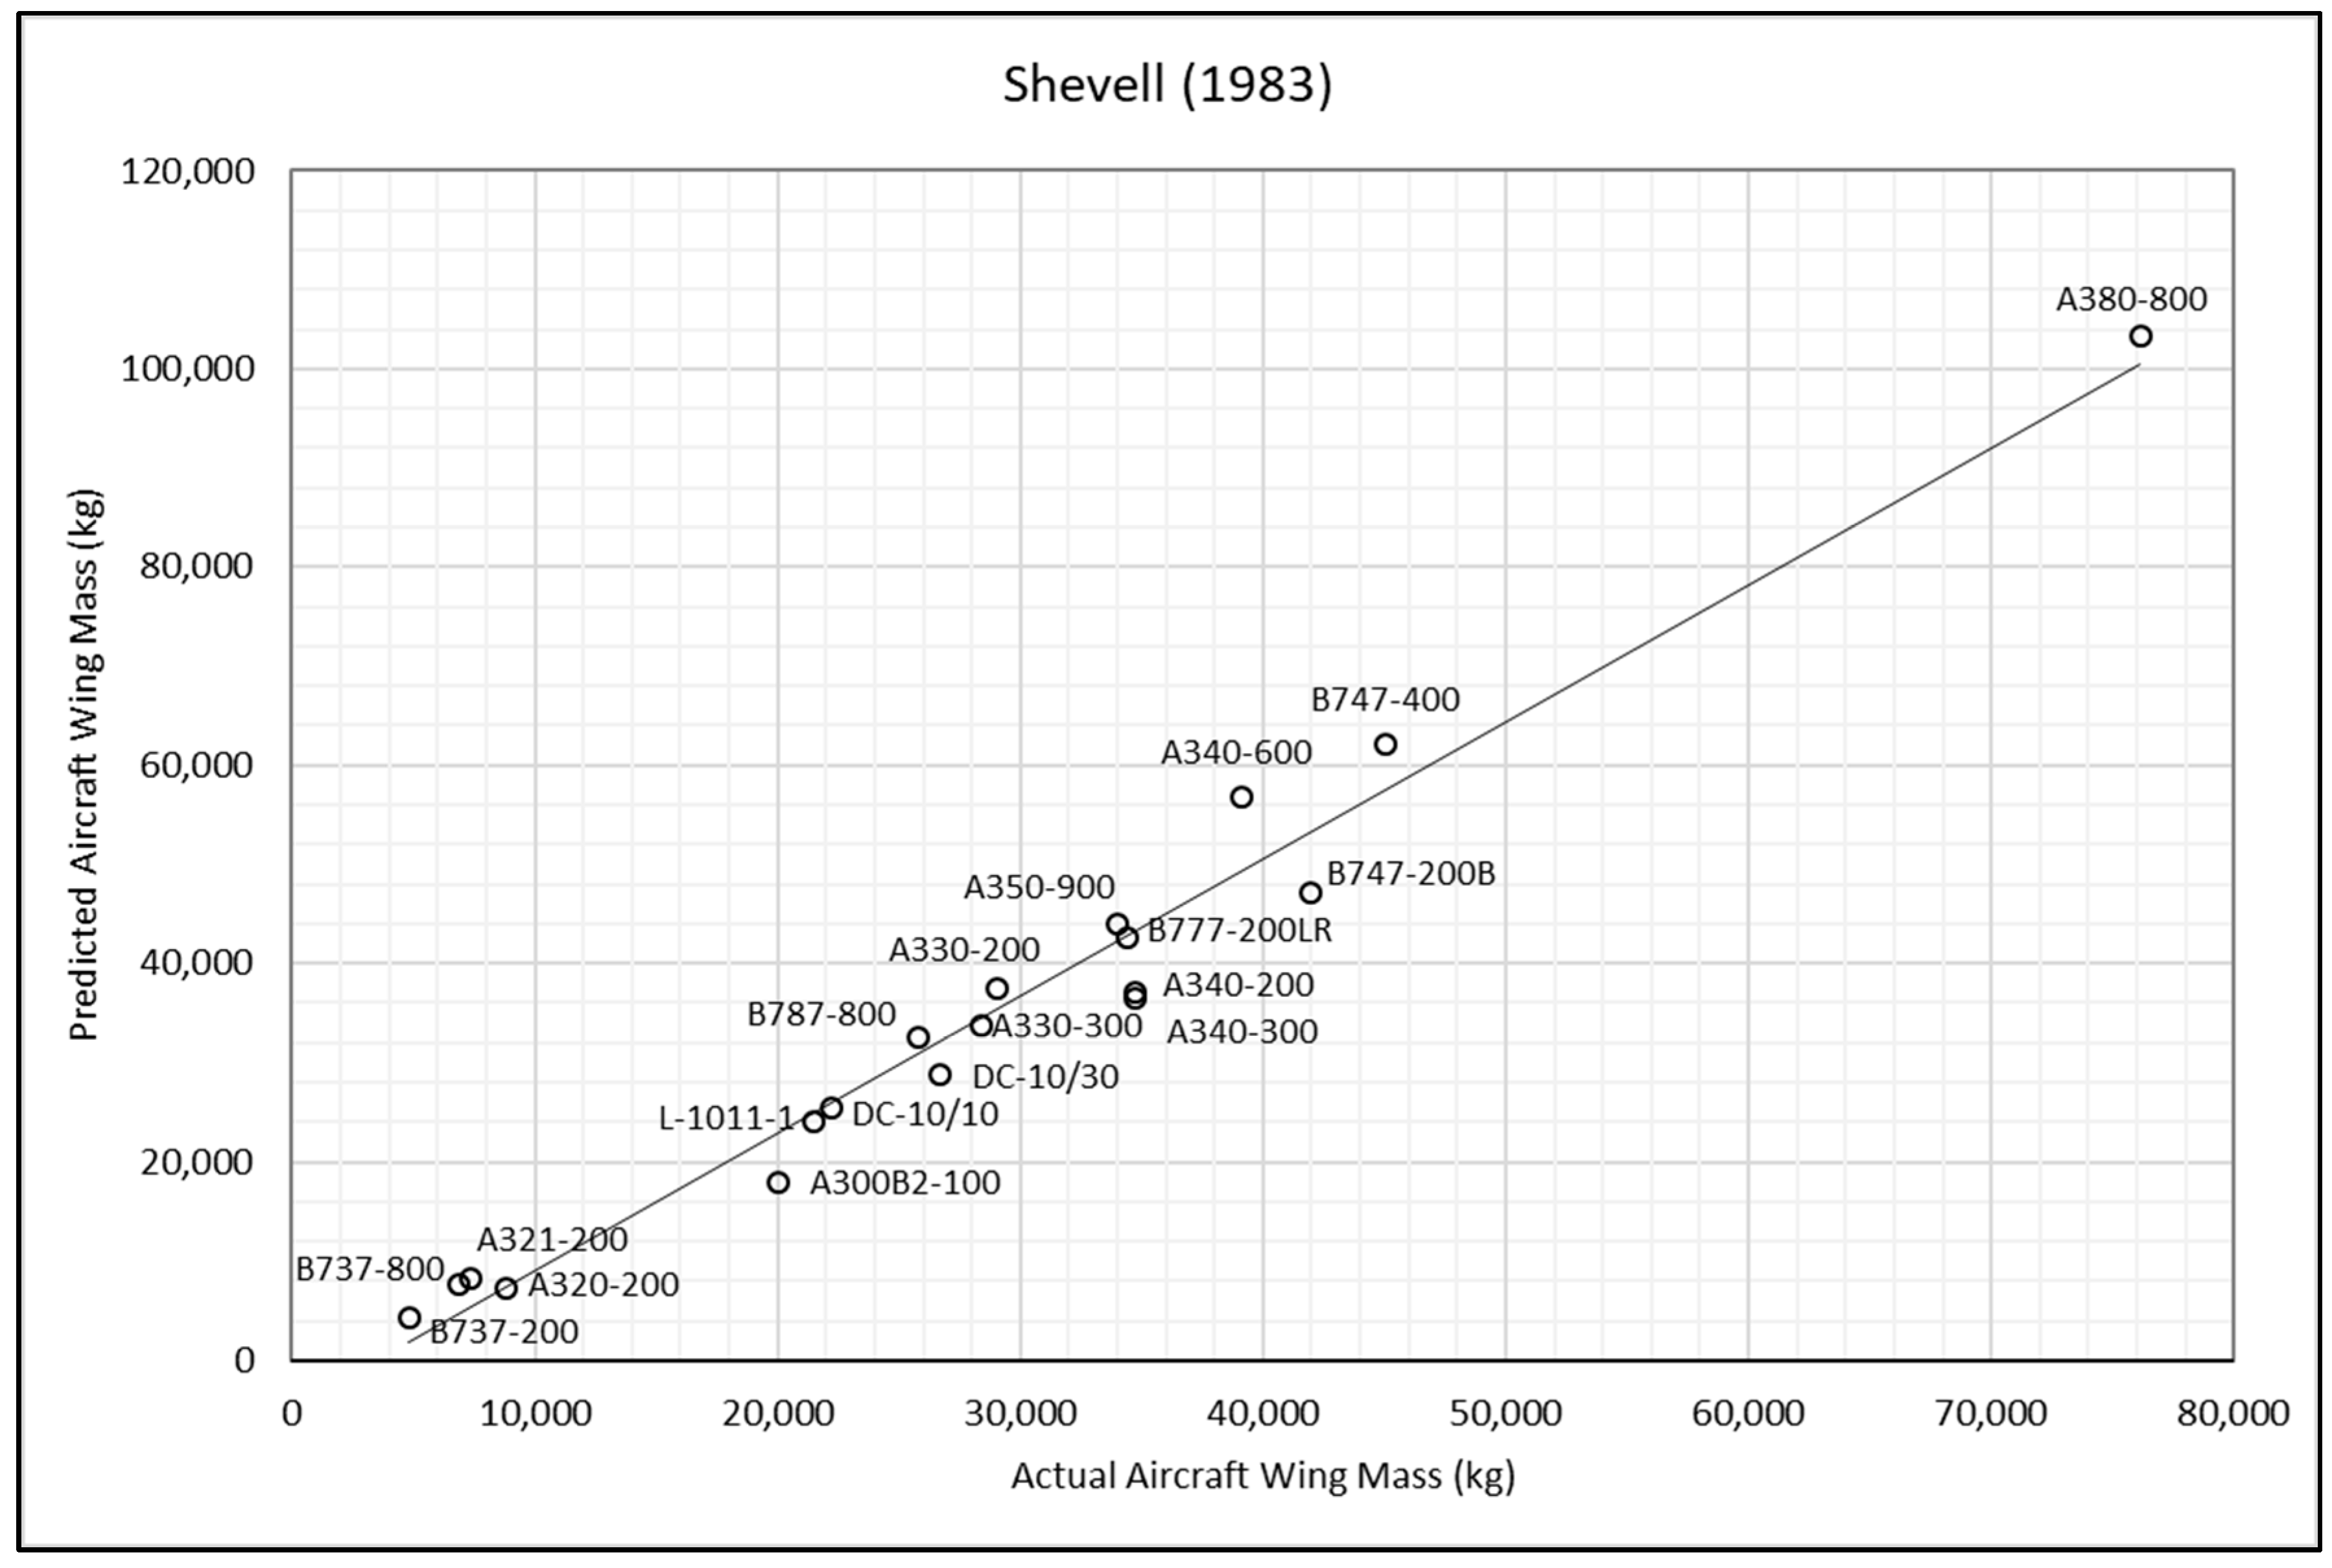
Figure 4.
Shevell method—actual and predicted aircraft wing masses [17].
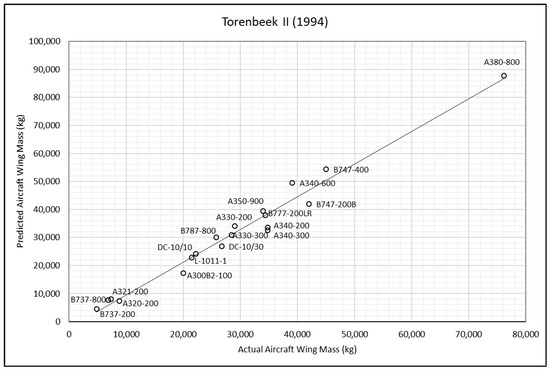
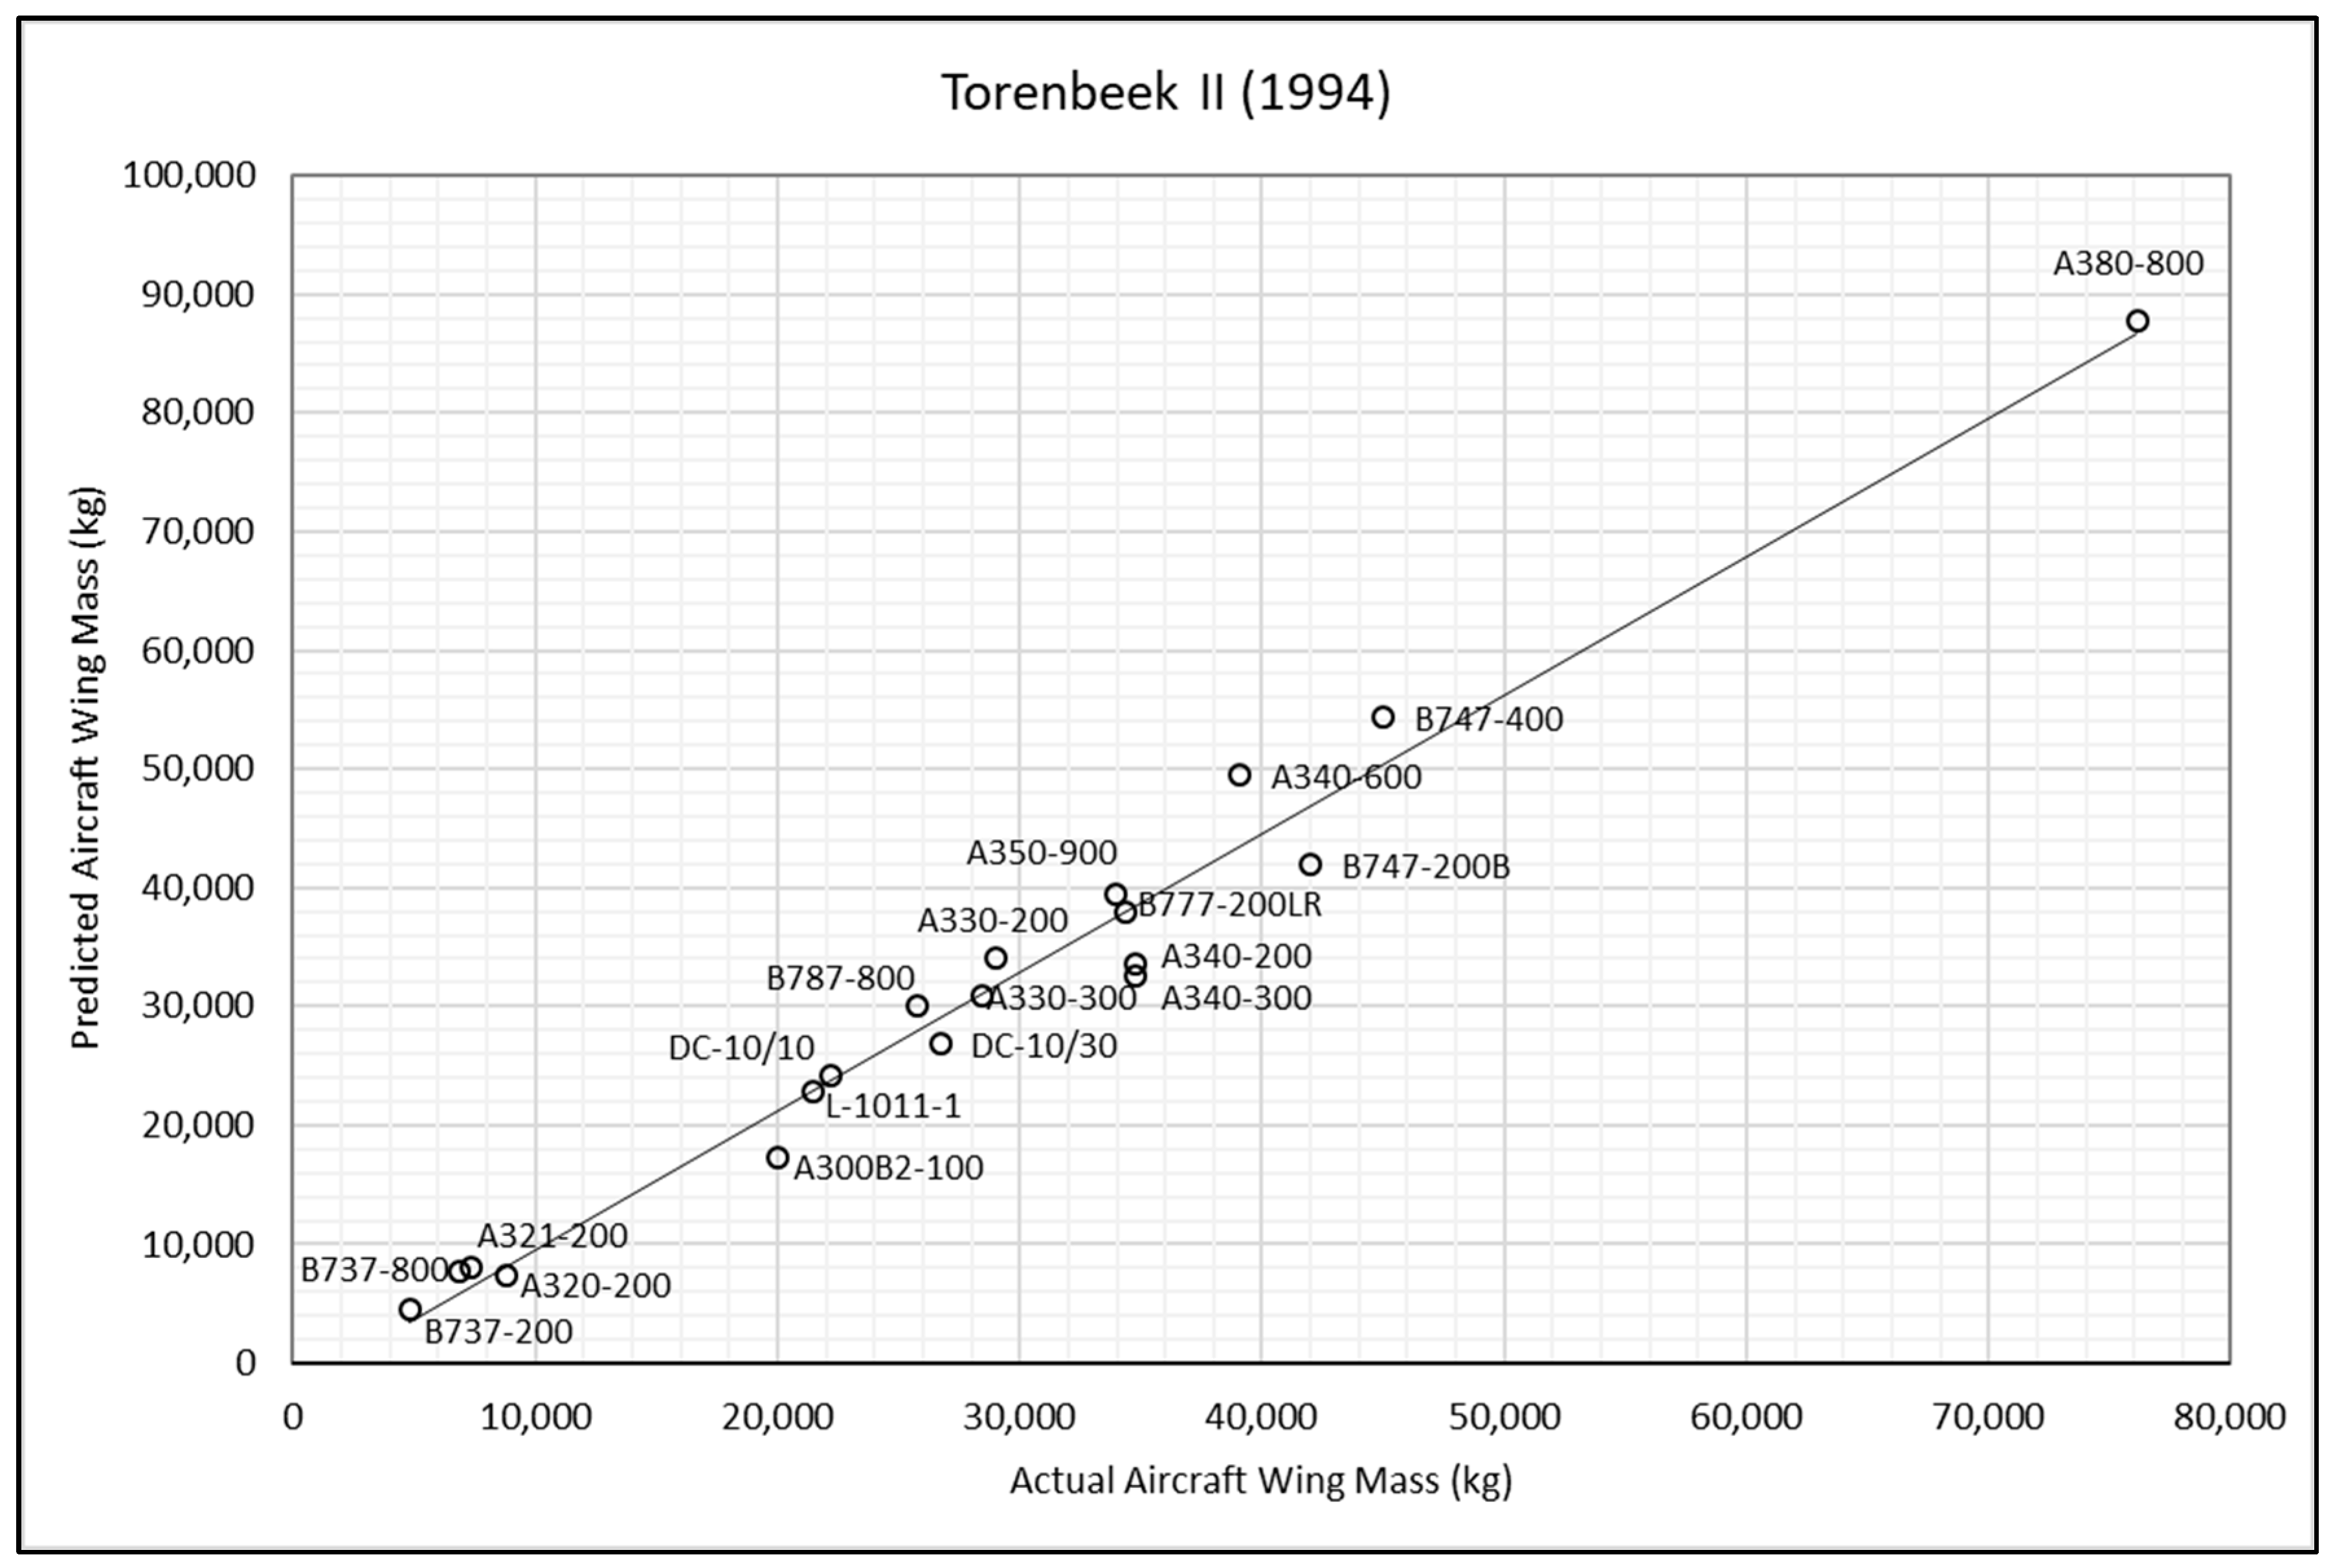
Figure 5.
Torenbeek II method—actual and predicted aircraft wing masses [16].
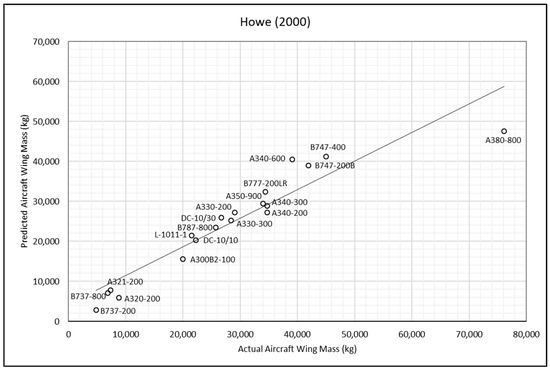
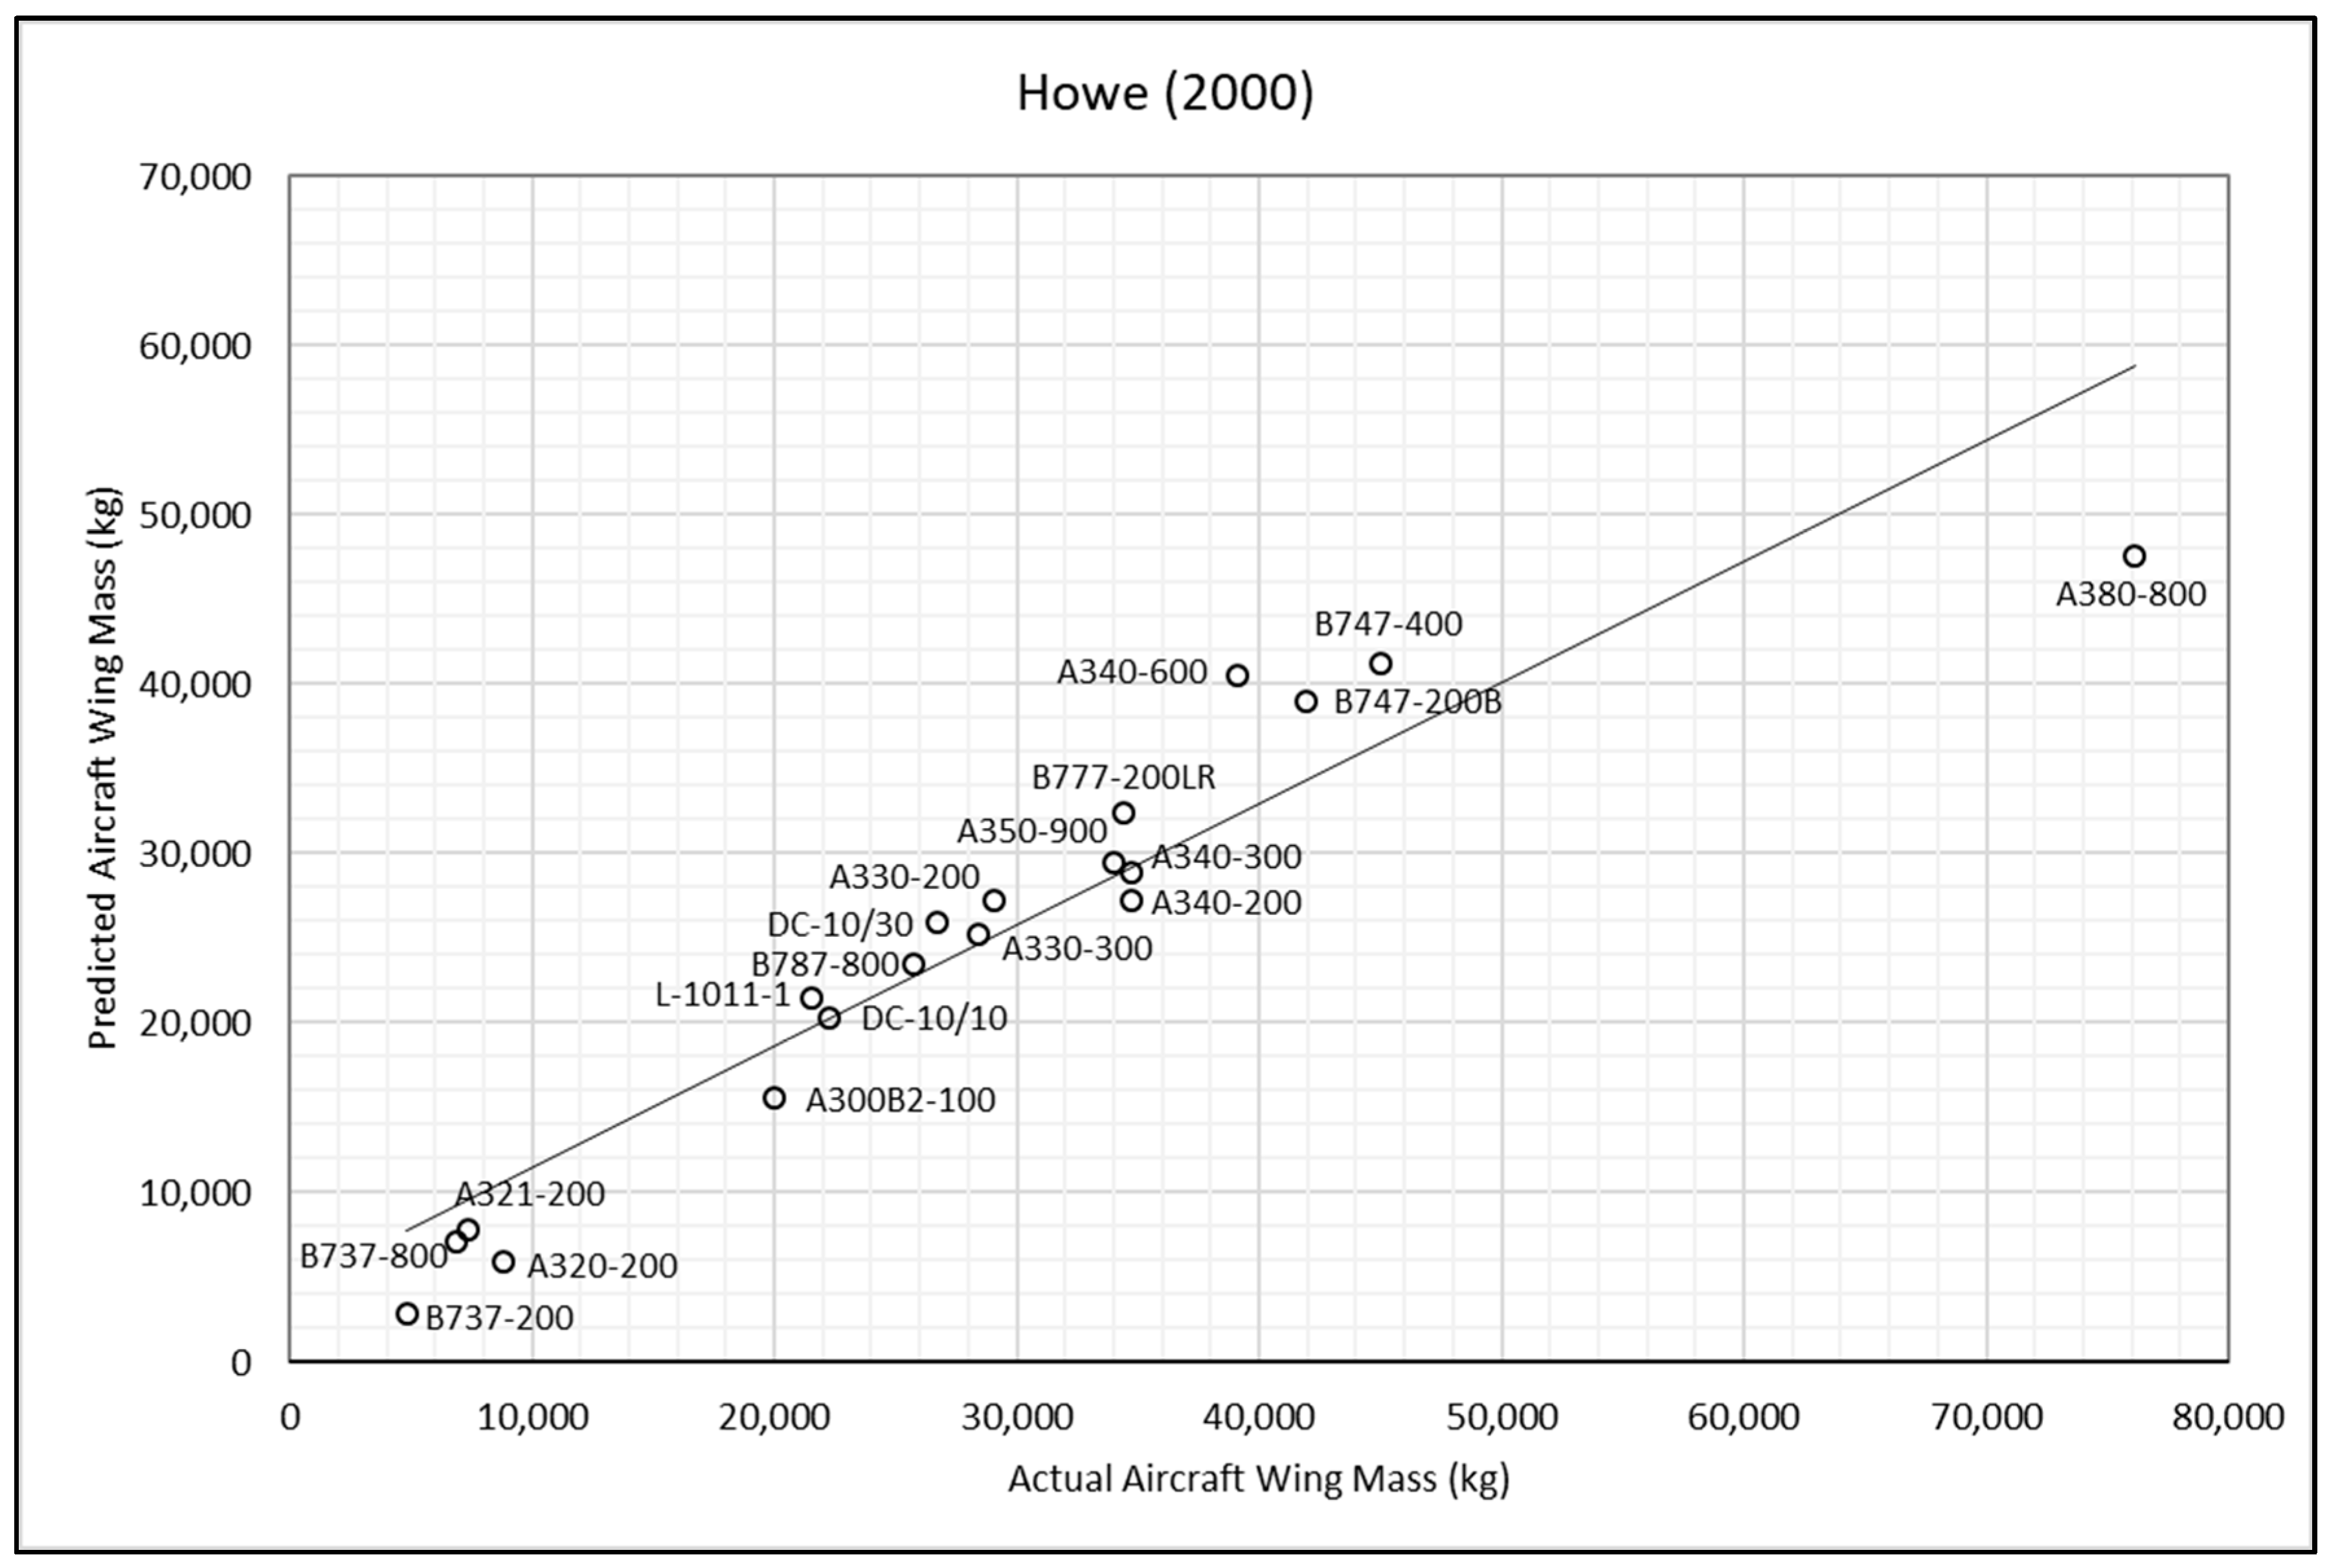
Figure 6.
Howe method—actual and predicted aircraft wing masses [21].
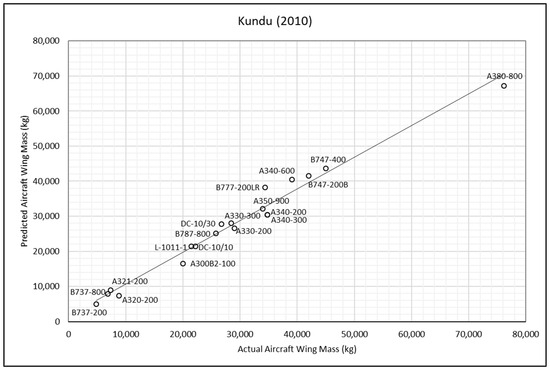
Figure 7.
Kundu method—actual and predicted aircraft wing masses [11].
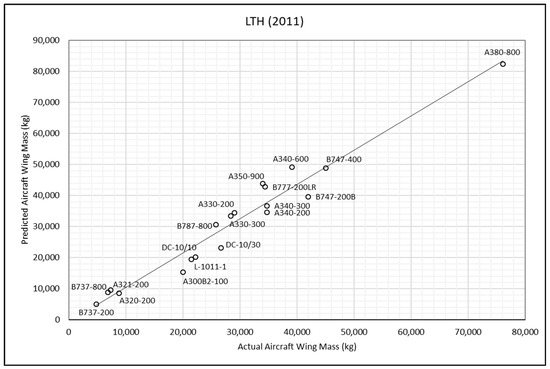
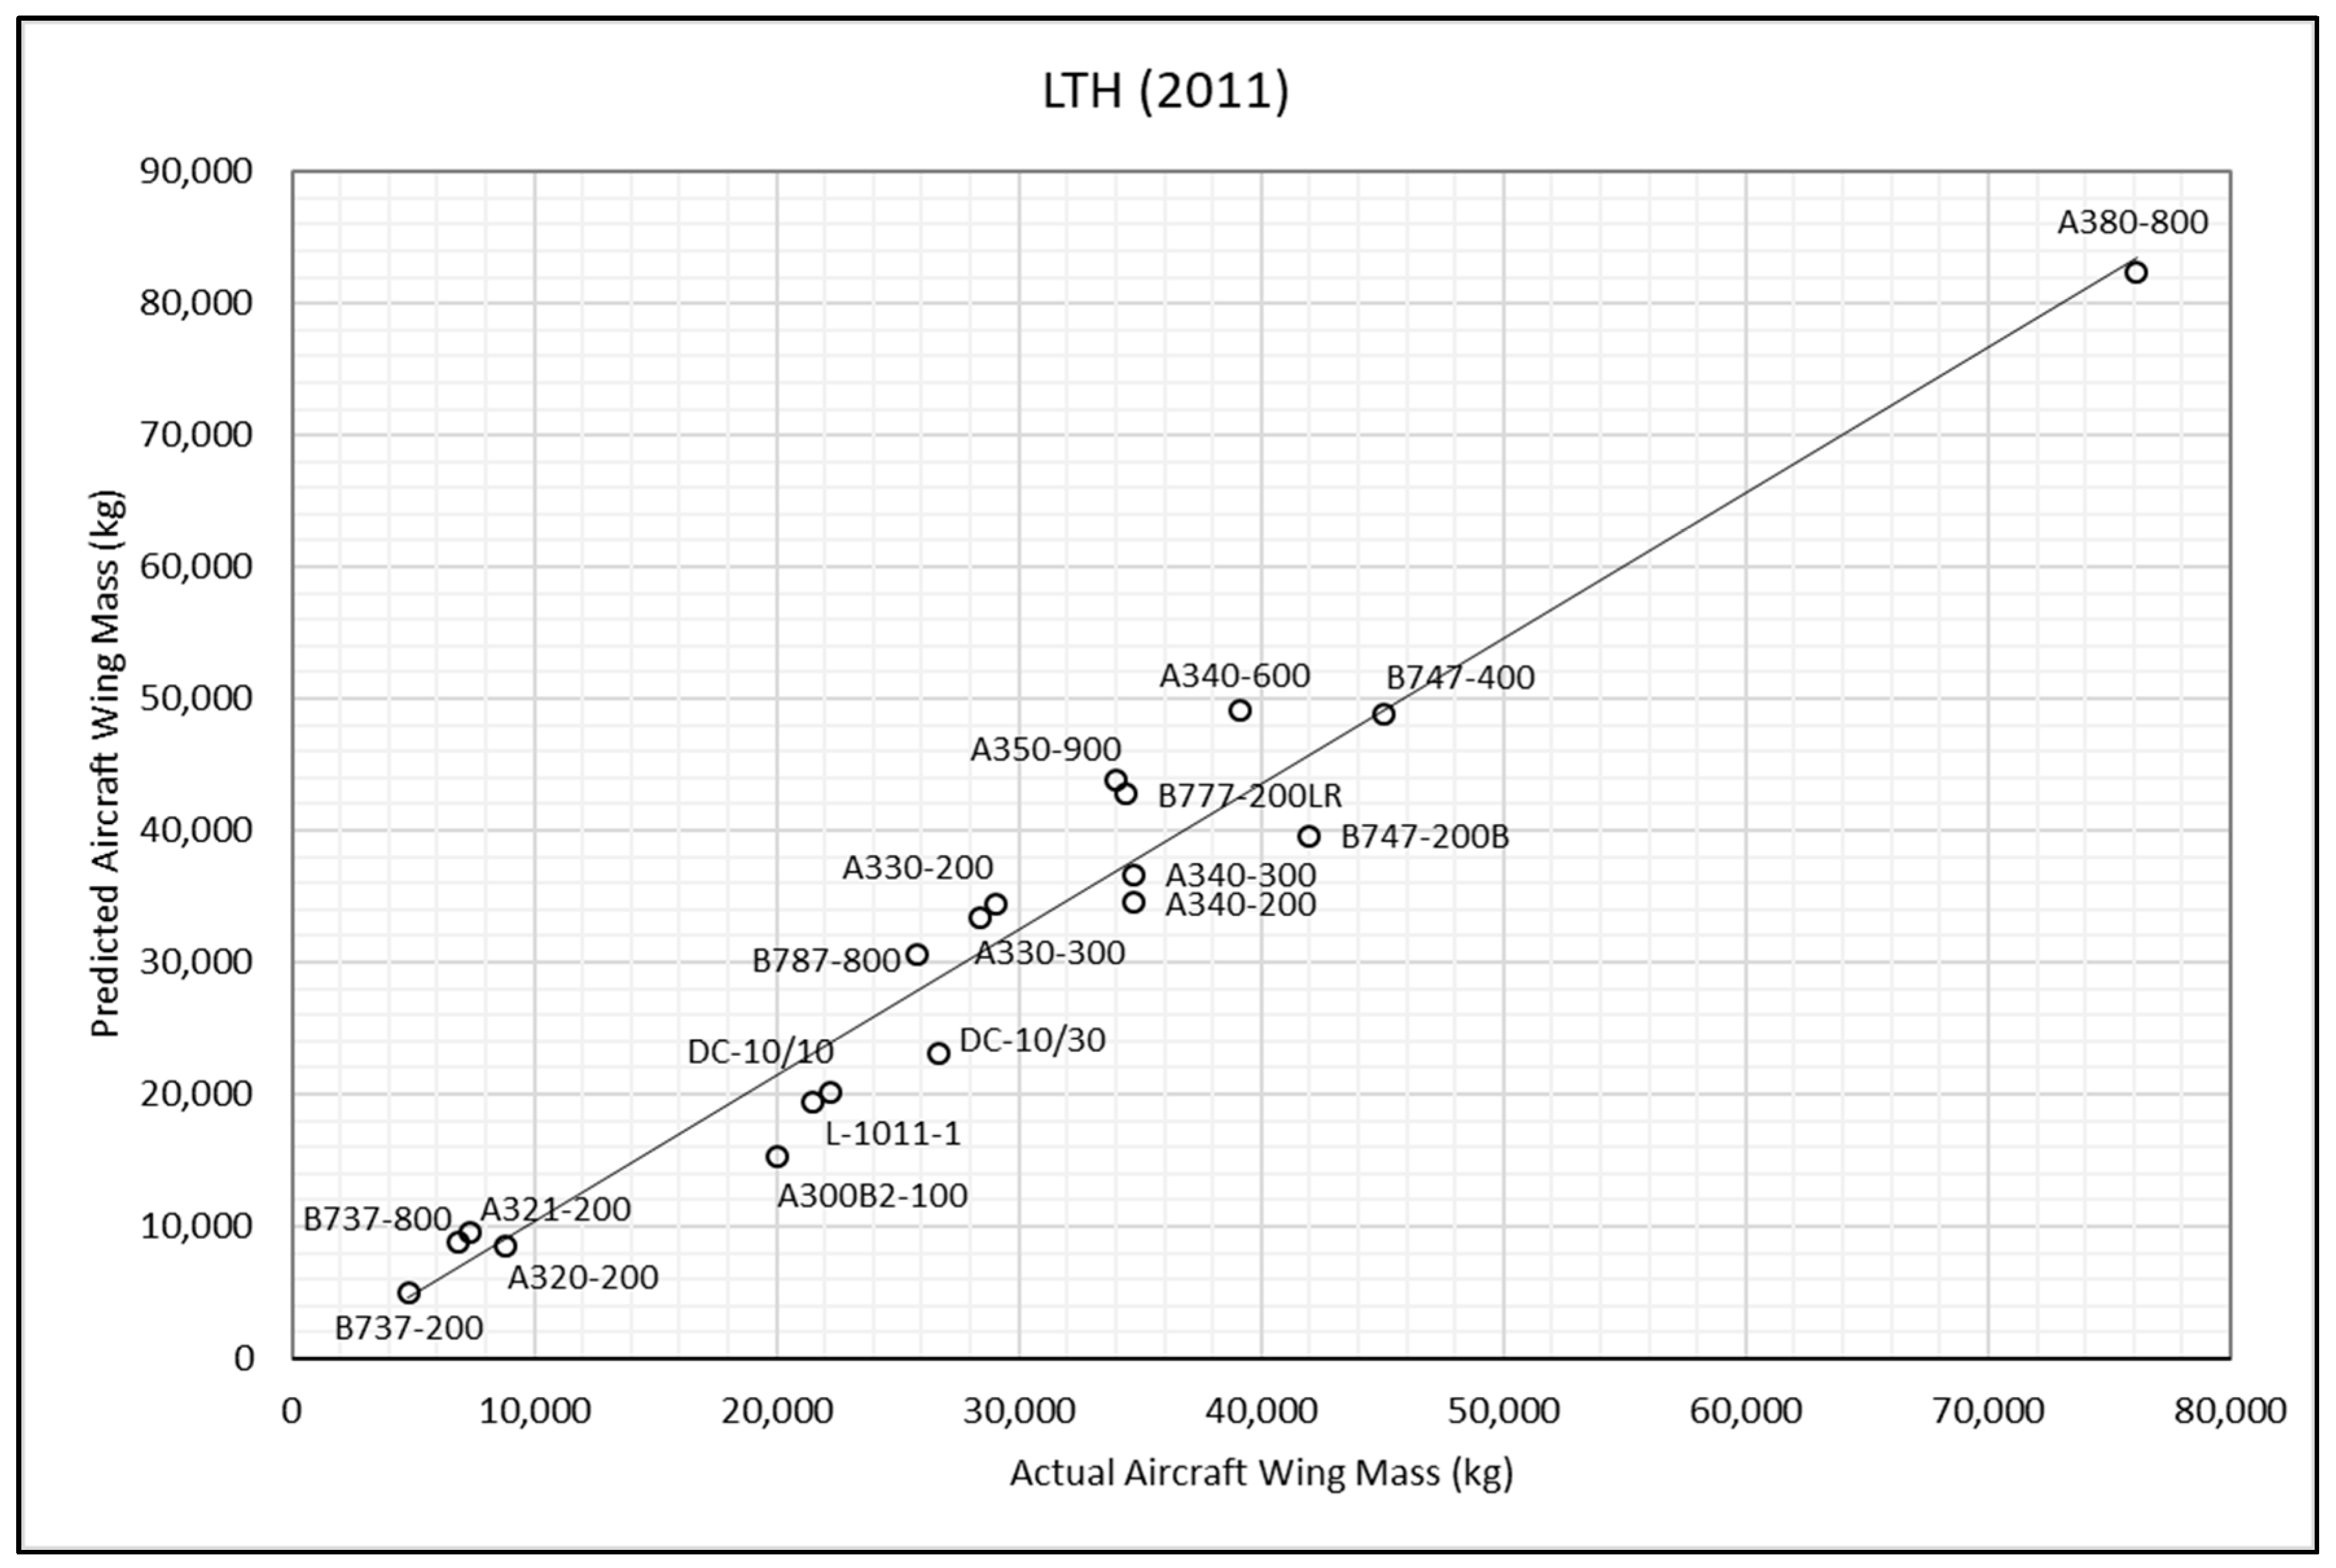
Figure 8.
LTH method—actual and predicted aircraft wing masses [19].
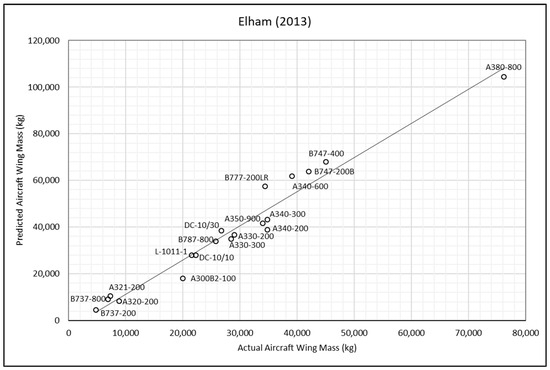
Figure 9.
Elham simple method—actual and predicted aircraft wing masses [8].

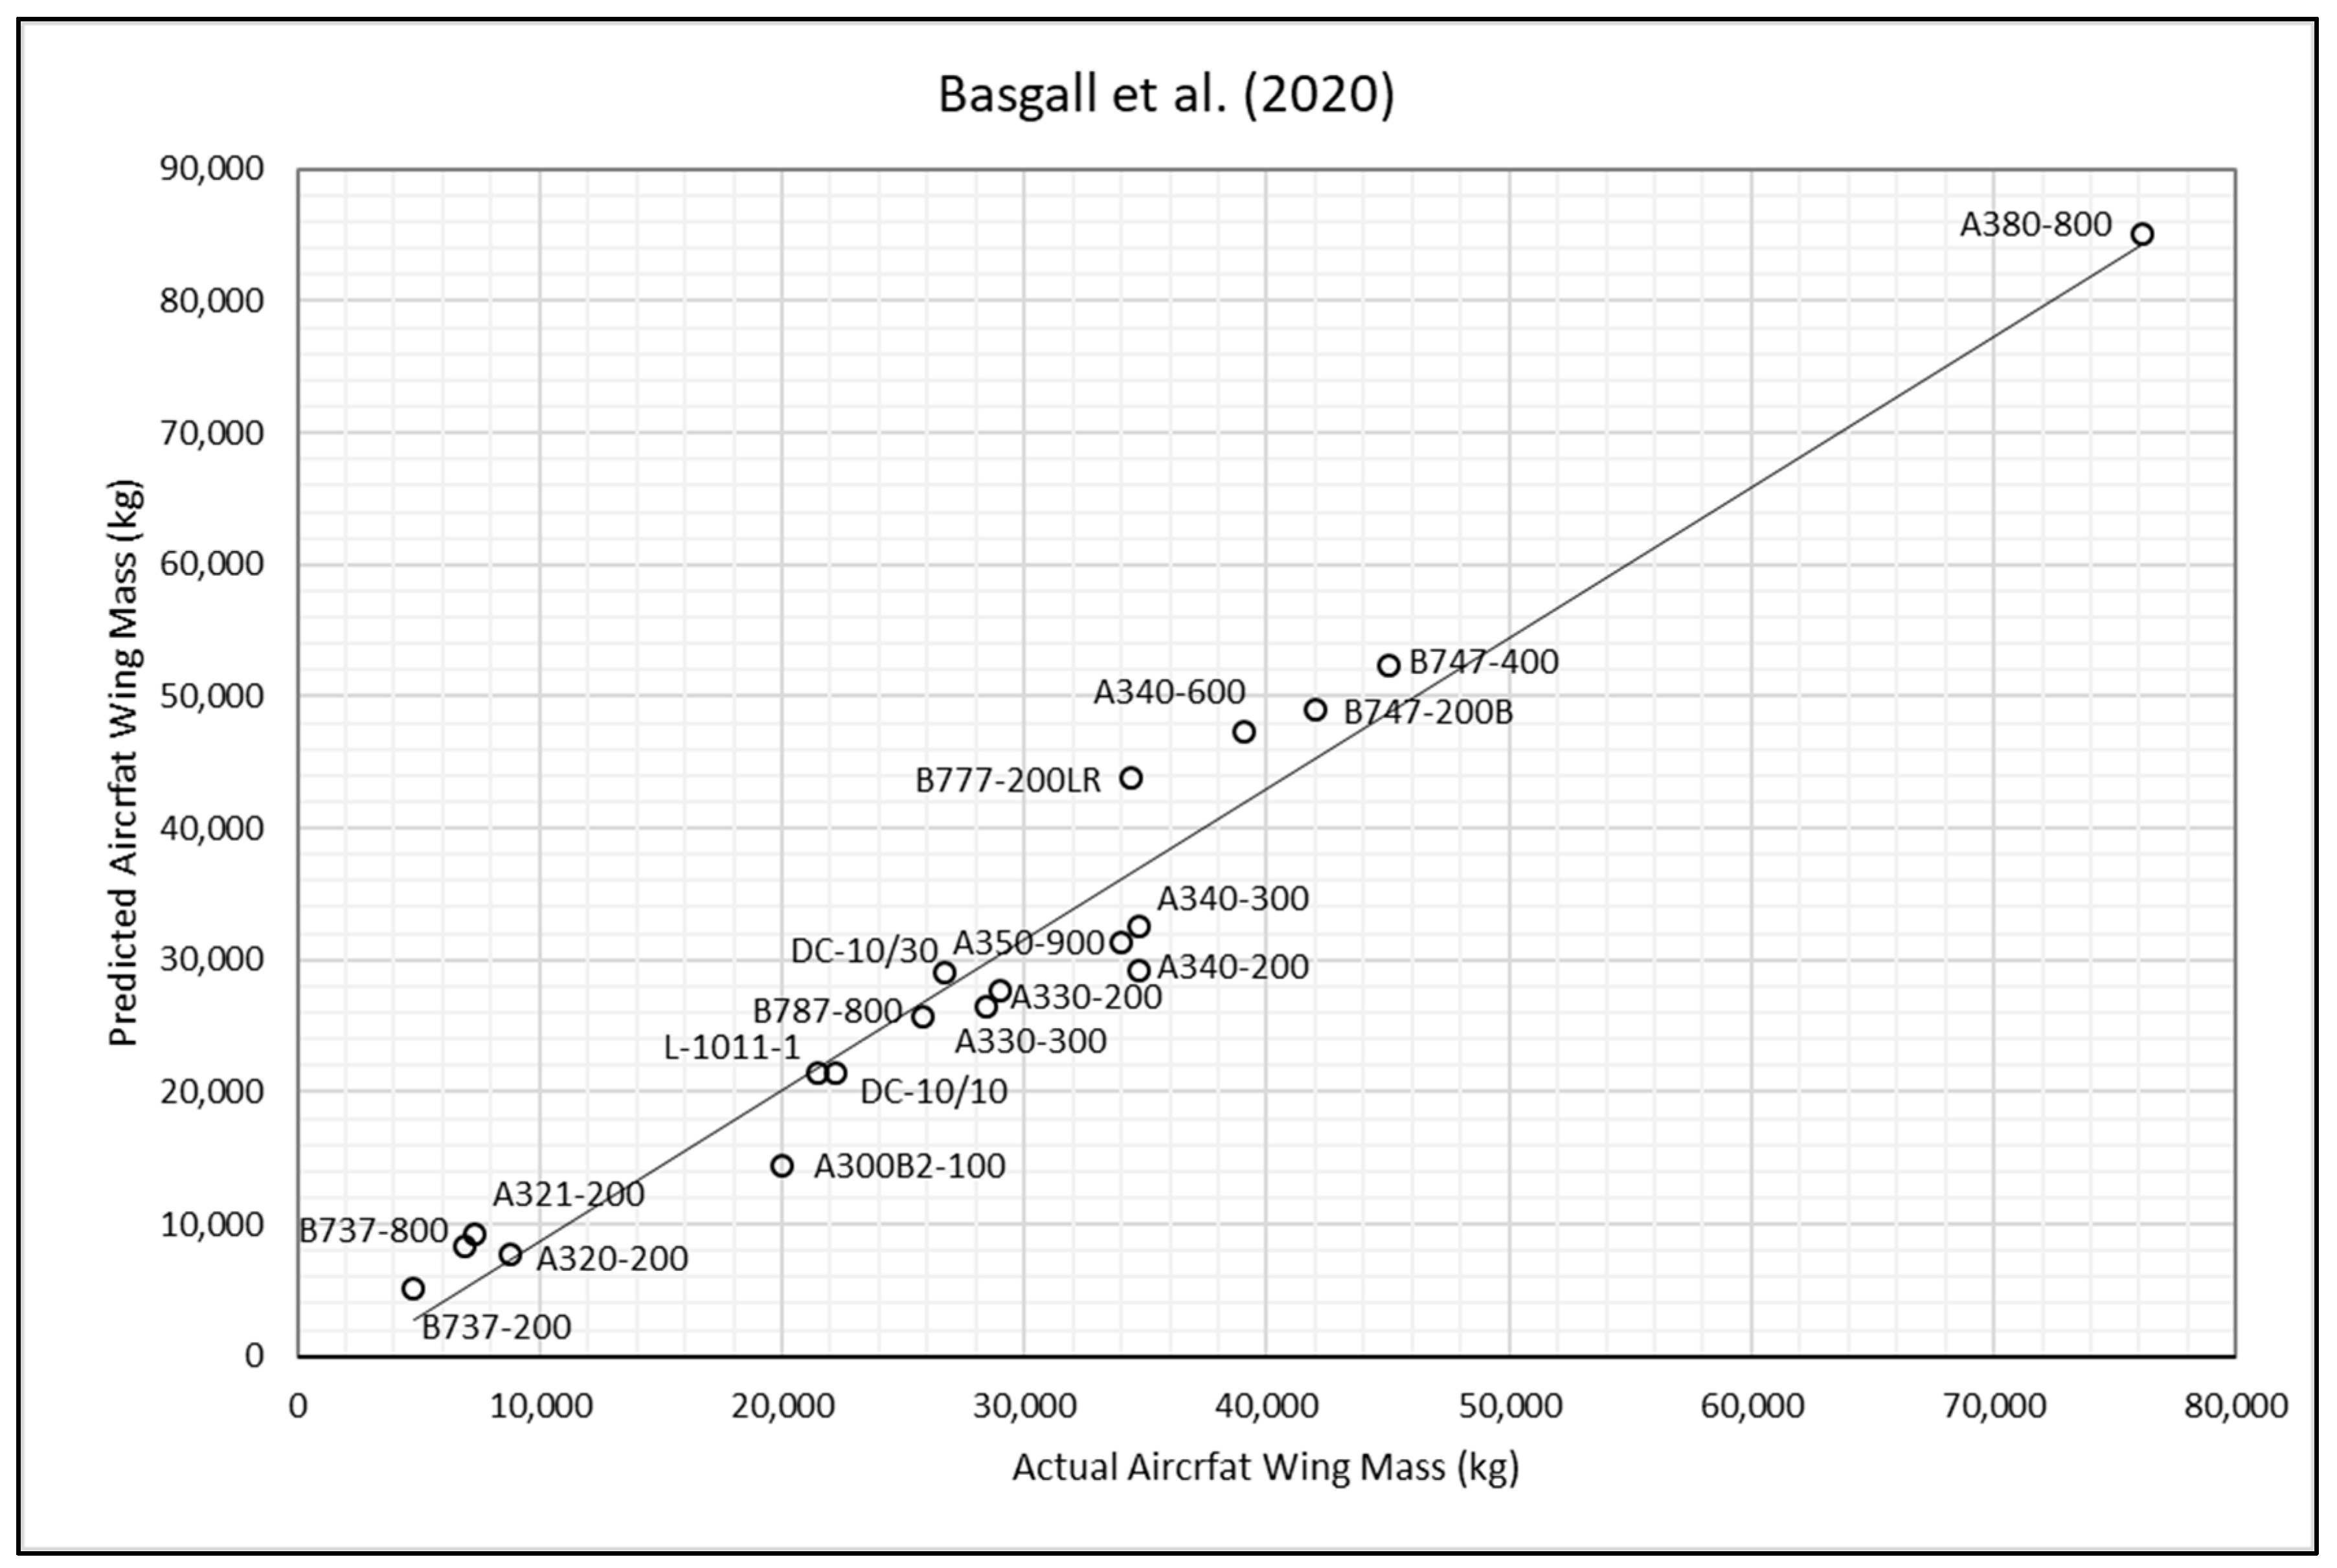
Figure 10.
Basgall jet transport method—actual and predicted aircraft wing masses [25].
Table 5.
Error calculation and root mean square percentage error of the wing mass of selected aircraft.
Each point in Figure 3, Figure 4, Figure 5, Figure 6, Figure 7, Figure 8, Figure 9 and Figure 10 represents an aircraft, with the solid line indicating the ideal case where the predicted weight exactly matches the actual weight. Points above the line correspond to over-predictions, while points below the line indicate under-predictions. The methods of wing-weight estimation developed by Kundu and Torenbeek II effectively capture the general trends in aircraft weight. While there are a few outliers, as marked by points significantly distant from the line, such deviations are expected in the context of a conceptual design tool. The accuracy of the investigated methods in predicting the mass of the selected aircraft wings was analysed using the actual wing mass as a reference value. The error was calculated as follows:
From Table 5, it can be observed that Torenbeek I method significantly underpredicts the wing mass of the selected aircraft, whilst Shevell’s method and Elham’s simple method, in general, overpredict it when compared to other methods. The root mean square percentage error (RMSPE) was chosen as the comparative accuracy indicator to compute the average difference between the wing-mass values obtained by the remaining methods and the actual wing mass.
where the parameters and are the actual and predicted wing-mass values respectively and is the total number of selected transport aircraft. The results show that the RMSPE for the Kundu method is 10%, while that for the Torenbeek II method is 13%, that for Basgall is 15%, and those for the Howe and LTH methods are 17%. According to the findings, the Kundu and Torenbeek II methods achieved the highest accuracy, and the slight differences in RMSPE values were found to be nonsignificant. When using these methods, the predicted wing mass was found to be within [−12.5%, +11.7%] of the true wing mass in about 62% of study cases, which is sufficient for most conceptual and preliminary aircraft-design purposes. The predicted wing mass was found to be within [−22.3%, +20.6%] in nearly 25% of cases and within [−39.0%, +29.7%] in around 13% of cases.
It is crucial to recognize that a discrepancy between the predicted wing-mass value and the quoted actual value does not automatically indicate an error in the prediction method. Various factors contributing to this disparity can be identified and elaborated upon as follows. The methods of wing-mass prediction presented in this study were formulated with the assumption that the necessary input data are accessible during the initial phases of aircraft design. Therefore, although data for well-established and previously manufactured aircraft may be either known or reasonably estimated, those relevant to newly developed aircraft such as Airbus A380-800, Airbus A350-900, and Boeing B787-800 aircraft remain broadly unavailable. Thus, it is reasonable to anticipate that the method’s effectiveness is contingent upon the extent and consistency of available well-documented data. In reality, the availability of precise and comprehensive data in the open literature is typically quite restricted.
Most readily accessible mass data pertain to aircraft constructed from conventional aluminum alloys, and the prediction methods relying on the interpretation of empirical data are primarily applicable to components made from the same materials. Dealing with the recent introduction of advanced lightweight alloys, particularly composite materials, poses a challenge in the methods under consideration in this study. This is because the use of somewhat incongruent factors can lead to misleading results, and there is limited empirical evidence available with which to establish design trends. This challenge may be partly mitigated by employing a theoretical approach that takes specific material properties into account. Nonetheless, implementing this approach with composite materials can be challenging due to the wide range of available material characteristics. The use of more complex methods to estimate wing mass does not necessarily result in increased accuracy. In the early stage of design, many variables essential for these methods are often unavailable, making their inclusion less practical. It is advisable to explore these methods when more reliable data become accessible.
5. Refinement of Methods of Wing-Mass Estimation
There is a compelling argument for creating straightforward formulas with minimal variables, reducing the time and input efforts involved. The general formulation of weight estimation based on empirical data typically follows a power law, as represented by the following equation:
where represents the component weight to be analysed, is the dependent variable on which the analysis is based, and and are the constants of proportionality, which are determined using the chosen statistical method. Based on the data collected and analysed in this study, a refined empirical formula for estimating aircraft wing mass is introduced in Figure 11a,b. This formula aims to provide a straightforward and efficient method for obtaining a rapid initial approximation, making it suitable for use in the early stages of design.
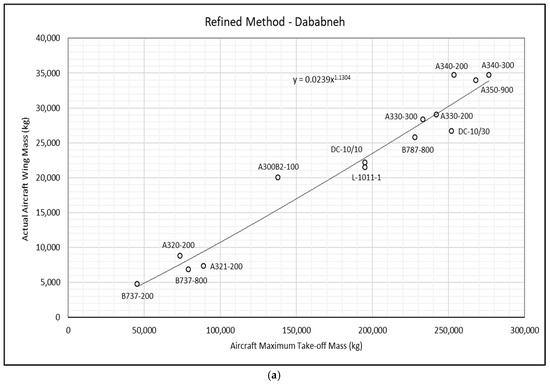
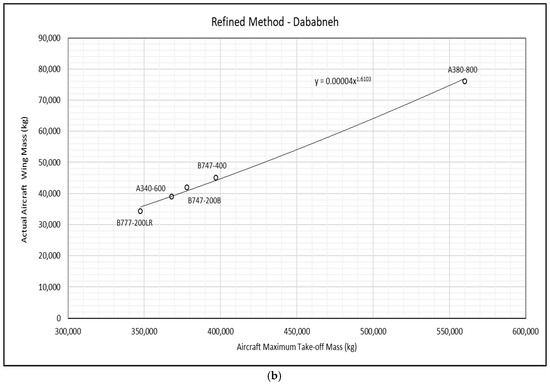
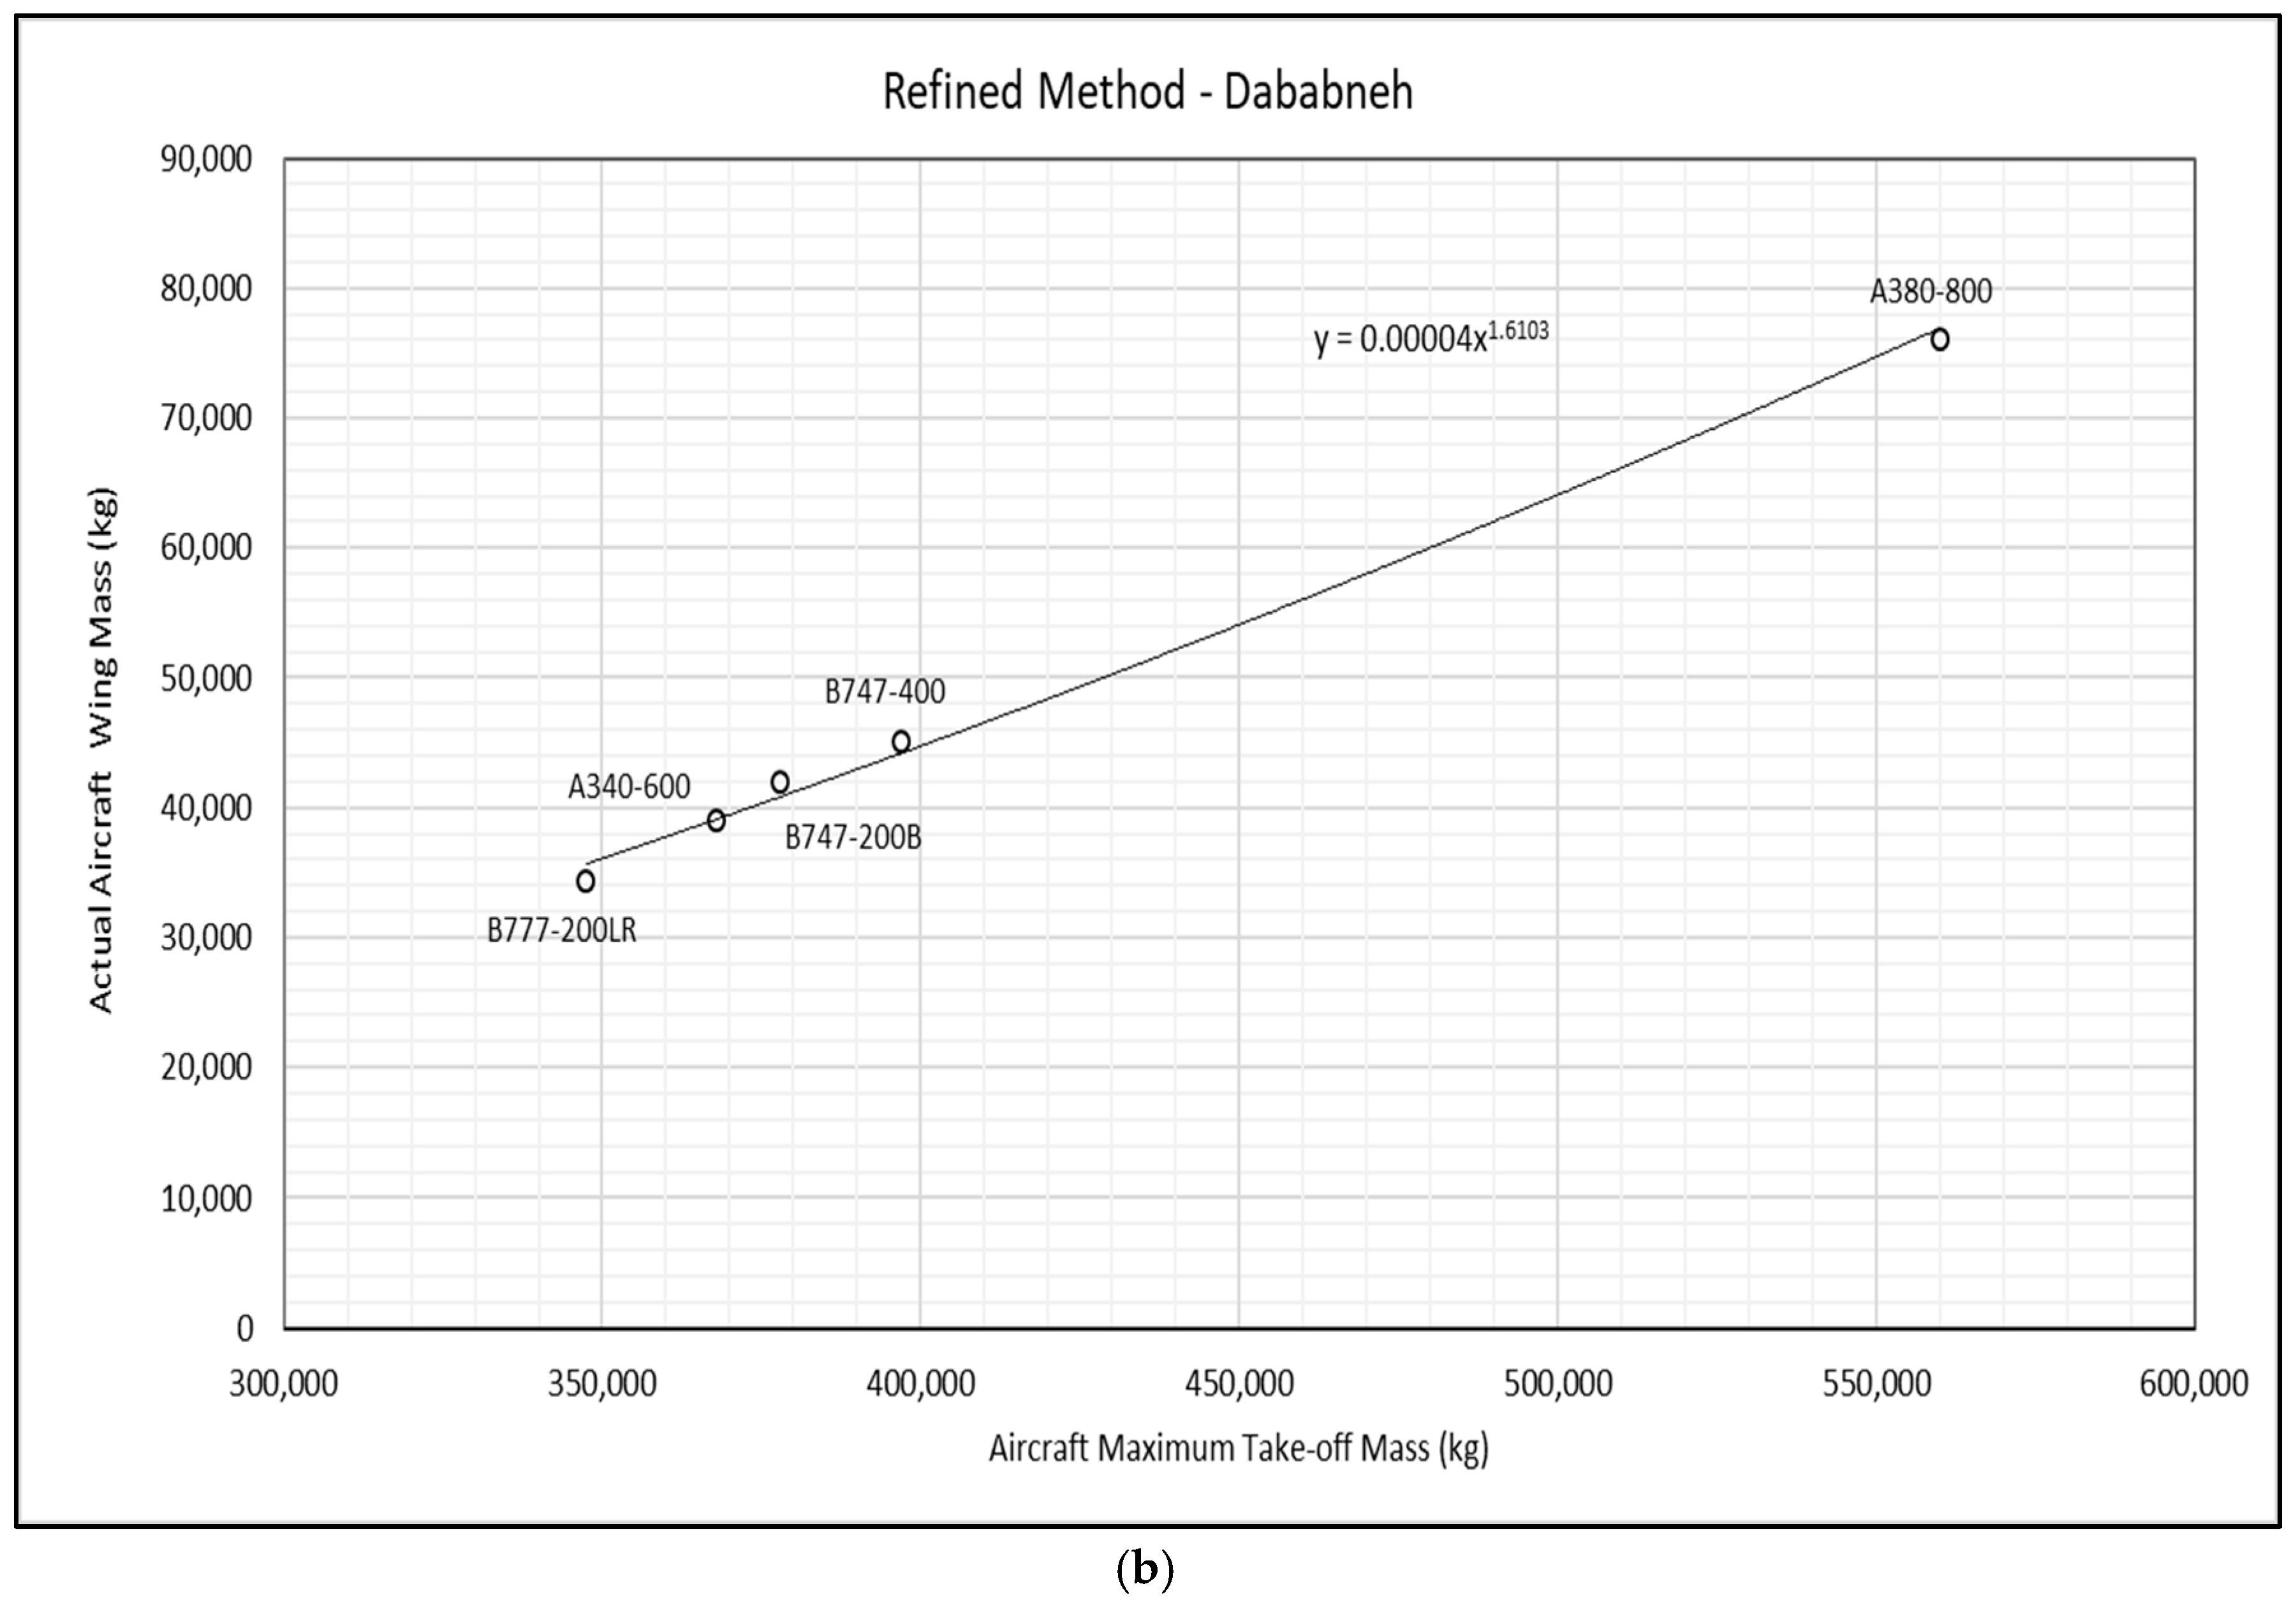
Figure 11.
(a) Wing mass versus aircraft maximum takeoff mass (MTOM < 300,000 kg) and its corresponding power-law regression. (b) Wing mass versus aircraft maximum takeoff mass (MTOM > 300,000 kg) and its corresponding power-law regression.
Due to the absence of monotonic data under the drop in the values of the wing mass and the unavailability of the data for MTOM in the interval of , fitting of all the data with a single regression is not preferable. Instead, the alternative is to fit segments of the data on either side of a break. Therefore, Equation (15) represents the wing mass as a function of the aircraft maximum takeoff mass using power-law regression, as shown in Figure 11a and Figure 11b respectively. Notably, the overall root mean square percentage error (RMSPE) value, using the newly refined formula for estimating wing mass for the list of aircraft presented in Table 4, is 11%. More specifically, the results indicate an RMSPE of 6.5% for the aircraft depicted in Figure 11b and 13% for the aircraft illustrated in Figure 11a. Furthermore, the proposed methods acknowledge the emergence of newly developed aircraft constructed from composite materials and thus may permit the removal of introduced reduction factors to facilitate their application. The integration of composite materials into aircraft structures requires careful consideration of their unique properties, posing significant challenges for designers, especially in the early phases of design.
Table 6 presents a comparison between the predicted wing masses, calculated using the refined estimation methods, and the reference wing-mass values from the open literature for different conventional and unconventional aircraft types.
Table 6.
Estimated versus actual wing mass for researched conventional and unconventional transport-type aircraft.
The percentage errors indicate that the predicted wing masses for the DLR-F11, NASA-CRM-Metallic, NASA-CRM-Composite, MR-TF, SR-SBW, and Biplane are generally close to the actual values, with errors ranging from −8.6% to 4.6%. A reduction factor of 20% was applied to the NASA-CRM-Composite wing to account for the use of a purely composite wing. While the refined methods of wing-mass estimation offer acceptable predictions for these aircraft types, demonstrating a reasonable level of accuracy during the conceptual design phase, they still yield some errors when they are applied to some unconventional aircraft, as shown in Table 6. This indicates that there is a need for further refinement, especially for unconventional and innovative aircraft designs, which should be implemented when more statistical data become available.
6. Conclusions
In conclusion, the new refined formula outperforms the other methods discussed in this study, achieving an overall root mean square percentage error (RMSPE) of 11%, indicating improved accuracy in wing-mass estimation. Specifically, the RMSPE is 6.5% for the aircraft shown in Figure 11b and 13% for those in Figure 11a. The refined method proves effective for wings with an aspect ratio up to 10, providing reasonable accuracy during the conceptual design phase. However, some errors arise when the method is applied to unconventional aircraft, as shown in Table 6. As modern aircraft designs increasingly incorporate higher aspect ratios, this method may struggle to accurately estimate wing mass for such configurations. To maintain accuracy as the design evolves, the recalibration of the empirical model will be essential.
Despite the use of advanced techniques such as those developed by Howe and the LTH method, which involve numerous variables in their computations, no significant improvement in the accuracy of wing-mass estimation has been observed. The frequent unavailability of essential variables for these methods limits their practical application. It is recommended to revisit these approaches when more reliable data become accessible. In situations in which the necessary technical data and specifications for wing-mass estimation are unknown and certain variable values are unavailable, practical engineering assumptions and judgment should be applied as a last resort. Regarding the accuracy of the investigated methods for predicting wing mass, the Kundu and Torenbeek II methods demonstrated the highest accuracy, with the minor differences in their RMSPE values considered negligible. In contrast, the Torenbeek I method consistently underestimates wing mass for the selected aircraft, while Shevell’s and Elham’s methods tend to overestimate it compared to the other approaches (see Table 5).
The ongoing study also highlights that discrepancies between the predicted and actual wing mass does not necessarily indicate a flaw in the prediction method. Various factors contributing to these differences can be identified and explained, as detailed in Section 4. For example, when different variants of an aircraft family share similar wing masses despite variations in maximum takeoff mass (MTOM), this is often the result of deliberate design decisions made during the development of the family program. Designers may choose to create wings with a high degree of commonality to minimize development and production costs, incorporating shared structural elements, materials, and manufacturing techniques. Additionally, the wings may be designed to accommodate the loads of the heaviest variant, with lighter variants inheriting this robust design without significant reductions in structural mass. Furthermore, wings may be designed with growth potential in mind, allowing for future variants or upgrades without requiring a complete redesign.
Author Contributions
O.D. supervised the research, wrote and reviewed the manuscript, and presented the findings. J.T.C.-S. conducted the literature review and performed the calculations. All authors contributed equally and have read and approved the final version of the manuscript.
Funding
This research received no external funding.
Data Availability Statement
The original contributions presented in the study are included in the article, further inquiries can be directed to the corresponding author.
Conflicts of Interest
The authors declare no conflicts of interest.
Appendix A
This appendix provides the variables for the technical data and specifications for the chosen aircraft, which are linked to the methods employed in estimating wing mass within this study. In instances in which certain variable values were not accessible, practical engineering assumptions and judgments were employed as a final recourse during the analysis.
Table A1.
Relevant collected and analysed data for aircraft—part A [52,53,54,55].
Table A1.
Relevant collected and analysed data for aircraft—part A [52,53,54,55].
| Parameter | Units | Aircraft Type—Part A | |||||||||
|---|---|---|---|---|---|---|---|---|---|---|---|
| A380-800 | A350-900 | A340-200 | A340-300 | A340-600 | A330-200 | A330-300 | A300B2-100 | A320-200 | A321-200 | ||
| Torenbeek I (1976) [14] | |||||||||||
| kg | 360,911.00 | 189,852.00 | 169,000.00 | 178,000.00 | 245,000.00 | 170,000.00 | 175,000.00 | 116,500.00 | 61,000.00 | 71,500.00 | |
| m | 79.64 | 64.74 | 60.30 | 58.00 | 61.20 | 60.30 | 58.00 | 44.83 | 34.10 | 34.10 | |
| ° | 30.26 | 30.24 | 26.83 | 26.95 | 28.20 | 26.83 | 26.95 | 24.80 | 22.50 | 22.50 | |
| - | 3.75 | 3.75 | 3.75 | 3.75 | 3.75 | 3.75 | 3.75 | 3.75 | 3.75 | 3.75 | |
| m | 2.00 | 1.89 | 1.68 | 1.52 | 1.44 | 1.61 | 1.52 | 1.43 | 0.93 | 0.93 | |
| m2 | 853.21 | 437.17 | 363.10 | 363.11 | 435.26 | 363.1 | 363.11 | 260.00 | 122.57 | 122.57 | |
| Shevell Method (1983) [17] | |||||||||||
| - | 3.75 | 3.75 | 3.75 | 3.75 | 3.75 | 3.75 | 3.75 | 3.75 | 3.75 | 3.75 | |
| ft | 261.29 | 212.40 | 197.83 | 190.29 | 200.79 | 197.83 | 190.29 | 147.08 | 111.88 | 111.88 | |
| lbs | 1,234,588.67 | 590,838.86 | 558,871.83 | 609,578.15 | 811,301.12 | 533,518.67 | 513,677.07 | 304,000.00 | 162,039.76 | 196,211.41 | |
| lbs | 795,672.51 | 418,552.96 | 372,581.22 | 392,422.83 | 540,132.54 | 374,785.85 | 385,808.96 | 256,838.54 | 134,481.98 | 157,630.52 | |
| - | 9.82% | 12.46% | 12.83% | 12.40% | 10.00% | 12.40% | 12.40% | 10.50% | 12.60% | 12.60% | |
| ft2 | 9183.88 | 4705.66 | 3908.38 | 3908.48 | 4685.10 | 3908.38 | 3908.48 | 2798.62 | 1319.33 | 1319.33 | |
| rad | 0.53 | 0.53 | 0.47 | 0.47 | 0.49 | 0.47 | 0.47 | 0.43 | 0.39 | 0.39 | |
| - | 0.20 | 0.18 | 0.25 | 0.22 | 0.20 | 0.25 | 0.22 | 0.30 | 0.21 | 0.21 | |
| Torenbeek II (1994) [16] | |||||||||||
| - | 3.75 | 3.75 | 3.75 | 3.75 | 3.75 | 3.75 | 3.75 | 3.75 | 3.75 | 3.75 | |
| kg | 560,000.00 | 268,000.00 | 253,500.00 | 276,500.00 | 368,000.00 | 242,000.00 | 233,000.00 | 137,892.08 | 73,500.00 | 89,000.00 | |
| kg | 360,910.98 | 189,852.43 | 169,000.00 | 178,000.00 | 245,000.00 | 170,000.00 | 175,000.00 | 116,500.00 | 61,000.00 | 71,500.00 | |
| m | 79.64 | 64.74 | 60.30 | 58.00 | 61.20 | 60.30 | 58.00 | 44.83 | 34.10 | 34.10 | |
| m2 | 853.21 | 437.17 | 363.10 | 363.11 | 435.26 | 363.1 | 363.11 | 260.00 | 122.57 | 122.57 | |
| - | 0.20 | 0.18 | 0.25 | 0.22 | 0.20 | 0.25 | 0.22 | 0.30 | 0.21 | 0.21 | |
| ° | 33.50 | 32.63 | 29.7 | 29.74 | 31.1 | 29.7 | 29.74 | 28 | 24.96 | 24.96 | |
| Howe Method (2000) [21] | |||||||||||
| - | 7.43 | 9.46 | 9.26 | 9.18 | 8.51 | 9.27 | 9.18 | 7.73 | 9.34 | 9.34 | |
| m2 | 853.21 | 437.17 | 363.10 | 363.11 | 435.26 | 363.1 | 363.11 | 260.00 | 122.57 | 122.57 | |
| ° | 33.50 | 32.63 | 29.7 | 29.74 | 31.1 | 29.7 | 29.74 | 28 | 24.96 | 24.96 | |
| - | 0.20 | 0.18 | 0.25 | 0.22 | 0.20 | 0.25 | 0.22 | 0.30 | 0.21 | 0.21 | |
| kg | 560,000.00 | 268,000.00 | 253,500.00 | 276,500.00 | 368,000.00 | 242,000.00 | 233,000.00 | 137,892.08 | 73,500.00 | 89,000.00 | |
| - | 4.13 | 4.13 | 4.13 | 4.13 | 4.13 | 4.13 | 4.13 | 4.13 | 4.13 | 4.13 | |
| m/s | 280.63 | 283.58 | 278.54 | 278.54 | 278.54 | 278.54 | 278.54 | 277.68 | 220.00 | 272.25 | |
| - | 11.26% | 15.49% | 16.00% | 15.30% | 11.97% | 15.00% | 15.30% | 15.00% | 15.21% | 15.21% | |
| 853 | 440 | 420 | 420 | 475 | 380 | 440 | 269 | 179 | 190 | ||
| Kundu Method (2010) [11] | |||||||||||
| - | 12.00% | 12.00% | 12.00% | 12.00% | 11.00% | 11.00% | 12.00% | 12.00% | 10.00% | 10.00% | |
| LTH Method (2011) [19] | |||||||||||
| m2 | 853.21 | 437.17 | 363.10 | 363.11 | 435.26 | 363.1 | 363.11 | 260.00 | 122.57 | 122.57 | |
| kg | 560,000.00 | 268,000.00 | 253,500.00 | 276,500.00 | 368,000.00 | 242,000.00 | 233,000.00 | 137,892.08 | 73,500.00 | 89,000.00 | |
| - | 7.43 | 9.46 | 9.26 | 9.18 | 8.51 | 9.27 | 9.18 | 7.73 | 9.34 | 9.34 | |
| - | 11.26% | 15.49% | 16.00% | 15.30% | 11.97% | 15.00% | 15.30% | 15.00% | 15.21% | 15.21% | |
| - | 9.50% | 11.30% | 12.00% | 11.30% | 9.50% | 12.00% | 11.30% | 12.00% | 11.75% | 11.75% | |
| - | 8.70% | 10.60% | 10.50% | 10.60% | 8.70% | 10.50% | 10.60% | 10.50% | 10.84% | 10.84% | |
| ° | 33.50 | 32.63 | 29.7 | 29.74 | 31.1 | 29.7 | 29.74 | 28 | 24.96 | 24.96 | |
| Elham Simple Class I Method (2013) [8] | |||||||||||
| MTOM | kg | 560,000.00 | 268,000.00 | 253,500.00 | 276,500.00 | 368,000.00 | 242,000.00 | 233,000.00 | 137,892.08 | 73,500.00 | 89,000.00 |
| Basgall Jet Transport Method (2020) [25] | |||||||||||
| MTOM | lbs | 1,234,588.67 | 590,838.86 | 558,871.83 | 609,578.15 | 811,301.12 | 533,518.67 | 513,677.07 | 304,000.00 | 162,039.76 | 196,211.41 |
Table A2.
Relevant collected and analysed data for aircraft—part B [56,57,58,59,60,61,62,63].
Table A2.
Relevant collected and analysed data for aircraft—part B [56,57,58,59,60,61,62,63].
| Parameter | Units | Aircraft Type—Part B | ||||||||
|---|---|---|---|---|---|---|---|---|---|---|
| B787-800 | B777-200LR | B747-400 | B747-200B | B737-800 | B737-200 | L-1011-1 | DC-10/10 | DC-10/30 | ||
| Torenbeek I (1976) [14] | ||||||||||
| kg | 160,985.93 | 209,106.08 | 247,207.84 | 238,816.38 | 62,731.82 | 38,555.00 | 145,150.00 | 151,956.00 | 166,922.00 | |
| m | 56.43 | 62.28 | 62.3 | 59.64 | 34.32 | 28.35 | 47.35 | 50.40 | 50.40 | |
| ° | 29.15 | 27.93 | 35.37 | 34.62 | 22.13 | 21.83 | 31.62 | 31.29 | 31.29 | |
| - | 3.75 | 3.75 | 3.75 | 3.75 | 3.75 | 3.75 | 3.75 | 3.75 | 3.75 | |
| m | 1.80 | 1.97 | 1.65 | 2.22 | 0.89 | 0.90 | 1.92 | 2.10 | 2.10 | |
| m2 | 360.77 | 440.09 | 532.74 | 511.00 | 124.74 | 91.04 | 321.50 | 367.70 | 367.70 | |
| Shevell Method (1983) [17] | ||||||||||
| - | 3.75 | 3.75 | 3.75 | 3.75 | 3.75 | 3.75 | 3.75 | 3.75 | 3.75 | |
| ft. | 185.14 | 204.33 | 204.40 | 195.67 | 112.60 | 93.01 | 155.35 | 165.35 | 165.35 | |
| lbs | 502,500.00 | 766,000.00 | 875,000.00 | 833,000.00 | 174,200.00 | 100,000.00 | 430,012.00 | 429,901.00 | 555,036.00 | |
| lbs | 354,913.20 | 461,000.00 | 545,000.00 | 526,500.00 | 138,300.00 | 84,999.20 | 320,001.00 | 335,005.60 | 368,000.00 | |
| - | 11.15% | 12.60% | 9.95% | 12.50% | 12.40% | 12.00% | 10.70% | 11.00% | 11.00% | |
| ft2 | 3883.30 | 4737.09 | 5734.37 | 5500.36 | 1342.69 | 979.95 | 3460.60 | 3957.89 | 3957.89 | |
| rad | 0.51 | 0.49 | 0.62 | 0.60 | 0.39 | 0.38 | 0.55 | 0.55 | 0.55 | |
| - | 0.12 | 0.12 | 0.22 | 0.30 | 0.21 | 0.27 | 0.26 | 0.22 | 0.22 | |
| Torenbeek II (1994) [16] | ||||||||||
| - | 3.75 | 3.75 | 3.75 | 3.75 | 3.75 | 3.75 | 3.75 | 3.75 | 3.75 | |
| kg | 227,930.17 | 347,451.76 | 396,893.32 | 377,842.44 | 79,015.79 | 45,359.24 | 195,050.00 | 195,000.00 | 251,760.00 | |
| kg | 160,985.93 | 209,106.08 | 247,207.84 | 238,816.38 | 62,731.82 | 38,555.00 | 145,150.00 | 151,956.00 | 166,922.00 | |
| m | 56.43 | 62.28 | 62.30 | 59.64 | 34.32 | 28.35 | 47.35 | 50.40 | 50.40 | |
| m2 | 360.77 | 440.09 | 532.74 | 511.00 | 124.74 | 91.04 | 321.50 | 367.70 | 367.70 | |
| - | 0.12 | 0.12 | 0.22 | 0.30 | 0.21 | 0.27 | 0.26 | 0.22 | 0.22 | |
| ° | 32.20 | 31.34 | 38.00 | 37.50 | 25.02 | 25.00 | 35.00 | 35.00 | 35.00 | |
| Howe Method (2000) [21] | ||||||||||
| - | 8.50 | 8.53 | 7.10 | 7.00 | 9.18 | 8.83 | 6.97 | 6.91 | 6.91 | |
| m2 | 360.77 | 440.09 | 532.74 | 511.00 | 124.74 | 91.04 | 321.50 | 367.70 | 367.70 | |
| ° | 32.20 | 31.34 | 38.00 | 37.50 | 25.02 | 25.00 | 35.00 | 35.00 | 35.00 | |
| - | 0.12 | 0.12 | 0.22 | 0.30 | 0.21 | 0.27 | 0.26 | 0.22 | 0.22 | |
| kg | 227,930.17 | 347,451.76 | 396,893.32 | 377,842.44 | 79,015.79 | 45,359.24 | 195,050.00 | 195,000.00 | 251,760.00 | |
| - | 4.13 | 4.13 | 4.13 | 4.13 | 4.13 | 4.13 | 4.13 | 4.13 | 4.13 | |
| m/s | 271.77 | 277.10 | 280.63 | 280.63 | 273.56 | 176.00 | 284.53 | 265.50 | 292.65 | |
| - | 14.67% | 15.00% | 11.40% | 15.00% | 14.50% | 15.00% | 16.00% | 17.90% | 17.90% | |
| - | 381 | 440 | 660 | 480 | 189 | 130 | 400 | 399 | 380 | |
| Kundu Method (2010) [11] | ||||||||||
| - | 11.00% | 11.00% | 11.00% | 11.00% | 10.00% | 11.00% | 11.00% | 11.00% | 11.00% | |
| LTH Method (2011) [19] | ||||||||||
| m2 | 360.77 | 440.09 | 532.74 | 511.00 | 124.74 | 91.04 | 321.50 | 367.70 | 367.70 | |
| kg | 227,930.17 | 347,451.76 | 396,893.32 | 377,842.44 | 79,015.79 | 45,359.24 | 195,050.00 | 195,000.00 | 251,760.00 | |
| - | 8.50 | 8.53 | 7.10 | 7.00 | 9.18 | 8.83 | 6.97 | 6.91 | 6.91 | |
| - | 14.67% | 15.00% | 11.40% | 15.00% | 14.50% | 15.00% | 16.00% | 17.90% | 17.90% | |
| - | 12.09% | 12.30% | 9.46% | 12.00% | 11.75% | 12.00% | 12.00% | 12.00% | 12.00% | |
| - | 6.70% | 10.70% | 9.00% | 10.50% | 11.00% | 10.50% | 7.00% | 8.00% | 8.00% | |
| ° | 32.20 | 31.34 | 38.00 | 37.50 | 25.02 | 25.00 | 35.00 | 35.00 | 35.00 | |
| Elham Simple Class I Method (2013) [8] | ||||||||||
| MTOM | kg | 227,930.17 | 347,451.76 | 396,893.32 | 377,842.44 | 79,015.79 | 45,359.24 | 195,050.00 | 195,000.00 | 251,760.00 |
| Basgall Jet Transport Method (2020) [25] | ||||||||||
| MTOM | lbs | 502,500.00 | 766,000.00 | 875,000.00 | 833,000.00 | 174,200.00 | 100,000.00 | 430,012.00 | 429,901.00 | 555,036.00 |
References
- Kretov, A.; Tiniakov, D. Evaluation of the Mass and Aerodynamic Efficiency of a High Aspect Ratio Wing for Prospective Passenger Aircraft. Aerospace 2022, 9, 497. [Google Scholar] [CrossRef]
- Marano, A.D.; Diodati, G.; Paletta, N.; Di Palma, L.; Belardo, M.; Nour, P.A. Structural Scalability Preliminary Studies for the Next Generation Civil Tiltrotor Composite Wing. Aerospace 2023, 10, 478. [Google Scholar] [CrossRef]
- Dababneh, O.; Kipouros, T. Review of aircraft wing mass estimation methods. Aerosp. Sci. Technol. 2018, 72, 256–266. [Google Scholar] [CrossRef]
- Bravo-Mosquera, P.D.; Catalano, F.M.; Zingg, D.W. Unconventional aircraft for civil aviation: A review of concepts and design methodologies. Prog. Aerosp. Sci. 2022, 131, 100813. [Google Scholar] [CrossRef]
- Zhu, W.; Fan, Z.; Yu, X. Structural mass prediction in conceptual design of blended-wing-body aircraft. Chin. J. Aeronaut. 2019, 32, 2455–2465. [Google Scholar] [CrossRef]
- Takahashi, T.T.; Lemonds, T. Prediction of wing structural mass for transport category aircraft conceptual design. In Proceedings of the 15th AIAA Aviation Technology, Integration, and Operations Conference, Dallas, TX, USA, 22–26 June 2015. [Google Scholar] [CrossRef]
- Chiozzotto, G.P. Wing weight estimation in conceptual design: A method for strut-braced wings considering static aeroelastic effects. CEAS Aeronaut. J. 2016, 7, 499–519. [Google Scholar] [CrossRef]
- Elham, A. Weight Indexing for Multidisciplinary Design Optimization of Lifting Surfaces. Ph.D. Thesis, Delft University of Technology, Delft, The Netherlands, 2013. [Google Scholar]
- Murphy, N. Analytical Wing Weight Prediction/Estimation Using Computer Based Design Techniques. Ph.D. Thesis, Cranfield Institute of Technology, Cranfield, UK, 1987. [Google Scholar]
- Ardema, M.; Chambers, M.; Patron, A.; Hahn, A.; Miura, H.; Moore, M. Analytical Fuselage and Wing Weight Estimation of Transport Aircraft; NASA: Washington, DC, USA, 1996.
- Kundu, A. Aircraft Design; Cambridge University Press: Cambridge, UK, 2010. [Google Scholar]
- Raymer, D.P. Aircraft Design: A Conceptual Approach, 4th ed.; AIAA Education Series; AIAA: Washington, DC, USA, 2006. [Google Scholar]
- Roskam, J. Airplane Design: Part III—Layout Design of Cockpit, Fuselage, Wing and Empennage: Cutaways and Inboard Profiles; Roskam Aviation and Engineering Corporation: Lawrence, KS, USA, 1989. [Google Scholar]
- Torenbeek, E. Synthesis of Subsonic Airplane Design; Delft University Press: Delft, The Netherlands; Kluwer Academic Publishers: Dordrecht, The Netherlands, 1976. [Google Scholar]
- Glatt, C. WAATS—A Computer Program for Weights Analysis of Advanced Transportation Systems; NASA: Washington, DC, USA, 1974. [Google Scholar]
- Torenbeek, E. Optimum Wing Area, Aspect Ratio and Cruise Altitude for Long Range Transport Aircraft; Delft University of Technology: Delft, The Netherlands, 1994. [Google Scholar]
- Shevell, R.S. Fundamentals of Flight; Prentice–Hall: Lansing, MI, USA, 1983. [Google Scholar]
- St. John, R.S. The derivation and application of analytical–statistical weight prediction techniques. In Proceedings of the 28th Annual Conference, San Francisco, CA, USA, 12–16 May 1969; Society of Allied Weight Engineers, Inc.: Melbourne Beach, FL, USA, 1969. SAWE Paper No. 810. [Google Scholar]
- Dorbath, F. Large Civil Jet Transport (MTOM >40t) Statistical Mass Estimation. In DLR-LY/Airbus, LTH MA 401 12-01. 2011. Available online: https://www.researchgate.net/publication/312158007_Large_Civil_Jet_Transport_MTOM_40t_-_Statistical_Mass_Estimation (accessed on 10 February 2025).
- Elham, A.; van Tooren, M.J.L.; La Rocca, G. An Advanced Quasi-Analytical Weight Estimation Method for Airplane Lifting Surfaces. In Proceedings of the 71st International Conference on Mass Properties, Bavaria, Germany, 5–10 May 2012; Society of Allied Weight Engineers, Inc.: Melbourne Beach, FL, USA, 2012. SAWE Paper No. 3571. [Google Scholar]
- Howe, D. Aircraft Conceptual Design Synthesis; Professional Engineering Publishing Limited: London, UK; Bury St. Edmunds, UK, 2000. [Google Scholar]
- Kundu, A.; Price, M.; Riordan, M.D. Conceptual Aircraft Design an Industrial Approach; John Wiley & Sons: Hoboken, NJ, USA, 2019. [Google Scholar]
- Howe, D. The prediction of aircraft wing mass, Part G. J. Aerosp. Eng. 1996, 210, 135–145. [Google Scholar]
- Chiozzotto, G.P. Initial Weight Estimate of Advanced Transport Aircraft Concepts Considering Aeroelastic Effects. In Proceedings of the 55th AIAA Aerospace Sciences Meeting, AIAA SciTech Forum, Grapevine, TX, USA, 9—13 January 2017. [Google Scholar]
- Basgall, B.; Wanbo, L.; Truman, C.; Willem, A.A. Aircraft Design Weight Methods Comparison and Improvement. In Proceedings of the AIAA SciTech Forum, Orlando, FL, USA, 6–10 January 2020. [Google Scholar]
- Horvath, B.L.; Wells, D.P. Comparison of Aircraft Conceptual Design Weight Estimation Methods to the Flight Optimization System. In Proceedings of the 2018 AIAA Aerospace Sciences Meeting, Kissimmee, FL, USA, 8–12 January 2018. [Google Scholar]
- McCullers, L.A. Aircraft Configuration Optimization Including Optimized Flight Profiles, Multi-Disciplinary Analysis and Optimization Part 1; NASA CP-2327; NASA: Washington, DC, USA, 1984.
- Yan, M.J.; Elham, A. Designing high aspect ratio wings: A review of concepts and approaches. Prog. Aerosp. Sci. 2024, 145, 100983. [Google Scholar] [CrossRef]
- Jemitola, P.; Monterzino, G.; Fielding, J. Wing mass estimation algorithm for medium range box wing aircraft. Aeronaut. J. 2013, 117, 329–340. [Google Scholar] [CrossRef]
- Yan, M.J.; Elham, A. Initial weight estimation of twin-fuselage configuration in aircraft conceptual design. In Proceedings of the 80th SAWE International Conference on Mass Properties Engineering, Cocoa Beach, FL, USA, 10–23 October 2021. [Google Scholar]
- Moerland, E.; Pfeiffer, T.; Bohnke, D.; Jepsen, J.; Freund, S.; Liersch, C.M.; Chiozzotto, G.P.; Klein, C.; Scherer, J.; Hasan, Y.J.; et al. On the design of a strut-braced wing configuration in a collaborative design environment. In Proceedings of the 17th AIAA Aviation Technology, Integration, and Operations Conference, American Institute of Aeronautics and Astronautics, Denver, CO, USA, 5–9 June 2017. [Google Scholar] [CrossRef]
- Howe, D. DAeT 9317—Aircraft Mass Prediction, Department of Aerospace Engineering; Cranfield University: Cranfield, UK, 2009. [Google Scholar]
- Effing, T.; Stephan, R.; Stumpf, E. Influence of a Detailed Mass Estimation for a Wing with known Flight Shape in Conceptual Overall Aircraft Design; Deutsche Gesellschaft für Luft- und Raumfahrt-Lilienthal-Oberth e.V.: Bonn, Germany, 2023. [Google Scholar] [CrossRef]
- Castilla, R.A.; Lutz, F.; Jezegou, J.; Benard, E. Wing Structural Model for Overall Aircraft Design of Distributed Electric Propulsion General Aviation and Regional Aircraft. Aerospace 2022, 9, 5. [Google Scholar] [CrossRef]
- Scholz, D. Mass Estimation of Folding Wings. In Proceedings of the 83rd International Conference on Mass Properties Engineering, Online, 20–22 May 2024; Society of Allied Weight Engineers (SAWE): Melbourne Beach, FL, USA, 2024. [Google Scholar] [CrossRef]
- Torenbeek, E. Prediction of wing group weight for preliminary design. Aircr. Eng. Aerosp. Technol. 1971, 43, 16–21. [Google Scholar] [CrossRef]
- Torenbeek, E. Development and Application of a Comprehensive, Design-sensitive Weight Prediction Method for Wing Structures of Transport Category Aircraft; Report LR-693; Delft University of Technology: Delft, The Netherlands, 1992. [Google Scholar]
- Roeseler, W.G.; Sarh, B.; Kismarton, M.U. Composite structures: The first 100 years. In Proceedings of the 16th International Conference on Composite Materials, Kyoto, Japan, 9 July 2007; pp. 1–10. [Google Scholar]
- Gardiner, G. Resin-infused MS-21 wings and wingbox. High Perform. Compos. 2014, 22, 29. [Google Scholar]
- Pierce, R.S.; Falzon, B.G. Simulating Resin Infusion through Textile Reinforcement Materials for the Manufacture of Complex Composite Structures. Engineering 2017, 3, 596–607. [Google Scholar] [CrossRef]
- Nicolai, L.M.; Carichner, G. Fundamentals of Aircraft and Airship Design; AIAA Education: Reston, VA, USA, 2010. [Google Scholar]
- Dababneh, O. Multidisciplinary Design Optimisation for Aircraft Wing Mass Estimation. Ph.D. Thesis, Cranfield University, Cranfield, UK, 2016. [Google Scholar]
- PaceTxtgroup. Pacelab APD. Version 1.1. Aircraft Preliminary Design Software—APD Mass Report; PACE Aerospace & IT: Berlin, Germany, 2009. [Google Scholar]
- Seywald, K. Wing mass prediction considering quasi-static nonlinear aeroelasticity. In PEGASUS—AIAA Student Conference, VIII ed.; Poitiers: Davie, FL, USA, 2012. [Google Scholar]
- Macci, S.H. Semi-analytical method for predicting wing structural mass. In Proceedings of the 54th Annual Conference, Huntsville, AL, USA, 22–24 May 1995. SAWE Paper No. 2282. [Google Scholar]
- Anderson, W.; Udin, S. Wing mass formula for subsonic aircraft. J. Aircr. 1991, 29, 725–727. [Google Scholar]
- Bai, L.; Deng, Z.; Zhang, X.; Xia, M.; Wing, J.W.; Wing, A. Weight Estimation Method Based on Wing-box Beam Design. In SAWE Tech Fair, Virtual Conference; SAWE Paper No. 3709; Society of Allied Weight Engineers, Inc.: Melbourne Beach, FL, USA, 2020. [Google Scholar]
- Hurlimann, F.; Kelm, R.; Dugas, M.; Oltmann, K.; Kress, G. Mass estimation of transport aircraft wingbox structures with a CAD/CAE-based multidisciplinary process. Aerosp. Sci. Technol. 2010, 15, 323–333. [Google Scholar] [CrossRef]
- Masuko, T.; Imamura, T.; Rinoie, K. Conceptual design of biplane with high aspect ratio wings as next generation civil jet transport, SciTech AIAA 2016-1032. In Proceedings of the 54th AIAA Aerospace Sciences Meeting, San Diego, CA, USA, 4–8 January 2016. [Google Scholar]
- Ma, Y.; Karpuk, S.; Elham, A. Conceptual design and comparative study of strut-braced wing and twin-fuselage aircraft configurations with ultra-high aspect ratio wing. Aerosp. Sci. Technol. 2022, 121, 107395. [Google Scholar] [CrossRef]
- Ma, Y.; Yan, J.; Elham, A. Initial weight estimation of twin-fuselage configuration in aircraft conceptual design. Proc. Inst. Mech. Eng. Part G J. Aerosp. Eng. 2023, 23, 130–140. [Google Scholar] [CrossRef]
- booksite.elsevier.com. (n.d.). Butterworth-Heinemann—Civil Jet Aircraft Design—Aircraft Data File—Airbus Aircraft. Available online: https://booksite.elsevier.com/9780340741528/appendices/data-a/table-1/default.htm (accessed on 13 December 2023).
- Airplane Characteristics for Airport Planing. (n.d.). Available online: https://aircraft.airbus.com/sites/g/files/jlcbta126/files/2023-02/Airbus-Commercial-Aircraft-AC-A300-Dec-2009.pdf (accessed on 13 December 2023).
- A350 Aircraft Characteristics Airport and Maintenance Planning AC@A350. (n.d.). Available online: https://aircraft.airbus.com/sites/g/files/jlcbta126/files/2023-02/Airbus-Commercial-Aircraft-AC-A350-900-1000.pdf (accessed on 13 December 2023).
- A380 Aircraft Characteristics Airport and Maintenance Planning AC. (n.d.). Available online: https://aircraft.airbus.com/sites/g/files/jlcbta126/files/2023-12/ac_a380_1223.pdf (accessed on 13 December 2023).
- booksite.elsevier.com. (n.d.). Butterworth-Heinemann—Civil Jet Aircraft Design—Aircraft Data File—Boeing Aircraft. Available online: https://booksite.elsevier.com/9780340741528/appendices/data-a/table-2/table.htm (accessed on 13 December 2023).
- booksite.elsevier.com. (n.d.). Butterworth-Heinemann—Civil Jet Aircraft Design—Aircraft Data File—Boeing Aircraft. Available online: https://booksite.elsevier.com/9780340741528/appendices/data-a/table-3/table.htm (accessed on 13 December 2023).
- booksite.elsevier.com. (n.d.). Butterworth-Heinemann—Civil Jet Aircraft Design—Aircraft Data File—Boeing Aircraft. Available online: https://booksite.elsevier.com/9780340741528/appendices/data-a/table-4/table.htm (accessed on 13 December 2023).
- booksite.elsevier.com. (n.d.). Butterworth-Heinemann—Civil Jet Aircraft Design—Aircraft Data File—Douglas, Boeing and Lockheed Aircraft. Available online: https://booksite.elsevier.com/9780340741528/appendices/data-a/table-6/table.htm (accessed on 13 December 2023).
- 737 Airplane Characteristics for Airport Planning. 2020. Available online: https://www.boeing.com/resources/boeingdotcom/commercial/airports/acaps/737_RevA.pdf (accessed on 13 December 2023).
- Min, K.; Plumley, R.; Brooks, A. Boeing 747 AOE 4124 Spring 2007. 2007. Available online: https://archive.aoe.vt.edu/mason/Mason_f/B747PresS07.pdf?q=747 (accessed on 13 December 2023).
- 787 Airplane Characteristics for Airport Planning. 2018. Available online: https://www.boeing.com/resources/boeingdotcom/commercial/airports/acaps/787.pdf (accessed on 13 December 2023).
- 777-200LR/-300ER/-Freighter Airplane Characteristics for Airport Planning. 2022. Available online: https://www.boeing.com/content/dam/boeing/boeingdotcom/commercial/airports/acaps/777_2_2er_3.pdf (accessed on 10 February 2025).


Disclaimer/Publisher’s Note: The statements, opinions and data contained in all publications are solely those of the individual author(s) and contributor(s) and not of MDPI and/or the editor(s). MDPI and/or the editor(s) disclaim responsibility for any injury to people or property resulting from any ideas, methods, instructions or products referred to in the content. |
© 2025 by the authors. Licensee MDPI, Basel, Switzerland. This article is an open access article distributed under the terms and conditions of the Creative Commons Attribution (CC BY) license (https://creativecommons.org/licenses/by/4.0/).