Author Contributions
Conceptualization, G.S. and M.P. (Martin Propst); methodology, M.P. (Martin Propst) and G.S.; numerical simulations, M.G., J.P. and F.W.; experimental validation, G.S., M.P. (Marco Portolani), J.S.-K. and T.H.; formal analysis, M.G. and G.S.; data curation, G.S.; writing—original draft preparation, G.S.; writing—review and editing, M.P. (Martin Propst), J.P. and C.B.; visualization, G.S. and M.G.; supervision, D.B., D.P., A.F., M.T. and C.B.; project management, T.H. and J.P.; project coordination, C.B.; funding acquisition, C.B. All authors have read and agreed to the published version of the manuscript.
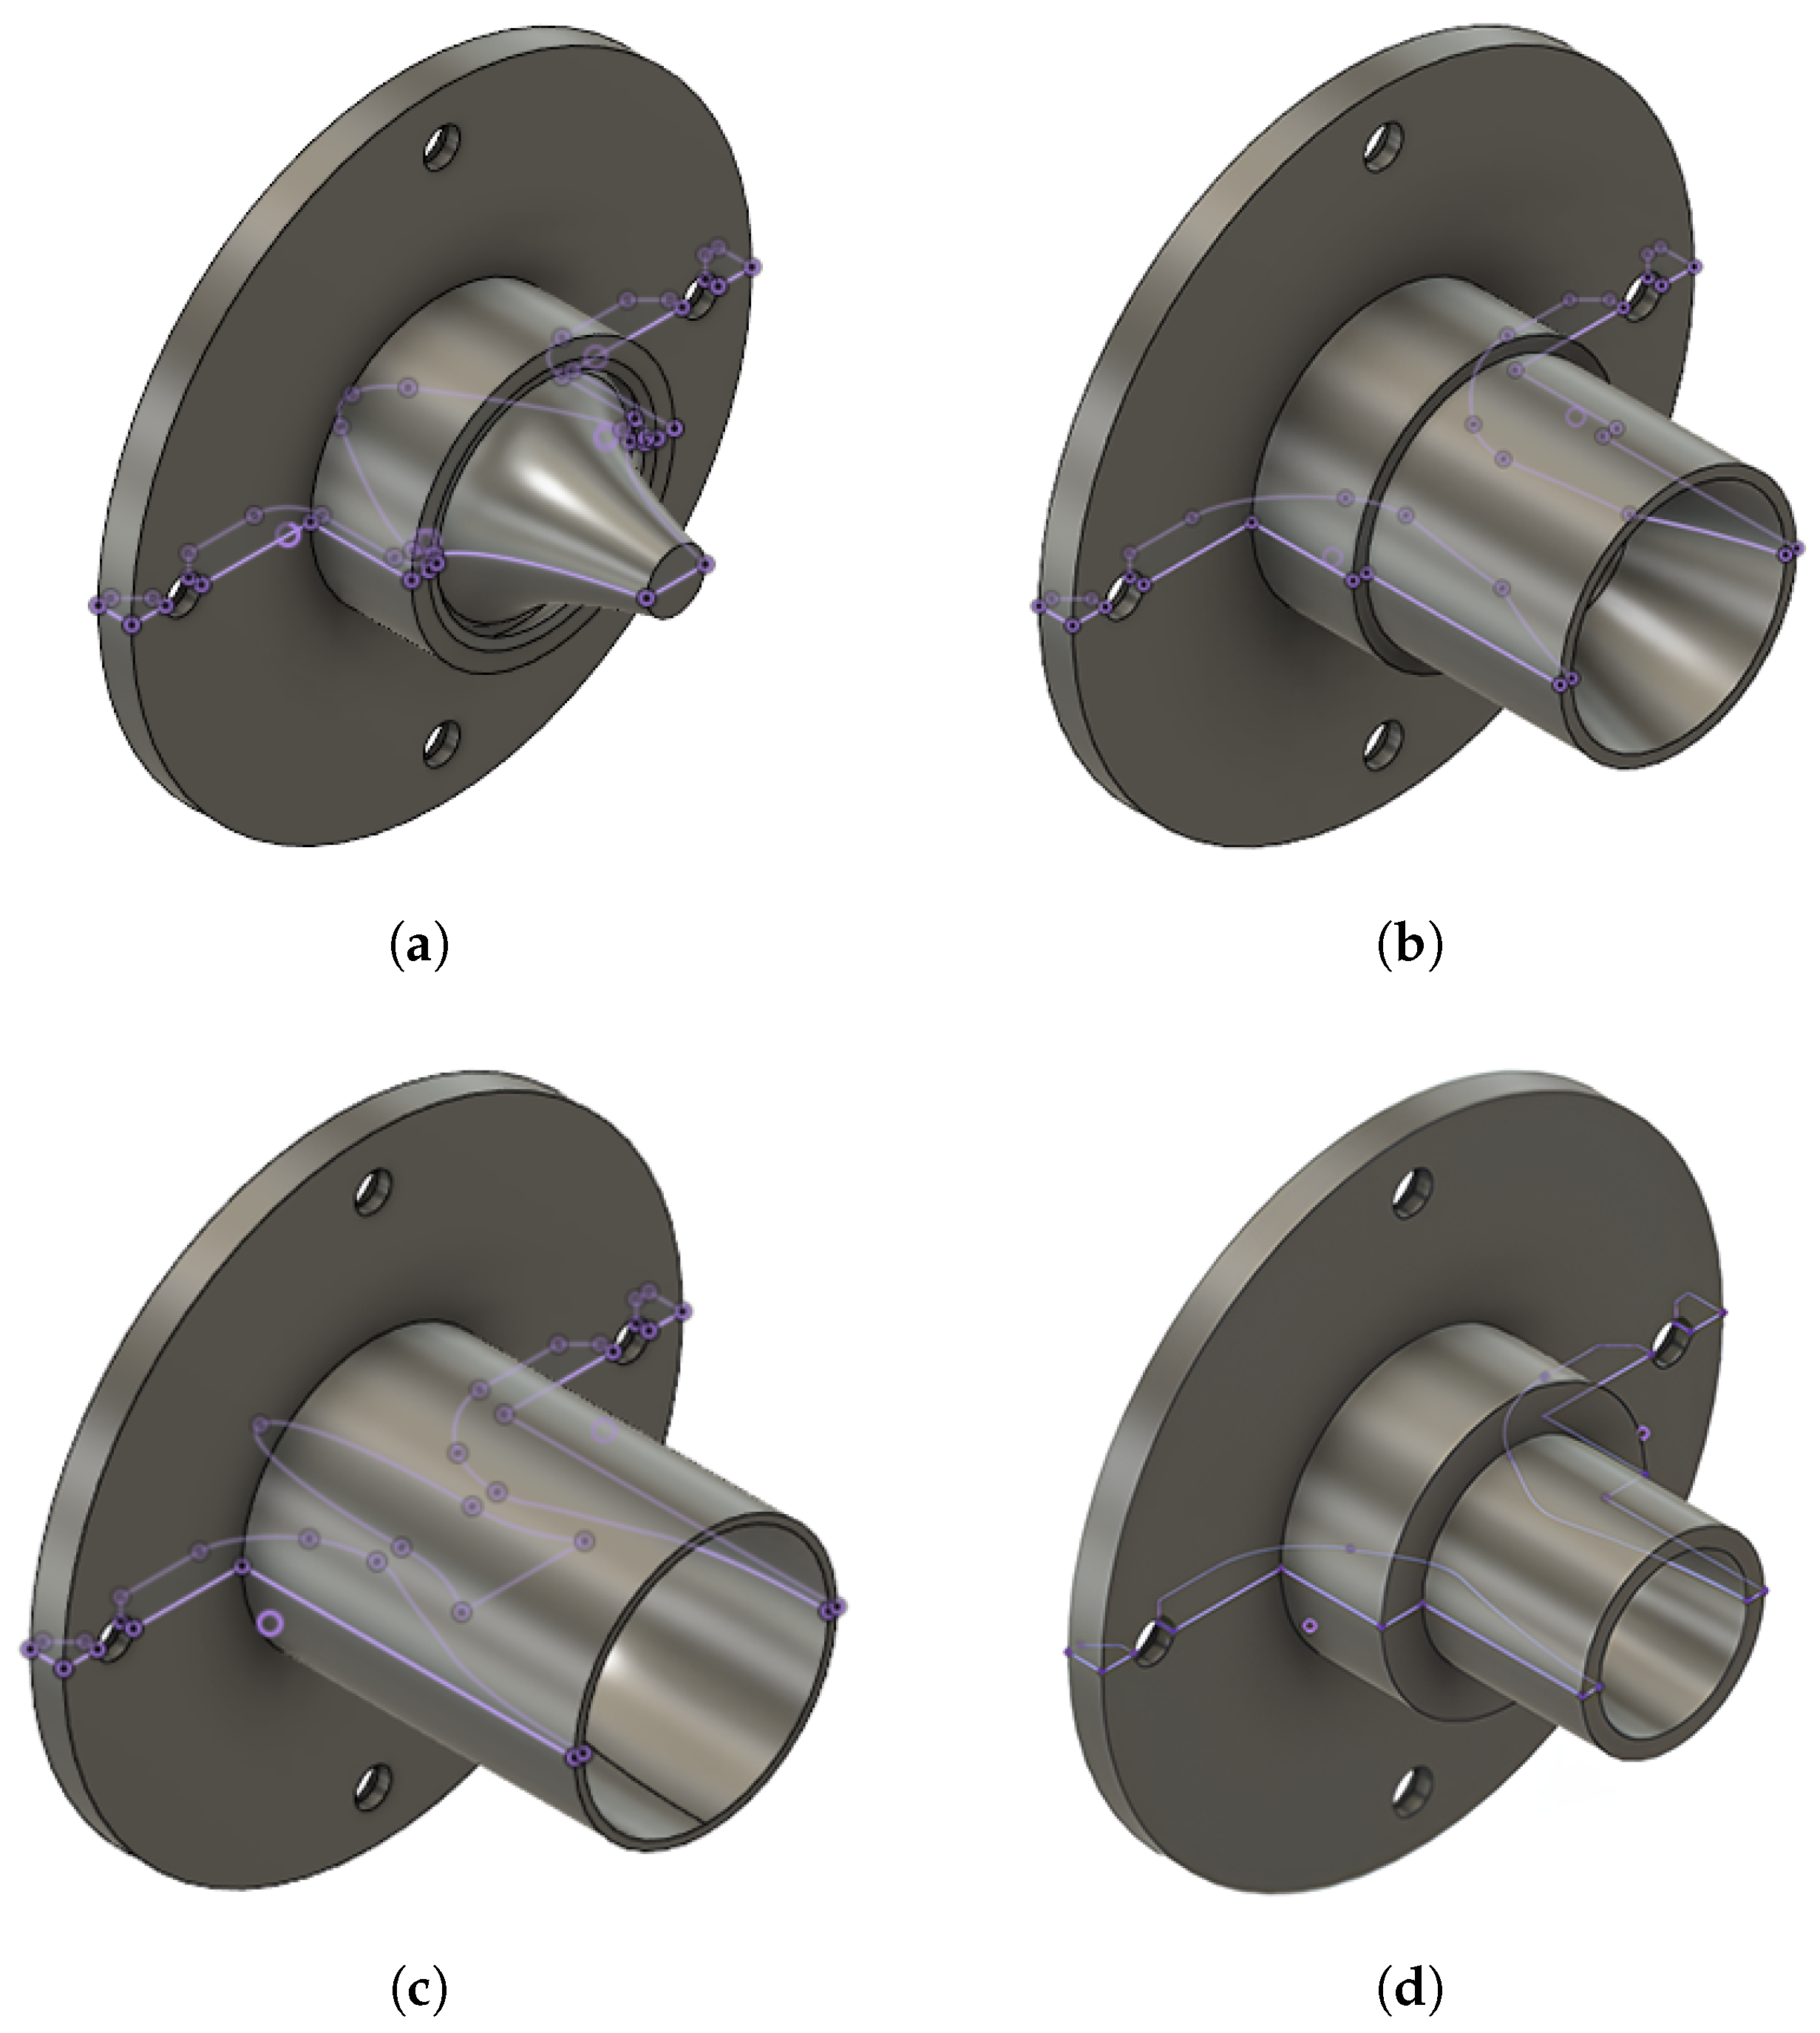
Figure 1.
CAD models of advanced and conventional nozzles: (a) aerospike nozzle (AN), (b) dual-bell (DB) nozzle, (c) expansion-deflection (ED) nozzle, and (d) Rao-bell parabolic nozzle (RAO-bell).
Figure 1.
CAD models of advanced and conventional nozzles: (a) aerospike nozzle (AN), (b) dual-bell (DB) nozzle, (c) expansion-deflection (ED) nozzle, and (d) Rao-bell parabolic nozzle (RAO-bell).
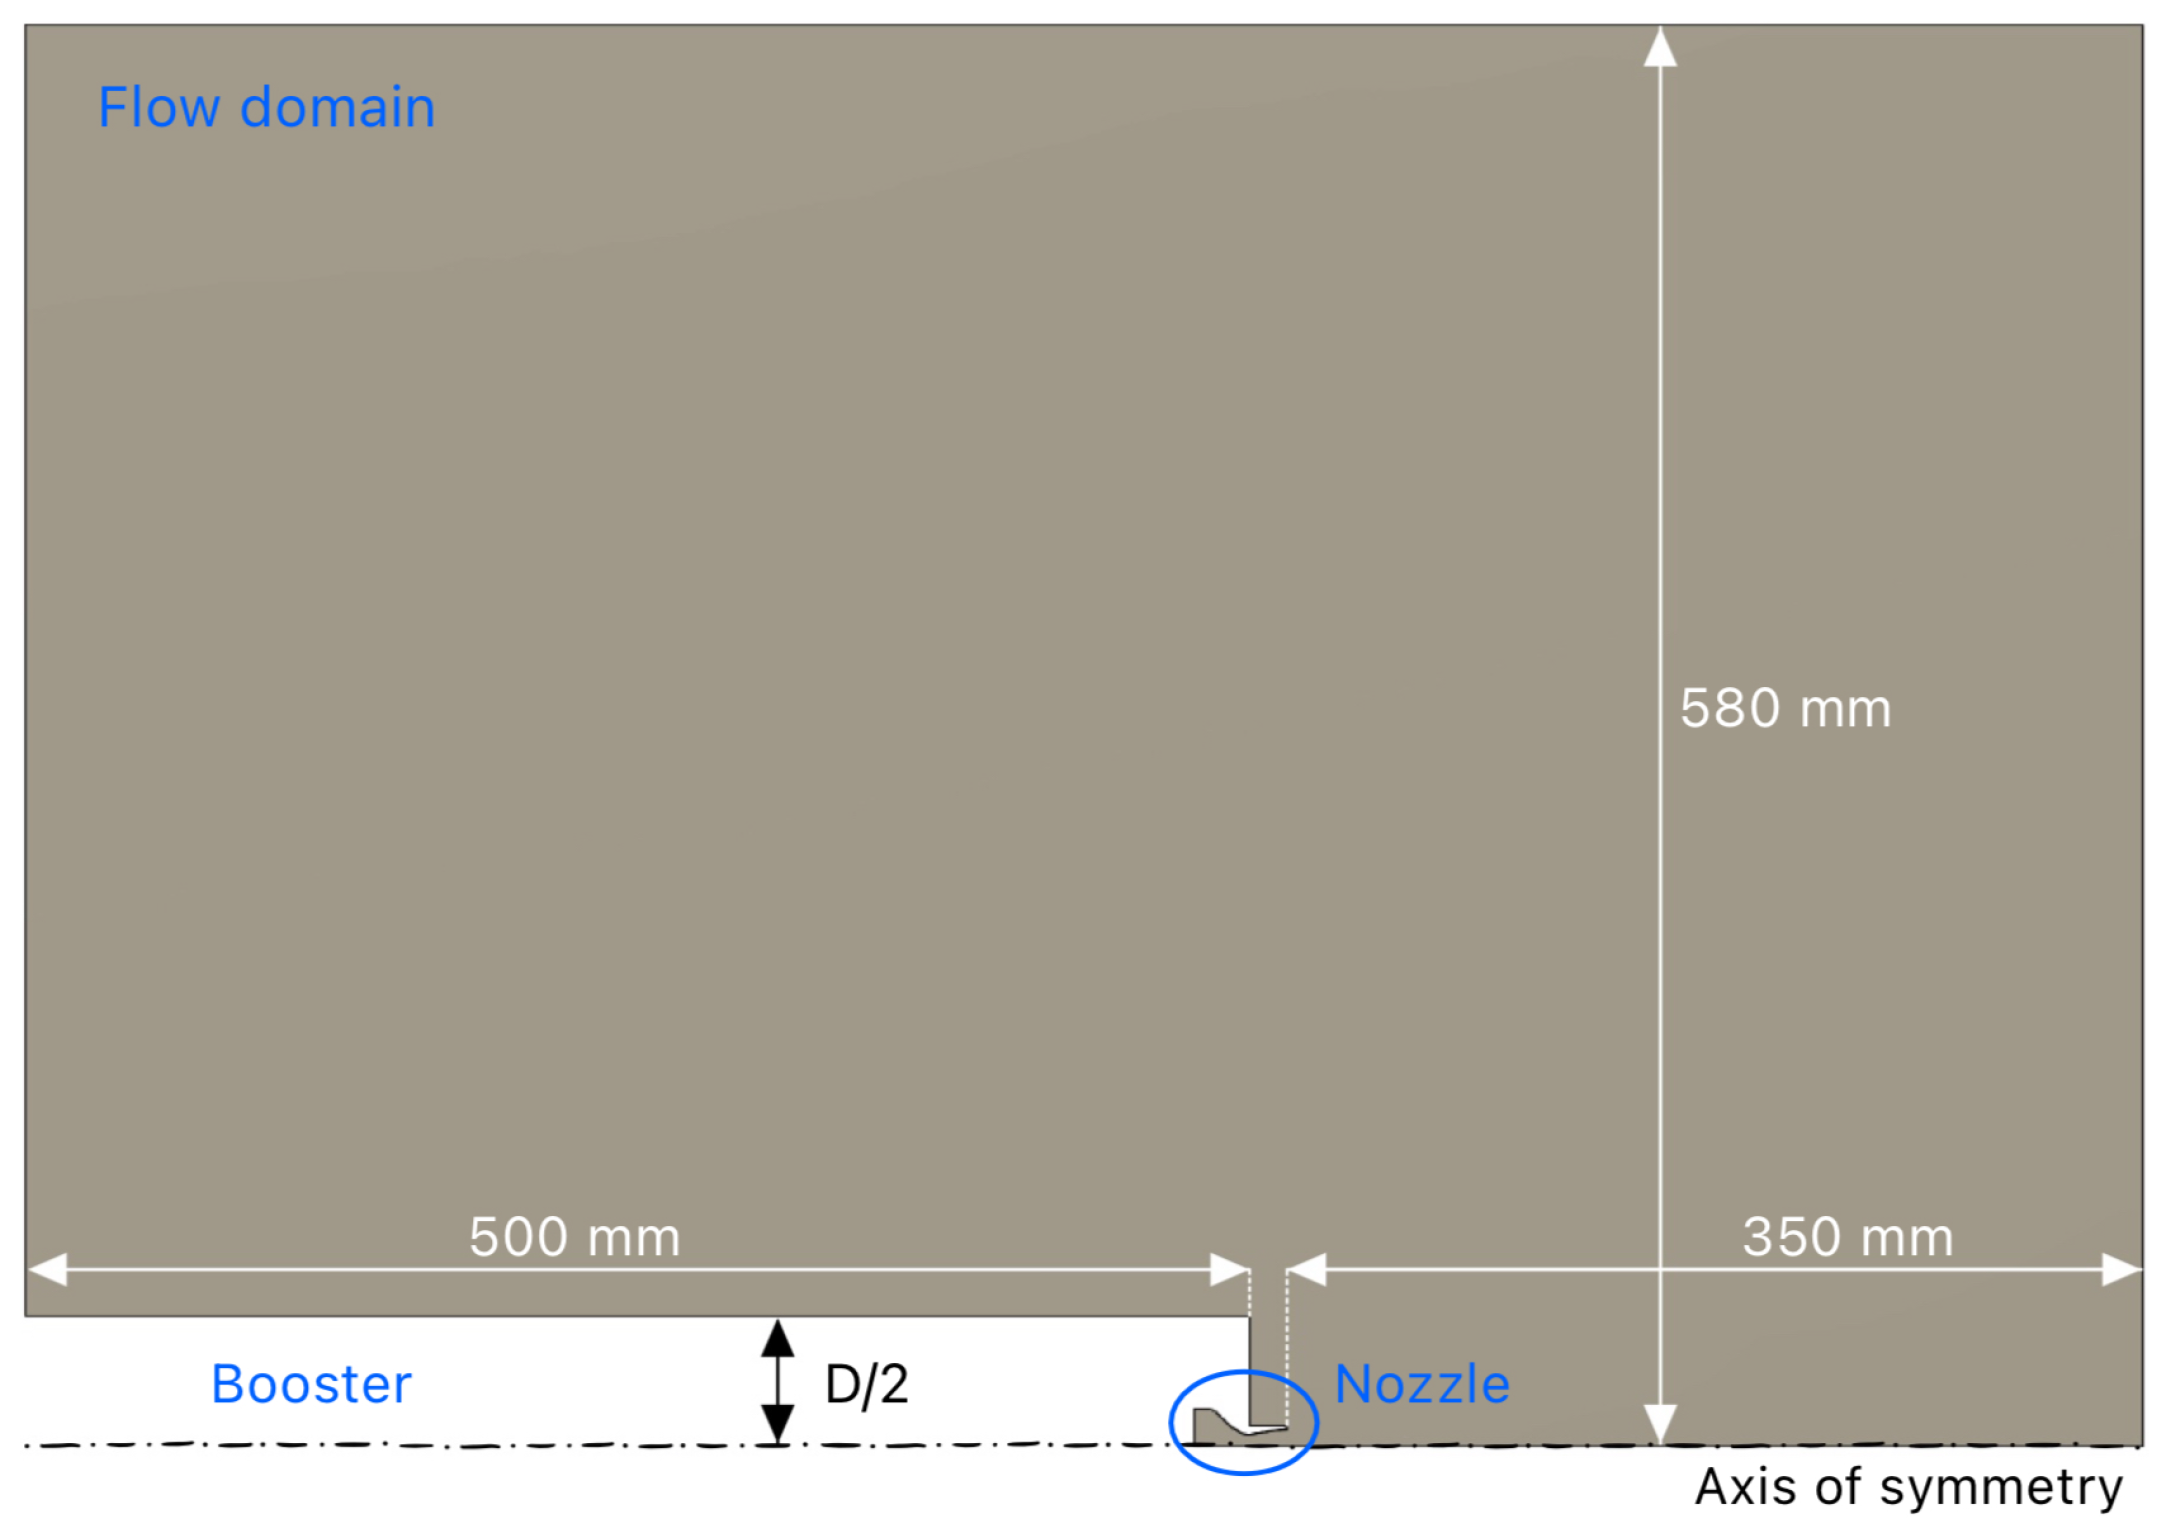
Figure 2.
Geometrical domain of the flow-field for counter/retro-flow cases.
Figure 2.
Geometrical domain of the flow-field for counter/retro-flow cases.
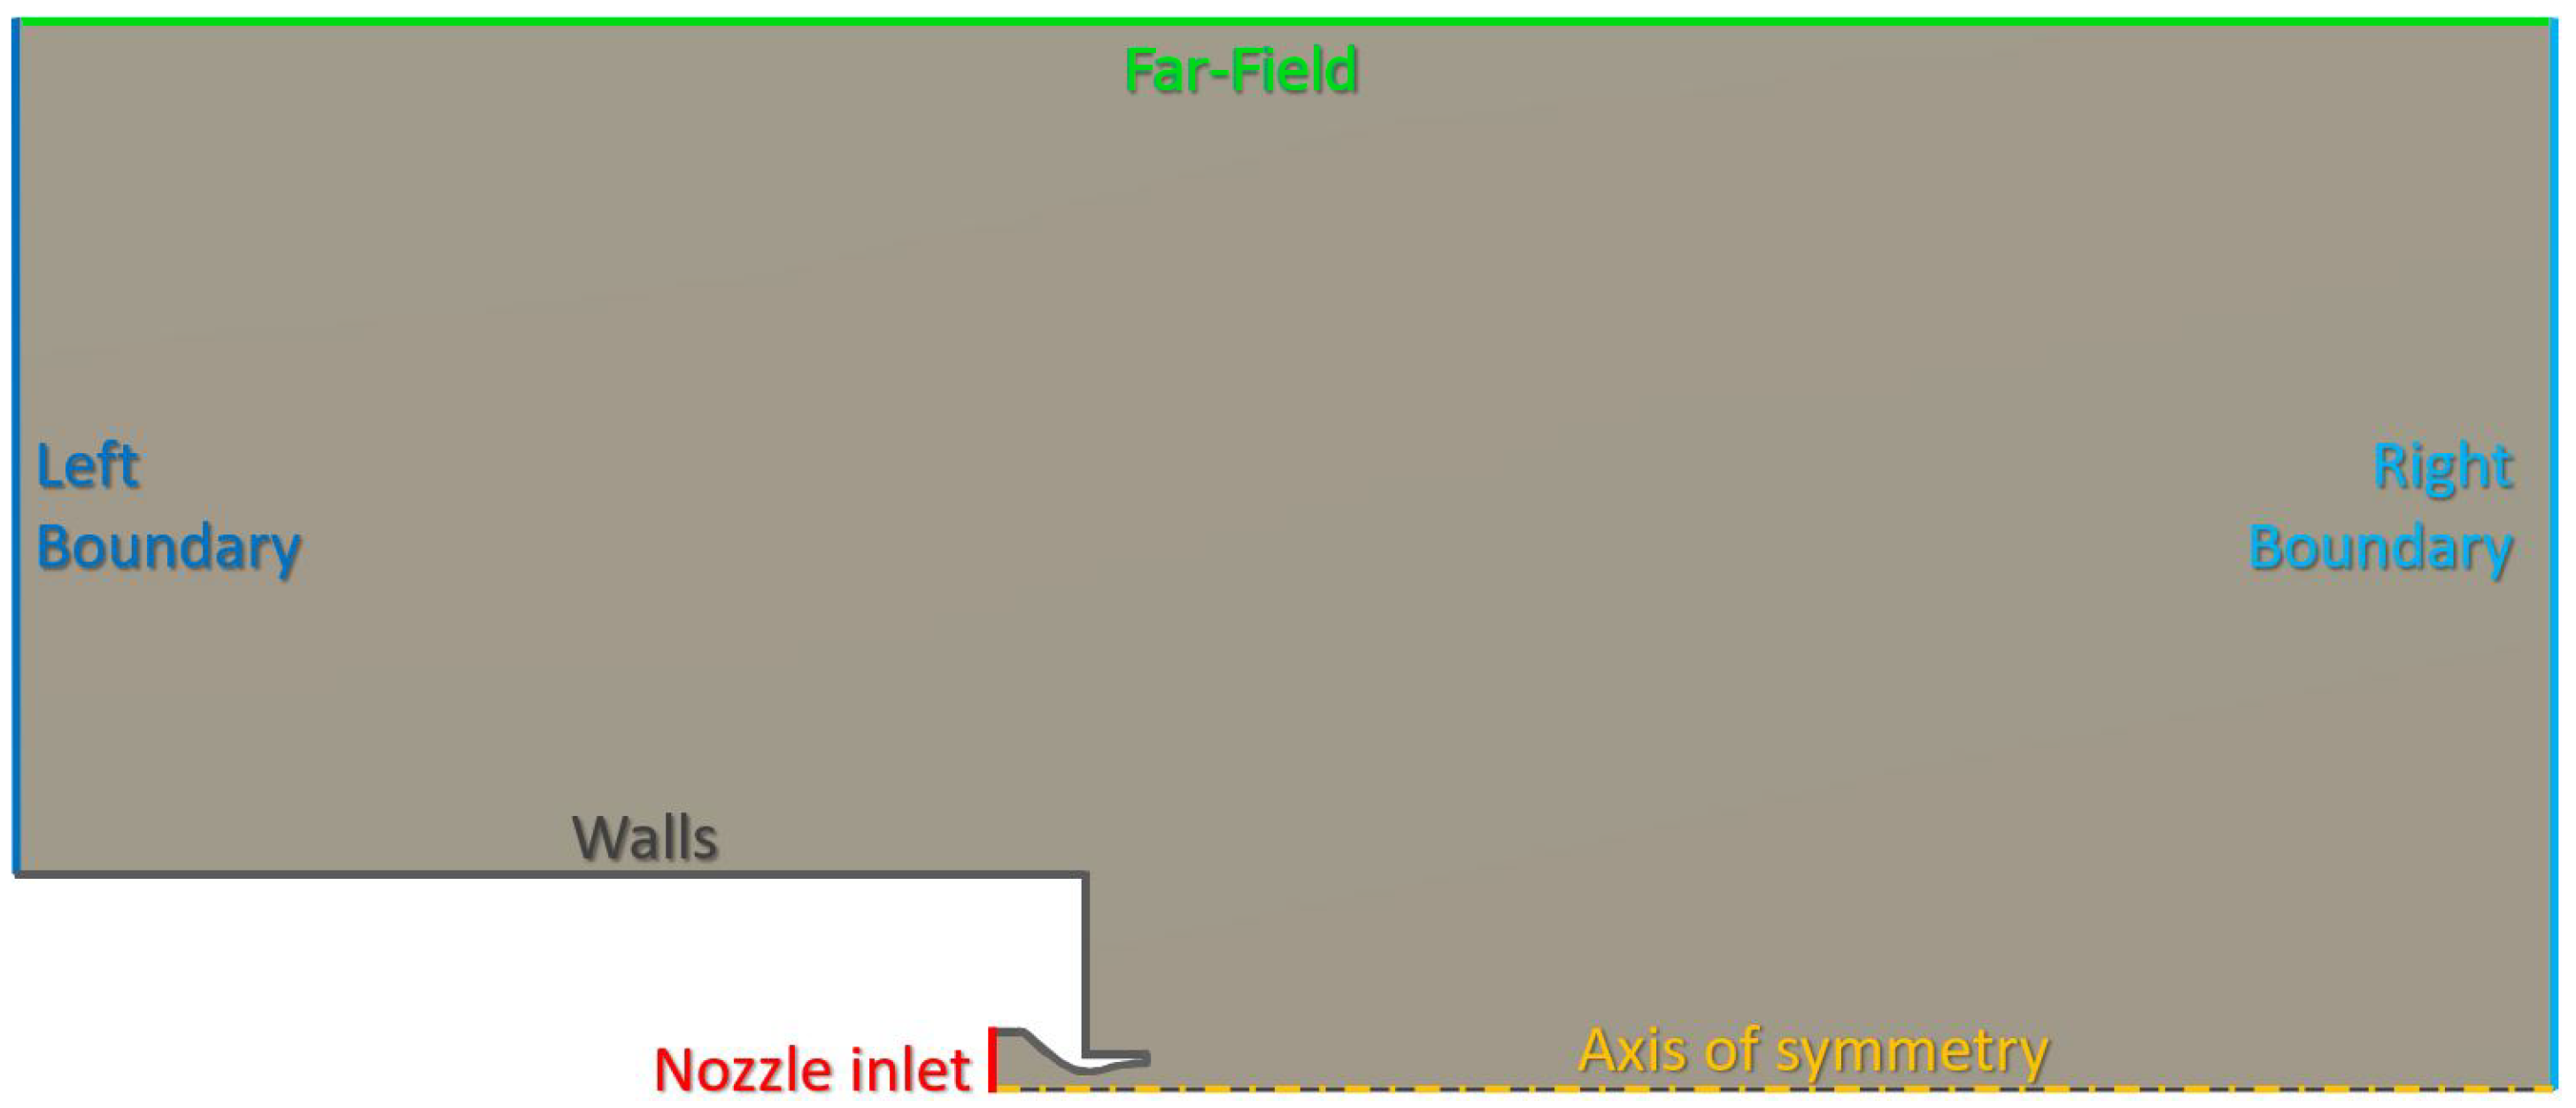
Figure 3.
Boundary regions in the simulations.
Figure 3.
Boundary regions in the simulations.
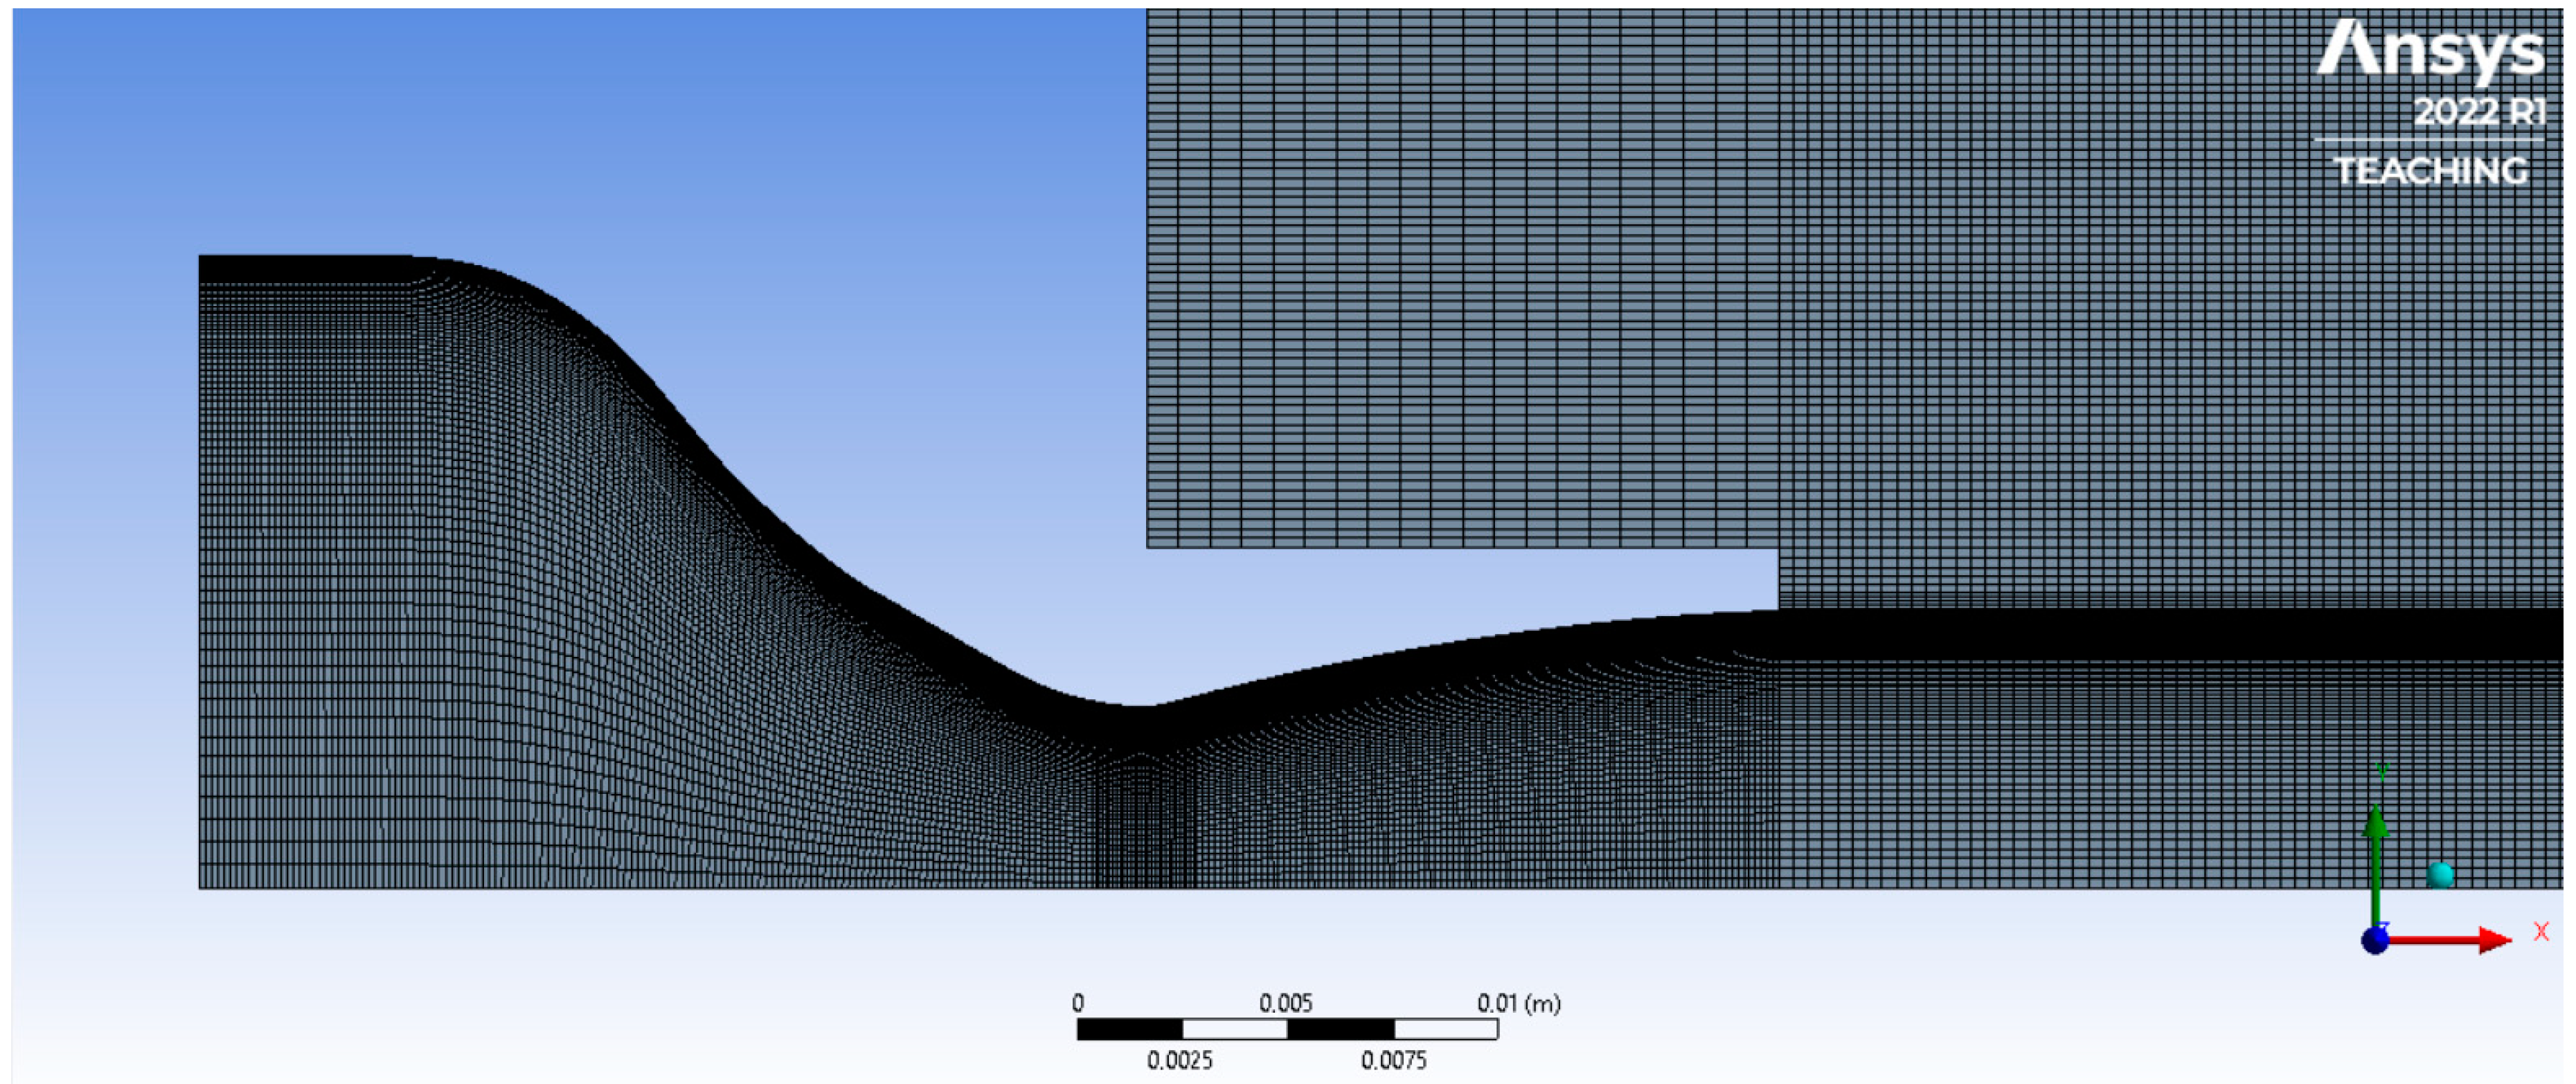
Figure 4.
Discretisation grids (RAO-bell, PRF case) after mesh refinement.
Figure 4.
Discretisation grids (RAO-bell, PRF case) after mesh refinement.
Figure 5.
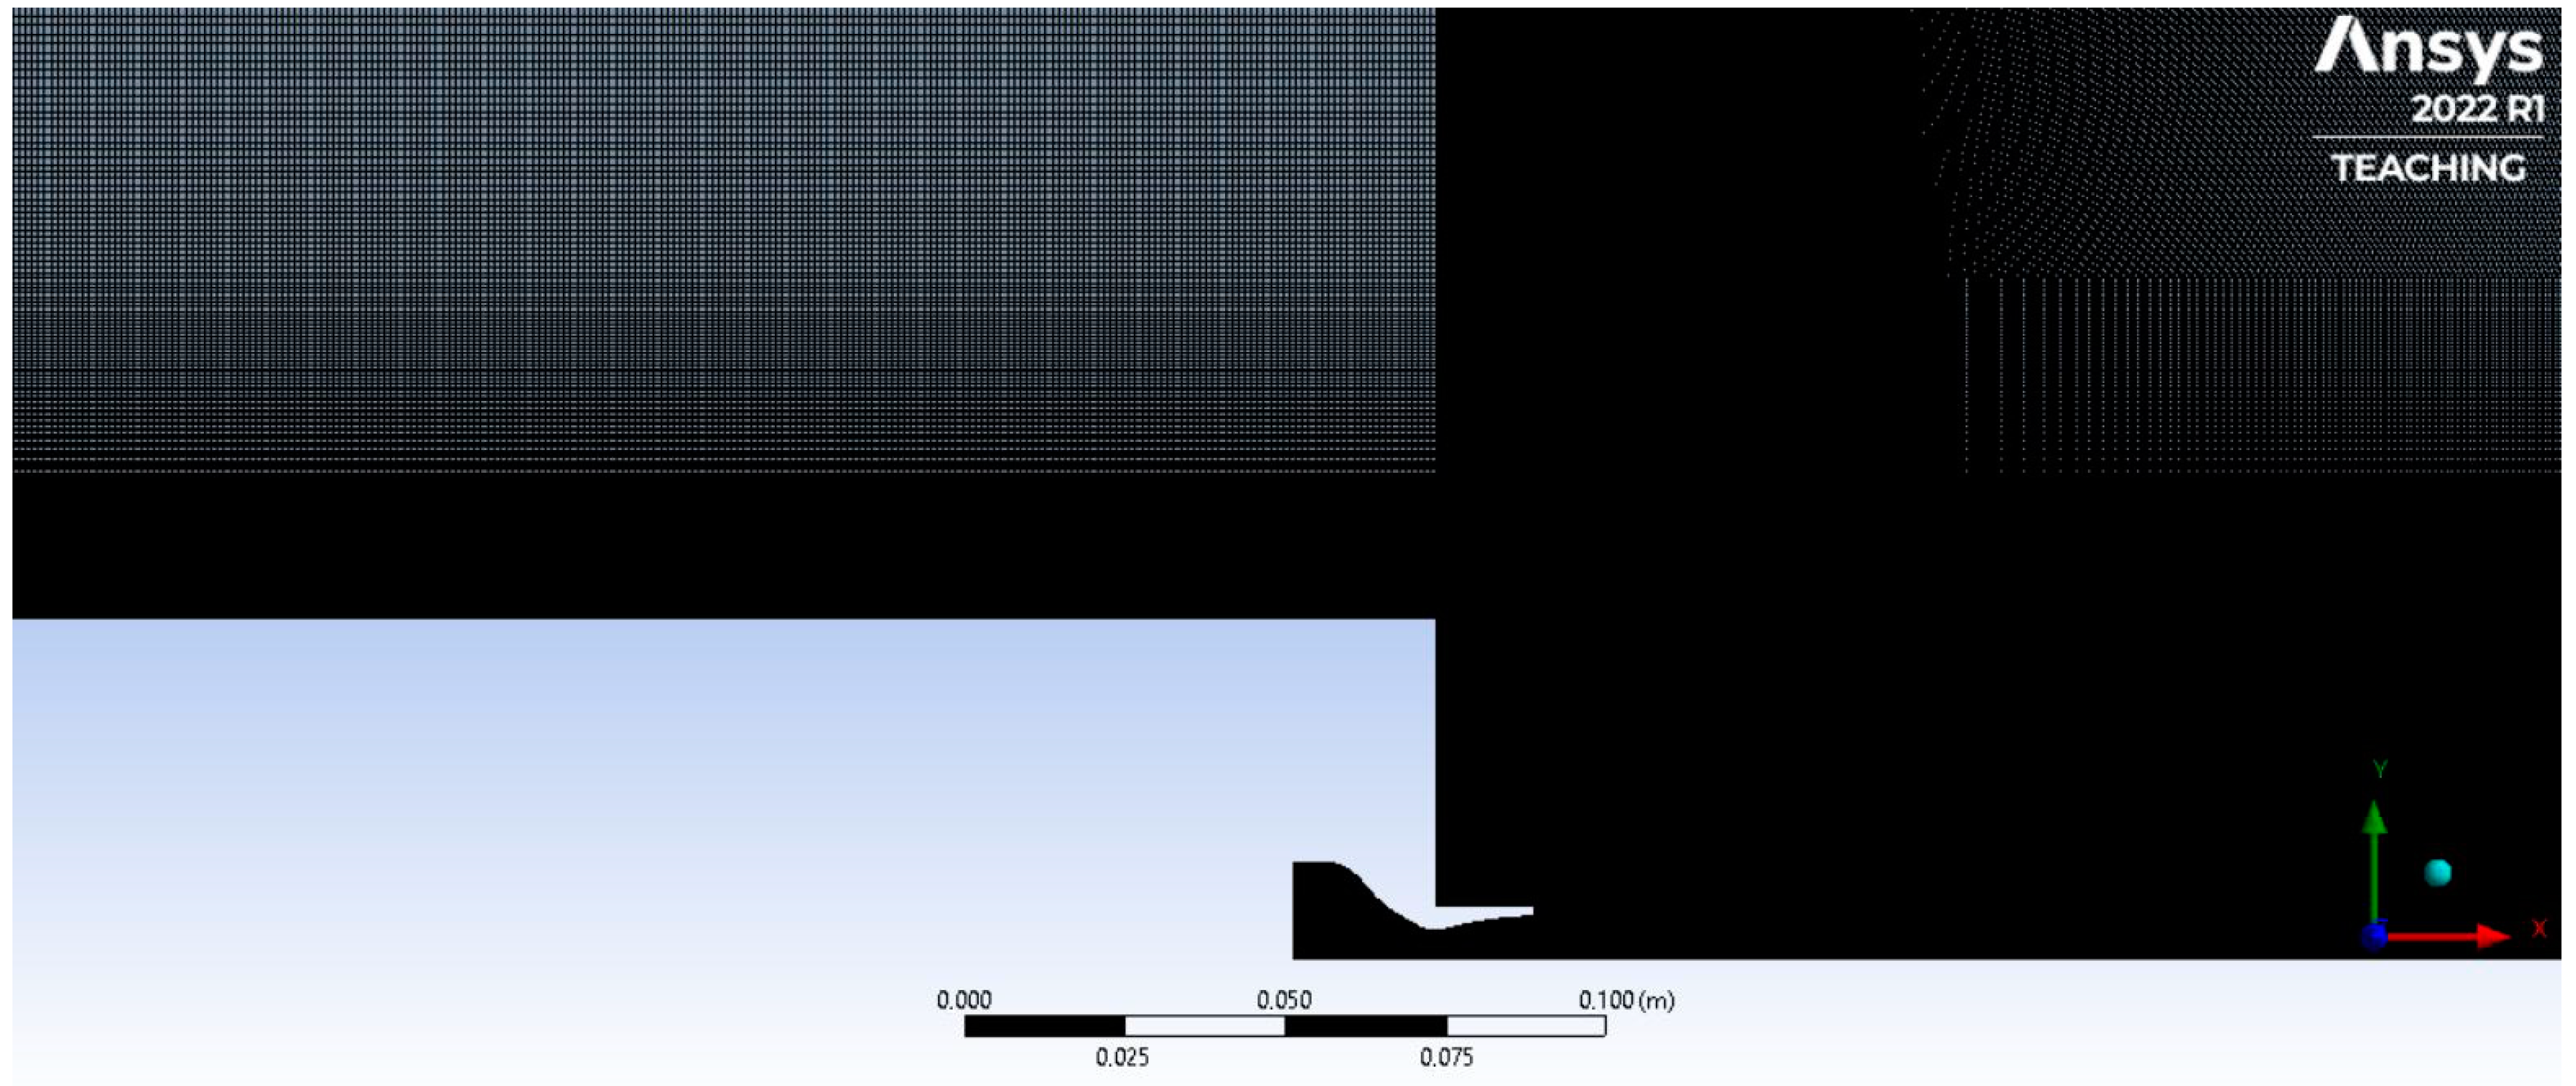
Discretisation grids (RAO-bell, RFL case) after mesh refinement.
Figure 5.
Discretisation grids (RAO-bell, RFL case) after mesh refinement.
Figure 6.
Flow visualisation (Mach contours) for AN at design point ().
Figure 6.
Flow visualisation (Mach contours) for AN at design point ().
Figure 7.
Flow visualisation (Mach contours) for AN at SLS ().
Figure 7.
Flow visualisation (Mach contours) for AN at SLS ().
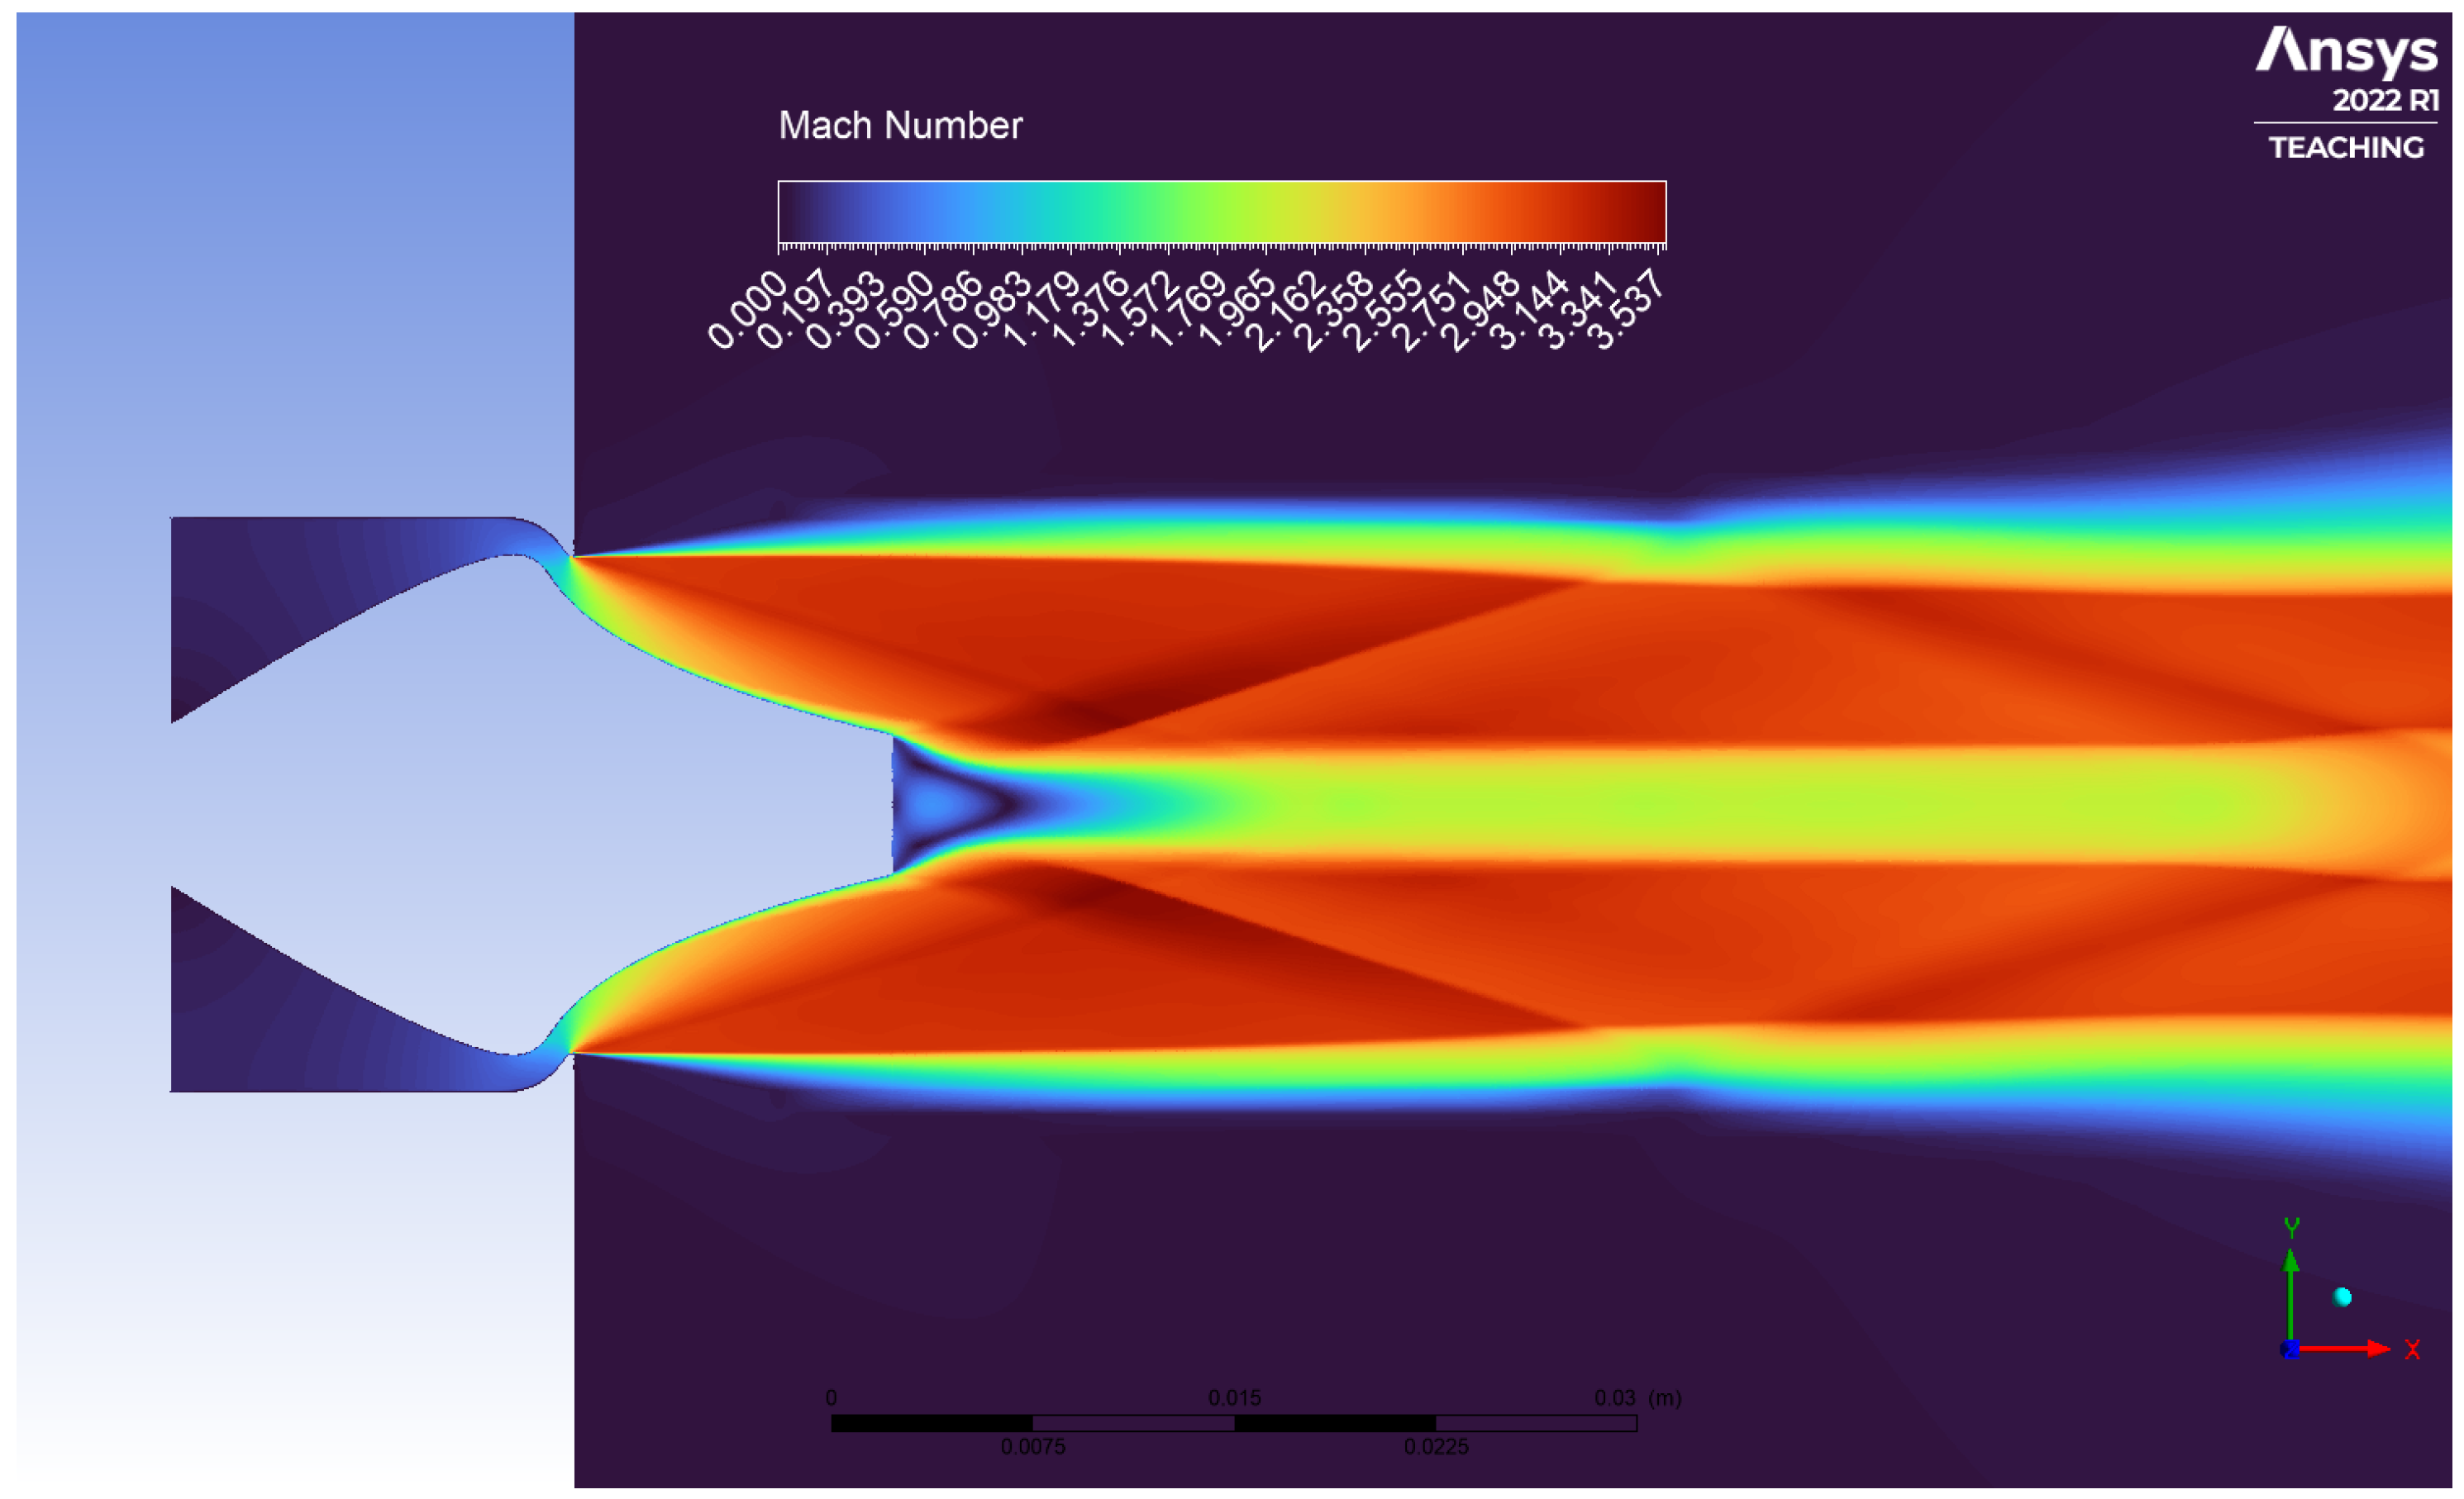
Figure 8.
Flow visualisation (Mach contours) for DB nozzle at design point ().
Figure 8.
Flow visualisation (Mach contours) for DB nozzle at design point ().
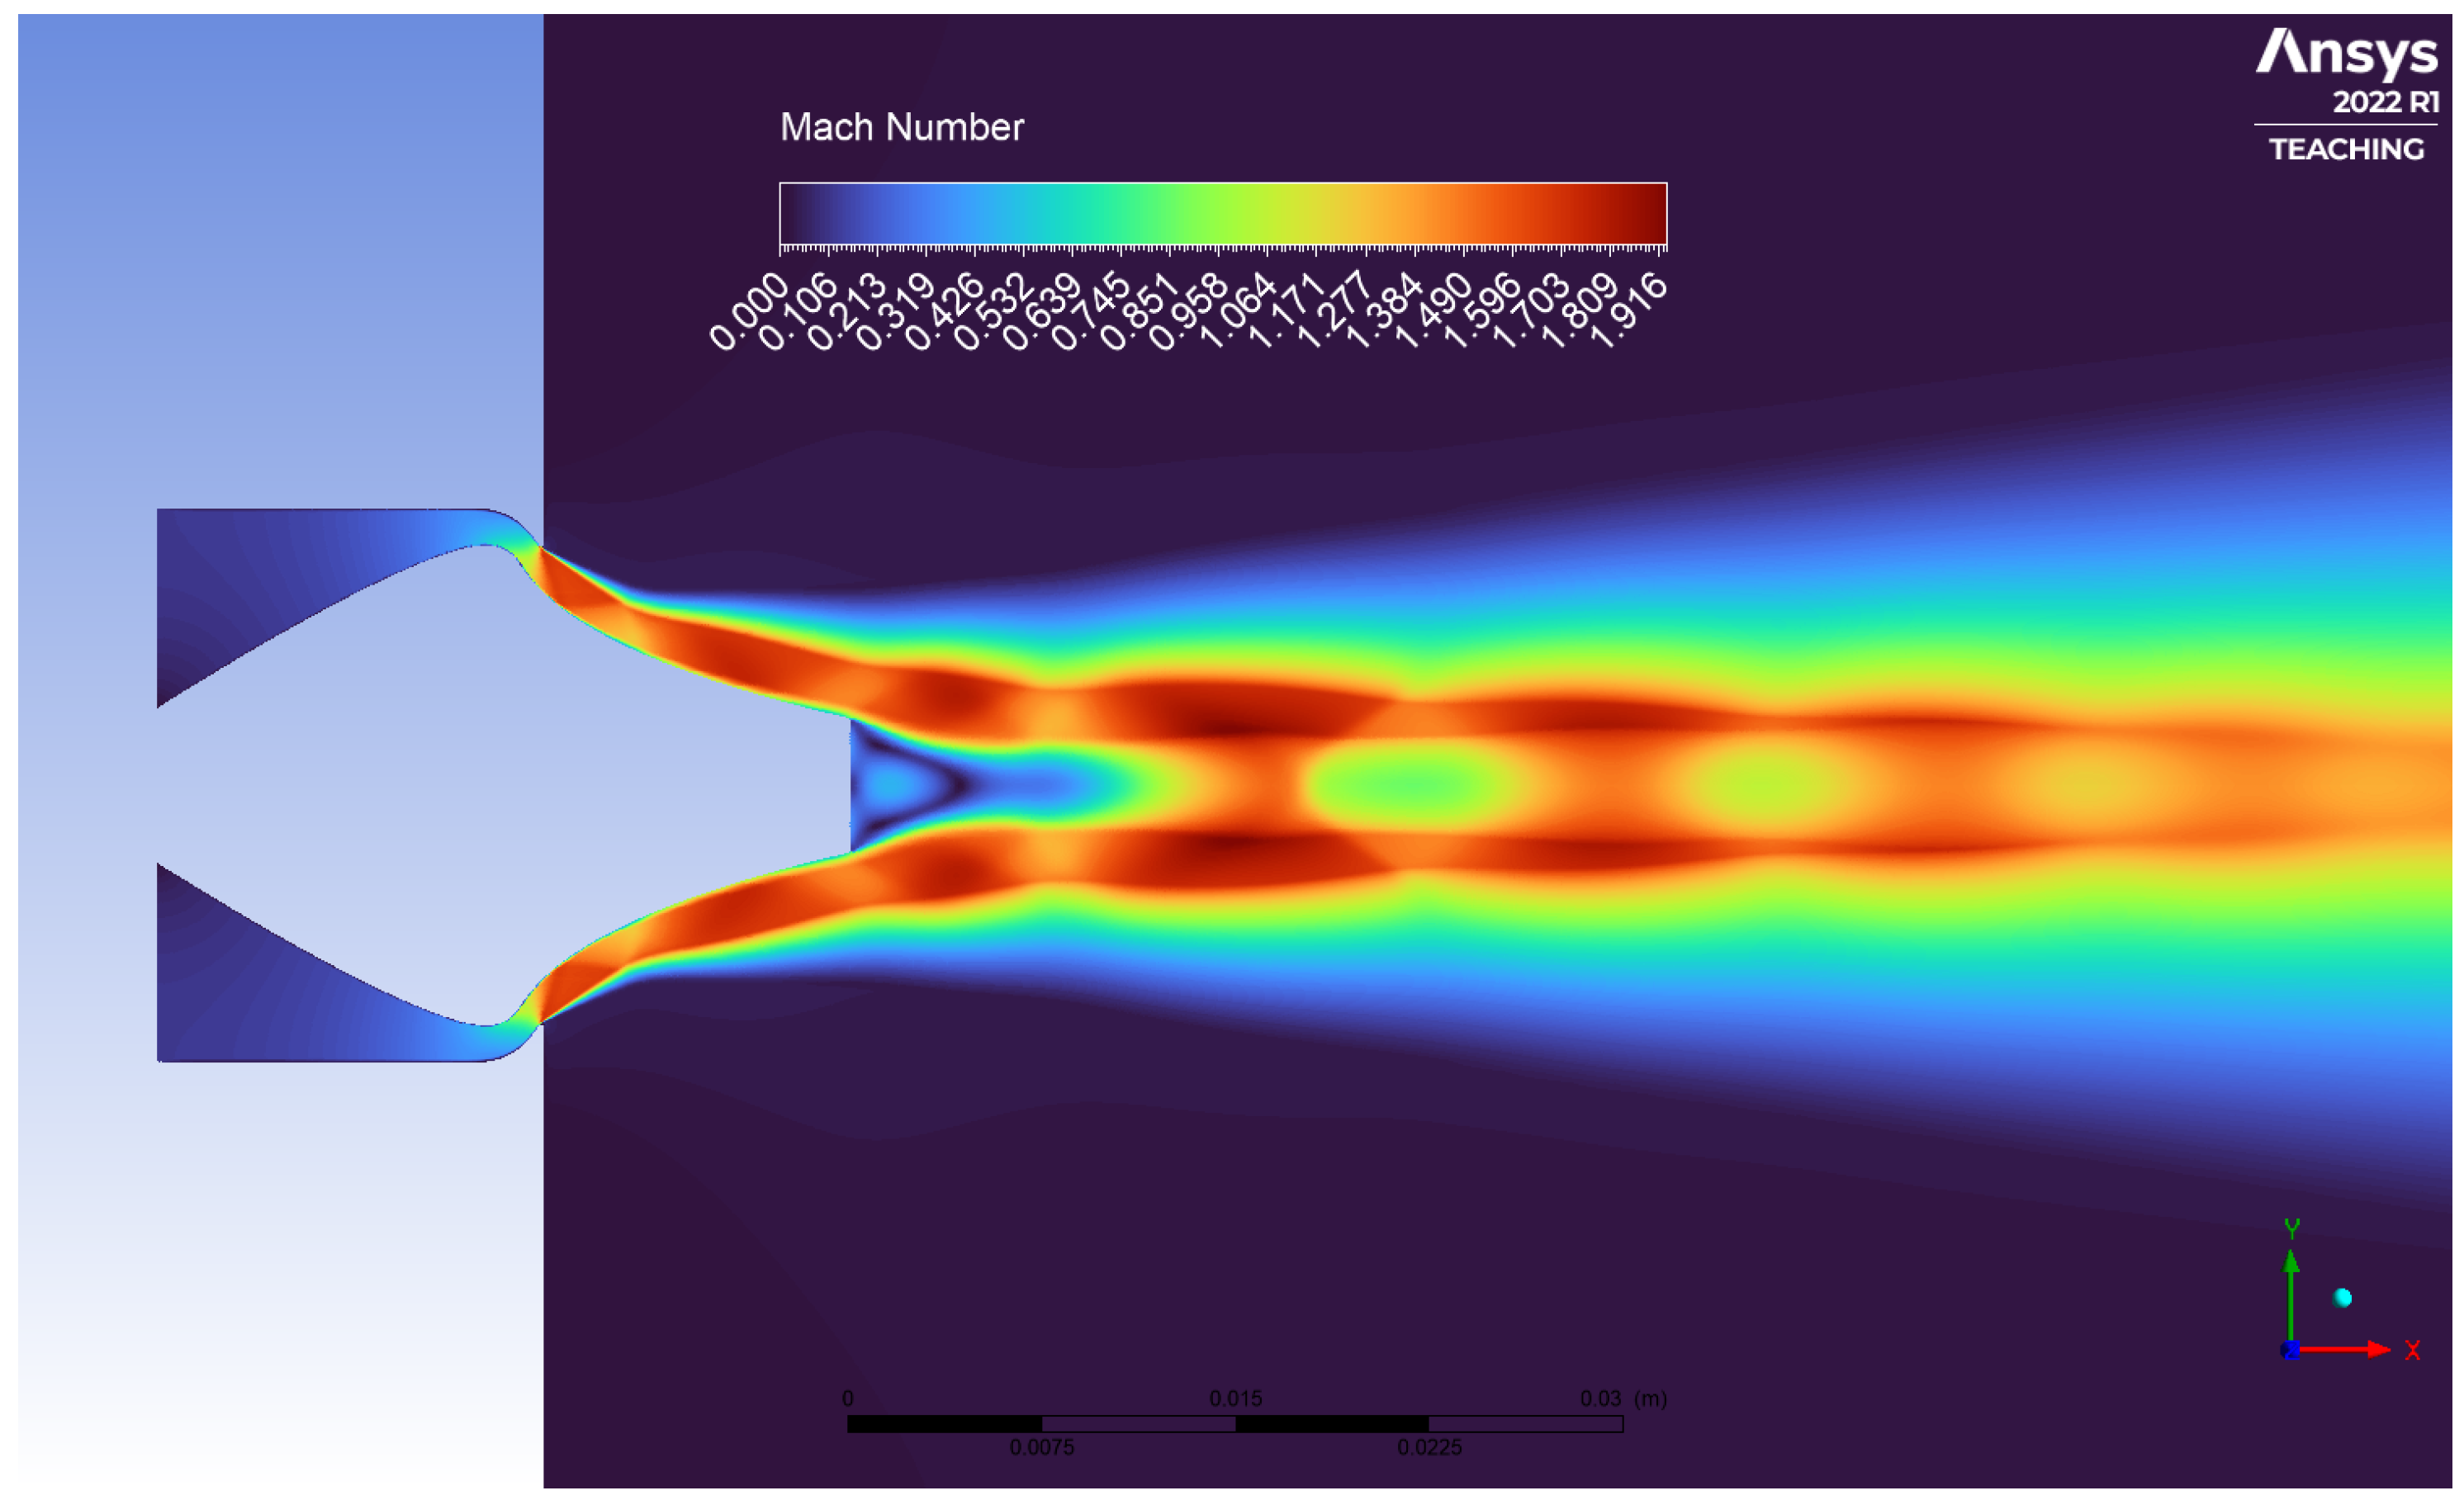
Figure 9.
Flow visualisation (Mach contours) for DB nozzle at SLS ().
Figure 9.
Flow visualisation (Mach contours) for DB nozzle at SLS ().
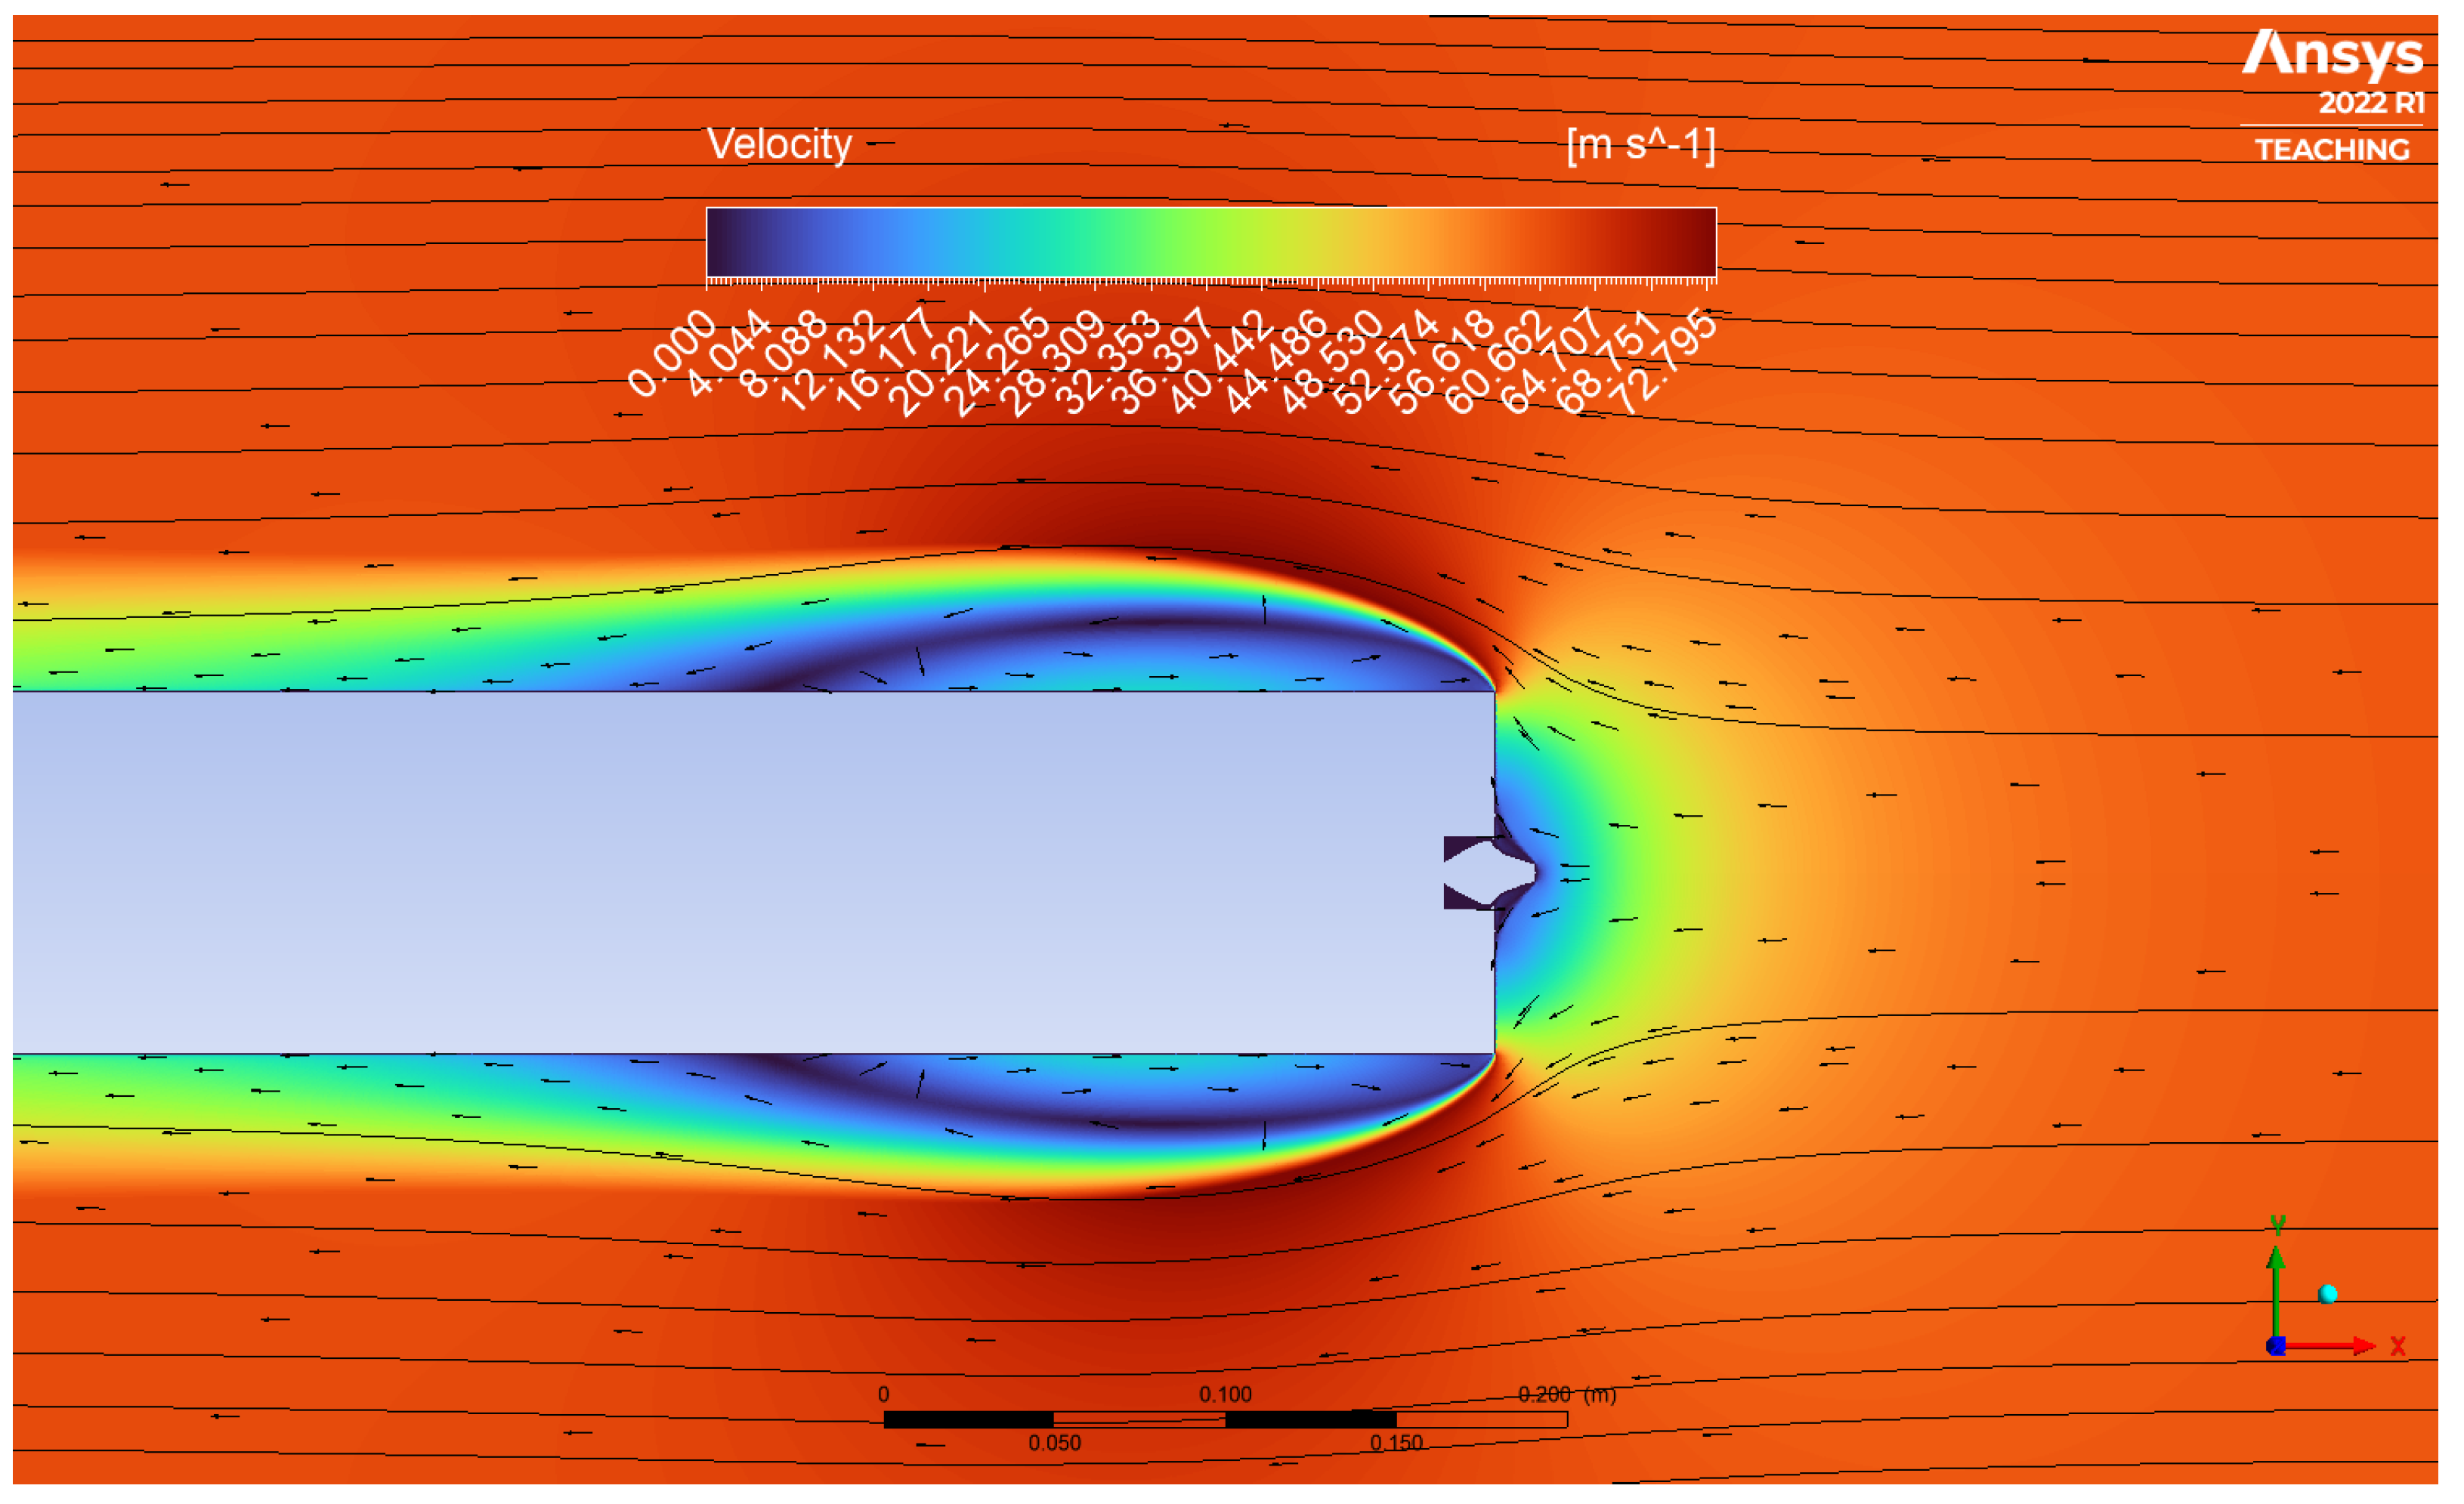
Figure 10.
Flow visualisation (velocity contour with streamlines) for AN in CFL ( m/s).
Figure 10.
Flow visualisation (velocity contour with streamlines) for AN in CFL ( m/s).
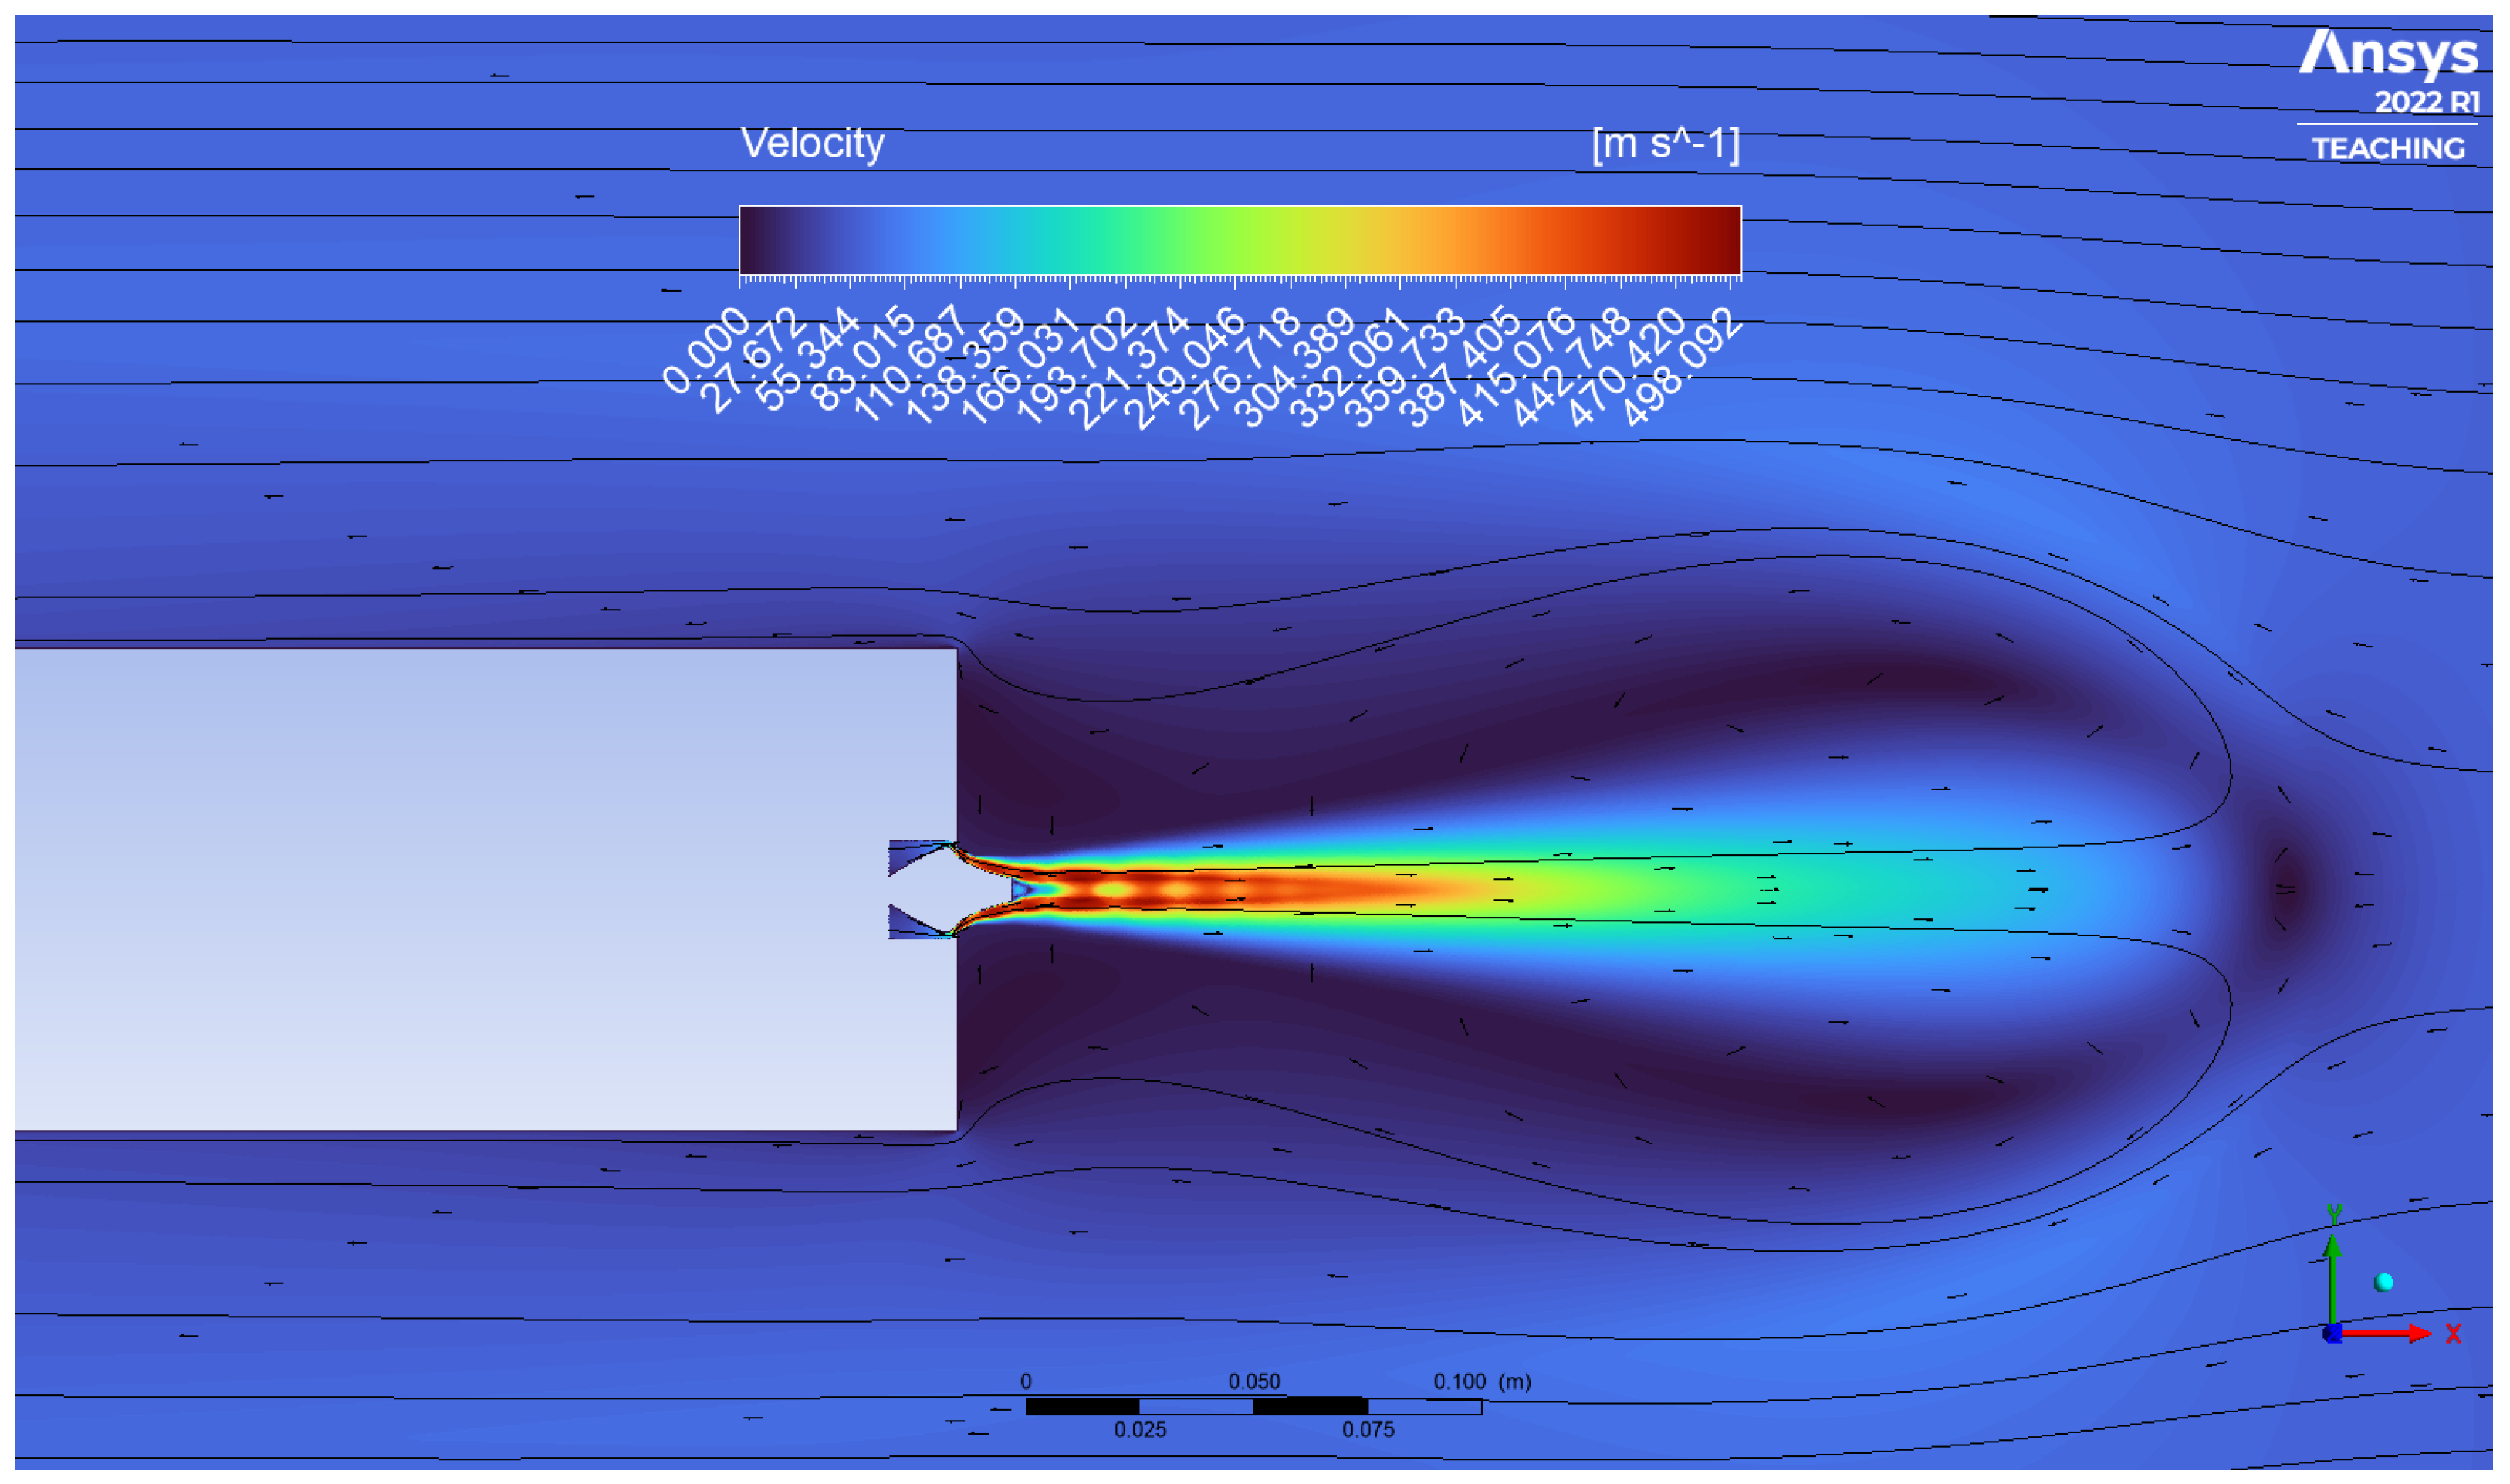
Figure 11.
Flow visualisation (velocity contour with streamlines) for AN in RFL ( m/s).
Figure 11.
Flow visualisation (velocity contour with streamlines) for AN in RFL ( m/s).
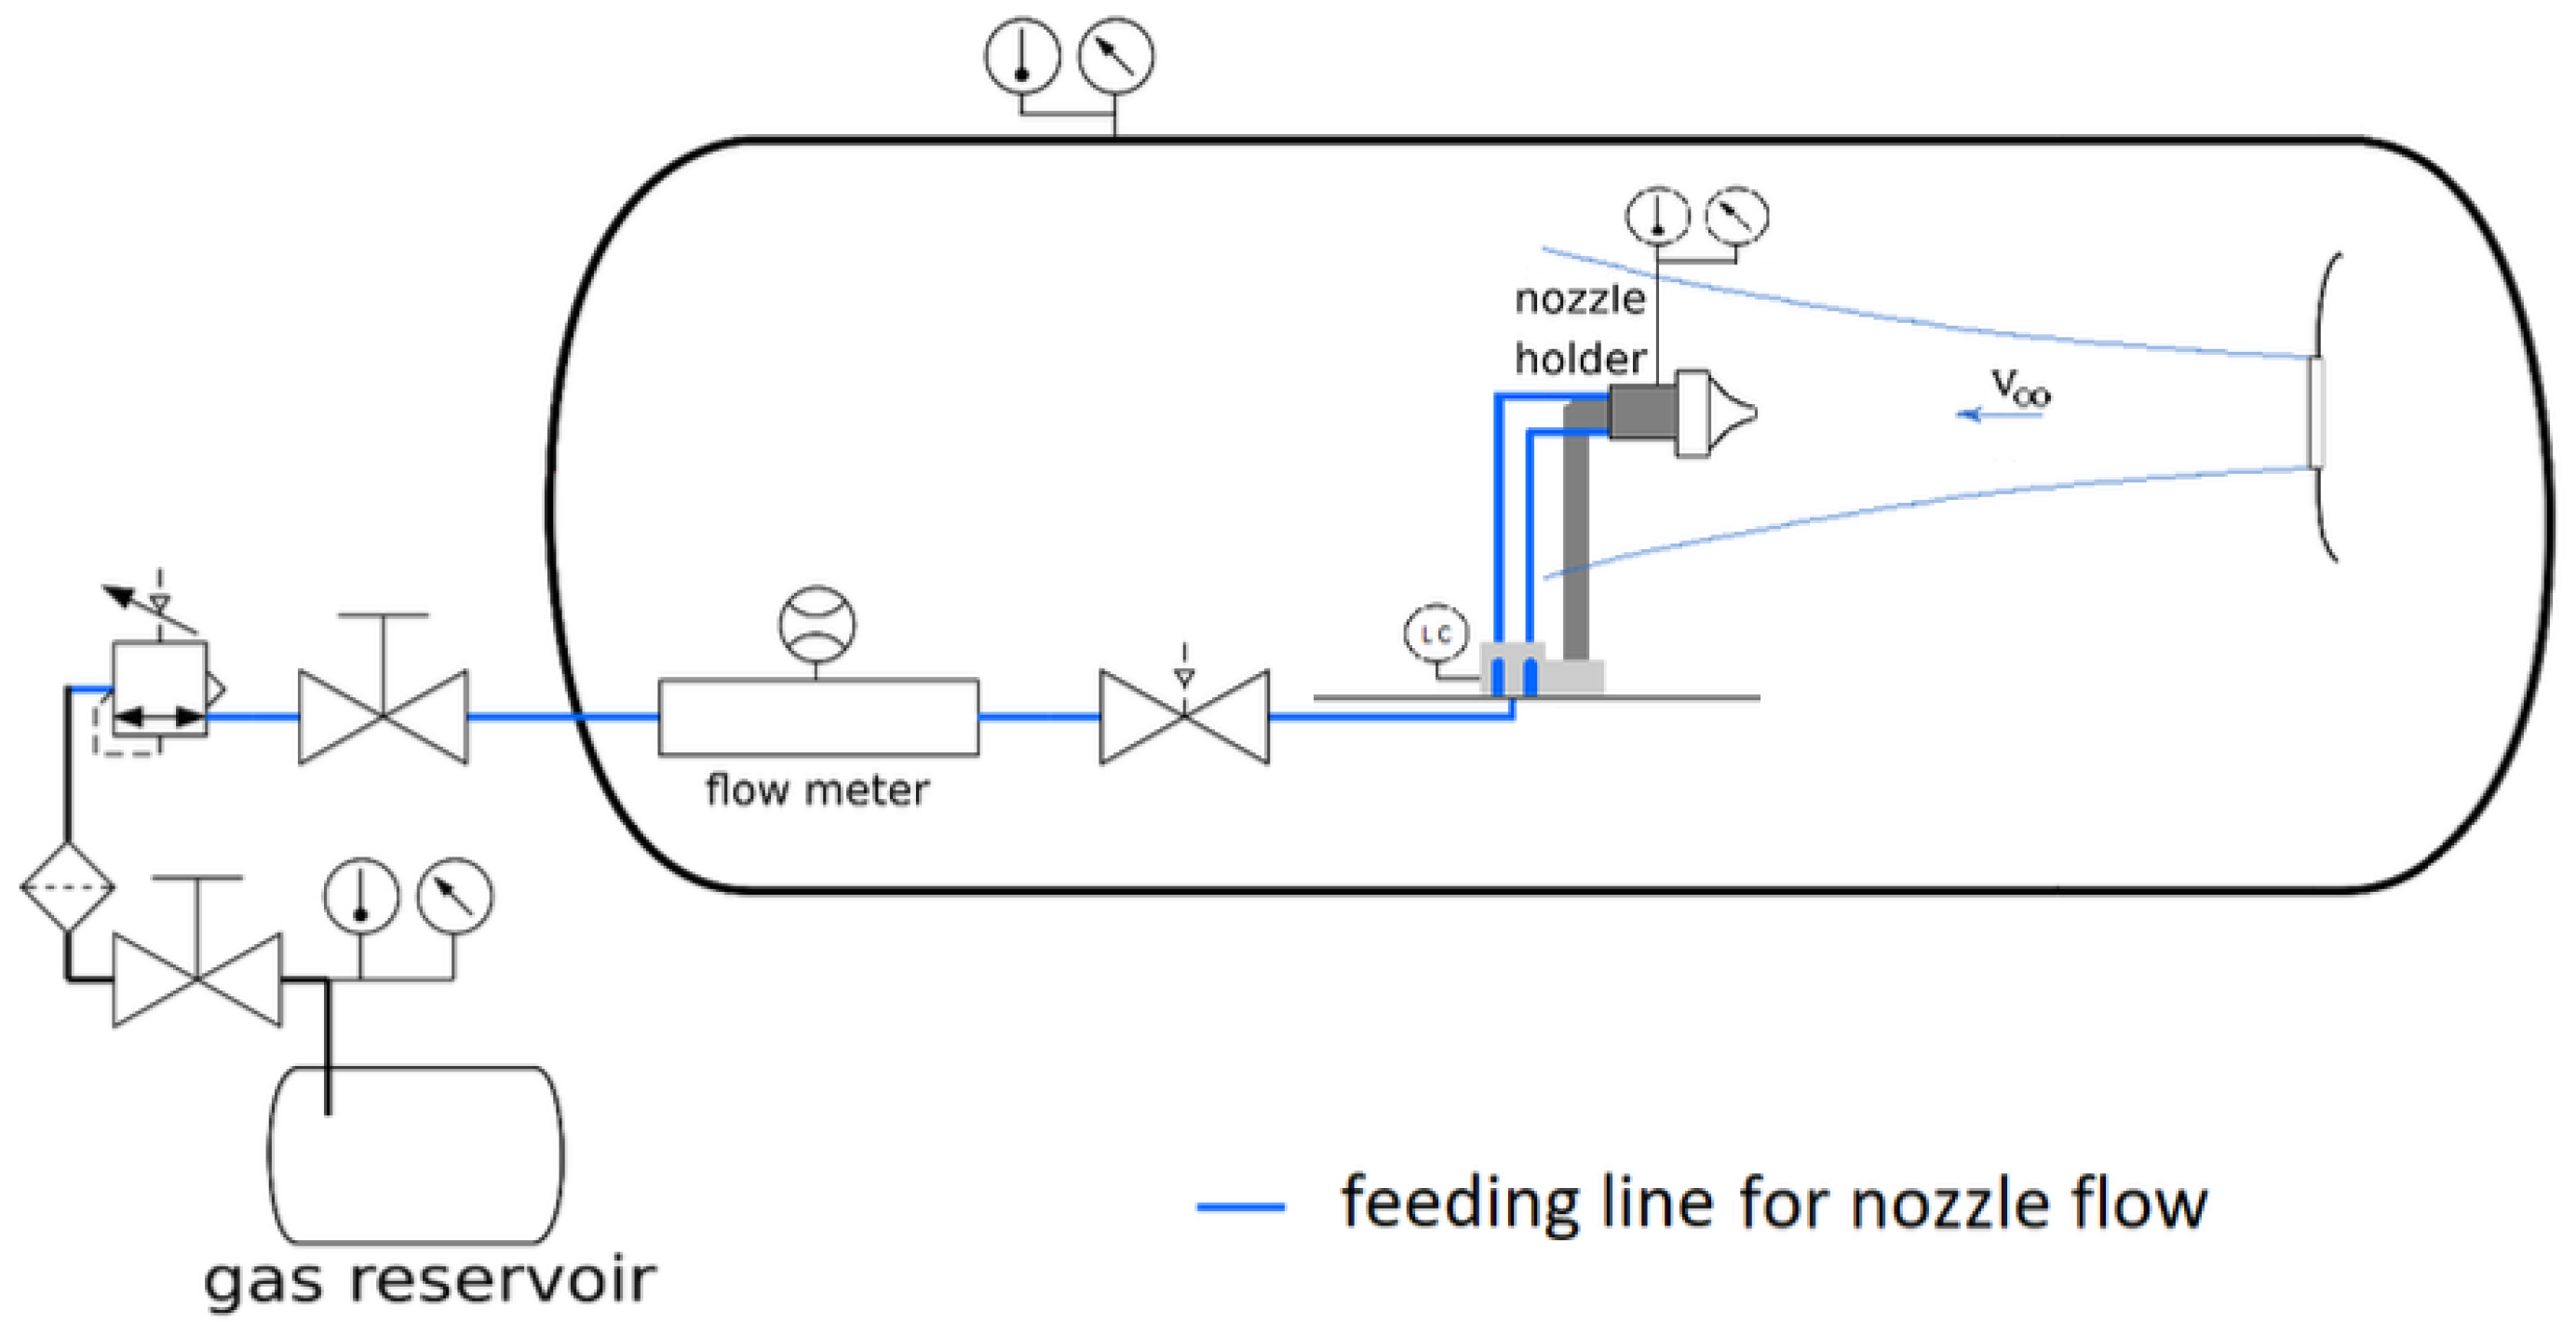
Figure 12.
Schematics of test-bench and feed system.
Figure 12.
Schematics of test-bench and feed system.
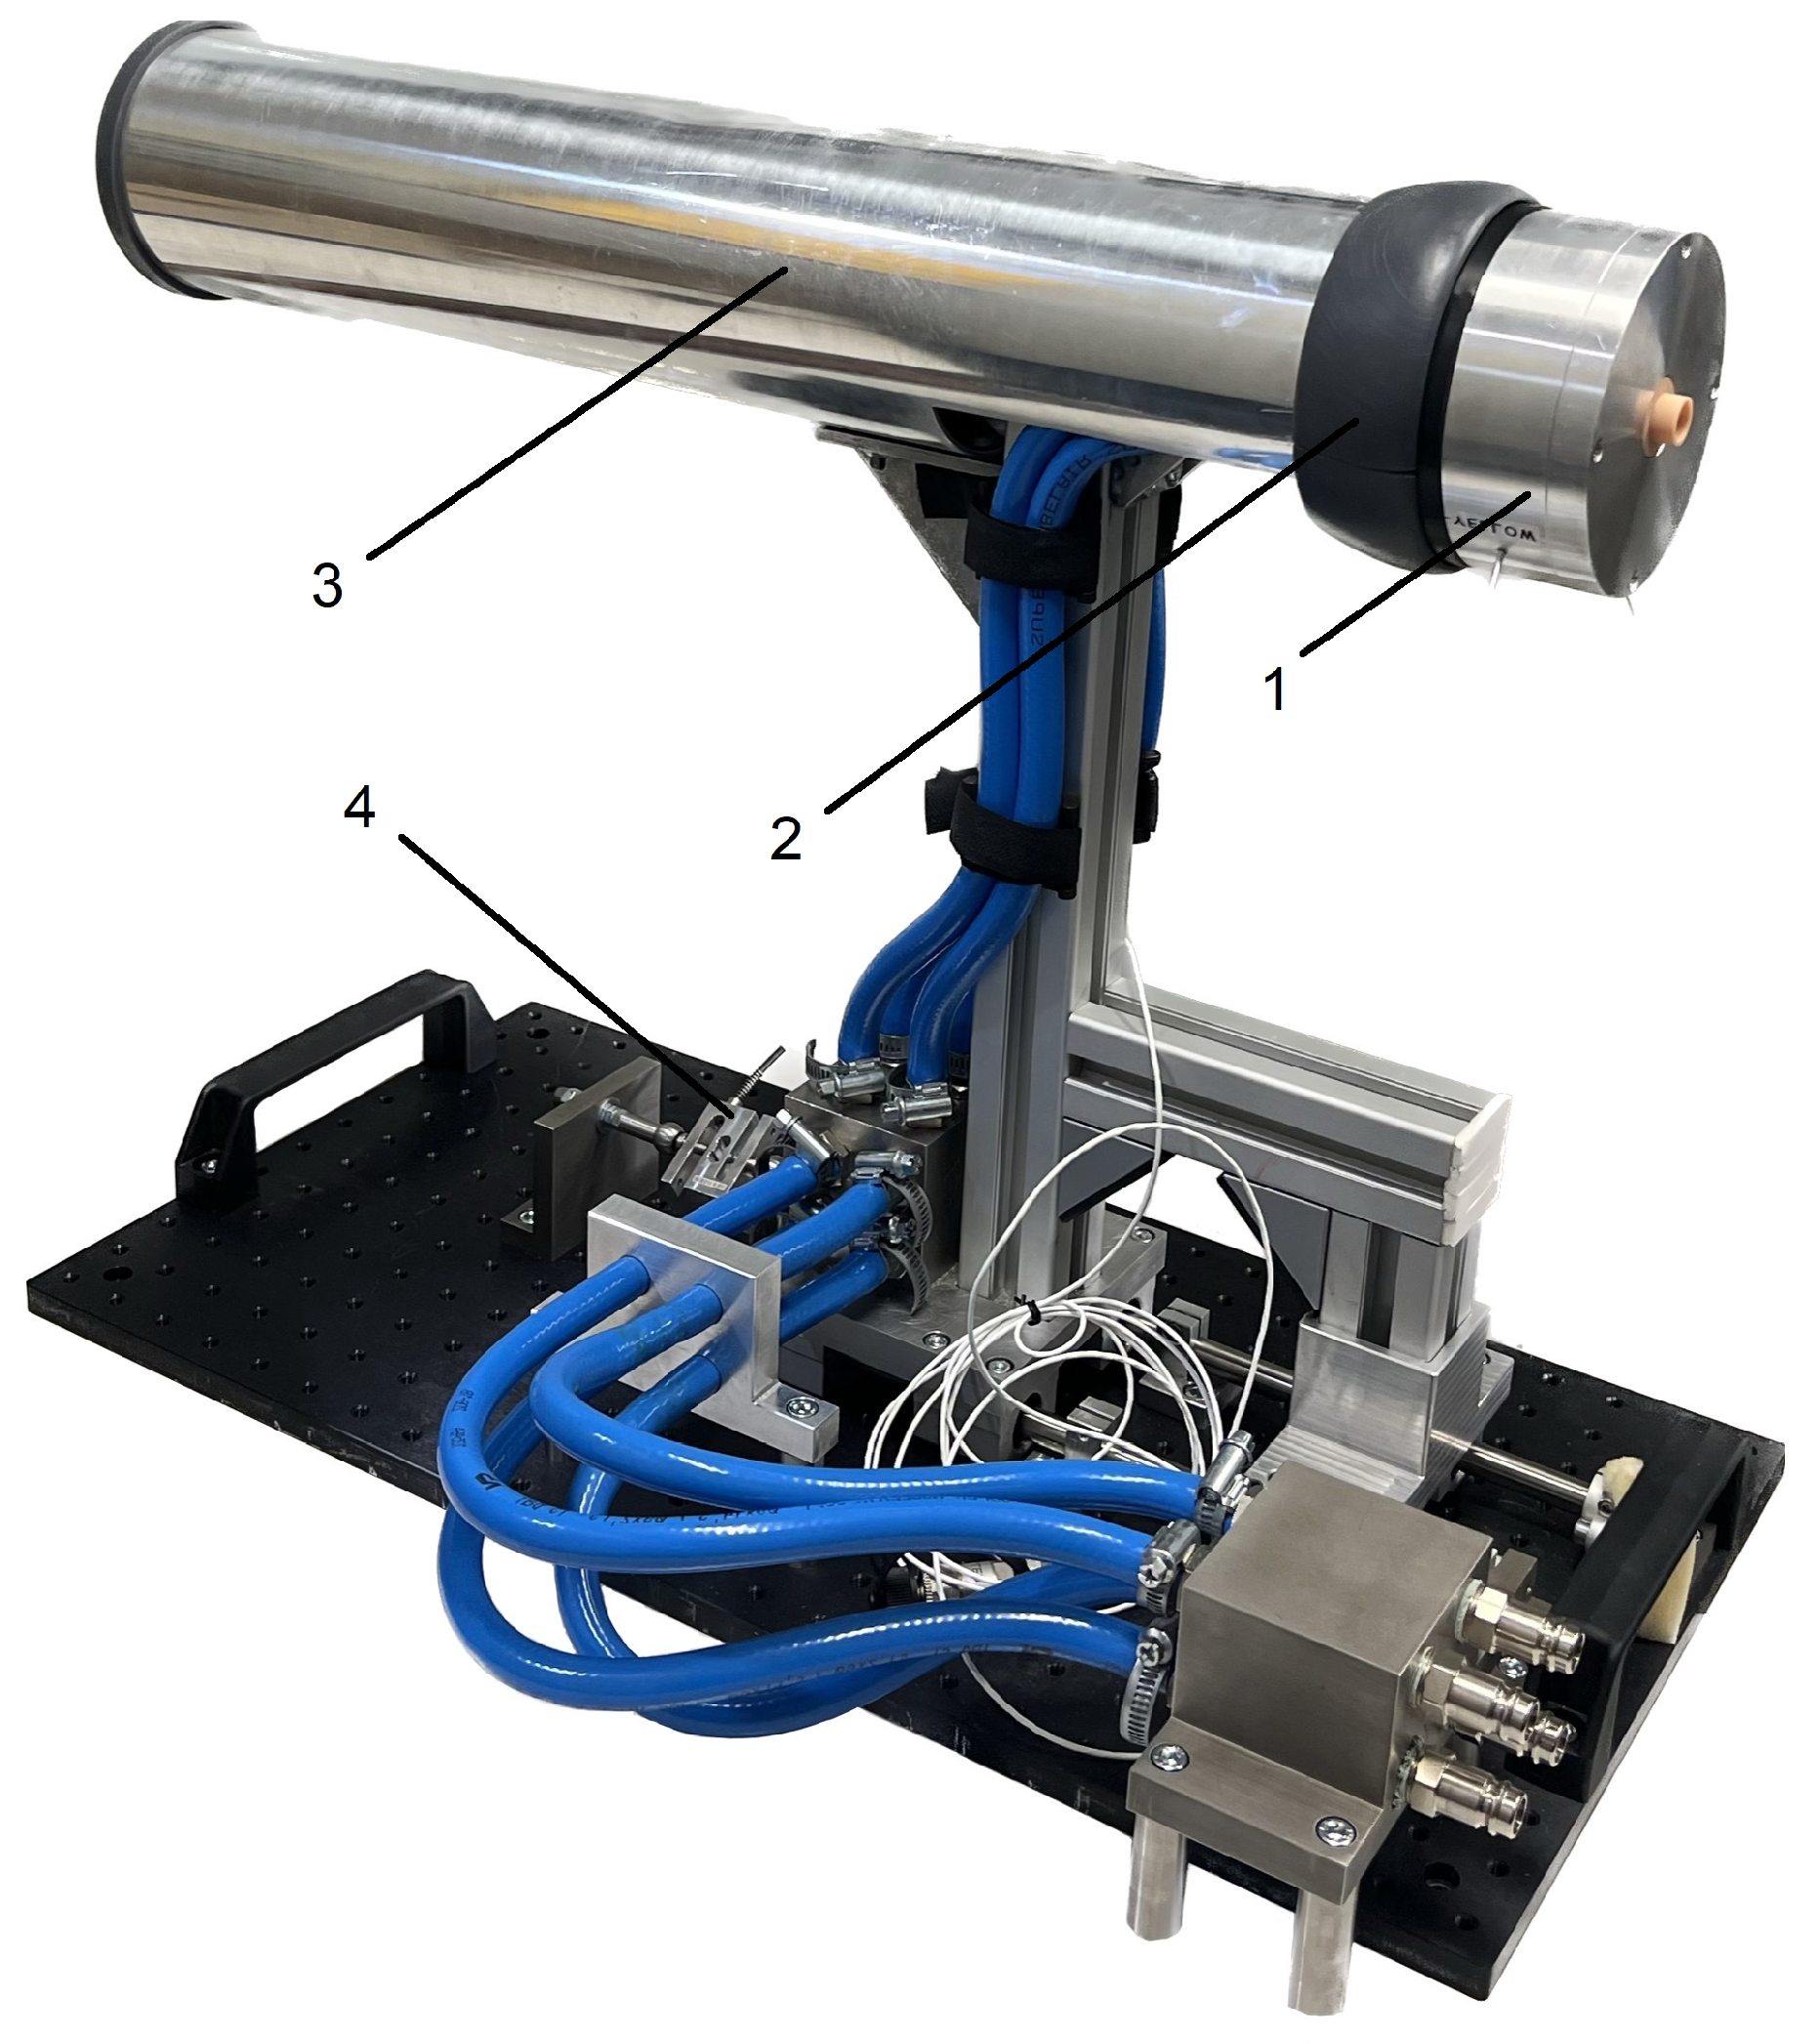
Figure 13.
Picture of the final setup: (1) pressure chamber and nozzle model, (2) chamber/body interface or support ring, (3) external body-extension, (4) S-shaped load cell.
Figure 13.
Picture of the final setup: (1) pressure chamber and nozzle model, (2) chamber/body interface or support ring, (3) external body-extension, (4) S-shaped load cell.
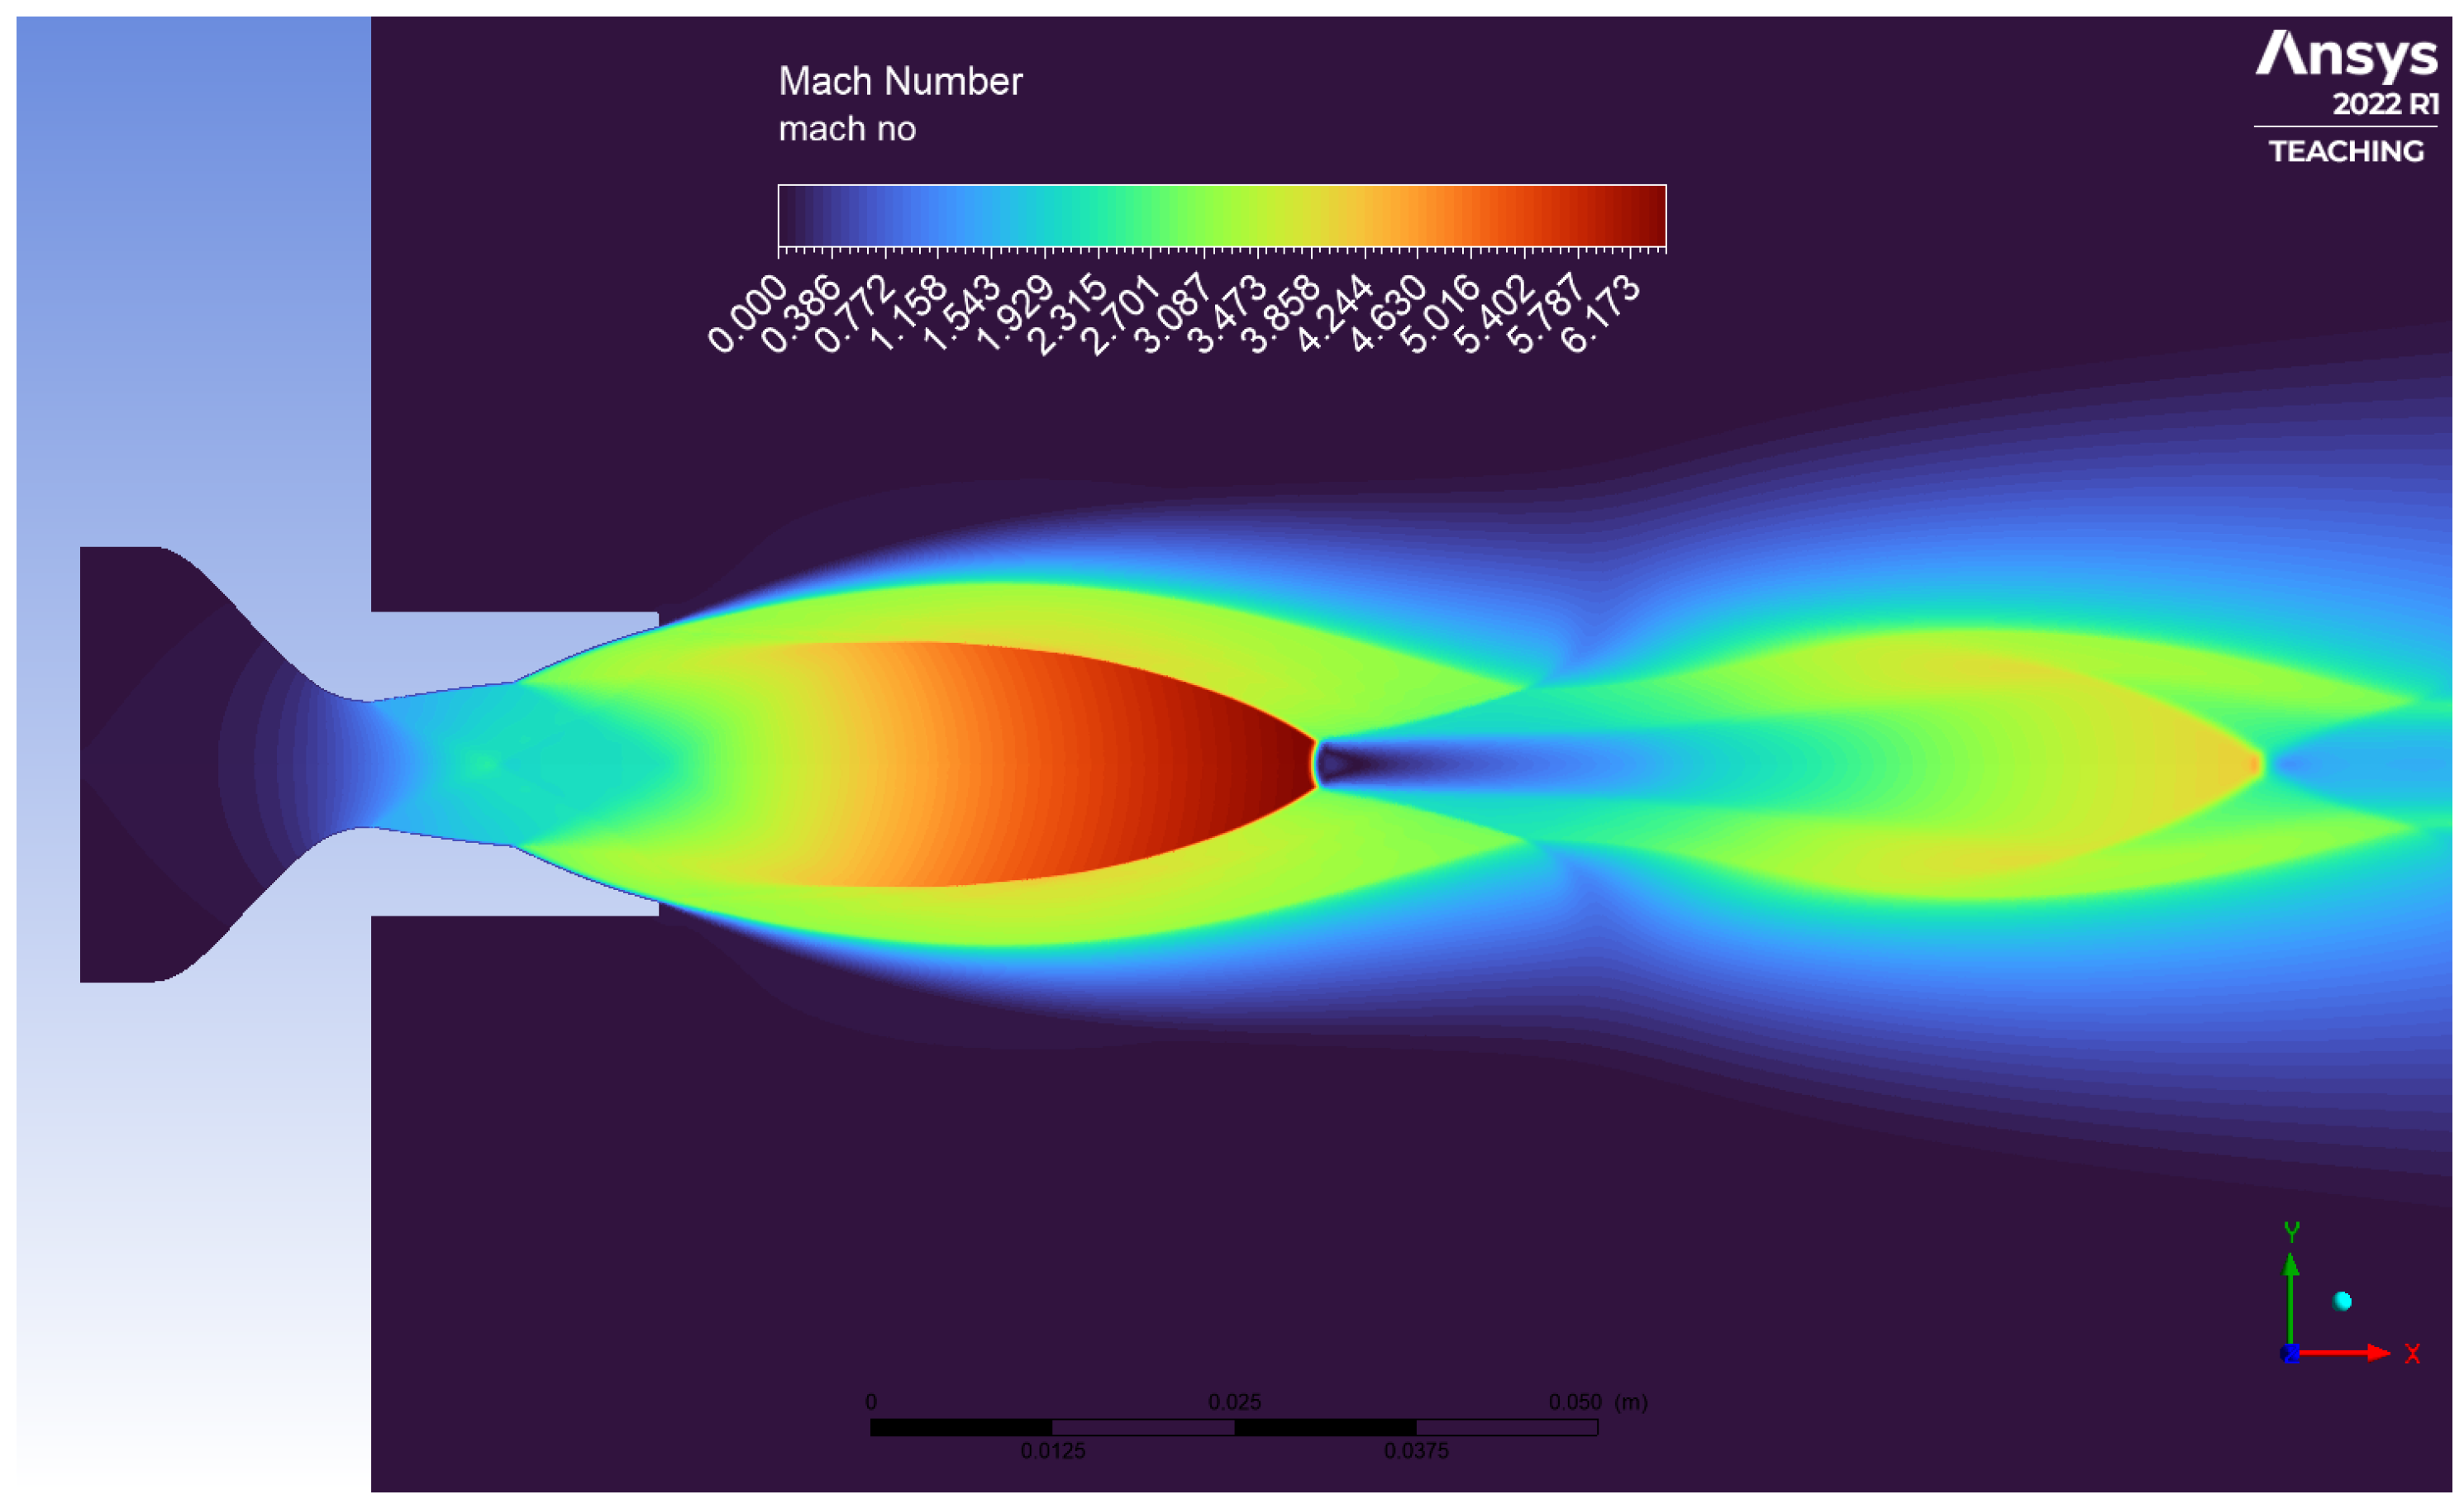
Figure 14.
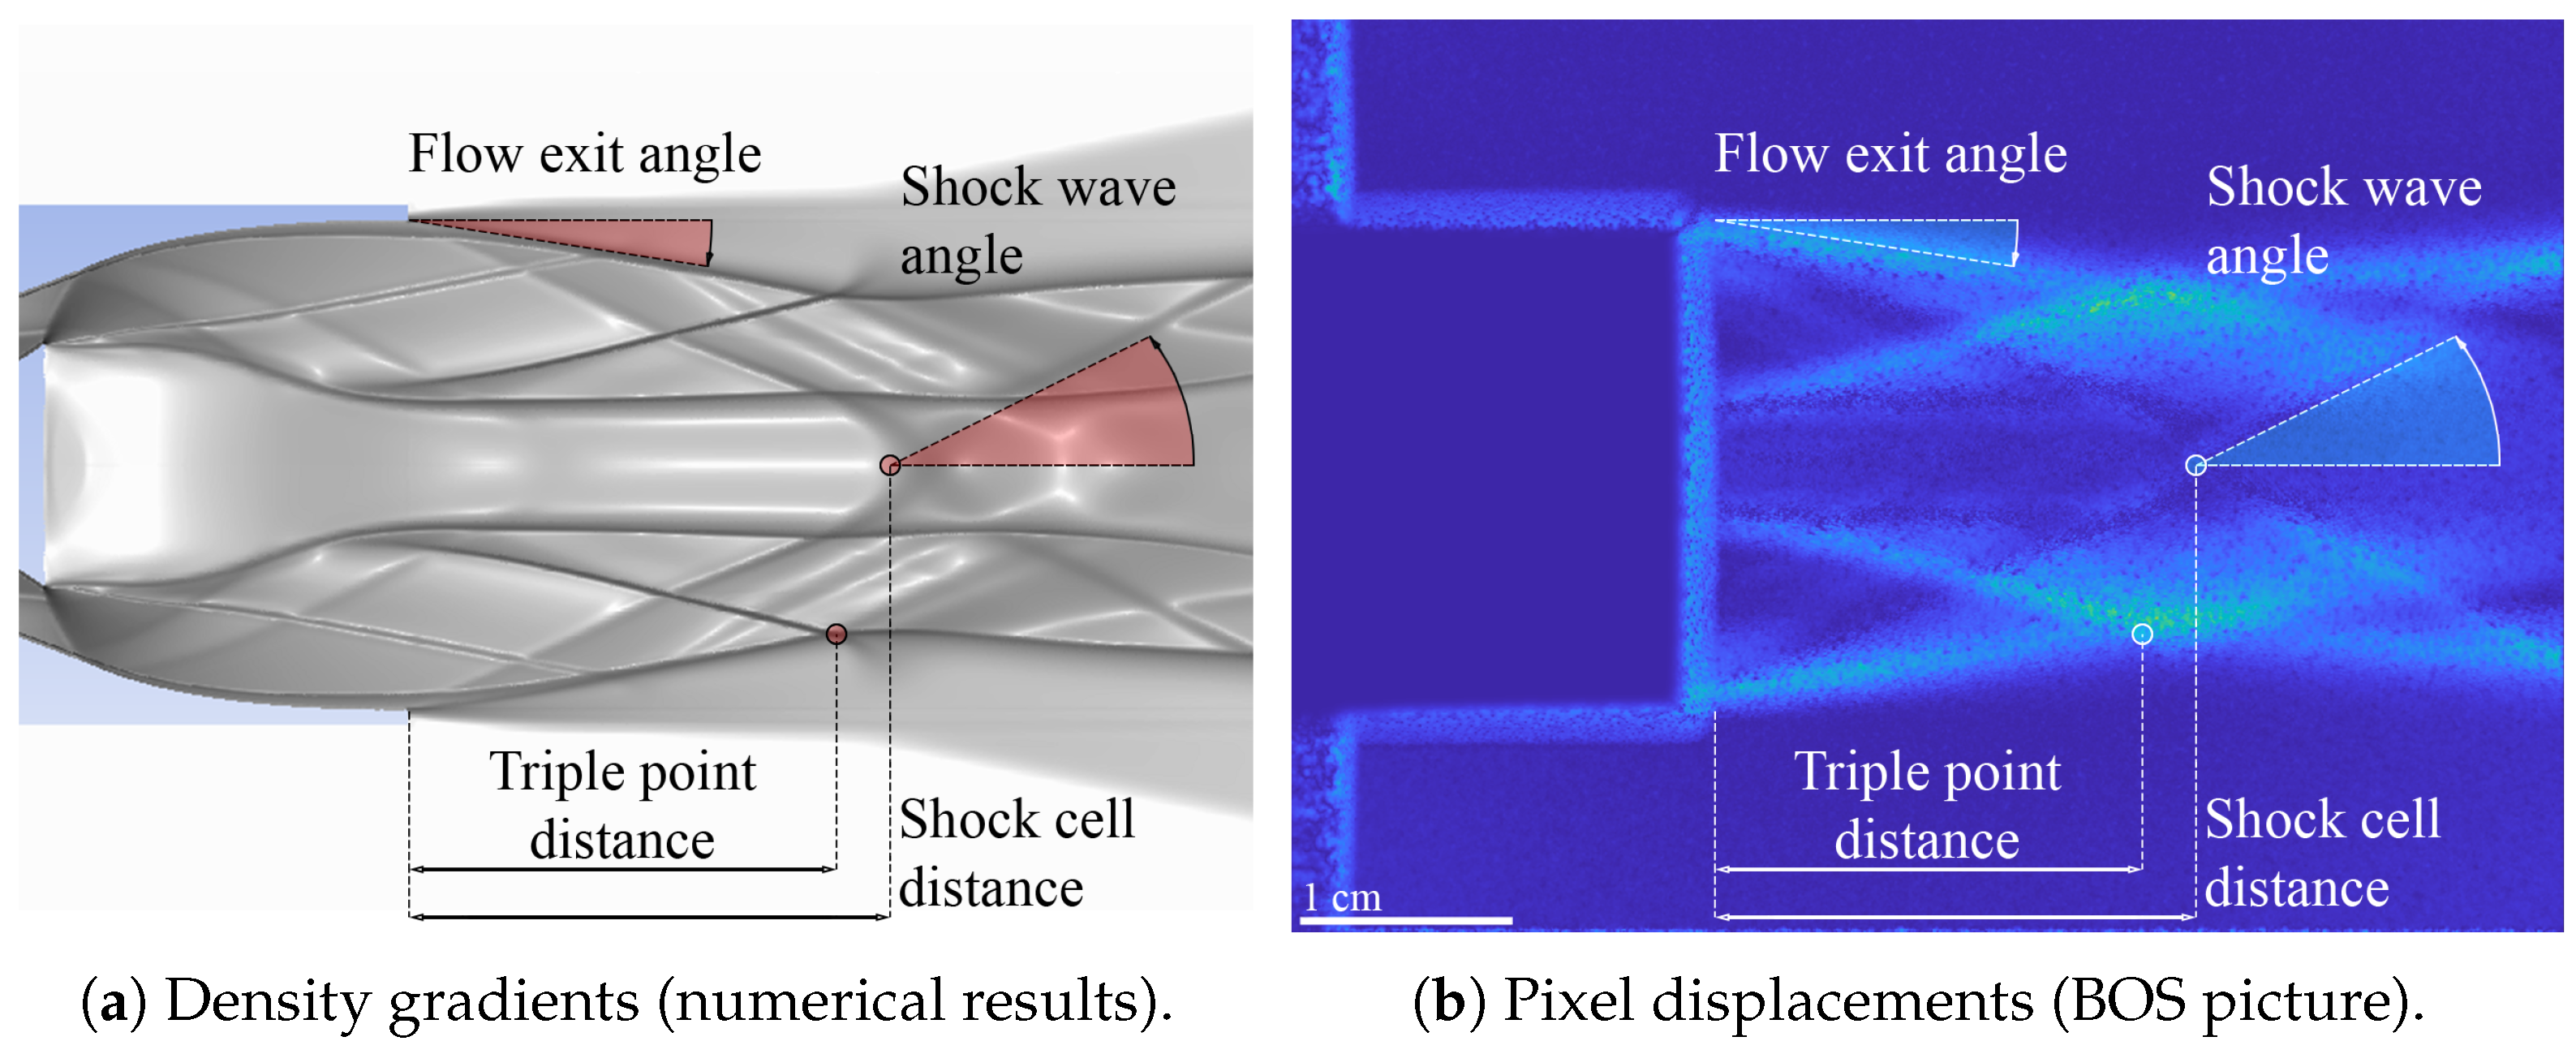
Qualitative comparison of flow topology for ED nozzle at design point ().
Figure 14.
Qualitative comparison of flow topology for ED nozzle at design point ().
Figure 15.
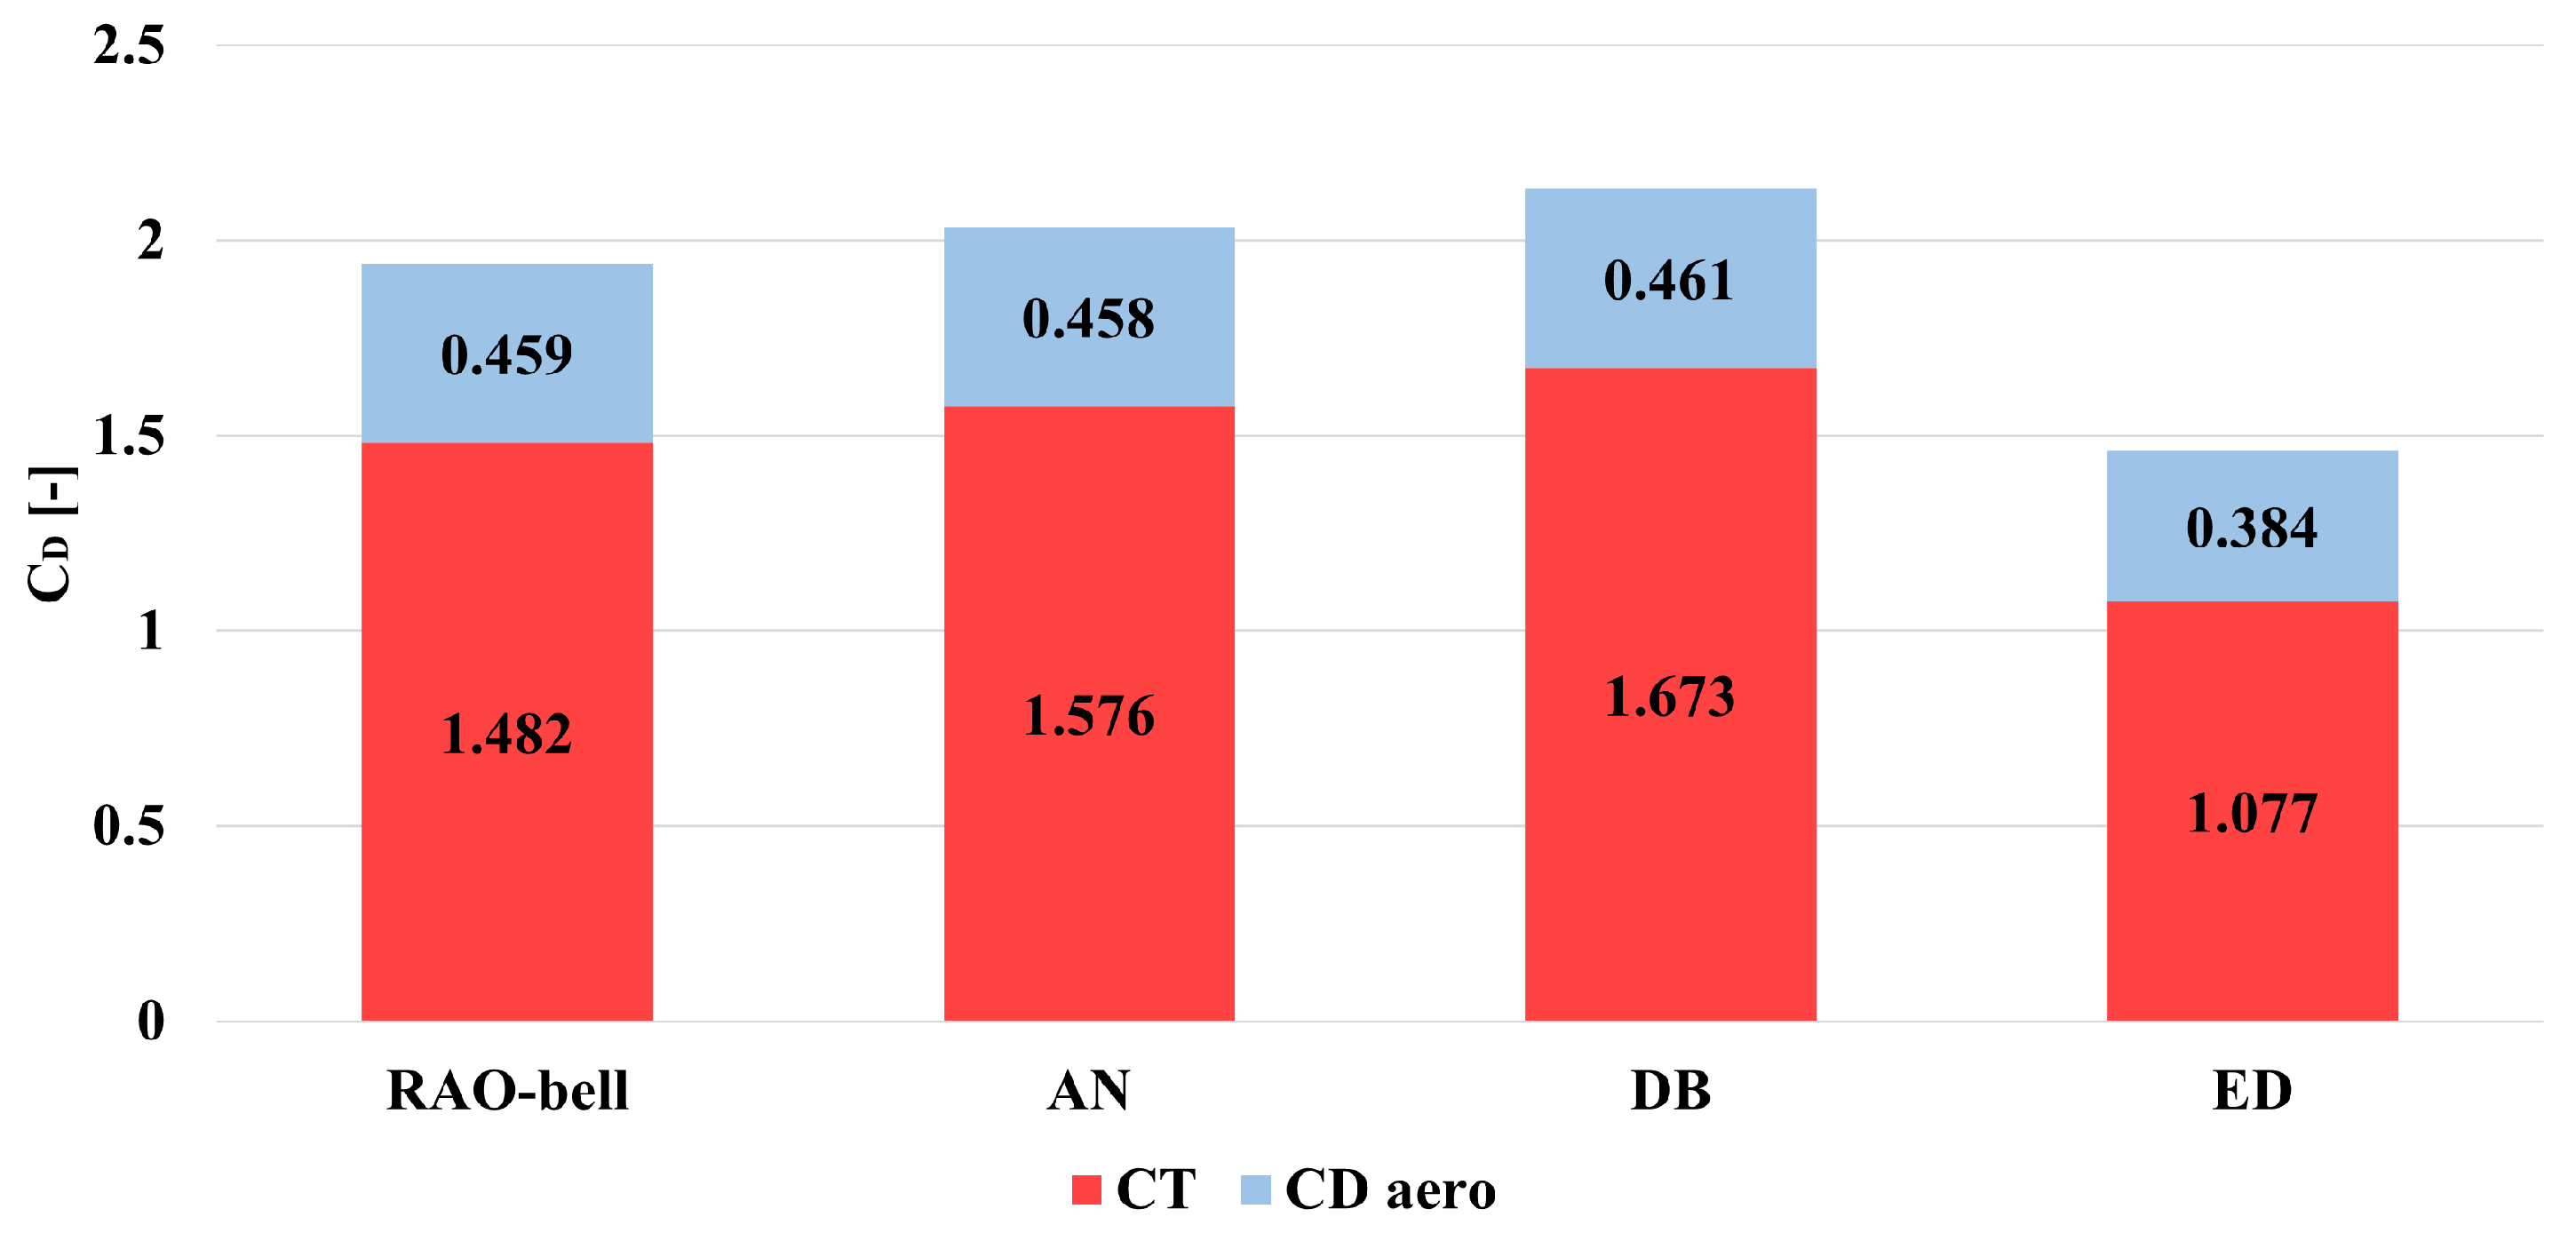
Numerical results on total drag coefficient () of the extended body in retro-flow scenario (, uniform free-stream at ).
Figure 15.
Numerical results on total drag coefficient () of the extended body in retro-flow scenario (, uniform free-stream at ).
Figure 16.
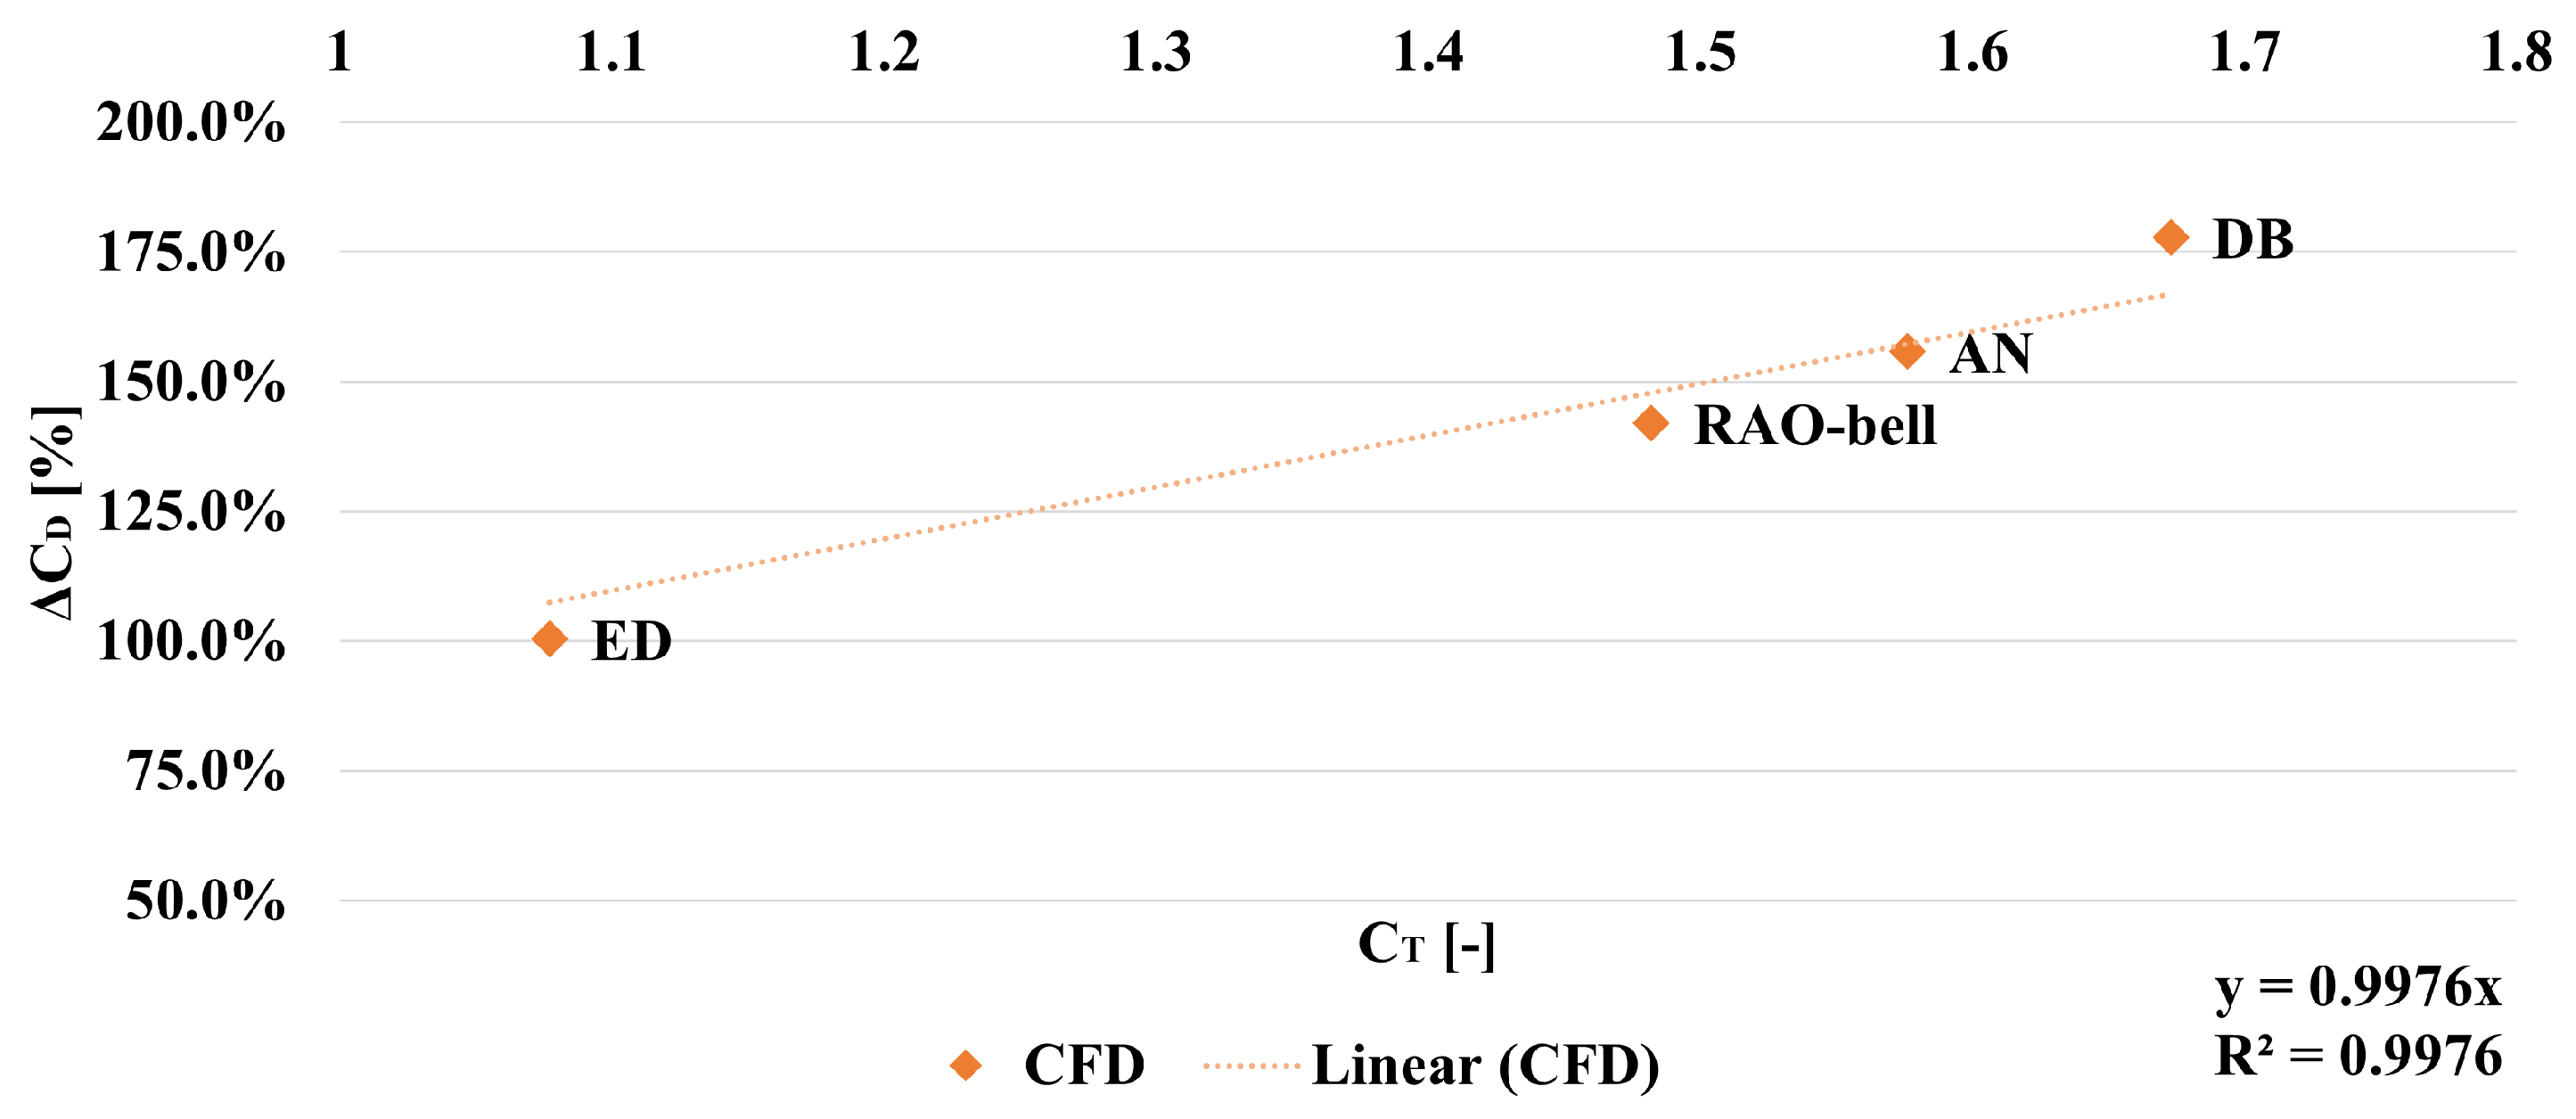
Direct proportionality between aerodynamics thrust coefficient () and increments of total pressure drag () of the extended body in retro-flow scenario (, uniform free-stream at ).
Figure 16.
Direct proportionality between aerodynamics thrust coefficient () and increments of total pressure drag () of the extended body in retro-flow scenario (, uniform free-stream at ).
Figure 17.
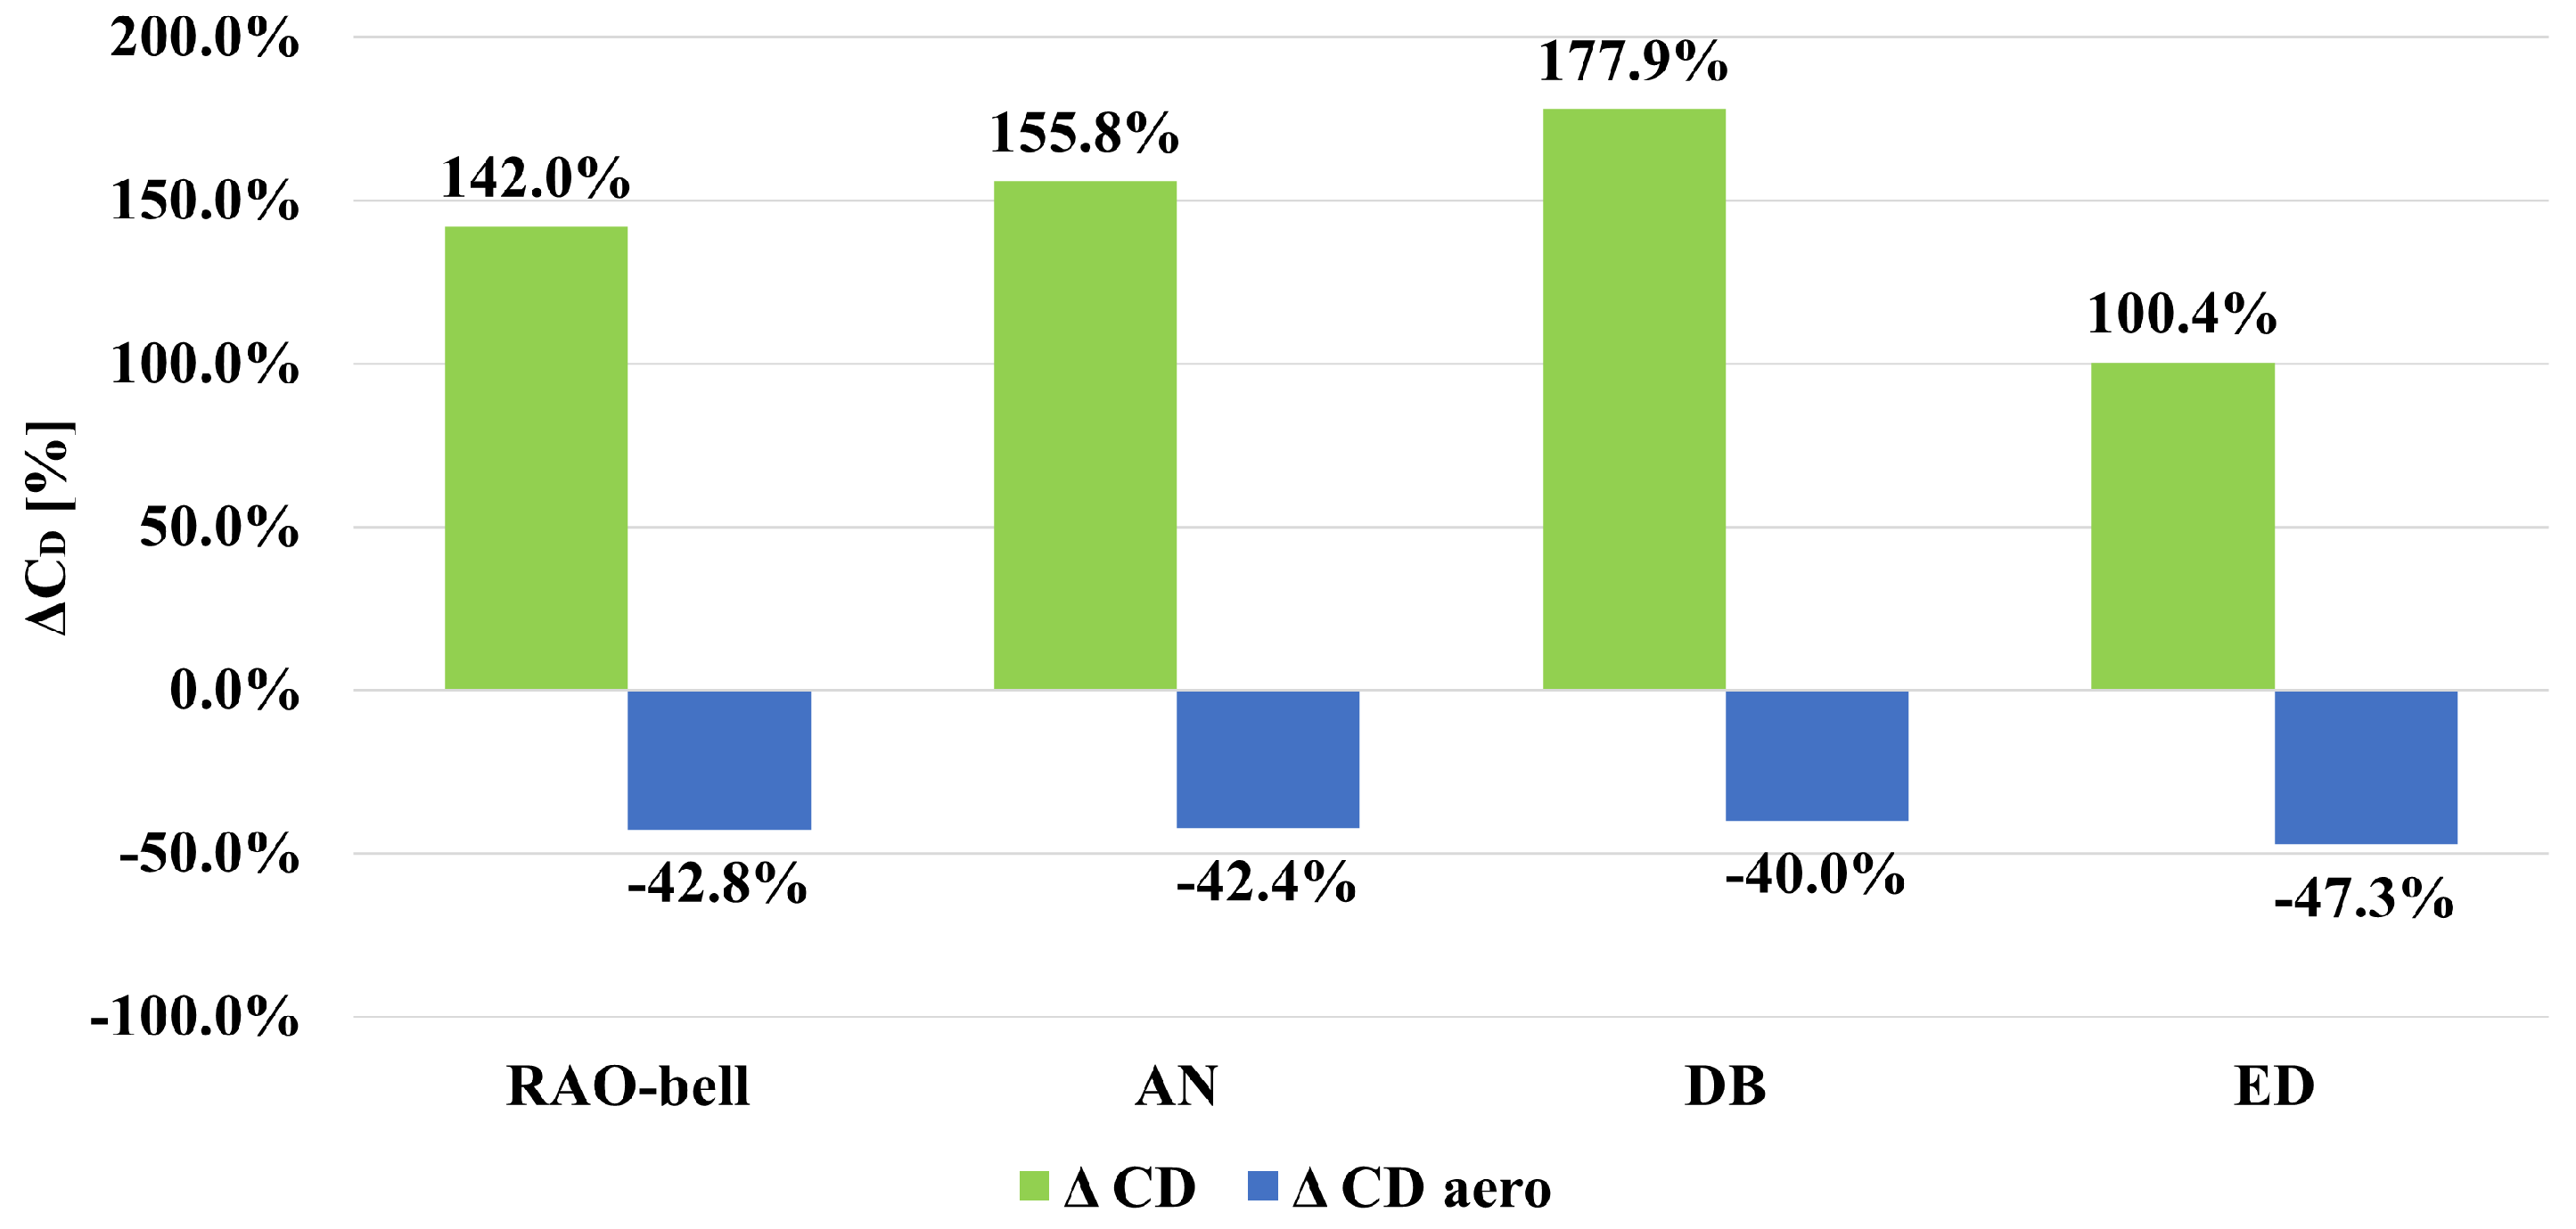
Numerical results on increment of total drag coefficient () and decrement of aerodynamic drag coefficient () of the extended body in retro-flow scenario (, uniform free-stream at ).
Figure 17.
Numerical results on increment of total drag coefficient () and decrement of aerodynamic drag coefficient () of the extended body in retro-flow scenario (, uniform free-stream at ).
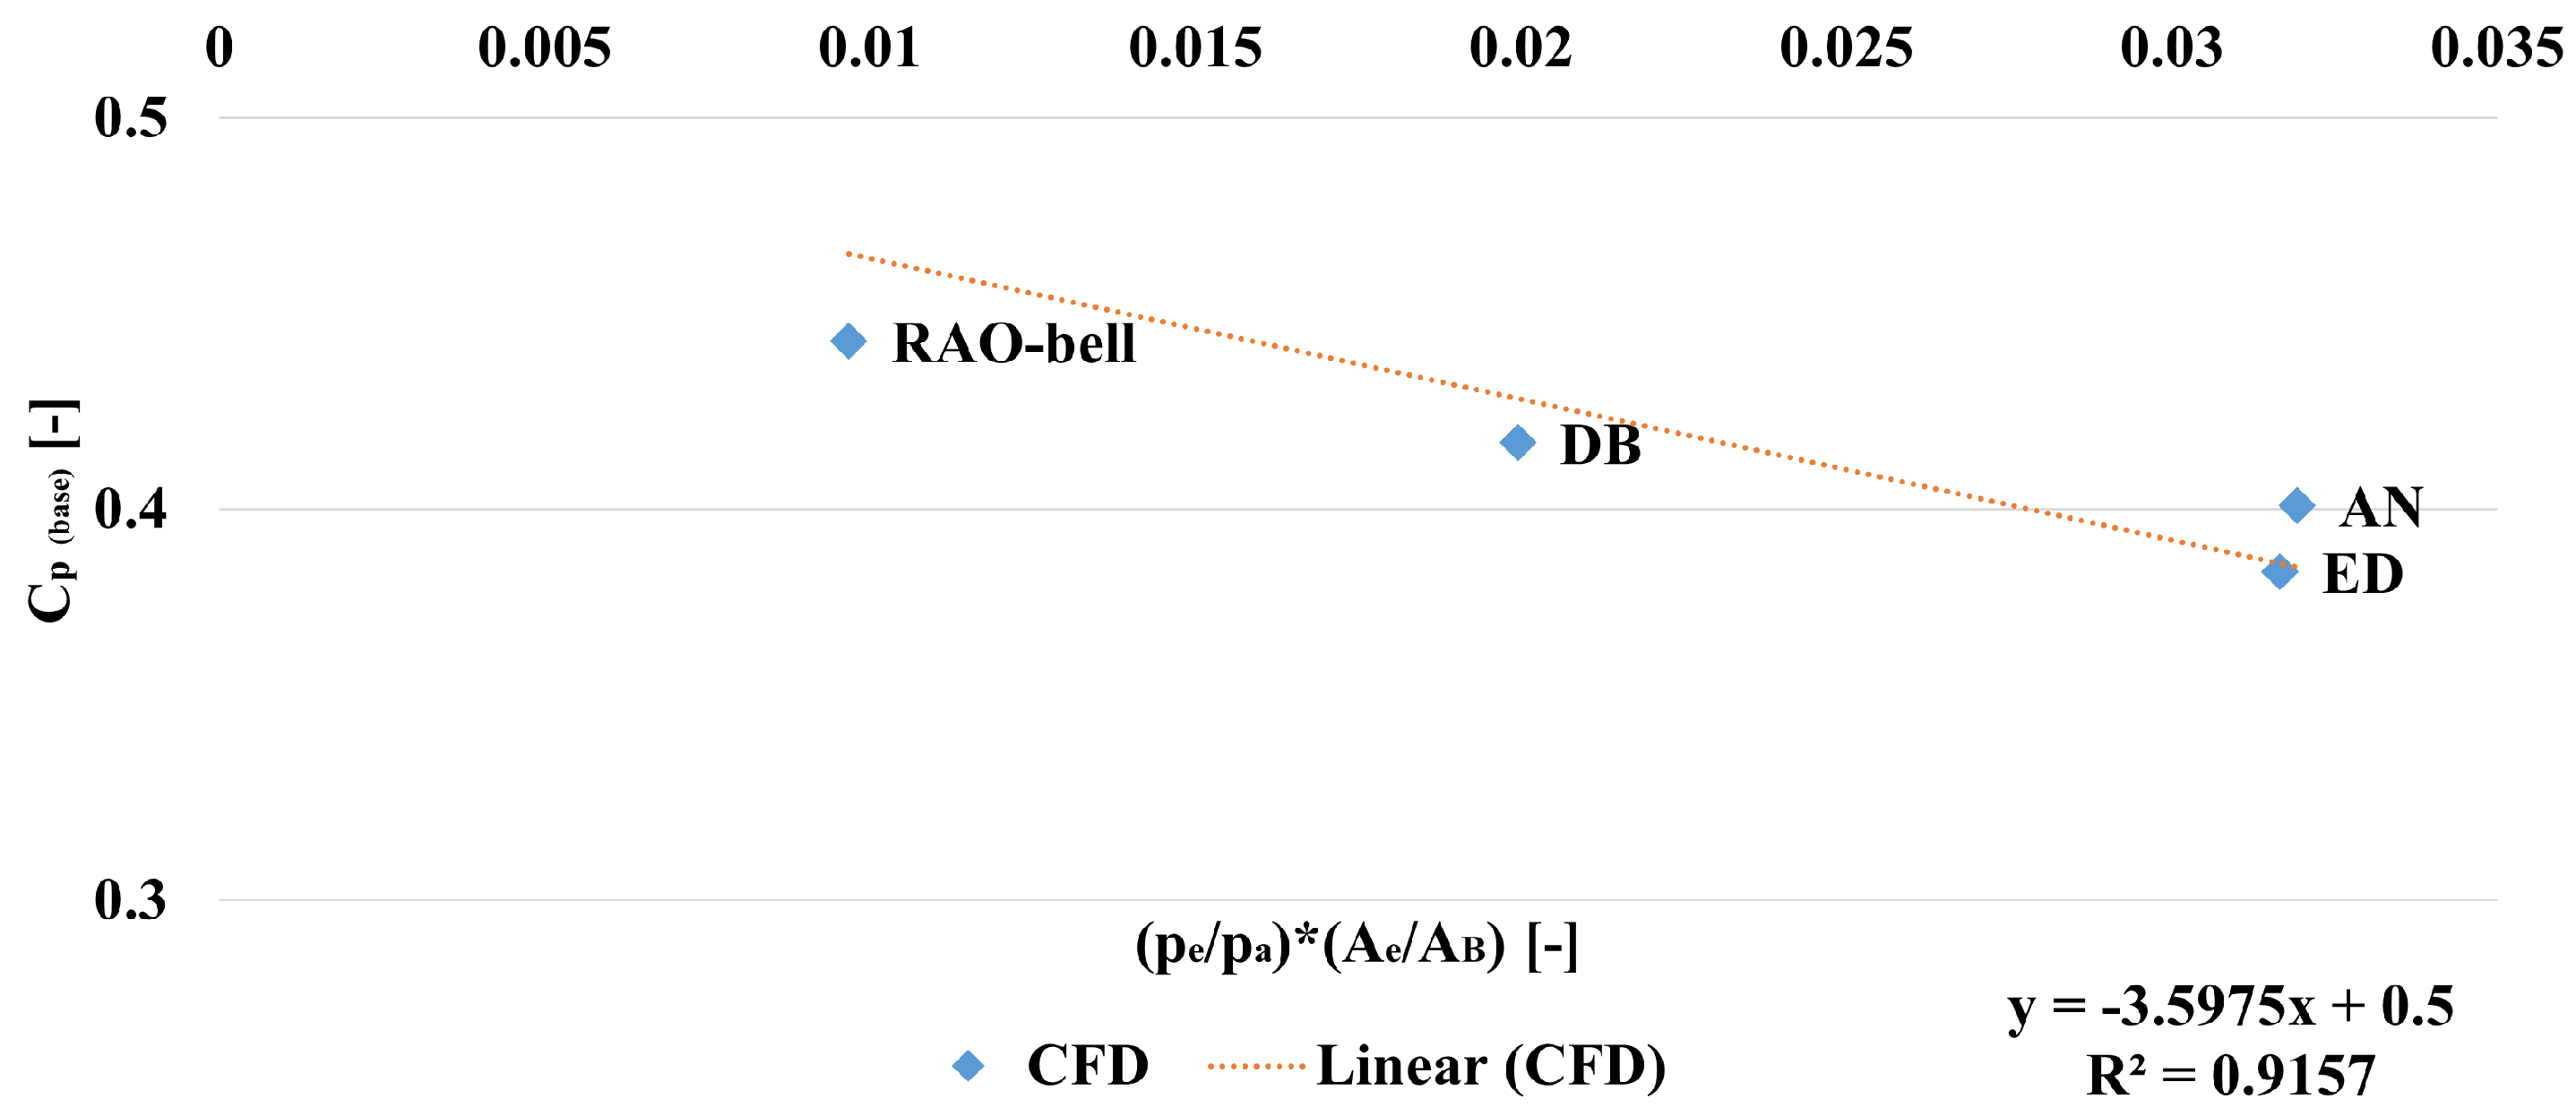
Figure 18.
Direct proportionality between APR () times the form-factor () and pressure coefficient at the base plate () in retro-flow scenario (, uniform free-stream at ).
Figure 18.
Direct proportionality between APR () times the form-factor () and pressure coefficient at the base plate () in retro-flow scenario (, uniform free-stream at ).
Figure 19.
Normalised jet penetration distance (
) for advanced and bell-shaped nozzles in retro-flow scenario (
, uniform free-stream at
) and comparison with reference values available in the literature [
14,
15].
Figure 19.
Normalised jet penetration distance (
) for advanced and bell-shaped nozzles in retro-flow scenario (
, uniform free-stream at
) and comparison with reference values available in the literature [
14,
15].
Table 1.
Reference design parameters for advanced nozzles [
10].
Table 1.
Reference design parameters for advanced nozzles [
10].
| Parameter | Symbol | Value | Unit |
|---|
| Nozzle pressure ratio (on design) | | 45.0 | - |
| Chamber total pressure a | | 0.48 | MPa |
| Chamber total temperature | | 293.15 | K |
| Chamber cross-sectional area | | 5541.8 | mm2 |
| Isoentropic exponent | | 1.4 | - |
| Specific gas-constant (air) | R | 287 | J/kg K |
| Nozzle throat area | | 58.5 | mm2 |
| Mass-flow (on design) b | | 67.3 | g/s |
| Thrust (on design) b | | 41.6 | N |
Table 2.
Model properties for the numerical simulations in Ansys© Fluent.
Table 2.
Model properties for the numerical simulations in Ansys© Fluent.
| Energy equations | activated |
| Working fluid | dry-air (ideal gas, Sutherland-type viscosity) |
| Turbulence model | Shear-Stress Transport (SST) |
| Initial temp. condition | K |
| Initialisation method | hybrid method, followed by a Full-Multi-Grid (FMG) initialization |
| Solver type | pressure-based coupled algorithm, steady, and axial-symmetric |
| Solver methods | 2nd order, higher order term relaxation ticked (at 0.25 overall variables) |
Table 3.
Boundary conditions for nozzle performance on-design (PRF-OD case).
Table 3.
Boundary conditions for nozzle performance on-design (PRF-OD case).
| Label | Type | Parameter | Value |
|---|
| Nozzle inlet | Pressure inlet | Gauge pressure | 480,000 Pa |
| Right boundary a | Pressure outlet | Gauge pressure | 10,670 Pa |
| Left boundary a | Pressure inlet | Gauge pressure | 10,670 Pa |
| Far-field | Velocity inlet | Axial velocity | m/s |
Table 4.
Boundary conditions for nozzle performance off-design (PRF-SLS case).
Table 4.
Boundary conditions for nozzle performance off-design (PRF-SLS case).
| Label | Type | Parameter | Value |
|---|
| Nozzle inlet | Pressure inlet | Gauge pressure | 480,000 Pa |
| Right boundary | Pressure outlet | Gauge pressure | 101,325 Pa |
| Left boundary | Pressure inlet | Gauge pressure | 101,325 Pa |
| Far-field | Velocity inlet | Axial velocity | m/s |
Table 5.
Boundary conditions for aerodynamic performance in counter-flow (CFL).
Table 5.
Boundary conditions for aerodynamic performance in counter-flow (CFL).
| Label | Type | Parameter | Value |
|---|
| Nozzle inlet | Wall | - | - |
| Right boundary | Velocity inlet | Axial velocity | m/s |
| Left boundary a | Pressure outlet | Gauge pressure | 99,156 Pa |
| Far-field | Velocity inlet | Axial velocity | m/s |
Table 6.
Boundary conditions for nozzle and aerodynamic performance in retro-flow (RFL).
Table 6.
Boundary conditions for nozzle and aerodynamic performance in retro-flow (RFL).
| Label | Type | Parameter | Value |
|---|
| Nozzle inlet | Pressure inlet | Gauge pressure | 480,000 Pa |
| Right boundary | Velocity inlet | Axial velocity | m/s |
| Left boundary a | Pressure outlet | Gauge pressure | 99,156 Pa |
| Far-field | Velocity inlet | Axial velocity | m/s |
Table 7.
Meshing target values for key parameters.
Table 7.
Meshing target values for key parameters.
| Parameter | Target Value | Comments |
|---|
| Average orthogonality | >0.98(min ort. > 0.5) | Highly achieved(>0.99) |
| Average skewness | <0.05 | Highly achieved(∼0.01) |
| Average aspect ratio | <10(max AR < 50) | Achieved a |
| <5(close to 1) | Achieved b |
| Number of cells | >500 k(>1000 k for RFL) | Highly achieved |
Table 8.
Results for the evaluation of nozzle performance at each specific design point (PRF-OD: MPa).
Table 8.
Results for the evaluation of nozzle performance at each specific design point (PRF-OD: MPa).
| Nozzle | | T | | | a | | | |
|---|
| | [] | [] | [] | [−] | [−] | [−] | [] | [−] |
|---|
| RAO-bell | 34,653.15 | 36.16 | 56.43 | 1.284 | 13.830 | 1.015 | 65.32 | 2.320 |
| AN | 10,670.00 | 39.18 | 63.49 | 1.457 | 44.670 | 1.039 | 62.91 | 3.080 |
| DB | 10,670.00 | 38.96 | 60.29 | 1.383 | 44.910 | 1.156 | 65.88 | 3.060 |
| ED | 10,670.00 | 39.25 | 60.74 | 1.393 | 44.900 | 0.789 | 65.88 | 3.120 |
Table 9.
Results for the evaluation of nozzle performance at SLS ambient conditions (PRF-SLS: MPa).
Table 9.
Results for the evaluation of nozzle performance at SLS ambient conditions (PRF-SLS: MPa).
| Nozzle | | T | | | a | | |
|---|
| | [] | [] | [] | [−] | [−] | [−] | [] |
|---|
| RAO-bell | 101,325.00 | 27.50 | 42.47 | 0.976 | 4.730 | 0.657 | 66.01 |
| AN | 101,325.00 | 29.29 | 47.42 | 1.089 | 4.700 | 1.067 | 62.69 |
| DB | 101,325.00 | 29.20 | 45.18 | 1.036 | 4.730 | 0.624 | 65.88 |
| ED | 101,325.00 | 19.85 | 30.71 | 0.705 | 4.730 | 0.753 | 65.87 |
Table 10.
Results for the evaluation of nozzle performance during subsonic retro-propulsion (RFL: MPa, m/s uniform, ambience at SLS).
Table 10.
Results for the evaluation of nozzle performance during subsonic retro-propulsion (RFL: MPa, m/s uniform, ambience at SLS).
| Nozzle | | | | | a | | |
|---|
| | [] | [] | [] | [−] | [−] | [−] | [] |
|---|
| RAO-bell | 99,156.00 | 27.77 | 42.94 | 0.986 | 4.833 | 0.637 | 65.95 |
| AN | 99,156.00 | 29.53 | 47.82 | 1.098 | 4.800 | 1.065 | 62.97 |
| DB | 99,156.00 | 29.29 | 45.11 | 1.040 | 4.830 | 0.635 | 66.21 |
| ED | 99,156.00 | 20.29 | 31.40 | 0.720 | 4.828 | 0.755 | 65.89 |
Table 11.
Numerical results for aerodynamic performance of the body against a subsonic free-stream (CFL: m/s uniform, ambient conditions at SLS).
Table 11.
Numerical results for aerodynamic performance of the body against a subsonic free-stream (CFL: m/s uniform, ambient conditions at SLS).
| Nozzle | a | a | b | c | |
|---|
| | [] | [−] | [−] | [−] | [] |
|---|
| RAO-bell | 15.02 | 0.802 | 0.941 | −0.521 | 73.56 |
| AN | 14.89 | 0.795 | 0.897 | −0.547 | 73.55 |
| DB | 14.39 | 0.768 | 0.952 | −0.533 | 73.46 |
| ED | 13.65 | 0.729 | 0.824 | −0.551 | 73.55 |
Table 12.
Numerical results for aerodynamic performance of the body in subsonic retro-flow configuration (RFL: m/s uniform, ambient conditions at SLS).
Table 12.
Numerical results for aerodynamic performance of the body in subsonic retro-flow configuration (RFL: m/s uniform, ambient conditions at SLS).
| Nozzle | a | a | b | c | c |
|---|
| | [] | [−] | [−] | [−] | [] |
|---|
| RAO-bell | 8.60 | 0.459 | 0.443 | −0.046 | 295 |
| AN | 8.59 | 0.458 | 0.401 | −0.069 | 292 |
| DB | 8.63 | 0.461 | 0.417 | −0.068 | 300 |
| ED | 7.17 | 0.384 | 0.329 | −0.069 | 281 |
Table 13.
Verification of performance at design point (losses with respect to ideal performance of each nozzle derived analytically in hypothesis of quasi-1D isoentropic nozzle flow [
18]).
Table 13.
Verification of performance at design point (losses with respect to ideal performance of each nozzle derived analytically in hypothesis of quasi-1D isoentropic nozzle flow [
18]).
| Nozzle | | | | a |
|---|
| | [−] | [−] | [−] | [−] |
|---|
| RAO-bell b | 0.951 | 1.015 | 0.980 | 0.971 |
| AS | 0.942 | 0.988 | 1.006 | 0.935 |
| DB | 0.937 | 0.938 | 0.956 | 0.979 |
| ED | 0.944 | 0.944 | 0.963 | 0.979 |
Table 14.
Verification of performance at SLS conditions (losses with respect to ideal performance of each nozzle derived analytically in hypothesis of quasi-1D isoentropic nozzle flow [
18]).
Table 14.
Verification of performance at SLS conditions (losses with respect to ideal performance of each nozzle derived analytically in hypothesis of quasi-1D isoentropic nozzle flow [
18]).
| Nozzle | | | | a |
|---|
| | [−] | [−] | [−] | [−] |
|---|
| AS | 0.980 | 1.021 | 1.004 | 0.955 |
| DB | 0.977 | 0.973 | 0.955 | 1.004 |
| ED | 0.664 | 0.661 | 0.650 | 1.004 |
Table 15.
Validation of performance, comparison at design point (PRF-OD) and at sea-level standard (PRF-SLS) between CFD and experimental data. More details (e.g., sensors accuracy, performance calculation) are available in previous publications by the authors [
10,
11].
Table 15.
Validation of performance, comparison at design point (PRF-OD) and at sea-level standard (PRF-SLS) between CFD and experimental data. More details (e.g., sensors accuracy, performance calculation) are available in previous publications by the authors [
10,
11].
| Nozzle | Case | | | | |
|---|
| | | [] | [%] | [−] | [%] |
|---|
| RAO-bell | PRF-OD a | 34.70 ± 0.51 | +4.21 | 1.230 ± 0.018 | +4.39 |
| RAO-bell | PRF-SLS b | 24.50 ± 0.10 | +12.24 | 0.869 ± 0.004 | +12.31 |
| AN | PRF-OD c | 38.95 ± 0.65 | +0.59 | 1.434 ± 0.026 | +1.60 |
| AN | PRF-SLS b | 28.25 ± 0.51 | +3.68 | 1.040 ± 0.019 | +4.71 |
| DB | PRF-OD c | 37.73 ± 0.54 | +3.26 | 1.334 ± 0.015 | +3.67 |
| DB | PRF-SLS b | 27.80 ± 0.10 | + 5.04 | 0.981 ± 0.004 | +5.61 |
| ED | PRF-OD c | 38.73 ± 0.13 | +1.34 | 1.375 ± 0.004 | +1.31 |
| ED | PRF-SLS b | 22.27 ± 0.31 | −10.87 | 0.789 ± 0.011 | −10.65 |
Table 16.
Performance comparison under SLS conditions between advanced nozzles () and RAO-bell nozzle ().
Table 16.
Performance comparison under SLS conditions between advanced nozzles () and RAO-bell nozzle ().
| Nozzle | | | | | |
|---|
| | [−] | [%] | [%] | [%] | [%] |
|---|
| AS | 4.700 | +6.51 | +11.66 | +11.58 | −5.03 |
| DB | 4.730 | +6.18 | +6.38 | +6.15 | −0.20 |
| ED | 4.730 | −27.82 | −27.77 | −27.69 | −0.21 |
Table 17.
Numerical results on variation of nozzles performance between static-fire and retro-flow configurations at SLS (, ).
Table 17.
Numerical results on variation of nozzles performance between static-fire and retro-flow configurations at SLS (, ).
| Nozzle | a | | | | b | |
|---|
| | [] | [%] | [%] | [%] | [%] | [−] |
|---|
| RAO-bell | 100,132.82 | +0.98 | +1.02 | +1.11 | +1.35 | 0.631 |
| AS | 100,040.21 | +0.82 | +0.84 | +0.84 | +2.09 | 1.056 |
| DB | 100,075.49 | +0.31 | +0.34 | −0.15 | +1.40 | 0.629 |
| ED | 99,881.45 | +2.22 | +2.26 | +2.26 | +1.60 | 0.750 |
Table 18.
Scaling parameters for the Aerodynamics Interference (AI) region ( m/s uniform, ambient conditions at SLS).
Table 18.
Scaling parameters for the Aerodynamics Interference (AI) region ( m/s uniform, ambient conditions at SLS).
| Nozzle | a | b | | |
|---|
| | [−] | [−] | [−] | [−] |
|---|
| RAO-bell | 1.482 | 56.280 | 1.832 | 22.345 |
| AN | 1.576 | 23.158 | 1.173 | 15.743 |
| DB | 1.673 | 22.014 | 1.168 | 15.792 |
| ED | 1.077 | 19.710 | 1.280 | 12.811 |
