Article

The Effects of Speed on the Running Performance of a Small Two-Wheeled Lunar Rover

Department of Biomedical Engineering, Doshisha University, Kyotanabe 610-0394, Japan
*
Authors to whom correspondence should be addressed.
Aerospace 2025, 12(2), 115; https://doi.org/10.3390/aerospace12020115
Submission received: 18 November 2024 / Revised: 28 January 2025 / Accepted: 29 January 2025 / Published: 31 January 2025
(This article belongs to the Special Issue Space Mechanisms and Robots)

Abstract

:
Small wheeled lunar rovers tend to dig into surfaces via wheel rotation, causing them to slip and get stuck on regolith. Additionally, reducing power consumption remains a longstanding challenge. This study created a small two-wheeled rover and conducted tests at various wheel rotation speeds to assess the effects of rotation speed on its running performance. Through running tests and the measurement of reaction force, the influence of different wheel rotation speeds on running performance was clarified. Running at low rotation speeds prevented slipping and sinking. Additionally, the amount of sinkage was shown to converge to a certain level even at higher rotation speeds. These findings suggest that the maximum wheel rotation speed at which the rover avoids getting stuck allows the rover to achieve running with low-power consumption.

1. Introduction

In recent years, interest in lunar exploration has increased. Past lunar explorations have suggested the presence of water [1,2,3,4], and studies on Helium-3 have also been conducted [5,6]. Utilizing lunar water resources could potentially provide hydrogen for fuel, drinking water, and oxygen for breathing, thereby increasing the importance of lunar exploration.
The lunar surface is a harsh environment, consisting of one-sixth of Earth’s gravity, extreme temperature variations, high-vacuum conditions, and radiation exposure, making it hazardous for human beings. Rovers are essential for lunar exploration under such conditions, as demonstrated in uncrewed and crewed missions in the U.S.’s Apollo and Soviet Lunar programs.
Rovers vary widely in size, from large human-operated vehicles to small rovers weighing less than a few hundred grams. Large rovers offer substantial ground contact area, traction, and propulsion, but their mass and size result in high development costs. Small rovers, due to their smaller mass and size, enable reduced development costs and payload, allowing them to serve as secondary payloads on launches. Thus, the interest in small rovers is increasing. Batteries and sensors of limited mass and volume to be installed on small rovers should be considered for reducing power consumption. Additionally, the lunar surface is covered with regolith, consisting of fine particles of an average of 70 µm in size, which can range from a few centimeters to several meters deep [7,8], with slopes exceeding 30 degrees [9,10]. Consequently, small rovers tend to become “stuck [11]”, where forward movement is impossible, posing a significant challenge to running on rough terrain such as regolith. To address this challenge, various types of rovers have been proposed, including crawler-type rovers [12] and hopping-type rovers [13]. Four-wheeled rovers [14,15] are being studied due to their high rotation efficiency, ease of control, and simple mechanisms. Wheeled rovers are less influenced by reaction forces from the ground due to the deformation of soft ground. This causes the rover’s wheels to dig into the ground and get stuck [15]. In addition, wheels tend to slip and sink on soft ground [14]. For this reason, small lunar rovers using wheeled systems are limited to climbing angles of around 20 degrees [16]. Furthermore, in four-wheeled rovers, the rear wheels are affected by the sand disturbed by the front wheels [17], making it difficult to identify the optimal wheel type due to the complex interactions of ground reaction forces. Single-wheel tests have also been conducted to study the relationship between wheel rotation speed, slip ratio, and sinkage [18], but little attention has been paid to the power consumption critical for lunar exploration. In this study, a two-wheeled rover was used to evaluate the effects of wheel rotation speed on the running performance of the entire body, rather than assessing the influence on running performance solely at the individual wheel level as in single-wheel tests. This approach allows for an evaluation of the effects of wheel rotation speed on the rover’s power consumption and clarifies the mechanism by which wheel rotation speed affects ground conditions.
For the mass in this study, we referred to YAOKI’s two-wheeled rover and selected 250 g for half, 166 g for one-third, and 83 g for one-sixth. As for speed, we chose a range from 6 rpm to 14 rpm, because sinkage occurs at speeds above 14 rpm, and our goal was to achieve a Lev-2-like mission. By adjusting the wheel rotation speed of a small two-wheeled lunar rover, this study aimed to achieve low-power running on a lunar soil simulant and identify the optimal speed considering ground shear strength and rover mass. The evaluation parameters included running time, slip ratio, power consumption, and sinkage, with tests conducted under various shear strengths and rover masses to clarify the impact of wheel rotation speed on running performance. Based on these results, the relationships between wheel rotation speed, sinkage, and reaction forces from the simulant were investigated. Additionally, tests for measuring reaction force on the lugs were conducted using a robot arm to clarify the relationship between rotation speed and reaction force.

2. Materials and Methods

2.1. The Creation of a Small Two-Wheeled Rover

An overview of the small two-wheeled rover created in this study is shown in Figure 1. The rover was designed by using 3D CAD (Fusion 360, Autodesk Inc., Tokyo, Japan) and printed with a 3D printer (Raise3D Pro3 Plus, Raise 3D Technologies Inc., Irvine, CA, USA) using ABS resin (RAISE 3D technologies Inc., Irvine, CA, USA) as the material. To synchronize the phase and speed of the wheels, two servo motors (XC-330-M288-T, ROBOTIS Japan, Tokyo, Japan) were controlled by a board computer (SPRESENSE, SONY Corporation, Tokyo, Japan). Two wheels were installed on the front of the body, with a tail stabilizer at the rear for support, creating a three-point structure. A total of 20 g was supported by the stabilizer. The circular wheels had a diameter of 100 mm and a thickness of 25 mm, with twelve 10 mm long lugs attached at equal intervals. The overall dimensions of the rover equipped with circular wheels were 200 mm in length, 190 mm in width, and 120 mm in height, with mass adjusted by adding weights.

2.2. Running Test Field

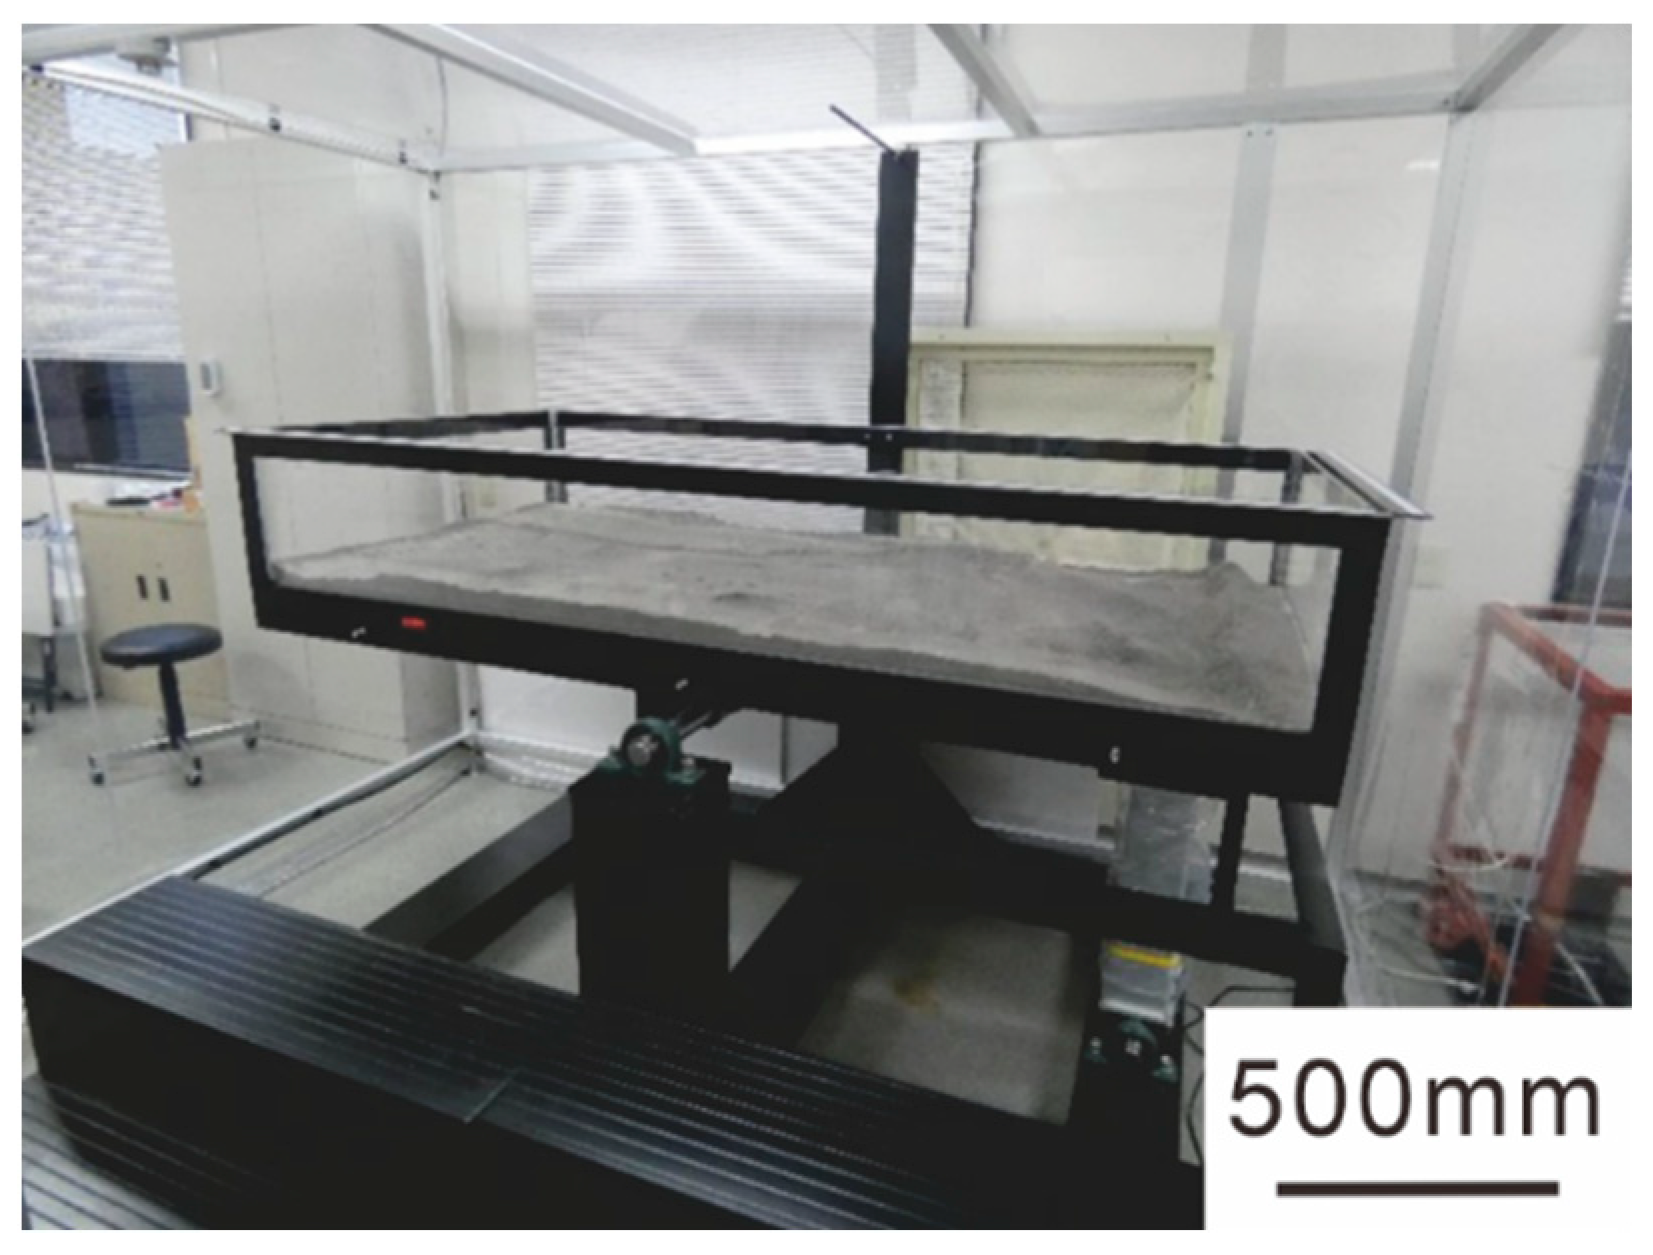
The setup for the running test field is shown in Figure 2. To observe the running pattern, an acrylic container with a width of 1000 mm, length of 2000 mm, and height of 400 mm was used. A lunar soil simulant (FJS-1, SHIMIZU CORPORATION, Tokyo, Japan) was laid in the acrylic container to a depth of 100 mm as a substitute for regolith.

2.3. Density Test

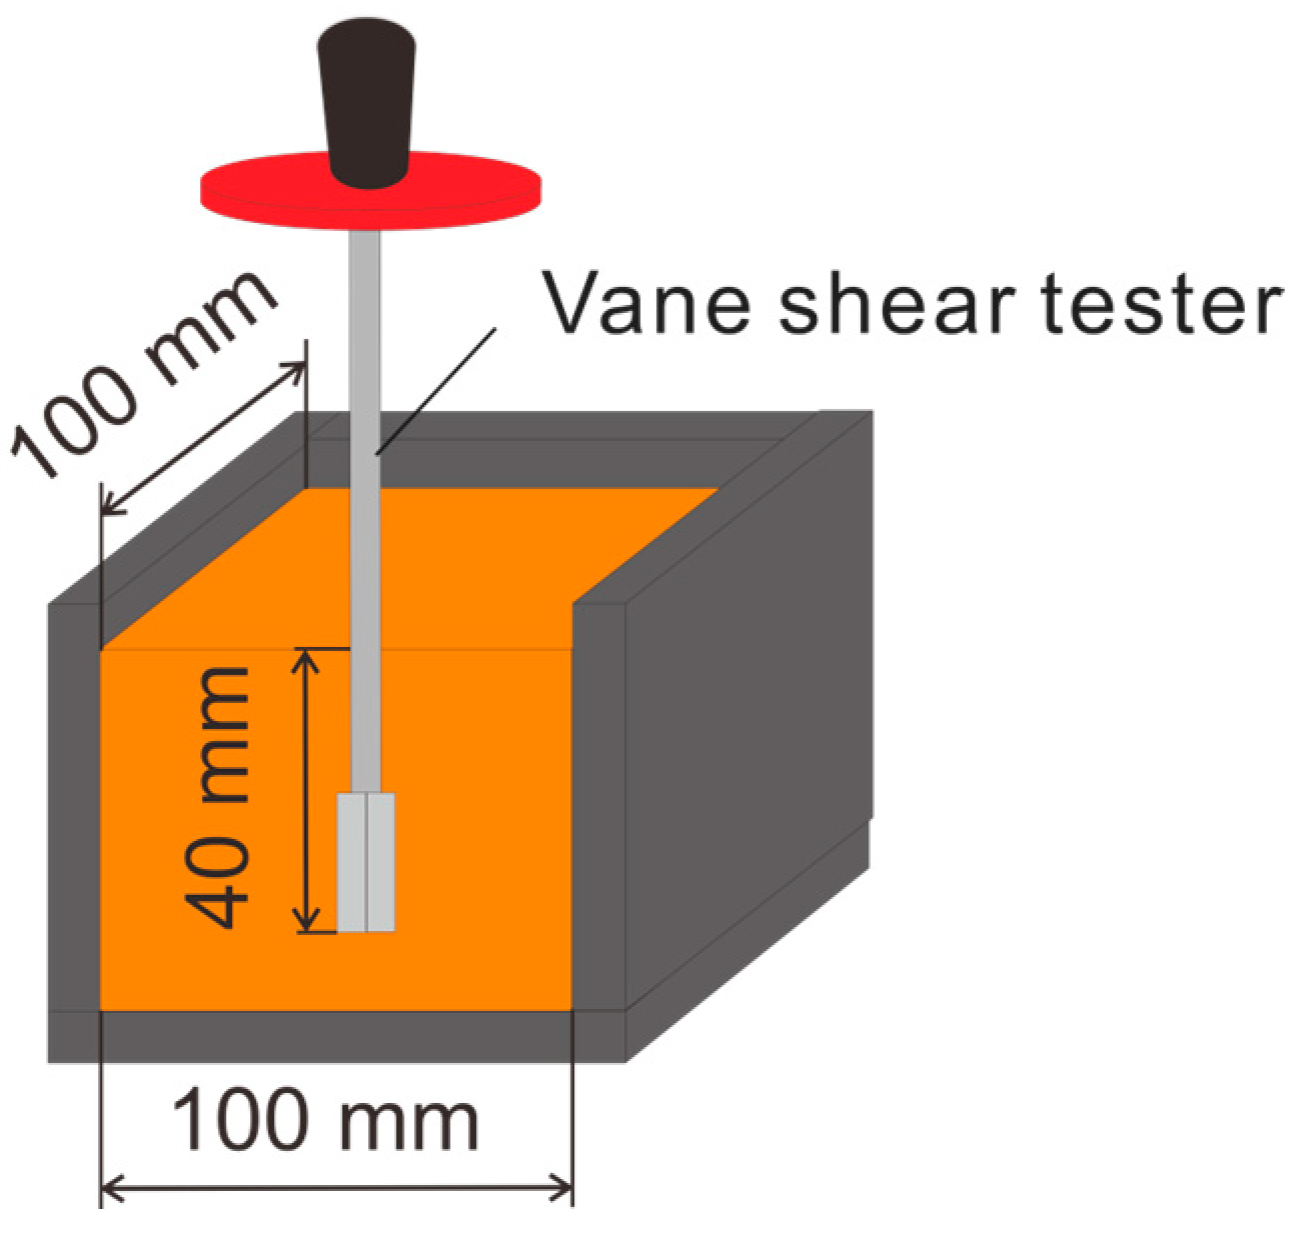
A density test was conducted to measure simulant density and shear strength, as shown in Figure 3. Containers of 100 mm in width, 100 mm in length, and 100 mm in height were filled with a simulant of varying densities from 1.65 g/cm3 to 1.80 g/cm3 in increments of 0.05 g/cm3. Shear strengths at depths of 20 mm and 40 mm were measured using a vane shear tester (FTD2CN-S, nishinihonshikenki, Osaka, Japan).

2.4. Running Test

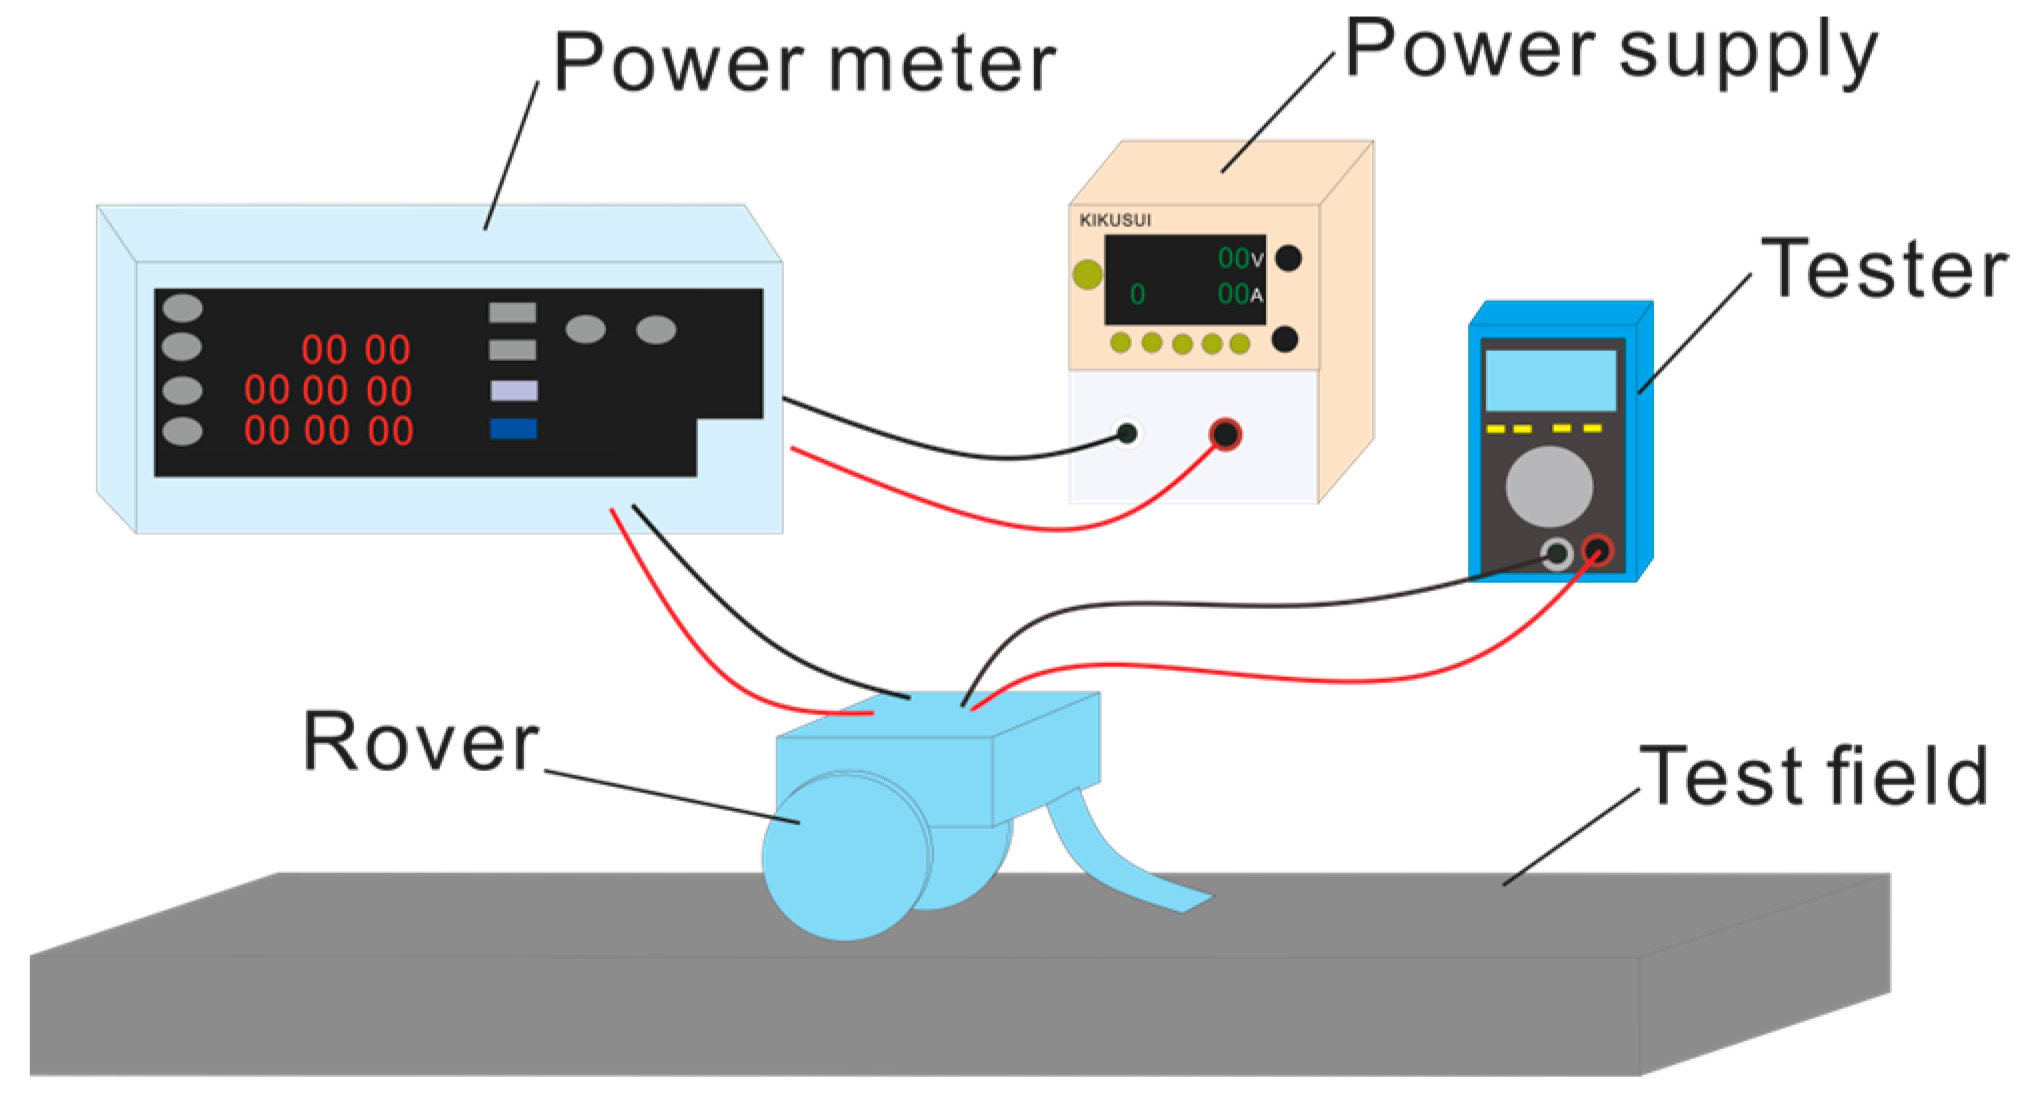
An overview of the running test is shown in Figure 4. Four parameters—running time, power consumption during running, slip ratio, and wheel sinkage—were used to evaluate running performance. A test running distance of 700 mm was set, and the slope angle was adjusted to 0 and 5 degrees using a digital angle gauge by tilting the test field. The power supply was set at an output voltage of 5 V using a DC stabilized power source (PMX18-5A, KIKUSUI ELECTRONICS CORP, Kanagawa, Japan). Five levels of wheel rotation speeds (6, 8, 10, 12, and 14 min−1) and three mass conditions (83 g (7 g supported by stabilizer), 166 g (12 g supported by stabilizer), and 250 g (20 g supported by stabilizer)) were used in the running tests. Additionally, the shear strength at a depth of 40 mm in the test field was set to 0.40 ± 0.05 cNm, 0.60 ± 0.05 cNm, and 1.00 ± 0.05 cNm by compacting the surface with a flat plate. Power consumption was measured with a power meter (PW3335, HIOKI E. E. CORPORATION, Nagano, Japan) over the same distance as the running time measurement. A power meter (B35T+, OWON Technology Inc., Tokyo, Japan) recorded voltage and current at 0.01 s intervals. The torque test employed the pulley method, in which the weight was lifted one gram at a time, and the voltage and current were measured at that time. The weight was adjusted so that the data obtained in this test match the data obtained during the running test, and the motor unit efficiency was calculated. Motor unit efficiency, η , was calculated with the following equation:
η = N T V I
where N is the motor rotation speed, T is load torque, V is voltage, and I is current. The slip ratio λ was calculated using the following equations:
λ = 1 V ω r ω : D r i v i n g r ω V ω
λ = 1 r ω V ω : B r e a k i n g V ω r ω
where V ω is the wheel movement speed, r is the wheel circumference, and ω is the angular velocity. The wheel movement speed was calculated from the running time and running distance on the test field.
Figure 5 shows the setup for sinkage measurement. Reflective markers were attached to the upper and side surfaces of the rover as well as to the upper and side surfaces of the running test field’s outer walls for the running tests. The running test setups were illuminated by two lights, and the tests were recorded by two cameras mounted on a non-contact 3D displacement and strain measurement system (ZEISS ARAMIS Adjustable 24M, Carl Zeiss AG, Oberkochen, Germany). The obtained data were recorded with dedicated software (ZEISS INSPECT, 2023 Carl Zeiss AG, Oberkochen, Germany) to capture vertical displacement.

2.5. Test for Measuring Reaction Force

To measure the reaction force received by the wheel lugs of the rover, a test for measuring reaction force was conducted, as shown in Figure 6. A three-axis force sensor (USLG25, Tec Gihan Co., Ltd., Kyoto, Japan) and a plate that mimics the wheel lug were attached to the end of a robot arm (RV-4FR, Mitsubishi Electric Corporation, Tokyo, Japan). The robot arm’s position was set to match the wheel rotation radius of 60 mm and to insert the plate to a depth of 10 mm in the simulant, aligning with the height of the wheel lugs. The reaction force received from the simulant was measured while the plate attached to the force sensor was perpendicular to the ground. The rotation speed of the robot arm matched that of the small two-wheeled rover used in the running tests.

3. Results

3.1. The Results of the Density Test

The results of the simulant density tests are shown in Figure 7. The results indicated that higher density corresponded to greater shear strength. And it can be seen that the deeper the depth, the greater the shear strength. Furthermore, the relationship between density and ground depth for regolith was defined using the following equations, where r represents density and r ground depth [8].
ρ = 1.92 z + 12.2 z + 18
ρ = 1.39 z 0.056
The calculations with both equations suggested that the density of regolith at a depth of 40 mm was lower than the minimum density of the simulant used in this study, which was 1.65 g/cm3. This indicates that the simulant density was greater than the density of regolith. From the results of density tests, the shear strength of regolith is not known. Therefore, in order to conduct experiments that simulate running on regolith, it is necessary to predict the shear strength of regolith, which is an important parameter for running. As an example, a regression equation for density ρ and shear strength τ was proposed as follows.
τ = 6.15 ρ 2 15.1 ρ + 8.57
From the above equation, the shear strength of regolith can be predicted from its density.

3.2. The Results of the Running Test

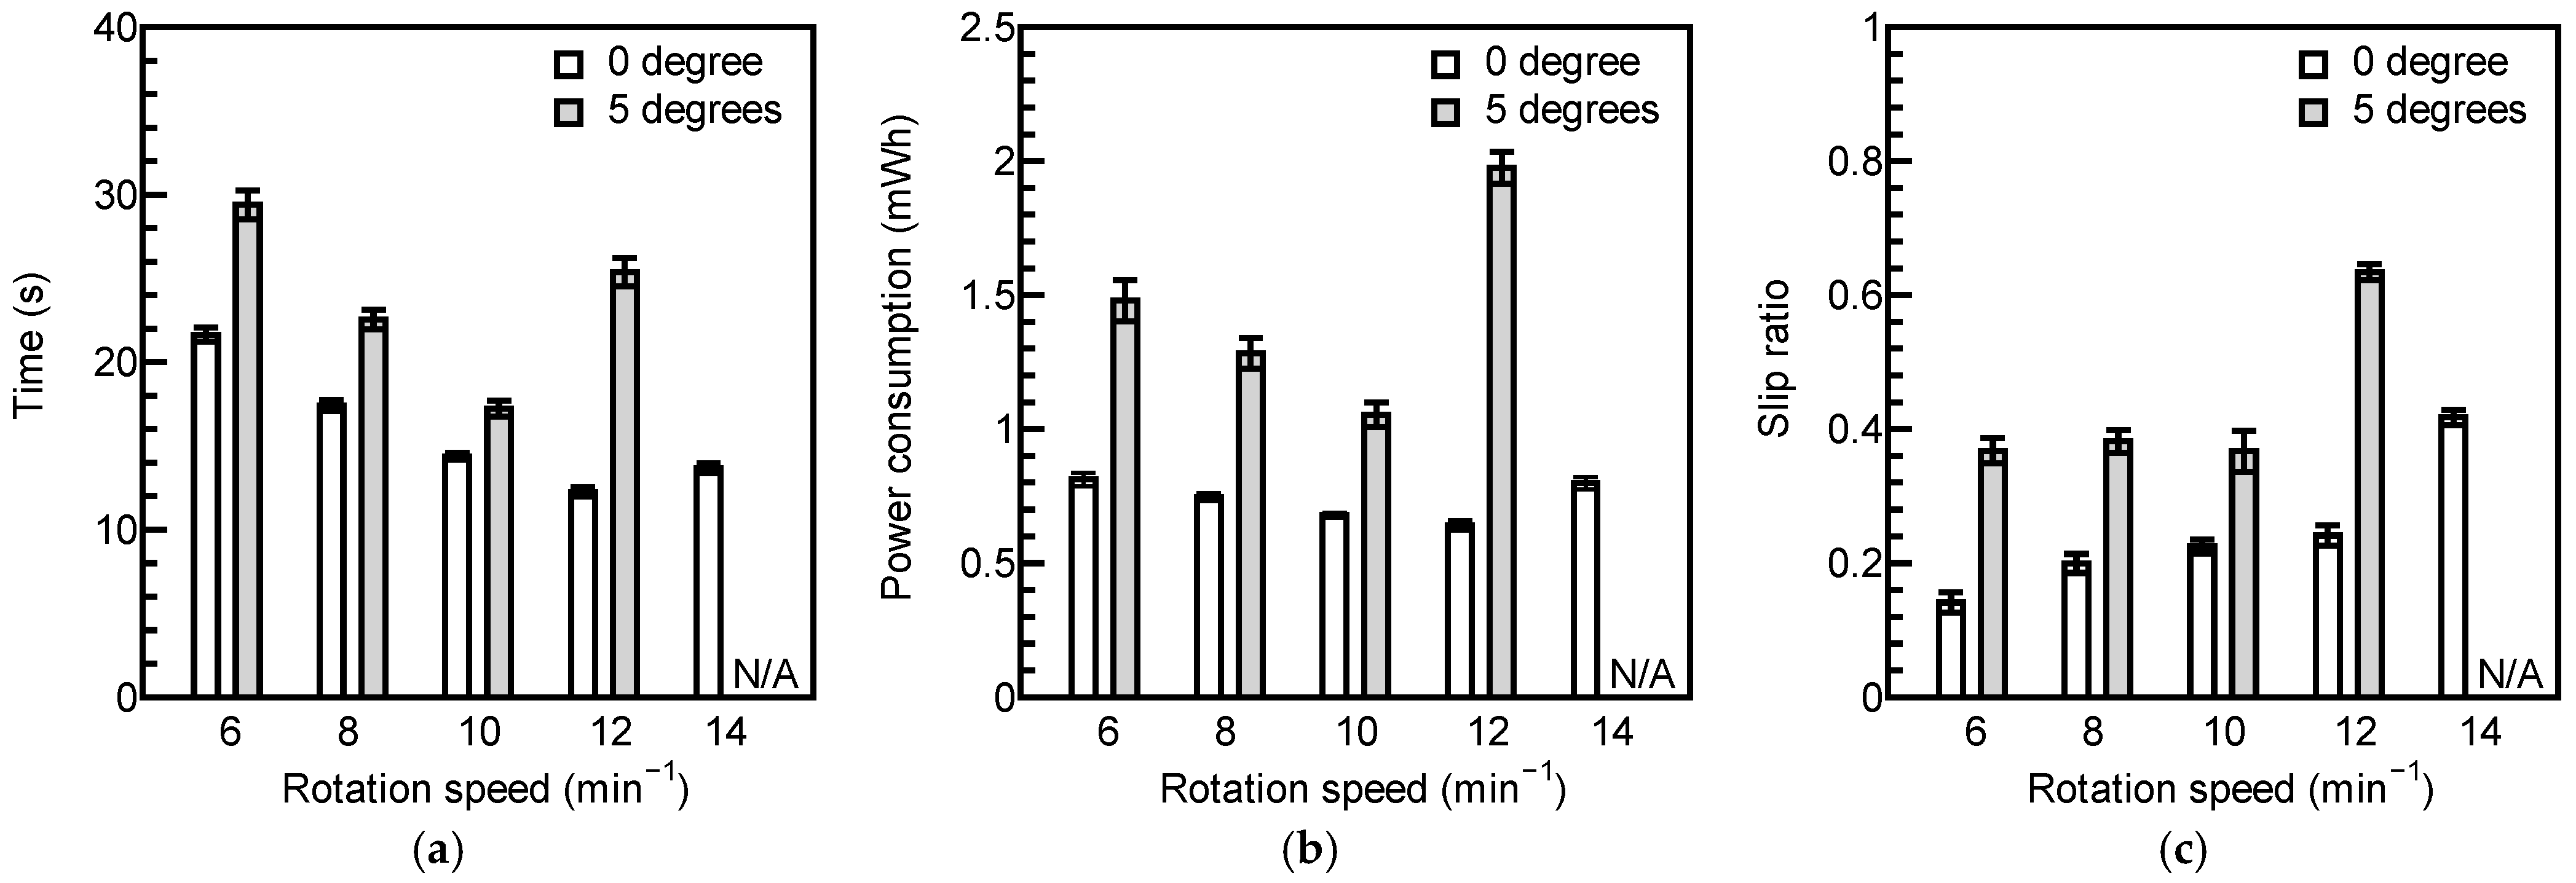
Figure 8 shows the running test results for a shear strength of 0.40 ± 0.05 cNm on the test field and a rover mass of 250 g. At a slope angle of 0 degrees, the results indicated that up to a wheel rotation speed of 12 min−1, the higher the wheel rotation speed, the shorter the running time and the lower the power consumption. However, at above 12 min−1, running time and power consumption increased. The slip ratio also showed a tendency to increase with higher wheel rotation speeds. At a slope angle of 5 degrees, running was not possible at a wheel rotation speed of 14 min−1. For power consumption and running time, up to 10 min−1, higher wheel rotation speeds resulted in shorter running times and lower power consumption, but beyond 10 min−1, running times increased, and power consumption rose. The slip ratio also tended to increase at speeds above 10 min−1.
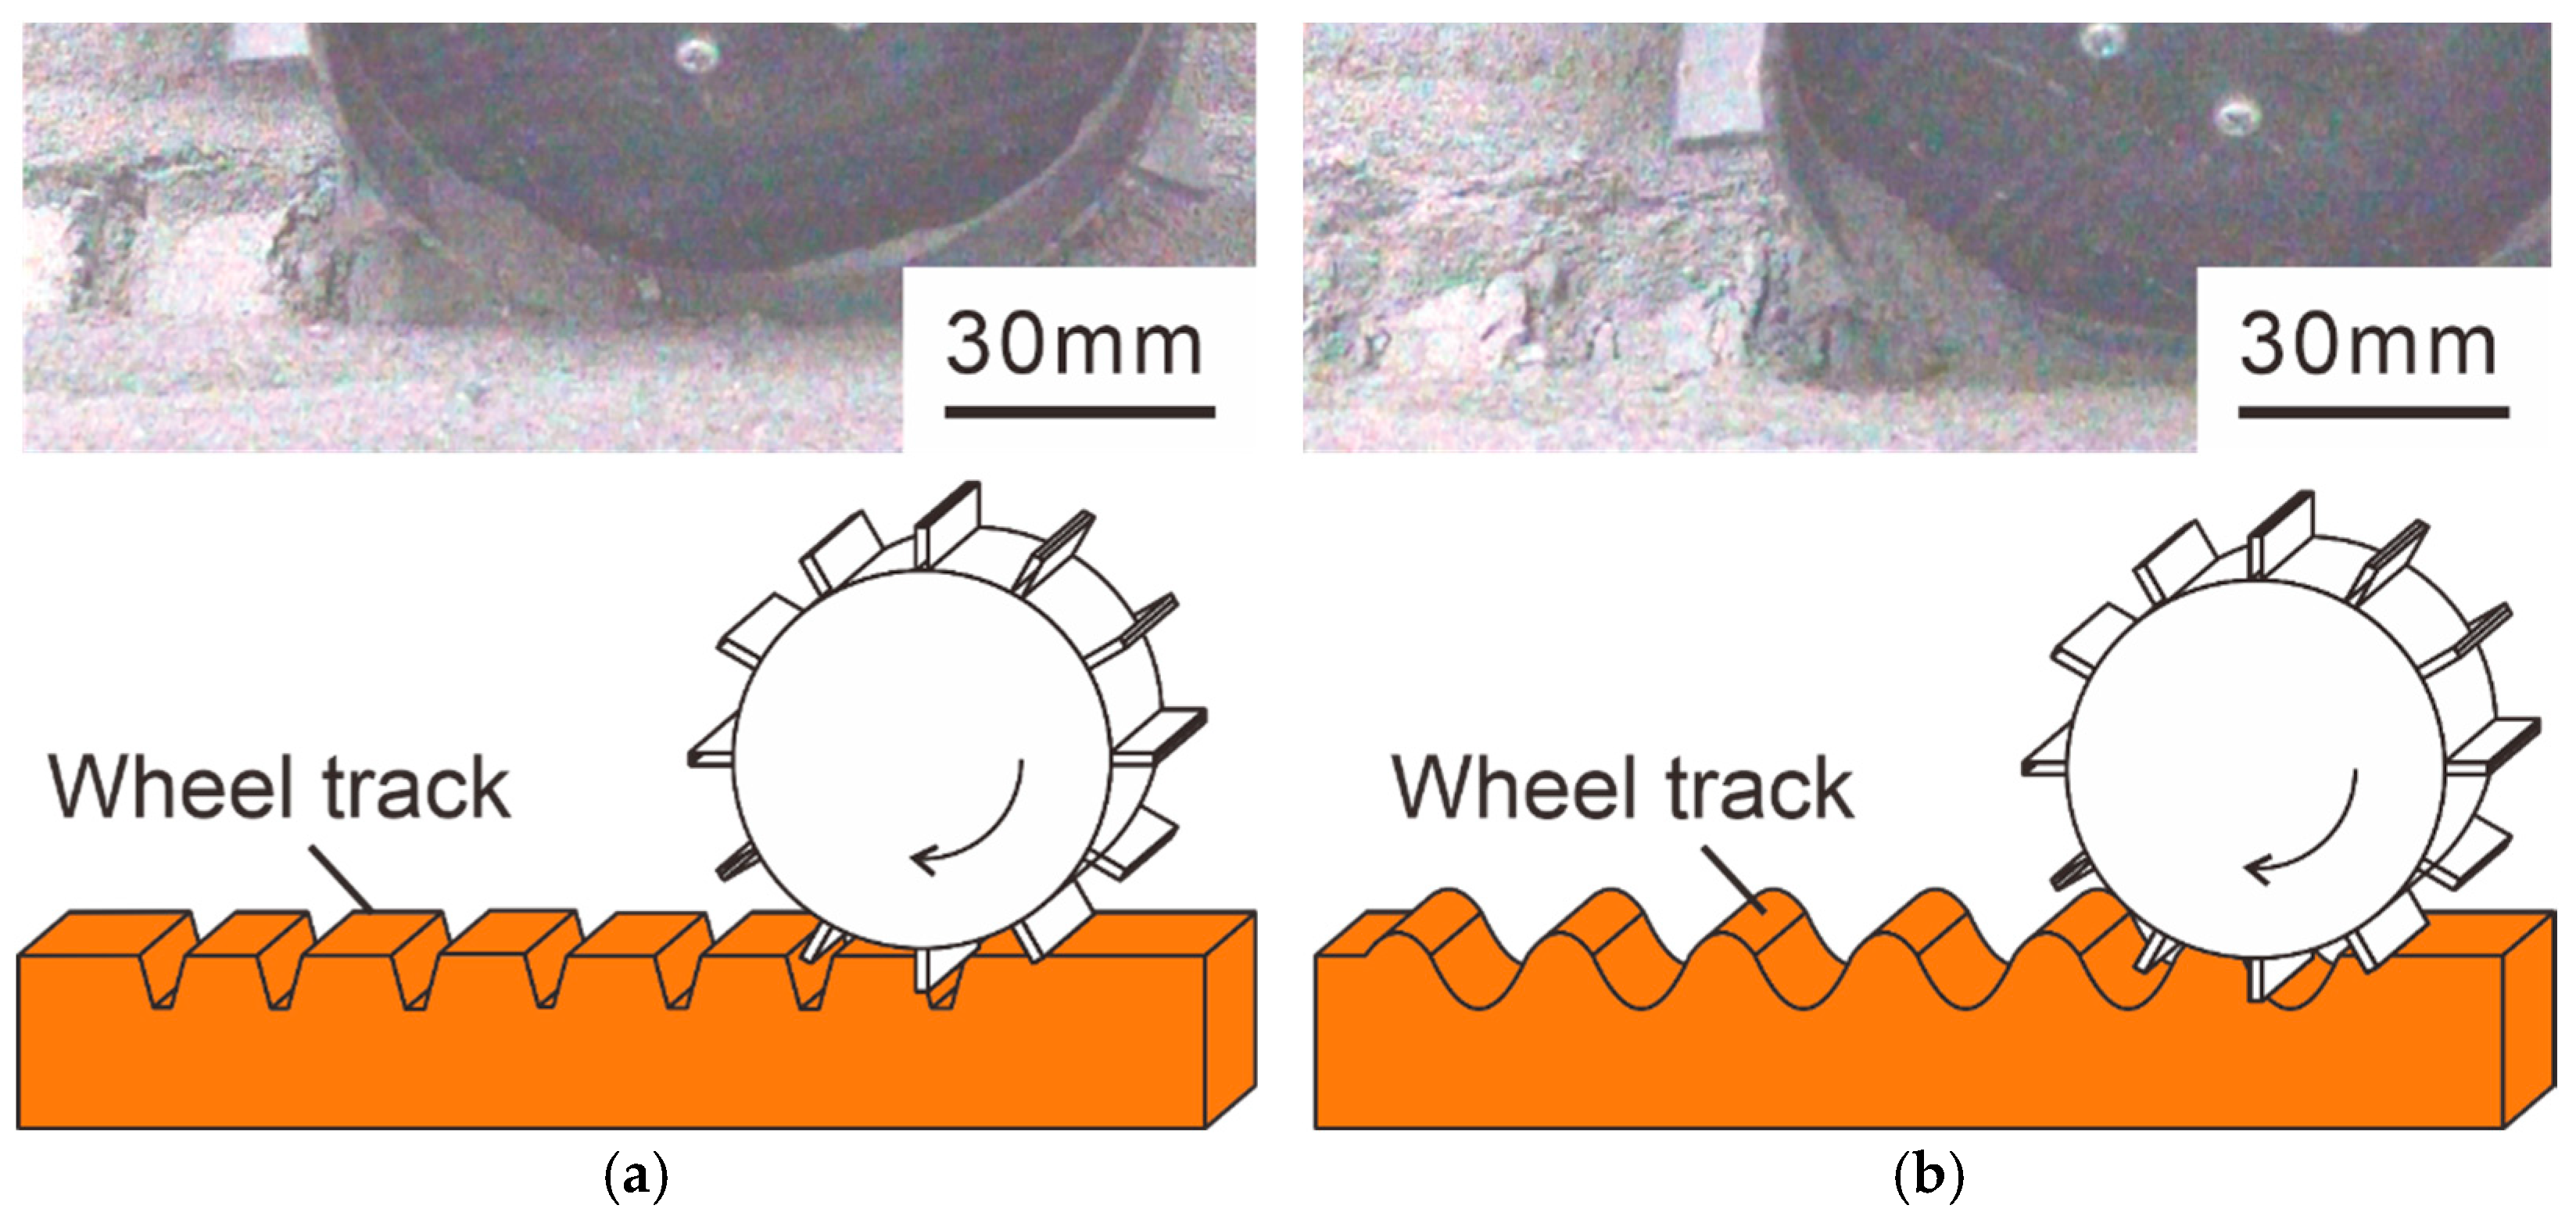
Figure 9 illustrates the condition of the ground immediately after running at a slope angle of 0 degrees with wheel rotation speeds of 6 min−1 and 10 min−1. At 10 min−1, the rover tended to dig into the ground while advancing forward. Therefore, higher wheel rotation speeds cause more ground digging during running. At 6 min−1, tracks were visible, indicating that lower wheel rotation speeds compact the ground.
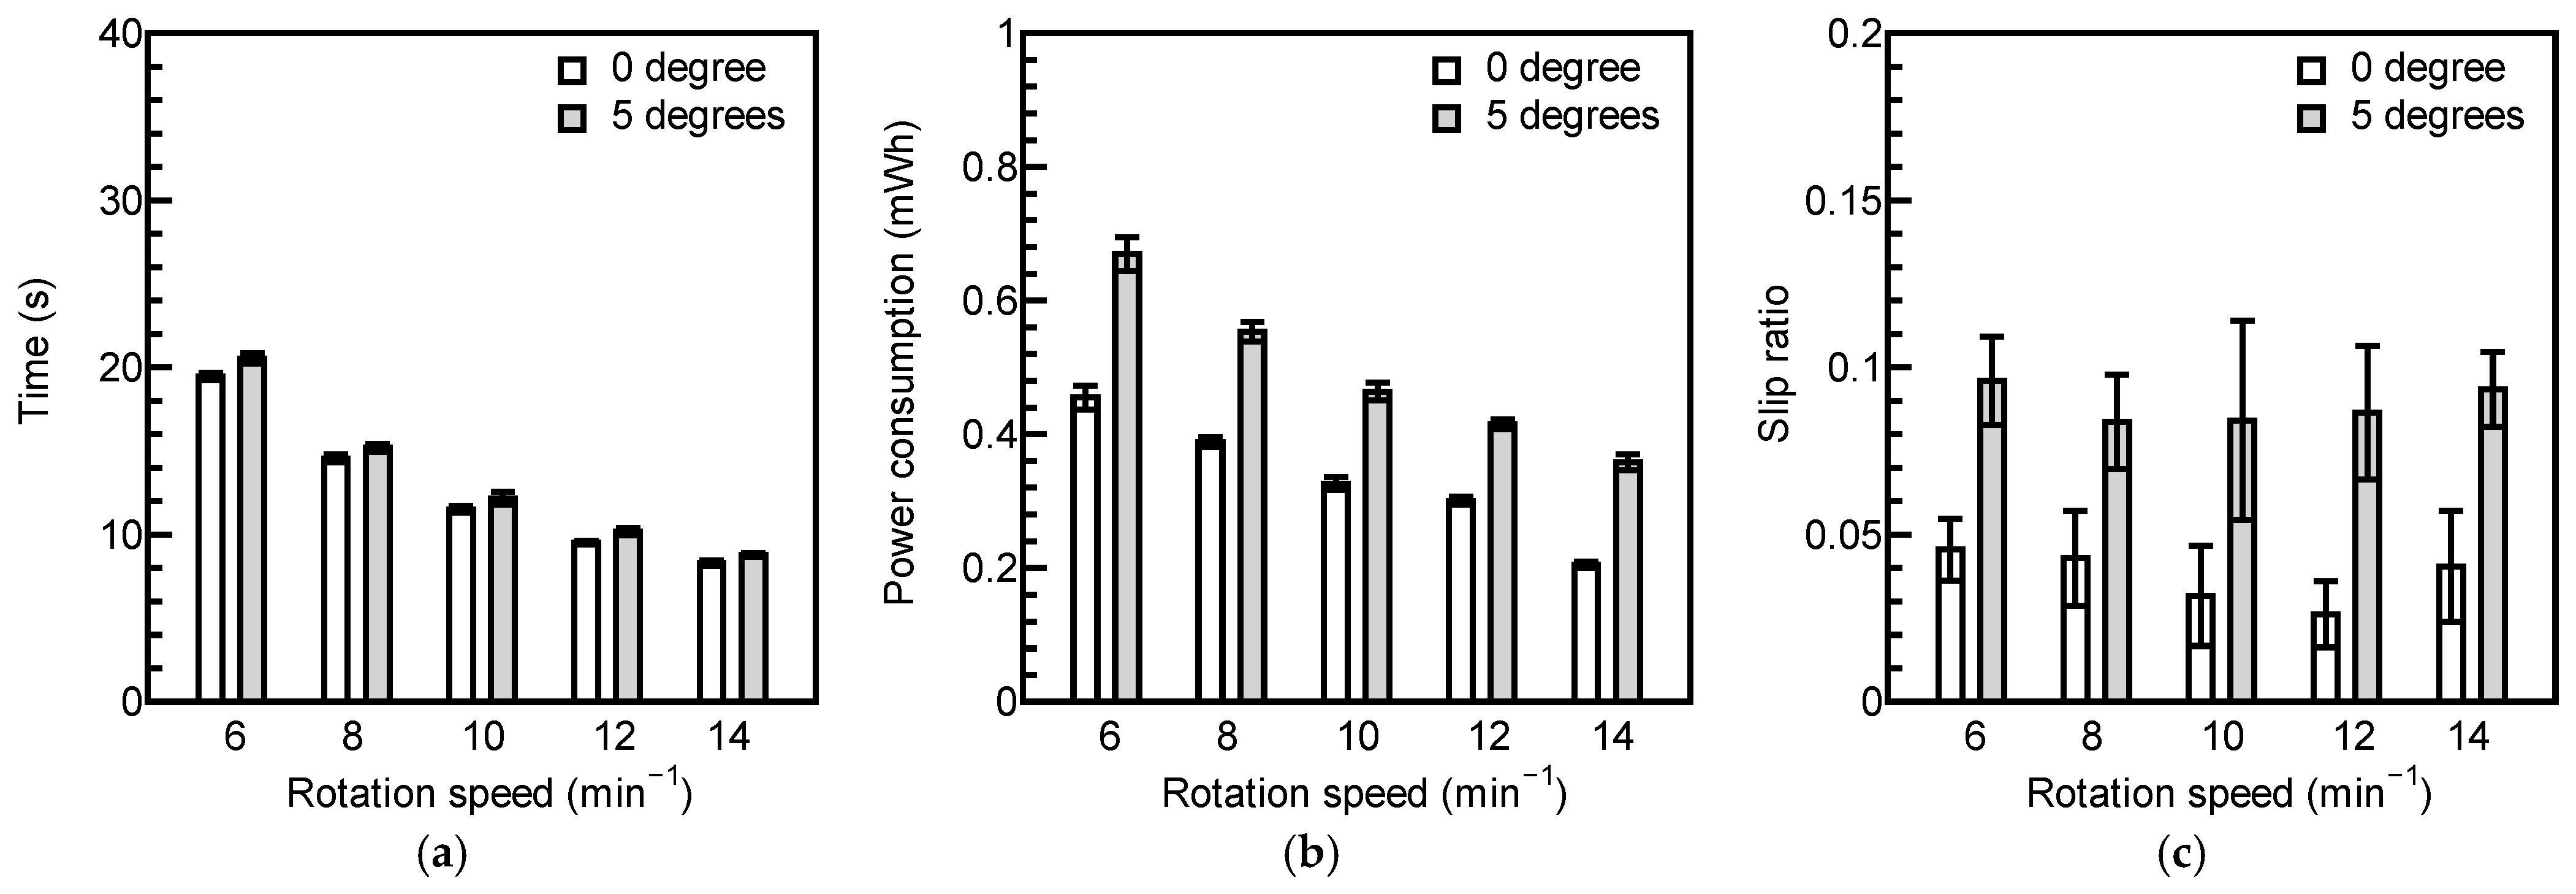
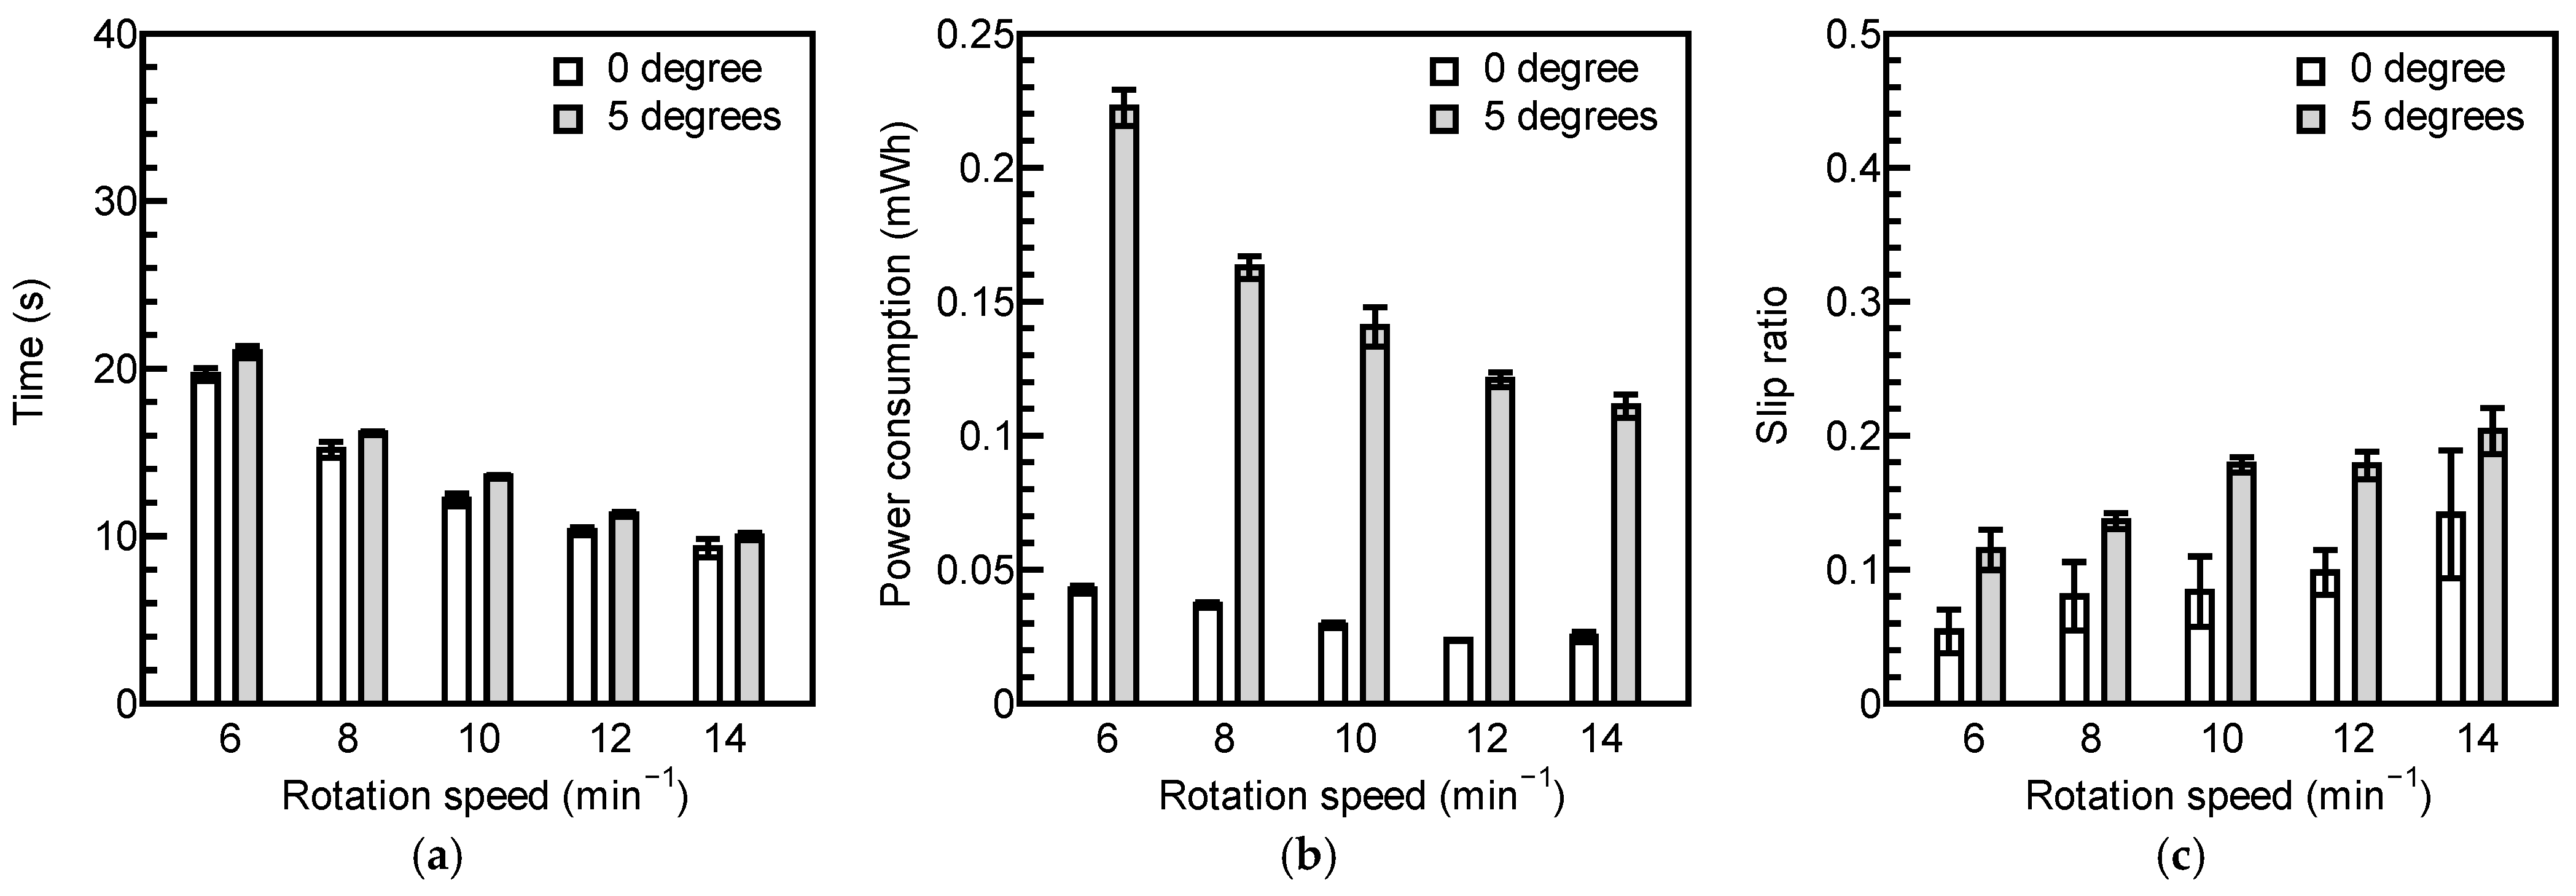
Figure 10 presents the running test results at a shear strength of 0.60 ± 0.05 cNm on the test field and a rover mass of 250 g. At both slope angles of 0 and 5 degrees, higher wheel rotation speeds resulted in shorter running times and lower power consumption. The slip ratio showed no significant difference. Figure 11 presents the running test results at a shear strength of 1.00 ± 0.05 cNm on the test field and a rover mass of 250 g. At both slope angles of 0 and 5 degrees, higher wheel rotation speeds resulted in shorter running times and lower power consumption. The slip ratio showed no significant difference. Figure 12 presents the running test results at a shear strength of 0.40 ± 0.05 cNm on the test field and a rover mass of 83 g. At both slope angles of 0 and 5 degrees, higher wheel rotation speeds resulted in shorter running times and lower power consumption. However, the slip ratio tended to increase with higher wheel rotation speeds. Figure 13 shows the running test results for a shear strength of 0.40 ± 0.05 cNm on the test field and a rover mass of 166 g. At both slope angles of 0 and 5 degrees, a higher wheel rotation speed resulted in a shorter running time. For power consumption, the results indicated that up to a wheel rotation speed of 10 min−1, the higher the wheel rotation speed, the lower the power consumption. However, at above 10 min−1, power consumption increased. The slip ratio also showed a tendency to increase with higher wheel rotation speeds.
From these results, it was concluded that an optimal wheel rotation speed exists for each condition, which minimizes power consumption and enables effective running. This optimal speed was found to increase with higher shear strength and rover mass.

3.3. The Results of the Test for Measuring Reaction Force

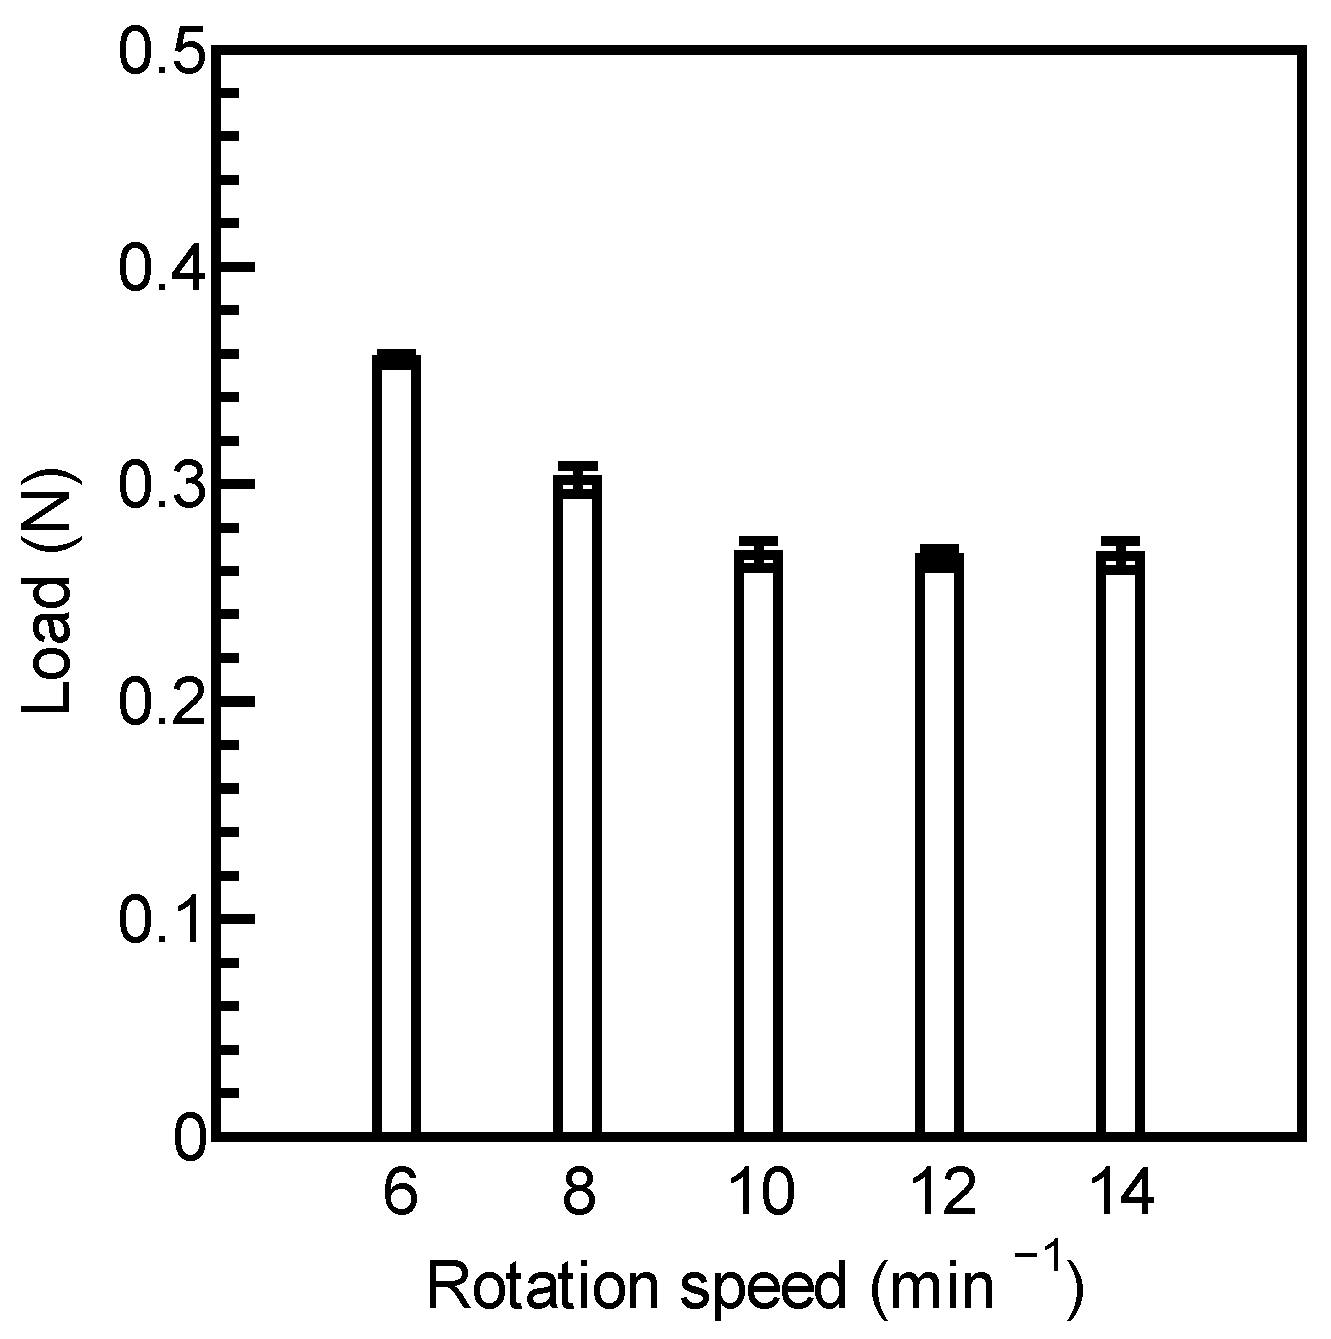
The results of the tests for measuring reaction force are shown in Figure 14. Up to a wheel rotation speed of 10 min−1, the reaction force decreased as the rotation speed increased. However, at speeds above 10 min−1, the reaction force remained unchanged, regardless of further increases in rotation speed. This finding indicates that when the wheel rotation speed exceeds a certain threshold, a sufficient reaction force for running cannot be obtained.

3.4. Results of Sinkage Measurement

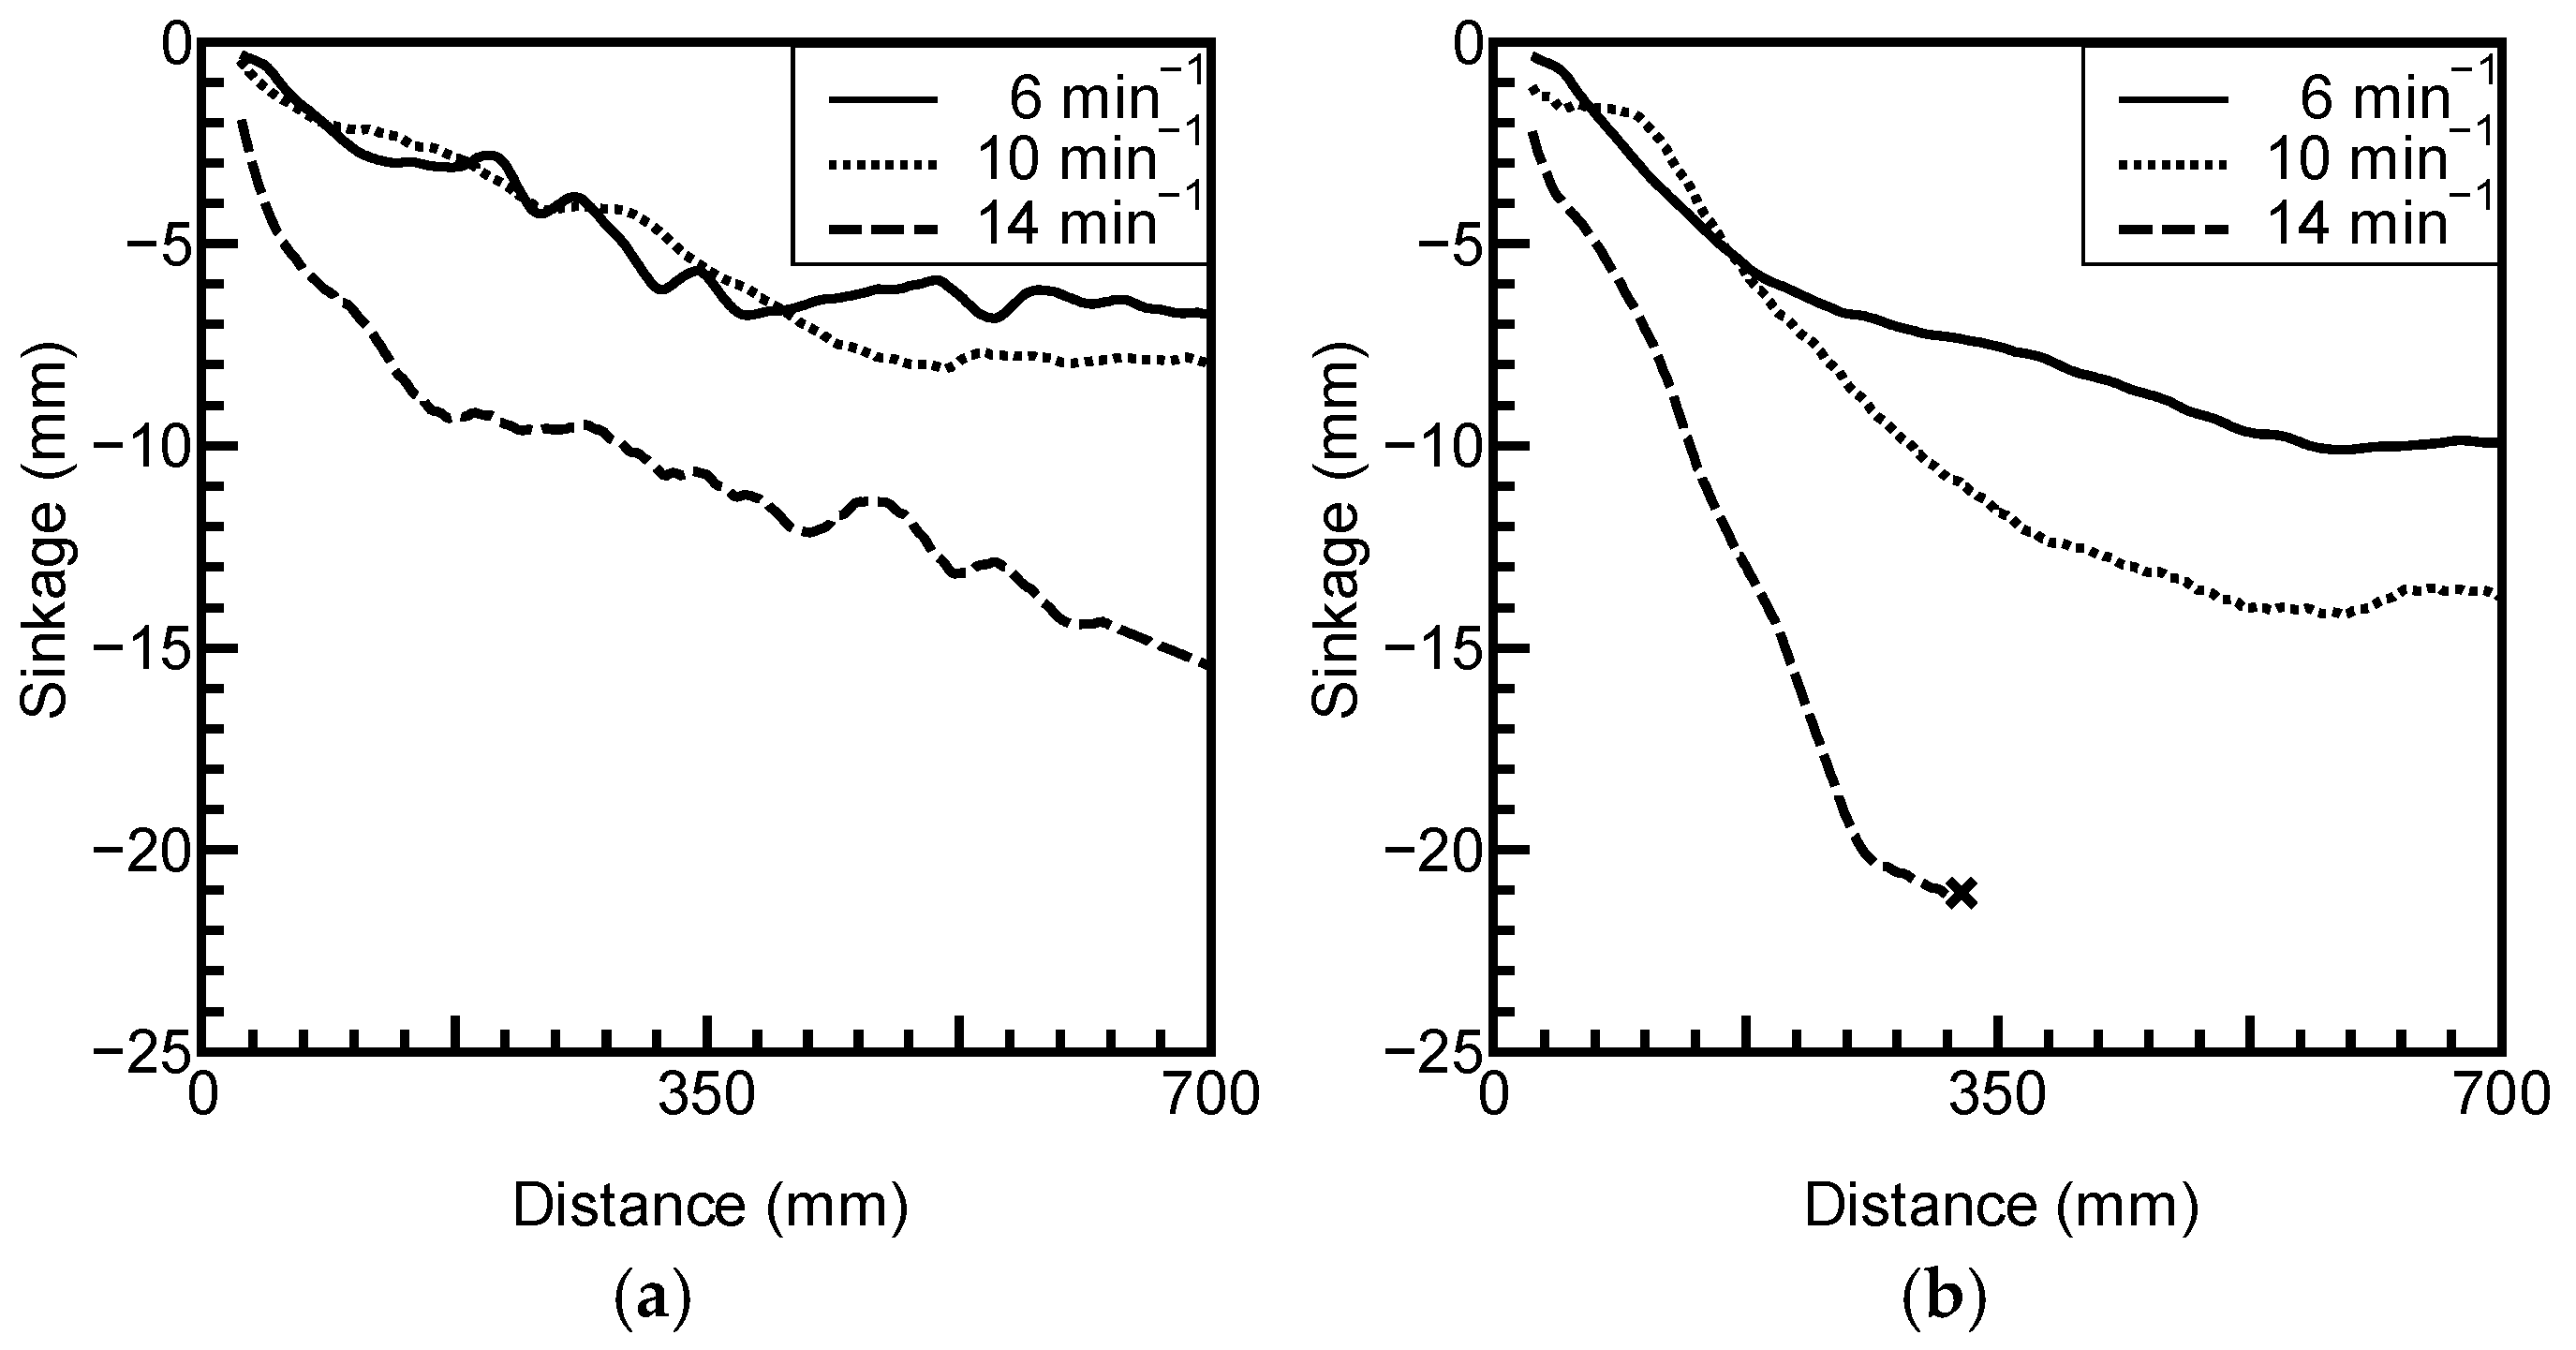
The results of sinkage measurements for a shear strength of 0.40 cNm and a rover mass of 250 g are shown in Figure 15. At both slope angles of 0 and 5 degrees, the sinkage converged to a certain level at wheel rotation speeds of 6 min−1 and 10 min−1, while at 14 min−1, the rover continued to sink and became stuck at a slope angle of 5 degrees. These results indicate that higher wheel rotation speeds result in higher sinkage. For other conditions of mass and shear strength, the sinkage also converged to a certain level.

4. Discussion

4.1. Traction Force of Wheels

The traction force of the wheels on a slope can be modeled using the following equation, as proposed in a previous study [15]:
D P = r b θ 1 θ 2 τ θ c o s θ d θ θ 1 θ 2 σ θ s i n θ d θ + L j b λ θ 1 θ 2 R b c o s θ d θ
where r is the wheel radius, b is the wheel width, θ 1 is the entry angle, θ 2 is the exit angle, τ ( θ ) is the shear stress, σ ( θ ) is the vertical stress, L j is the lug length, λ is the slip ratio, and R b is the passive pressure acting on the lug. This equation suggests that the shear stress on the wheel surface and the passive pressure on the wheel lugs both contribute to the traction force.

4.1.1. Shear Stress

Shear stress can be expressed as follows [15]:
τ θ = ( c + σ θ t a n ϕ ) ( 1 exp j θ K )
where c is soil cohesion, ϕ is the internal friction angle, j is the shear strain, and K is the deformation modulus. Additionally, cohesion can be calculated by the following equation [19]:
c = f v d W × z c π D 2
where f v d W is the Van der Waals force, z c is the coordination number of particles, and D is the particle diameter. This equation suggests that adhesion increases as the particle coordination number increases. The coordination number is also related to density. An increase in adhesion results in an increase in shear stress. The ruts in Figure 9 indicate that higher wheel rotation speeds prevent ground compaction. And Figure 15 shows that the sinkage tends to be larger at higher wheel rotation speeds. Moreover, Figure 7 shows that a greater ground depth correlates with increased shear strength. Therefore, as wheel rotation speed increases, sinkage increases, which in turn increases shear stress. This implies that as long as the rover avoids excessive sinkage that leads to it getting stuck, greater wheel rotation speeds result in a higher shear stress, thus yielding a higher traction force.

4.1.2. Passive Pressure

In soft ground conditions, passive pressure from the lugs is reported to be the primary source of traction [11] and can be expressed using Rankine’s earth pressure theory as follows [20]:
R b = 1 2 ρ g H 2 tan 2 ( 45 ° + ϕ 2 )
where H is the lug sinkage. The above equation suggests that higher ground density leads to greater passive pressure, which, in turn, increases the traction force of the wheels. Therefore, as wheel rotation speed increases, higher sinkage contributes to increased passive pressure on the wheel lugs.

4.2. Sinkage and Ground Density

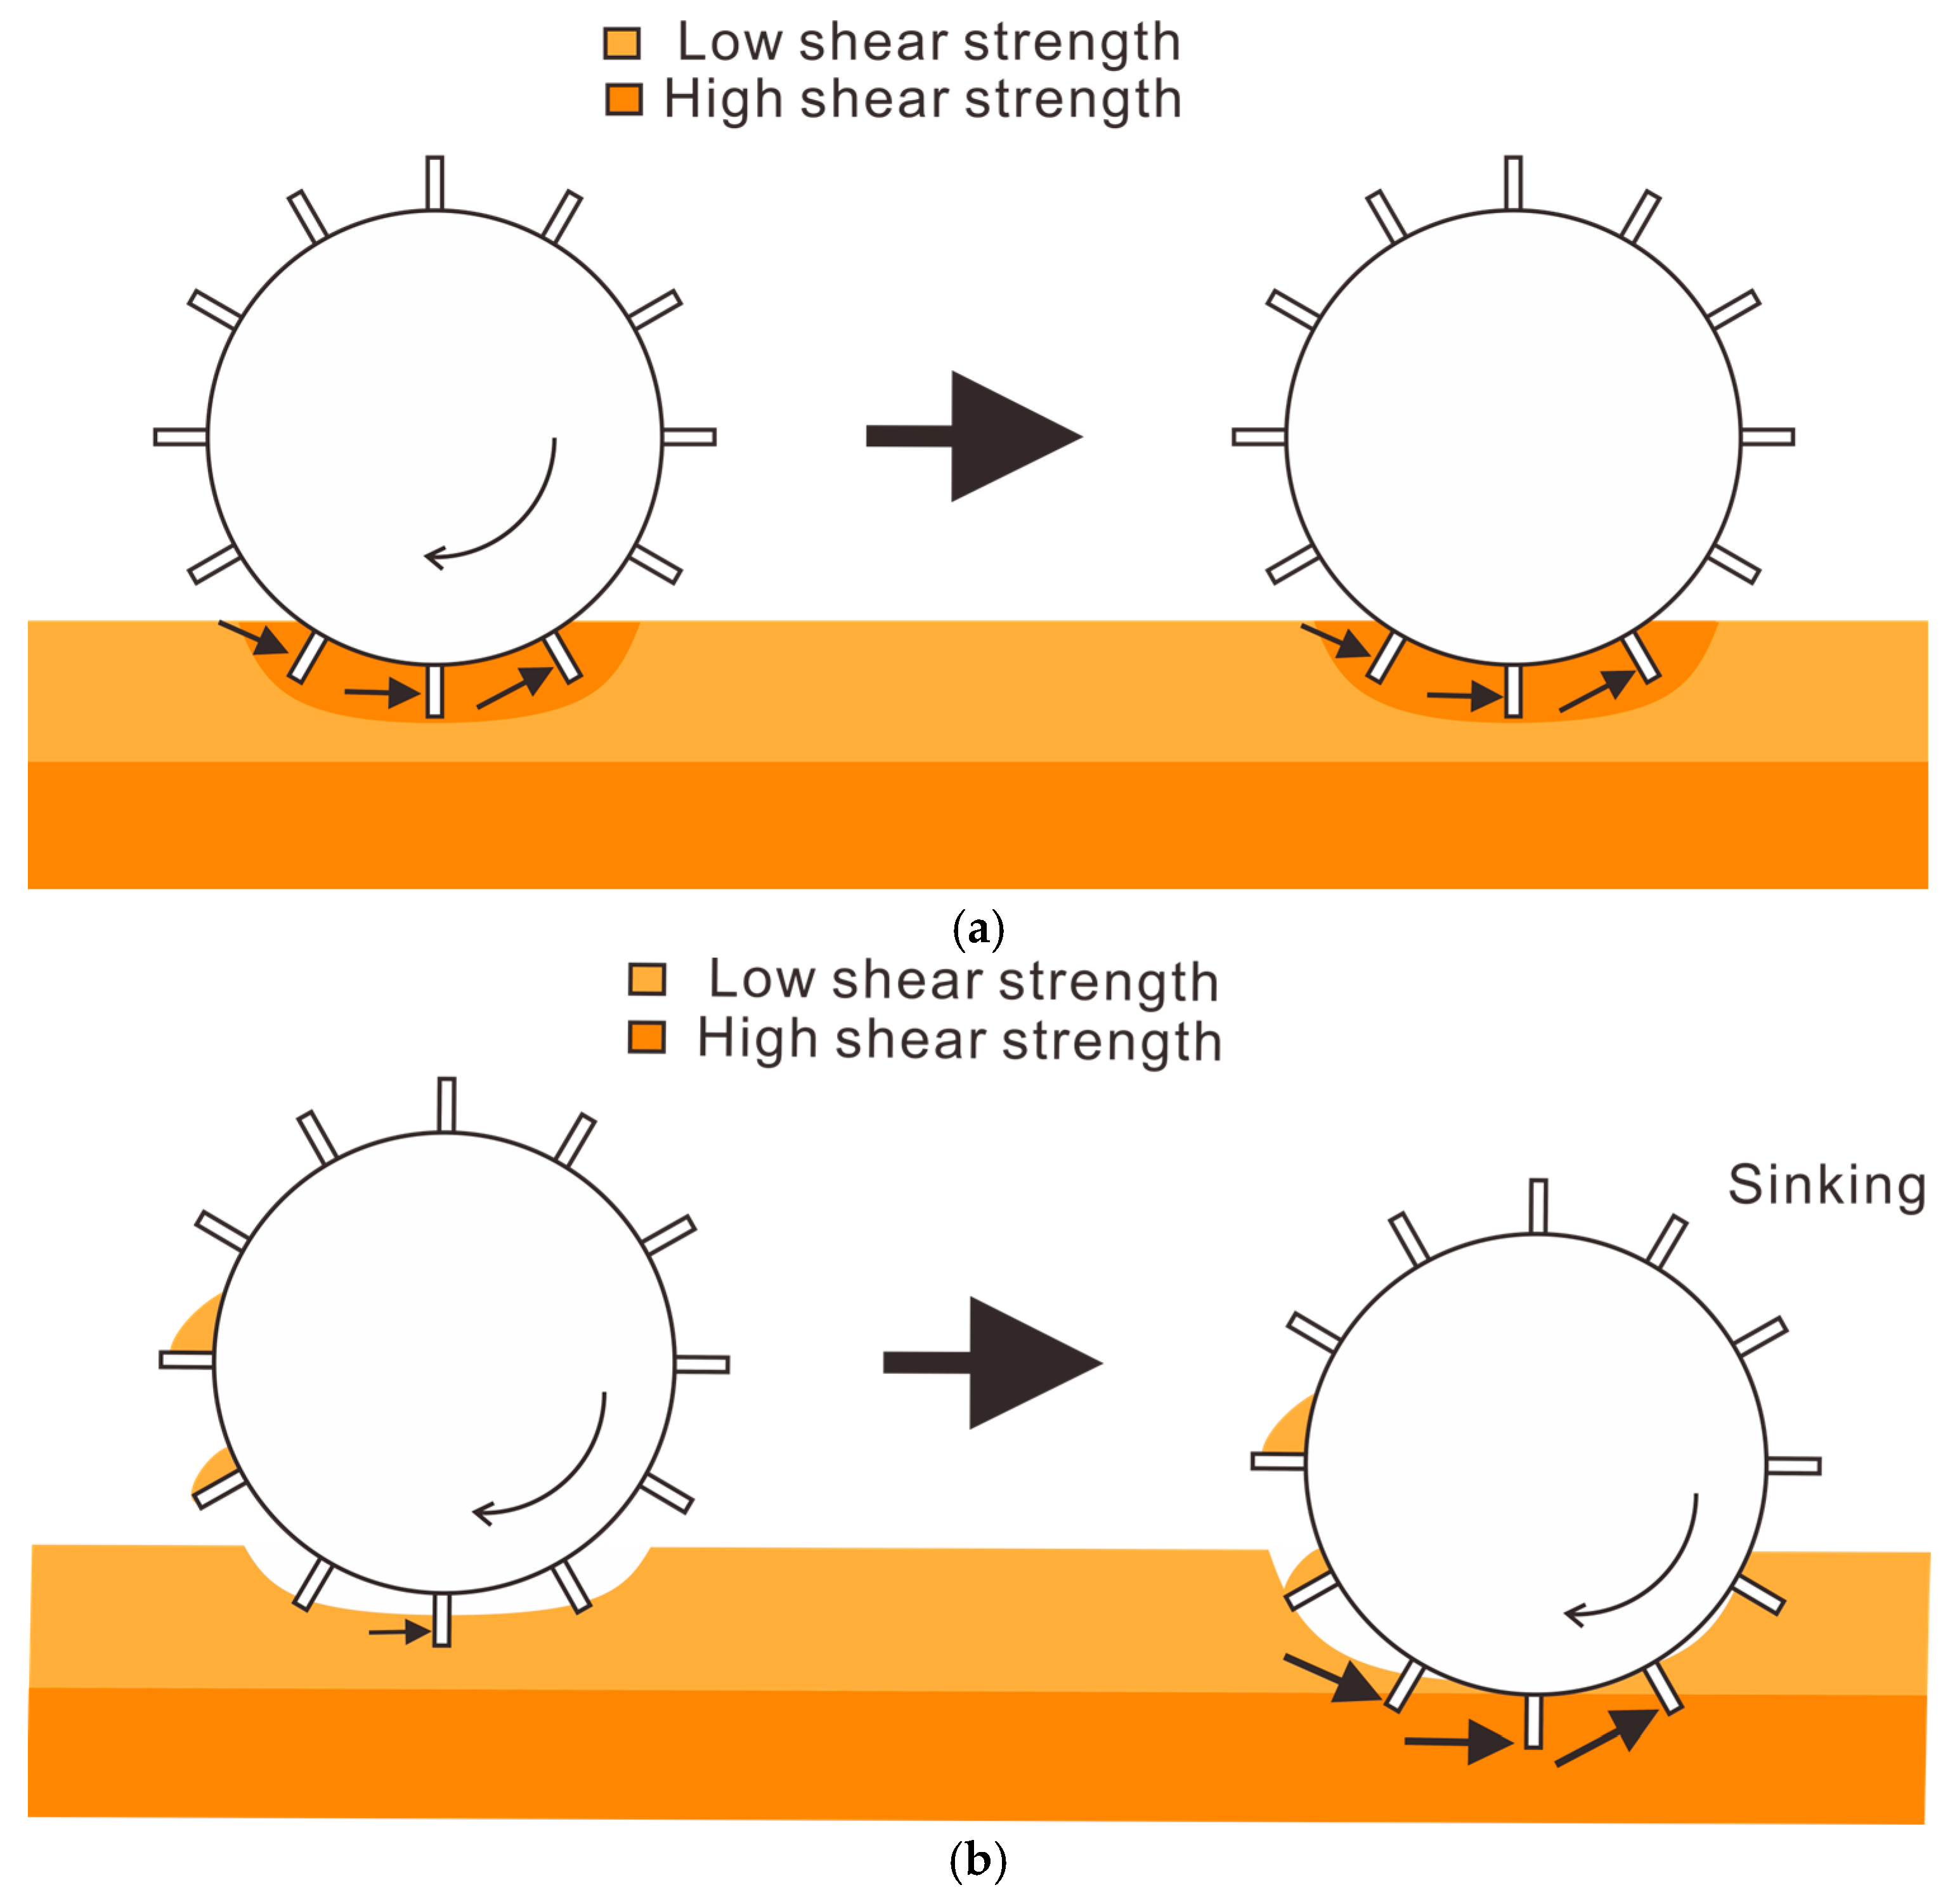
Figure 16 illustrates the running behavior at low and high wheel rotation speeds. On soft ground, the application of pressure causes a compaction phenomenon known as shrinkage, which increases ground density [11]. It has also been reported that higher speeds reduce rolling friction [21]. Therefore, at higher wheel rotation speeds, the rover tends to dig through the ground, leading to lower shear strength and increased sinkage. At lower wheel rotation speeds, the rover compacts the ground as it runs, which increases ground density through compaction, allowing the wheels to resist sinking. Additionally, as shown in Equations (4) and (5), on soft ground like regolith, greater depths correspond to higher density. Furthermore, Figure 12 shows that higher density correlates with increased shear strength. It has also been reported that higher forward speeds increase the horizontal load between the ground and the wheels [21]. When this horizontal load exceeds the ground’s shear strength, sinkage occurs. From these findings, it can be inferred that as wheel rotation speed increases, the horizontal load also increases, resulting in greater sinkage. As sinkage increases, the shear strength of the ground becomes larger, eventually causing the sinkage to stabilize at a certain level. If this stable sinkage exceeds the stack sinkage of the rover, the rover gets stuck.

4.3. Optimal Speed

As speed is reported to deteriorate traction performance if it is too fast [22], it is important to run at the optimum speed for efficient traveling. The 3D graphs of the experimental results for different masses and different densities are shown in Figure 17. The experimental results indicate that, up to a certain wheel rotation speed, increasing the wheel rotation speed results in shorter running times and reduced power consumption. However, beyond a specific wheel rotation speed, sinkage increases and resistance from the ground increases, leading to higher power consumption. Therefore, running at the optimal speed is essential for improving running performance. Based on the results from tests with different rover masses, a regression equation for mass and power consumption was derived using a dimensionless quantity with the reference quantity as the respective maximum value as follows, where M represents the mass and W the power consumption:
W = 1.25 M 0.424
The R-squared value of this equation is 0.945. This equation indicates that power consumption is greatly influenced by mass, with higher mass leading to increased power consumption. Similarly, based on experiments with different ground densities, a regression equation with dimensionless quantities of wheel rotation speed and density was derived as follows, where N represents the wheel rotation speed and ρ the ground density:
W = 0.551 N 8.21 ρ + 8.99
The R-squared value of this equation is 0.845. This equation shows that higher density results in lower power consumption. A regression equation with dimensionless quantities for calculating the optimal wheel rotation speed that minimizes power consumption, given the rover mass and ground density, is as follows:
N = 164 M + 172.5 M ρ + 1.28 M 2 87.5 ρ 2 + 79.1
The R-squared value of this equation is 1.00. This equation enables the selection of the optimal wheel rotation speed to achieve low-power running, based on the rover’s mass and estimated ground density. From these results, ground density and rover mass are some of the most important factors in designing for driving on the lunar surface. However, since these are data obtained on the Earth, future research should take lunar gravity into account.

5. Conclusions

In this study, to enhance the running performance of small two-wheeled lunar rovers on soft ground, the relationship between wheel rotation speed and running performance was examined for circular wheels with lugs. The key findings from the evaluation of running performance at five different wheel rotation speeds are summarized as follows:
  • At low wheel rotation speeds, the rover compacts the ground as it runs, which increases ground density and shear strength through compaction, allowing the wheels to resist sinking.
  • At high wheel rotation speeds, the rover runs by digging into the ground rather than compacting it, which increases sinkage. However, as the rover reaches denser ground layers, the lugs experience greater reaction forces, resulting in increased traction force.
  • Up to a certain wheel rotation speed, increasing the rotation speed reduces power consumption, but beyond a specific wheel rotation speed, higher rotation speeds lead to increased power consumption and the risk of getting stuck.
  • For running on soft ground, power consumption is heavily influenced by running time. Therefore, operating at the maximum wheel rotation speed at which the rover avoids getting stuck allows the rover to achieve running with low-power consumption.

Author Contributions

Conceptualization, K.W.; data curation, Y.O.; funding acquisition, K.W.; investigation, Y.O.; methodology, K.W. and K.T.; project administration, K.W.; resources, K.W.; supervision, K.W. and K.T.; validation, K.W. and Y.O.; visualization, Y.O.; writing—original draft, Y.O.; writing—review and editing, K.W. and K.T. All authors have read and agreed to the published version of the manuscript.

Funding

This research was partially supported by Individual Research Allowances of Doshisha University.

Data Availability Statement

Data are contained within this article.

Conflicts of Interest

The authors declare no conflicts of interest.

References

  1. Anand, M.; Tartese, R.; Barnes, J.J. Understanding the origin and evolution of water in the Moon through lunar sample studies. Philos. Trans. R. Soc. A 2024, 372, 20130254. [Google Scholar] [CrossRef] [PubMed]
  2. Robinson, K.L.; Taylor, G.J. Heterogeneous distribution of water in the Moon. Nat. Geosci. 2014, 7, 401–408. [Google Scholar] [CrossRef]
  3. Colaprete, A.; Schultz, P.; Heldmann, J.; Wooden, D.; Shirley, M.; Ennico, K.; Hermalyn, B.; Marshall, W.; Ricco, A.; Elphic, R.; et al. Detection of Water in the LCROSS Ejecta Plume. Science 2010, 330, 463–468. [Google Scholar] [CrossRef] [PubMed]
  4. Kayama, M.; Tomioka, N.; Ohtani, E.; Seto, Y.; Nagaoka, H.; Gotze, A.; Miyake, A.; Ozawa, S.; Sekine, T.; Kobayashi, T. Discovery of moganite in a lunar meteorite as a trace of H2O ice in the Moon’s regolith. Science 2018, 4, eaar4378. [Google Scholar]
  5. Fa, W.; Jin, Y.Q. Quantitative estimation of helium-3 spatial distribution in the lunar regolith layer. Icarus 2007, 190, 15–23. [Google Scholar] [CrossRef]
  6. Li, A.; Chen, X.; Song, L.; Chen, G.; Xu, W.; Huo, J.; Gao, M.; Li, M.; Zhang, L.; Yao, B.; et al. Taking advantage of glass: Ccapturing and retaining the helium gas on the moon. Mater. Futures. 2022, 1, 035101. [Google Scholar] [CrossRef]
  7. Fa, W.; Wieczorek, M.A. Regolith thickness over the lunar nearside: Result from Earth-based 70-cm Arecibo radar observations. Icarus 2012, 21, 771–787. [Google Scholar] [CrossRef]
  8. Carrier, W.D.; Olhoeft, G.R.; Mendell, W. Physical properties of the lunar surface. In Lunar Source Book: A User’s Guide to the Moon, 1st ed.; Heiken, H.G., Vaniman, T.D., French, M.B., Eds.; Cambridge University Press: Cambridge, UK, 1991; Chapter 9; pp. 475–580. [Google Scholar]
  9. Ohtake, M.; Matsunaga, T.; Haruyama, J.; Yokota, Y.; Morota, T.; Honda, C.; Ogawa, Y.; Torii, M.; Miyamoto, H.; Arai, T.; et al. The global distribution of pure anorthosite on the Moon. Nature 2009, 461, 236–240. [Google Scholar] [CrossRef] [PubMed]
  10. Toryudani, K.; Matsushima, T. Analysis of Shape Characteristics Lunar Crater by Observation and SPH Simulation. J. JSCE A2 2017, 73, 527–534. [Google Scholar] [CrossRef] [PubMed]
  11. Izuka, K.; Kubota, T. Study on locomotion systems of lunar exploration roverson loose soil. Stud. Sci. Technol. 2012, 1, 49–55. [Google Scholar]
  12. Tsumaki, T.; Honda, A.; Kato, H.; Fujioka, K. Development of the cross-country robot with 4 crawlers. J. Robot. Soc. Jpn. 2016, 34, 422–431. [Google Scholar] [CrossRef]
  13. Yoshimitsu, T.; Kubota, T. Engineering challenges and results by MINERVA-II asteroid surface rovers. J. Robot. Soc. Jpn. 2020, 38, 754–761. [Google Scholar] [CrossRef]
  14. Mizukami, N.; Yoshimitsu, T.; Kubota, T. Proposal of terramechanics-based wheel model for dynamic sinkage. Trans. Jpn. Soc. Mech. Eng. C 2012, 78, 84–93. [Google Scholar] [CrossRef]
  15. Izuka, K.; Sato, Y.; Kubota, Y.; Kubota, T. Study on traversability with consideration of wheeled forms for lunar and planetary exploration rovers. Trans. Jpn. Soc. Mech. Eng. C 2006, 72, 3842–3847. [Google Scholar] [CrossRef]
  16. Yoshida, K. Research issues on Lunar/Planetary exploration robots—A technical note on traction mechanics. J. Robot. Soc. Jpn. 2009, 27, 506–509. [Google Scholar] [CrossRef]
  17. Watanabe, N.; Tanaka, Y.; Mori, K.; Kawaguchi, M.; Tanaka, K. Effect of Elliptic Column Wheels on the Running Performance of Small Lunar Exploration Rover on Soft Ground. Harris Sci. Rev. Doshisha Univ. 2021, 62, 57–64. [Google Scholar]
  18. Iizuka, K.; Urayama, Y.; Shimoda, S.; Kubota, T. A study on wheel control for exploration robots on lunar simulant terrain. In Proceedings of the 48th Japan Joint Automatic Control Conference, Nagano, Japan, 25–26 November 2005; pp. 739–742. [Google Scholar]
  19. Matsushima, T.; Kobayashi, T. Mechanics of planetary regolith. Jpn. Geotech. Soc. 2021, 69, 43–51. [Google Scholar]
  20. Watanabe, T.; Iizuka, K. Proposal of walking to reduce slipping behavior using compaction effect of loose soil caused by a propagation of vibration for small light lunar planetary exploration rovers with legs. Trans. Jpn. Soc. Mech. Eng. 2020, 86, 886. [Google Scholar] [CrossRef]
  21. Fujii, H. The strength in soil body generated by compaction equipment on the field. Trans. Jpn. Soc. Irrig. Drain. Reclam. Eng. 1972, 41, 70–77. [Google Scholar]
  22. David, R.M.; Fabian, B.; Michel, V.W.; Yoshida, K. The effects of increasing velocity on the tractive performance of planetary rovers. arXiv 2023, arXiv:2306.02167. [Google Scholar]
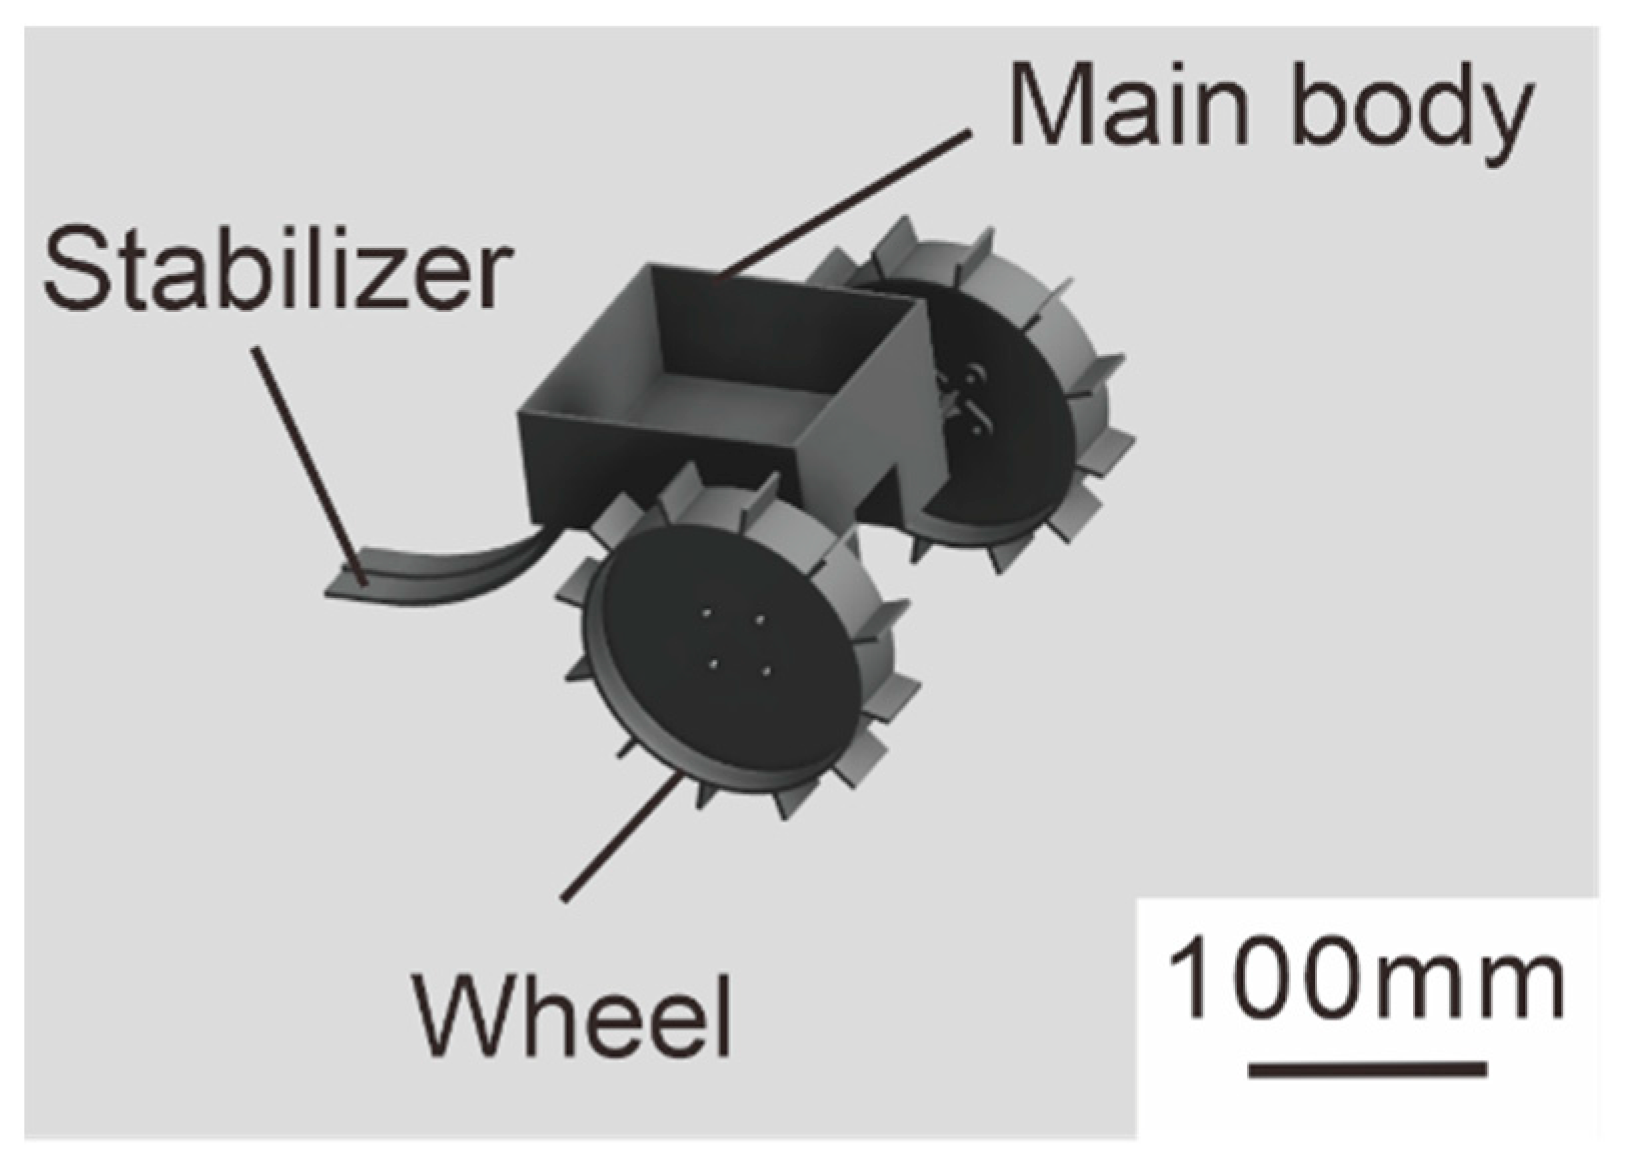
Figure 1. Overview of created small two-wheeled rover.
Aerospace 12 00115 g001
Figure 2. Running test field.
Aerospace 12 00115 g002
Figure 3. Density test.
Aerospace 12 00115 g003
Figure 4. Overview of running test.
Aerospace 12 00115 g004
Figure 5. Sinkage measurement using ARAMIS.
Aerospace 12 00115 g005
Figure 6. Device for measuring reaction force that lug receives from simulant.
Aerospace 12 00115 g006
Figure 7. Density and shear strength: (a) 20 mm depth; (b) 40 mm depth.
Aerospace 12 00115 g007
Figure 8. The running test results with a mass of 250 g and shear strength of 0.40 ± 0.05 cNm on the test field: (a) running time; (b) power consumption; (c) slip ratio.
Aerospace 12 00115 g008
Figure 9. The condition of the ground immediately after running at a slope angle of 0 degrees: (a) 6 min−1; (b) 10 min−1.
Aerospace 12 00115 g009
Figure 10. The running test results with a mass of 250 g and shear strength of 0.60 ± 0.05 cNm on the test field: (a) running time; (b) power consumption; (c) slip ratio.
Aerospace 12 00115 g010
Figure 11. The running test results with a mass of 250 g and shear strength of 1.00 ± 0.05 cNm on the test field: (a) running time; (b) power consumption; (c) slip ratio.
Aerospace 12 00115 g011
Figure 12. The running test results with a mass of 83 g and shear strength of 0.40 ± 0.05 cNm on the test field: (a) running time; (b) power consumption; (c) slip ratio.
Aerospace 12 00115 g012
Figure 13. The running test results with a mass of 166 g and shear strength of 0.40 ± 0.05 cNm on the test field: (a) running time; (b) power consumption; (c) slip ratio.
Aerospace 12 00115 g013
Figure 14. Results of reaction force measurements.
Aerospace 12 00115 g014
Figure 15. Results of sinkage measurements (x means stack): (a) slope angle of 0 degrees; (b) slope angle of 5 degrees.
Aerospace 12 00115 g015
Figure 16. Running behavior: (a) low wheel rotation speed; (b) high rotation speed.
Aerospace 12 00115 g016
Figure 17. The 3D graphs of the experimental results for different masses and different densities: (a) different masses; (b) different densities.
Aerospace 12 00115 g017
Disclaimer/Publisher’s Note: The statements, opinions and data contained in all publications are solely those of the individual author(s) and contributor(s) and not of MDPI and/or the editor(s). MDPI and/or the editor(s) disclaim responsibility for any injury to people or property resulting from any ideas, methods, instructions or products referred to in the content.