Article

A Comparative Analysis of Multi-Criteria Decision-Making Methods and Normalization Techniques in Holistic Sustainability Assessment for Engineering Applications

Department of Mechanical Engineering and Aeronautics, University of Patras, 26504 Patras, Greece
*
Author to whom correspondence should be addressed.
Aerospace 2025, 12(2), 100; https://doi.org/10.3390/aerospace12020100
Submission received: 20 December 2024 / Revised: 20 January 2025 / Accepted: 28 January 2025 / Published: 29 January 2025

Abstract

:
The sustainability evaluation of engineering processes and structures is a multifaceted challenge requiring the integration of diverse and often conflicting criteria. To address this challenge, Multi-Criteria Decision-Making (MCDM) methods have emerged as effective tools. However, the selection of the most suitable MCDM approach for problems involving multiple criteria is critical to ensuring robust, reliable, and actionable outcomes. Equally significant is the choice of a proper normalization technique, which plays a pivotal role in determining the robustness and reliability of the results. This study investigates the impact of common MCDM tools on the decision-making process concerning diverse aspects of sustainability. It also examines how different normalization methods influence the final outcomes. Sustainability in this context is understood as a trade-off among five key dimensions: performance, environmental impact, economic impact, social impact, and circularity. The outcome of the MCDM process is represented by an aggregated metric, referred to as the Sustainability Index (SI). This index offers a comprehensive and robust framework for evaluating sustainability and facilitating decision-making when conflicting criteria are present. To assess the effects of implementing different MCDM and normalization choices on the sustainability assessment, a dataset from the aviation sector is employed. Specifically, a typical aircraft component is analyzed as a case study for holistic sustainability assessment, utilizing data that represent the various dimensions of sustainability mentioned above, for this component. Additionally, the study investigates the influence of initial data variations and weight variations within the MCDM process on the results. The results indicate that, overall, the different MCDM and normalization methods lead to similar outcomes when applied to the design alternatives. However, a deeper dive into the results reveals that the weighted sum method, when paired with min-max normalization, appears to be more appropriate, based on the use case involved for the present investigation, due to its robustness regarding small variations in the initial data and its sensitivity to large ones. This research underscores the critical importance of selecting appropriate MCDM tools and normalization methods to enhance transparency, robustness, reliability, and consistency of sustainability assessments within a holistic framework.

1. Introduction

Multi-Criteria Decision-Making (MCDM) methods have a wide range of applications across various fields, addressing specific decision-making challenges, including those related to sustainability assessments. There are numerous MCDM techniques, including the Weighted Sum Model (WSM), TOPSIS (Technique for Order Preference by Similarity to Ideal Solution), ELECTRE (ELimination and Choice Expressing REality), PROMETHEE (Preference Ranking Optimization METHod for Enrichment Evaluation), VIKOR (VIseKriterijumska Optimizacija I Kompromisno Resenje) COPRAS (Complex Proportional Assessment), AHP (Analytic Hierarchy Process), and Goal Programming (GP), among others. Additionally, many hybrid models have been developed to address specific decision-making challenges.
The varying interpretations of sustainability and its ambiguity pose challenges for researchers. Many studies overlook defining the term, leading to methodological issues and reliance on indirect analysis through social and ecological variables [1]. A common and predominant interpretation of sustainability in the aviation sector is its association with the environmental dimension, particularly focusing on carbon neutrality [2]. In their previous works, e.g., [3,4], the authors proposed a more holistic definition of sustainability that encompassed a wide range of aspects, including performance, environmental, economic, social, and circularity aspects. In this context, sustainability is understood as a trade-off among the above dimensions. This interpretation is also adopted in the present work. Sustainability, according to this perspective of the authors, is detailed in Section 2.1 and the works cited therein.
Given the diverse nature and structure of MCDM, as well as the extensive range of MCDM application sectors, the literature review in this study focuses specifically on the use of MCDM methods for sustainability assessment across various domains. Particular emphasis is placed on their application within engineering, with a dedicated focus on the aviation sector to align with the use case data analyzed in this study. In this regard, sustainability assessment represents a common application area for MCDM, spanning multiple industries and sectors, and offering a structured approach to evaluate and optimize decisions based on sustainability objectives [5]. Irrelated to the exact interpretation of sustainability, MCDM methods have been widely employed and compared in the context of sustainability assessment, showcasing their strengths and limitations in various case studies and applications. For example, a thorough literature review on the application of MCDM methods in sustainable engineering was conducted in [6]. It highlights that selecting an appropriate MCDM method is itself a multi-criteria problem, as each method has its own strengths and limitations. The choice of method largely depends on the preferences of decision makers and analysts, with no single method universally superior to others. The review also concludes that there has been a significant increase in the application of MCDM models across engineering disciplines over the past decade, with the AHP method being the most applied one, followed closely by TOPSIS. In [7], a hybrid MCDM model combining TOPSIS, DEMATEL (Decision-Making Trial and Evaluation Laboratory), ANP, and GRA (Grey Relational Analysis) is proposed as a tool for selecting green and sustainable materials. Similarly, ref. [8] emphasizes the use of MCDM in the transportation sector, highlighting the critical role of stakeholder involvement in the decision-making process. Meanwhile, ref. [9] advocates for the application of MCDM to deliver sustainable products to consumers. Additionally, ref. [10] applies MCDM to assess the sustainability of electricity production technologies, incorporating methods such as MOORA (Multi-Objective Optimization Ratio Analysis) and TOPSIS. Moreover, ref. [11] provides a comprehensive review of MCDM methods for sustainable renewable energy development, analyzing a wide range of models, including WSM, AHP, ELECTRE, PROMETHEE, and others, to identify optimal solutions. Finally, recent research has introduced new hybrid MCDM models for sustainability assessment, incorporating regret theory and fuzzy environments, as demonstrated in [12].
In the aviation sector, MCDM methods are widely used for sustainability assessments, particularly in areas such as aircraft, airport, and airline operations evaluation. The author in [13] identifies 280 articles applying MCDM methods for sustainability assessments, involving over 60 different techniques. This study highlights a lack of clarity in many cases, as no reasons are provided for why a particular MCDM method was chosen over others. Instead, justifications typically focus on why the selected MCDM interpretation method was suitable for the study, often citing capabilities such as ranking or scoring a set of alternatives based on multiple criteria—functions that almost all MCDM methods can achieve. In this context, the above work [13] emphasizes key guidelines for assessing sustainability using MCDM methods. These guidelines highlight the importance of transparency in methodological choices and the reasoning behind the decisions made. It also notes that a well-constructed Multi-Criteria Analysis article should, at a minimum, provide clear explanations for why and how alternatives and criteria were selected, how criterion scores were determined, how weights were generated, and the rationale for selecting a specific MCDM over other existing methods (or the justification for developing a new method).
In a comprehensive review of over 160 papers on MCDM in the aviation industry [14], many studies focus on assessing sustainability criteria at the aircraft, airport, and airline levels, with AHP and TOPSIS being the most widely used methods. Another study [15] highlights that MCDM is an appropriate tool for sustainability assessment in aviation, especially when compared to other decision support systems such as deep learning and neural networks.
At the aircraft level, a hybrid MCDM approach is proposed in [16] for aircraft selection based on sustainability-related aspects. SWARA (Stepwise Weight Assessment Ratio Analysis) is utilized for weighting and COPRAS for aggregation in [17], focusing on sustainability criteria in aircraft selection. A comparison of AHP and ESM (Even Swaps Method) in [18] also results in the same rankings, with sensitivity analysis also applied on the involved weights. Additionally, ref. [19] compares a novel MCDM method with the WSM and the WPM (Weighted Product Method) to select an aircraft using a fuzzy weighting approach, leading to consistent conclusions. Additionally, in [20], MCDM methods were applied to assess and compare aircraft in terms of sustainability, incorporating AHP for weighting and WSM and TOPSIS for aggregation, which resulted in consistent outcomes.
At the airport level, ref. [21] uses a hybrid MCDM approach incorporating DEMATEL, DANP (DEMATEL-based ANP), and VIKOR to assess sustainability performance in international airports. Similarly, ref. [22] proposes MCDM for selecting a new airport, comparing methods like SAW, TOPSIS, and AHP, all yielding consistent results. The importance of sensitivity analysis to assess robustness is also emphasized in this study.
Additionally, ref. [23] proposes a hybrid MCDM method for selecting sustainable aviation fuels in supply chain management. This method is compared with others, including WSM and TOPSIS, showing consistent rankings across all methods, with sensitivity analysis applied to both input data and weights. Similarly, in [24], MCDM is used to assess the sustainability of alternative aviation fuels, incorporating and comparing methods such as WSM, TOPSIS, and GRA. The study concludes that all methods provide consistent rankings, with slight deviations observed only in the WSM. Finally, ref. [25] highlights the importance of stakeholder weighting in decision-making by proposing the Best-Worst Method, a technique that accounts for the relative importance of various stakeholders in the decision-making process.
The effect of normalization techniques in the context of MCDM methods has been also extensively studied in the literature. The choice of normalization technique can significantly impact the final ranking of alternatives and the selection of the best option. As noted by Chatterjee and Chakraborty [26], the normalization method employed in a MCDM approach plays a crucial role in determining the outcome of the decision-making process. Moreover, a comprehensive analysis of various normalization techniques for MCDM methods such as WSM, TOPSIS, and COPRAS was provided in [27], highlighting the pros and cons of each method. The authors suggest that sum-based linear normalization and vector normalization methods are among the most preferred normalization techniques, although the final choice depends on the specific structure of the problem being analyzed. In the context of ship design, ref. [28] investigates the effect of normalization (sum-based and vector normalization) methods on MCDM techniques such as WSM, WPM, TOPSIS, and ELECTRE. The results indicate consistency in the outcomes based on correlation analysis. In a study on web services [29], the impact of normalization on the VIKOR method was assessed using techniques such as linear sum, linear max, min-max, and vector normalization. The findings revealed that different normalization methods resulted in distinct outcomes, emphasizing the importance of selecting the appropriate technique for the given context. Additionally, ref. [30] examined normalization techniques like max, min-max, and vector normalization in conjunction with the WSM aggregation method, leading to different rankings for each technique. Similarly, ref. [31] assessed various normalization methods for the TOPSIS model, highlighting the challenge of identifying the most suitable normalization technique for each problem. In [32], different normalization techniques for the WSM are evaluated, concluding that min-max normalization is the most appropriate compared to other methods, although the study could not offer concrete recommendations for practical applications. In [33], the authors assessed ten different normalization techniques for the PSI (Preference Selection Index) method, noting that each technique led to different results, though some could be correlated. The challenges of selecting the optimal normalization technique were also discussed in [34], where the authors pointed out that varying rankings can result from different techniques, complicating the decision process. Different normalization methods were compared in [35] in the presence of outliers, showing that each method yielded distinct results depending on the normalization approach. On the other hand, ref. [36] assessed five normalization techniques in conjunction with the MARCOS (Measurement of Alternatives and Ranking according to COmpromise Solution) aggregation method, finding relatively consistent results for all normalization methods. In the robotics sector, ref. [37] compared different normalization techniques for the Weighted Aggregated Sum Product Assessment (WASPAS), alongside other MCDM methods, favoring min-max normalization for its effectiveness. In a study focused on time and complexity criteria, ref. [38] examined various normalization techniques for the TOPSIS method. Lastly, in the aviation sector, three normalization techniques—min-max, sum, and z-score normalization—using the WSM were assessed in [39]. The study found consistent rankings for both the min-max and z-score methods. In another study for aircraft selection problems [40], different normalization techniques were applied to the weighted sum aggregation method, with results showing that vector, linear sum, and linear max normalization produced similar outcomes, while min-max normalization led to different results.
The findings regarding both the MCDM methods and the selected normalization techniques underscore the importance of carefully choosing the appropriate method based on the specific characteristics of the problem. Different techniques can yield varying results, which highlight the need for a tailored approach in decision-making. The choice of normalization method can significantly influence the final rankings and the selection of the best alternative, depending on the structure and requirements of the problem at hand. Recognizing this impact, it becomes essential to systematically investigate how different normalization methods and decision-making tools perform in practical applications.
The aim of the present work is to explore and evaluate the effects of implementing various MCDM tools and normalization methods on sustainability assessments of engineering processes and structures, focusing on an aircraft component design with multiple variations. Specifically, in the context of aircraft component design, multiple variations in configurations need to be evaluated across various sustainability dimensions, including mechanical performance, environmental impact, economic factors, social impact, and circular economy principles. However, there is limited understanding of how different MCDM methods and normalization techniques influence the robustness, reliability, and interpretation of sustainability outcomes in engineering design, particularly in complex applications like aircraft components. Data collected from an aircraft structural component, investigated in a previous study of the authors [41], are utilized to implement a Sustainability Index (SI), firstly introduced in [3], integrating key metrics across multiple sustainability-related dimensions. This research investigates how different MCDM methods, such as the WSM, TOPSIS, modified TOPSIS, VIKOR, and COPRAS, as well as various normalization techniques (min-max, median, vector, z-score, and sum normalization), affect the robustness, reliability, and the interpretation of the final outcomes. The research questions addressed in this study are as follows: (a) how do different MCDM methods (WSM, TOPSIS, modified TOPSIS, VIKOR, and COPRAS) impact the robustness and reliability of sustainability assessments for aircraft component designs? (b) What is the effect of various normalization techniques (min-max, median, vector, z-score, and sum normalization) on the outcomes of sustainability evaluations in the context of comparing different aircraft component configurations?
The remainder of the paper is organized as follows: Following the introduction section of this paper (Section 1), which includes a literature review on the use of MCDM in the context of sustainability assessment and the objectives of the present study, Section 2 presents an overview of the holistic sustainability framework, along with the dataset used for the analysis. Section 3 outlines the various MCDM and normalization methods considered in this study. Section 4 presents the results from the analysis, followed by a discussion on the outcomes of the MCDM and normalization techniques. The paper concludes in Section 5, highlighting the key findings and offering perspectives for future research.

2. Definitions and Use Case

In this section, the sustainability approach adopted by the authors is outlined (Section 2.1), while Section 2.2 provides a description of the dataset used for the case study considered in the present work.

2.1. Definition of Sustainability

A more comprehensive approach to sustainability in the design of an actual component is adopted by the authors in [41]. This is achieved by considering the five dimensions of sustainability mentioned below, as distinct yet interrelated factors, to create a sustainable design. More details are available in the relevant study; however, for the reader’s convenience, the essential data have been summarized and are presented below:
(a)
Mechanical performance is evaluated through static and dynamic analyses of the component, with key parameters, including total deformation and mode 1 eigenfrequency.
(b)
Costs are assessed based on raw material costs, manufacturing process costs, and recyclability costs of the component.
(c)
Environmental sustainability is represented by the carbon dioxide (CO2) emissions generated over the material’s life cycle.
(d)
Circularity is expressed through the recyclability potential of the component and its ability to be part of a closed-loop process, which depends on the quality of the recycled material.
(e)
Social impact is analyzed by considering the potential effects on various stakeholder groups throughout the product’s entire life cycle, including stages such as material extraction, manufacturing, and end-of-life.
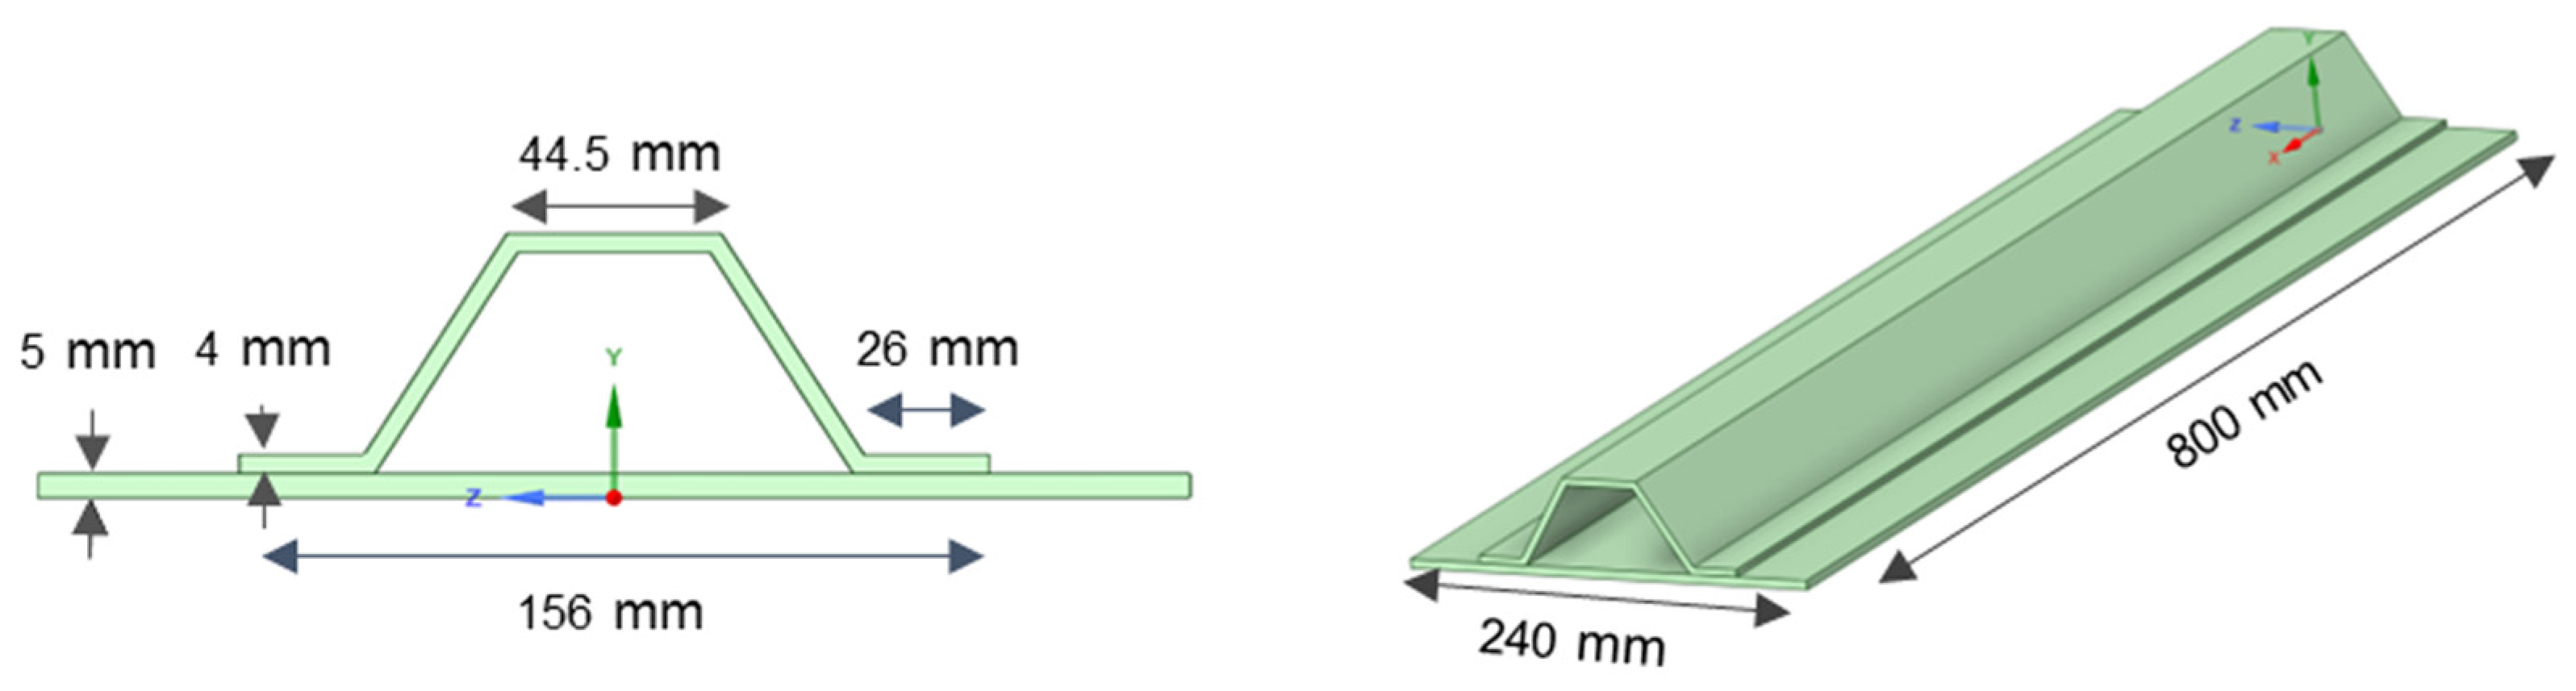
The above dimensions were quantified through relevant metrics and aggregated into a sustainability index, unique for each alternative, as described in [41]. The index is derived using normalized data for the five Pillars—Performance (P), Costs (C), Environmental Impact (E), Circularity Performance (CIRC), and Social Impact (SOC)—with normalization performed using the min-max method. These pillars are then combined using the Weighted Sum Method, where each pillar is multiplied by its respective weighting factor, determined by the user. Under each pillar of sustainability, one or more metrics or criteria can be included, depending on the specific application. The aggregated sustainability metric is then used to rank the alternative design configurations.

2.2. Case Study

This study utilizes a comprehensive dataset and associated information aligned with defined sustainability dimensions to analyze the impact of various MCDM and normalization methods on the final ranking of design alternatives. The dataset, representative of an aircraft component design process, encapsulates the conflicting aspects of sustainability, providing a robust foundation for applying MCDM methods. By leveraging this dataset, sourced from study [41], the research enables a detailed comparison of the effects of different MCDM and normalization techniques. This dataset is specifically centered on the design and evaluation of alternative configurations of a commonly used aircraft component: a hat-stiffened panel. This type of panel is a critical structural element in aerospace applications and is composed of two primary components: the skin and the stringer. A typical profile and geometry of a hat-stiffened panel are illustrated in Figure 1 [4]. Five distinct material combinations were analyzed, as detailed in Table 1.
The dataset includes 4487 distinct design alternatives, with variations in both the material properties and the geometrical features of the panel, namely, panel thickness, stiffener thickness, and crown width. Each configuration was systematically evaluated across multiple dimensions of sustainability: mechanical performance, environmental impact, economic cost, social impact, and circularity performance. Sustainability in design, particularly in the context of aircraft structures, is often primarily associated with environmental sustainability. This focus is exemplified by approaches such as eco-design, which aims to reduce carbon emissions and improve fuel efficiency [42]. However, there is a growing call to adopt the triple bottom line—encompassing environmental, social, and economic viability—in the aviation sector [43].

3. Methodology

For the aforementioned dataset, an aggregated metric was evaluated with respect to five pillars: performance, environment, cost, circularity and society, based on five MCDM and five normalization methods. Since most MCDM methods require a weighting procedure to determine the weights or priorities for each criterion, reducing subjectivity in this process is essential. To achieve this, the AHP is employed [44]. This method involves structured pairwise comparisons, allowing decision makers to systematically assess the relative importance of each criterion. In the present analysis, three representative weighting scenarios were considered by the authors: one with equal weights assigned to each of the five sustainability dimensions, one where environmental impact and performance were prioritized (i.e., considered significantly more important compared to the other criteria), and one where cost and performance were prioritized (i.e., considered significantly more important compared to the other criteria). The pairwise comparisons for determining the weights of the sustainability dimensions were made using the Saaty scale, a key component of the AHP. The Saaty scale allows for the comparison of criteria in pairs by assigning numerical values ranging from 1 (indicating equal importance) to 9 (indicating extreme importance). These pairwise comparisons were then used to derive the priority weights for each sustainability dimension, which were applied in the aforementioned weighting scenarios.
Following the weighting process and the derivation of the aggregated sustainability metric for each MCDM method considered, a Pearson correlation analysis was performed to evaluate the consistency and agreement among the results of the different MCDM methods. Moreover, a sensitivity analysis was conducted to test the robustness of the studied methods. More specifically, the data were perturbed by a zero-mean Gaussian error, with the standard deviation being a percentage of the standard deviations of the initial variables. Based on 1000 simulated perturbed samples, the mean and standard deviation of the final rankings were computed and compared. The most robust method with respect to small departures from the initial data, as well as the most sensitive to high perturbations, was selected for further investigation, considering the normalization method and its effect on the final outcome.

3.1. MCDM Methods Considered

The impact of various MCDM methods was assessed using the approaches outlined below. These methods are recognized as some of the most widely utilized and popular techniques in the literature due to their effectiveness in handling complex decision problems where multiple conflicting criteria must be considered. By applying these methods, the study aimed to evaluate how different decision-making frameworks can influence the sustainability assessment of alternative design configurations.

3.1.1. Weighted Sum Method (WSM)

The WSM or, alternatively, Simple Additive Weighting (SAW) method, is a widely used MCDM method in practice, since it is a method that is easy to implement and interpret. The WSM was introduced by Fishburn [45] and provides a scoring model based on the weighted average principle. It assigns weights to each objective and then uses the weighted sum of them, converting multiple objectives into an aggregated scalar objective function. The weights are usually determined by the AHP method [44,46,47].
More specifically, let x i j be the performance of the alternative Ai against the attribute Cj, i = 1, …. I and j = 1, …, J, y i j the normalized rating and w j the weight of the Cj attribute, with w j   = 1 . The normalized data are utilized, since the data should be in a common scale. Then, the overall score for the alternative Ai is equal to:
WSM i = j = 1 J w j · y i j .
The attribute with the highest WSM score is the best alternative.
One disadvantage of this method is that it can lead to compromises between the pillars; high performance in one criterion can compensate for low performance in another.

3.1.2. Technique for Order Preference by Similarity to an Ideal Solution (TOPSIS)

TOPSIS was initially proposed by Hwang and Yoon [48] as a compromising model, based on the distance principle. TOPSIS proposed as an optimal solution the one that has the shortest distance from the positive ideal solution and the longest distance from the negative ideal solution. The positive ideal solution is the solution that maximizes the benefit criteria, such as performance, circularity and social impact, and minimizes the cost criteria, such as the total cost of the component production and the CO2 emissions. On the other hand, the negative ideal solution maximizes the cost criteria and minimizes the benefit criteria. The most used distance in TOPSIS evaluation is the Euclidean distance. However, other distances, such as Manhattan, Tchebichev [49], and others [50], can be used to calculate TOPSIS.
Let v i j = w j × y i j , i = 1, …., I and j = 1, …, J, the weighted and normalized rating and v j + ,   v j be the positive and the negative ideal solution, respectively. Then, the overall score for the alternative A i is:
V i = j = 1 J ( v i j v j ) 2 j = 1 J ( v i j v j ) 2 + j = 1 J ( v i j v j + ) 2
Finally, alternatives are ranked with respect to V i values. A higher V i score value indicates a better alternative performance.
A main limitation of TOPSIS is the rank reversal phenomenon whereby, through adding or removing an alternative solution, the initial ranking of the alternatives changes. Several modifications for addressing this problem have been proposed in the literature, e.g., in [51,52]. TOPSIS with Manhattan distance does not appear to suffer from the rank reversal phenomenon [49], as it inherits this property from WSM, with both methods exhibiting similar behavior when this distance metric is used. Additionally, in this method, the interpretation of the weights is not straightforward, as the distances from the positive and negative ideal solutions are weighted by the square of the initial weights ( w j 2). For this reason, modified TOPSIS has been proposed.

3.1.3. Modified TOPSIS

The main difference between the modified TOPSIS and the original TOPSIS is that in the modified version, the ideal solution is identified first, and then the weighted Euclidean distance is calculated [53]. Thus, the overall score for the alternative Ai is:
V i = j = 1 J w j ( y i j y j ) 2 j = 1 J w j ( y i j y j ) 2 + j = 1 J w j ( y i j y j + ) 2
The difference between the two methods is that in TOPSIS, w j 2 is used—contrary to modified TOPSIS, where w j is used—while calculating the distances from the positive and the negative ideal solutions. This helps maintain a proportional and more balanced impact of each attribute on the final decision, avoiding the exaggerated influence of higher-weighted attributes seen in the traditional TOPSIS method. Yet, TOPSIS and the modified TOPSIS methods result in the same ranking when equal attribute weights are used.

3.1.4. VIKOR

VIKOR (VIseKriterijumska Optimizacija I Kompromisno Resenje or, in English, Multi-criteria Optimization and Compromise Solution) has been proposed by Opricovic [54,55,56]. Unlike TOPSIS, which prioritizes solutions closest to the positive ideal solution and farthest from the negative ideal, VIKOR focuses on a compromise solution by minimizing the distance to ideal solutions. This approach appeals to risk-takers, potentially leading to more innovative or bold decisions.
Let y j *   a n d   y j be the best and the worst values for each criterion.
Step 1: Compute S i and R i :
S i = j = 1 J w j · y j * y i j y j * y j
and:
R i = max j w j · y j * y i j y j * y j
Step 2: Compute:
Q i = v · S i S * S S * + 1 v · R i R * R R *
where S = max i S i , S * = min i S i , R = max i R i , R * = min i R i , and v is a weighting reference, where 0 ≤ v ≤ 1.
Step 3: Rank alternatives, sorted by the values S, R, and Q in ascending order, and produce three ranking lists.
S, R, and Q ranking lists will propose the compromise solution or a set of compromise solutions. If the attribute A′ has the best score with respect to Q list, it could be considered as the best solution if it satisfies the following conditions:
C1: Q(A″) − Q(A′) ≥ (m − 1)−1
where A″ is the attribute with second-best score in Q list, andm is the number of attributes, and C2: A′ also has the best score with respect to S and/or R list. If the above conditions are not satisfied, a compromise solution set results.

3.1.5. COPRAS

COPRAS (Complex Proportional Assessment) method was introduced by Zavadskas and Kaklauskas [57], and it can be described as follows:
Step 1. Normalize the initial rating x i j i = 1 , , I   a n d   j = 1 , , J . Let y i j i = 1 , , I   a n d   j = 1 , , J be the normalized rating;
Step 2. Weight the normalized rating y i j   by proper weight w j , j = 1 , , J   w i t h   Σ w j = 1 ;
Step 3. Calculate the P i ,   R i ,   Q i ;
  • where Ri is the summation of the attributes that need to be minimized, and Pi is the summation of the attributes that need to be maximized:
    Q i = P i + j = 1 J R j R i j = 1 J 1 R j , U i = Q i Q m a x · 100 %
Alternatives are ranked based on U i values. A higher score value in U indicates a better alternative performance.
A main limitation of COPRAS is that it is less robust than other MCDM methods, even in the case of small data changes [58]. This lack of robustness means that even minor variations in the input data, such as slight changes in the values of criteria or the performance of alternatives, can lead to significant fluctuations in the final rankings or outcomes.

3.2. Normalization Methods

Normalization is a crucial step in any decision-making problem, as it transforms heterogeneous data into data on a common scale. Data normalization involves scaling the attribute values to make them lie numerically in the same scale and thus have the same importance on the final index. There exist numerous normalization methods in the literature [59], but in the current work, the following five widely used techniques were considered and compared (Table 2).
Let x be the initial value and x′ represent the normalized value. The m i n ( x ) , m a x ( x ) , m e a n ( x ) , m e d i a n ( x ) , s t d e v ( x ) , and I Q R ( x ) correspond to the minimum, the maximum, the mean, the median, the standard deviation, and the interquartile range value of the criterion, respectively.

4. Results

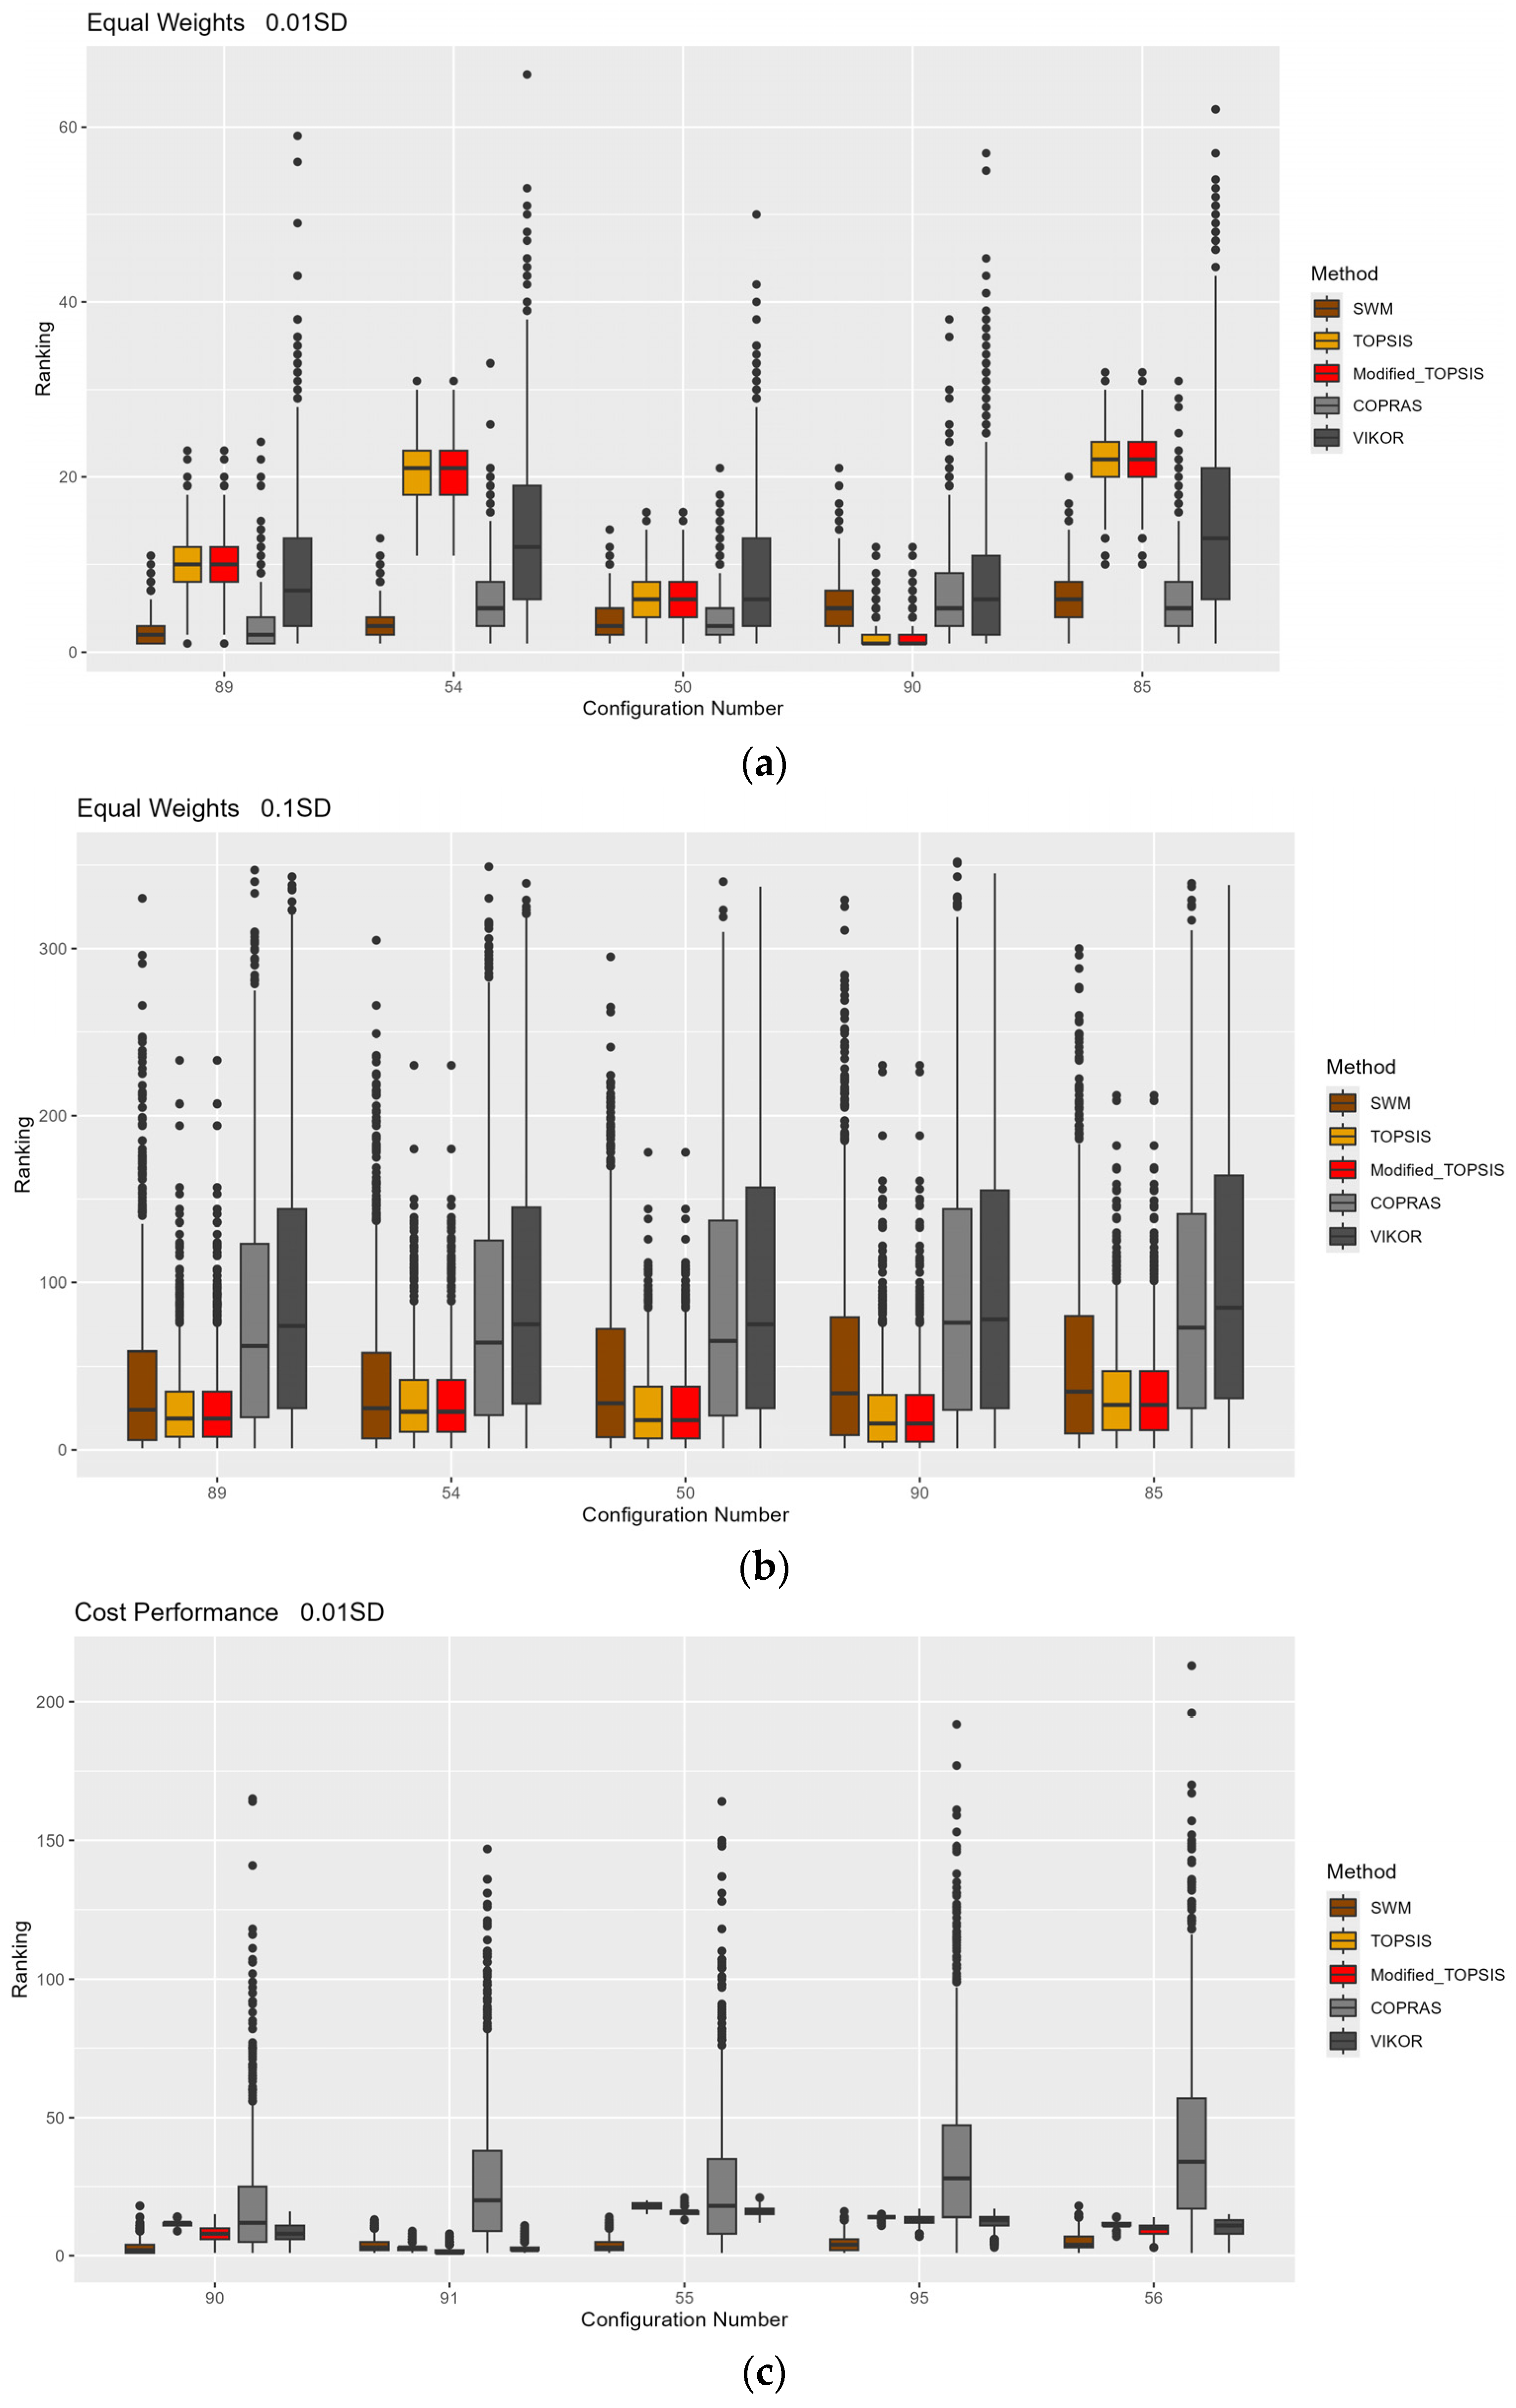
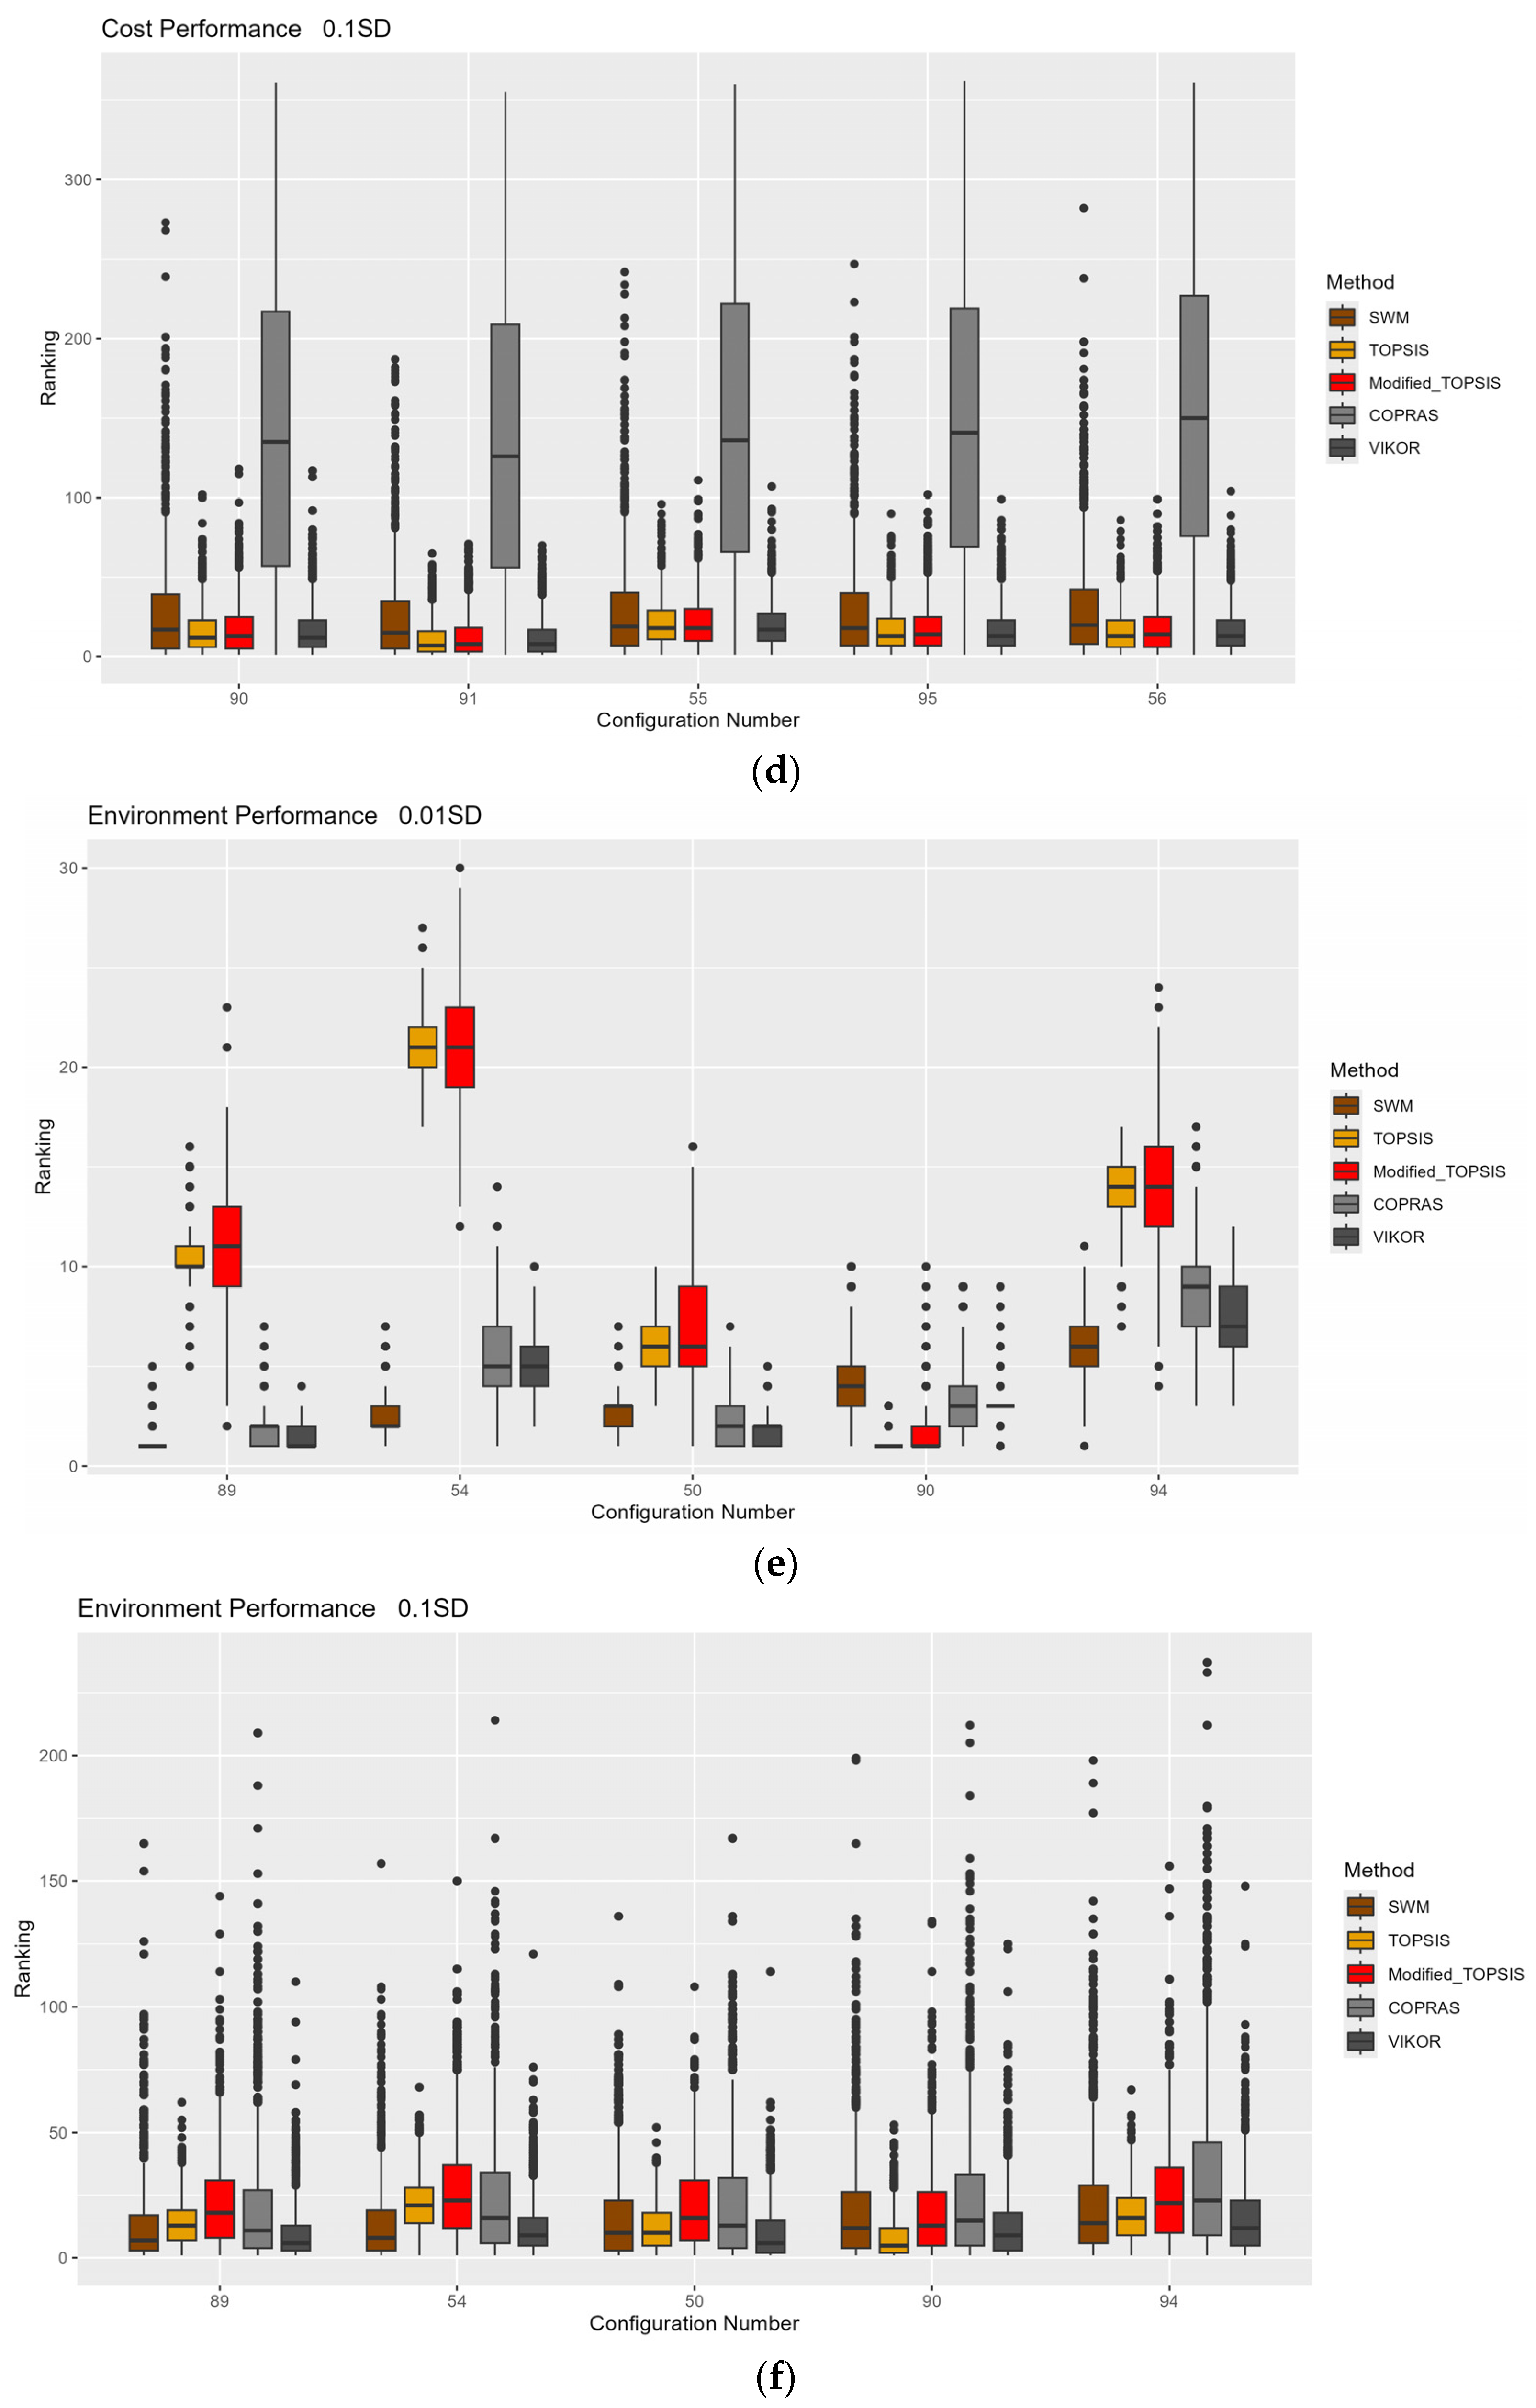
4.1. MCDM Impact Results

In Table 3, the first 10 ordered configurations are presented; these were obtained from the five different MCDM methods. The numbers shown in colors correspond to the configuration IDs considered in [38] and are used to track the same colors in the rest of the columns. The first column indicates the material combinations, as shown in Table 1. As described in Section 2, each design configuration, apart from the different material combinations (as shown in Table 1), also corresponds to variations in design parameters, namely panel thickness, stringer thickness, and crown width. Moreover, three different scenarios have been considered: equal weighting among the five pillars of sustainability, prioritization of costs and performance, and prioritization of environment and performance. As described in Section 3, three representative scenarios have been chosen. Based on the procedure of the Analytic Hierarchy Process (AHP) used to derive priorities, the following weight assignments were determined for the three different scenarios. In the equal weights scenario, the five dimensions of sustainability—performance, environment, costs, society, and circular economy—were each assigned a weight of 20%. In the environment- and costs-prioritized scenario, where environmental impact and costs were strongly emphasized, these two dimensions received a weight of 41% each, while the remaining three dimensions (performance, society, and circular economy) were each assigned a weight of 6%. Lastly, in the costs- and performance-prioritized scenario, where costs and performance were given greater importance, these two dimensions also received a weight of 41% each, with the other three dimensions receiving 6% each. Coloring has been applied to help identify the similar configurations obtained across the five different MCDM methods. To improve clarity, the configuration colors derived from the WSM are highlighted in the rankings of the other MCDM methods.
As already mentioned in Section 2, the data have been obtained from design configurations where five different material combinations have been considered, as shown in Table 1. In all MCDM methods and scenarios considered, the design configurations involving a combination of aluminum in both components of the hat-stiffened panel (panel + stiffener) rank first. Therefore, the top 10 configurations shown herein also concern the aluminum–aluminum (AL-AL) combination design, for which only the design geometric parameters vary.
In the equal-weighting scenario, most of the top-ranked design configurations consistently appear across all five MCDM methods, although their positions within the rankings varied. This suggests a strong consensus among the different MCDM methods, indicating that these top configurations are consistently deemed optimal or high-performing, regardless of the specific method used. More specifically, TOPSIS and modified TOPSIS yielded identical results, as mathematically proven, and their final rankings closely aligned with those of VIKOR. SWM and COPRAS produced similar ranking orders. When greater weight was assigned to cost and performance metrics compared to the others, modified TOPSIS and VIKOR exhibited nearly identical performance, though the rankings of other configurations differed. Finally, when greater weight was assigned to performance and environmental factors, the top ten ranked attributes were identical in COPRAS and VIKOR, although their exact positions differed. These two methods differed by only two attributes compared to the corresponding list from SWM.
To verify the similarity of the entire ordered lists resulting from the five different aggregation methods, a Pearson correlation analysis was conducted, considering the three different weighting schemes. The Pearson correlation coefficient describes the strength and the direction of a linear relationship between two variables, with values ranging from −1 to 1. A value of 1 indicates perfect positive correlation (all data points align in a straight line with a positive slope), and a value of −1 indicates perfect negative correlation (all data points align in a straight line with a negative slope). The correlation analysis results (Table 4) indicate a strong positive correlation between the alternative rankings, meaning that all methods demonstrated equivalent rankings.
To test the sensitivity of the five MCDM methods to small variations in the initial data, 1000 perturbed samples were generated. The initial values were perturbed by a Gaussian error with zero mean and a standard deviation equal to 1% and 10% of the standard deviation of the initial data. The simulated samples were then normalized and ordered. Figure 2a–f present the boxplots of the first five ordered attributes with respect to SWM for each of the considered MCDM methods.
For the scenario with equal weights, both VICOR and COPRAS exhibited higher variability, even with small perturbations (1%) on the initial data, which is undesirable in this specific context. Conversely, the WSM demonstrated minimal variation in response to small perturbations, indicating stability in the resulting order. TOPSIS and modified TOPSIS were relatively stable under small data perturbations, although they were slightly more sensitive than WSM. As the perturbation of the initial data increased (to 10%), the variation in WSM also increased, which is a desirable characteristic in this scenario. TOPSIS and modified TOPSIS showed high sensitivity to larger perturbations, although they were less sensitive than WSM. Finally, COPRAS and VIKOR exhibited extreme sensitivity to the ranking order under large data variations.
When greater weights were assigned to cost and performance metrics, the WSM exhibited low sensitivity to small data variations but higher sensitivity to significant data variations. This behavior was also observed in TOPSIS, Modified TOPSIS, and VIKOR. In contrast, COPRAS displayed very high sensitivity to both small and large data variations.
In the scenario where greater weights were assigned to environmental and performance metrics, WSM again demonstrated low sensitivity to small data variations and high sensitivity to significant data variations. However, the other methods showed sensitivity to both small and large data variations, with VIKOR and COPRAS being particularly sensitive to substantial data changes.
In conclusion, WSM stands out as a more suitable approach when compared to other methods due to its desirable balance between stability and sensitivity. This method demonstrates minimal sensitivity to small perturbations in the input data, ensuring that the ranking order of attributes remains consistent despite minor variations. Stability is a highly desirable characteristic in the context of sustainability assessment, where small fluctuations in data may occur due to uncertainties or measurement errors. Ensuring the reliability of rankings under such conditions helps maintain the credibility and robustness of the assessment results.
At the same time, SWM exhibits increased sensitivity to larger data variations, allowing it to effectively capture significant changes in the input data. This adaptability ensures that SWM can identify and reflect meaningful shifts in trends, which may indicate substantial alterations in the sustainability attributes being evaluated. This dual characteristic of SWM—stability for minor variations and responsiveness to major shifts—positions it as an ideal method for sustainability assessments, where both precision and adaptability are crucial.
Moreover, this balance is essential in practical applications. For example, in monitoring systems or policy evaluations, slight variations in input data should not lead to disproportionate changes in outcomes, which might mislead decision makers. Conversely, when there are significant changes in the data—such as changes due to new environmental policies, technological advancements, or economic shifts—SWM’s ability to reflect these changes ensures that the method remains relevant and insightful.

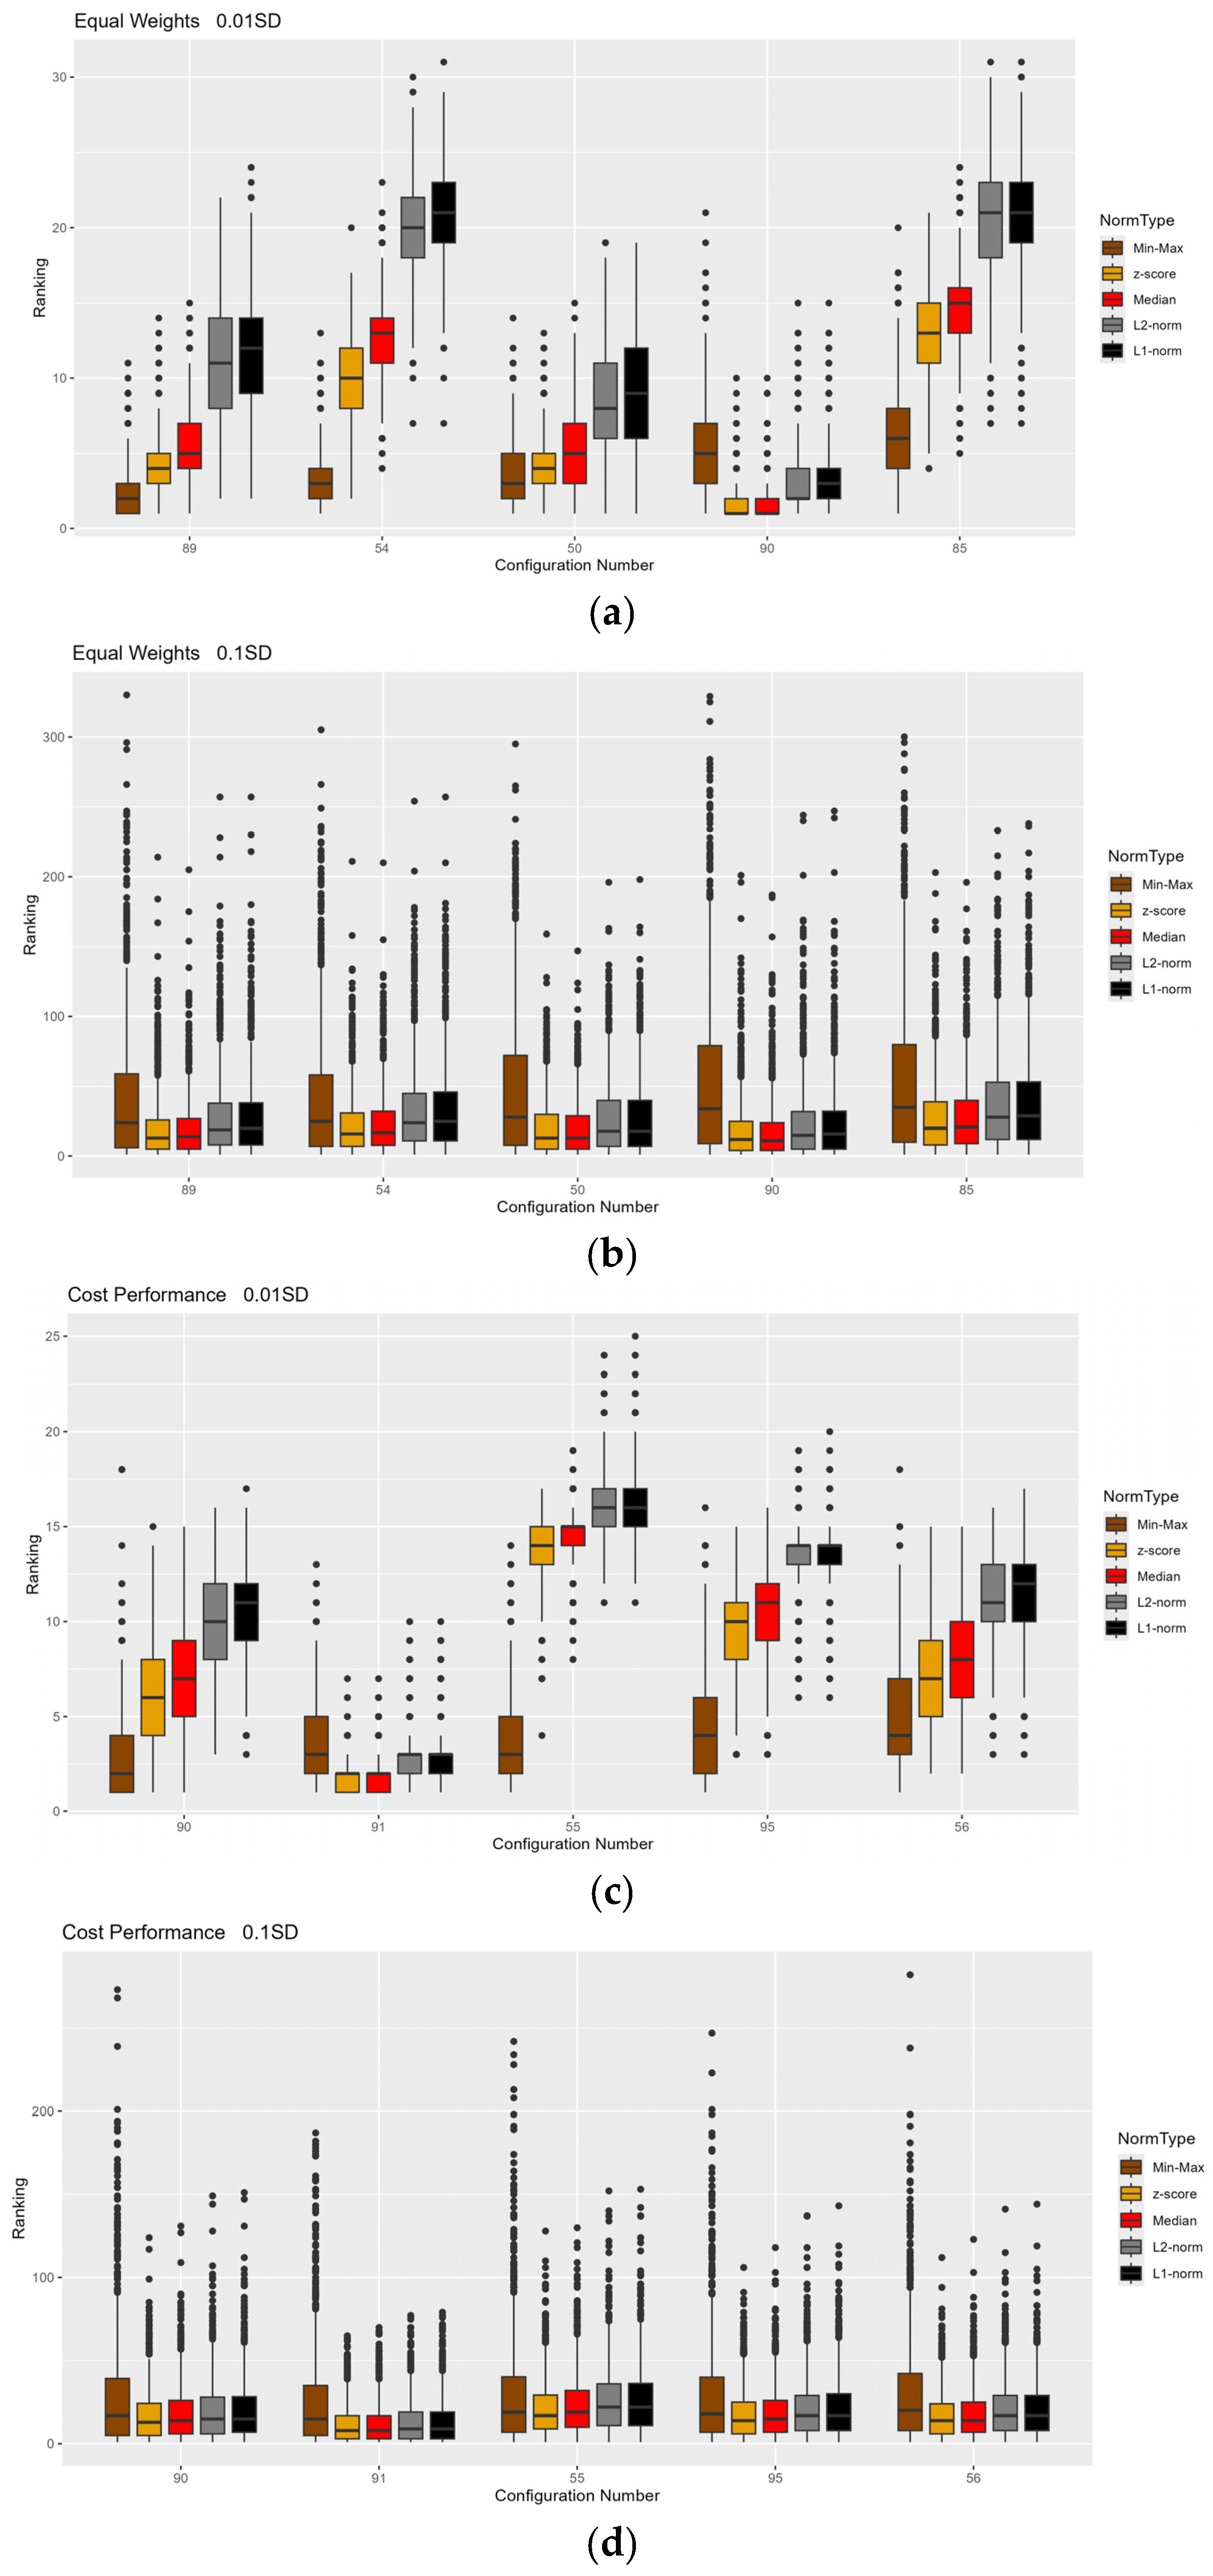
4.2. Normalization Impact Results

Following the analysis on the impact of the MCDM methods, the effect of normalization methods on WSM performance was assessed. For this analysis, the most robust MCDM method from the previous step, i.e., the SWM method, was considered, and the impact of different normalization methods on this method was evaluated. In Table 5, the first ten design configurations are presented for the SWM method across five normalization techniques and three weighting scenarios: equal weighting, performance- and cost-prioritized, and environment- and performance-prioritized. For all weighting scenarios, the rankings were very similar across all studied normalization methods, with the L1 and L2 norms yielding nearly identical results. Color changes are used to track the same configuration in the rest of the columns.
This consistent ranking is further confirmed by the correlation analysis (Table 6), where all correlation coefficients are very close to one, indicating a high degree of similarity between the rankings for the different normalization methods. This is also the case for all the studied weighting scenarios.
To test the sensitivity of the five normalization methods to variability in the initial data, a simulation similar to that conducted for the MCDM methods was performed. The simulated data were ordered, and the boxplots of the first five ordered attributes with respect to the min-max normalization method are depicted in Figure 3a–f for each normalization method.
In the equal-weight scenario, the L1 norm and L2 norm normalization methods appear to be sensitive to both small and large data perturbations. The ranking using min-max normalization seems to be insensitive to small data perturbations (1%) but shows sensitivity to larger data perturbations (10%). The z-score and median normalization methods demonstrate moderate sensitivity to both small and large data perturbations.
In the scenario where greater weight was assigned to both cost and performance metrics, all normalization methods exhibit moderate sensitivity to both small and large data perturbations. However, min-max appears to be more sensitive to large data perturbations compared to the other methods, which is a desirable outcome.
Finally, in the scenario where greater weights were assigned to both environment and performance, min-max normalization appears to be less sensitive to small data perturbations compared to the other methods. Additionally, z-score and median methods seem to have low sensitivity to small data perturbations. For larger data perturbations, the ranking using min-max becomes more sensitive compared to the other methods, while L1 norm and L2 norm show high sensitivity to both small and large data perturbations.
Based on the analysis above, min-max normalization proves to be the preferred method in various scenarios due to its balanced sensitivity to data variations. This normalization technique is particularly advantageous because it combines stability and responsiveness, ensuring consistent performance across a spectrum of data conditions. Specifically, min-max normalization demonstrates a high degree of stability when handling small perturbations in the input data, preventing minor fluctuations from disproportionately affecting the rankings. At the same time, it remains sufficiently responsive to larger shifts in the data, effectively capturing significant changes in trends or attributes.
In the context of sustainability assessment, these qualities are significant. Accurate ranking and sensitivity to changes are critical for evaluating sustainability metrics, which often involve a complex interplay of environmental, economic, and social factors. Min-max normalization ensures that the rankings produced are reliable and reflective of the actual state of the system, even when faced with inherent uncertainties or variability in the input data. For instance, minor inaccuracies in data collection or reporting will not compromise the integrity of the assessment, while more substantial changes, such as policy shifts or environmental disruptions, are appropriately highlighted.

5. Conclusions and Future Perspectives

This study investigates the impact of various MCDM tools on the decision-making process and examines how prominent normalization methods affect the final outcomes in the context of sustainability assessment, specifically during the design of aircraft structures. Using a dataset from the aviation sector, a typical aircraft component was selected as a case study for a holistic sustainability assessment. A detailed sensitivity analysis was conducted to explore the influence of MCDM tools, normalization methods, and weight variations on the outcome results.
The results indicate that the ranking obtained from the considered MCDM methods was consistent, as demonstrated by the correlation analysis. This finding suggests that the choice of MCDM tool does not significantly affect the ranking in this context. However, the sensitivity analysis of the impact of data variation under different weighting scenarios revealed that the WSM is more sensitive to small data variations, while exhibiting desirable sensitivity to larger data variations. This characteristic is advantageous in sustainability assessment, as it aligns with the need for robust responses to significant changes in the dataset.
When considering normalization methods, the analysis focused on five widely used techniques. The effect of normalization on the WSM was assessed, with the ranking results showing consistency, as validated by the correlation analysis. Notably, the min-max normalization method demonstrated smaller sensitivity to small data variations and greater sensitivity to larger data variations. This property makes it a particularly robust choice for this context.
WSM and min-max normalization both offer significant advantages in sustainability assessments, each bringing the desirable balance of stability and sensitivity to data variations. WSM excels in maintaining stable rankings when faced with minor perturbations, ensuring reliability in results despite uncertainties, while remaining responsive to larger shifts to capture meaningful trends. Similarly, min-max normalization provides a balanced approach by preventing small fluctuations from distorting rankings and effectively highlighting significant changes in the data. Additionally, the bounded nature of results using min-max normalization (e.g., within the range 0–1) enhances interpretability, transparency, and comprehensibility. Together, these methods offer robust frameworks for dynamic and accurate sustainability evaluations, ensuring consistency and adaptability in varying data conditions.
Overall, the weighted sum model using the min-max method is justified for calculating an aggregated metric of sustainability in the conceptual design phase due to its ability to provide a simple, transparent, and flexible framework for decision making under uncertainty. The weighted sum model’s clarity and ability to provide a first-order approximation of sustainability make it a practical tool for conceptual design.
This work also addresses the key considerations outlined in relevant studies for assessing sustainability using MCDM methods, such as [9] ensuring complete transparency in methodological choices and providing sound reasoning behind the decisions made. It offers detailed explanations of the selection process for alternatives and criteria, the definition of criterion scores, the generation of weights, and the rationale for choosing the specific MCDM method. Additionally, a sensitivity analysis is incorporated to assess the robustness of the results, providing further confidence in the reliability and consistency of the findings under different scenarios and assumptions.
Future research should address potential drawbacks of the weighted sum model, particularly its compensatory nature, where strong performance in one criterion can offset poor performance in another. Introducing minimum thresholds for critical criteria could help ensure that design alternatives failing to meet essential sustainability requirements are excluded from consideration. Moreover, the engagement of relevant stakeholders to establish a more realistic definition of priorities within the context of holistic sustainability in specific sectors would undoubtedly enhance the credibility of the assessment.

Author Contributions

Conceptualization, S.M., D.M., A.F. and S.P.; methodology, S.M. and D.M.; software, S.M.; validation, D.M., S.P. and A.F.; formal analysis, S.M. and D.M.; investigation, S.M. and D.M.; resources, A.F. and S.P.; data curation, S.M., D.M. and A.F.; writing—original draft preparation, S.M., D.M. and A.F.; writing—review and editing, S.M., D.M., A.F. and S.P.; visualization, S.M. and D.M.; supervision, S.P.; project administration, S.M. and S.P.; funding acquisition, S.P. All authors have read and agreed to the published version of the manuscript.

Funding

The research conducted in this paper has been funded by European Union’s Horizon 2020’s research and innovation program under grant agreement no. 101058089, project EuReComp (European recycling and circularity in large composite components).

Data Availability Statement

The original contributions presented in the study are included in the article, further inquiries can be directed to the corresponding author.

Conflicts of Interest

The authors declare no conflict of interest.

Nomenclature

AHPAnalytic Hierarchy Process
CFRPCarbon Fiber Reinforced Plastic
COPRASComplex Proportional Assessment
DANPDEMATEL-based ANP
DEMATELDecision-Making Trial and Evaluation Laboratory
ELECTREElimination and Choice Expressing Reality
ESMElimination Et Choice Translating Reality
GPGoal Programming
GRAGrey Relational Analysis
MARCOSMeasurement of Alternatives and Ranking According to Compromise Solution
MCDMMulti-Criteria Decision Making
MOORAMulti-Objective Optimization Ratio Analysis
PROMETHEEPreference Ranking Optimization Method for Enrichment Evaluation
PSIPopulation Stability Index
SISustainability Index
SWARAStepwise Weight Assessment Ratio Analysis
TOPSISTechnique for Order Preference by Similarity to Ideal Solution
VIKORVIseKriterijumskaOptimizacija I KompromisnoResenje
WASPASWeighted Aggregated Sum Product Assessment
SAWSimple Additive Weighting
WPMWeighted Product Method
WSMWeighted Sum Model

References

  1. Salas-Zapata, W.A.; Ortiz-Muñoz, S.M. Analysis of meanings of the concept of sustainability. Sustain. Dev. 2019, 27, 153–161. [Google Scholar] [CrossRef]
  2. European Partnership Under Horizon Europe Clean Aviation. Available online: https://research-and-innovation.ec.europa.eu/system/files/2020-07/ec_rtd_he-partnerships-clean-aviation.pdf (accessed on 20 November 2024).
  3. Markatos, D.N.; Pantelakis, S.G. Assessment of the Impact of Material Selection on Aviation Sustainability, from a Circular Economy Perspective. Aerospace 2022, 9, 52. [Google Scholar] [CrossRef]
  4. Filippatos, A.; Markatos, D.; Tzortzinis, G.; Abhyankar, K.; Malefaki, S.; Gude, M.; Pantelakis, S. Sustainability-Driven Design of Aircraft Composite Components. Aerospace 2024, 11, 86. [Google Scholar] [CrossRef]
  5. Ziemba, P. Application framework of multi-criteria methods in sustainability assessment. Energies 2022, 15, 9201. [Google Scholar] [CrossRef]
  6. Stojčić, M.; Zavadskas, E.K.; Pamučar, D.; Stević, Ž.; Mardani, A. Application of MCDM methods in sustainability engineering: A literature review 2008–2018. Symmetry 2019, 11, 350. [Google Scholar] [CrossRef]
  7. Zhang, H.; Peng, Y.; Tian, G.; Wang, D.; Xie, P. Green material selection for sustainability: A hybrid MCDM approach. PLoS ONE 2017, 12, e0177578. [Google Scholar] [CrossRef]
  8. Żak, J.; Hadas, Y.; Rossi, R. (Eds.) Advanced Concepts, Methodologies and Technologies for Transportation and Logistics; Springer: Berlin/Heidelberg, Germany, 2018; Volume 572. [Google Scholar] [CrossRef]
  9. Santos, R.; Matias, J.C.O.; Abreu, A. A Decision-Making Tool to Provide Sustainable Solutions to a Consumer. IFIP Adv. Inf. Commun. Technol. 2020, 577, 63–78. [Google Scholar] [CrossRef]
  10. Streimikiene, D.; Balezentis, T.; Krisciukaitien, I.; Balezentis, A. Prioritizing sustainable electricity production technologies: MCDM approach. Renew. Sustain. Energy Rev. 2012, 16, 3302–3311. [Google Scholar] [CrossRef]
  11. Kumar, A.; Sah, B.; Singh, A.R.; Deng, Y.; He, X.; Kumar, P.; Bansal, R.C. A review of multi criteria decision making (MCDM) towards sustainable renewable energy development. Renew. Sustain. Energy Rev. 2017, 69, 596–609. [Google Scholar] [CrossRef]
  12. Wang, W.; Tian, G.; Zhang, T.; Jabarullah, N.H.; Li, F.; Fathollahi-Fard, A.M.; Wang, D.; Li, Z. Scheme selection of design for disassembly (DFD) based on sustainability: A novel hybrid of interval 2-tuple linguistic intuitionistic fuzzy numbers and regret theory. J. Clean. Prod. 2021, 281, 124724. [Google Scholar] [CrossRef]
  13. Lindfors, A. Assessing sustainability with multi-criteria methods: A methodologically focused literature review. Environ. Sustain. Indic. 2021, 12, 100149. [Google Scholar] [CrossRef]
  14. Dožić, S. Multi-criteria decision making methods: Application in the aviation industry. J. Air Transp. Manag. 2019, 79, 101683. [Google Scholar] [CrossRef]
  15. Elhmoud, E.R.; Kutty, A.A. Sustainability Assessment in Aviation Industry: A Mini- Review on the Tools, Models and Methods of Assessment. 2020. Available online: http://qspace.qu.edu.qa/handle/10576/50466 (accessed on 8 December 2024).
  16. Kiracı, K.; Akan, E. Aircraft selection by applying AHP and TOPSIS in interval type-2 fuzzy sets. J. Air. Transp. Manag. 2020, 89, 101924. [Google Scholar] [CrossRef] [PubMed]
  17. Bağcı, B.; Kartal, M. A combined multi criteria model for aircraft selection problem in airlines. J. Air. Transp. Manag. 2024, 116, 102566. [Google Scholar] [CrossRef]
  18. Dožić, S.; Kalić, M. Comparison of Two MCDM Methodologies in Aircraft Type Selection Problem. Transp. Res. Procedia 2015, 10, 910–919. [Google Scholar] [CrossRef]
  19. Ardil, C. Commercial Aircraft Selection Decision Support Model Using Fuzzy Combinative Multiple Criteria Decision Making Analysis. J. Sustain. Manuf. Transp. 2023, 3, 38–55. [Google Scholar] [CrossRef]
  20. Markatos, D.N.; Pantelakis, S.G. Implementation of a Holistic MCDM-Based Approach to Assess and Compare Aircraft, under the Prism of Sustainable Aviation. Aerospace 2023, 10, 240. [Google Scholar] [CrossRef]
  21. Lu, M.T.; Hsu, C.C.; Liou, J.J.H.; Lo, H.W. A hybrid MCDM and sustainability-balanced scorecard model to establish sustainable performance evaluation for international airports. J. Air. Transp. Manag. 2018, 71, 9–19. [Google Scholar] [CrossRef]
  22. Janic, M.; Reggiani, A. An Application of the Multiple Criteria Decision Making (MCDM) Analysis to the Selection of a New Hub Airport. Eur. J. Transp. Infrastruct. Res. 2002, 2. [Google Scholar] [CrossRef]
  23. Chai, N.; Zhou, W. A novel hybrid MCDM approach for selecting sustainable alternative aviation fuels in supply chain management. Fuel 2022, 327, 125180. [Google Scholar] [CrossRef]
  24. Chen, L.; Ren, J. Multi-attribute sustainability evaluation of alternative aviation fuels based on fuzzy ANP and fuzzy grey relational analysis. J. Air. Transp. Manag. 2018, 68, 176–186. [Google Scholar] [CrossRef]
  25. Singh, J.; Rana, S.; Hamid, A.B.A.; Gupta, P. Who should hold the baton of aviation sustainability? Soc. Responsib. J. 2023, 19, 1161–1177. [Google Scholar] [CrossRef]
  26. Chatterjee, P.; Chakraborty, S. Flexible manufacturing system selection using preference ranking methods: A comparative study. Int. J. Ind. Eng. Comput. 2014, 5, 315–338. [Google Scholar] [CrossRef]
  27. Aytekin, A. Comparative Analysis of the Normalization Techniques in the Context of MCDM Problems. Decis. Mak. Appl. Manag. Eng. 2021, 4, 1–25. [Google Scholar] [CrossRef]
  28. Jafaryeganeh, H.; Ventura, M.; Soares, C.G. Effect of normalization techniques in multi-criteria decision making methods for the design of ship internal layout from a Pareto optimal set. Struct. Multidiscip. Optim. 2020, 62, 1849–1863. [Google Scholar] [CrossRef]
  29. Mhlanga, S.T.; Lall, M. Influence of Normalization Techniques on Multi-criteria Decision-making Methods. J. Phys. Conf. Ser. 2022, 2224, 012076. [Google Scholar] [CrossRef]
  30. Vafaei, N.; Ribeiro, R.A.; Camarinha-Matos, L.M. Assessing Normalization Techniques for Simple Additive Weighting Method. Procedia Comput. Sci. 2022, 199, 1229–1236. [Google Scholar] [CrossRef]
  31. Kacprzak, D. A new similarity measure for rankings obtained in MCDM problems using different normalization techniques. Oper. Res. Decis. 2024, 34, 47–64. [Google Scholar] [CrossRef]
  32. Kosareva, N.; Krylovas, A.; Zavadskas, E.K. Statistical analysis of MCDM data normalization methods using Monte Carlo approach. The case of ternary estimates matrix. Econ. Comput. Econ. Cybern. Stud. Res. 2018, 52, 159–175. [Google Scholar] [CrossRef]
  33. Do, D.T.; Tran, V.D.; Duong, V.D.; Nguyen, N.-T. Investigation of the Appropriate Data Normalization Method for Combination with Preference Selection Index Method in MCDM. Oper. Res. Eng. Sci. Theory Appl. 2023, 6. [Google Scholar] [CrossRef]
  34. Mukhametzyanov, I.Z. Normalization of Multidimensional Data for Multi-Criteria Decision Making Problems; Springer Nature: Dordrecht, The Netherlands, 2023; Volume 348. [Google Scholar] [CrossRef]
  35. Vafaei, N.; Ribeiro, R.A.; Camarinha-Matos, L.M. Comparison of Normalization Techniques on Data Sets with Outliers. Int. J. Decis. Support Syst. Technol. 2022, 14, 1–17. [Google Scholar] [CrossRef]
  36. Trung, D.D. Development of data normalization methods for multi-criteria decision making: Applying for MARCOS method. Manuf. Rev. 2022, 9, 22. [Google Scholar] [CrossRef]
  37. Mathew, M.; Sahu, S.; Upadhyay, A. Effect of Normalization Techniques in Robot Selection Using Weighted Aggregated Sum Product Assessment. Int. J. Innov. Res. Adv. Stud. 2017, 4, 59–63. [Google Scholar]
  38. Lakshmi, T.M.; Venkatesan, V.P. A Comparison of Various Normalization in Techniques for Order Performance By Similarity To Ideal Solution (topsis). Int. J. Comput. Algorithm 2014, 3, 255–259. Available online: http://www.hindex.org/2014/article.php?page=853 (accessed on 8 December 2024).
  39. Markatos, D.N.; Malefaki, S.; Pantelakis, S.G. Sensitivity Analysis of a Hybrid MCDM Model for Sustainability Assessment—An Example from the Aviation Industry. Aerospace 2023, 10, 385. [Google Scholar] [CrossRef]
  40. Ardil, C. Aircraft selection using multiple criteria decision making analysis method with different data normalization techniques. Int. J. Ind. Syst. Eng. 2019, 13, 744–756. Available online: https://www.academia.edu/52345173/Aircraft_Selection_Using_Multiple_Criteria_Decision_Making_Analysis_Method_with_Different_Data_Normalization_Techniques (accessed on 8 December 2024).
  41. Filippatos, A.; Markatos, D.; Tzortzinis, G.; Abhyankar, K.; Malefaki, S.; Gude, M.; Pantelakis, S. A proposal towards a step change from eco-driven to sustainability-driven design of aircraft components. In Proceedings of the ICAS 2024 Conference, Florence, Italy, 9–13 September 2024; Available online: https://www.researchgate.net/publication/385272877_A_PROPOSAL_TOWARDS_A_STEP_CHANGE_FROM_ECO-DRIVEN_TO_SUSTAINABILITY-DRIVEN_DESIGN_OF_AIRCRAFT_COMPONENTS (accessed on 20 November 2024).
  42. Clean Aviation. Eco-Design TA. Available online: https://www.clean-aviation.eu/ (accessed on 20 November 2024).
  43. Gupta, I.; Nandita, M.; Deepak, T. Triple bottom line: Evidence from aviation sector. Int. J. Bus. Ethics Gov. 2020, 3, 97–104. [Google Scholar] [CrossRef]
  44. Saaty, T.L. A scaling method for priorities in hierarchical structures. J. Math. Psychol. 1977, 15, 234–281. [Google Scholar] [CrossRef]
  45. Fishburn, P.C. Letter to the Editor—Additive Utilities with Incomplete Product Sets: Application to Priorities and Assignments. Oper. Res. 1967, 15, 537–542. [Google Scholar] [CrossRef]
  46. Saaty, T. The analytic hierarchy process: Planning, priority setting, resource allocation McGraw-Hill, New York, 1980, xiii. Eur. J. Oper. Res. 1980, 9, 97–98. Available online: https://search.worldcat.org/title/5352839 (accessed on 11 December 2024).
  47. Saaty, T.L. How to make a decision: The analytic hierarchy process. Eur. J. Oper. Res. 1990, 48, 9–26. [Google Scholar] [CrossRef]
  48. Hwang, C.-L.; Yoon, K. Multiple Attribute Decision Making. In Multiple Attribute Decision Making: Methods and Applications a State-of-the-Art Survey; Springer: Berlin/Heidelberg, Germany, 1981; Volume 186. [Google Scholar] [CrossRef]
  49. Ciardiello, F.; Genovese, A. A comparison between TOPSIS and SAW methods. Ann. Oper. Res. 2023, 325, 967–994. [Google Scholar] [CrossRef]
  50. Akay, H.; Koçyiğit, M.B. Investigation of Flood Hazard Susceptibility Using Various Distance Measures in Technique for Order Preference by Similarity to Ideal Solution. Appl. Sci. 2024, 14, 7023. [Google Scholar] [CrossRef]
  51. García-Cascales, M.S.; Lamata, M.T. On rank reversal and TOPSIS method. Math. Comput. Model. 2012, 56, 123–132. [Google Scholar] [CrossRef]
  52. Shyur, H.-J.; Shih, H.-S. Resolving Rank Reversal in TOPSIS: A Comprehensive Analysis of Distance Metrics and Normalization Methods. Informatica 2024, 35, 837–858. [Google Scholar] [CrossRef]
  53. Deng, H.; Yeh, C.H.; Willis, R.J. Inter-company comparison using modified TOPSIS with objective weights. Comput. Oper. Res. 2000, 27, 963–973. [Google Scholar] [CrossRef]
  54. Opricovic, S. Multicriteria Optimization of Civil Engineering Systems. Ph.D. Thesis, Faculty of Civil Engineering, Belgrade, Serbia, 1998; 302p. Available online: https://www.scirp.org/reference/referencespapers?referenceid=2827893 (accessed on 11 December 2024).
  55. Duckstein, L.; Opricovic, S. Multiobjective optimization in river basin development. Water Resour. Res. 1980, 16, 14–20. [Google Scholar] [CrossRef]
  56. Opricovic, S.; Tzeng, G.H. Multicriteria Planning of Post-Earthquake Sustainable Reconstruction. Comput.-Aided Civ. Infrastruct. Eng. 2002, 17, 211–220. [Google Scholar] [CrossRef]
  57. Zavadskas, E.K.; Kaklauskas, A.; Šarka, V. The new method of multicriteria complex proportional assessment of projects. Technol. Econ. Dev. Econ. 1994, 1, 131–139. [Google Scholar]
  58. Kraujalienė, L. Comparative analysis of multicriteria decision-making methods evaluating the efficiency of technology transfer. Bus. Manag. Econ. Eng. 2019, 17, 72–93. [Google Scholar] [CrossRef]
  59. Krishnan, A.R. Past efforts in determining suitable normalization methods for multi-criteria decision-making: A short survey. Front. Big Data 2022, 5, 990699. [Google Scholar] [CrossRef]
Figure 1. Profile and geometry of a hat stiffened panel [4].
Aerospace 12 00100 g001
Figure 2. (af): Boxplots of the first five ordered attributes across MCDM methods for two levels of data perturbation (1% and 10%), for the equal weights’ scenario (a,b), for the cost and performance prioritization scenario (c,d), and for the environment and performance prioritization scenario (e,f).
Aerospace 12 00100 g002aAerospace 12 00100 g002b
Figure 3. (f): Boxplots of the first five ordered attributes across various normalization methods for two levels of data perturbation (1% and 10%), for the equal weights’ scenario (a,b), for the cost and performance prioritization scenario (c,d), and for the environment and performance prioritization scenario (e,f).
Aerospace 12 00100 g003aAerospace 12 00100 g003b
Table 1. Component’s alternative configurations/material combinations.
Component Configurations
NoSkinStringer
1Aluminium 2024 T3Aluminium 2024 T3
2CFRP (Carbon Fiber-Reinforced Plastic)Aluminium 2024 T3
3Aluminium 2024 T3CFRP
4CFRPCFRP
517-4PH Stainless SteelCFRP
Table 2. Normalization methods considered in the present study.
MethodFor the Attribute That Needs to Be MaximizedFor the Attribute That Need to Be Minimized
Min–Max x = x m i n ( x ) max x m i n ( x ) x = 1 x min x max x m i n ( x )
Z-Score x = x m e a n ( x ) s t d e v ( x ) x = x m e a n ( x ) s t d e v ( x )
Robust Scaling x = x m e d i a n ( x ) I Q R ( x ) x = x m e d i a n ( x ) I Q R ( x )
L1—Norm x = x x i x = max x x + m i n ( x ) x i
L2—Norm x = x x i 2 x = max x x + m i n ( x ) x i 2
Table 3. Ranking of configurations using different MCDM methods across various sustainability scenarios.
Ranking No.Material CombinationSWMTOPSISModified TOPSISCOPRASVIKOR
Equal Weighting
1AL-AL8990908990
2AL-AL5451515050
3AL-AL5091918591
4AL-AL9052529089
5AL-AL8550505451
6AL-AL9455554655
7AL-AL5595955152
8AL-AL123565612392
9AL-AL5192929454
10AL-AL12889895585
Prioritization to Performance and Costs Terms
Ranking No.Material CombinationSWMTOPSISMod. TOPSISCOPRASVIKOR
1AL-AL9092918992
2AL-AL9193925093
3AL-AL5591938591
4AL-AL9597525452
5AL-AL5698969097
6AL-AL9453534653
7AL-AL9652975196
8AL-AL51965712390
9AL-AL8957909457
10AL-AL9258565598
Prioritization to Performance and Environment Terms
Ranking No.Material CombinationSWMTOPSISMod. TOPSISCOPRASVIKOR
1AL-AL8990908989
2AL-AL5451915050
3AL-AL5091519090
4AL-AL9052528554
5AL-AL9450505185
6AL-AL8555555451
7AL-AL5595959194
8AL-AL12356565555
9AL-AL5192929486
10AL-AL12889898691
Table 4. Pearson’s correlation analysis results for the considered MCDM methods.
Aggregation MethodSWMTOPSISModified TOPSISCOPRASVIKOR
Equal Weights
SWM10.8660.8660.9580.948
TOPSIS0.866110.9430.869
Modified TOPSIS0.866110.9430.869
COPRAS0.9580.9430.94310.976
VIKOR0.9480.8690.8690.9761
Prioritization to Performance and Environment Terms
SWM10.8560.8900.8980.941
TOPSIS0.85610.9320.9120.886
Modified TOPSIS0.8900.93210.9760.853
COPRAS0.8980.9120.97610.854
VIKOR0.9410.8860.8530.8541
Prioritization to Performance and Costs Terms
SWM10.9080.9230.9310.917
TOPSIS0.90810.9990.8260.987
Modified TOPSIS0.9230.99910.8430.988
COPRAS0.9310.8260.84310.809
VIKOR0.9170.9870.9880.8091
Table 5. Ranking of configurations using different normalization methods for the WSM, across various sustainability scenarios.
Ranking No.MaterialMin–Maxz-ScoreMedianL2—NormL1—Norm
Equal Weighting
1AL-AL8990909191
2AL-AL5491919090
3AL-AL5050519292
4AL-AL9089505151
5AL-AL8551895252
6AL-AL9455555093
7AL-AL5595925656
8AL-AL12356959350
9AL-AL5194569596
10AL-AL12892529695
Prioritization to Performance and Costs Terms
1AL-AL9092929292
2AL-AL9191919393
3AL-AL5593939191
4AL-AL9596969797
5AL-AL5690975253
6AL-AL9497575352
7AL-AL9656909698
8AL-AL5157529896
9AL-AL8952565757
10AL-AL9295955858
Prioritization to Performance and Environment Terms
1AL-AL8990909191
2AL-AL5491919292
3AL-AL5051519090
4AL-AL9050505151
5AL-AL9489895252
6AL-AL8555929393
7AL-AL5595555656
8AL-AL12356955096
9AL-AL5192569695
10AL-AL12894529550
Table 6. Pearson’s correlation analysis results for the considered normalization methods methods—assuming equal weighting.
Normalization
Method
Min–Maxz-ScoreMedianL2—NormL1—Norm
Equal Weights
Min–Max10.9470.8920.9460.942
z-Score0.94710.9900.9960.996
Median0.8920.99010.9830.984
L2—Norm0.9460.9960.98311
L1—Norm0.9420.9960.98411
Disclaimer/Publisher’s Note: The statements, opinions and data contained in all publications are solely those of the individual author(s) and contributor(s) and not of MDPI and/or the editor(s). MDPI and/or the editor(s) disclaim responsibility for any injury to people or property resulting from any ideas, methods, instructions or products referred to in the content.

