Article

Experimental Investigation on Drag Reduction Characteristics of Riblets Considering the Flow Environment of Fuselage

1
School of Aeronautic Science and Engineering, Beihang University, Beijing 100191, China
2
Shenyang Aerodynamics Research Institute, China Aviation Industry Corporation, Shenyang 110015, China
*
Author to whom correspondence should be addressed.
Aerospace 2025, 12(11), 985; https://doi.org/10.3390/aerospace12110985
Submission received: 11 September 2025 / Revised: 25 October 2025 / Accepted: 25 October 2025 / Published: 3 November 2025
(This article belongs to the Section Aeronautics)

Abstract

The riblets surface is a passive turbulence drag reduction technology that holds promising application prospects in drag reduction for large aircraft. Currently, most research on the drag reduction characteristics of riblets is limited to medium and low Reynolds number environments with zero pressure gradient, and the effects of adverse pressure gradient on the drag reduction rate remain controversial. The inconsistency between the local flow direction on the fuselage surface and the arrangement direction of the riblets can lead to cross-flow effects. To investigate the drag reduction performance of riblets under flow conditions more representative of actual aircraft surfaces, this study establishes an adverse pressure gradient environment at moderate-to-high Reynolds numbers. Hot-wire anemometry is employed to measure the drag reduction rate of the riblet surface, and the fundamental turbulent boundary layer statistics are observed. The measurement results indicate that the adverse pressure gradient and cross-flow effects contribute positively and negatively to the drag reduction rate of the riblets, respectively, while the increase in Reynolds number in this experiment has no substantial effect. The changes in the basic statistics of the turbulent boundary layer on the surface of the riblets are consistent with existing literature.

1. Introduction

The total drag of a large aircraft is primarily composed of skin friction drag, induced drag, pressure drag, and interference drag. Among these, skin friction drag accounts for more than 50% of the total drag [1], representing the most significant potential for drag reduction. As a passive turbulence reduction method, the riblet surface requires no additional control devices, offers relatively straightforward implementation, and demonstrates significant drag reduction effects, thus holding greater application potential. Since the initial exploration of drag reduction effects of riblets by Walsh et al. [2,3,4,5] from NASA Langley Research Center in the 1980s, researchers have conducted extensive experimental and numerical simulation studies on this subject. Results demonstrate that triangular riblets with equal dimensionless height and width exhibit optimal drag reduction performance among various riblet configurations [5]. Chan explored the influence of the riblet height-to-spacing ratio and found that the trend of the “k”-type behavior is associated with the destruction of near-wall cycle structures, which is indicated by the shortening of Reynolds stress structures [6]. Regarding the drag reduction mechanism of riblets, multiple interpretations have been proposed in the literature [7,8,9,10,11], yet a comprehensive theoretical framework has not been established to date.
Aircraft surfaces represent a potential application scenario for riblets, which present three distinctive flow characteristics: firstly, the aircraft surface is subjected to high Reynolds number conditions; secondly, extensive adverse pressure gradient regions exist on the fuselage; finally, complex flow conditions around engine nacelles, wing-body junctions, and landing gear bays result in local flow directions that are not parallel to the fuselage centerline and dynamically adjust with changing flight attitudes, generating local crossflows. The model proposed by Wang can accurately predict the drag reduction effects of various riblet shapes (such as blade-shaped, trapezoidal, triangular, etc.) under optimal dimensions, and solves the problem that traditional models overestimate drag reduction at the optimal dimensions [12]. However, existing research predominantly focuses on streamwise-aligned riblets under zero-pressure-gradient conditions, and due to experimental limitations, studies on riblets at high Reynolds numbers remain scarce.
Numerous studies have investigated the effects of adverse pressure gradients on smooth flat-plate boundary layers. The presence of an adverse pressure gradient introduces certain modifications to boundary layer characteristics [13]. High-resolution large eddy simulation was employed to comparatively analyze the drag reduction performance of riblets under zero pressure gradient and mild adverse pressure gradient conditions, which found that the drag reduction effect of riblets was only slightly improved under the mild adverse pressure gradient condition [14]. In terms of the velocity profile, a strong adverse pressure gradient results in a slight downward shift in the log-law region in the mean velocity profile, indicating a thinning of the viscous sublayer [15]. The Reynolds shear stress increases significantly with the intensity of the adverse pressure gradient, indicating a fundamental shift in the primary locations and mechanisms of turbulence production. The contributions and spatial distributions of the terms in the turbulent kinetic energy transport equation undergo profound modifications under such conditions [14]. Hence, the potential influence of adverse pressure gradients on the drag reduction performance of riblets cannot be overlooked. Historically, research conclusions regarding this effect have exhibited significant contradictions: some studies suggest that adverse pressure gradients enhance the drag reduction rate of riblets [16], while others report the opposite trend [17,18]. Consequently, conducting precise experimental measurements is essential to accurately characterize the drag reduction properties of riblets under realistic operating conditions.
Furthermore, the influence of local crossflow effects warrants in-depth investigation. The prevailing explanation for the drag reduction mechanism of riblets posits that their streamwise-periodic geometry suppresses the spanwise fluctuations of near-wall streamwise vortices, which are recognized as the primary instigators of turbulent bursting events and consequent wall friction generation. Park investigates the effect of yaw angle on the drag reduction performance of riblets in turbulent channel flow through direct numerical simulations. When the yaw angle α < 12°, riblets can still achieve drag reduction; however, their drag-reduction performance deteriorates as the yaw angle increases [19]. Li also found that the riblet drag reduction rate decreases with the increase in the yaw angle, and its critical yaw angle decreases as the immersion height increases [20]. Consequently, further experimental assessment of crossflow effects under varying Reynolds numbers and adverse pressure gradient conditions is necessary.
In summary, within the historical context of optimizing aerodynamic drag for large aircraft, obtaining experimental data that closely aligns with actual operating conditions is paramount for the modeling of riblets on such aircraft. This paper investigates the effects and underlying mechanisms of adverse pressure gradients and crossflow on the drag reduction rate of riblets under moderate-to-high Reynolds number conditions. The paper is structured as follows. Experimental setup describes the experimental methodology, including Experimental facilities, geometry of Riblets and design of TBL. The next two sections present drag reduction rate and turbulent statistics of riblets, respectively. The final section summarizes the conclusions.

2. Experimental Setup

2.1. Experimental Facilities

The experiments were conducted in a low-speed, straight-flow, suction-type wind tunnel. The test section of the wind tunnel is 11 m in length, 2 m in height, and 2 m in width. The velocity range is 0.5 m/s to 30 m/s, with a turbulence intensity level of 0.2%. The experimental setup is illustrated in Figure 1. The test plate is 10.6 m in length, 2 m in width, and 0.02 m in thickness. It is horizontally fixed at a height of 0.45 m above the lower wall of the wind tunnel, with a wedge-shaped leading edge. The yaw angle between the riblets and the incoming flow direction is adjusted using a 360° rotatable disk with a diameter of 0.6 m, which is installed in the center of the test plate. Two test plates of size 0.16 m× 0.38 m are symmetrically positioned on the turntable disk: one is a smooth plate (control group), and the other is Riblets under investigation (experimental group). The distance from the leading edge of both plates to the wedge-shaped leading edge is 8.6 m.
A right-handed coordinate system is adopted for the experiments, with the origin located at the center of the leading edge of the test plate. The incoming flow direction is defined as the x-direction (streamwise), the direction normal to the wall surface upward as the y-direction (wall-normal), and the direction along the width of the plate as the z-direction (spanwise). A hot-film anemometer is installed directly aft of both measurement plates. A traverse system is installed downstream of the two measurement plates to enable the hot-wire probe to move along the wall-normal direction perpendicular to the surface, thereby measuring the boundary layer above the test plates. The high-precision traverse stage used in the experiment has a wall-normal travel range of 0.5 m with an accuracy of 1 μm. Given that the thickness of the viscous sublayer in the plate boundary layer is on the order of y + = 3 ~ 5 , the actual wall-normal height corresponding to y + = 1 in this experiment is no less than 30 μm. Thus, the accuracy of the traverse system meets the experimental requirements.
Flow field measurements were conducted using a hot-wire anemometer system along with hot-wire and hot-film probes. The experiments employed a Constant Temperature Anemometry (CTA) system manufactured by Dantec Dynamics (Copenhagen, Denmark), operating at a bridge ratio of 1:20. The probes utilized included Dantec’s 55P11 single-wire probe, 55P15 boundary layer single-wire probe, and 55R47 hot-film probe. The overheat ratios for the hot-wire and hot-film probes were set to 0.8 and 0.4, respectively. The sampling frequency was set to 20 kHz for all measurements.
Regarding the arrangement of probes, a Dantec 55R47 hot-film probe is mounted flush with the trailing edge of each measurement plate. As the hot-film probes require in situ calibration, a Dantec 55P15 single-wire boundary layer probe is positioned directly above each hot-film probe. These single-wire probes are traversed along the wall-normal direction via a high-precision displacement stage. Additionally, a Dantec 55P11 single-wire probe is fixed in the free-stream region of the wind tunnel. This reference probe is located midway between the two traversable hot-wire probes, at a distance of 0.48m from the wall, outside the turbulent boundary layer developed over the plate.
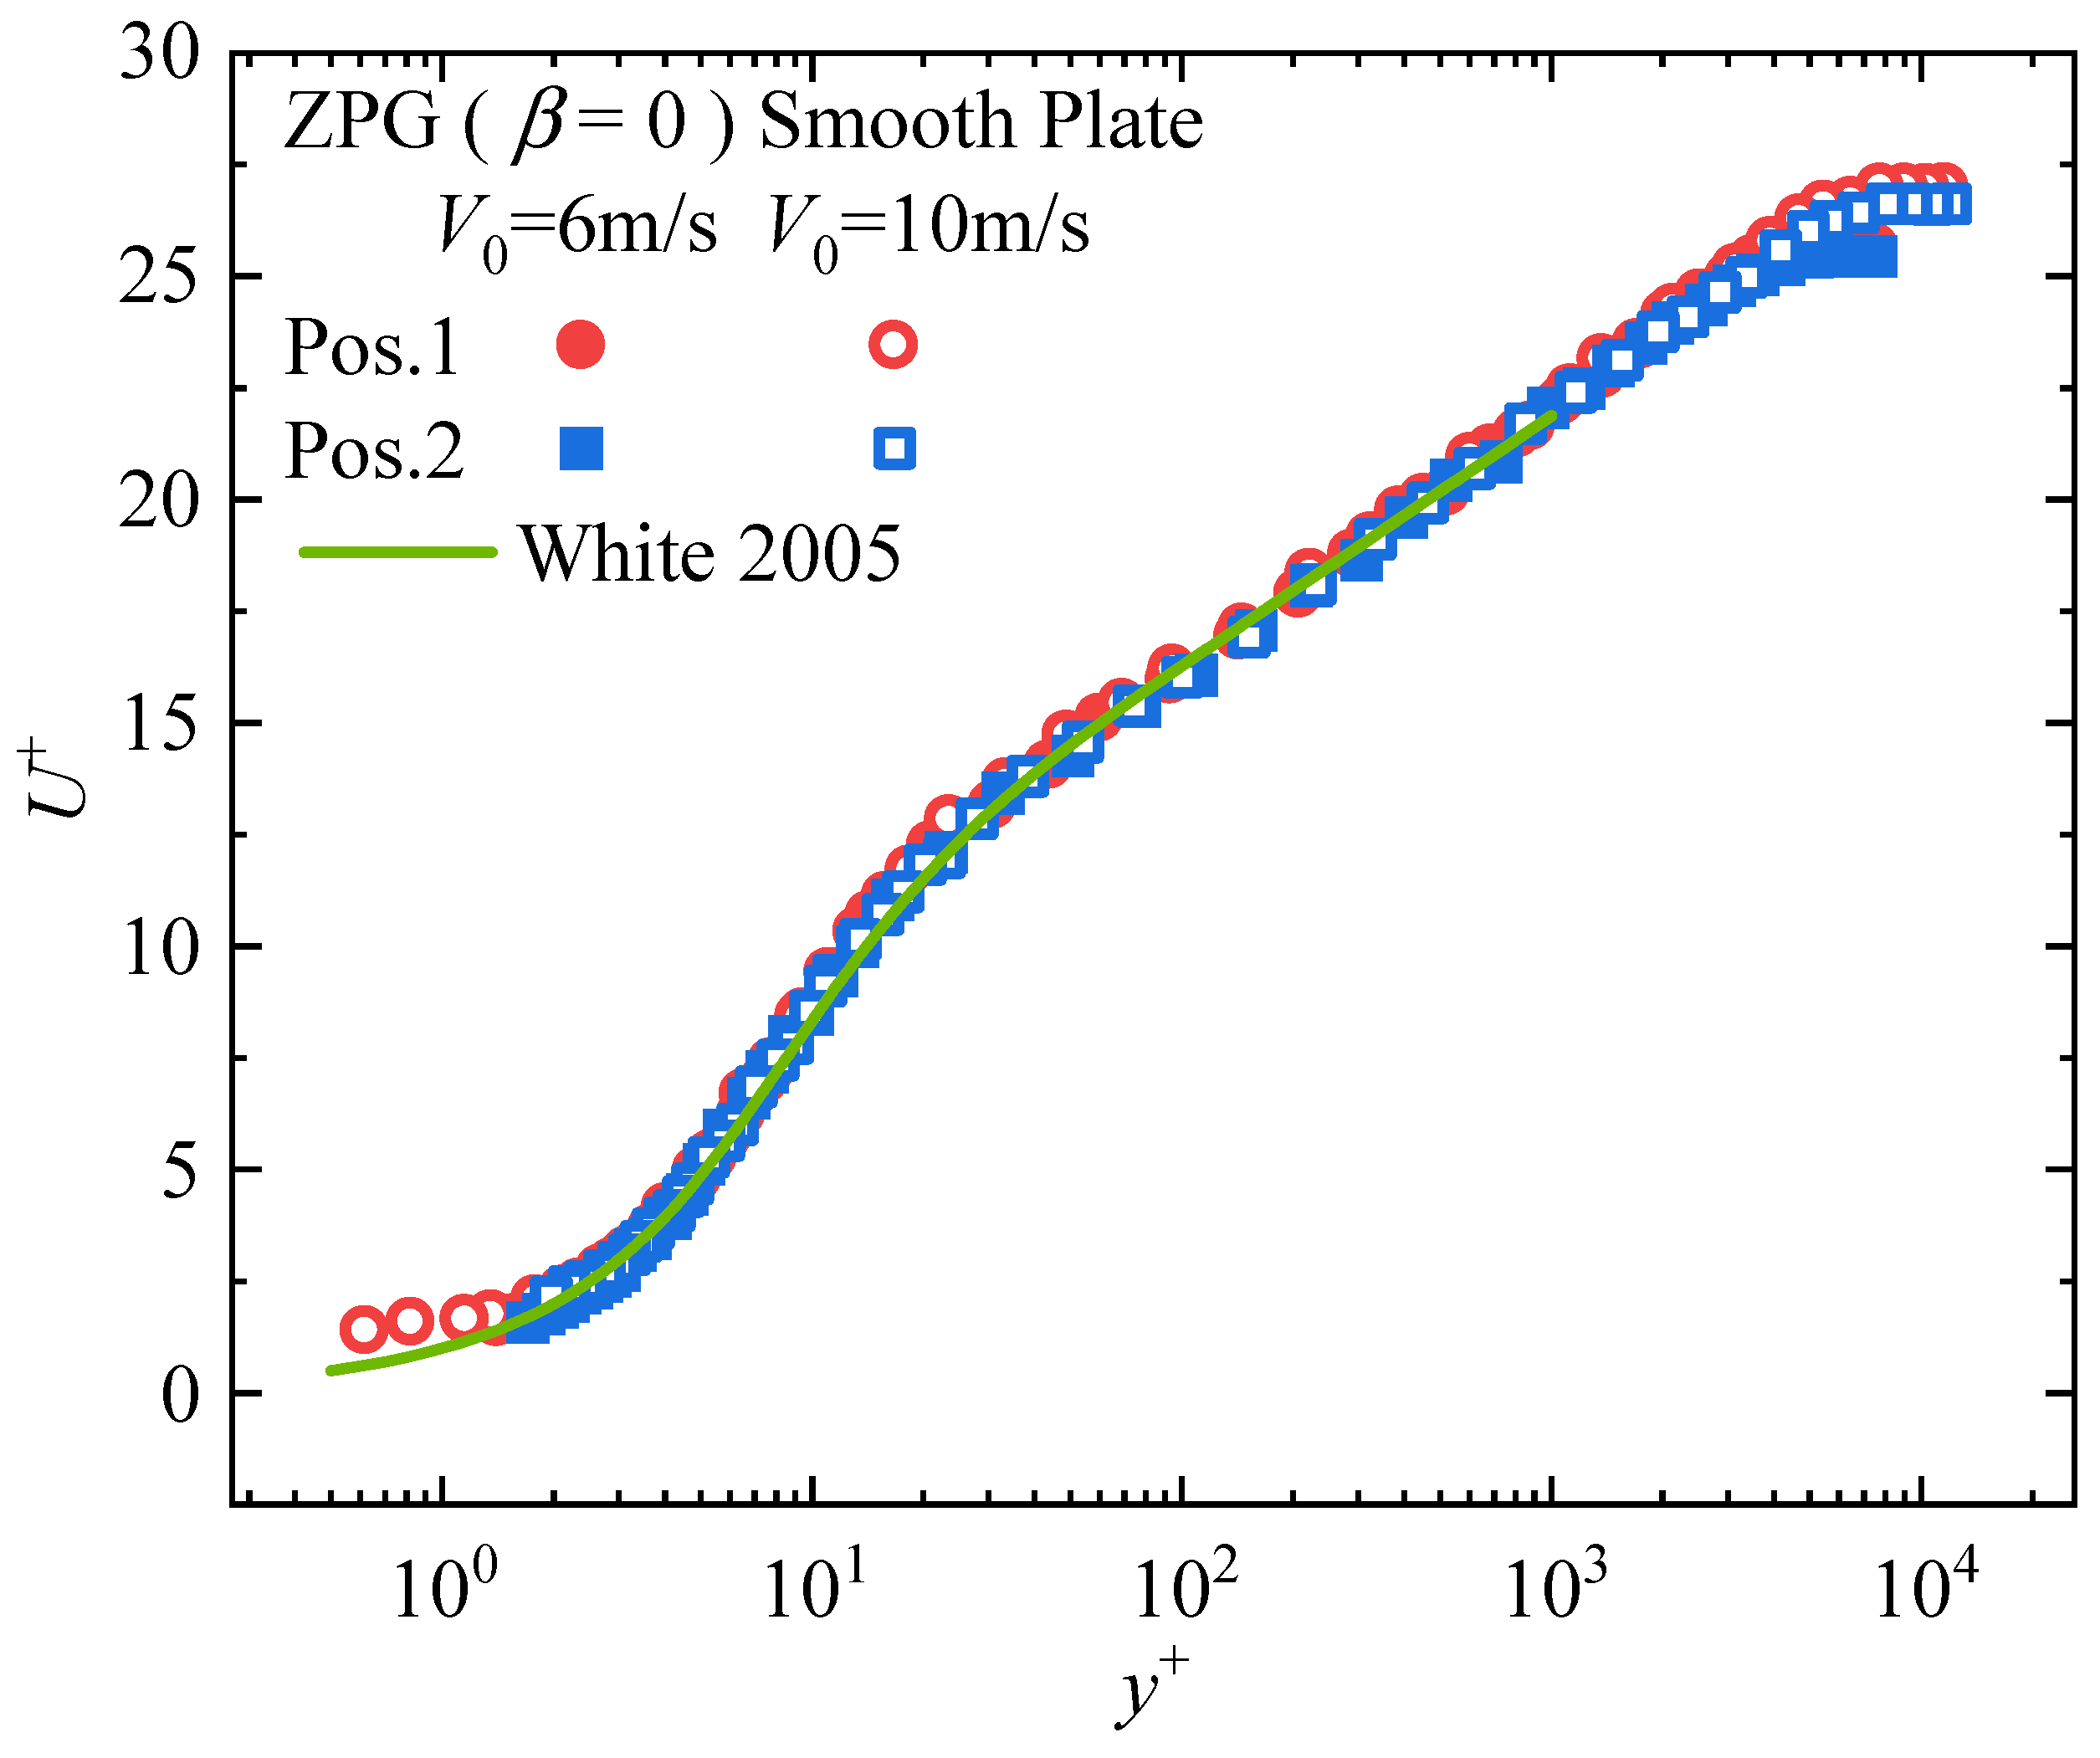
Figure 2 presents the time-averaged velocity profiles of the turbulent boundary layer measured at two different spanwise positions under incoming flow velocities of 6 m/s and 10 m/s, respectively. All velocity data are non-dimensionalized using the wall friction velocity u τ , i.e., y + = y u τ / ν , U + = U / u τ , u + = u / u τ . As seen from Figure 2, the velocity profiles at both spanwise positions demonstrate excellent agreement. For the mean velocity profiles, comparison is made with White’s canonical velocity profile [21], showing strong consistency between the present measurements and this established reference. Table 1 presents the turbulent boundary layer parameters for both the experimental (riblet-mounted) and control (smooth wall) cases at 6 m/s and 10 m/s. The statistical results demonstrate excellent agreement between the two spanwise measurement positions, confirming the spanwise homogeneity of the flow development.
It should be noted that both the wall shear stress τ w and the friction velocity u τ in this study are determined by fitting the slope of the mean velocity profile in the linear region of the viscous sublayer, i.e., τ w = μ d u d y y = wall = ρ u τ 2 . As seen from the inset of Figure 2, for the mean velocity profile under the 10 m/s smooth wall condition at Position 1, although the hot-wire probe reached measurement points within the range of y + < 1 , the measured velocities at these points exceed the canonical velocity profile and deviate significantly from the linear velocity distribution characteristic of the viscous sublayer. This occurs because when the distance between the hot-wire probe and the wall decreases beyond a certain threshold, heat conduction effects become significantly enhanced. A significant amount of the heat generated by the wire is conducted through the wall instead of being entirely removed by convective airflow. This results in an increase in the bridge power, which the system misinterprets as an elevated flow velocity [22]. Consequently, these data points are excluded from the evaluation of u τ and τ w .

2.2. Experimental Design of TBL

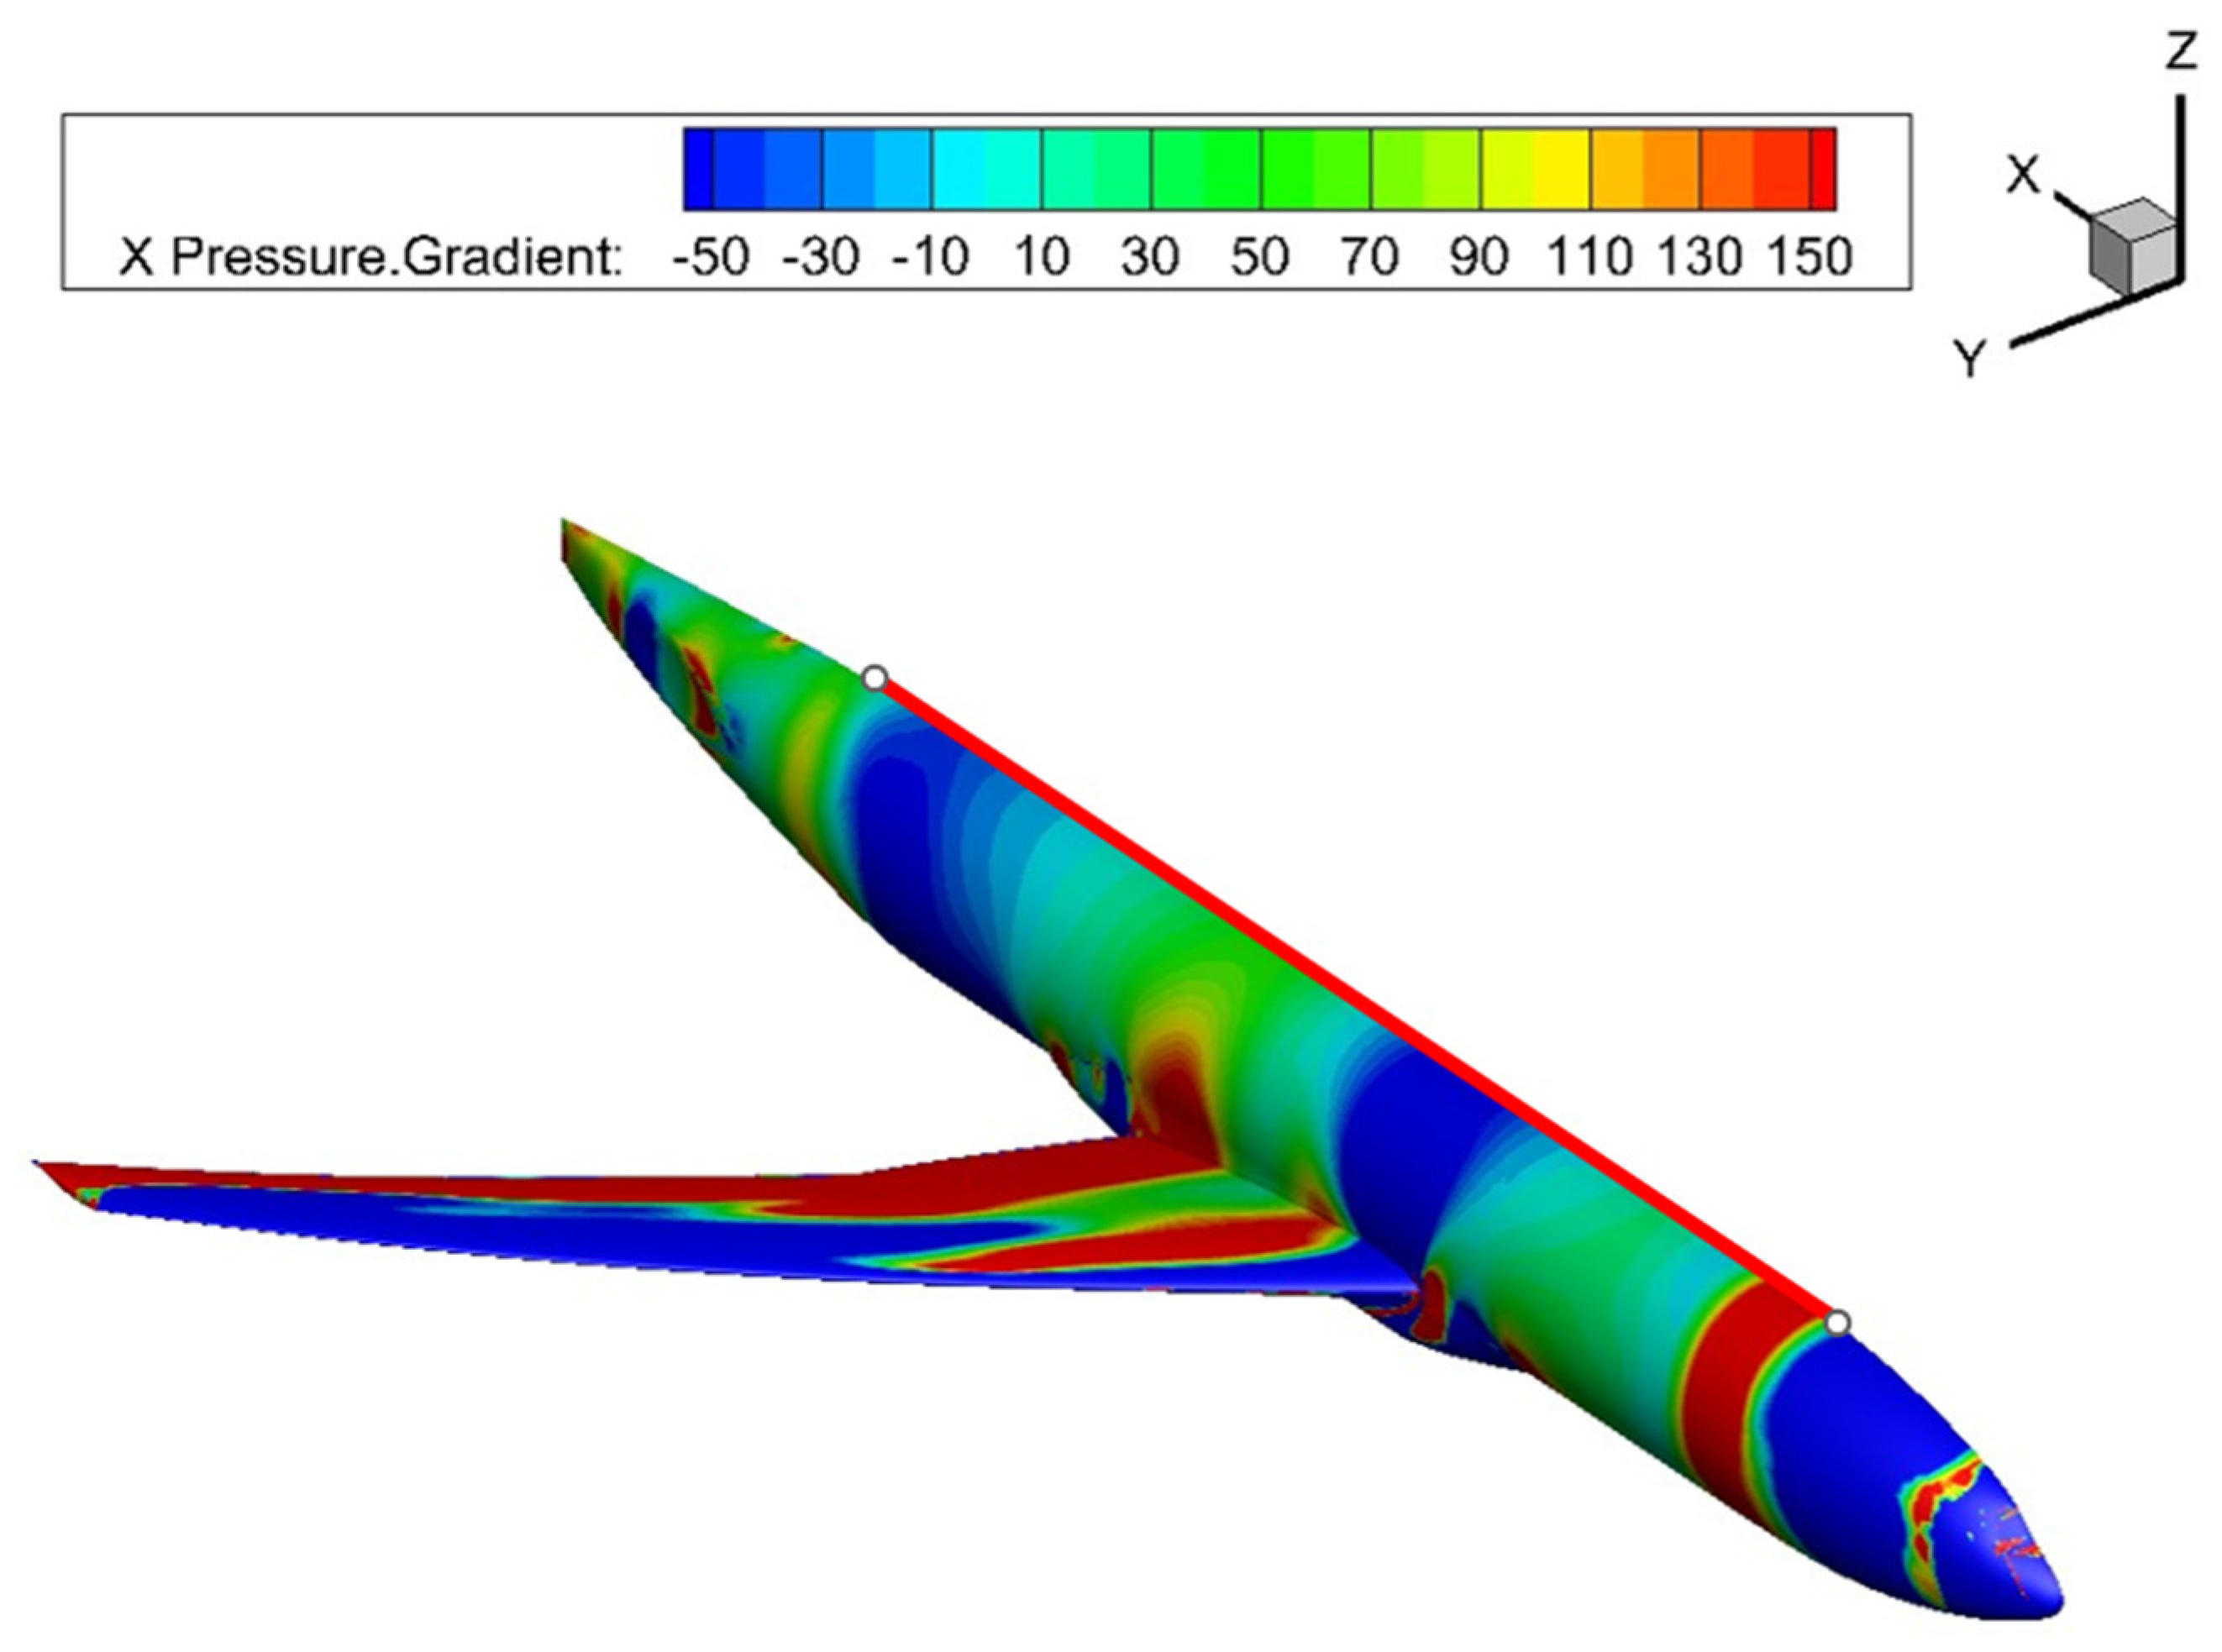
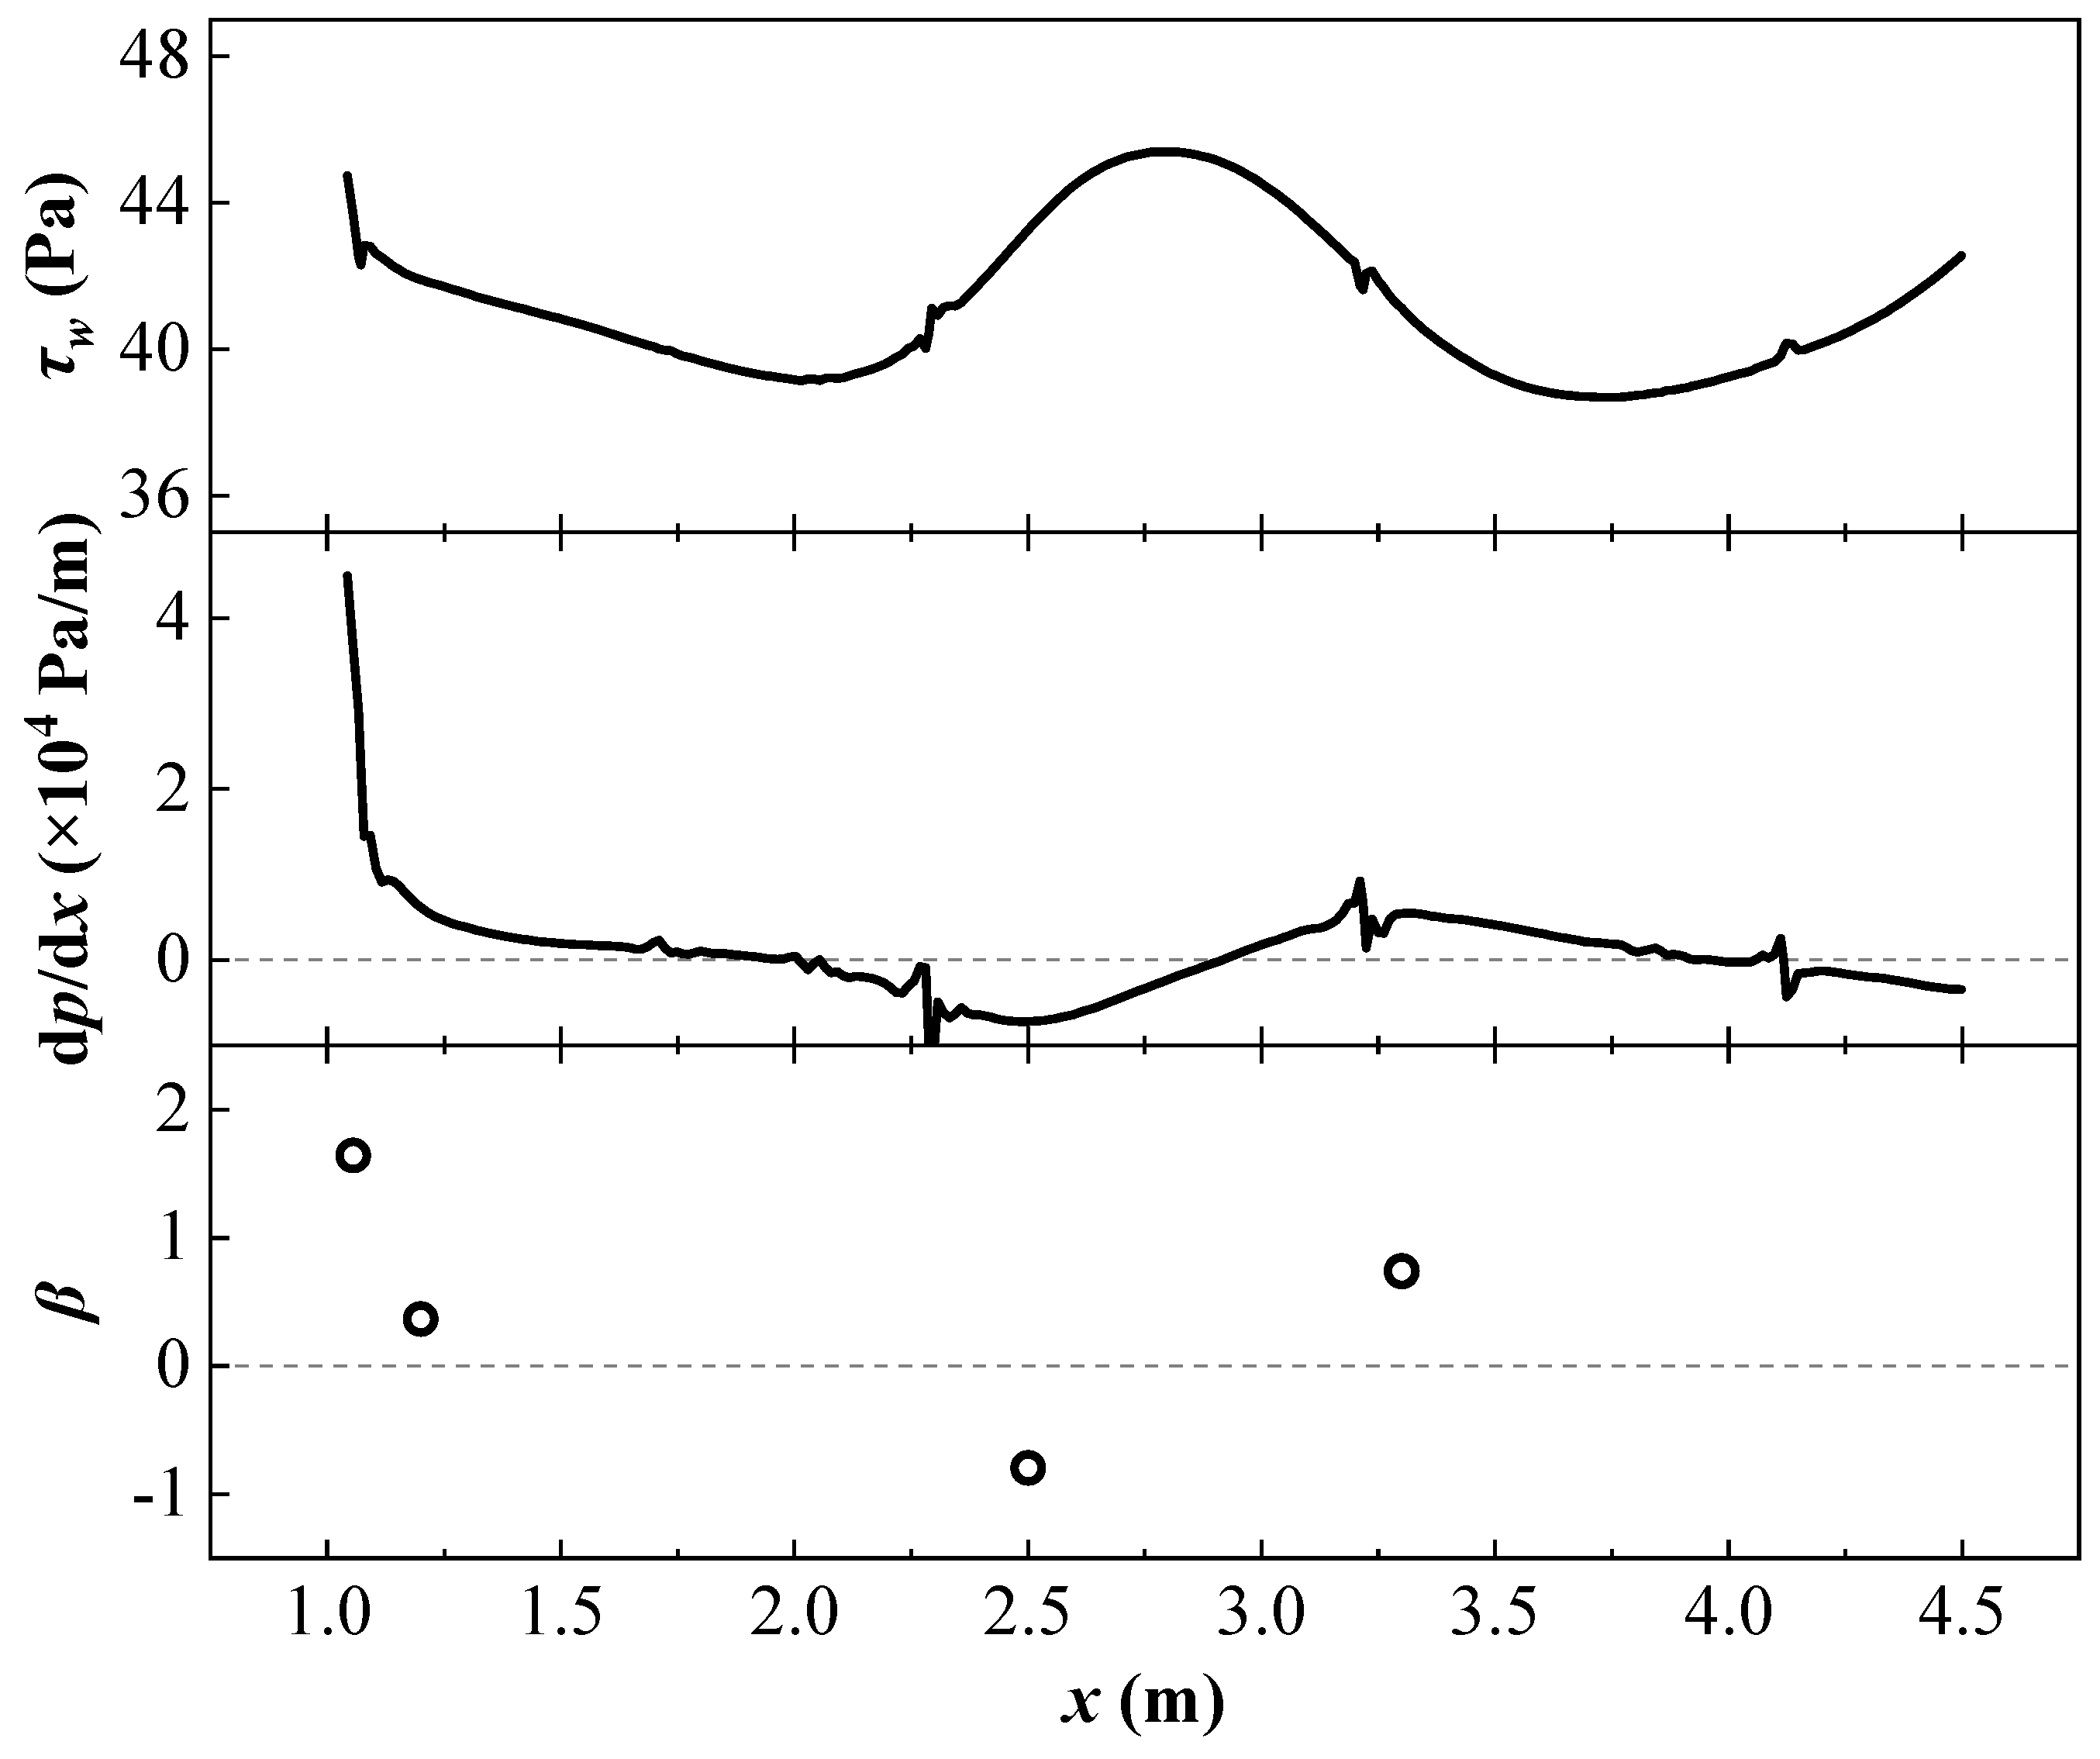
The turbulent drag reduction design of riblets for aircraft fuselage should primarily meet the drag reduction requirements corresponding to the flow field conditions present on the fuselage surface during cruise flight. This study employs the Common Research Model (CRM) as a reference configuration [23]. Numerical simulations are performed to characterize the flow field around the model under cruise conditions. Key flow parameters are extracted from the fuselage surface to subsequently determine the range of pressure gradients investigated in the experimental study. The external flow field around the Common Research Model (CRM) was computed using ANSYS Fluent 2021 R1. The simulation employed the k-omega SST turbulence model with a freestream Mach number of 0.85. The pressure gradient distribution over the CRM fuselage surface is presented in Figure 3. Planes intersecting the central axis of the CRM fuselage model at dihedral angles of 0 ° ,   15 ° ,   30 ° ,   60 °   and   90 ° relative to the horizontal plane intersect the fuselage surface along a straight line. At representative streamwise locations, the surface pressure gradient dp/dx, wall shear stress τ w , and local boundary layer displacement thickness δ were extracted. The Clauser pressure gradient parameter β = δ τ w d p d x was calculated, with the results shown in Figure 4 and Table 2.
As indicated in Table 2, the dimensionless adverse pressure gradient over the fuselage surface of the CRM under cruise conditions generally remains below 1.5. Additionally, Sasamori et al. [24] of the Japan Aerospace Exploration Agency (JAXA) conducted a comprehensive investigation of the adverse pressure gradient distribution over the surface of the TRA2022 model aircraft. Their findings reveal that the proportions of the wetted area subjected to favorable pressure gradient (FPG), zero pressure gradient (ZPG), and adverse pressure gradient (APG) conditions account for 36%, 15%, and 49% of the total wetted area, respectively. Within the APG regions, areas with β ≤ 2.0 constitute 41.6% of the total wetted area, while those within the range of 1 < β < 5 constitute merely 4.5% of the total wetted area. Accordingly, this paper selected two adverse pressure gradient conditions, β = 0.8 and β = 1.5, for investigation.
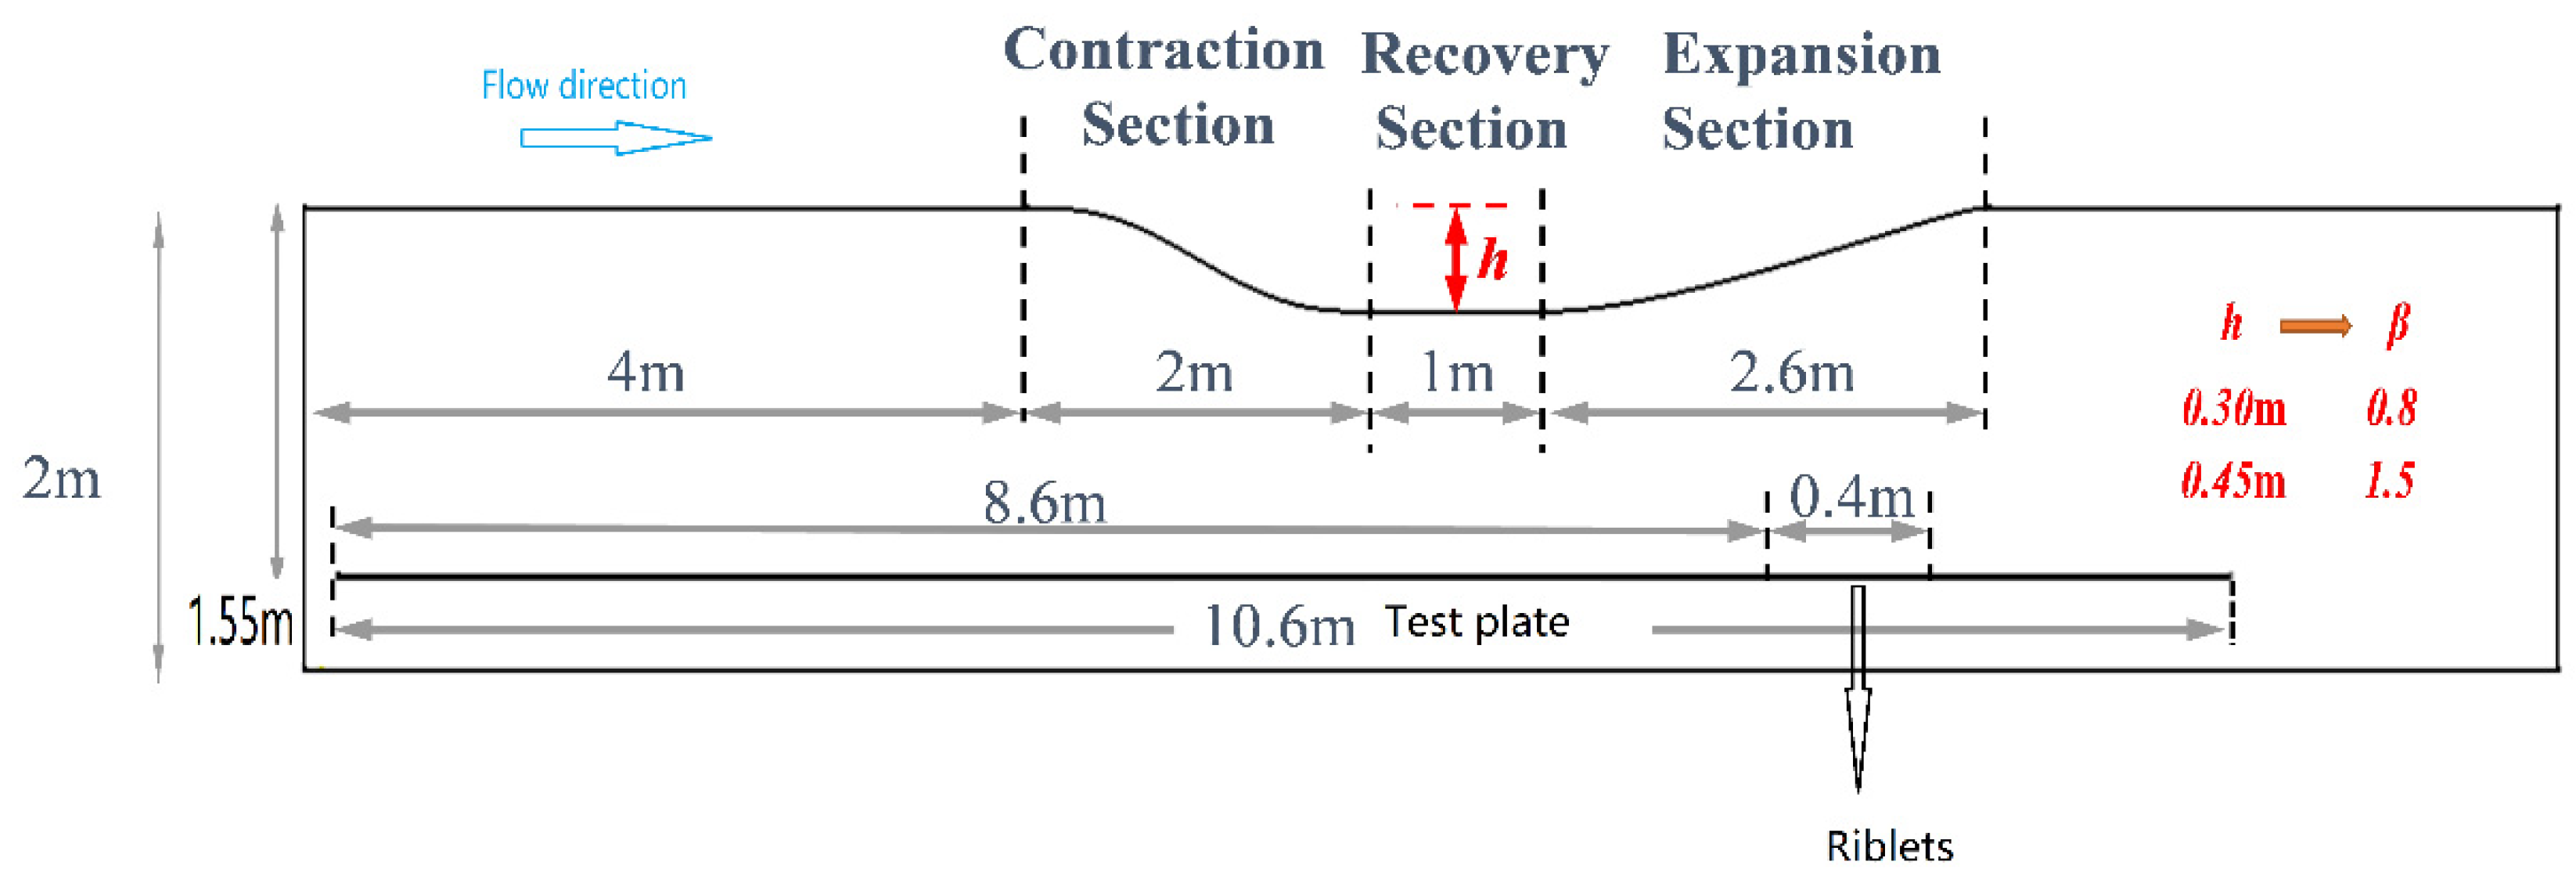
As shown in Figure 5, a bump is installed on the upper surface of the wind tunnel test section. According to its profile, it can be divided into a contraction section, a recovery section, and an expansion section. The purpose of the recovery section is to allow the boundary layer to reestablish equilibrium and achieve a smooth transition [25]; The contraction and expansion sections generate favorable and adverse pressure gradients, respectively. Thus, riblets can be installed beneath the expansion section [13]. Adjusting the height h of the bump recovery section enables the realization of different adverse pressure gradient magnitudes. The design of the contraction section draws reference from the air intake configuration of low-to-medium speed wind tunnels, employing a fifth-order spline curve. The profile of the expansion section requires careful adjustment to ensure that, within the range of incoming flow velocities required for the experiments, the adverse pressure gradient distribution across the entire test region remains stable and invariant with streamwise position. This study utilized Fluent 2021 R1 to obtain the adverse pressure gradients generated by bumps with different heights. A velocity inlet and a pressure outlet are set at the inlet and outlet, respectively, and the k-w SST turbulence model is adopted. A two-dimensional structured grid is used for the computational mesh, with a grid quantity of 820,000. Grid refinement is performed in the boundary layers of the test section walls and the flat plate surface. Numerical results show that β = 0.8 for h = 0.3 m and β = 1.5 for h = 0.45 m. The final design results are presented in Figure 6, which shows the distribution of flow parameters and the dimensionless adverse pressure gradient within the test section located directly beneath the expansion segment. The design demonstrates a satisfactory outcome.
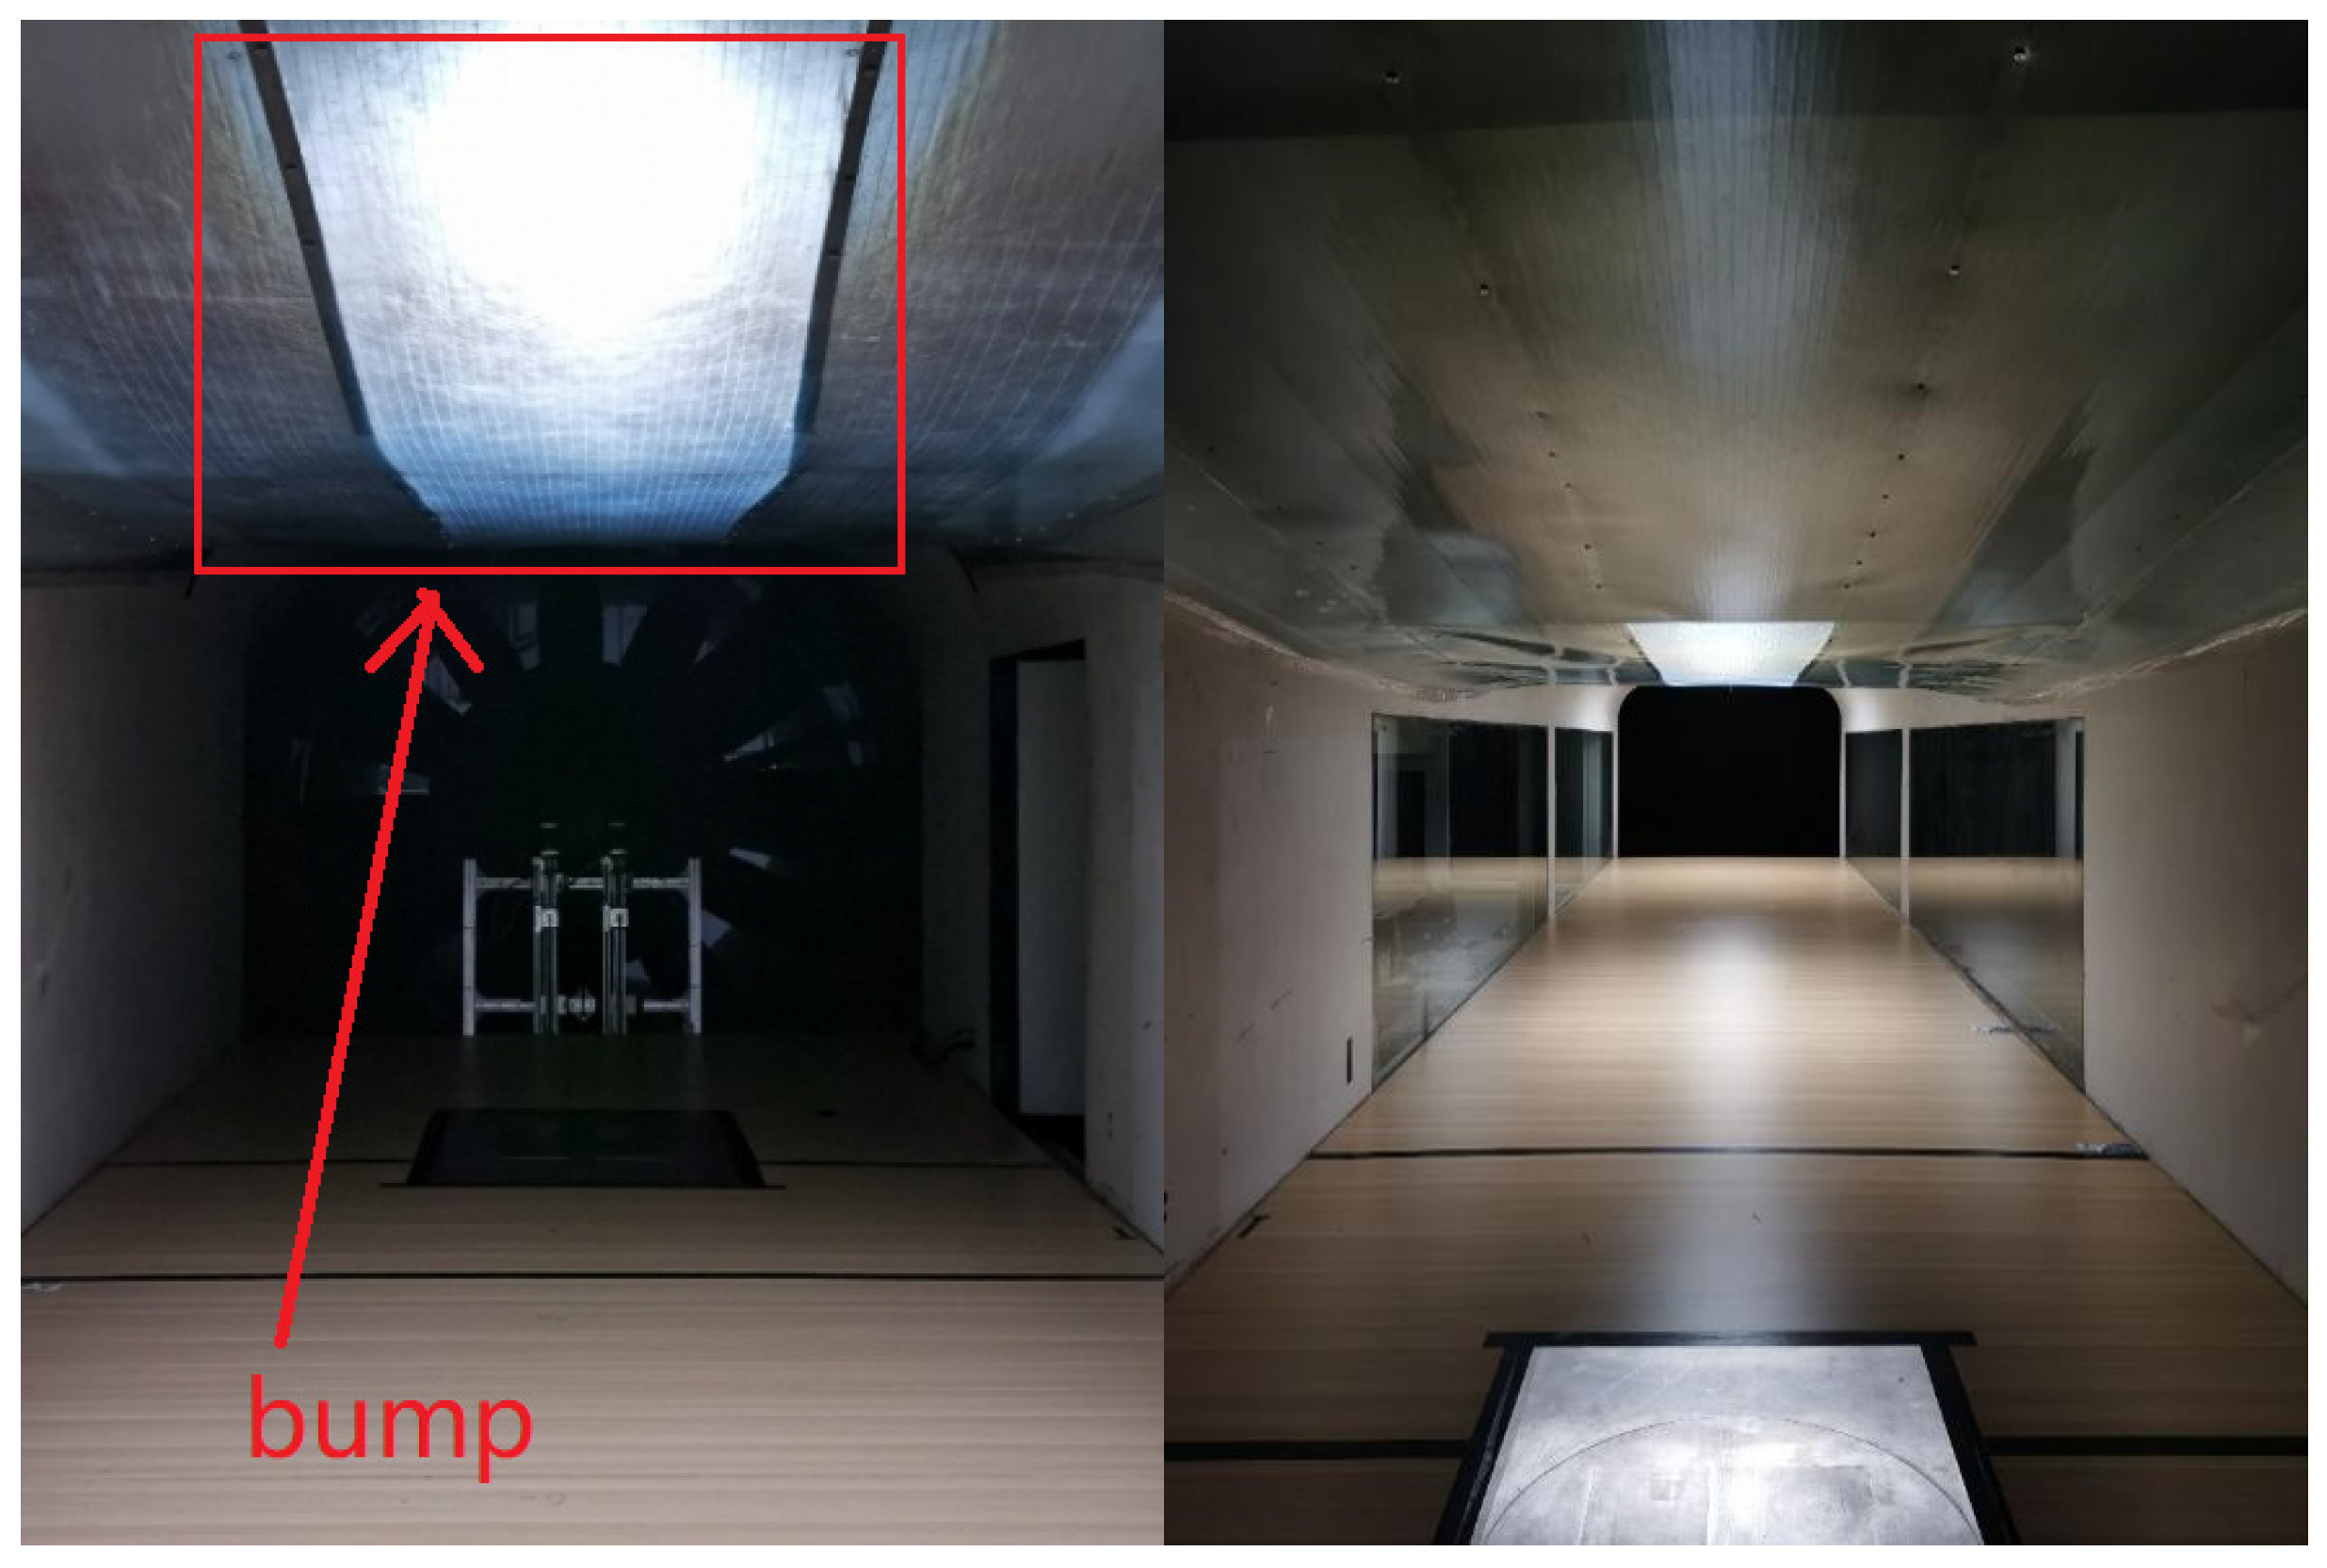
Based on the aforementioned range of adverse pressure gradients and the design dimensions of the contraction-expansion section, a bump with a skin-frame structure was constructed in the wind tunnel. The installation result is shown in Figure 7. Measurements of the turbulent boundary layer over the smooth flat plate were conducted across all freestream velocities to verify whether the constructed adverse pressure gradient environment met the design requirements. The results are summarized in Table 3. It can be observed that the experimentally implemented adverse pressure gradient environment agrees well with the design conditions. Under various freestream velocities, the adverse pressure gradient fluctuates near the target design values, with the fluctuation amplitude controlled within ±10%. Accordingly, measurements of the drag reduction rate of riblets can be conducted under this adverse pressure gradient environment.

2.3. Geometry of Riblets

The experiments employed both triangular and trapezoidal riblets, which were installed at Position 1 during testing. Numerous historical studies on triangular and trapezoidal riblets [6,7,26] provide a validated basis for comparing the zero-pressure-gradient results obtained in this work. Furthermore, considering that the rolling process used in practical manufacturing cannot effectively maintain sharp peaks at the crests of small riblets, the trapezoidal riblets in this study were truncated at the top to better approximate an industrially viable riblet shape. All riblets were fabricated using CNC machining. Figure 8 shows a schematic diagram of the two riblet types, and Table 4 summarizes their geometric parameters.

3. Drag Reduction Rate of Riblets

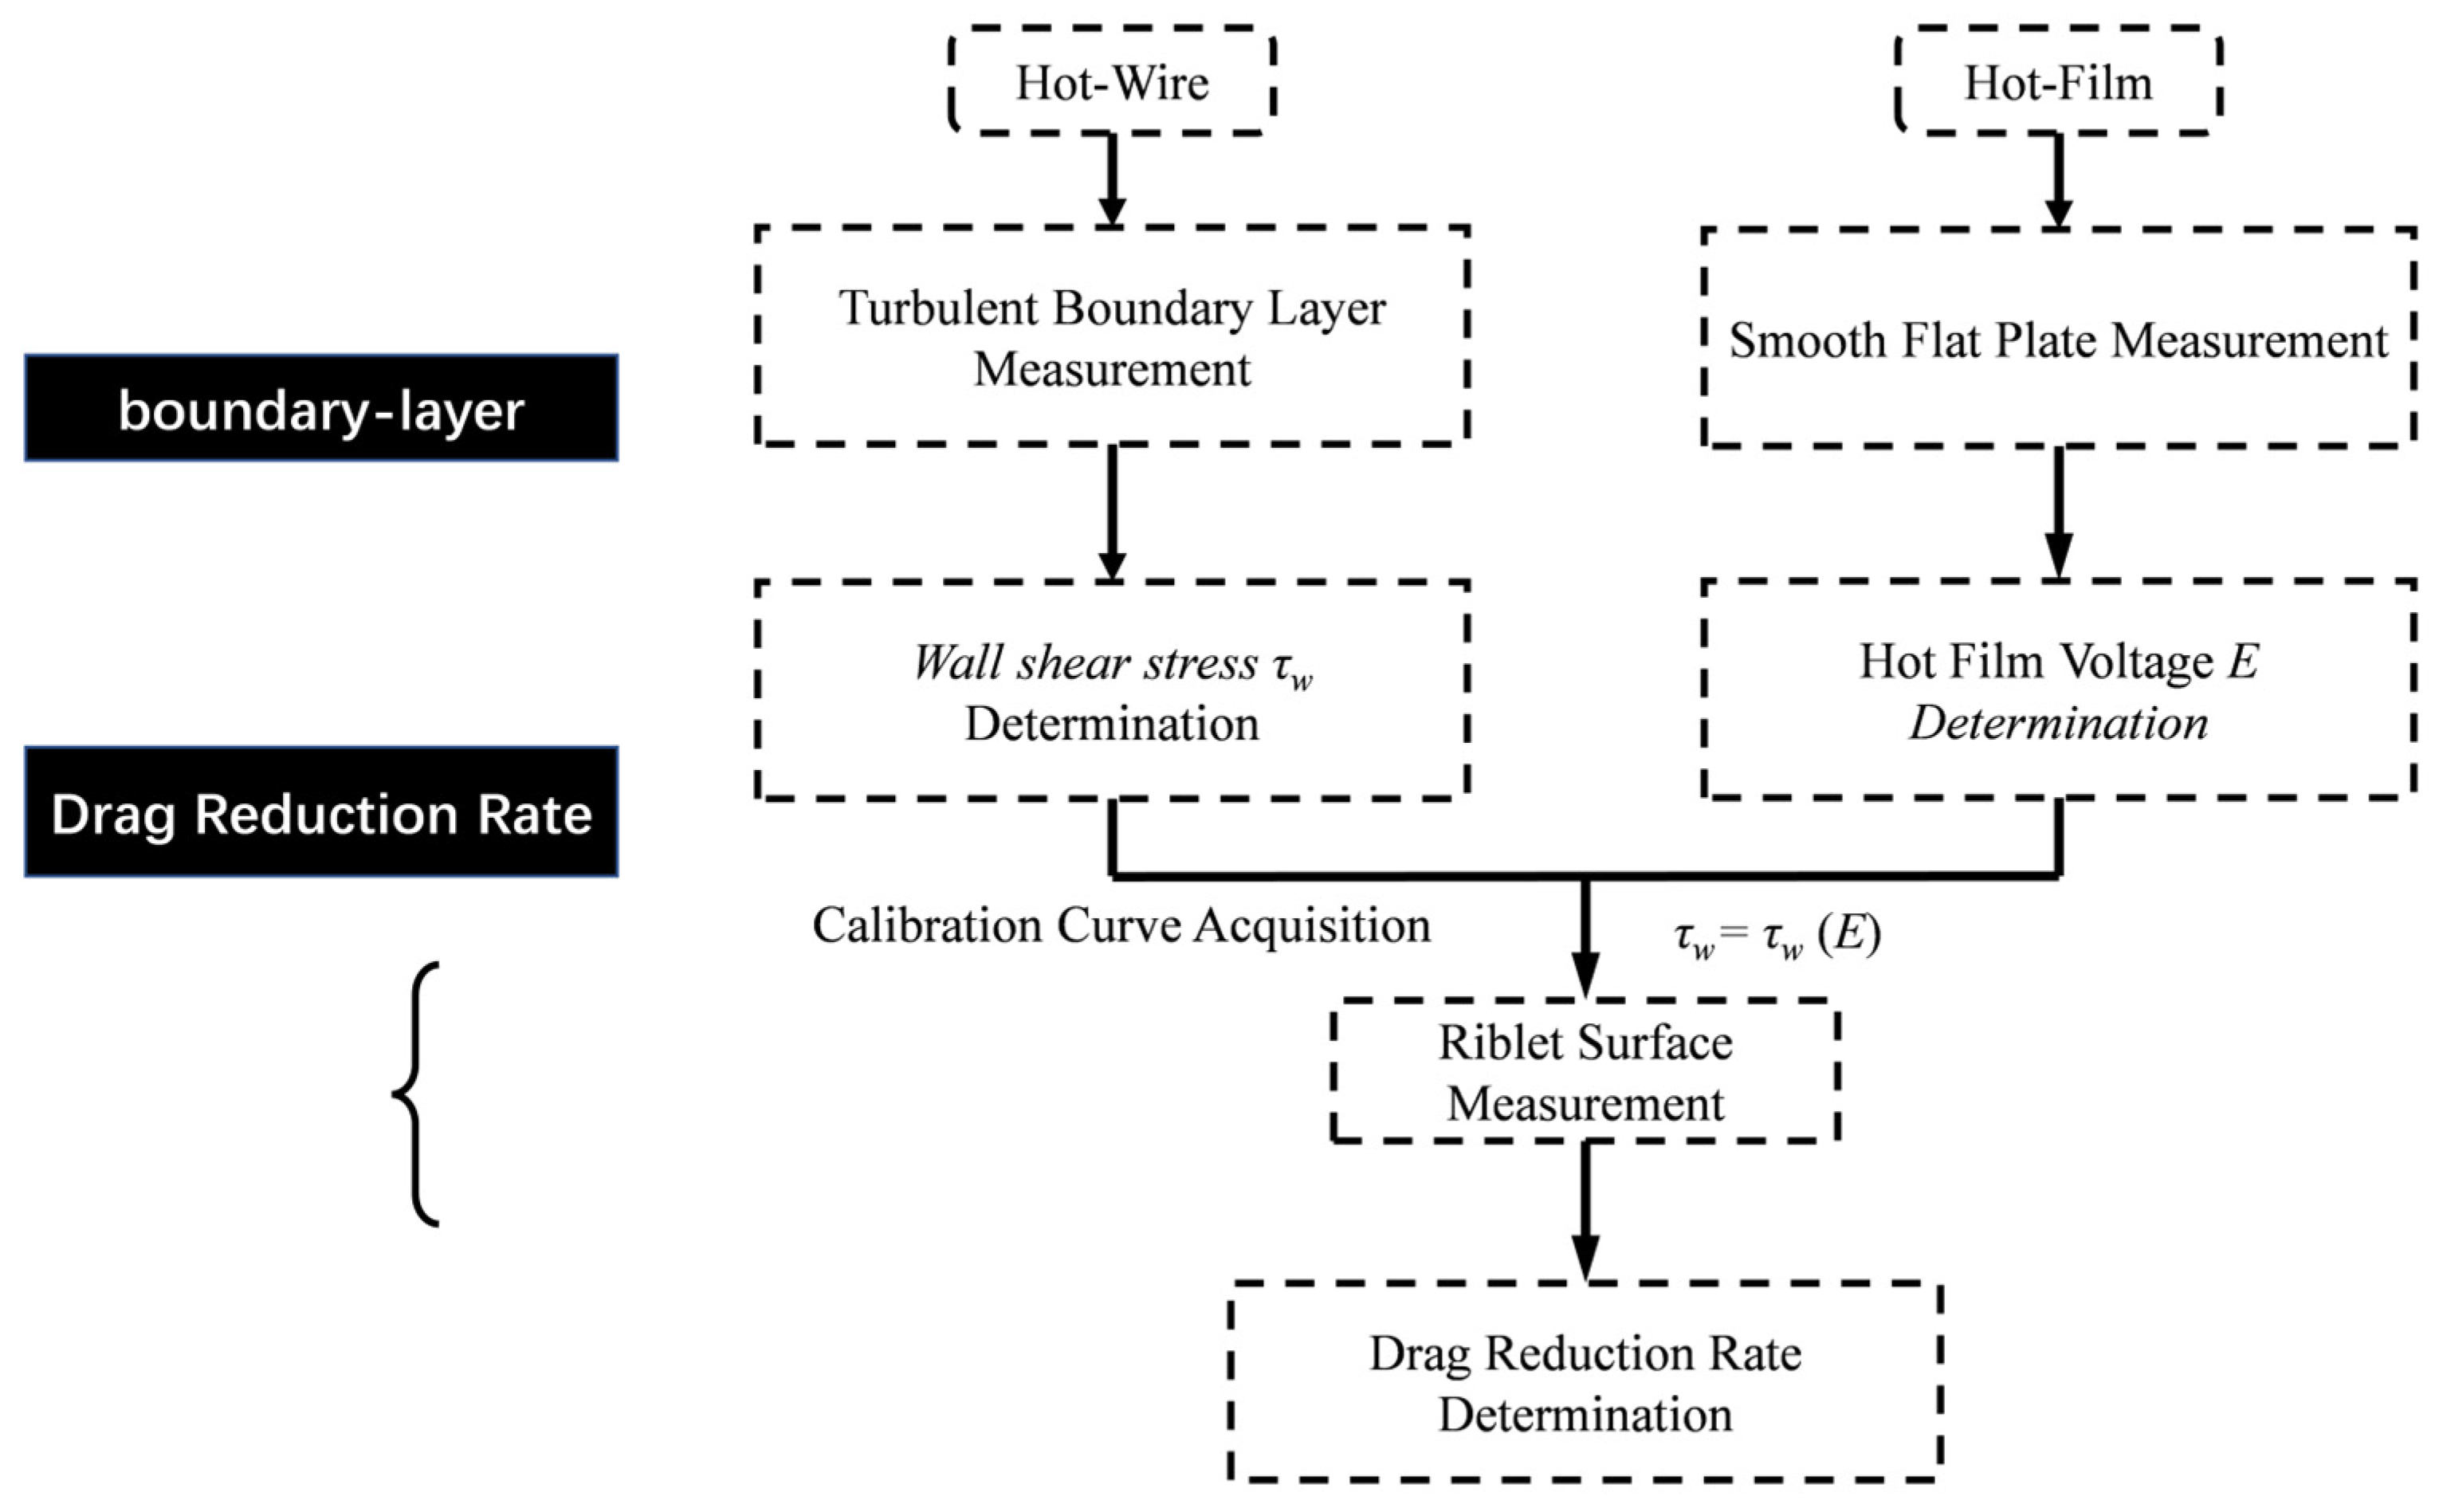
Under both zero pressure gradient and the aforementioned adverse pressure gradient conditions, drag reduction rates of riblet surfaces relative to smooth walls were measured using hot-film probes (also referred to as wall shear stress sensors). Conventional practice employs in situ calibration for this type of wall shear stress probe. Therefore, under smooth-wall conditions, the local wall shear stress τ w ( U ) was first measured using hot-wire anemometry at various freestream velocities, while simultaneously recording the hot-film voltage E ( U ) . This procedure established the calibration curve τ w = τ w ( E ) for the hot-film probe. Subsequently, the smooth wall was replaced with a riblet surface to measure the drag reduction rate under varying freestream velocities (thus varying dimensionless riblet spacing s + ), yaw angles, and pressure gradient conditions. The measurement procedure is illustrated in Figure 9:
The drag reduction rate is defined by Equation (1), where τ w represents the wall shear stress of the smooth surface and τ w represents the wall shear stress of the riblet surface. As described in Figure 1, two measurement positions were designed in this experiment, enabling the following measurement protocol: during preliminary measurements, both positions are equipped with smooth flat plates. Subsequently, the smooth plate at Position 1 is replaced with a riblet-mounted plate, while Position 2 remains equipped with the smooth plate. This configuration offers the advantage of monitoring temporal variations in wall shear stress through repetitive measurements at Position 2. Given that the drag reduction rate of riblet surfaces typically ranges from 5% to 10%, this arrangement effectively eliminates the influence of freestream velocity fluctuations in the wind tunnel, thereby enhancing both the accuracy and efficiency of drag reduction rate measurements.
DRR = τ w τ w τ w × 100 %
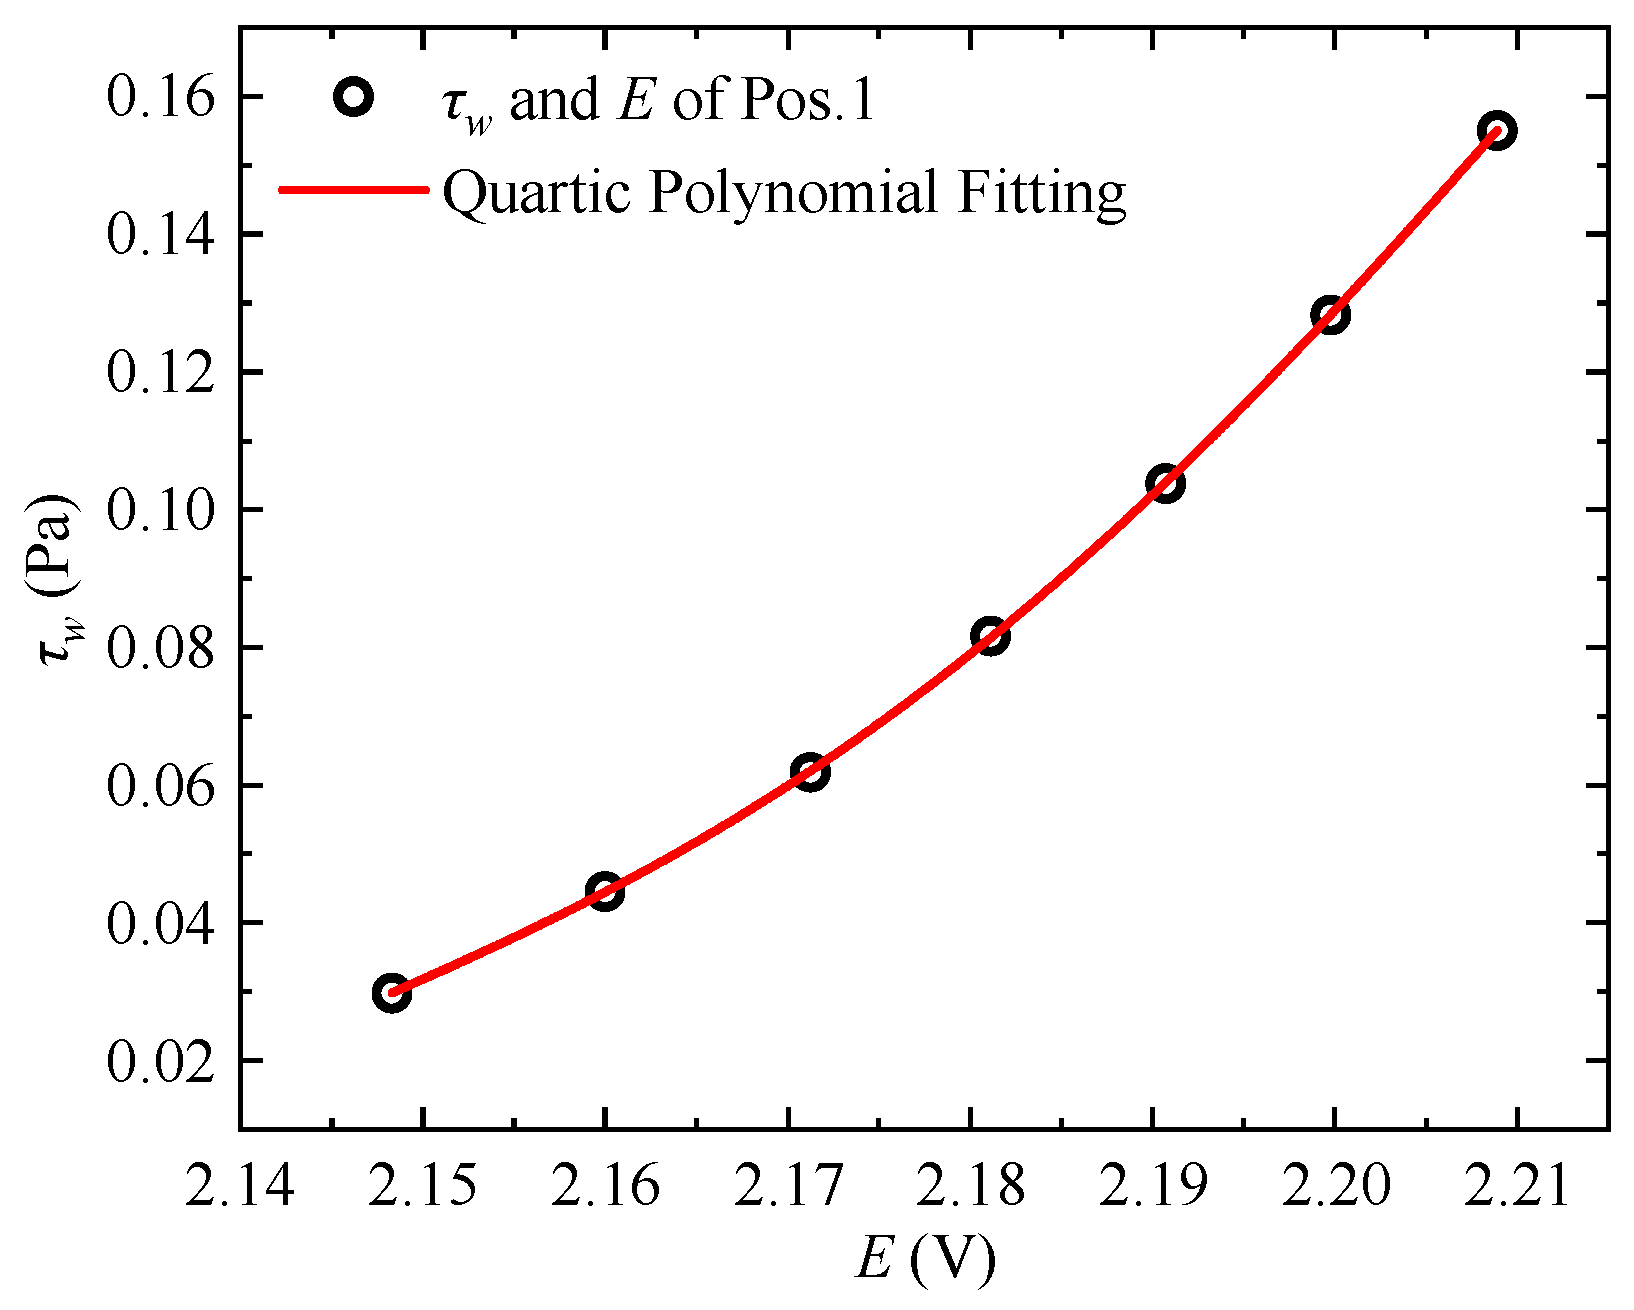
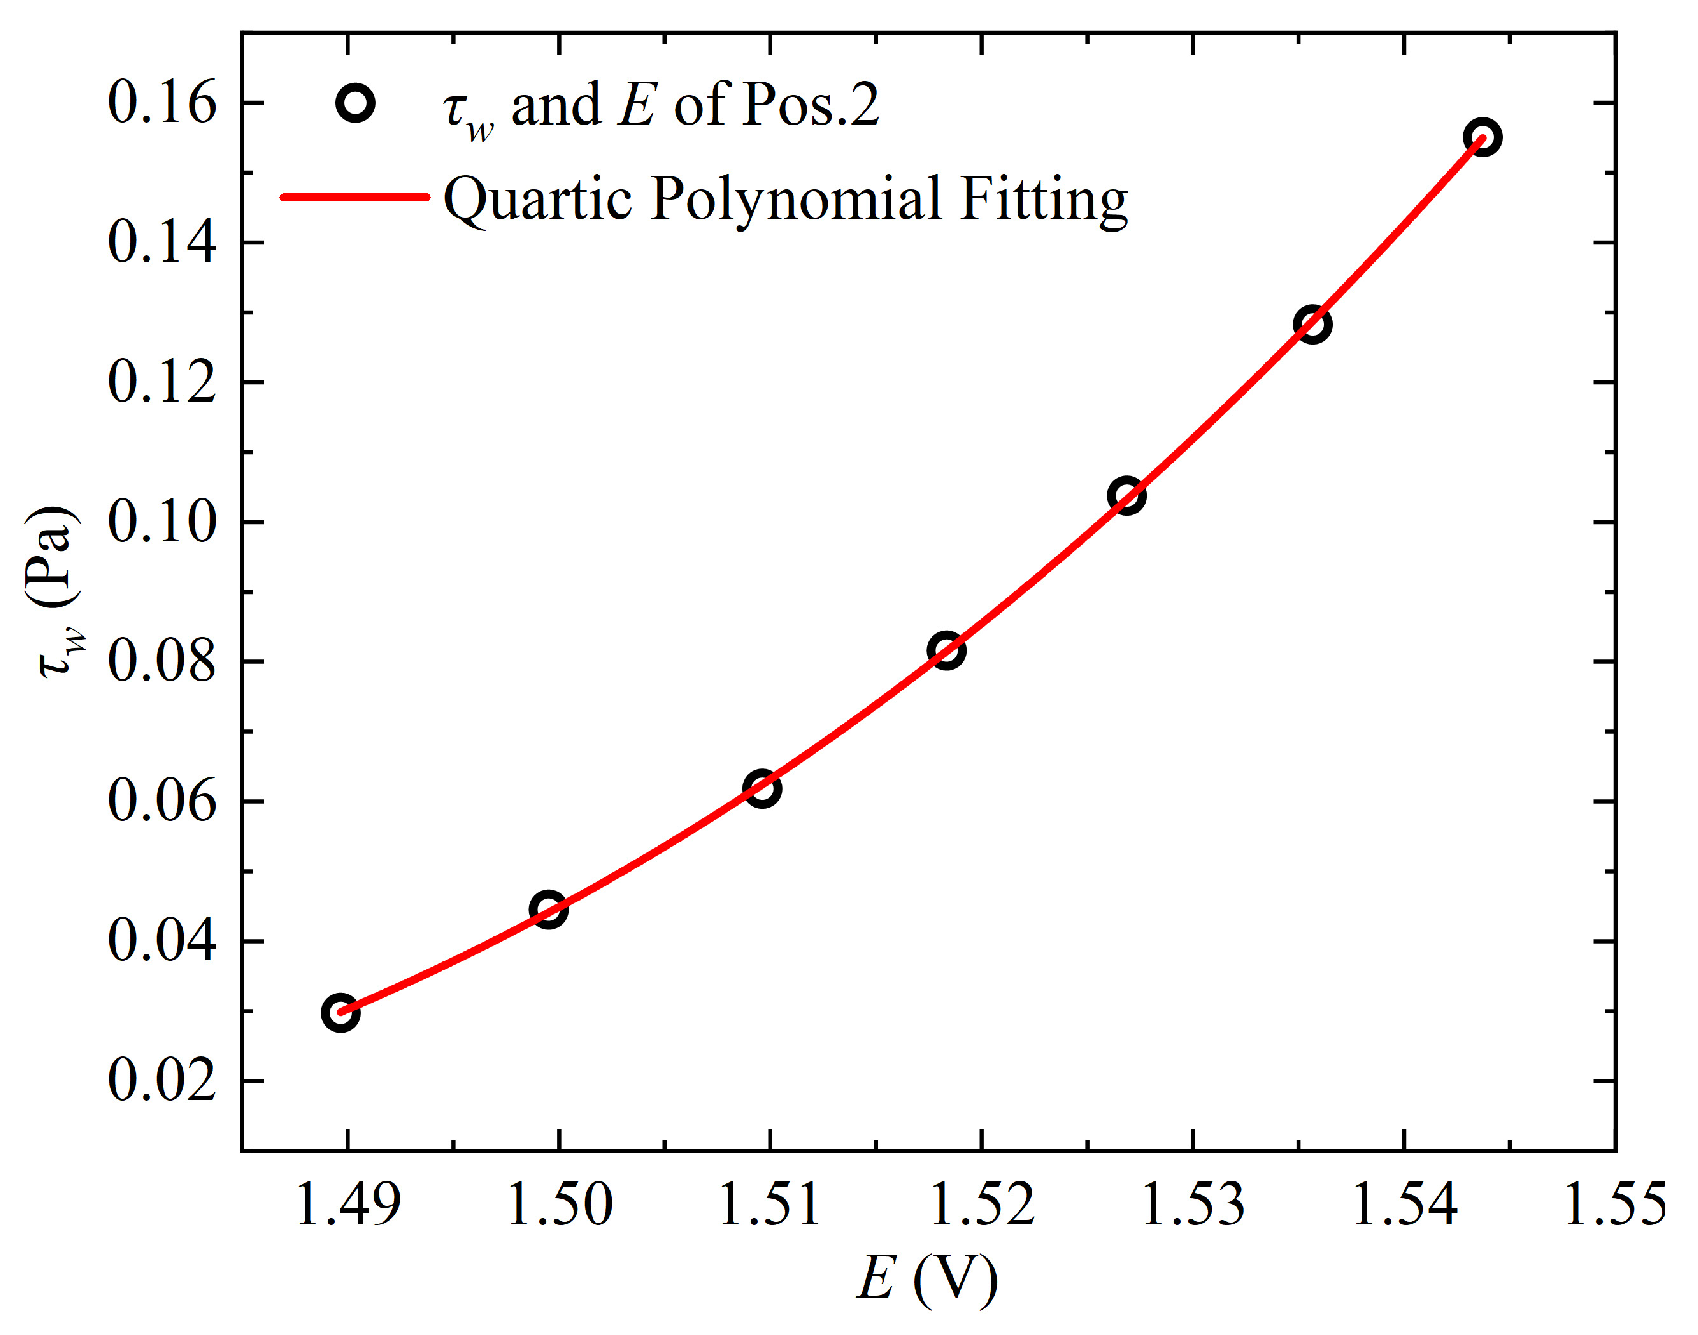
Simultaneous measurements of the viscous sublayer velocity profiles at Measurement Position 1 (Pos. 1) and Position 2 (Pos. 2) were conducted using hot-wire probes under various freestream velocities. The wall shear stress was determined through linear fitting of the velocity gradient in the viscous sublayer. Concurrently, the voltage outputs from the hot-film probes at both positions were recorded, and fourth-order polynomial fitting was applied to establish the calibration curves, as shown in Figure 10 and Figure 11. The corresponding fitting functions are given by Equation (2) and Equation (3), respectively. It should be noted that prior to each measurement of the drag reduction rate on the riblet surface, in situ calibration of the hot-film probes must be performed under smooth-wall conditions to obtain updated calibration curves.
τ w ( E ) = 61 , 499.9 + 112 , 938.4 E 77 , 757.3 E 2 + 23 , 787.7 E 3 2728.2 E 4
τ w ( E ) = 3772.0 + 9954.6 E 9835.1 E 2 + 4310.6 E 3 707.0 E 4
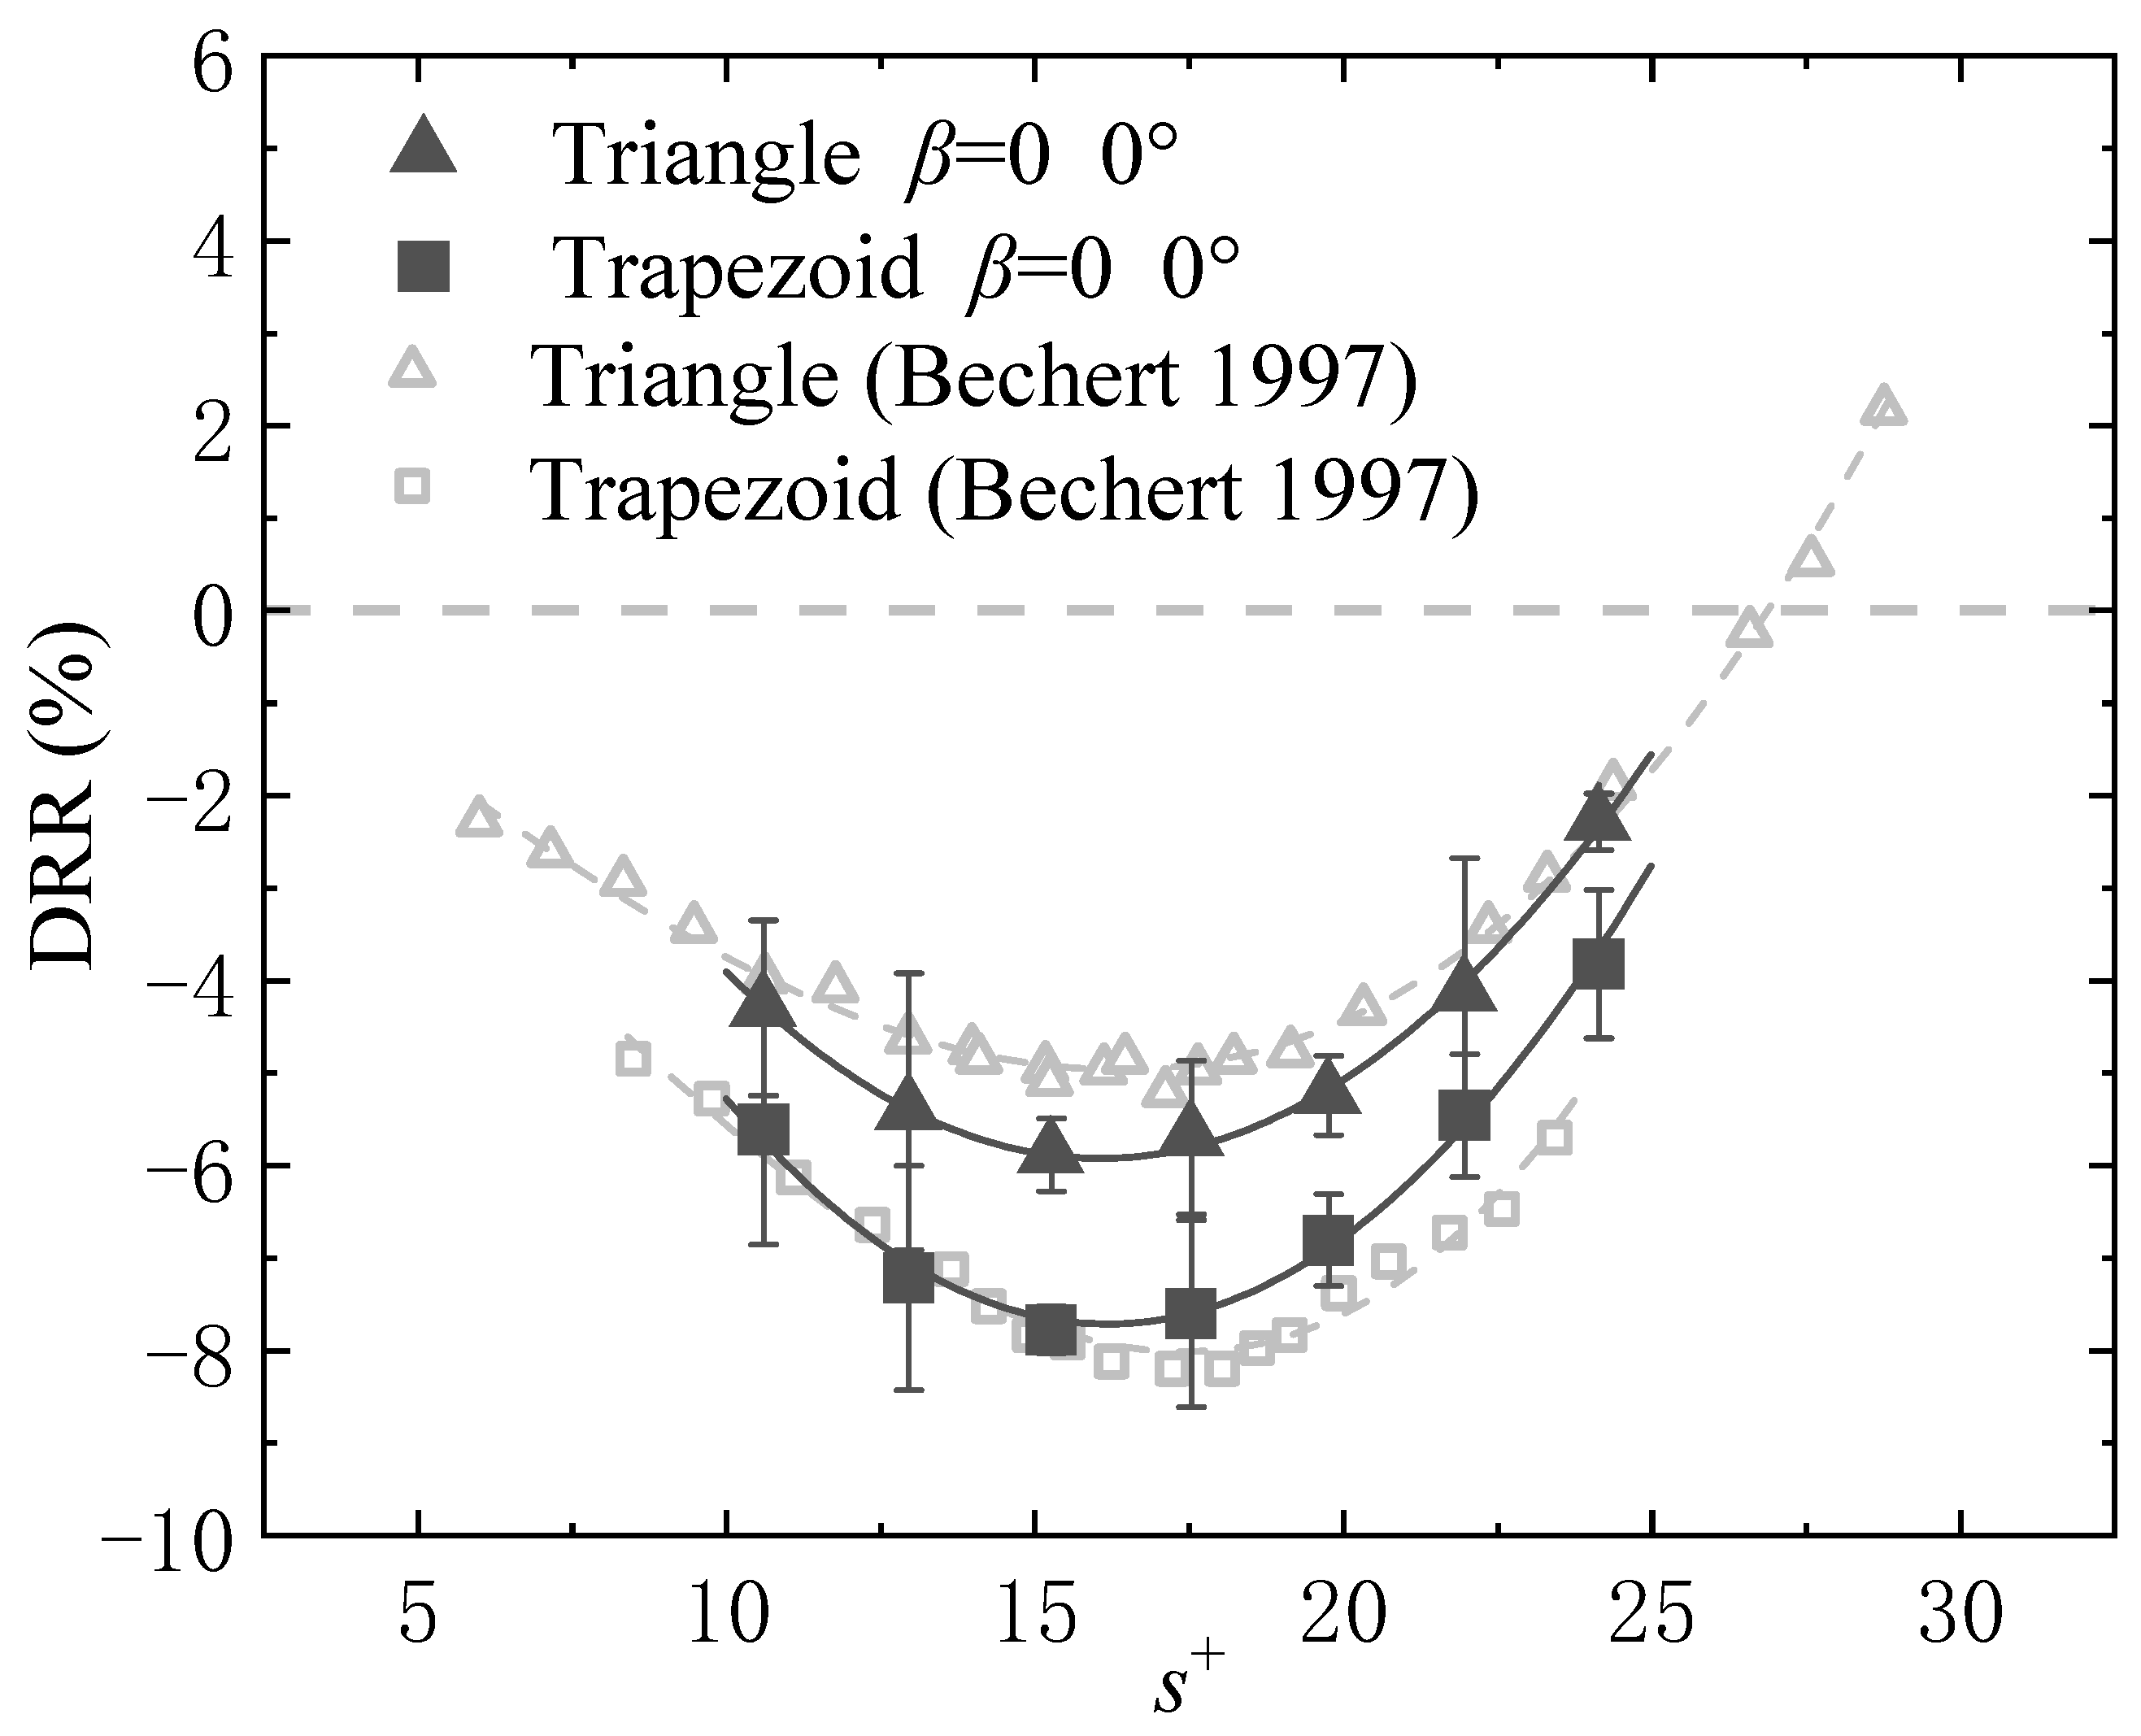
Following in situ calibration of the hot-film probes, the smooth surface was replaced with a riblet surface to determine the drag reduction rate. For each measurement point, the procedure was repeated three times to eliminate random errors, thereby establishing the corresponding error bands. Under zero pressure gradient conditions, the present experimental data were compared with measurements by Bechert et al. [27], whose study achieved a maximum friction Reynolds number of Re τ < 665 . The results are presented in Figure 12. It can be observed that under zero pressure gradient conditions and without yaw angle (i.e., absence of crossflow effects), the experimental results from this study show close agreement with those reported by Bechert et al. [27] for both triangular and trapezoidal riblets. Furthermore, the trapezoidal riblets exhibit a higher drag reduction rate compared to the triangular riblets. As discussed by Bechert et al., trapezoidal riblets are more suitable for application on aircraft surfaces. The triangular riblets in this study exhibit a higher drag reduction rate than those reported in Ref. [27], while the trapezoidal riblets show a comparatively lower drag reduction efficiency. Moreover, the peak drag reduction for trapezoidal riblets occurs at a lower dimensionless spacing s + compared to the reference study. Furthermore, although the maximum friction Reynolds number Re τ in this study reaches 6000—an order of magnitude higher than that in the experiments by Bechert et al. [27]—the drag reduction rate remains largely unchanged. This leads to the following conclusion: Within the range of Reynolds numbers investigated in this study ( Re τ < 6000 ), the increase in Reynolds number does not qualitatively alter the drag reduction performance of the riblets.
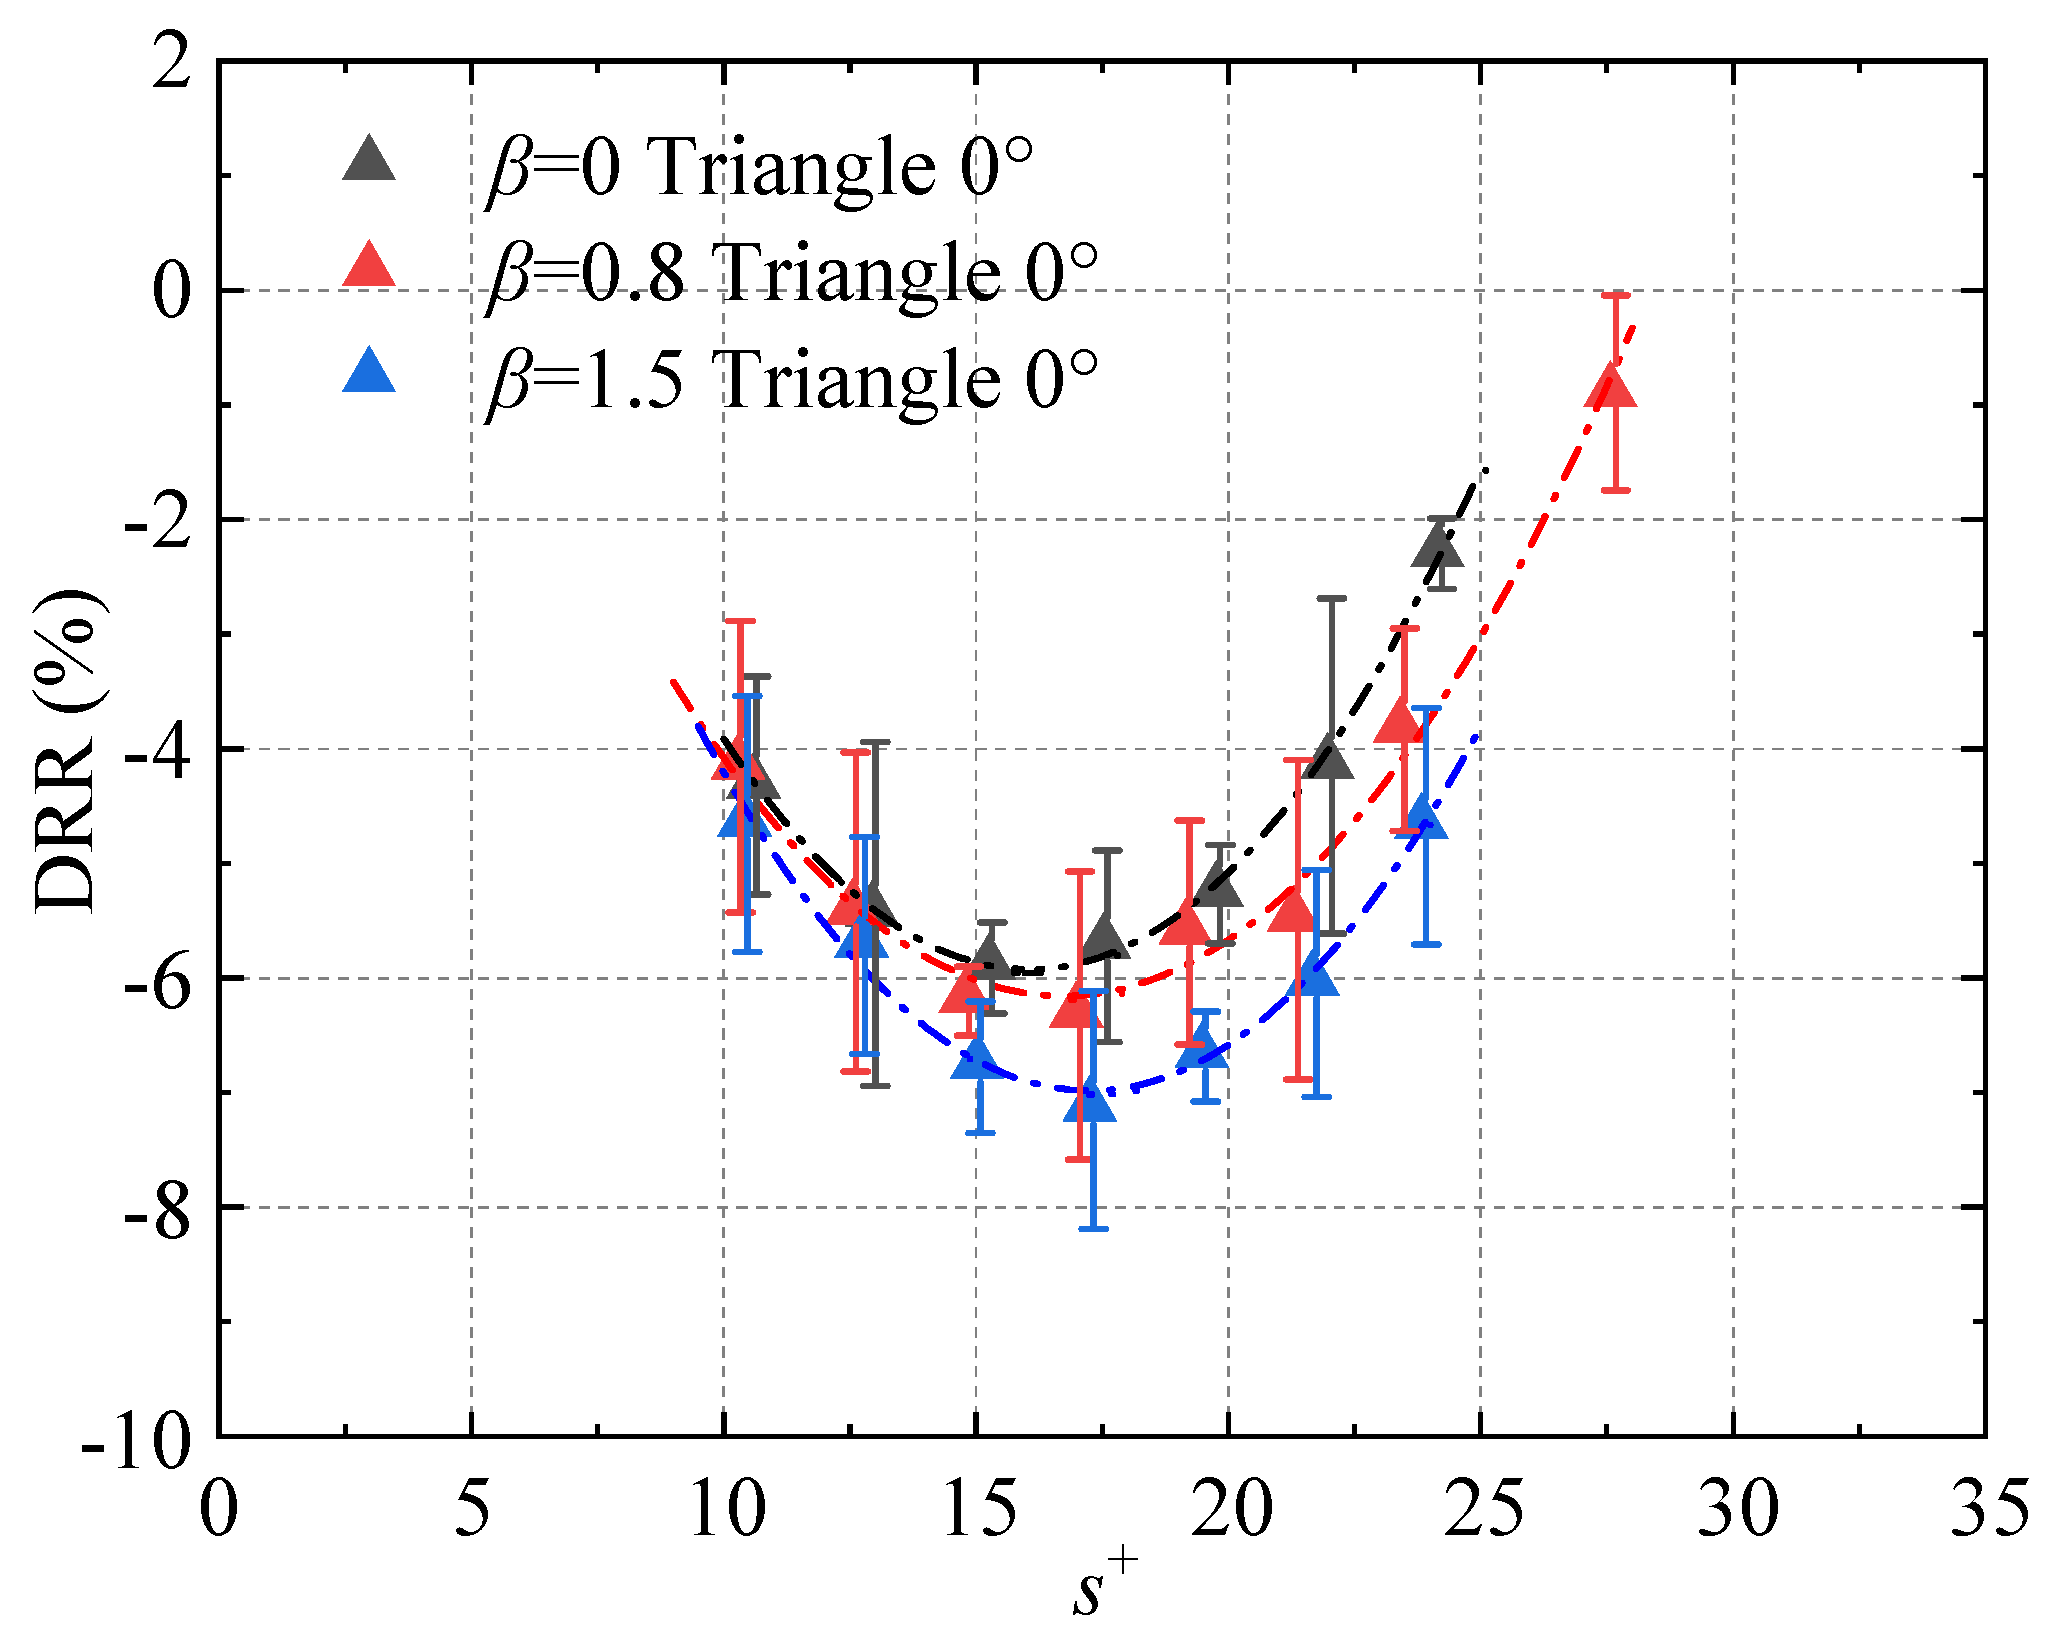
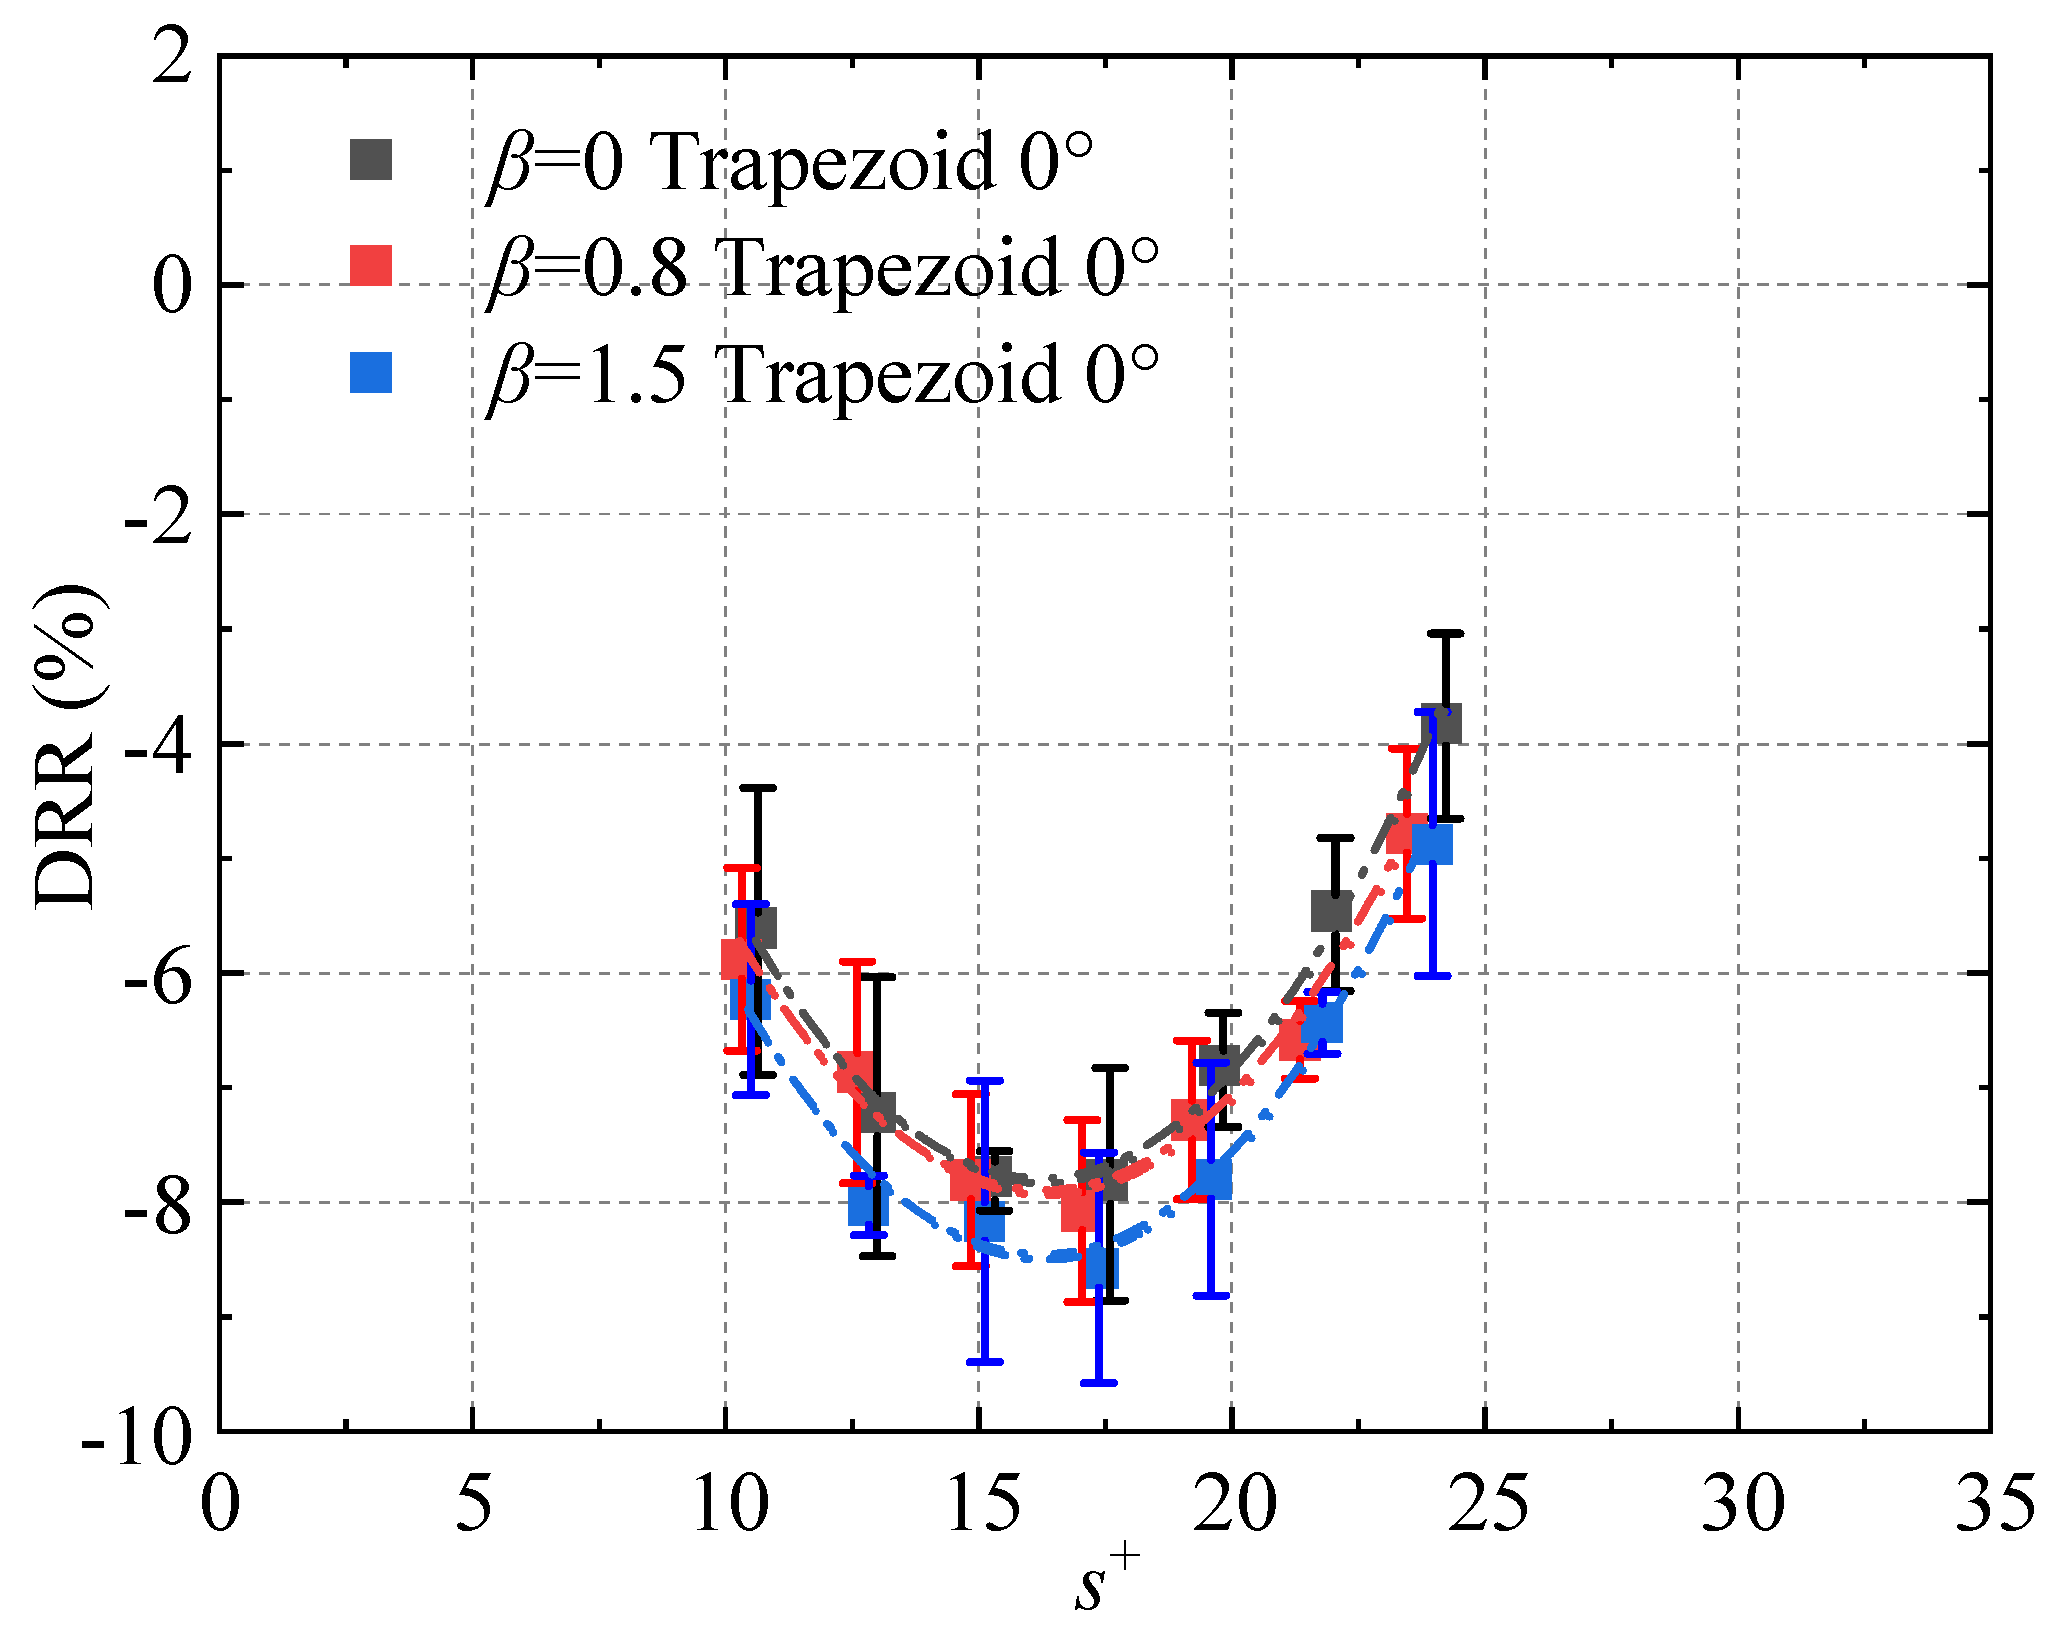
The following section examines the effects of adverse pressure gradients on the drag reduction performance of riblets. The drag reduction rates for both triangular and trapezoidal riblets under β = 0, 0.8, and 1.5 conditions are presented in Figure 13 and Figure 14, respectively. It is evident that the adverse pressure gradient exerts a positive effect on the drag reduction performance of riblets. The drag reduction rate increases with the intensity of the adverse pressure gradient, which is consistent with the findings reported by Debisschop and Nieuwstadt [13]. Accordingly, the drag reduction rates obtained in this study are compared with the results from the aforementioned literature, as shown in Figure 15. Debisschop and Nieuwstadt similarly constructed an adverse pressure gradient environment using a contraction–expansion section configuration. They employed an oil-floating force balance to measure the overall wall shear stress of a flat plate equipped with triangular riblets and subsequently determined the drag reduction rate by comparing these results with measurements obtained from a smooth flat plate under identical conditions. The experimental results from this study exhibit remarkable agreement with those reported by Debisschop and Nieuwstadt, providing strong mutual validation. This consistency reinforces the conclusion that a moderate adverse pressure gradient can enhance the drag reduction performance of riblets, provided it does not induce flow separation.
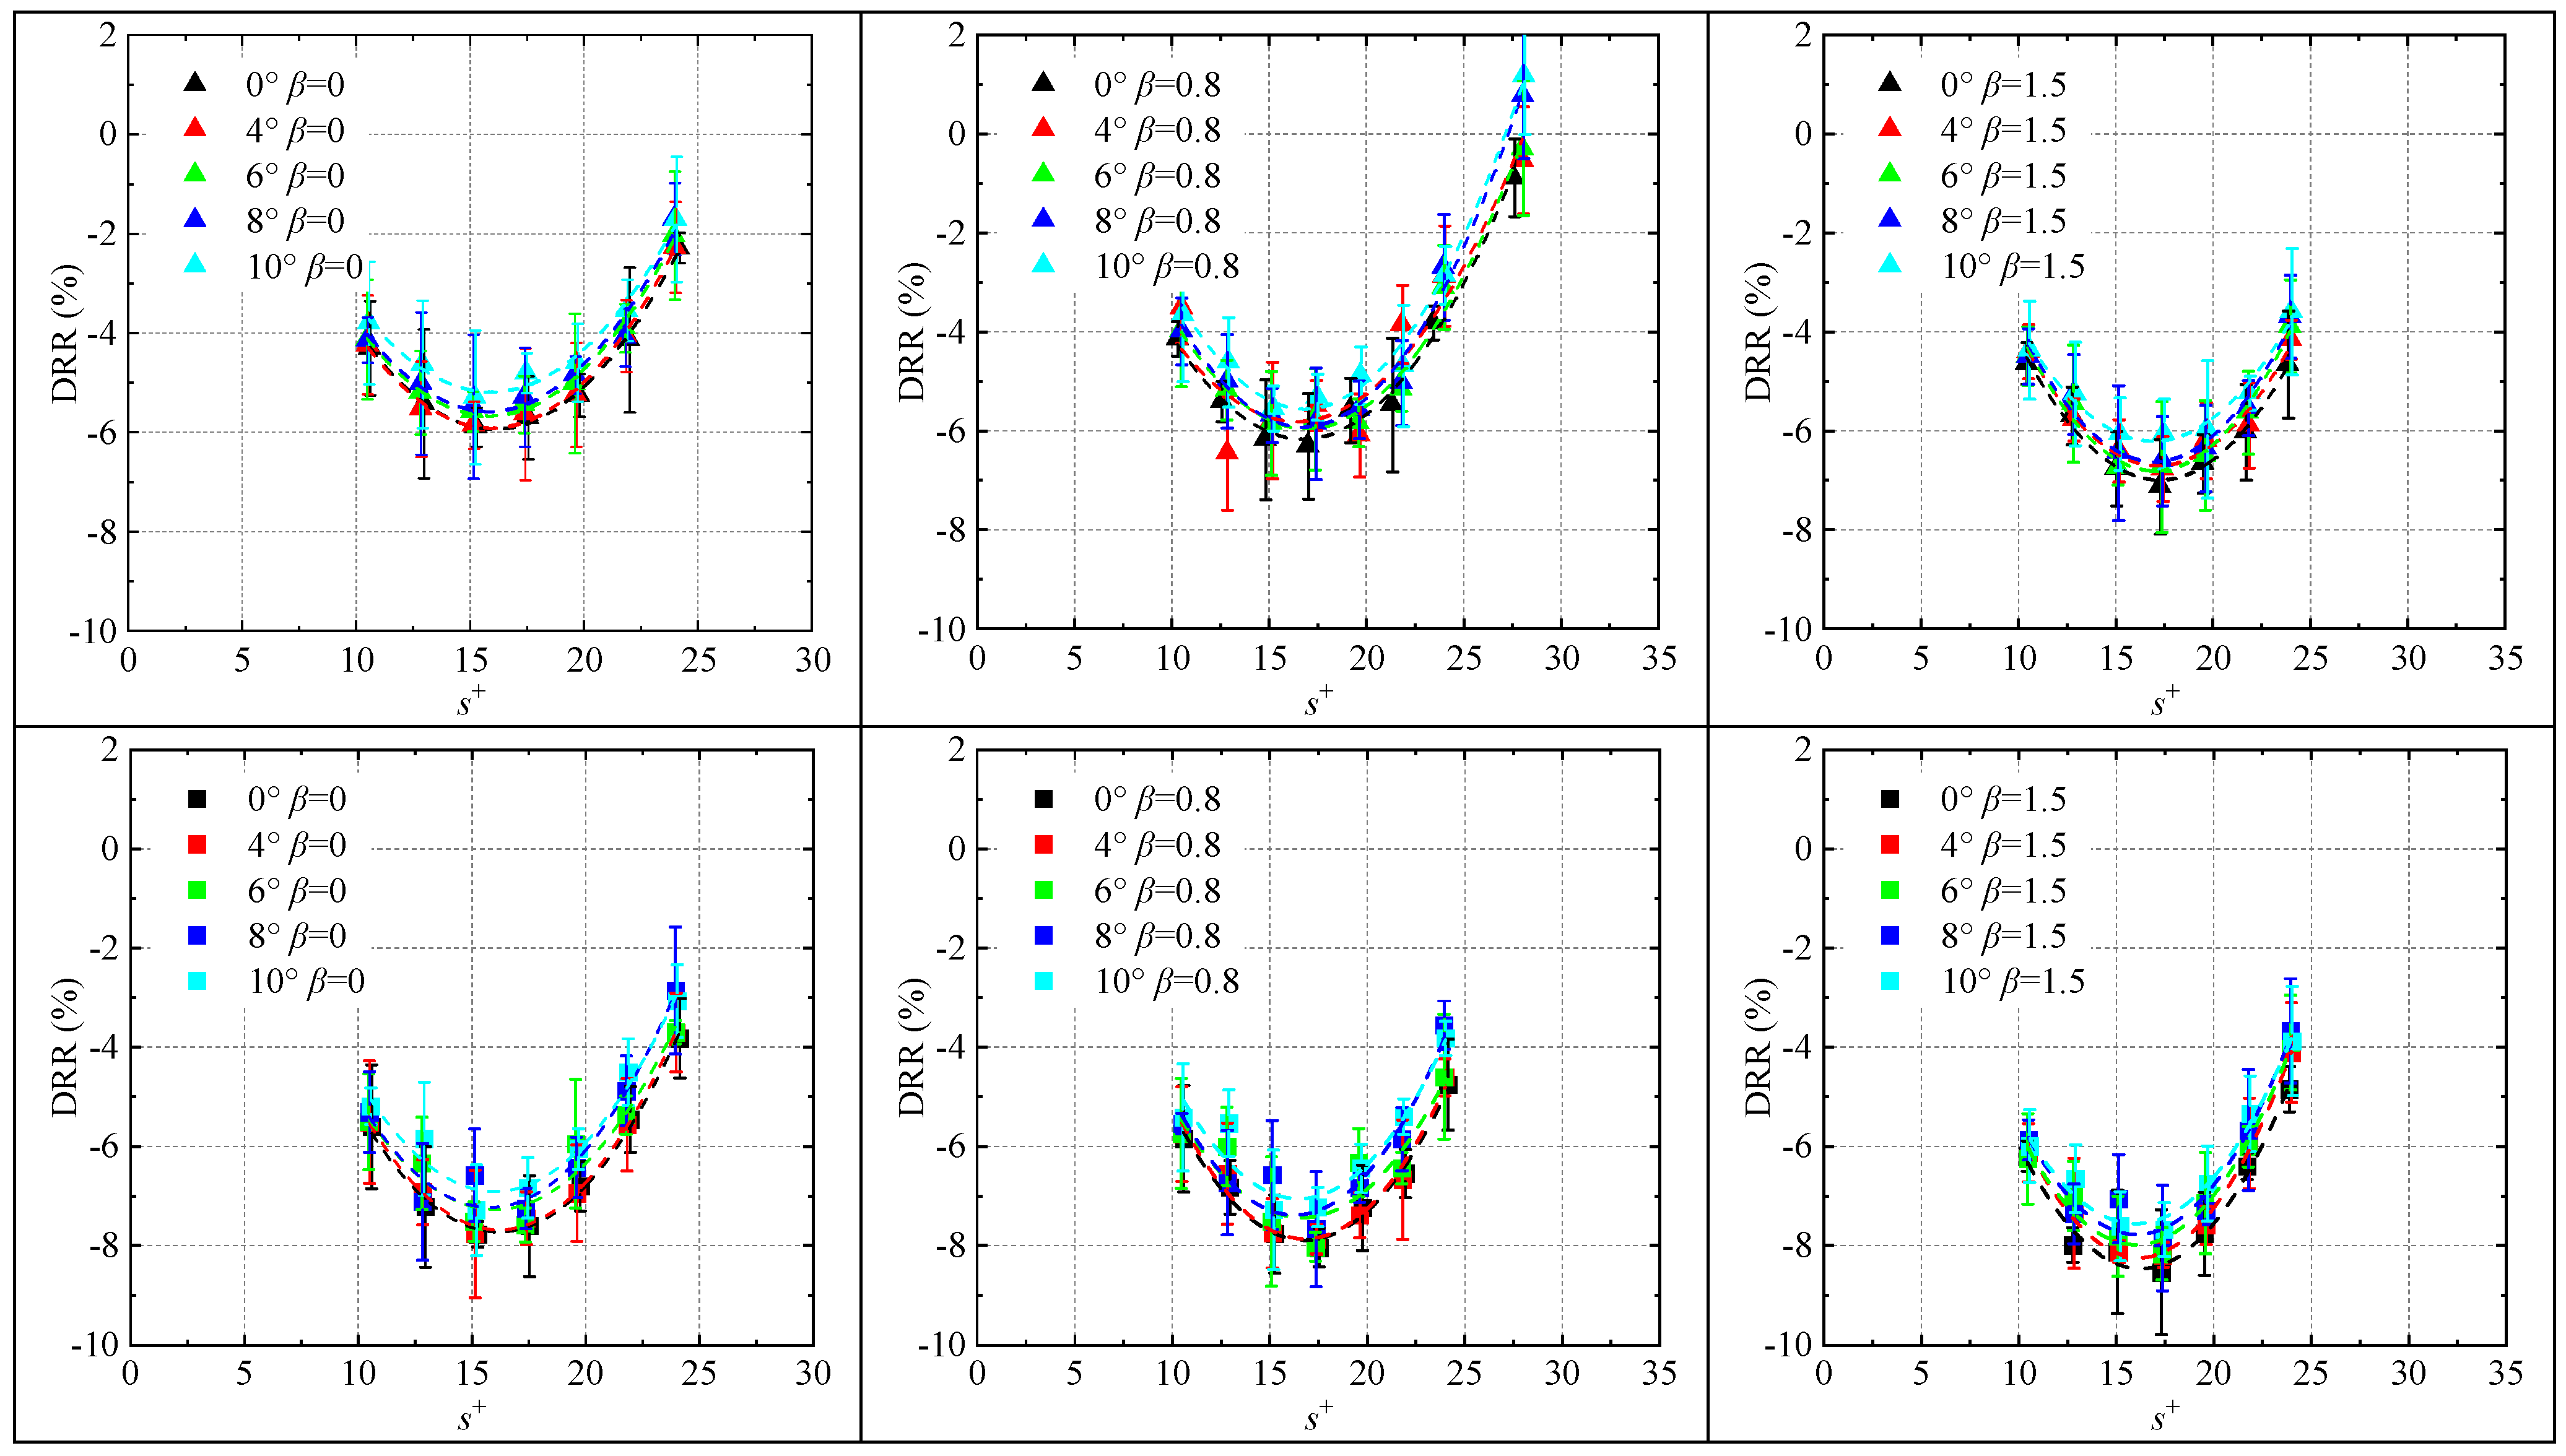
Further investigation was conducted on the effect of yaw angle (crossflow effects) on the drag reduction rate of riblets. In this experiment, crossflow conditions were generated by rotating the riblet surfaces to specific yaw angles, i.e., φ = 0 ° ,   4 ° ,   6 ° ,   8 ° ,   10 ° . The measured drag reduction rates are presented in Figure 16. It is evident that under all adverse pressure gradient conditions, the drag reduction rate progressively decreases with increasing yaw angle (crossflow effects), indicating that crossflow suppresses the drag-reducing effectiveness of riblets. This finding necessitates that the design of riblet surfaces on aircraft must account for the local flow direction of the surrounding flow field. Riblets should be aligned with the actual local streamlines to optimize drag reduction performance.

4. Basic Statistics of TBL

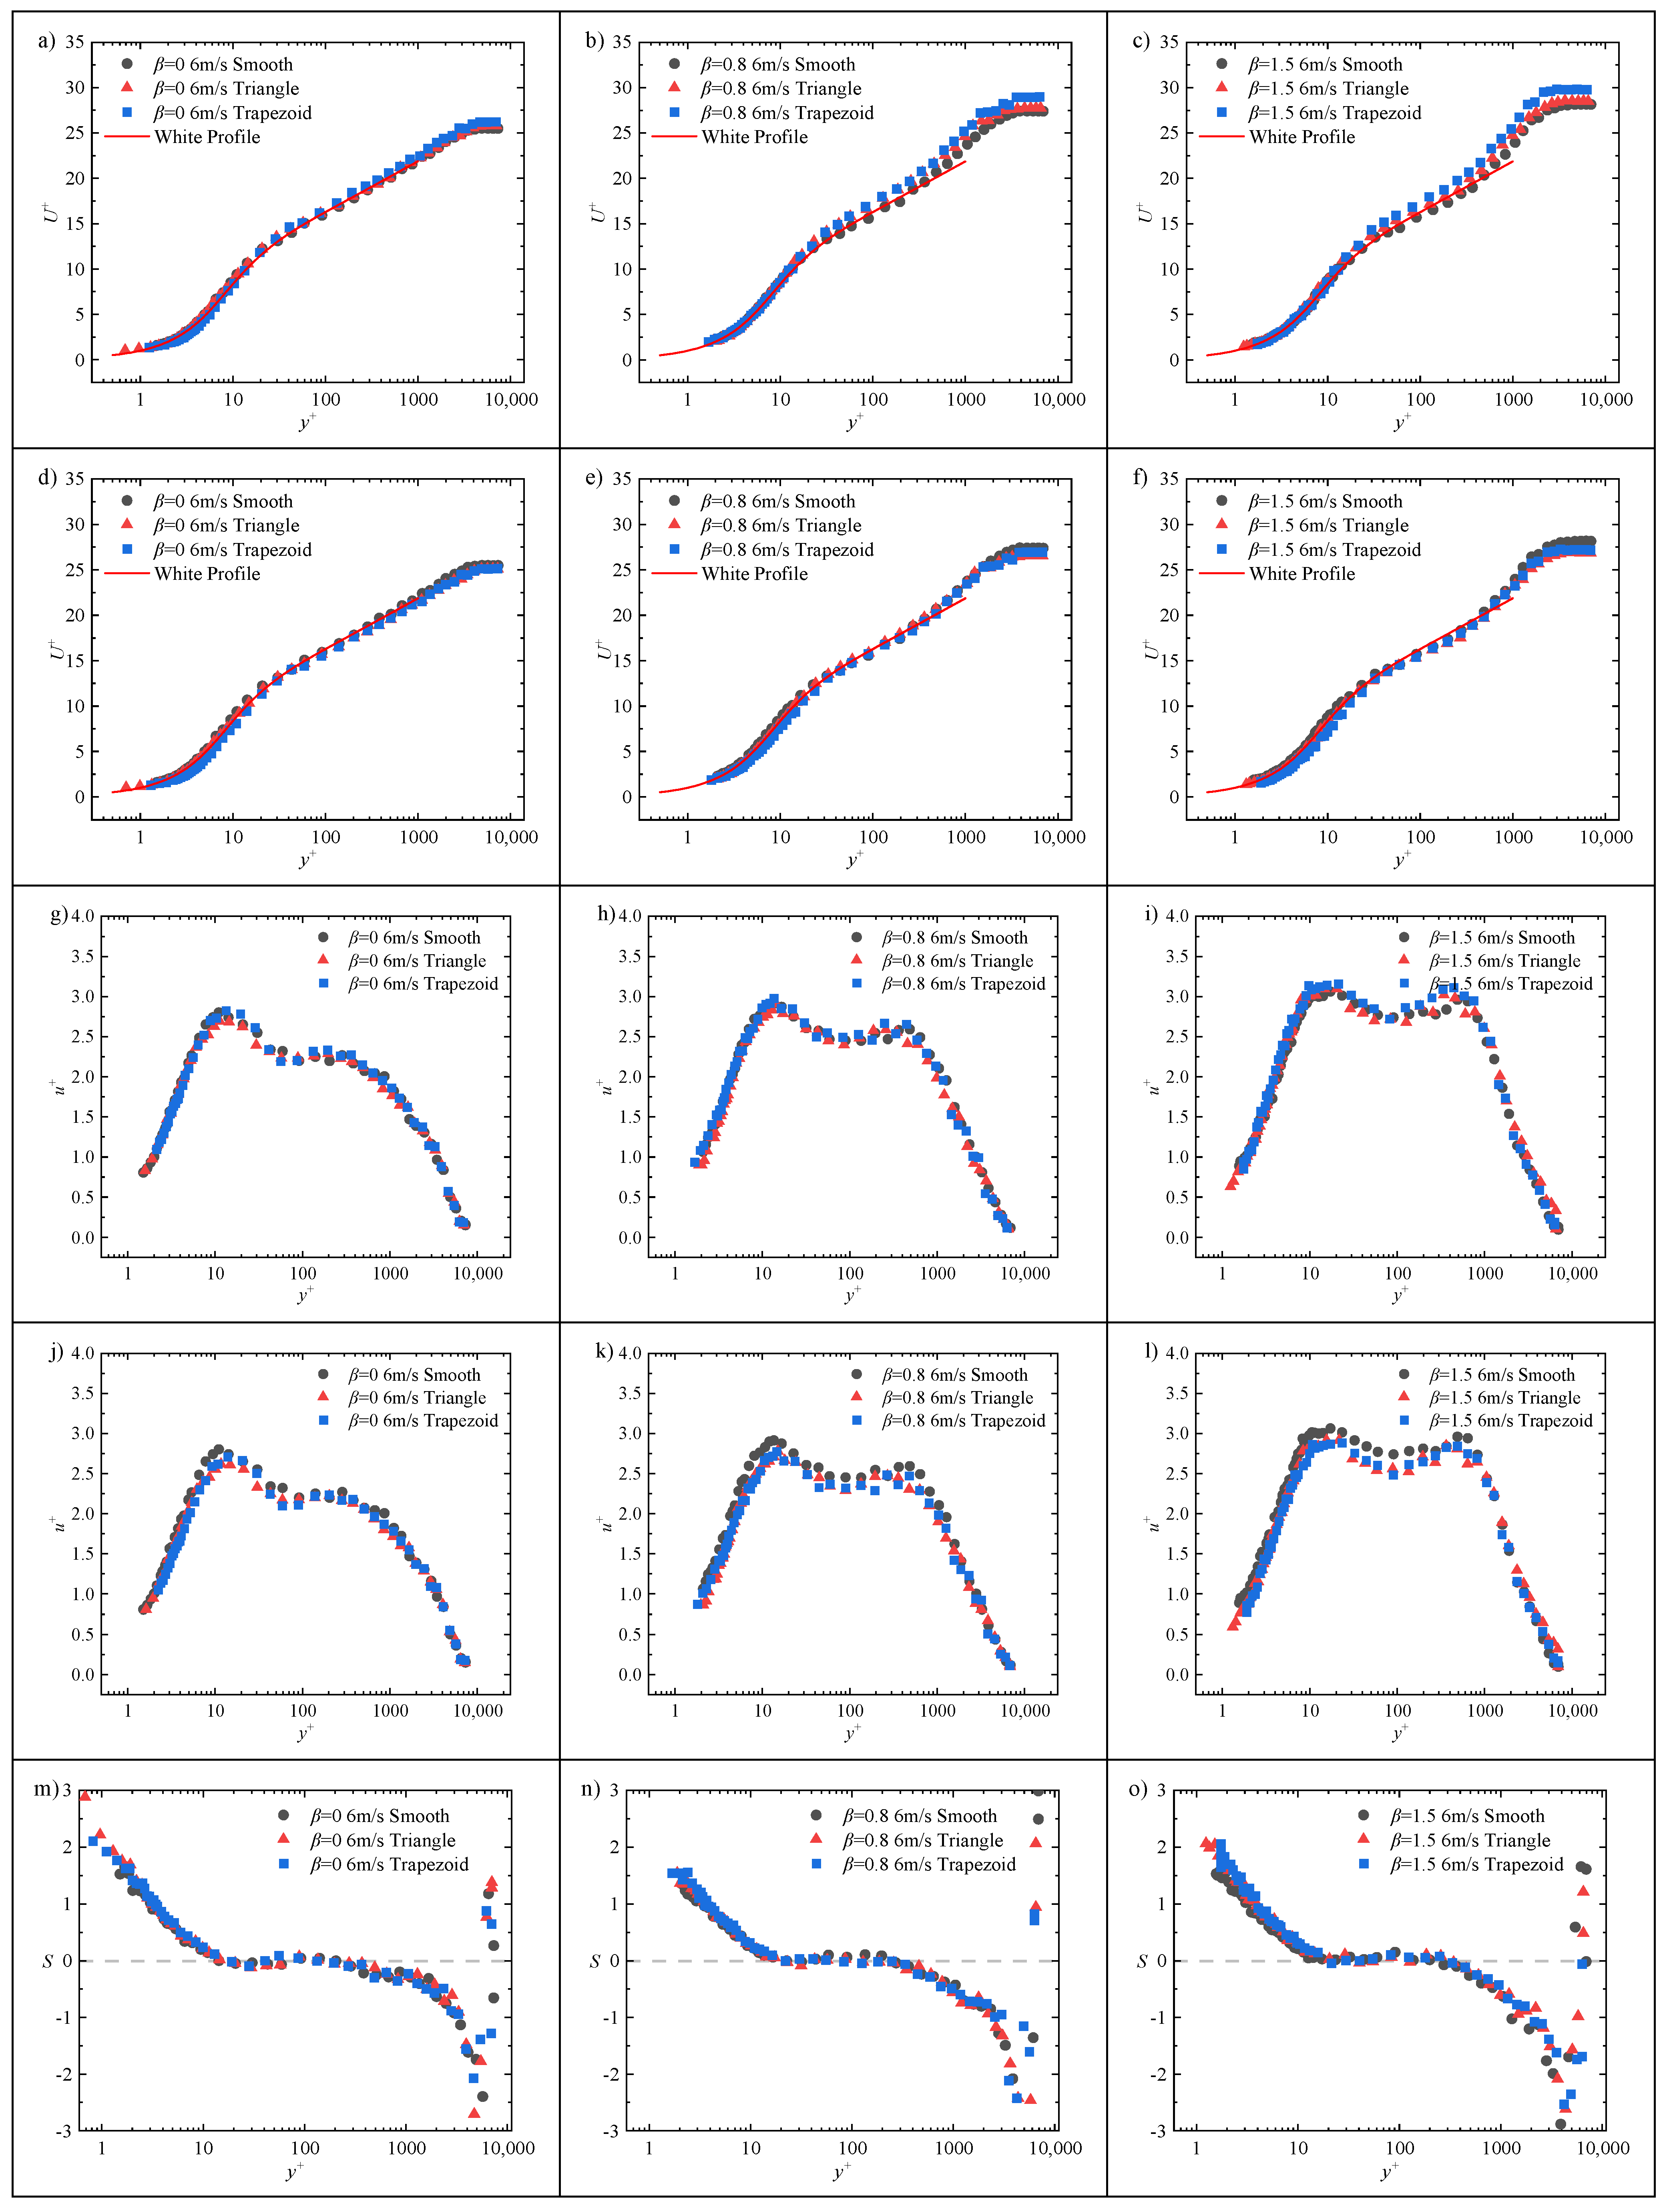
To investigate the mechanisms of drag reduction by riblets and the influence of adverse pressure gradients on their performance, this study employed hot-film probes for drag reduction measurements. Additionally, hot-wire anemometry was utilized to measure the turbulent boundary layers over both smooth and riblet surfaces at a freestream velocity of 6 m/s (corresponding to the optimal drag reduction regime of the non-dimensional riblet spacing s + ) under various adverse pressure gradient conditions. The changes in fundamental statistical quantities before and after riblet implementation were obtained, as shown in Figure 17. As shown in Figure 16, the drag reduction rate is no more than 8%, which means that the changes in the statistics of near-wall turbulence are not as significant as expected. This results in little variation in the velocity statistics of all orders for riblets under different environments in Figure 17. However, the variation trend of the curve can still reflect the changes in drag reduction magnitude.
Figure 17a–c show the mean velocity profiles, non-dimensionalized using the local friction velocity u τ . The results demonstrate that the logarithmic region of the velocity profile over the riblet surface exhibits a consistent upward shift relative to the smooth wall. This shift, quantified as Δ U + , serves as an indicator of the drag reduction performance. Notably, the velocity profile shift Δ U + is larger for trapezoidal riblets than for triangular riblets.
Moreover, as the adverse pressure gradient intensifies, both types of riblets maintain consistent trends in the velocity profile shift Δ U + . At β = 1.5, this shift effect becomes particularly pronounced. When normalized using the smooth-wall friction velocity u τ , the logarithmic regions of the velocity profiles regain coincidence. However, a velocity deficit emerges within the range of y + < 30 , and the magnitude of this deficit is positively correlated with the drag reduction rate. Since the same u τ is used for non-dimensionalization, the non-dimensional mean velocity profile effectively reflects the characteristics of the original dimensional velocity profile. Thus, at the same freestream velocity and identical wall-normal height, the local mean velocity in the viscous sublayer and buffer region of the turbulent boundary layer over the riblet surface is reduced compared to that over the smooth wall. This reduction results in a decreased slope of the linear region of the velocity profile, consequently leading to a reduction in wall shear stress. In the logarithmic region, the velocity profiles of different surface configurations resume overlapping, indicating that the local mean velocity in this region remains unaffected by the riblets. In summary, the influence of riblets on the mean velocity profile is confined to the viscous sublayer and buffer region. Therefore, the upward shift in the logarithmic region velocity profile observed when normalized using the local friction velocity is attributed to the reduction in u τ caused by the riblets. Consequently, Δ U + can serve as a quantitative measure of the change in wall shear stress.
Constrained by the limitations of the hot-wire measurement, the Reynolds stress distribution of turbulent fluctuations within the boundary layer cannot be obtained. However, the fluctuations in the velocity field can indirectly reflect the interaction mechanism between near-wall turbulent structures and the wall surface. Figure 17d–f presents the fluctuating velocity profiles, similarly non-dimensionalized using the local u τ . The conclusions drawn are fundamentally consistent with those of the mean velocity profiles. The fluctuating velocity profiles over the riblet surface exhibit a slight increase in the plateau near the logarithmic and wake regions, as well as in the potential flow region, compared to the smooth wall. This is again attributed to the reduction in the local u τ . When non-dimensionalized using the smooth-wall friction velocity u τ , the fluctuating velocity profiles reflect the inherent characteristics of the pre-non-dimensionalization data. Within the region y+ < 100, the fluctuating velocities exhibit a discernible reduction, a trend that becomes more pronounced under adverse pressure gradient conditions. The decrease in velocity fluctuations indicates a reduction in the energy of the flow structures within this region. This demonstrates that riblets effectively attenuate smaller-scale energy-containing structures above the wall, thereby diminishing their capacity to induce wall-normal momentum mixing. Consequently, the associated wall shear stress is reduced, leading to drag reduction.
For all flow conditions, the skewness and flatness factors deviate from their standard values and show an increase within the region y + < 15. When the skewness factor exceeds zero, it indicates an increased distribution of the probability density function of the local velocity fluctuations on the positive semi-axis. This condition corresponds to “sweep events” (Q2 events) in the turbulent boundary layer, where high-speed fluid from above suddenly intrudes downward into the low-speed fluid near the wall due to disturbances, resulting in strong impact and sweeping effects on the low-speed fluid in the near-wall region, causing the mixing of streamwise momentum in the wall-normal direction. The fluctuating velocity characteristics manifest as u > 0 , v < 0 , indicating an increase in positive streamwise velocity fluctuations. This leads to a right-skewed probability density function and a positive value of the skewness factor. Further comparison between the riblet surface and the smooth wall clearly reveals that the skewness factor values are higher over the riblet surface. At first glance, this phenomenon might suggest an increased frequency of sweep events. However, the underlying reason is that the riblets attenuate the strength of the near-wall streamwise vortices. Since streamwise vortices normally possess the significant ability to accumulate low-speed fluid, the introduction of riblets suppresses this capability, leading to a substantial reduction in the frequency of ejection events. In fact, while the probability of sweep events also decreases, the suppression of ejection events is more pronounced, resulting in an overall increase in the skewness factor. Regarding the flatness factor, a value greater than 3 indicates a more concentrated distribution of the probability density function for local velocity fluctuations, characterized by a higher peak. Riblets also cause the flatness factor to increase within the region y + < 15 compared to the smooth wall. Together, these observations indicate that within y + < 15, the presence of the wall leads to a deviation of the probability distribution of fluctuating velocities in the near-wall flow field from the Gaussian distribution characteristic of isotropic turbulence, resulting in anisotropy. Compared to the smooth wall, the influence of riblets on both higher-order statistical quantities is confined to the region y + < 15. After riblet implementation, both the skewness and flatness factors exceed those of the smooth wall, a phenomenon consistent with the findings of Choi et al. [6]. It is noteworthy that under riblet-induced modifications, the magnitude of increase in both skewness and flatness factors grows with the intensity of the adverse pressure gradient.

5. Conclusions

Measurements of the turbulent boundary layer over the smooth wall revealed excellent agreement between the measured velocity profiles and White’s canonical velocity profile theory. The boundary layer shape factor remained below 1.25, indicating fully developed turbulent flow. The measurement results from two spanwise-symmetric positions on the flat plate demonstrated strong consistency, validating the reliability of the experimental setup. The nominal Reynolds number achieved in this experiment reached approximately 3.9 ~ 6.5 × 10 6 , representing an order of magnitude increase compared to existing literature.
(1)
The adverse pressure gradient environment over the aircraft surface was investigated. The distribution and characteristic values of adverse pressure gradients on the fuselage surface of the CRM under cruise conditions were evaluated. Adverse pressure gradient conditions with β = 0.8 and 1.5 were selected for study, and an experimental scheme based on a contraction–expansion section was designed to replicate these pressure gradient environments. Flow field measurements confirmed that the physically implemented adverse pressure gradient environment effectively met the design specifications.
(2)
Experimental measurements of the drag reduction rates were conducted for both types of riblet surfaces under various flow conditions, and the results were compared with existing literature. The drag reduction rates obtained in this study exhibit no significant differences in magnitude compared to those reported in the literature, indicating that the Reynolds number conditions in the current experiments did not substantially alter the drag-reducing performance of the riblets. A key conclusion is that the presence of adverse pressure gradients and crossflow effects exerts positive and negative influences, respectively, on the drag reduction efficacy of riblets. Based on the extent to which riblets modify the fundamental statistical quantities of the turbulent boundary layer, it is evident that these modifications are indeed enhanced under adverse pressure gradient conditions.

Author Contributions

Conceptualization, H.G.; methodology, P.L.; validation, H.G.; formal analysis, F.C. and C.L.; investigation, Q.M.; data curation, Q.M. and Y.S.; writing—original draft preparation, Q.M.; writing—review and editing, H.G.; supervision, P.L.; project administration, T.Z. All authors have read and agreed to the published version of the manuscript.

Funding

This research received no external funding.

Data Availability Statement

The raw data supporting the conclusions of this article will be made available by the authors on request.

Conflicts of Interest

The authors declare no conflicts of interest.

References

  1. Risse, K.; Stumpf, E.; Schröder, W. Preliminary Overall Aircraft Design with Hybrid Laminar Flow Control; Shaker: Aachen, Germany, 2016. [Google Scholar]
  2. Walsh, M. Turbulent Boundary Layer Drag Reduction Using Riblets. In Proceedings of the 20th Aerospace Sciences Meeting, Orlando, FL, USA, 11–14 January 1982; American Institute of Aeronautics and Astronautics: Orlando, FL, USA, 1982; pp. 1–8. [Google Scholar]
  3. Walsh, M.J. Riblets as a Viscous Drag Reduction Technique. AIAA J. 1983, 21, 485–486. [Google Scholar] [CrossRef]
  4. Walsh, M.; Lindemann, A. Optimization and Application of Riblets for Turbulent Drag Reduction. In Proceedings of the 22nd Aerospace Sciences Meeting, Reno, NV, USA, 9–12 January 1984; American Institute of Aeronautics and Astronautics: Reno, NV, USA, 1984; pp. 1–10. [Google Scholar]
  5. Walsh, M.J. Riblets. In Viscous Drag Reduction in Boundary Layers; American Institute of Aeronautics and Astronautics: Reston, VA, USA, 1990; pp. 203–261. [Google Scholar]
  6. Chan, L.; Kevin Skvortsov, A.; Ooi, A. Effect of straight riblets of the underlying surface on wall bounded flow drag. Int. J. Heat Fluid Flow 2023, 102, 109160. [Google Scholar] [CrossRef]
  7. Choi, K.S. Near-Wall Structure of a Turbulent Boundary Layer with Riblets. J. Fluid Mech. 1989, 208, 417–458. [Google Scholar] [CrossRef]
  8. Bacher, E.; Smith, C. A Combined Visualization-Anemometry Study of the Turbulent Drag Reducing Mechanisms of Triangular Micro-Groove Surface Modifications. In Proceedings of the Shear Flow Control Conference, Boulder, CO, USA, 12–14 March 1985; American Institute of Aeronautics and Astronautics: Boulder, CO, USA, 1985; pp. 1–10. [Google Scholar]
  9. Goldstein, D.B.; Tuan, T.C. Secondary Flow Induced by Riblets. J. Fluid Mech. 1998, 363, 115–151. [Google Scholar] [CrossRef]
  10. Bechert, D.W.; Bartenwerfer, M. The Viscous Flow on Surfaces with Longitudinal Ribs. J. Fluid Mech. 1989, 206, 105–129. [Google Scholar] [CrossRef]
  11. Luchini, P.; Manzo, F.; Pozzi, A. Resistance of a Grooved Surface to Parallel Flow and Crossflow. J. Fluid Mech. 1991, 228, 87–109. [Google Scholar] [CrossRef]
  12. Wong, J.; Camobreco, C.J.; Garcia-Mayoral, R.; Hutchins, N.; Chung, D. A viscous vortex model for predicting the drag reduction of riblet surfaces. J. Fluid Mech. 2024, 978, A18. [Google Scholar] [CrossRef]
  13. Debisschop, J.R.; Nieuwstadt, F.T.M. Turbulent Boundary Layer in an Adverse Pressure Gradient—Effectiveness of Riblets. AIAA J. 1996, 34, 932–937. [Google Scholar] [CrossRef]
  14. Boomsma, A.; Sotiropoulos, F. Riblet drag reduction in mild adverse pressure gradients: A numerical investigation. Int. J. Heat Fluid Flow 2015, 56, 251–260. [Google Scholar] [CrossRef]
  15. Devenport, W.J.; Lowe, K.T. Equilibrium and Non-Equilibrium Turbulent Boundary Layers. Prog. Aerosp. Sci. 2022, 131, 100807. [Google Scholar] [CrossRef]
  16. Nieuwstadt, F.T.M.; Wolthers, W.; Leijdens, H.; Prasad, K.K.; Manen, A.S.-V. The Reduction of Skin Friction by Riblets under the Influence of an Adverse Pressure Gradient. Exp. Fluids 1993, 15, 17–26. [Google Scholar] [CrossRef]
  17. Choi, K.S. Effects of Longitudinal Pressure Gradients on Turbulent Drag Reduction with Riblets. In Turbulence Control by Passive Means; Coustols, E., Ed.; Springer: Dordrecht, The Netherlands, 1990; Volume 4, pp. 109–121. [Google Scholar]
  18. Kurita, M.; Nishizawa, A.; Kwak, D.; Iijima, H.; Iijima, Y.; Takahashi, H.; Sasamori, M.; Abe, H.; Koga, S.; Nakakita, K. Flight Test of a Paint-Riblet for Reducing Skin-Friction. In Proceedings of the 2018 Applied Aerodynamics Conference, Bristol, UK, 24–28 July 2018; American Institute of Aeronautics and Astronautics: Reston, VA, USA, 2018; pp. 1–7. [Google Scholar]
  19. Park, J.; Choi, H. Effect of the yaw angle on the riblet performance. Phys. Fluids 2024, 36, 065110. [Google Scholar] [CrossRef]
  20. Li, Z.P.; He, L.; Zuo, Y.R.; Yin, Y.; Meng, B. Numerical study on the influence of riblet yaw-angle on drag reduction rate with different immersion heights. Results Eng. 2024, 22, 102118. [Google Scholar] [CrossRef]
  21. White, F.M. Viscous Fluid Flows, 3rd ed.; McGraw-Hill: New York, NY, USA, 2005. [Google Scholar]
  22. Hutchins, N.; Choi, K.S. Accurate Measurements of Local Skin Friction Coefficient Using Hot-Wire Anemometry. Prog. Aerosp. Sci. 2002, 38, 421–446. [Google Scholar] [CrossRef]
  23. Walsh, M.J. Effect of Detailed Surface Geometry on Riblet Drag Reduction Performance. J. Aircr. 1990, 27, 572–573. [Google Scholar] [CrossRef]
  24. Sasamori, M.; Koga, S.; Kurita, M. Pressure Gradient Effects on the Performance of Riblets Installed on Aircraft Surfaces. J. Aircr. 2022, 59, 447–457. [Google Scholar] [CrossRef]
  25. Vila, C.S.; Vinuesa, R.; Discetti, S.; Ianiro, A.; Schlatter, P.; Örlü, R. Experimental Realisation of Near-Equilibrium Adverse-Pressure-Gradient Turbulent Boundary Layers. Exp. Therm. Fluid Sci. 2020, 112, 109975. [Google Scholar] [CrossRef]
  26. NASA Common Research Model Providing Data Worldwide. 2017. Available online: https://commonresearchmodel.larc.nasa.gov/ (accessed on 7 September 2025).
  27. Bechert, D.W.; Bruse, M.; Hage, W.; van der Hoeven, J.G.T.; Hoppe, G. Experiments on Drag-Reducing Surfaces and Their Optimization with an Adjustable Geometry. J. Fluid Mech. 1997, 338, 59–87. [Google Scholar] [CrossRef]
Figure 1. Experimental setup: (A) Wind tunnel with a test plate of 8.6 m in length; (B) Probes over measurement plates; (C) Schematic of the test plate (red lines show axis of x, y and z).
Aerospace 12 00985 g001
Figure 2. Time-averaged velocity profiles of turbulent boundary layers on a smooth flat plate at different spanwise positions. Here, blue line shows White profile [21].
Aerospace 12 00985 g002
Figure 3. Pressure gradient distribution over the CRM Surface.
Aerospace 12 00985 g003
Figure 4. Distribution of wall shear stress, pressure gradient, and corresponding non-dimensional pressure gradient along the surface of the CRM.
Aerospace 12 00985 g004
Figure 5. Experimental setup of adverse pressure gradient environment.
Aerospace 12 00985 g005
Figure 6. Velocity contour plot of the final design of the top bump.
Aerospace 12 00985 g006
Figure 7. Experimental setup of the top bump.
Aerospace 12 00985 g007
Figure 8. Schematic diagram of riblet’s geometry parameters (Left: triangular riblets, Right: trapezoidal riblets).
Aerospace 12 00985 g008
Figure 9. Measurement procedure for drag reduction rate.
Aerospace 12 00985 g009
Figure 10. Calibration curve of hot-film probe at Pos. 1 for the case of β = 0.
Aerospace 12 00985 g010
Figure 11. Calibration curve of hot-film probe at Pos. 2 for the case of β = 0.
Aerospace 12 00985 g011
Figure 12. Comparison of drag reduction rates of two riblet types with literature results of Bechert [27] for the case of ZPG, i.e., β = 0.
Aerospace 12 00985 g012
Figure 13. Drag reduction rate of triangular riblets at different pressure gradient.
Aerospace 12 00985 g013
Figure 14. Drag reduction rate of trapezoidal riblets at different pressure gradient.
Aerospace 12 00985 g014
Figure 15. Comparison of drag reduction rates for two riblet types under different β conditions with literature results [13].
Aerospace 12 00985 g015
Figure 16. Effect of yaw angle on drag reduction rate of two riblet types under different adverse pressure gradients (β).
Aerospace 12 00985 g016
Figure 17. Fundamental statistical quantities of the turbulent boundary layer with different surfaces.
Aerospace 12 00985 g017aAerospace 12 00985 g017b
Table 1. Measured Parameters of the Turbulent Boundary Layer over the Smooth Flat Plate.
VelocityPositionNominal Boundary Layer Thickness
δ (mm)
Displacement Boundary Layer Thickness
δ* (mm)
Momentum Boundary Layer Thickness
θ (mm)
Shape Factor
H
Nominal Reynolds Number
Rex
Friction Reynolds Number
Reτ
Momentum Reynolds Number
Reθ
6 m/sPos. 123924.7819.751.2553.9 × 10638987826
Pos. 224525.0320.041.2493.9 × 10639457940
10 m/sPos. 123524.5719.871.2376.5 × 106595513,089
Pos. 223823.5819.151.2316.5 × 106607112,617
Table 2. Non-Dimensional Pressure Gradient at Typical Locations of the CRM.
Plane Anglex (m)βx (m)βx (m)β
0 ° 1.051.642.50.373.30.74
15 ° 1.051.562.50.423.30.69
30 ° 1.051.402.50.583.30.81
60 ° 1.051.752.50.743.21.26
90 ° 1.051.522.50.953.21.77
Table 3. Boundary Layer Parameters and Dimensionless Adverse Pressure Gradient β at Measurement Locations under Different Freestream Velocities.
U (m/s)β = 0.8 β = 1.5
dp/dx
(Pa/m)
τw (Pa)δ* (mm)βdp/dx
(Pa/m)
τw (Pa)δ* (mm)β
40.9460.02990.02990.9461.2850.02890.02951.310
51.3660.04670.02630.7702.4360.04170.02861.672
61.8300.06490.02530.7143.3150.06150.02581.412
72.6870.08700.02380.7344.9390.08380.02571.513
83.2330.11270.02330.6685.9090.10720.02711.495
94.5830.13580.02280.7707.1440.12900.02541.407
105.3820.16890.02190.69810.8020.15910.02411.637
Table 4. Geometry Parameters of Riblets.
ShapeWidth s/mmHight h/mmTip Angle α/Degree Tip Width t/mm
Triangle10.866600
Trapezoid10.5300.025
Disclaimer/Publisher’s Note: The statements, opinions and data contained in all publications are solely those of the individual author(s) and contributor(s) and not of MDPI and/or the editor(s). MDPI and/or the editor(s) disclaim responsibility for any injury to people or property resulting from any ideas, methods, instructions or products referred to in the content.