Abstract
Advances in motor technology and the application of distributed electric propulsion systems have greatly promoted the development of electric vertical take-off and landing aircraft. As a critical safety component of eVTOL aircraft, the motor system design must satisfy both performance requirements and stringent airworthiness standards. This paper studies the lift–thrust unit drive motor system of an eVTOL aircraft and proposes an architecture that utilizes analytical redundancy to enhance system-level reliability. This paper focuses on threshold optimization in analytical redundancy systems. Through simulations and reliability analyses, the performance of the analytical redundancy system is quantified, with false alarm and missed detection probabilities evaluated, fault detection thresholds optimized, and overall system reliability enhanced analytical redundancy systems is improved. Simulation and calculation results demonstrate that the proposed fault detection method can effectively meet the requirements for rapid detection and achieve optimal reliability at the given optimal threshold.
1. Introduction
Electric vertical take-off and landing (eVTOL) aircraft, as a key enabler of advanced air transportation [1], rely on the high reliability of their thrust/lift units for their distributed propulsion systems. Brushless DC (BLDC) motors, with their high efficiency, high torque, and fast response, are core drive components. However, complex flight environments and prolonged operation expose these motors to multiple failure risks, including electronic component failure, thermal overload, and mechanical wear [2]. To ensure flight safety, traditional hardware redundancy solutions employ physical backups to achieve fail-safe characteristics. However, these solutions present challenges such as structural complexity, high weight and volume, and high cost. Furthermore, identical hardware designs can lead to common cause failures. The analytical redundancy method offers an innovative solution, replacing hardware redundancy with software-level fault detection. This method has been successfully implemented in aircraft such as the Airbus A350 and A380. For example, in the electrical flight control system (EFCS), this method effectively detects oscillation failure faults (OFCs) by comparing the actual deflection of control surfaces with the ideal model output. This method has passed airworthiness review and achieved complete fault detection coverage [3]. Fault detection (FD), as an important means of analytical redundancy, is mainly divided into two categories: model-based methods and data-driven methods. For motors, extensive research has been carried out based on these two fault detection methods at home and abroad. Mekki et al. [4] proposed a fault diagnosis method based on sliding mode observer to estimate phase current. Moseler et al. [5] proposed a model-based brushless DC motor fault detection method using parameter estimation, such as bearing damage or fracture may increase friction. Zhang et al. [6] designed an interval sliding mode observer for the initial inter-turn short circuit fault of the stator winding to deal with the uncertainty caused by sensor measurement error. Data-driven fault detection is a method that utilizes monitoring data collected during system operation to identify and locate faults. Hosseini et al. [7] introduced a supervised data-based approach for detecting and classifying faults in BLDC motors, including stator inter-turn faults, rotor dynamic unbalance, rotor static unbalance, and various combinations of these faults. For electric aircraft motor systems, to enhance system reliability, Hoenicke et al. [8] developed a novel power management control module. This module ensures high safety and reliability through redundant design and multiple safety measures. Lewis et al. [9] proposed a fault-tolerant motor design that combines an ironless Halbach permanent magnet array axial flux unit with a permanent magnet-free hybrid excitation radial flux unit. This dual-unit design effectively improves the motor’s fault tolerance and operational efficiency, making it suitable for the specific operational scenarios of electric propulsion aircraft.
Civil aircraft design must meet both performance requirements and airworthiness safety standards. EASA SC-VTOL.2510 explicitly states: “The design and installation of equipment must ensure that catastrophic failures are extremely unlikely and cannot result from a single fault” [10]. This clause ensures the overall aircraft safety meets requirements by establishing stringent safety metrics. Therefore, to meet airworthiness safety requirements, critical eVTOL safety systems must establish redundant mechanisms to prevent single-point catastrophic failures, with the probability of failure meeting the extremely unlikely requirement.
Based on the above discussion, it can be seen that software-based fault detection methods can enhance safety design. However, meeting top-level safety indicators presents a challenge for airworthiness safety compliance. This paper, taking this research perspective, optimizes detection thresholds for the eVTOL lift/thrust unit drive motor system, focusing on overall motor system reliability. By introducing a model-based fault detection approach into the architecture, we conduct threshold optimization research targeting system safety indicators.
2. Mathematical Modeling
2.1. BLDC Motor Mathematical Model Test Method
The structure of the motor driving the lift/thrust unit studied herein is presented in Figure 1. The system consists of key components such as power supply, BLDC motor, pulse width modulation (PWM) input and electronic speed control (ESC) [11]. The PWM signal controls the voltage and frequency of the motor by adjusting the pulse width of the current, thereby achieving precise regulation of the motor speed and torque. The ESC monitors the operating status of the motor and adjusts the current supplied to the stator winding to ensure that the motor can operate efficiently and stably under various load conditions.
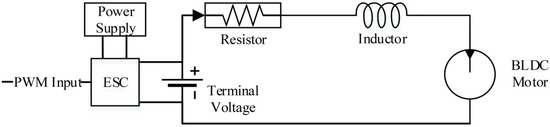
Figure 1.
BLDC motor equivalent circuit configuration.
Assuming that the stator self-inductance varies with the rotor position and the mutual inductance between the stator windings is negligible, the electrical dynamics of the BLDC motor can be initially described [12]. However, for system-level analysis and control design, a further simplified, lumped-parameter equivalent circuit model is adopted. This model abstracts the typical three-phase BLDC motor as a DC motor represented by a single winding, under the core assumption of symmetrical stator windings. Consequently, the equivalent resistance and inductance in the model represent the average values per phase and are utilized as unified parameter values for all windings in simulations [11]:
where the motor armature current, is the equivalent circuit armature inductance, is the equivalent resistance, is the motor back EMF, is the back EMF constant, is the drive system gear ratio, is the voltage applied to the armature.
The coupled rotor-motor mechanical equation of motion can be written as:
where is the rotor speed, is the rotor moment of inertia, is the inertia of the high-speed drive components (motor and coupled transmission components), , is the motor torque constant, , is the rotor aerodynamic torque with the drive system, is the linear representation of the mechanical friction or viscous losses in the drive system. The motor torque constant can be related to the back EMF constant through the relationship .
For current state-of-the-art BLDC motors, expected inductance values are on the order of a few micro Henry and result in extremely low time constants of the current dynamics [12]. Based on this physical property, it is reasonable to assume that the current response is instantaneous when modeling the system. The engineering equivalent of this assumption is to replace the circuit’s equivalent inductance . This yields the expression of in Equations (1) and (2) which then substituted in (3) provides the fundamental dynamic response of the coupled rotor-motor direct drive system as [13]:
The above formula can be rewritten as:
The motor’s time constant is given by: .
The above formula is linearized at the equilibrium point. Combined with the average effect of torque on speed [14], the system is locally linearized using the first-order Taylor expansion method, and the transfer function expression of the input-output relationship of the system is derived as follows, The corresponding parameter values are provided in Table A1 of Appendix A.
2.2. Speed PI Closed-Loop Control
The BLDC motor control system utilizes a PI controller to ensure rapid dynamic response and accurate steady-state speed tracking. The proportional term enhances agility, while the integral action eliminates steady-state error, maintaining consistent performance under load variations. As shown in Figure 2, d denotes an external disturbance, and f represents a fault input applied to simulate abnormal operating conditions of the motor.
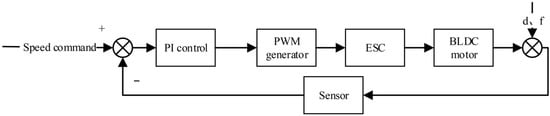
Figure 2.
Speed PI control block diagram.
For the system in the figure above, the relationship between the given speed and the actual speed can be derived as follows:
Changed to state space form as follows, where , represents the integral of the error between the speed command and the actual speed, directly represents the actual motor speed.
Given a ramp command with a target speed of 100 rad/s, as shown in Figure 3, the actual speed tracks and reaches the target command within 0.08 s, with the linearized model showing excellent agreement with the actual system in both transient and steady-state responses while maintaining modeling accuracy.
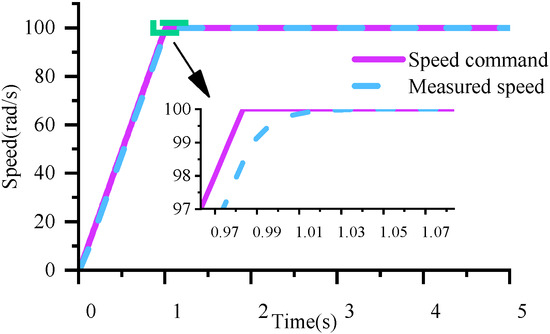
Figure 3.
Closed-loop control simulation waveform.
3. Redundancy Architecture Design
3.1. System Architecture
The dual-motor architecture (Figure 4) provides critical redundancy for eVTOL lift/thrust units, enabling continued operation during a single motor failure—unlike single-motor systems [15]. This redundant design ensures continuous thrust even with reduced available power.
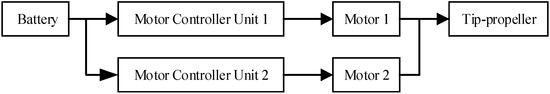
Figure 4.
Dual-redundancy motor architecture.
Based on the architecture shown above, this paper employs a Kalman filter and robust observer for fault detection, ensuring system adaptability and robustness while improving the reliability of detection results. By comparing different detection methods, the robustness of the fault detection system can be effectively enhanced, ensuring accurate fault identification and diagnosis in complex and changing flight environments, thereby ensuring flight safety.
As shown in Figure 5, the fault detection module uses two independent fault detection methods for analysis, each yielding a fault diagnosis result, and a final fault determination is reached through logical voting. If a motor system fault is detected, the speed command driver switches to the backup motor system. This redundant fault detection method ensures high reliability and safety of the motor system.
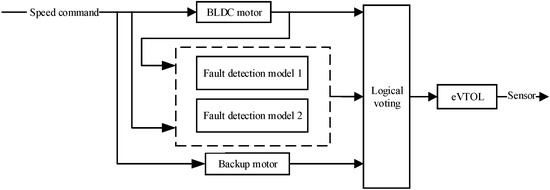
Figure 5.
System architecture diagram.
In fault detection logic design, various voting strategies can be employed to implement fault determination and comparative analysis. For example, a fault detection mechanism based on the combination of a Kalman filter and a robust observer can be monitored using either AND logic (both alarm simultaneously) or OR logic (either alarm). In the AND logic mode, the system determines that a fault has occurred only when both the Kalman filter and the robust observer generate alarm signals, significantly reducing the false alarm rate and improving detection accuracy and system fault tolerance. In the OR logic mode, the system triggers a fault alarm when either detector is triggered. This helps enhance the sensitivity and response speed of fault detection, ensuring that potential problems are identified and addressed promptly.
3.2. Fault Detection Design
- Kalman filter
The Kalman filter is used for state estimation. The optimal estimation of the system state is made through the two processes of prediction and update. In the prediction phase, the next state and error covariance matrix of the system are calculated. In the update phase, the state estimate and error covariance matrix are updated by the actual measurement values [16]. The two important parameters of the Kalman filter are Q and R, where Q is the process noise covariance matrix, which is related to the inaccuracy of system modeling, and R is the observation noise covariance matrix, which is related to the uncertainty in the observation equation.
The following is the basic model of the Kalman filter:
The system representation used in the diagnostic algorithm is directly derived from the linearized motor model equations described in Section 2.2. The matrices A, B, and H are obtained from this model, where A represents the state transition dynamics determined by electrical and mechanical coupling, B characterizes the effect of the control input on the state variables, and H defines the mapping from the internal states to the measurable motor speed.
Within the Kalman filter framework, , is the prior estimate of the state at time for time , is the optimal estimate of the state at time , is the prior estimate of the covariance matrix at time for time , and is the optimal estimate of the covariance matrix at time . is the Kalman gain, which represents the ratio of model prediction error to measurement error. is the actual observation value.
- 2.
- Robust Observer
A robust observer is an estimator designed within the framework of robust control theory. Specifically, it utilizes H-infinity synthesis for state estimation. It functions as a fault detection and isolation (FDI) mechanism by estimating faults in the presence of external disturbances and model uncertainties [17]. The observer calculates optimal feedback gains to stabilize the closed-loop control system while minimizing the H-infinity norm of the transfer function from the disturbance to the estimation error. Throughout the state estimation process, the observer gain matrix is continuously optimized to ensure stable and reliable operation in the presence of uncertainties and disturbances.
The robust control block diagram of the observer is shown in Figure 6.
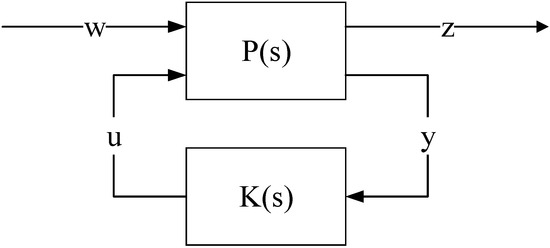
Figure 6.
Robust observer control block diagram.
The input and output relationship of the above control model can be expressed as:
In the robust observer framework considered in this study, is defined as the control signal, namely the speed command (); is defined as the observation, namely the actual motor speed (); is defined as the external disturbance, including measurement noise (as illustrated by d in Figure 2); is defined as the control variable, namely the detection error, which is the difference between the estimated speed and the actual speed; is robust observer, whose elements are determined by H-infinity synthesis to minimize the effect of disturbances on the detection error, and represents the augmented plant that incorporates both the motor dynamics and the external disturbances.
We can break into blocks corresponding to the dimensions of the input signal , i.e.,
The relationship between the system perturbation signal and the system performance evaluation signal is:
The expression of the transfer function is:
Based on the transfer function formulation, the controller K(s) is synthesized using the H-infinity method by minimizing the H-infinity norm of the influence of disturbances on the detection error: min .
This optimization process ensures that the system maintains excellent fault detection performance even in the presence of measurement noise.
3.3. Comparison of Detection Methods
In fault detection, Kalman filters and robust observers are used to estimate system states, improving the accuracy and reliability of diagnostic results. Kalman filters are suitable for scenarios with small disturbances and low Gaussian noise, providing highly accurate state estimates. Robust observers, on the other hand, are more effective when model errors are large or external interference is strong, maintaining the stability of system estimates. When used together, these two methods can detect a variety of fault types, improving system performance and reliability.
Mean Squared Error (MSE) is an important metric for measuring model accuracy. It is defined as the average of the squared errors between the predicted and true values and quantifies how closely the model approximates the real system. A low MSE indicates a high model fit accuracy and a strong ability to capture system characteristics, while a high MSE reflects poor model robustness to error and noise. MSE is often used as a standard metric for evaluating model accuracy.
As shown in Figure 7, when noise is low and the system model is accurate, the Kalman filter-based fault detection model exhibits lower mean squared error and is more accurate than the robust observer model.
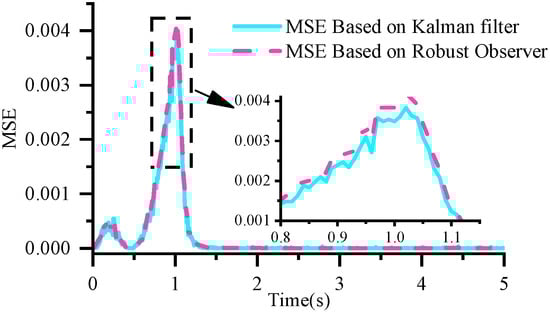
Figure 7.
Comparison of Mean Squared Errors When Noise is Low.
As shown in Figure 8, when the system model is uncertain or the disturbance is large, the mean squared error of the Kalman filter-based fault detection model is significantly higher than that of the robust observer model. This indicates that the robust observer has higher detection accuracy and robustness under conditions of model inaccuracy.
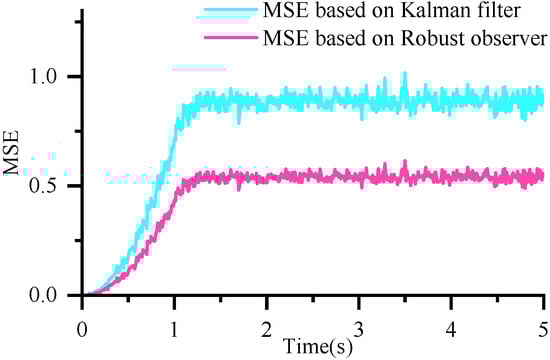
Figure 8.
Comparison of Mean Squared Errors When the Model Is Inaccurate.
4. Threshold Optimization Approach
4.1. Optimization Goal
- Rapidity: This refers to the ability of the system to quickly and accurately identify faults under ideal dynamic conditions during the switching process between the primary and standby systems. In simulation, the rapidity of fault detection results can be evaluated by monitoring the changes in parameters such as the actual speed, estimated speed, and residual of the motor system.
- Reliability: A confusion matrix is used to evaluate the false positive and missed detection rates of the model’s detection results, calculating the probability of occurrence of different failure modes to verify system stability. This method can quantitatively analyze the accuracy and robustness of the detection model under various operating conditions.
4.2. Detection Model Evaluation
The confusion matrix, as shown in Table 1, is used to evaluate the reliability of the fault detection method by quantifying the false alarm and missed detection rates.

Table 1.
Confusion Matrix.
The state-space model, essential for probabilistic false alarm analysis under fault-free conditions, is derived through a systematic, data-driven system identification process that integrates the analysis of fault-free residual data. This process begins by calculating the residual sequence r(k) from actual flight data, representing the difference between the measured sensor values and the model-predicted outputs. These fault-free residuals are then subjected to time series analysis techniques, including examination of their autocorrelation function (ACF) and partial autocorrelation function (PACF), to preliminarily determine the appropriate order of an ARMA model that best captures their dynamic characteristics. Based on this initial assessment, parameter estimation algorithms, are employed to fit the precise parameters of the ARMA model to the residual data. The final, determined ARMA model is then converted into an equivalent state-space realization, yielding the matrices , , , for the system [18]:
where represents the state transition dynamics determined by the autoregressive part, corresponds to the influence of the moving average component on the states, defines the mapping from the state variables to the residual output, describes the direct effect of external disturbances on the residuals, is the overall external interference vector, and is the residual vector.
The state covariance matrix is obtained by solving the Lyapunov formula:
Obtain the residual covariance matrix through the Toeplitz matrix:
The probability density function of the residual is obtained as:
where is the residual vector of time steps.
The false alarm probability can be regarded as the probability that the residual is greater than the threshold; that is [18]:
When calculating the missed detection rate, a fixed threshold is set, the minimum fault level that can be detected under the threshold is estimated, and the probability of a fault below the threshold is calculated, which is the missed detection probability. Assume that the probability of motor failure is uniformly distributed:
The missed detection probability is equal to the probability that the fault magnitude f is less than the threshold, which can be calculated as [19]:
where is minimum detectable fault magnitude.
4.3. Detection Logic Analysis
The reliability calculations for different detection logics are different. This article mainly analyzes and compares the reliability of four different detection mechanisms.
- The reliability calculation for fault detection based on a single Kalman filter is as follows, and the corresponding reliability diagram of false positives and false negatives is shown in Figure 9
 Figure 9. Reliability diagram of Kalman filter detection false positives and false negatives.
- The reliability calculation for fault detection based on a single robust observer is as follows, and the corresponding reliability diagram of false positives and false negatives is shown in Figure 10.
 Figure 10. Robust observer detection false positive and false negative reliability diagram.
- Based on the combination of the Kalman filter and robust observer, the reliability calculation of the alarm detection mechanism (OR voting) is as follows, and the corresponding reliability diagram of false positives and false negatives is shown in Figure 11.
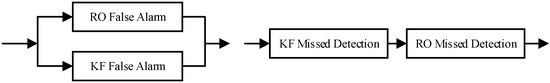 Figure 11. Or Voting detection reliability diagram for false positives and false negatives.
- Based on the combination of the Kalman filter and robust observer, the reliability calculation of the simultaneous alarm detection mechanism (AND voting) is as follows, and the corresponding reliability diagram of false positives and false negatives is shown in Figure 12.
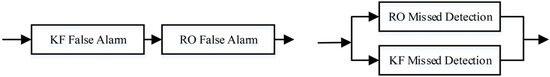 Figure 12. And voting detection false positive and false negative reliability diagram.
4.4. System Reliability Analysis
The system reliability block diagram is presented in Figure 13. Simultaneous failure of the main motor and backup motor, undetected failure of the main motor (missed detection), and the FD’s erroneous determination of a main motor failure (false detection) when the backup motor is actually faulty can all lead to failure of the aircraft’s lift/thrust unit. The failure probability must meet the safety probability indicator for the lift/thrust unit allocation.
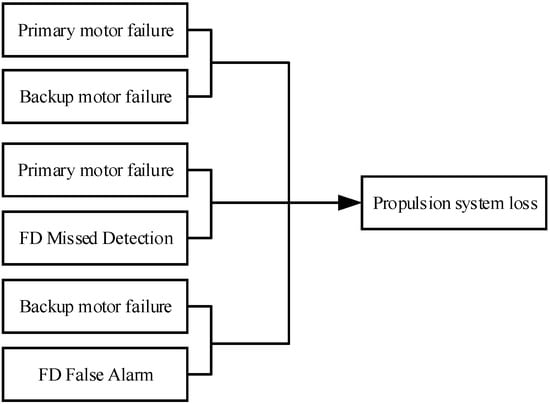
Figure 13.
Motor system failure reliability block diagram.
5. Simulation Analysis
When a motor experiences a fault, common abnormal speed manifestations primarily include abnormal speed fluctuations, speed reduction, and speed interruption [20], as well as speed response delay. Among these, this paper focuses on analyzing abnormal speed fluctuations. This paper simulates the fault by superimposing a sinusoidal signal with an amplitude of 10 on the speed signal to represent abnormal speed fluctuations. Abnormal speed fluctuations are typically caused by factors such as mechanical vibration, electromagnetic imbalance, or control system dynamic instability, e.g., dynamic eccentricity, mechanical unbalance, winding short circuits, or control algorithm oscillations. By analyzing abnormal modes through simulation, theoretical basis can be provided for optimizing relevant fault detection thresholds, thereby enhancing the reliability and safety of motor operation.
5.1. Fault Detection Based on Kalman Filter
The estimated output from the Kalman filter, the actual system output, and the reference command are compared following fault injection, as illustrated in Figure 14.
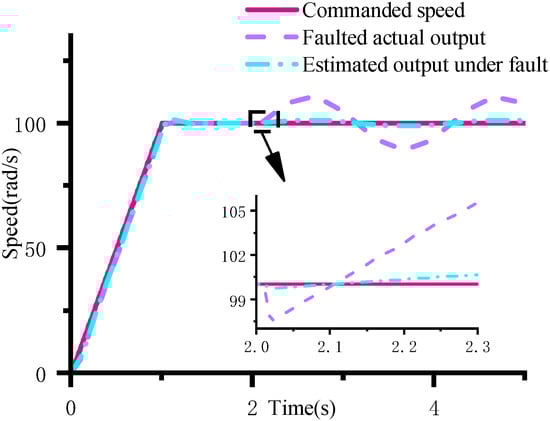
Figure 14.
Motor response and estimated value under speed anomaly.
To optimize fault detection, a threshold range of [0.2, 0.3] is set. The lower limit of 0.2 is based on the maximum residual error when there is no fault, ensuring rapid detection; the upper limit of 0.3 improves interference resistance. Experiments show that this range can effectively identify faults within 0.01–0.05 s.
As shown in Figure 15, a threshold that is too low (such as 0.2) increases the false alarm rate, while a threshold that is too high may miss minor faults. Therefore, it is necessary to select an optimal value within the range to balance the risk of false alarms and missed detections and ensure the robustness of the detection.
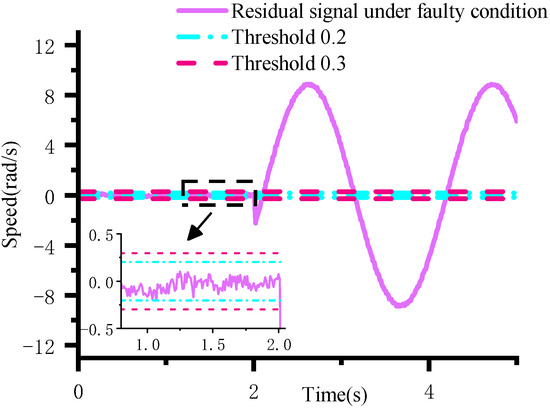
Figure 15.
Motor response and estimated values when speed anomaly occurs.
As shown in Figure 16, the false alarm rate decreases rapidly as the threshold increases. When the threshold approaches zero, the false alarm rate approaches 100%, indicating that the residual is highly likely to cross the low threshold due to interference. When the threshold is higher, the residual is highly unlikely to cross the threshold, and the false alarm rate is essentially zero. Figure 17 shows the maximum residual values when injecting different fault amplitudes. The maximum residual can be considered the threshold, which shows the relationship between a given threshold and the minimum detectable fault. When the threshold is set too high, the minimum detectable fault also increases, resulting in an increased missed detection rate.
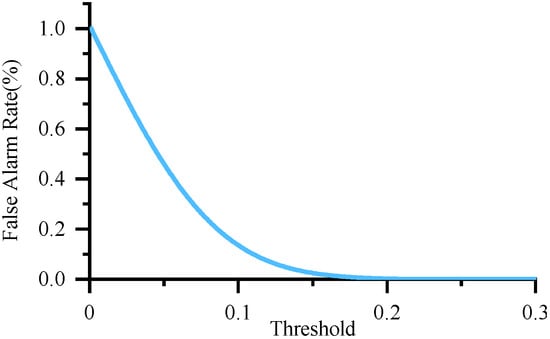
Figure 16.
Trend of false alarm rate as a function of threshold.
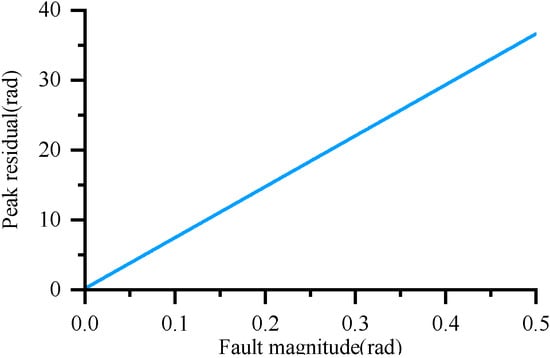
Figure 17.
The trend of maximum residual error changing with fault magnitude.
5.2. Fault Detection Based on Robust Observer
Following fault injection, Figure 18 presents a comparison between the robust observer’s estimated output, the actual system output, and the reference command. Figure 19 illustrates the relationship between the residuals and the corresponding threshold range after fault injection.
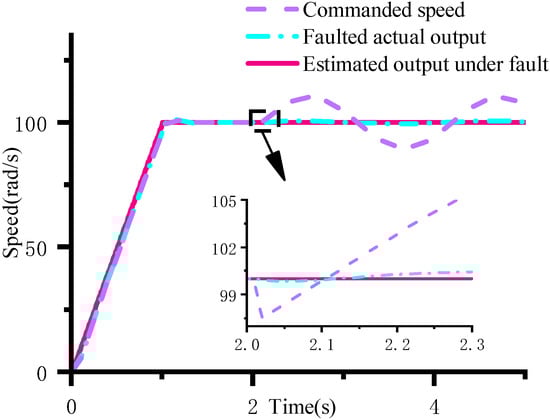
Figure 18.
Motor response and estimated value under speed anomaly.
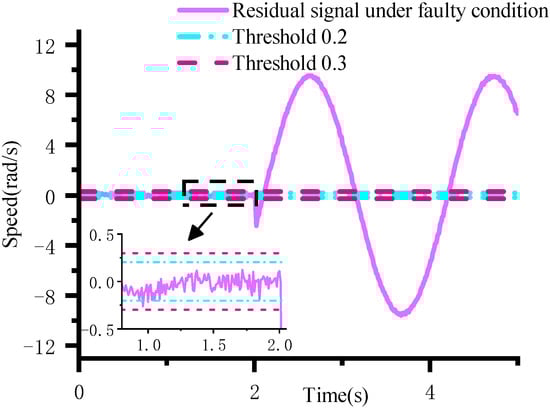
Figure 19.
Motor response and estimated values when speed anomaly occurs.
As shown in Figure 20 and Figure 21, compared with the Kalman detection model, when the same threshold is set, the false alarm rate of the robust observer model detection results is lower; at the same time, the magnitude of the detected faults is smaller; that is, the missed detection rate is smaller.
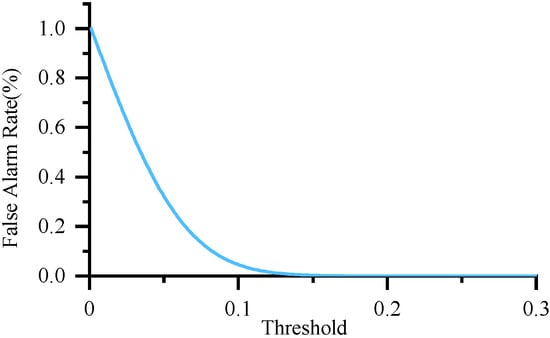
Figure 20.
Trend of false alarm rate as a function of threshold.
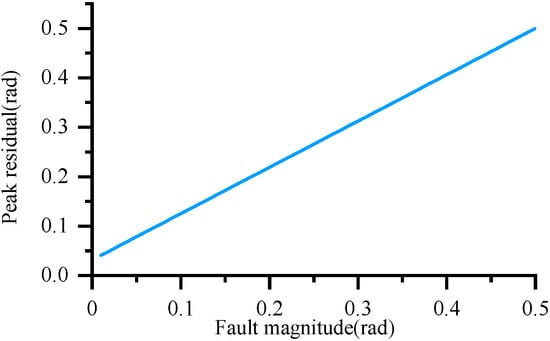
Figure 21.
The trend of maximum residual error changing with fault magnitude.
5.3. Analysis of Threshold Optimization
The missed detection and false alarm rates of fault detection are calculated using (13)–(19), with results presented in Figure 22 and Figure 23.
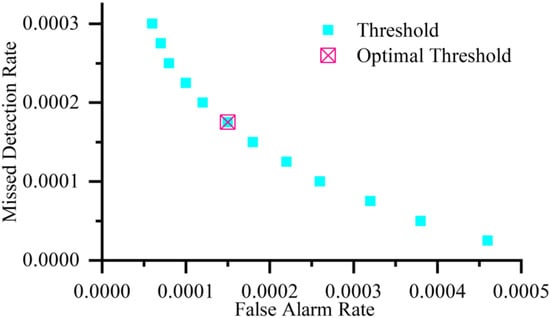
Figure 22.
Optimization of fault detection threshold based on Kalman filter.
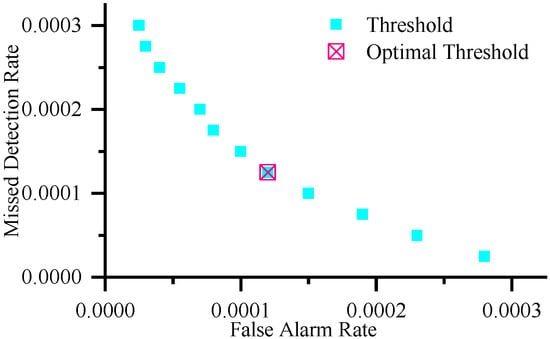
Figure 23.
Fault Detection Threshold Optimization Based on Robust Observer.
ROC curve analysis shows that the choice of threshold directly affects the balance between the system’s false alarm rate and missed detection rate. A threshold that is too low significantly increases the risk of false alarms, leading to unnecessary system switching. On the other hand, a threshold that is too high reduces the system’s sensitivity to faults and increases the probability of missed detection. The optimal operating point determined by ROC curve analysis is located closest to the origin of the curve, achieving the best balance between false alarm rate and missed detection rate. Specifically, the optimal threshold for the Kalman filter model is 0.287, and the optimal threshold for the robust observer model is 0.284. The corresponding performance indicators are shown in Table 2.
Table 2.
Optimal threshold and corresponding probability.
Depending on the model requirements, the ROC curve threshold selection strategy can be optimized as follows: for systems sensitive to false alarms, the threshold can be increased to reduce the false alarm rate; for systems sensitive to missed detections, the threshold can be lowered to reduce missed detections. By dynamically adjusting the threshold, the system’s reliability and sensitivity can be effectively balanced.
5.4. Failure Probability Calculation
Assuming a main drive motor failure probability of 10−4 and backup drive motor failure probabilities of 10−4 and 10−3, respectively, Figure 12 analyzes the motor system failure probability under four different detection logics, and the corresponding numerical values are summarized in Table 3.
Table 3.
Motor system failure probability.
Since the entire system is highly sensitive to the detection model’s false alarm rate when the backup motor failure probability is 10−4, a weighting coefficient α is introduced to comprehensively balance the false alarm rate and missed detection rate, enabling dynamic threshold adjustment through rate-adaptive optimization.
Analysis of the motor system failure probability under different detection mechanisms shows that when two independent detection units trigger an alarm simultaneously, the system failure probability is significantly reduced. This indicates that setting up multiple detection units for simultaneous detection can effectively enhance system reliability. Selecting appropriate thresholds can also improve system reliability. For example, when a threshold of 0.265 is selected in the Kalman filter detection module and a threshold of 0.269 is selected in the robust observer model, the system failure probabilities when two independent detection units trigger an alarm simultaneously are 5.85 × 10⁻⁸ and 4.05 × 10⁻⁸, respectively, significantly lower than the optimal results in the table.
Compared to traditional triple-redundant hardware designs, this hybrid redundancy design only requires two drive motors to achieve redundancy, significantly reducing the weight of the additional redundant hardware. Furthermore, by introducing a functional overlap mechanism within the detection units and combining it with a threshold optimization strategy, its reliability approaches that of traditional triple-redundant hardware designs.
6. Conclusions
The eVTOL motor system utilizes an architecture based on analytical redundancy. By optimizing fault detection thresholds, it improves detection performance while effectively reducing false alarm and missed detection rates. The core advantage of this solution lies in its heterogeneous redundancy design. As shown in Table 4, while maintaining a low SWaP requirement (only increasing the computational load), the complementary nature of multiple algorithms significantly enhances fault detection capabilities and effectively reduces common-cause failures. Compared to the high SWaP requirements and performance limitations of single-algorithm FDI solutions of traditional hardware redundancy solutions, this solution demonstrates significant comprehensive advantages.
Table 4.
Comparison of various redundant systems.
The enhanced detection module enables rapid fault identification and backup motor activation. The parallel operation of multiple heterogeneous observers embodies the core redundancy strategy of “multi-algorithm parallelism and voting logic” described in the table, further improving detection accuracy and system reliability.
However, the system’s performance is still affected by model accuracy, especially as system complexity increases. Future work will focus on developing more detailed motor models and advanced fault detection algorithms that are robust to model uncertainties. Comprehensive failure mode analysis and experimental validation will be conducted to ensure that the proposed approach provides more accurate and reliable results under realistic operating conditions. These improvements are expected to further enhance system performance, reliability, robustness, and cost-effectiveness through continued design optimization.
Author Contributions
Conceptualization, L.M.; Methodology, C.M.; Resources, J.Y.; Validation, C.M.; Writing—Original Draft, C.M.; Writing—Review and Editing, L.M. and J.Y. All authors have read and agreed to the published version of the manuscript.
Funding
This research received no external funding.
Data Availability Statement
The data presented in this study are available on request from the corresponding author.
Conflicts of Interest
The authors declare no conflicts of interest.
Appendix A
Table A1.
BLDC motor parameters [21].
Table A1.
BLDC motor parameters [21].
| Motor friction and viscous losses coefficient B (N m sec) | 0.15 |
| Voltage constant Ke (V rad/s) | 1.2 |
| Torque SI unit conversion constant c (lb − ft Nm) | 0.7374 |
| Armature resistance Ra (Ohms) | 0.6187 |
| Inertia of the high speed drive components drive system gear ratio r squared Jr2 (slug ft2) | 30 |
| Armature inductance La (millihenry mH) | ≈0 |
| Rotor rotational moment of inertia Ir (slug ft2) | 101.968 |
References
- Su, J.; Huang, H.; Zhang, H.; Wang, Y.; Wang, F.Y. eVTOL performance analysis: A review from control perspectives. IEEE Trans. Intell. Veh. 2024, 9, 4877–4889. [Google Scholar] [CrossRef]
- Solís, R.; Torres, L.; Pérez, P. Review of methods for diagnosing faults in the stators of BLDC motors. Processes 2023, 11, 82. [Google Scholar] [CrossRef]
- Lavigne, L.; Zolghadri, A.; Goupil, P.; Simon, P. Oscillatory failure case detection for new generation airbus aircraft: A model-based challenge. In Proceedings of the 47th IEEE Conference on Decision and Control, Cancun, Mexico, 9–11 December 2008; IEEE Press: New York, NY, USA, 2008; pp. 1249–1254. [Google Scholar]
- El Mekki, A.; Saad, K.B. Diagnosis based on a sliding mode observer for an inter-turn short circuit fault in brushless dc motors. Rev. Roum. Des Sci. Technol. Electrotech. Energétique 2018, 63, 391–396. [Google Scholar]
- Moseler, O.; Isermann, R. Application of model-based fault detection to a brushless DC motor. IEEE Trans. Ind. Electron. 2000, 47, 1015–1020. [Google Scholar] [CrossRef]
- Zhang, K.; Jiang, B.; Yan, X.-G.; Mao, Z. Incipient fault detection for traction motors of high-speed railways using an interval sliding mode observer. IEEE Trans. Intell. Transp. Syst. 2019, 20, 2703–2714. [Google Scholar] [CrossRef]
- Hosseini, F.; Abedi, M.; Mohammad Hosseini, S. Classification of multiple electromechanical faults in BLDC motors using neural networks and optimization algorithms. Res. Technol. Electr. Ind. 2023, 2, 97–107. [Google Scholar]
- Hoenicke, P.; Ghosh, D.; Muhandes, A.; Bhattacharya, S.; Bauer, C.; Kallo, J.; Willich, C. Power management control and delivery module for a hybrid electric aircraft using fuel cell and battery. Energy Convers. Manag. 2021, 244, 114445. [Google Scholar] [CrossRef]
- Lewis, D.D.; Badewa, O.A.; Mohammadi, A.; Vatani, M.; Ionel, D.M. Fault tolerant electric machine concept for aircraft propulsion with pm rotor and dc current stator dual-stage excitation. In Proceedings of the 12th International Conference on Renewable Energy Research and Applications (ICRERA), Oshawa, ON, Canada, 29 August–1 September 2023; IEEE: Piscataway, NJ, USA, 2023; pp. 607–611. [Google Scholar]
- European Union Aviation Safety Agency. Second Publication of Proposed Means of Compliance with the Special Condition VTOL:No:MOC-2 SC-VTOL; European Union Aviation Safety Agency: Cologne, Germany, 2021; pp. 1–94.
- Pavel, M.D. Understanding the control characteristics of electric vertical take-off and landing (eVTOL) aircraft for urban air mobility. Aerosp. Sci. Technol. 2022, 125, 107143. [Google Scholar] [CrossRef]
- Hendricks, E.S.; Aretskin-Hariton, E.; Ingraham, D.; Gray, J.S.; Schnulo, S.L.; Chin, J.; Falck, R.; Hall, D. Multidisciplinary optimization of an electric quadrotor urban air mobility aircraft. In Proceedings of the AIAA Aviation Forum, Reston, VA, USA, 15–19 June 2020; AIAA Aviation Forum: Reston, VA, USA, 2020; p. 3176. [Google Scholar]
- Mills, B.; Datta, A. Analysis of a permanent magnet synchronous motor coupled to a flexible rotor for electric VTOL. In Proceedings of the Annual Forum Proceedings-American Helicopter Society International, Philadelphia, PA, USA, 14–17 May 2018; American Helicopter Society International: Fairfax, VA, USA, 2018; pp. 1–14. [Google Scholar]
- Withrow-Maser, S.; Malpica, C.; Nagami, K. Impact of handling qualities on motor sizing for multirotor aircraft with urban air mobility missions. In Proceedings of the Vertical Flight Society’s 77th Annual Forum & Technology Display, Fairfax, VA, USA, 10–14 May 2021; The Vertical Flight Society: Fairfax, VA, USA, 2021; pp. 1653–1675. [Google Scholar]
- Jin, J. Fault Detection of an actuator with dual type motors and one common motion sensor. Electronics 2022, 11, 3338. [Google Scholar] [CrossRef]
- Huang, S.; Tan, K.K.; Lee, T.H. Fault diagnosis and fault-tolerant control in linear drives using the Kalman filter. IEEE Trans. Ind. Electron. 2012, 59, 4285–4292. [Google Scholar] [CrossRef]
- Frank, P.M. Enhancement of robustness in observer-based fault detection. Int. J. Control. 1994, 59, 955–981. [Google Scholar] [CrossRef]
- Hu, B.; Seiler, P.J. Certification analysis for a model-based UAV fault detection system. In Proceedings of the AIAA Guidance, Navigation, and Control Conference, National Harbor, MD, USA, 13–17 January 2014; AIAA: Reston, VA, USA, 2014; p. 610. [Google Scholar]
- Kotikalpudi, A.; Danowsky, B.P.; Seiler, P.J. Reliability analysis for small unmanned air vehicle with algorithmic redundancy. In Proceedings of the AIAA Scitech 2020 Forum, Orlando, FL, USA, 6–10 January 2020; AIAA: Reston, VA, USA, 2020; p. 739. [Google Scholar]
- Medeiros, R.L.; Filho, A.C.L.; Ramos, J.G.S.; Nascimento, T.P.; Brito, A.V. A novel approach for speed and failure detection in brushless DC motors based on chaos. IEEE Trans. Ind. Electron. 2018, 66, 8751–8759. [Google Scholar] [CrossRef]
- Malpica, C.; Withrow-Maser, S. Handling qualities analysis of blade pitch and rotor speed controlled eVTOL quadrotor concepts for urban air mobility. In Proceedings of the Vertical Flight Society International Powered Lift Conference 2020, San Jose, CA, USA, 21–23 January 2020. [Google Scholar]
Disclaimer/Publisher’s Note: The statements, opinions and data contained in all publications are solely those of the individual author(s) and contributor(s) and not of MDPI and/or the editor(s). MDPI and/or the editor(s) disclaim responsibility for any injury to people or property resulting from any ideas, methods, instructions or products referred to in the content. |
© 2025 by the authors. Licensee MDPI, Basel, Switzerland. This article is an open access article distributed under the terms and conditions of the Creative Commons Attribution (CC BY) license (https://creativecommons.org/licenses/by/4.0/).