Article

SHM for Complex Composite Aerospace Structures: A Case Study on Engine Fan Blades

by
Georgios Galanopoulos
1,
Shweta Paunikar
2,
Giannis Stamatelatos
3,
Theodoros Loutas
3,
Nazih Mechbal
2,
Marc Rébillat
2 and
Dimitrios Zarouchas
1,*
1
Center of Excellence in Artificial Intelligence for Structures, Prognostics & Health Management, Aerospace Engineering Faculty, Delft University of Technology, Kluyverweg 1, 2629 HS Delft, The Netherlands
2
Laboratoire Procédés et Ingénierie en Mécanique et Matériaux, Arts et Métiers Institute of Technology, CNRS, CNAM, HESAM University, Boulevard de l’Hospital 151, 75013 Paris, France
3
Department of Mechanical Engineering and Aeronautics, University of Patras, Rio Campus, 265 04 Patras, Greece
*
Author to whom correspondence should be addressed.
Aerospace 2025, 12(11), 963; https://doi.org/10.3390/aerospace12110963 (registering DOI)
Submission received: 19 September 2025 / Revised: 19 October 2025 / Accepted: 21 October 2025 / Published: 28 October 2025
(This article belongs to the Section Aeronautics)

Abstract

Composite engine fan blades are critical aircraft engine components, and their failure can compromise the safe and reliable operation of the entire aircraft. To enhance aircraft availability and safety within a condition-based maintenance framework, effective methods are needed to identify damage and monitor the blades’ condition throughout manufacturing and operation. This paper presents a unique experimental framework for real-time monitoring of composite engine blades utilizing state-of-the-art structural health monitoring (SHM) technologies, discussing the associated benefits and challenges. A case study is conducted on a representative Foreign Object Damage (FOD) panel, a substructure of a LEAP (Leading Edge Aviation Propulsion) engine fan blade, which is a curved, 3D-woven Carbon Fiber Reinforced Polymer (CFRP) panel with a secondary bonded steel leading edge. The loading scheme involves incrementally increasing, cyclic 4-point bending (loading–unloading) to induce controlled damage growth, simulating in-operation conditions and allowing evaluation of flexural properties before and after degradation. External damage, simulating foreign object impact common during flight, is introduced using a drop tower apparatus either before or during testing. The panel’s condition is monitored in-situ and in real time by two types of SHM sensors: screen-printed piezoelectric sensors for guided ultrasonic wave propagation studies and surface-bonded Fiber Bragg Grating (FBG) strain sensors. Experiments are conducted until panel collapse, and degradation is quantified by the reduction in initial stiffness, derived from the experimental load-displacement curves. This paper aims to demonstrate this unique experimental setup and the resulting SHM data, highlighting both the potential and challenges of this SHM framework for monitoring complex composite structures, while an attempt is made at correlating SHM data with structural degradation.

1. Introduction

Structural health monitoring (SHM) of composite materials has gained increasing research attention over recent decades, driven by the demand for enhanced structural safety and availability. Current maintenance strategies involve preventive or corrective maintenance actions, which in the first case can lead to significant downtime of aircraft and high costs by replacing parts that do not yet need replacing, while in the second case parts are repaired or replaced after failure has occurred which can lead to unsafe operation. At the same time, some types of structural, subsurface damage may remain undetected by routine inspections (usually visual), possibly leading to reduced airworthiness or unexpected failure. Real-time data from SHM sensors can reduce the intervals, downtime, and costs associated with traditional inspections and maintenance (preventive or corrective). Furthermore, SHM improves the probability of early damage detection, thereby helping to prevent unexpected or catastrophic failures [1]. By enabling the monitoring of both localized areas and entire structures to detect, localize, quantify, and track damage and its propagation [2,3,4,5], SHM serves as a crucial tool for transitioning towards condition-based maintenance (CBM) schemes.
An intelligent sensor network represents the foundational step towards CBM and the development of intelligent structures [6]. The ultimate goal of SHM extends beyond detecting surface and subsurface damage; it aims to provide insights into damage size and location (diagnostics) and to estimate the remaining operational life (prognostics) using SHM data. This information is invaluable for optimizing maintenance planning and improving fleet availability.
A reliable and resilient sensing infrastructure is vital for such endeavors. An intelligently designed and strategically deployed network of SHM sensors enhances the overall sensing capabilities of the SHM framework and increases the probability of damage being detected. Such a network provides the necessary data on abnormalities and degradation, which can then be transformed into actionable information about the structure’s condition.
Composite components, prevalent in aerospace applications, can benefit significantly from SHM systems, as demonstrated by various applications discussed in the literature [7]. However, the structural reliability of aircraft engines —critical aircraft systems whose safe and reliable operation is mandatory— remains an underrepresented area in SHM research.
The recently developed LEAP (Leading Edge Aviation Propulsion) engine, for instance, features fan blades with a hybrid metal–composite design. These blades consist of a 3D-woven Carbon Fiber Reinforced Polymer (CFRP) body supplemented by a titanium leading edge (LE), offering a stronger, more durable, and lightweight structure compared to traditional fully metallic fan blades. Despite these advantages, these composite blades are vulnerable to Foreign Object Damage (FOD), which can significantly reduce their structural integrity and compromise operational safety.
Impact damage can create subsurface defects that may go unnoticed during routine inspections. Such hidden damage can substantially reduce the structure’s load-bearing capabilities and accelerate its degradation rate [8,9]. Consequently, impacts can initiate the complex and overlapping composite damage mechanisms —such as delamination, fiber/matrix cracking [10], and potential debonding between the composite body and the LE— all of which adversely affect operational reliability. Common and often unexpected impact events during aircraft operation include encounters with debris, hail, and bird strikes, any of which can compromise the functionality and safety of the entire engine.
Engine blades are often expected to remain operational despite sustaining some level of damage. A critical issue arises when this damage is barely visible and thus goes undetected during routine inspections, potentially endangering safe operation during subsequent flights. The FOD panel investigated in this study is a representative substructure of a LEAP engine fan blade. Such panels are utilized by Original Equipment Manufacturers (OEMs) in the validation and verification processes for engine blades to ensure they can withstand impacts and the resultant damage without compromising the engine’s safe operation.
In the context of CBM, the structural integrity of components like the FOD panel can be monitored in real time using a network of SHM sensors. These systems can aid in detecting damage and estimating the time to failure, thereby enhancing the safe operation of engines and increasing aircraft availability [11]. Consequently, monitoring damage to ensure the safe and reliable operation of fan blades is of paramount importance [12,13].
Within the broader scope of safe operation and equipment lifecycle management, onboard SHM sensors can improve reliability from the manufacturing stage —where initial defects and critical points can be identified [14]— through to the equipment’s end-of-life stage, when repair or replacement becomes necessary [15]. The focus of the present work is primarily on the operational phase leading to end-of-life considerations.
Over the years, several SHM sensor technologies have been developed and researched for monitoring (intelligent) composite structures. Among the most popular are acoustic emission (AE) [16,17], guided waves (GWs) [18,19,20], and fiber optic sensors (FOSs) [14,21,22,23,24]. Each technology possesses distinct strengths and weaknesses that determine its suitability and effectiveness for various applications. This research employs two primary sensor technologies: GWs generated by novel screen-printed piezoelectric transducers (PZTs) and strain data acquired from FOSs. While both offer significant advantages for SHM, they also present notable drawbacks. Therefore, employing multiple SHM sensor types is often considered to leverage their respective strengths and mitigate their weaknesses [25].
Guided waves, covering a broad range of frequencies and generated using various piezoelectric transducers, are extensively used in SHM studies for both isotropic and anisotropic materials. However, GW responses in composites are inherently complex due to their anisotropic nature, material damping, and multi-modal dispersion characteristics. This complexity is further compounded by mode conversions and reflections arising from defects and geometric variations within the structures. Numerous comprehensive reviews have been published over the years, covering topics such as GW techniques, analytical and numerical modeling, signal processing, sensor technologies, damage detection and localization strategies, applications to real-world structures, environmental influences, damage features, and machine learning approaches for GW-based SHM [26,27,28,29].
Several studies have evaluated the diagnostic capabilities of GWs, focusing on their ability to locate and detect various defect types, including impact damage, cracks, and delamination, using either analytical methods [30,31,32,33,34] or machine learning approaches [35,36]. An alternative approach involves using GWs to estimate structural stiffness [37,38], often accompanied by Remaining Useful Life (RUL) estimations—a critical step towards CBM. Numerical methods can aid in better understanding GW behavior in composites, as demonstrated in [39,40]. As models increase in complexity, physics-informed neural networks and deep learning techniques can be enlisted for improved accuracy and performance [41]. Overall, GWs offer a promising sensing solution for both diagnostic and prognostic tasks. Nevertheless, challenges such as optimal sensor placement for damage localization [42,43] and the sensitivity of GWs to operational and environmental conditions remain significant, particularly for complex composite structures. Further studies are needed to provide insights into optimal sensor placement and to enhance sensor durability and reliability.
The application of Fiber Bragg Grating (FBG) sensors in SHM has been demonstrated in numerous studies. However, most research focuses on diagnostics, with fewer investigations into prognostics [44,45]. Both primarily utilize FOSs as strain sensors. The technology’s flexibility also allows for dynamic vibration sensing [46,47]. Key advantages of FBGs (and FOSs in general) include their low weight, small size, and immunity to electromagnetic interference, making them suitable SHM solutions for diverse applications and operational environments [48].
A common practice for identifying damage involves comparing strain values (or reflected wavelength spectra differences) between a baseline (healthy) condition and the current (damaged) state [49,50,51]. Some case studies also consider different operational conditions, such as varying loads or environmental factors [23,24]. More advanced methodologies, including principal component analysis [52,53] and machine learning techniques [54,55,56], have been employed to identify and distinguish various damage types. Efforts to address variable operational conditions were made in [57,58], aiming to reduce the impact of fluctuating loading conditions and develop health indicators for prognostics. However, these studies showed that raw strain values still influence health indicator quality and, consequently, prognostic performance. A comprehensive overview of FBG sensors for aerospace structures can be found in [44].
As previously mentioned, foreign object impacts on fan blades, common during take-off and landing, directly affect engine integrity. Aviation authorities impose strict regulations to ensure safe and reliable engine operation. While several researchers have discussed SHM applications in composite structures [59,60], to the authors’ knowledge, limited research has specifically addressed the structural health monitoring of composite engine fan blades.
This paper presents an experimental study on demonstrator composite FOD panels equipped with state-of-the-art SHM sensors to monitor structural integrity under mechanical loading. Two types of SHM systems are used, FBG sensors and PZT transducers. This combination of different sensor types aims to improve the detection and growth monitoring of damage, by taking advantage of the strengths and detection capabilities of the different sensor types. An incrementally severe, cyclic loading scheme is employed to induce controlled damage growth and degradation, stemming from impact-induced damage introduced either at the beginning of or during the experiment. This work details the experimental investigation and the sensing framework for the SHM of composite structures representative of engine fan blades, and attempts to correlate SHM data with quantified degradation. Degradation is assessed by the experimental stiffness loss. The presented results are intended not as an exhaustive analysis or definitive proof of concept for the SHM framework, but rather to highlight the challenges and opportunities in employing SHM for complex structures and in correlating SHM data with degradation, while also serving as a robust explanation for the database [61].
The remainder of this paper is organized as follows: Section 2 details the specifications of the FOD panels and the experimental campaign. Section 3 presents and discusses the comparative results. Finally, Section 4 provides the conclusions of this study.

2. Case Study

2.1. FOD Panel Definition

The FOD panels investigated in this study consist of a curved, 3D-woven hlCFRP body with a nominal length of 800 mm and a width of 350 mm. Each FOD panel is completed by a secondary bonded steel LE with a width of 50 mm, adhered to the edge of the CFRP body. The cross-sectional thickness of the FOD panel is variable: the LE (including the steel component) and trailing edge have thicknesses of 6.3 mm and 2.8 mm, respectively, while the middle section reaches a maximum thickness of approximately 10.8 mm.
The panels are manufactured using a resin transfer molding (RTM) technique. Notably, some optical fibers intended for SHM are embedded by being sown into the preforms prior to resin injection. This integration offers the potential advantage of monitoring the manufacturing process, assessing blade quality, and detecting abnormalities during RTM. A schematic representation of the panel and a photograph of an actual FOD panel are provided in Figure 1. The unique aspects of this panel include its complex geometry and its distinct response to flexural loading. Due to its double curved surface, the panel exhibits non-linear buckling behavior under load, leading to significant deformation that substantially affects the internal strain and stress fields, as will be demonstrated in Section 3.

2.2. Experimental Campaign

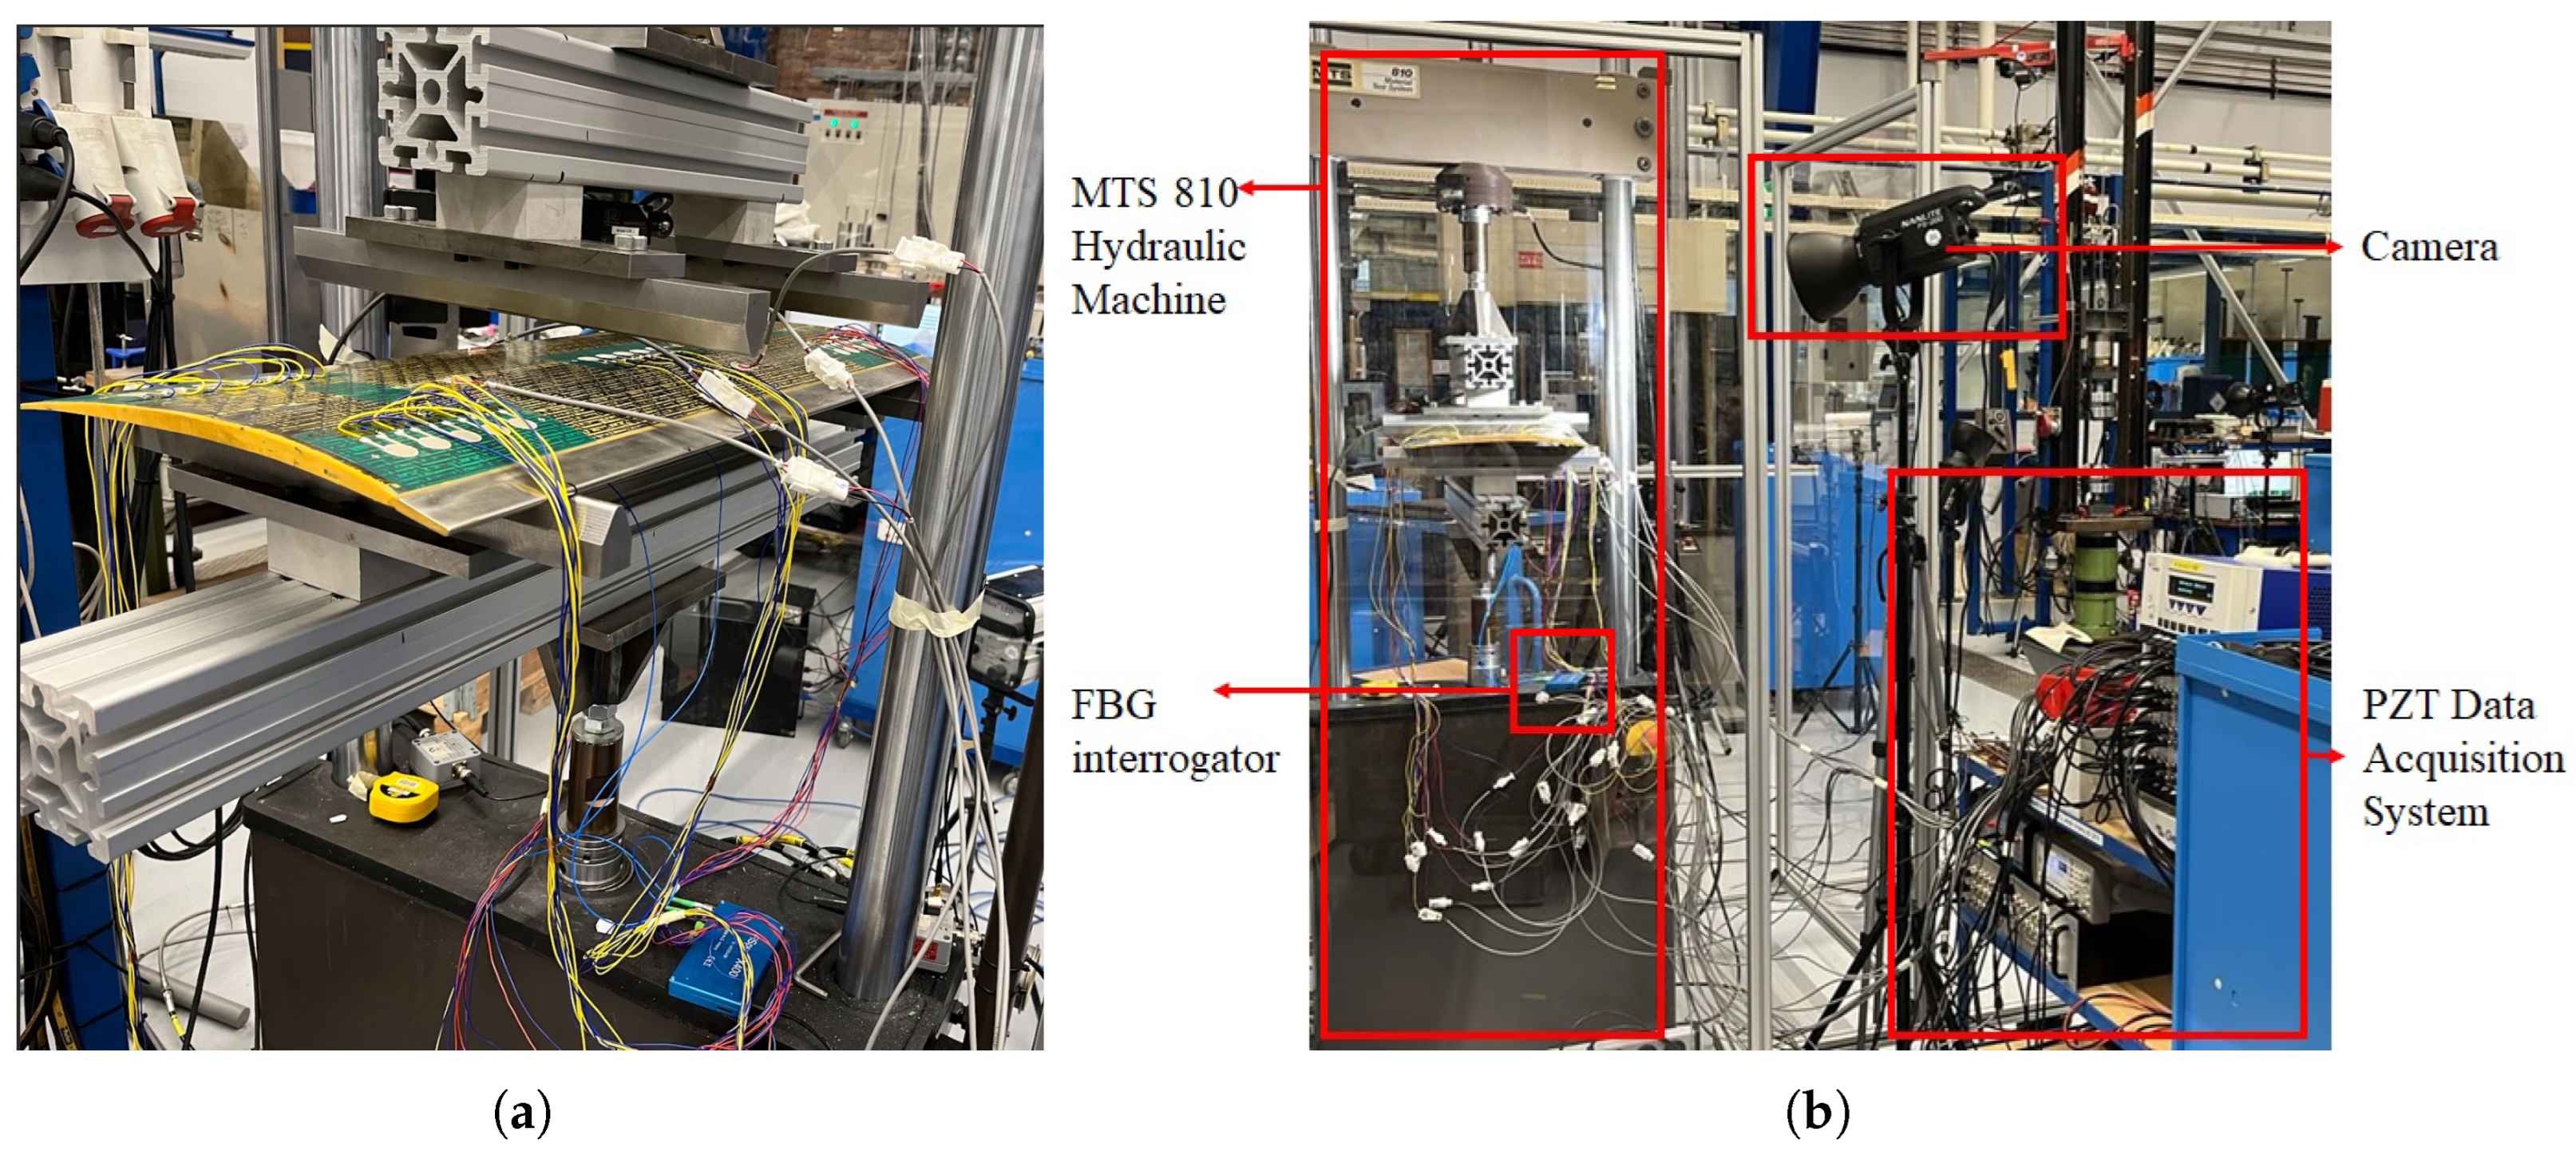
A total of 6 (1 under a quasi-static regime and 5 under a cyclic regime) FOD panels were tested using an MTS 810 hydraulic machine equipped with a 100 kN load cell. A 4-point bending, displacement controlled loading scheme was applied, with support and loading pin locations selected according to the ASTM D7264/D7264M–07 standard [62]. A pin radius of 6 mm was chosen based on a preliminary finite element analysis, which indicated this radius would yield the highest failure load compared to other radii investigated; this selection was guided solely by the maximum failure load criterion. This loading scheme was selected to simulate realistic operational loads while enabling the evaluation of the flexural stress/strain response before and after the occurrence of internal damage and/or the introduction of external damage.
Two SHM sensor systems were employed to monitor the FOD panel: Fiber Optic Sensors (FOSs) in the form of Fiber Bragg Grating (FBG) sensors, and printed piezoelectric transducer (PZT) sensors. Up to 8 FBG sensors are engraved per optical fiber, with a central wavelength from 800 to 900 nm. Temperature compensation and wavelength conversion factors are pre-calibrated the manufacturer for this specific application. PZT sensors are fabricated using the state-of-the-art screen-printing technology in 3 layers comprising a top electrode, a central sensing piezoelectric layer, and a bottom electrode. Both the electrodes are printed using a silver conductive paste, 1901-SB by ESL Europe. The piezoelectric layers were printed using a lacquer from the ALGRA Group [63]. All the pastes used in this process consist of a binder system, elemental or pre-alloyed powders, and some additives. The complete experimental setup is depicted in Figure 2. A 4-channel FiSpec FBGx400 interrogator from FiSens GmbH (Braunschweig, Germany) with an acquisition frequency of 1 Hz was used. For the PZTs an analog waveform generator was used to send the Lamb wave signal and the PZTs are also connected to a 32-channel HBM Nicolet data acquisition system, and HBM Perception data acquisition software is used to record the signals.
As previously mentioned, some optical fibers were embedded into the preforms before the RTM process, while additional FOSs were adhesively bonded to the bottom surface of the panel using an instantaneous strain gauge adhesive cured at room temperature. Due to the fragile nature of optical fibers, the high pressure applied during resin injection, and the de-molding process, most of the embedded FBGs were unfortunately destroyed. It is hence observed that while FOSs are a valuable tool, they are fragile and prone to breaking, limiting their widespread application in field conditions. Consequently, due to this loss and variations in the specifications of the available optical fibers (e.g., different lengths and number of FBG sensors per fiber), different sensor configurations and locations were utilized for the surviving and surface-mounted sensors. However, care was taken to ensure that sensor locations were primarily between the support pins— where deformation is largest— and, along the panel’s width, at three preferred regions: near the trailing edge, near the leading edge, and at the center of the panel.
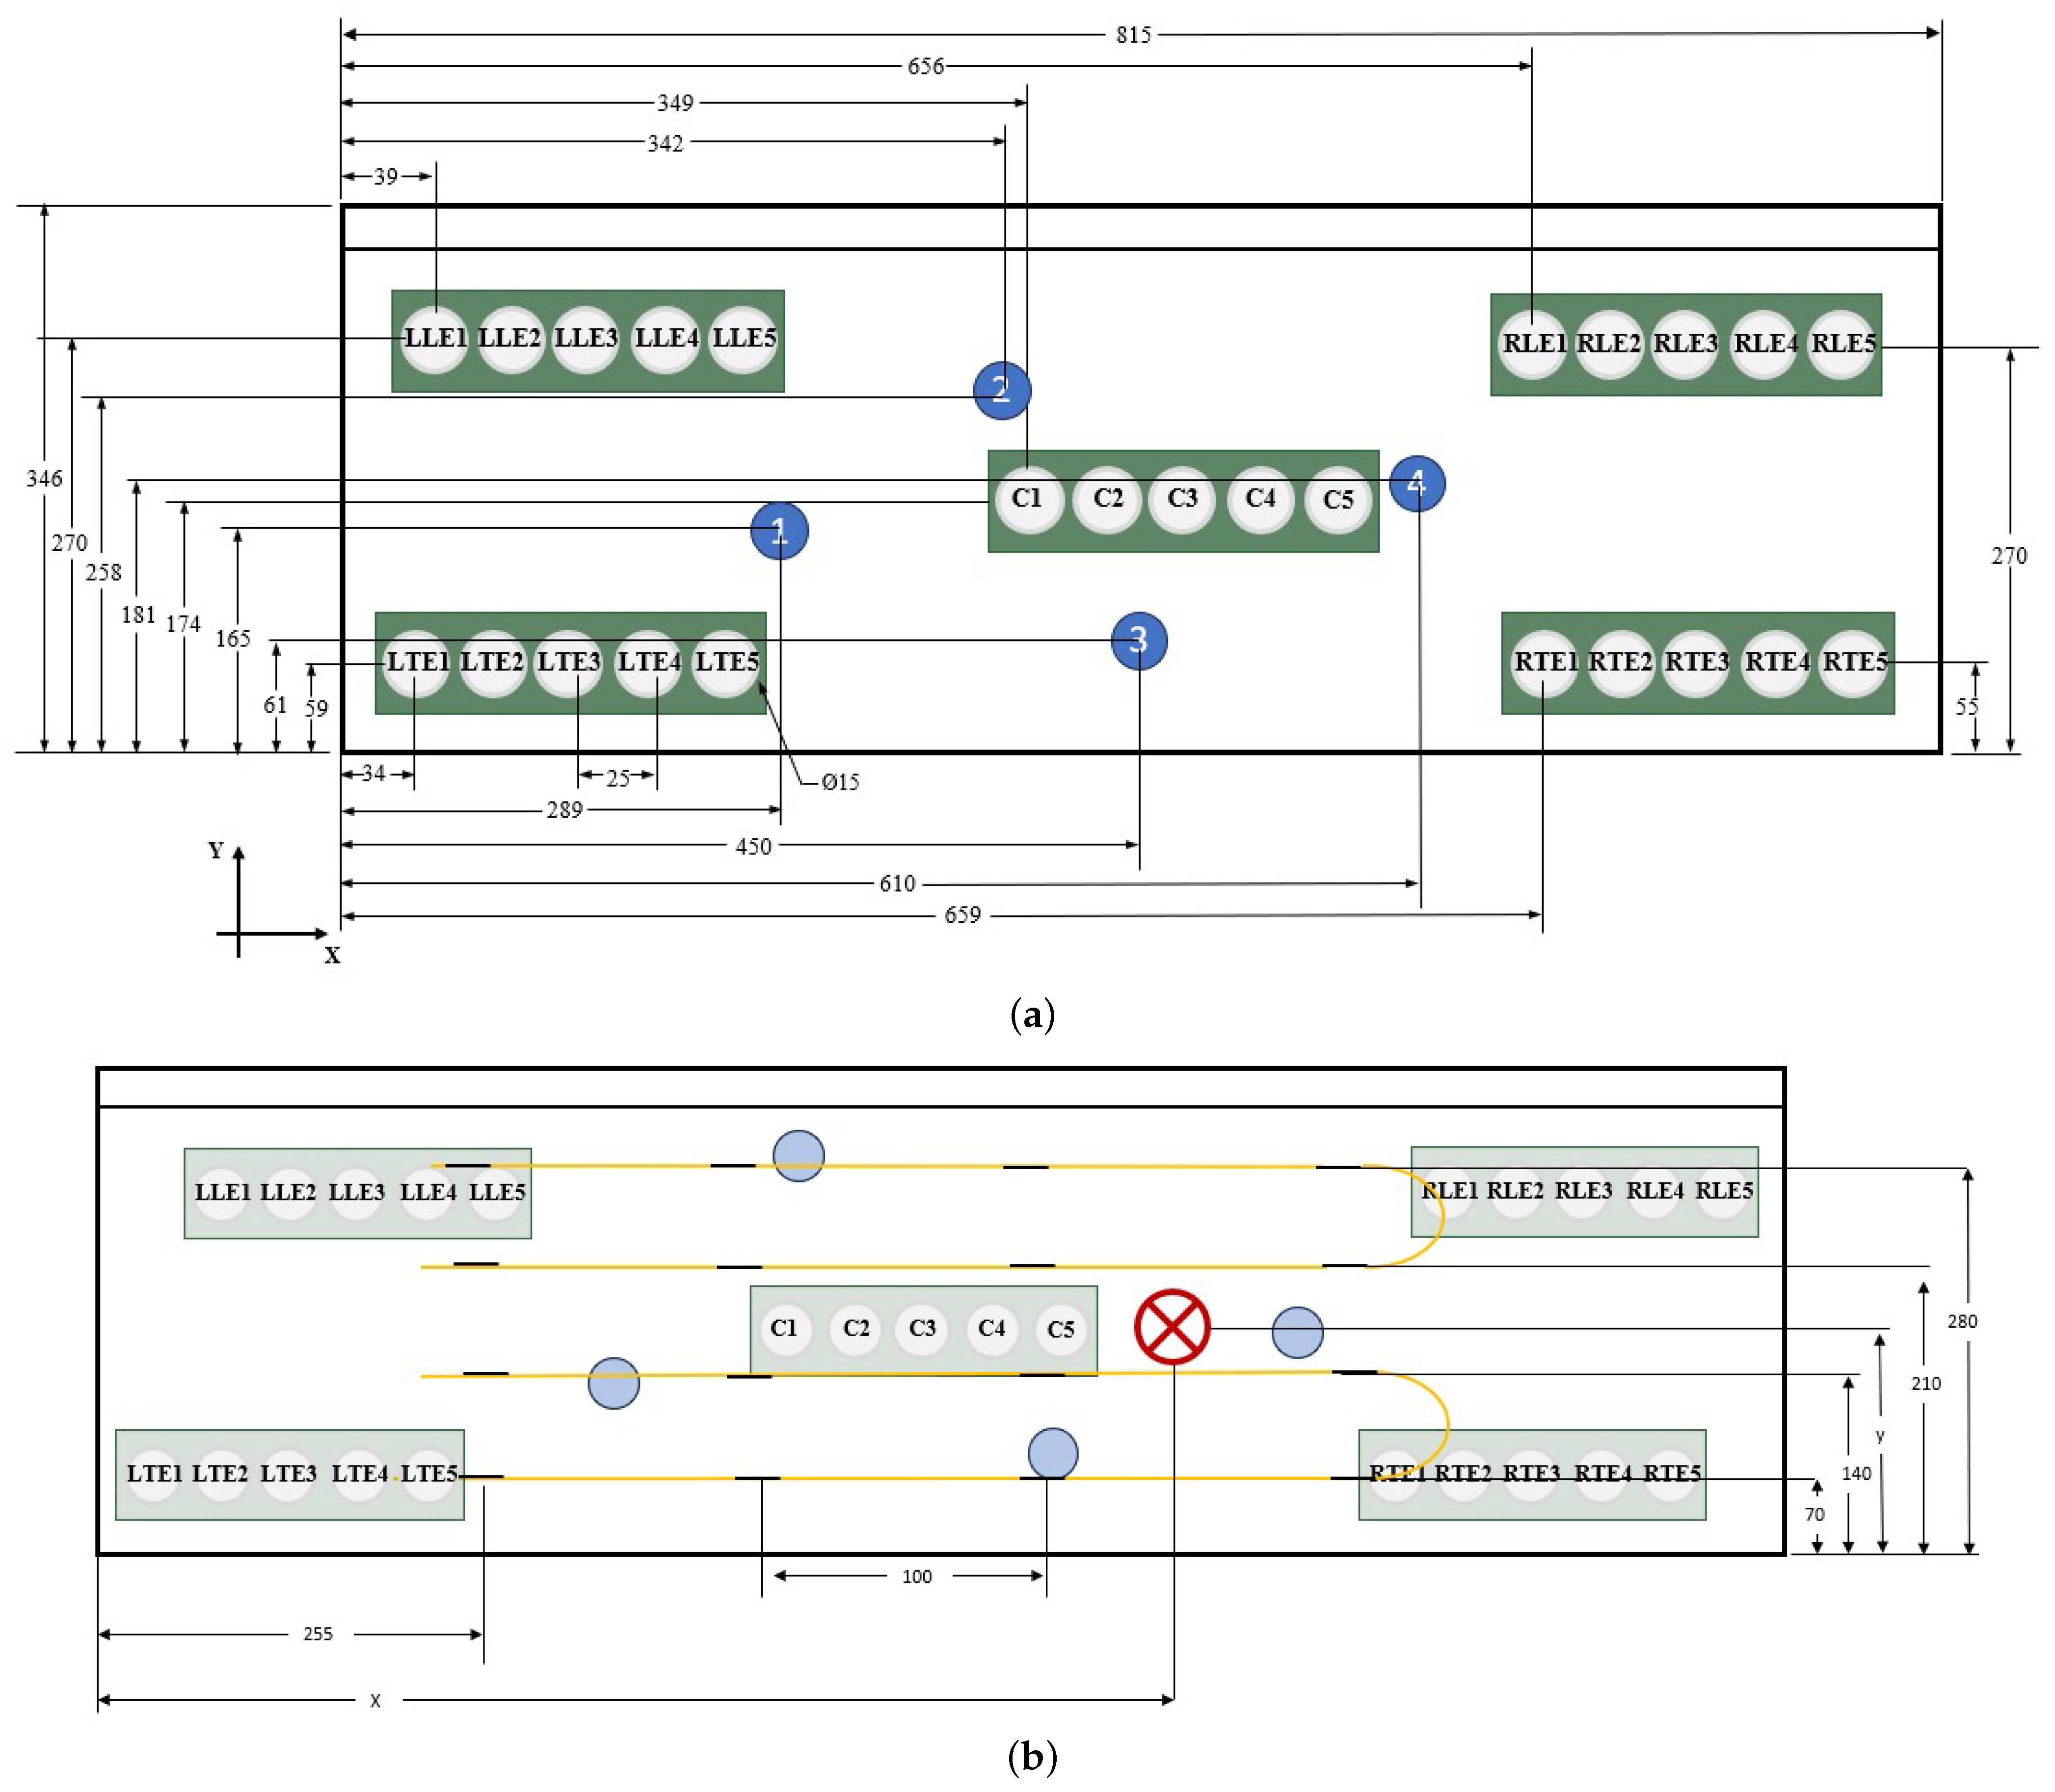
In addition to the novel screen-printed PZT sensors, conventional ceramic PZT transducers were used. Similar to the approach for embedding optical fibers, a state-of-the-art screen-printing technology was employed in this project, for the first time to our knowledge, to print PZT sensors directly onto the FOD panel surface after the RTM process. These printed PZT sensors, with a diameter of 15 mm and a thickness of approximately 135 μm, were used for measuring guided wave propagation in the panel. The printed PZTs were arranged in five arrays, each containing five sensors. These arrays were located approximately symmetrically near the four corners and at the center of each FOD panel, totaling 25 printed PZTs per panel. Supplementing these, four conventional PZT transducers were bonded using acrylic glue around the middle portion of the FOD panel, forming the vertices of an imaginary quadrilateral. A schematic of the sensor positioning is provided in Figure 3. A camera was also used to capture images of the middle top section of the FOD panels to observe damage evolution throughout the tests.
To determine the experimental collapse load, one FOD panel, not equipped with SHM sensors, was subjected to quasi-static 4-point bending until failure. This test was conducted in 11 steps, as detailed in Table 1, with a fixed loading rate of 10 mm/min. Before unloading at each step, the panel was held at the maximum load for 1.5 s to allow for photographic documentation of the top surface to monitor damage initiation and progression. Failure of this panel occurred at approximately 27 kN. Based on this result, the loading rate for the subsequent cyclic tests was adjusted according to the load level to ensure each cycle was completed in approximately 1 min (corresponding to a frequency of 0.3 Hz). The specific rate for each load level is provided in Table 1.
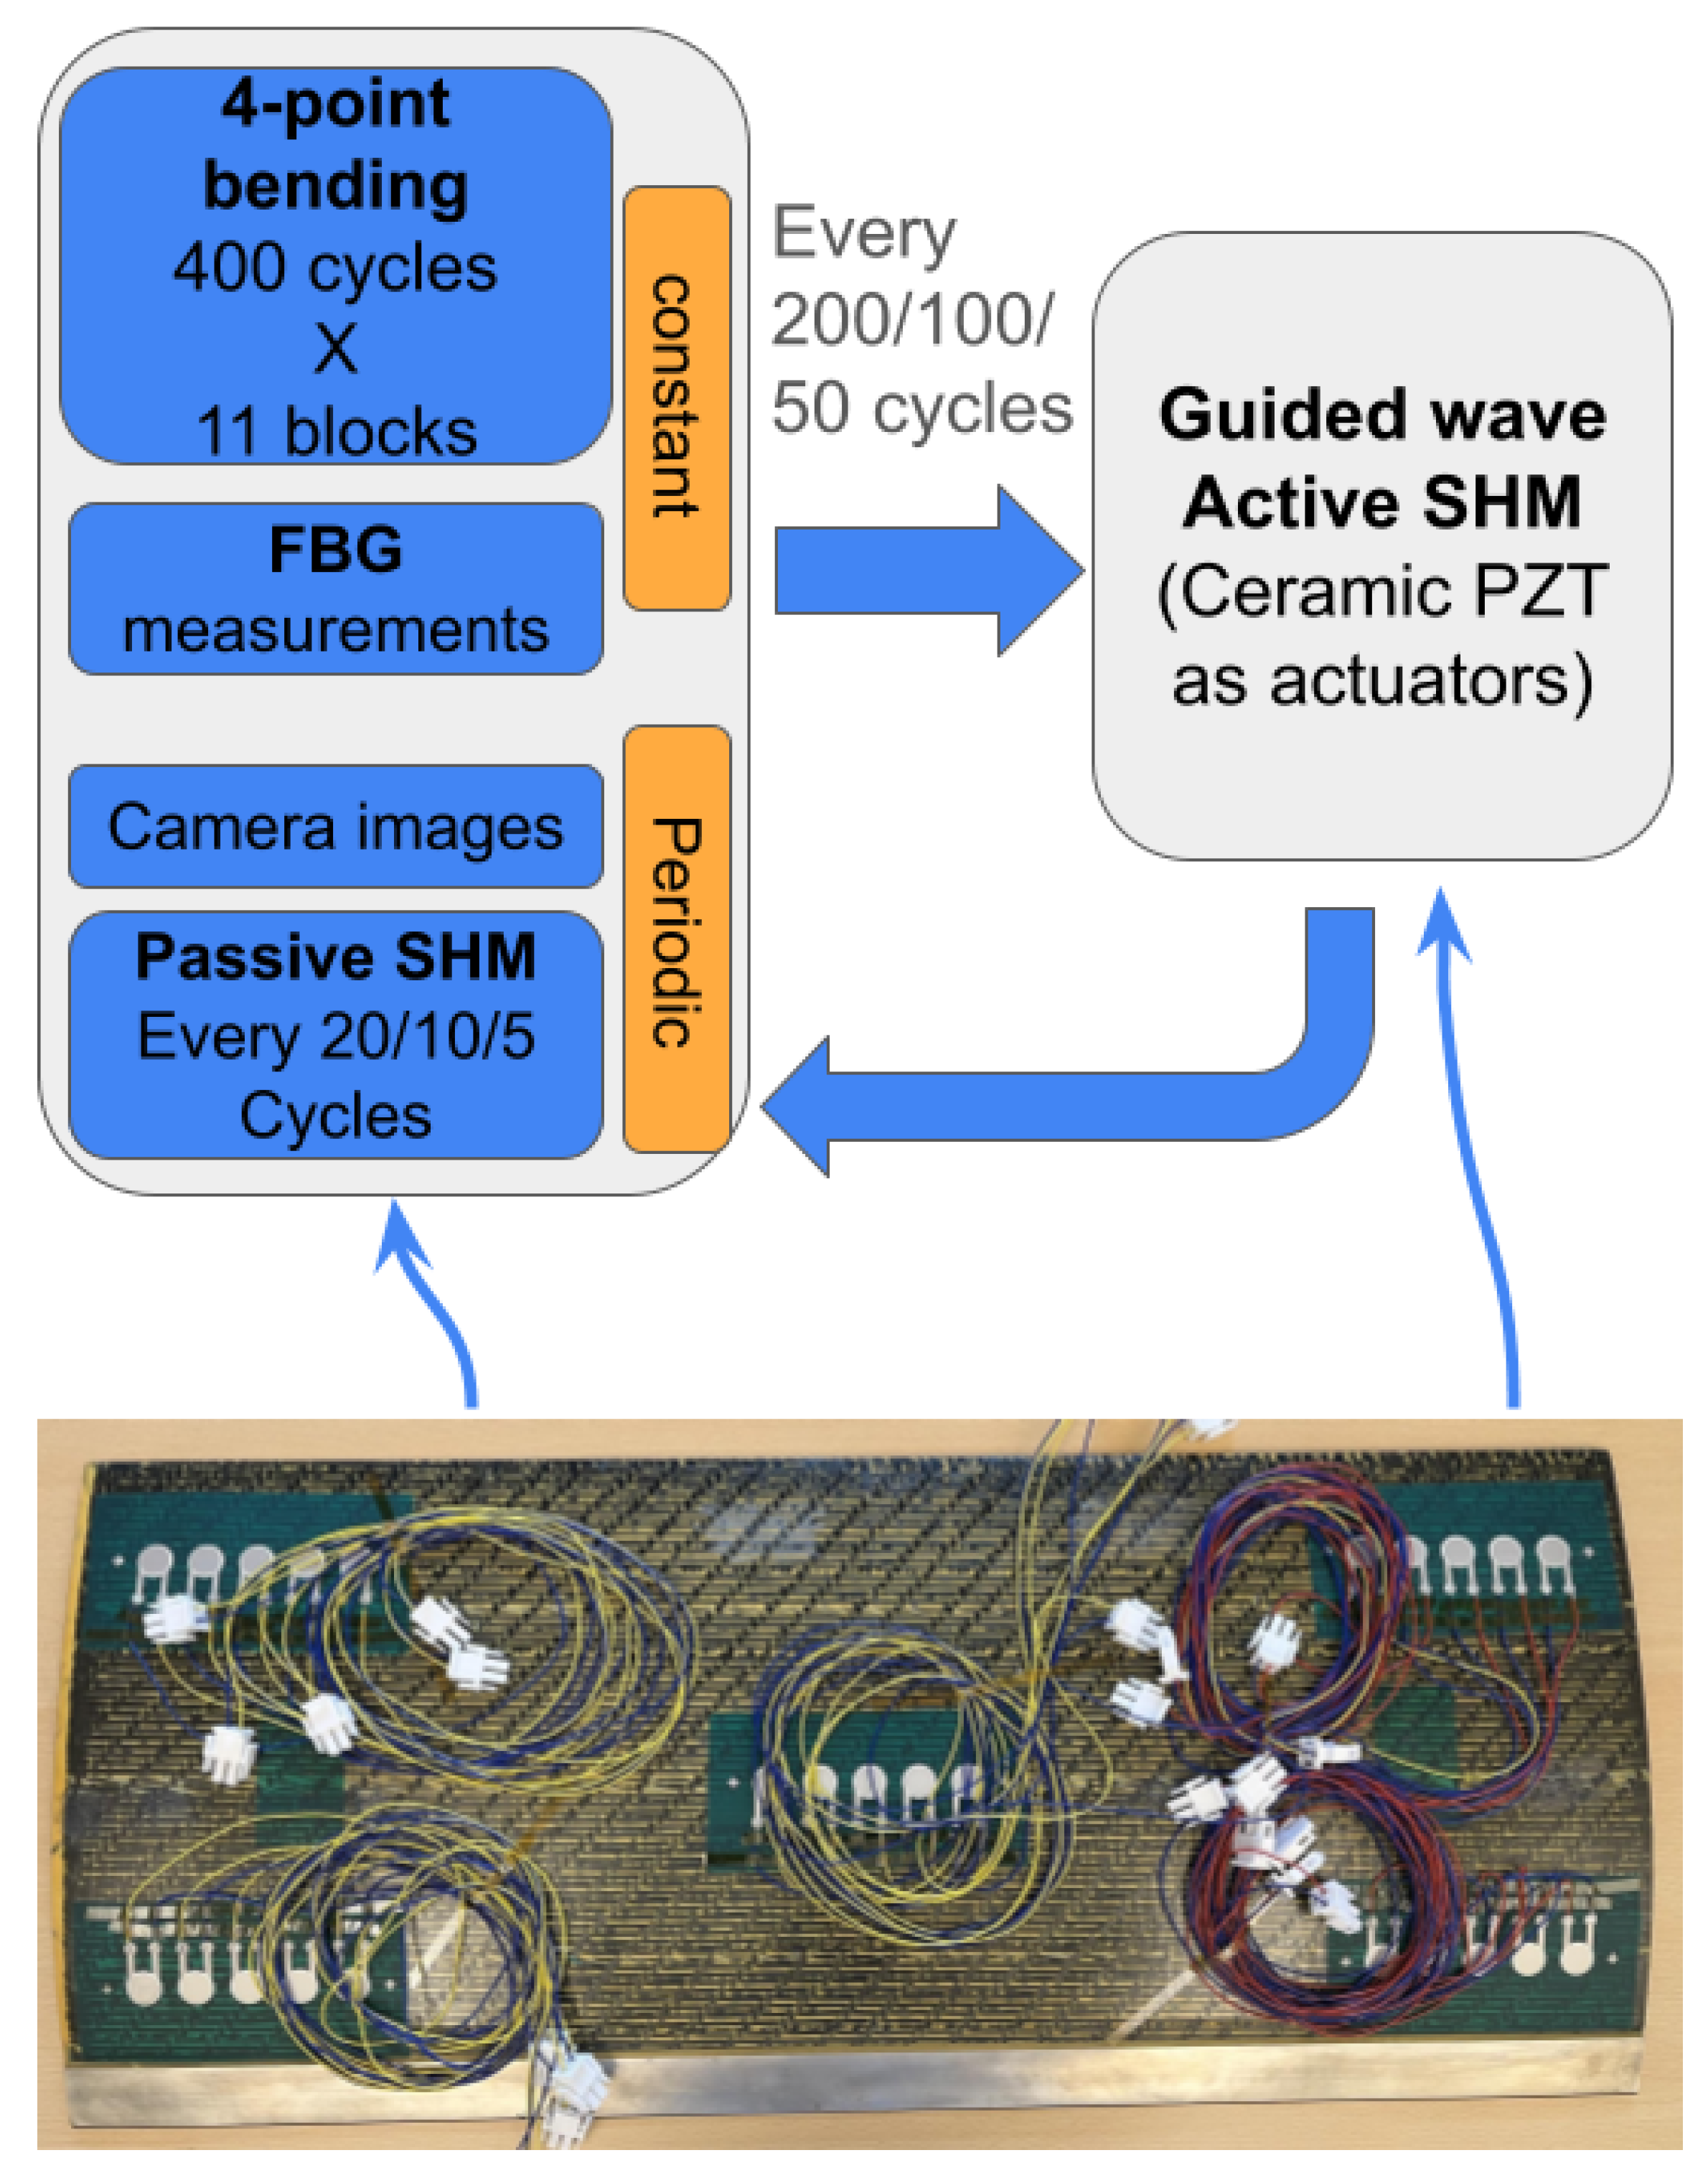
The remaining 5 FOD panels followed a similar loading scheme but with the number of repetitions increased to 400 per load step. Given the extensive duration of these tests, guided wave measurements were performed at periodic intervals. This strategy aimed to limit the volume of data generated while still capturing data across numerous degradation states. These periodic intervals, termed “blocks”, were defined as a specific number of loading–unloading cycles per load step. The size of these blocks (i.e., the number of cycles) was predetermined and varied as load severity increased, reflecting the rising probability of total failure with each successive load step. Specifically, blocks were sized at 200, 100, and 50 cycles for load steps up to 18 kN, 22 kN, and 26 kN, respectively. For guided Lamb wave measurements, performed at the end of each block, the FOD panel was maintained in a minimally loaded state (0.5 kN) between the pins. Five excitation frequencies—50, 100, 150, 200, and 250 kHz—were used, with each of the four ceramic PZTs acting as an actuator individually in a serial manner. Ten measurement repetitions were performed for each actuator–frequency combination, with signals sampled at 1 MHz, yielding 40 measurements per frequency for each sensing PZT. All four ceramic PZTs and all 25 printed PZTs were used to record the signals. The FBG sensors recorded strain data continuously throughout each block at a sampling frequency of 1 Hz. The data acquisition sequence is schematically summarized in Figure 4.
Impact damage was introduced to the top surface of the panels either prior to or during the experiments using a drop tower apparatus. For these impacts, the panel was clamped at its edges, and sandbags were placed underneath to minimize elastic deformation, allowing the FOD panel to absorb most of the impact energy. Impact energy values were 50 J or 55 J, delivered by an impactor with a Ø10 mm steel spherical tip. The impact events were also monitored using the PZT sensors, acquiring data at 1 MHz. Table 2 details the failure step, time of impact, and impact energy for the tested panels. The data in Table 2 indicate that the time to failure (in cycles) and the failure load were generally consistent, with only minor deviations. Although only five samples were tested, it is noteworthy that the panels exhibited similar performance under identical loading conditions. Their response and failure modes are discussed in more detail in Section 3.

3. Results

3.1. Failure Analysis by Visual Inspection

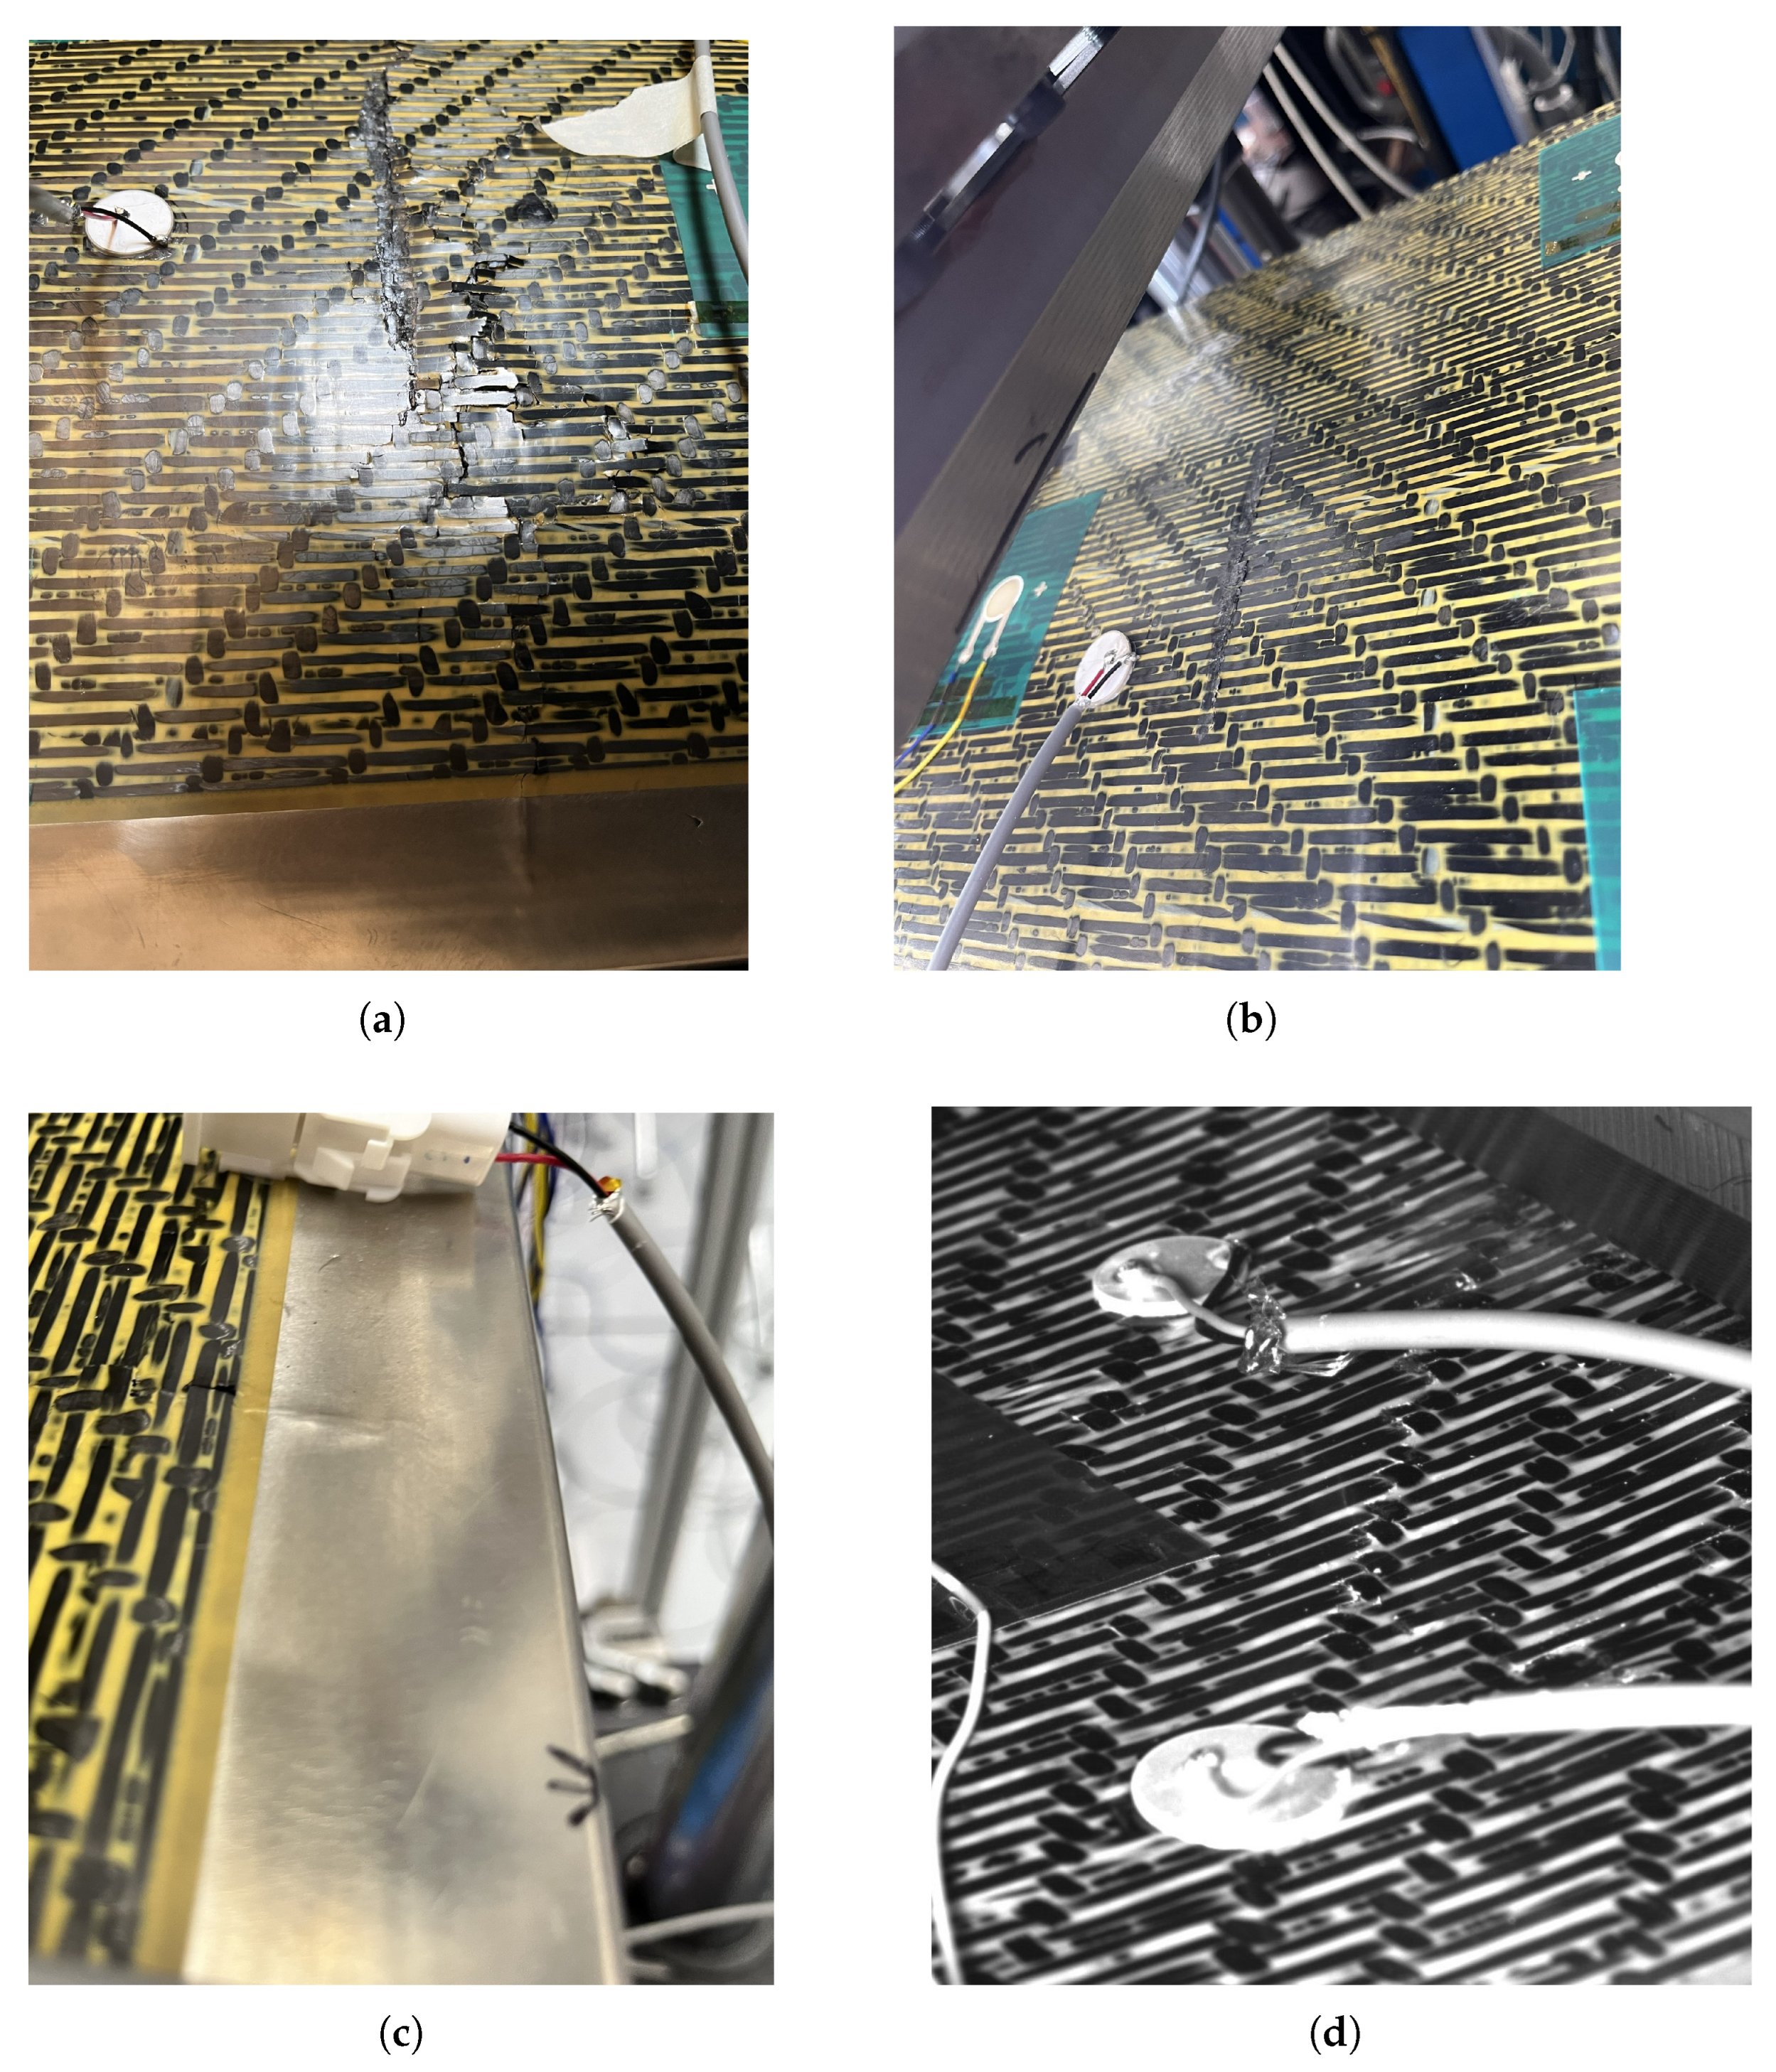
Visual inspection throughout the experiments revealed that panel failure was a gradual process, initiating with matrix cracking and progressively evolving to fiber breakage and fiber–skin separation. The final collapse of the FOD panels was predominantly characterized by extensive skin tear and fiber breakage across the panel’s width, primarily between the top loading pins. Additionally, skin damage was evident at the contact locations with these pins. Visible dents and deformation were also observed on the steel leading edge of the panels. Most of the damage was visible on the top surface of the panel, which experienced compressive loads during testing. In contrast, minimal visual damage was present on the bottom surface, mostly observed at the locations of contact with the support pins.
Figure 5 depicts representative damage and failure scenarios. Specifically, Figure 5a illustrates the primary collapse mode, consisting of skin and fiber breakage. Skin damage caused by the pins is shown in Figure 5b, while deformation of the leading edge near failure is depicted in Figure 5c. An intermediate stage of damage formation, characterized by tears in the top surface skin of the FOD panel, is shown in Figure 5d. These skin tears became more prominent as degradation increased.
It can be observed, from both Figure 5 and Table 2, that degradation was not dominated by the impact damage, rather it was mostly attributed to the panels reaching their collapse load. The authors note that the panel was very impact resistant and impact damage was not enough to dominate the degradation behavior of the panel. In cases where impact damage was present, the transverse crack (Figure 5a) would initiate at the location of impact; however, it is believed that other factors, such as reaching material strength, and/or stress/strain concentration areas due to manufacturing defects and panel–pin interactions, have significantly influenced the failure.

3.2. Hydraulic Test Machine Data

Data from the MTS machine, including absolute piston displacement, applied load, and center-panel displacement (measured by a laser distance sensor, LDS), were collected and analyzed to gain preliminary insights into the FOD panels’ behavior during testing. Degradation information can be extracted by combining the load and displacement data. Stiffness is a suitable metric for evaluating changes in a structure’s load-bearing capabilities. In this research, “stiffness” refers to the experimental structural stiffness calculated from the absolute piston displacement and the corresponding load recorded by the MTS.
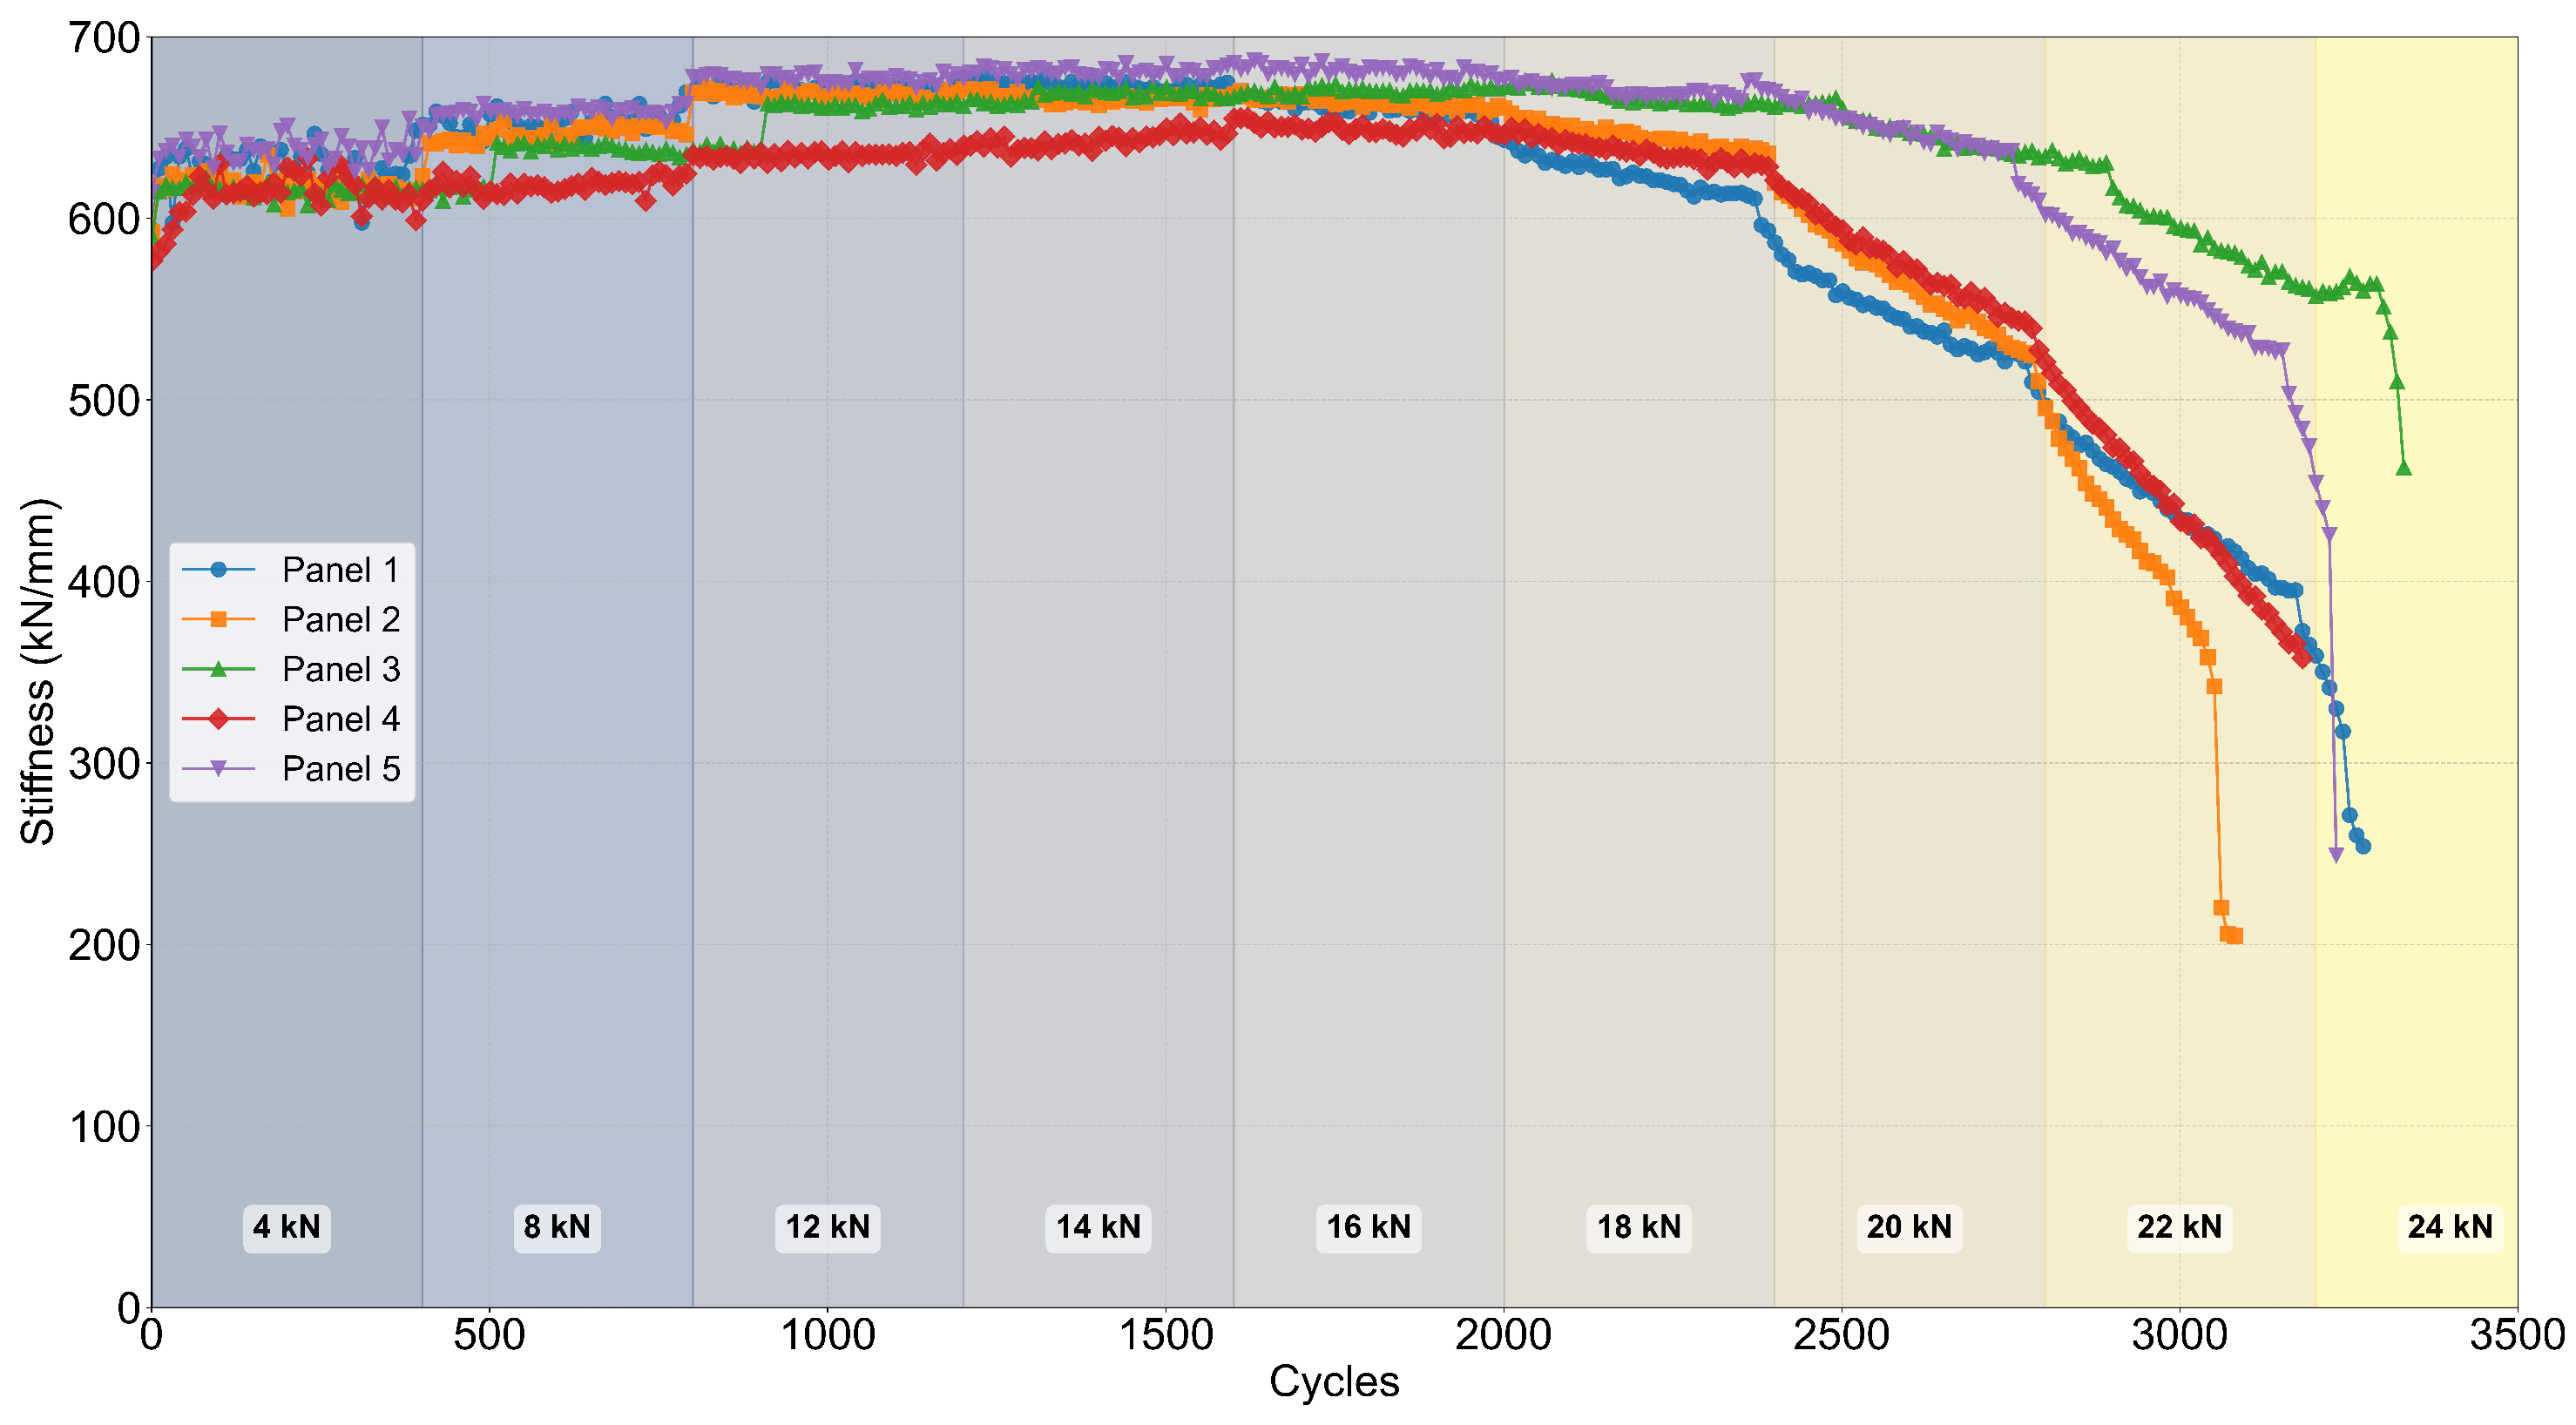
To calculate this stiffness, a linear fit was applied to the initial, linear portion of the load–displacement curve of each cycle. This portion corresponds to the pre-buckling regime, as non-linear mechanics begin to influence the structural response once buckling occurs. The stiffness (hereafter, “stiffness” will refer to this experimental stiffness unless otherwise stated) is defined as the slope of this linear fit. The evolution of stiffness is presented in Figure 6. In the early stages of the test, stiffness remains relatively constant, with a slight increasing trend. This initial increase is likely a result of the panel’s buckling behavior: the curved surface tends to flatten under load, a phenomenon that becomes more pronounced after 8 kN (minimal buckling was visually observed up to this load level). As time progresses and the applied load increases, damage develops and grows, causing the stiffness to decrease. This reduction becomes more rapid once substantial damage, such as skin and fiber breakage, is present in the structure. This typically occurs at higher load levels, around the 15–20 kN load levels, between the 2000th and 2500th cycle, which appears common for all tested panels. The largest drop in stiffness is observed during the 20 kN loading, where stiffness reduction of around 10% is observed, while panels 1, 2, and 4 show a slightly higher stiffness reduction of closer to 16%.

3.3. FBG Data

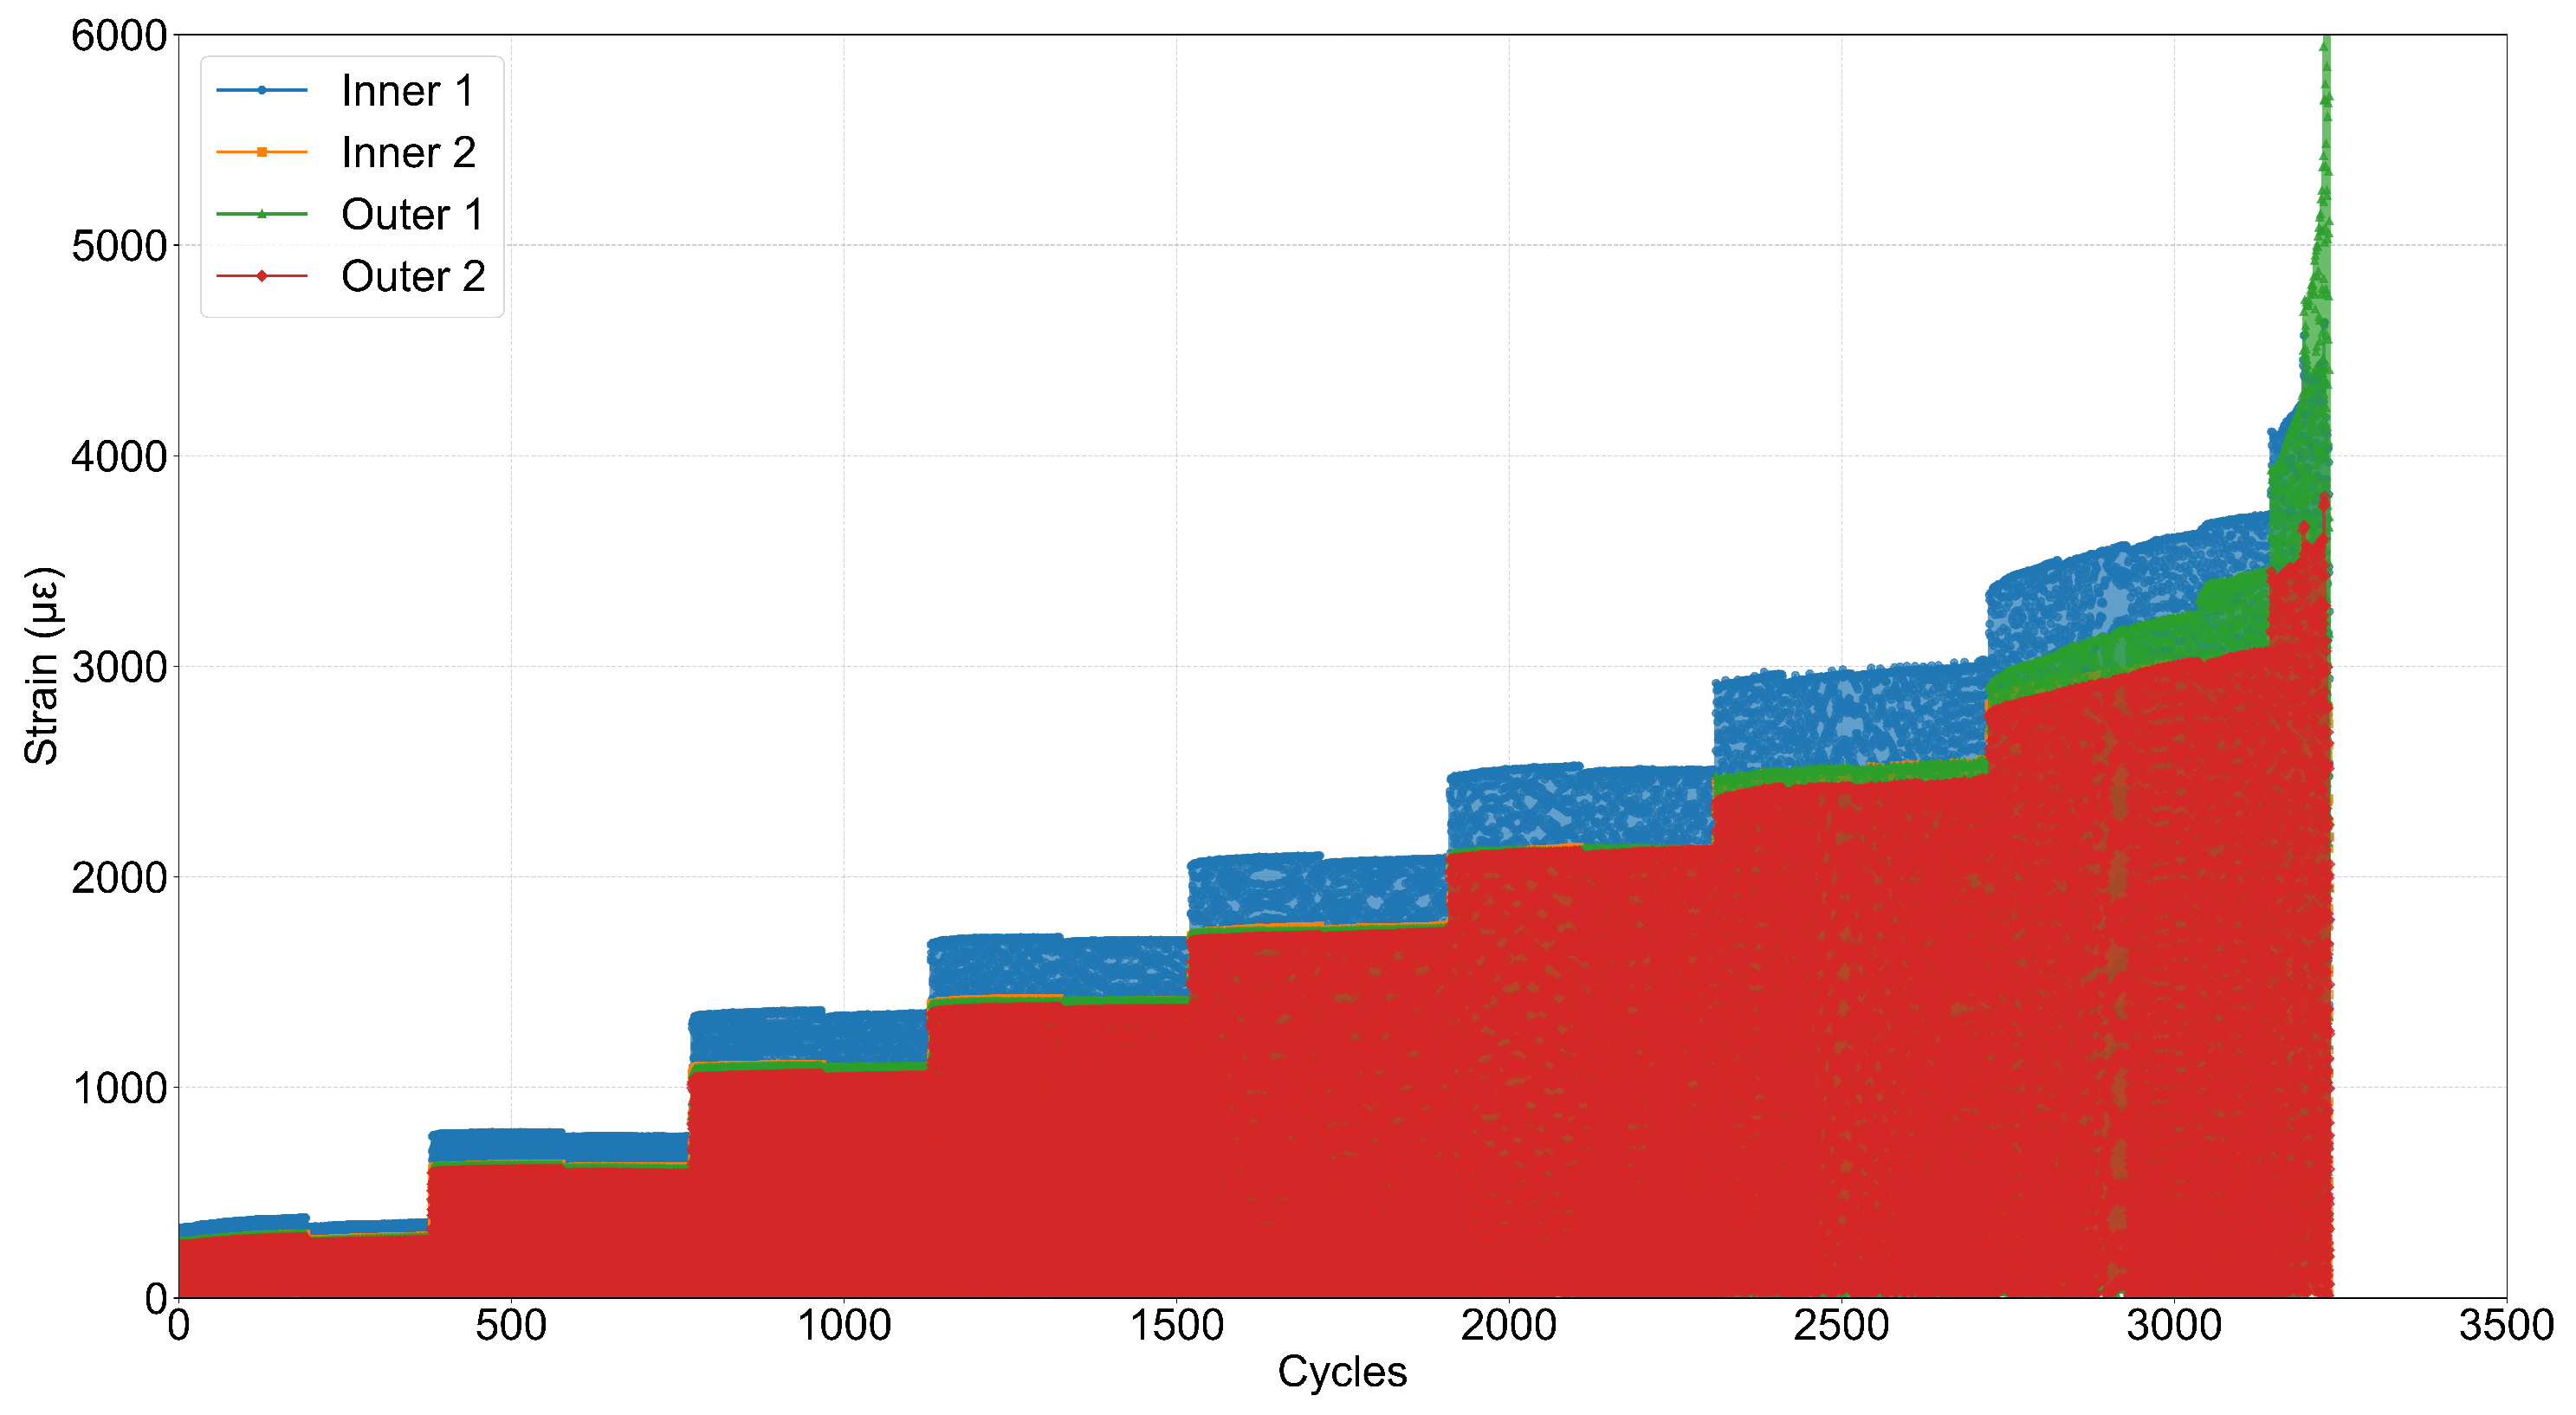
Optical fibers were both adhesively bonded to the bottom surface of the FOD panels and embedded within them. However, as the majority of embedded optical fibers did not survive the manufacturing process, and data from these are not further presented. The locations of the surface-bonded FBG sensors (see Figure 3) were chosen to provide sufficient information about strain distribution along the length and width of the panels. These locations were primarily focused on regions where maximum deformation was anticipated and failure was expected, thereby enabling the potential detection of damage initiation at various critical locations, since damage typically alters the local strain field. A primary observation is that strain is directly correlated with the applied load; for instance, surface-bonded FBG sensors, predominantly measuring the tensile stresses in this configuration, show increasing strain with increasing load, as qualitatively illustrated for a representative specimen in Figure 7. Sensors on the side, outer area show lower strain ranges, while sensors closer to the middle section of the panel show larger strain values. At the same time, after 2500 cycles (20–22 kN), signs of stiffness reduction are observed in all sensors (increase in strain under the same stress).
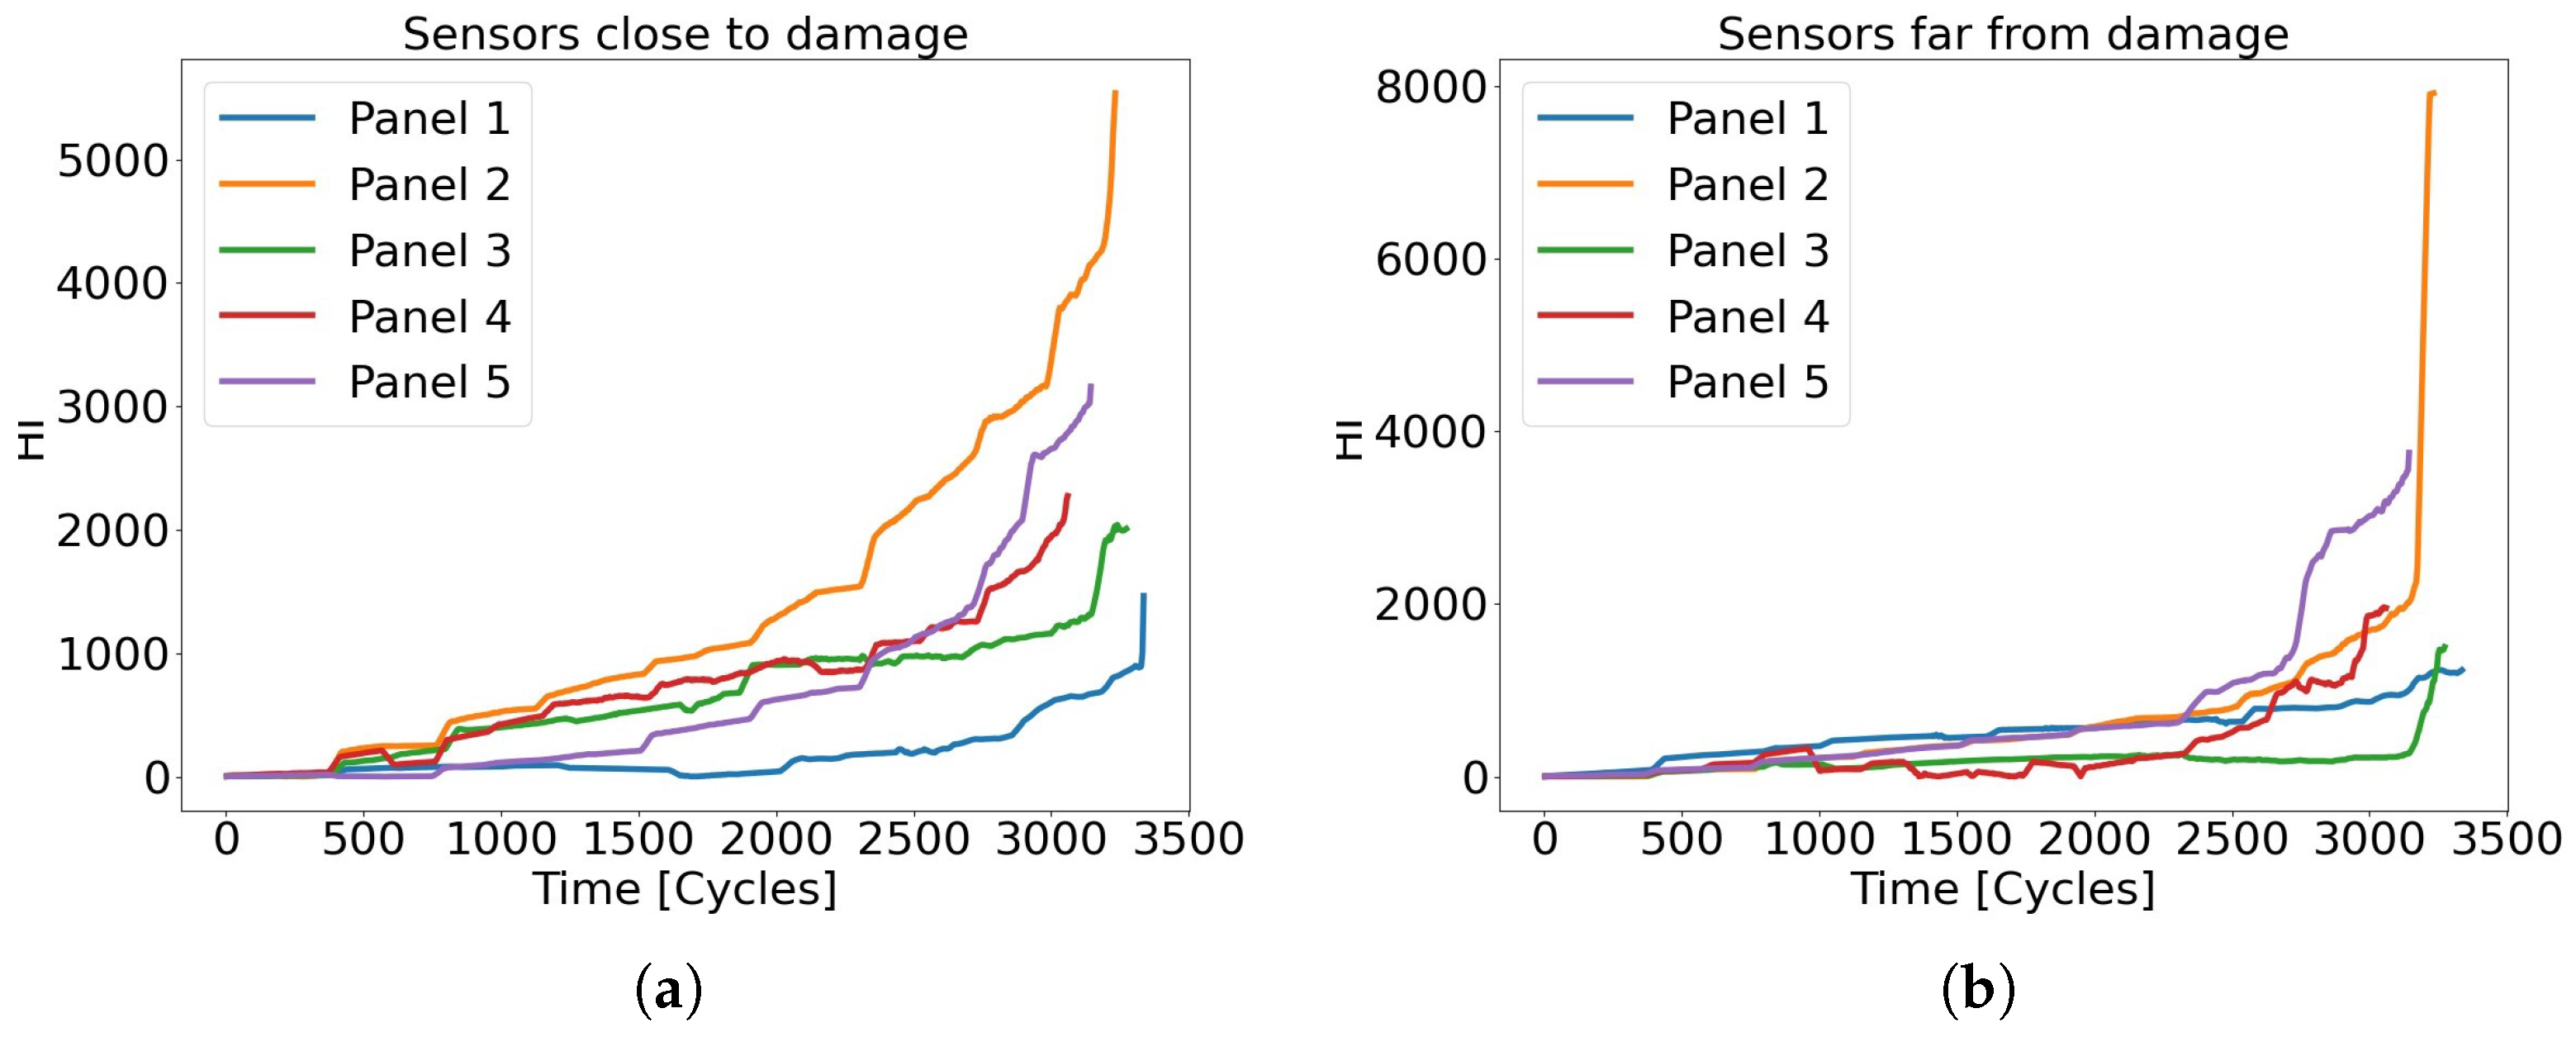
From raw FBG data one can clearly distinguish different load levels, but indications of degradation are typically only visible near the end of the panel’s life. Therefore, an increase in raw strain values is not necessarily a direct indicator of degradation or damage presence under varying load conditions. To mitigate the load effect, reduce data volume, and uncover underlying degradation trends, the strain data were first downsampled using a 200-data-point window mean, and then smoothed using a 10-data-point moving average filter. By calculating the time differential of strain for each sensor ( s i = ε i / t ) and then the cumulative sum of the absolute differences between pairs of these differential signals ( H I = | s k s j | ), a physical health indicator (HI) [64] was formulated. This HI shows some correlation with stiffness degradation (since it is a direct bi-product of strain measurements), as illustrated in Figure 8, which compares sensor pairs located at different proximities to the initial impact damage. When an FBG pair is close to the damaged area (both sensors within 70 mm of initial damage), a gradual increase in the HI’s value is observed (Figure 8a). Conversely, when both FBG sensors are further from the damage, the HI values increase abruptly only during the final stages of the test (Figure 8b), coinciding with the period when the stiffness drop becomes more rapid.
Similar to the trend observed in the stiffness reduction data (Figure 6), FBG data from sensors near the initial impact damage provide a subtle indication of degradation through an increasing slope of the HI curve. However, when transverse cracks begin to appear elsewhere on the panel, no significant change is immediately observed in this particular HI curve. This is likely because these transverse cracks initiate in a location different from the initial impact damage. Consequently, for HIs derived from sensors further from the initial impact but potentially closer to where these new cracks form (as suggested by Figure 8b), the slope increase is observed much later, closer to the time when transverse cracks are believed to formulate. This highlights a limitation of FBGs in clearly identifying damage distant from their immediate vicinity, suggesting that more advanced data processing techniques are necessary to extract more definitive diagnostic information.
These observations indicate that under complex loading schemes, signs of degradation are not always explicit in raw FBG data, and gradually evolving damage mechanisms can be difficult to distinguish. Nevertheless, it is demonstrated that with appropriate processing, strain-derived features show promise as indicators for degradation monitoring, exhibiting trends similar to stiffness reduction. This can be attributed to the fact that the reduction in stiffness is caused by the presence of damage (either fatigue caused degradation or external damage). This change in stiffness leads to a change in both stress and strain distributions in the panel. Due to the combined nature of the change, degradation is not explicitly observed in the raw strain data, but it is shown that it is effectively captured by the proposed HI. This suggests FBG sensors can be part of a capable SHM solution for online monitoring. Their high sensitivity to even slight variations in their immediate strain field makes them ideal for applications where the expected damage location is known or can be estimated, or in cases involving significant global stiffness loss (which affects the overall strain field).
However, several challenges persist, particularly for complex structures operating under variable or unknown conditions. FOSs are predominantly used as strain sensors; if damage does not alter the strain at a sensor’s location, that sensor may not detect the abnormality in time, as shown in Figure 8b. Even when global stiffness loss affects the overall strain field, under variable and unknown loading, it is not always clear whether changes in strain values are due to degradation or differing loading conditions. Similarly, damage such as cracks may only cause local changes to the strain field, remaining undetected by distant sensors. This locality explains the less distinct change in the differential HI value in Figure 8a (sensors within 70 mm initial impact) compared to the more rapid change in Figure 8b (where transverse cracks are presumed to have a more dominant, albeit later, effect).

3.4. PZT Data

As described in Section 2.1, each panel was equipped with five arrays of five screen-printed PZT sensors, complemented by four conventional ceramic PZT sensors. Each of the four conventional ceramic transducers was used sequentially to generate a 5-cycle tone burst excitation at central frequencies of 50, 100, 150, 200, and 250 kHz. The generated guided wave (GW) responses were measured at a sampling rate of 1 MHz by all PZT sensors—both the four ceramic and the 25 printed ones. This part of the study had two primary objectives: first, to provide a preliminary demonstration of the novel screen-printed PZT sensors’ ability to measure GW signals; and second, to utilize the GW signals measured by all sensors at various panel degradation stages to estimate damage and its growth, with the ultimate aim of developing data for diagnostic and prognostic methodologies.
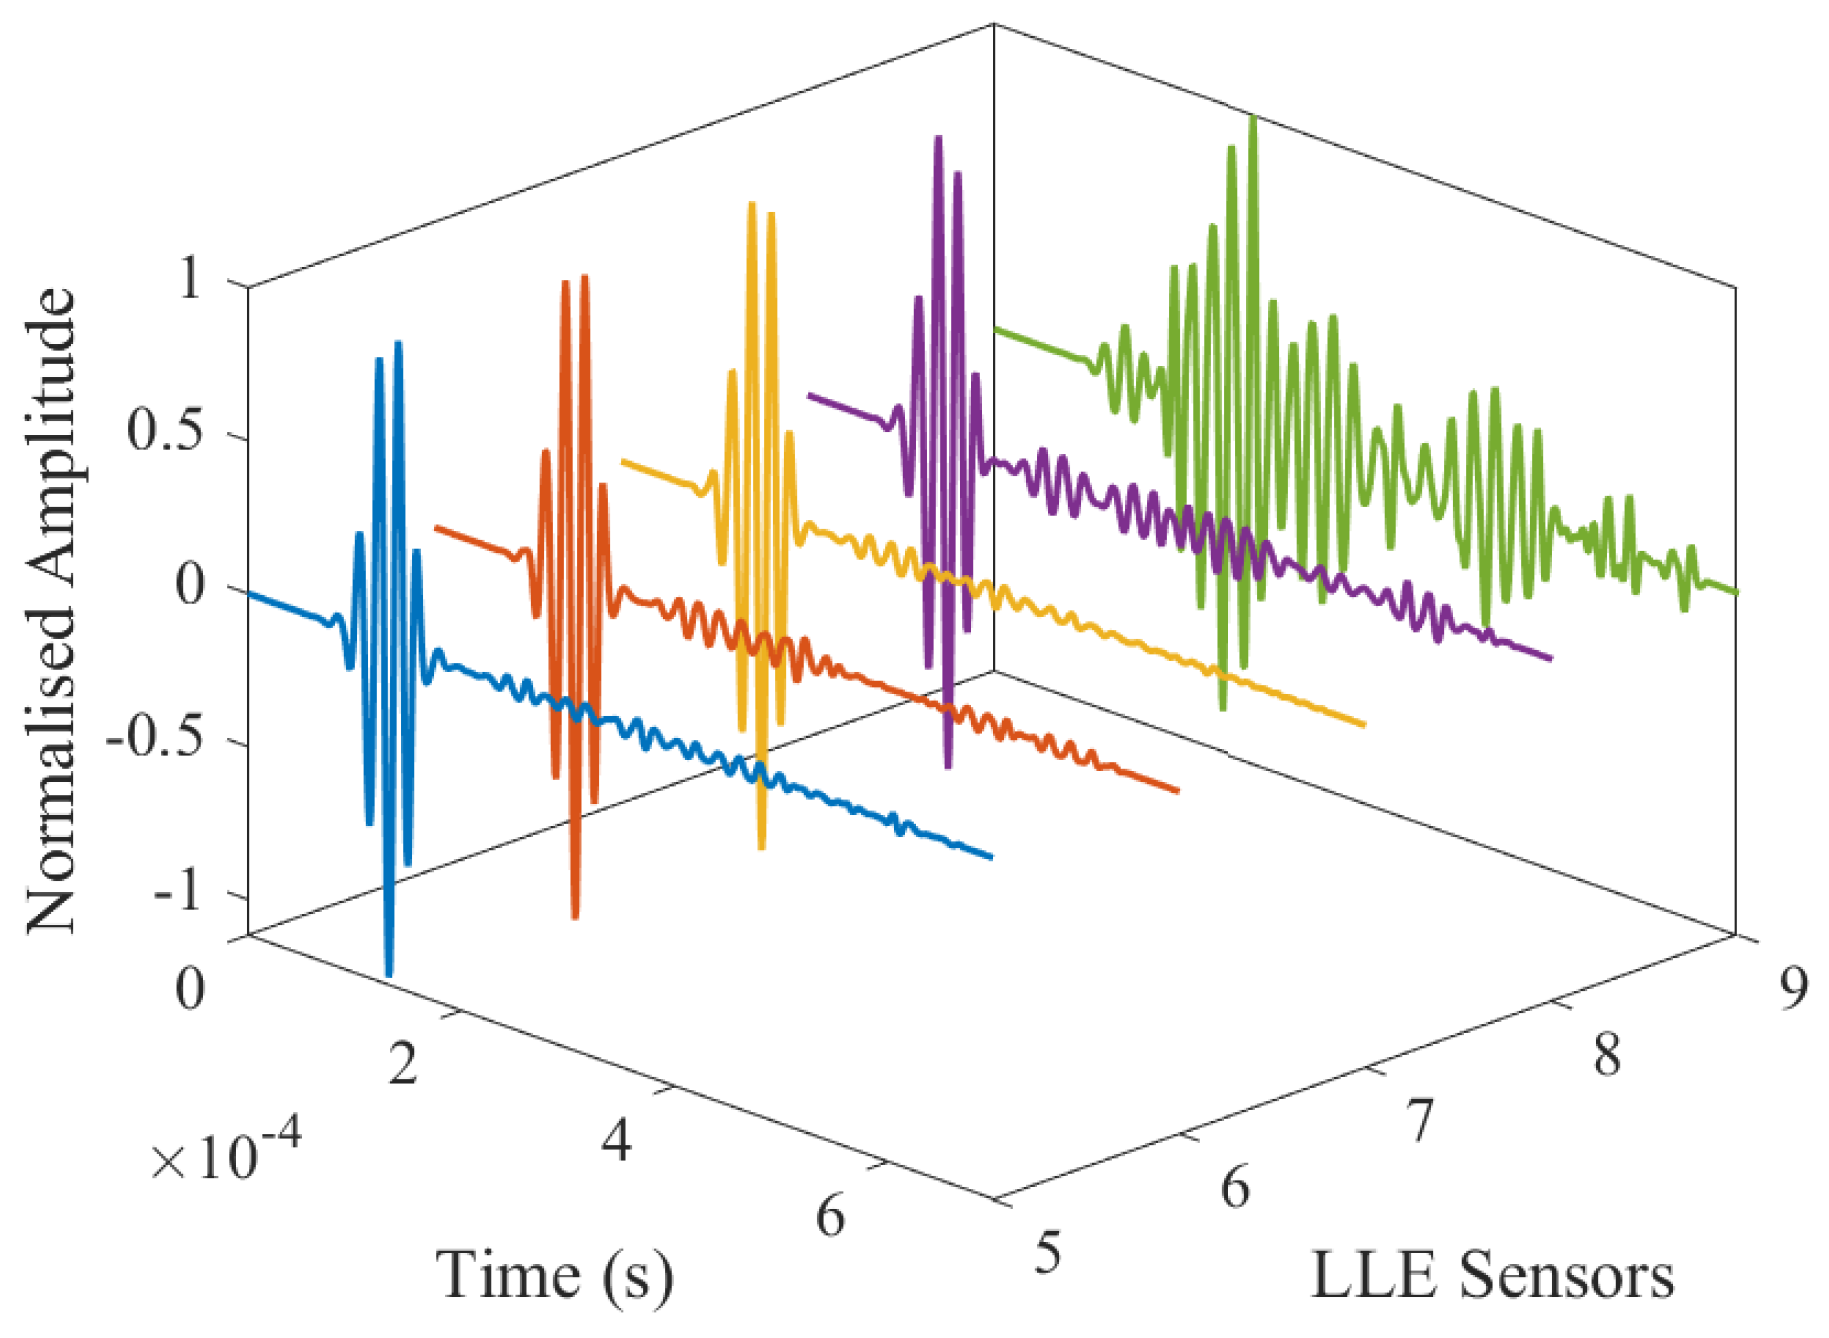
Initially, the raw GW signals were filtered using a “Symlet 8” wavelet. Figure 9 shows the normalized excitation signals at all five frequencies from ceramic sensor 1 (location detailed in Figure 3) alongside the corresponding denoised responses measured by the printed sensor LLE 2 (Left Leading Edge 2; see Figure 3), represented by dotted and solid lines, respectively. Furthermore, Figure 10 displays the signals measured by all five sensors in the printed sensor array LLE for a 50 kHz excitation.
The signals presented in Figure 9 and Figure 10 demonstrate that the novel printed PZT sensors fabricated using screen-printing technology are capable of measuring GW signals across a range of frequencies. However, it is also apparent that their efficiency in measuring signals at higher frequencies is currently limited. It is posited that with further technological refinement, the performance of printed PZTs could be improved, potentially enabling their widespread use for GW sensing on a large scale. Their response will further be analyzed in future work.
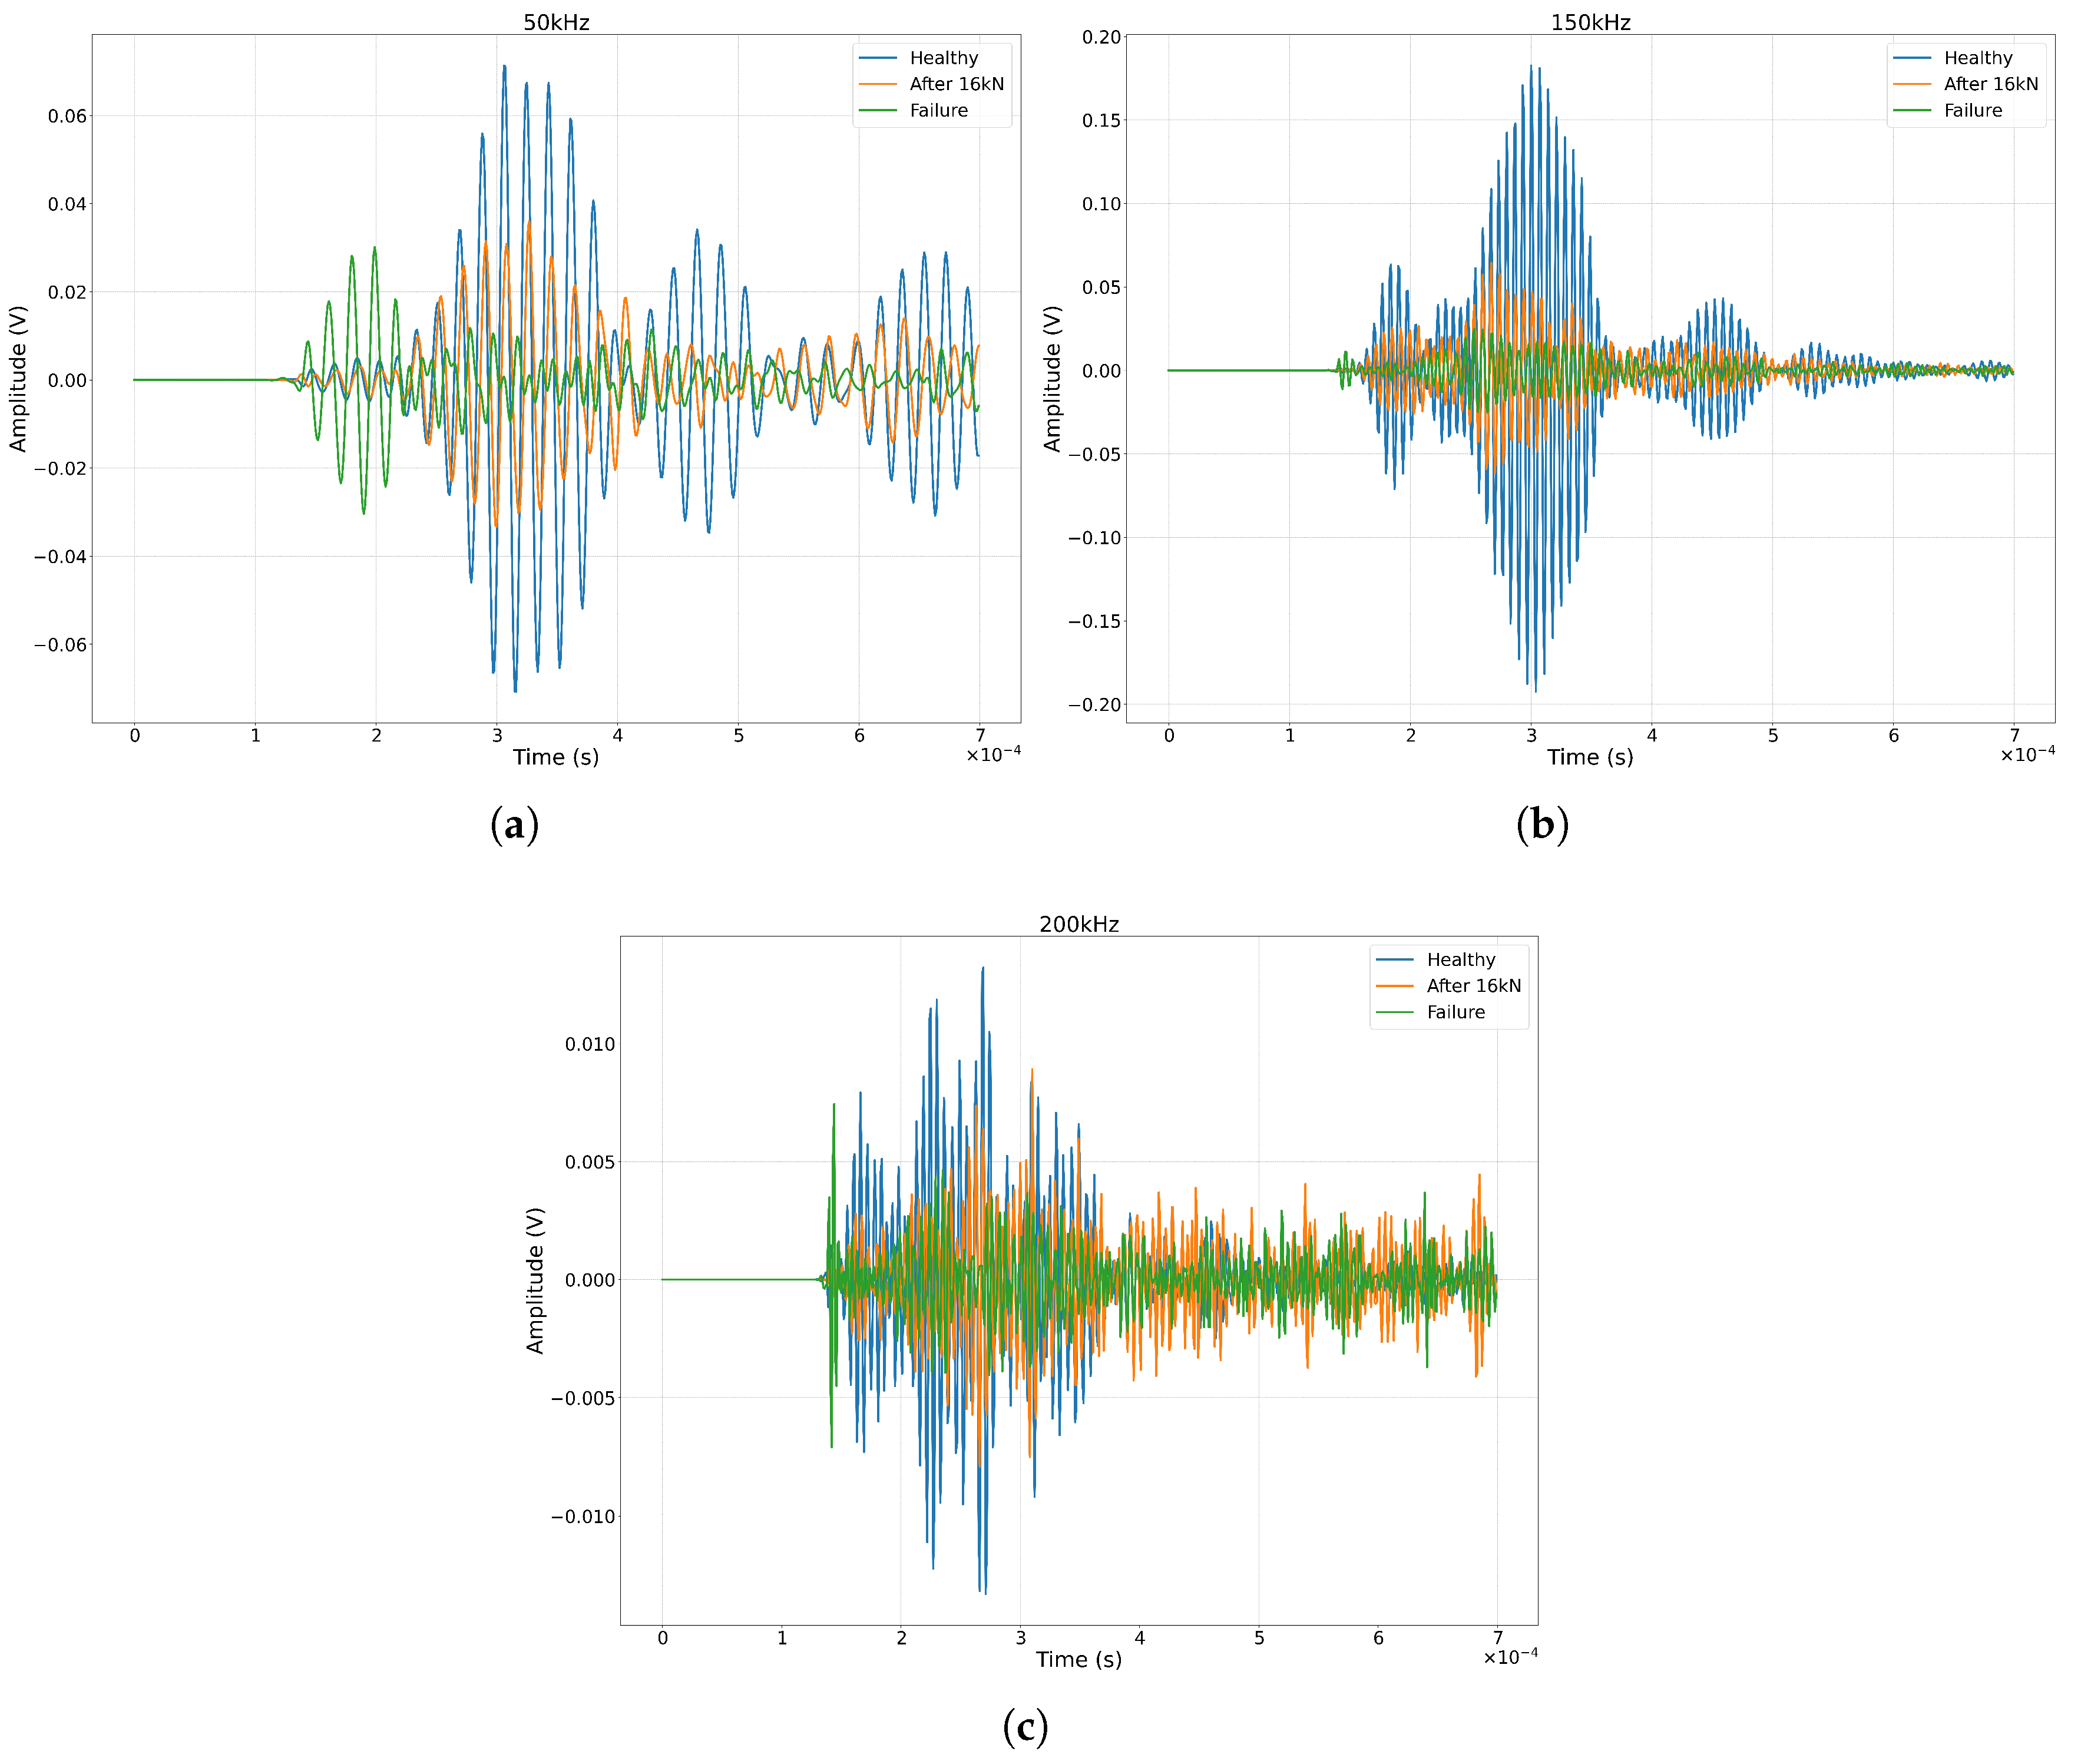
In addition to generating excitation signals, the conventional ceramic sensors were used to measure responses. Figure 11 compares GW signals from the baseline (healthy) case with signals measured after the completion of the 16 kN load step and after panel failure, for 50 kHz, 150 kHz, and 200 kHz excitations. These load levels are selected based on the stiffness degradation trend (at 16 kN the first stiffness decrease is observed). Data from only one of the panels is presented to demonstrate the change in the GW behavior with increasing degradation. A more in-depth look and comparison will be performed in future work. For consistency, the excitation signal from ceramic sensor 1 was kept identical for all three panel states (healthy, degraded, failed). The corresponding response for the 50 kHz excitation, measured by ceramic sensor 2 (Figure 11a), shows that the initial wave packet in the signal remains almost constant before failure, with only minor amplitude changes across the degradation states. However, the amplitude of a subsequent wave packet first decreases from the healthy state to the state after the 16 kN load step. Beyond this point, internal cracks and damage within the panel appear to cause this packet to merge with reflections and significantly alter the signal. For the 150 kHz excitation, responses (Figure 11b) clearly show that the response amplitude decreases considerably as the panel degrades. At 200 kHz, Figure 11c shows a similar behavior is observed with the signal amplitude decreasing as damage accumulates. The observed changes in GW signals can be attributed to accumulating damage, as environmental and boundary conditions were maintained at a constant level throughout the measurements. It should be noted, however, that degradation of the PZTs is not considered and may be affecting the signals.
Even with the simplifications inherent in this preliminary analysis, it is evident that there are discernible changes in the GW signals’ behavior as damage progresses. This demonstrates the potential of this methodology for further development in diagnostics and prognostics. Future work will involve a more in-depth investigation of the panel’s and the printed PZTs’ responses to different excitation signals, as well as a detailed study of GW propagation behavior in pristine and damaged 3D-woven composite structures.
Similar to the investigation performed for the FBG data, an HI that correlates Lamb wave data with stiffness degradation was investigated. First the signals recorded from all standard PZTs at 50 kHz are transformed to the frequency domain and are aggregated. The 50 kHz frequency was selected due to the lower signal–noise ratio. Then, the statistical features presented in Table 3 were calculated.
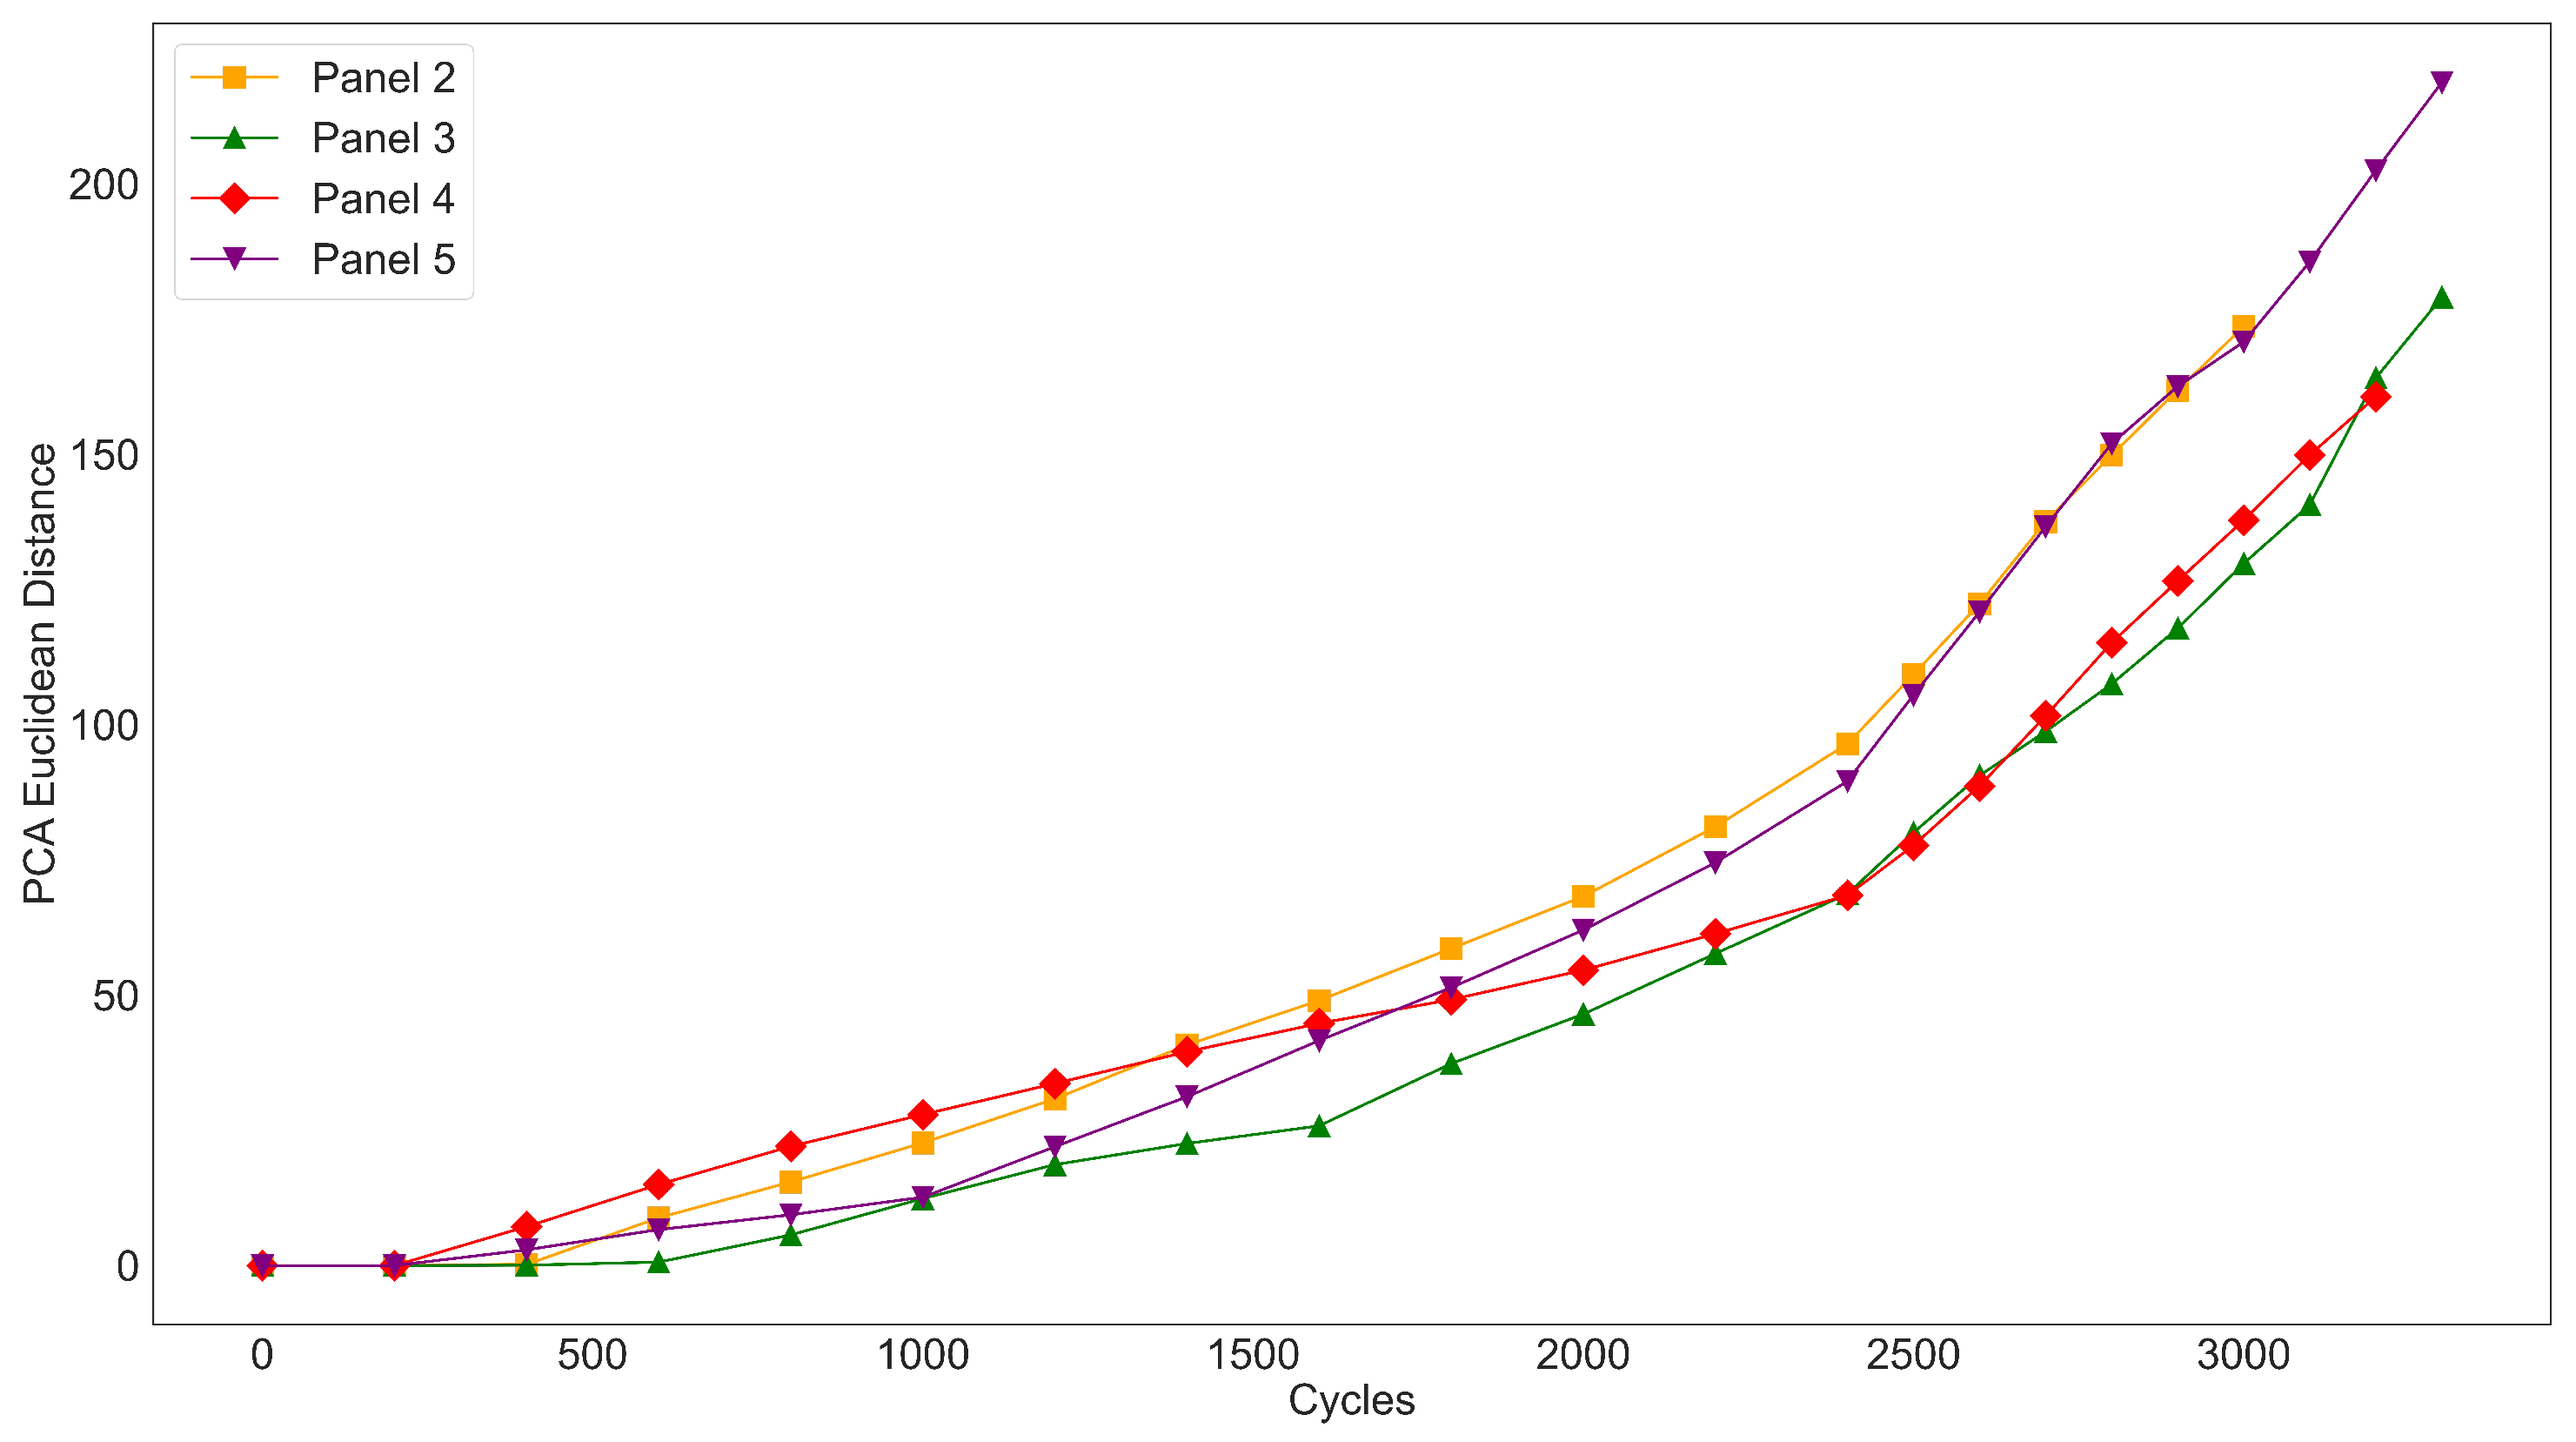
These features were then used to perform a principal component analysis. Similar to [65], the measurements up to 1500 cycles (based on minimal stiffness change) were used to obtain the transformation T h = X 0 : 1500 P h . The reduced component matrix P r —where P r is a subset of P h keeping only the components with explained variance over 90%—is then used to transform the entire dataset to the principal component space as T = X P r . Then D t = Σ | | T t T t = 0 | | is calculated and used as an indicator of degradation as shown in Figure 12. Contrary to the strain-based HI which can be correlated to the physical property of strain change, this HI does not posses any physical meaning but can be used as a virtual measure of degradation [64]. Due to the cumulative nature of this metric, it can be seen that, regardless of stiffness change, the HI is increasing. However, at time where a more rapid decrease in the stiffness is observed (around the 2000–2500th cycle), it can be observed that the slope of the curves also change, possibly meaning that the GWs have detected the change in stiffness. No direct correlation is, however, noted at this time. A more in-depth analysis on the prognostic value of these metrics will be performed in future work. Unfortunately, the quality of the PZT data from panel 1 was not good and no analysis could be performed.

3.5. Discussion

From the analysis in both the FBG and PZT data, it is observed that both are capable of correlating to the stiffness degradation. In the case of FBG, it can be seen that the closer a sensor is to an initial damage the more gradual the behavior of the HI is and a better correlation in the stiffness degradation is observed. Conversely, when FBG sensors are further from damage, they only start to show signs of degradation very late, almost right before failure is imminent, or when stiffness reduction has become serious enough to significantly alter the strain field of the entire structure. Alternatively, the PZT-based HI shows a more rapid increase, which can be attributed to surface defects appearing in the earlier stages of the experiment. It should also be noted that the GW measurements are less frequent, and hence, some signs of more gradual degradation may have not been captured. However, it can also be observed via the change in slope around the 2000th cycle that the increase in stiffness decrease speed affects the GW data. This is also observed in the FBG HI. This shows that even though FBGs offer the advantage of continuous monitoring, they are dependent on being close to the location of damage to provide good detection capabilities. On the other hand, GWs can capture damage from its early stages; the need to actively excite them and their dependence on constant conditions during measurement limit their applicability for online monitoring.

4. Conclusions

This paper presented an experimental structural health monitoring (SHM) framework for monitoring complex composite aircraft structures, exemplified by a case study on a Foreign Object Damage (FOD) panel representative of a LEAP engine fan blade. The study highlighted the advantages and challenges associated with the employed SHM technologies. The FOD panels, a hybrid metal–composite structure, featured a curved, 3D-woven composite body with a steel leading edge were equipped with two state-of-the-art sensor types: Fiber Bragg Grating (FBG) sensors and screen-printed and ceramic piezoelectric transducer (PZT) sensors.
The FOD panels were subjected to an incrementally severe, cyclic 4-point bending test (load–unload) designed to simulate near-operational conditions and assess the panel’s flexural response under progressive damage. The loading involved multiple load steps, from 4 kN up to approximately 28 kN (the quasi-static collapse load of a pristine structure), with 400 cycles per monitored step. Degradation was quantified by the reduction in experimental stiffness, calculated from load–displacement data. It was observed that experimental stiffness decreased as damage was initiated and accumulated, with the rate of decrease accelerating as failure became imminent. The final failure mode was dominated by skin and fiber breakage across the panel’s width.
Analysis of the FBG data, after pre-processing, demonstrated that strain-derived features can indicate degradation, although the detectability of damage was more prominent when it occurred near the sensors. It remains a challenge to explicitly distinguish degradation from load-induced variations in raw strain data, underscoring the need for further investigation to achieve comprehensive diagnostic results.
Regarding the PZT sensors, measurements served as a preliminary demonstration of the capabilities of screen-printing technology for fabricating sensors directly onto structures. The printed PZTs successfully measured guided wave responses, despite their current low output voltages. These sensors are advantageous due to their non-invasive nature and negligible weight, which result in minimal local stiffness variation on the monitored structure. It was also demonstrated that there are potential GW-based HIs that can be correlated to stiffness degradation. Further investigation is required however. With further study and technological maturation, printed PZT sensors hold the potential for deployment on large-scale industrial structures, especially in inaccessible locations. The comprehensive SHM dataset acquired in this study provides a unique foundation for developing advanced diagnostic and prognostic methodologies for aerospace composite structures.
The findings emphasize both the strengths and drawbacks of the deployed SHM systems, highlighting current research gaps and the respective advantages and disadvantages of each sensor type for complex applications. While collected SHM data can offer valuable insights into a structure’s condition, raw data are often uninformative without sophisticated processing. Therefore, the development of advanced signal processing and data interpretation algorithms remains crucial for robust SHM implementation. At the same time, while experiments in laboratory conditions can assist in developing algorithms and methodologies for SHM, in real applications, with complex operational conditions (high rotational speeds) and extreme environments (high temperatures, humidity), their implementation can be further complicated. Future research should also address sensor reliability and durability under operational and environmental loads, including potential failures during manufacturing or service, to ensure the feasibility and long-term viability of SHM systems.

Author Contributions

Conceptualization, G.G.; methodology, G.G., S.P., and G.S.; software, G.G., S.P., and G.S.; validation, G.G. and S.P.; formal analysis, G.G., S.P., and G.S.; investigation, G.G.; resources, D.Z.; data curation, G.G. and S.P.; writing—original draft preparation, G.G., S.P., and G.S.; writing—review and editing, D.Z., T.L., N.M., and M.R.; supervision, D.Z., T.L., N.M., and M.R.; project administration, D.Z. and N.M.; funding acquisition, D.Z., T.L., and N.M. All authors have read and agreed to the published version of the manuscript.

Funding

This research was funded by the European Union Horizon 2020 MORPHO program (grant agreement 101006854).

Data Availability Statement

Part of the data used in this research can be found at https://zenodo.org/records/14627730, accessed on 1 February 2025.

Acknowledgments

The authors would like to acknowledge Safran Composites for procurement of the FOD panels, Fraunhofer IFAM for the printed PZT sensors and the embedding of the optical fibers, and FiSens GmbH for the optical fibers and optical fiber interrogation systems.

Conflicts of Interest

The authors declare no conflicts of interest.

References

  1. Kessler, S.S.; Spearing, S.M. Design of a piezoelectric-based structural health monitoring system for damage detection in composite materials. In Proceedings of the SPIE’s 9th Annual International Symposium on Smart Structures and Materials, San Diego, CA, USA, 17–21 May 2002; Volume 4701, pp. 86–96. [Google Scholar] [CrossRef]
  2. Cawley, P. Structural health monitoring: Closing the gap between research and industrial deployment. Struct. Health-Monit. Int. J. 2018, 17, 1225–1244. [Google Scholar] [CrossRef]
  3. Lima, R.A.A.; Perrone, R.; Carboni, M.; Bernasconi, A. Experimental analysis of mode I crack propagation in adhesively bonded joints by optical backscatter reflectometry and comparison with digital image correlation. Theor. Appl. Fract. Mech. 2021, 116, 103117. [Google Scholar] [CrossRef]
  4. Khodaei, Z.S.; Aliabadi, M.H. A Multi-Level Decision Fusion Strategy for Condition Based Maintenance of Composite Structures. Materials 2016, 9, 790. [Google Scholar] [CrossRef]
  5. Marques, R.; Unel, M.; Yildiz, M.; Suleman, A. Remaining useful life prediction of laminated composite materials using Thermoelastic Stress Analysis. Compos. Struct. 2019, 210, 381–390. [Google Scholar] [CrossRef]
  6. Abbas, S.; Li, F.C.; Qiu, J.X. A Review on SHM Techniques and Current Challenges for Characteristic Investigation of Damage in Composite Material Components of Aviation Industry. Mater. Perform. Charact. 2018, 7, 224–258. [Google Scholar] [CrossRef]
  7. Gholizadeh, S. A review of non-destructive testing methods of composite materials. Port. Conf. Fract. 2016, 1, 50–57. [Google Scholar] [CrossRef]
  8. Dorey, G. Impact and Crashworthiness of Composite Structures; Elsevier Science Publishing Co., Inc.: Amsterdam, The Netherlands, 1984; pp. 155–192. [Google Scholar]
  9. Azouaoui, K.; Azari, Z.; Pluvinage, G. Evaluation of impact fatigue damage in glass/epoxy composite laminate. Int. J. Fatigue 2010, 32, 443–452. [Google Scholar] [CrossRef]
  10. Sadighi, M.; Alderliesten, R. Impact fatigue, multiple and repeated low-velocity impacts on FRP composites: A review. Compos. Struct. 2022, 297, 115962. [Google Scholar] [CrossRef]
  11. Giurgiutiu, V. Structural Health Monitoring of Aerospace Composites; Academic Press: Waltham, MA, USA, 2015. [Google Scholar]
  12. Hunston, D.; McDonough, W.; Fanconi, B.; Mopsik, F.; Wang, F.; Phelan, F.; Chiang, M. Assessment of the State-of-the-Art for Process Monitoring Sensors for Polymer Composites; Technical Report NISTIR 4514; National Institute of Standards and Technology: Gaithersburg, MD, USA, 1991. [Google Scholar]
  13. Lam, H.F.; Ko, J.M.; Wong, C.W. Detection of Damage Location Based on Sensitivity Analysis. In Proceedings of the 13th International Modal Analysis Conference, Nashville, TN, USA, 13–16 February 1995; Volume 2460, pp. 1499–1505. [Google Scholar]
  14. Kinet, D.; Mégret, P.; Goossen, K.W.; Qiu, L.; Heider, D.; Caucheteur, C. Fiber Bragg grating sensors toward structural health monitoring in composite materials: Challenges and solutions. Sensors 2014, 14, 7394–7419. [Google Scholar] [CrossRef]
  15. Qiu, Y.; Wang, Q.b.; Zhao, H.t.; Chen, J.a.; Wang, Y.y. Review on composite structural health monitoring based on fiber Bragg grating sensing principle. J. Shanghai Jiaotong Univ. 2013, 18, 129–139. [Google Scholar] [CrossRef]
  16. Saeedifar, M.; Zarouchas, D. Damage characterization of laminated composites using acoustic emission: A review. Compos. Part B Eng. 2020, 195, 108039. [Google Scholar] [CrossRef]
  17. Ono, K. Review on structural health evaluation with acoustic emission. Appl. Sci. 2018, 8, 958. [Google Scholar] [CrossRef]
  18. Saeedifar, M.; Mansvelder, J.; Mohammadi, R.; Zarouchas, D. Using passive and active acoustic methods for impact damage assessment of composite structures. Compos. Struct. 2019, 226, 111252. [Google Scholar] [CrossRef]
  19. Yue, N.; Khodaei, Z.S.; Aliabadi, M.H. Damage detection in large composite stiffened panels based on a novel SHM building block philosophy. Smart Mater. Struct. 2021, 30, 045004. [Google Scholar] [CrossRef]
  20. Salmanpour, M.S.; Khodaei, Z.S.; Aliabadi, M.H. Guided wave temperature correction methods in structural health monitoring. J. Intell. Mater. Syst. Struct. 2017, 28, 604–618. [Google Scholar] [CrossRef]
  21. Palaniappan, J.; Wang, H.; Ogin, S.L.; Thorne, A.; Reed, G.T.; Tjin, S.C. Use of conventional and chirped optical fibre Bragg gratings to detect matrix cracking damage in composite materials. Sens. Their Appl. XIII 2005, 15, 55–60. [Google Scholar] [CrossRef]
  22. Zhou, Z.D.; Liu, Q.; Ai, Q.S.; Xu, C. Intelligent monitoring and diagnosis for modern mechanical equipment based on the integration of embedded technology and FBGS technology. Measurement 2011, 44, 1499–1511. [Google Scholar] [CrossRef]
  23. Goossens, S.; De Pauw, B.; Geernaert, T.; Salmanpour, M.S.; Khodaei, Z.S.; Karachalios, E.; Saenz-Castillo, D.; Thienpont, H.; Berghmans, F. Aerospace-grade surface mounted optical fibre strain sensor for structural health monitoring on composite structures evaluated against in-flight conditions. Smart Mater. Struct. 2019, 28, 065008. [Google Scholar] [CrossRef]
  24. Todd, M.D.; Nichols, J.M.; Trickey, S.T.; Seaver, M.; Nichols, C.J.; Virgin, L.N. Bragg grating-based fibre optic sensors in structural health monitoring. Philos. Trans. R. Soc. Math. Phys. Eng. Sci. 2007, 365, 317–343. [Google Scholar] [CrossRef]
  25. Broer, A.A.; Benedictus, R.; Zarouchas, D. The need for multi-sensor data fusion in structural health monitoring of composite aircraft structures. Aerospace 2022, 9, 183. [Google Scholar] [CrossRef]
  26. Mitra, M.; Gopalakrishnan, S. Guided wave based structural health monitoring: A review. Smart Mater. Struct. 2016, 25, 053001. [Google Scholar] [CrossRef]
  27. Ricci, F.; Monaco, E.; Boffa, N.; Maio, L.; Memmolo, V. Guided waves for structural health monitoring in composites: A review and implementation strategies. Prog. Aerosp. Sci. 2022, 129, 100790. [Google Scholar] [CrossRef]
  28. Lu, H.; Chandran, B.; Wu, W.; Ninic, J.; Gryllias, K.; Chronopoulos, D. Damage features for structural health monitoring based on ultrasonic Lamb waves: Evaluation criteria, survey of recent work and outlook. Measurement 2024, 232, 114666. [Google Scholar] [CrossRef]
  29. Cawley, P. Guided waves in long range nondestructive testing and structural health monitoring: Principles, history of applications and prospects. NDT Int. 2024, 142, 103026. [Google Scholar] [CrossRef]
  30. Andreades, C.; Malfense Fierro, G.P.; Meo, M. A nonlinear ultrasonic SHM method for impact damage localisation in composite panels using a sparse array of piezoelectric PZT transducers. Ultrasonics 2020, 108, 106181. [Google Scholar] [CrossRef] [PubMed]
  31. Balasubramaniam, K.; Sikdar, S.; Soman, R.; Malinowski, P. Multi step structural health monitoring approaches in debonding assessment in a sandwich honeycomb composite structure using ultrasonic guided waves. Measurement 2022, 194, 111057. [Google Scholar] [CrossRef]
  32. Kessler, S.S.; Spearing, S.M.; Soutis, C. Damage detection in composite materials using Lamb wave methods. Smart Mater. Struct. 2002, 11, 269. [Google Scholar] [CrossRef]
  33. Ihn, J.B.; Chang, F.K. Detection and monitoring of hidden fatigue crack growth using a built-in piezoelectric sensor/actuator network: II. Validation using riveted joints and repair patches. Smart Mater. Struct. 2004, 13, 621. [Google Scholar] [CrossRef]
  34. Saxena, A.; Goebel, K.F.; Larrosa, C.C.; Janapati, V.; Roy, S.; Chang, F.K. Accelerated Aging Experiments for Prognostics of Damage Growth in Composite Materials; Technical report; NASA Ames Research Center: Mountain View, CA, USA, 2011. [Google Scholar]
  35. Tabian, I.; Fu, H.L.; Khodaei, Z.S. A Convolutional Neural Network for Impact Detection and Characterization of Complex Composite Structures. Sensors 2019, 19, 4933. [Google Scholar] [CrossRef]
  36. Seno, A.H.; Khodaei, Z.S.; Aliabadi, M.H.F. Passive sensing method for impact localisation in composite plates under simulated environmental and operational conditions. Mech. Syst. Signal Process. 2019, 129, 20–36. [Google Scholar] [CrossRef]
  37. Banerjee, P.; Palanisamy, R.P.; Udpa, L.; Haq, M.; Deng, Y.M. Prognosis of fatigue induced stiffness degradation in GFRPs using multi-modal NDE data. Compos. Struct. 2019, 229, 111424. [Google Scholar] [CrossRef]
  38. Yue, N.; Broer, A.; Briand, W.; Rebillat, M.; Loutas, T.; Zarouchas, D. Assessing stiffness degradation of stiffened composite panels in post-buckling compression-compression fatigue using guided waves. Compos. Struct. 2022, 293, 115751. [Google Scholar] [CrossRef]
  39. Munian, R.K.; Mahapatra, D.R.; Gopalakrishnan, S. Ultrasonic guided wave scattering due to delamination in curved composite structures. Compos. Struct. 2020, 239, 111987. [Google Scholar] [CrossRef]
  40. Paunikar, S.; Gopalakrishnan, S. Wave propagation in adhesively bonded metallic and composite lap joints modelled through spectrally formulated elastically coupled double beam element. Int. J. Mech. Mater. Des. 2022, 18, 365–393. [Google Scholar] [CrossRef]
  41. Nerlikar, V.; Miorelli, R.; Recoquillay, A.; d’Almeida, O. A physics-embedded deep-learning framework for efficient multi-fidelity modeling applied to guided wave based structural health monitoring. Ultrasonics 2024, 141, 107325. [Google Scholar] [CrossRef] [PubMed]
  42. Feng, T.; Aliabadi, M.H.F. Influence of placing positions of PZT transducers in thick composites on ultrasonic guided waves. Procedia Struct. Integr. 2024, 52, 785–794. [Google Scholar] [CrossRef]
  43. Dziendzikowski, M.; Kurnyta, A.; Dragan, K.; Klysz, S.; Leski, A. In situ Barely Visible Impact Damage detection and localization for composite structures using surface mounted and embedded PZT transducers: A comparative study. Mech. Syst. Signal Process. 2016, 78, 91–106. [Google Scholar] [CrossRef]
  44. Di Sante, R. Fibre Optic Sensors for Structural Health Monitoring of Aircraft Composite Structures: Recent Advances and Applications. Sensors 2015, 15, 18666–18713. [Google Scholar] [CrossRef]
  45. Guemes, A.; Fernandez-Lopez, A.; Pozo, A.R.; Sierra-Pérez, J. Structural Health Monitoring for Advanced Composite Structures: A Review. J. Compos. Sci. 2020, 4, 13. [Google Scholar] [CrossRef]
  46. Frieden, J.; Cugnoni, J.; Botsis, J.; Gmür, T.; Coric, D. High-speed internal strain measurements in composite structures under dynamic load using embedded FBG sensors. Compos. Struct. 2010, 92, 1905–1912. [Google Scholar] [CrossRef]
  47. Falcetelli, F.; Martini, A.; Di Sante, R.; Troncossi, M. Strain Modal Testing with Fiber Bragg Gratings for Automotive Applications. Sensors 2022, 22, 946. [Google Scholar] [CrossRef]
  48. Yeager, M.; Todd, M.; Gregory, W.; Key, C. Assessment of embedded fiber Bragg gratings for structural health monitoring of composites. Struct. Health-Monit. Int. J. 2017, 16, 262–275. [Google Scholar] [CrossRef]
  49. Güemes, A.; Fernandez-Lopez, A.; Fernandez, P. Damage detection in composite structures from fibre optic distributed strain measurements. In Proceedings of the EWSHM-7th European Workshop on Structural Health Monitoring, Nantes, France, 8–11 July 2014. [Google Scholar]
  50. Balageas, D.; Bourasseau, S.; Dupont, M.; Bocherens, E.; Dewynter-Marty, V.; Ferdinand, P. Comparison between non-destructive evaluation techniques and integrated fiber optic health monitoring systems for composite sandwich structures. J. Intell. Mater. Syst. Struct. 2000, 11, 426–437. [Google Scholar] [CrossRef]
  51. Goossens, S.; Berghmans, F.; Muñoz, K.; Jiménez, M.; Karachalios, E.; Saenz-Castillo, D.; Geernaert, T. A global assessment of barely visible impact damage for CFRP sub-components with FBG-based sensors. Compos. Struct. 2021, 272, 114025. [Google Scholar] [CrossRef]
  52. Guemes, A.; Sierra-Pérez, J.; Rodellar, J.; Mujica, L. A robust procedure for Damage detection from strain measurements based on Principal Component Analysis. Struct. Health Monit. Res. Appl. 2013, 558, 128–138. [Google Scholar] [CrossRef]
  53. Güemes, A.; Fernández-López, A.; Díaz-Maroto, P.F.; Lozano, A.; Sierra-Perez, J. Structural Health Monitoring in Composite Structures by Fiber-Optic Sensors. Sensors 2018, 18, 1094. [Google Scholar] [CrossRef]
  54. Kahandawa, G.C.; Epaarachchi, J.; Wang, H.; Lau, K.T. Use of FBG Sensors for SHM in Aerospace Structures. Photonic Sens. 2012, 2, 203–214. [Google Scholar] [CrossRef]
  55. Datta, A.; Augustin, M.J.; Gupta, N.; Viswamurthy, S.R.; Gaddikeri, K.M.; Sundaram, R. Impact Localization and Severity Estimation on Composite Structure Using Fiber Bragg Grating Sensors by Least Square Support Vector Regression. IEEE Sens. J. 2019, 19, 4463–4470. [Google Scholar] [CrossRef]
  56. Sbarufatti, C.; Manes, A.; Giglio, M. Performance optimization of a diagnostic system based upon a simulated strain field for fatigue damage characterization. Mech. Syst. Signal Process. 2013, 40, 667–690. [Google Scholar] [CrossRef]
  57. Galanopoulos, G.; Eleftheroglou, N.; Milanoski, D.; Broer, A.; Zarouchas, D.; Loutas, T. A novel strain-based health indicator for the remaining useful life estimation of degrading composite structures. Compos. Struct. 2023, 306, 116579. [Google Scholar] [CrossRef]
  58. Galanopoulos, G.; Fytsilis, E.; Yue, N.; Broer, A.; Milanoski, D.; Zarouchas, D.; Loutas, T. A data driven methodology for upscaling remaining useful life predictions: From single- to multi-stiffened composite panels. Compos. Part C Open Access 2023, 11, 100366. [Google Scholar] [CrossRef]
  59. Rocha, H.; Semprimoschnig, C.; Nunes, J.P. Sensors for process and structural health monitoring of aerospace composites: A review. Eng. Struct. 2021, 237, 112231. [Google Scholar] [CrossRef]
  60. Elenchezhian, M.R.P.; Vadlamudi, V.; Raihan, R.; Reifsnider, K.; Reifsnider, E. Artificial intelligence in real-time diagnostics and prognostics of composite materials and its uncertainties-a review. Smart Mater. Struct. 2021, 30, 083001. [Google Scholar] [CrossRef]
  61. Paunikar, S.; Galanopoulos, G.; Rébillat, M. An Experimental Data Set for the SHM of a Substructure of an Engine Fan Blade from the MORPHO Project. 2025. Available online: https://zenodo.org/records/14627730 (accessed on 1 February 2025). [CrossRef]
  62. ASTM D7264/D7264M–07; Standard Test Method for Flexural Properties of Polymer Matrix Composite Materials. ASTM International: West Conshohocken, PA, USA, 2007.
  63. Wirth, I.; Rébillat, M.; Letellier, F.; Kohl, M.; Conen, J.; Becker, M.O.; Rusch, T. Integration of printed sensors for the functionalization of composite components. In Proceedings of the 10th ECCOMAS Thematic Conference on Smart Structures and Materials (SMART 2023), Patras, Greece, 3–5 July 2023; pp. 1817–1826. [Google Scholar]
  64. Wen, P.; Zhao, S.; Chen, S.; Li, Y. A generalized remaining useful life prediction method for complex systems based on composite health indicator. Reliab. Eng. Syst. Saf. 2021, 205, 107241. [Google Scholar] [CrossRef]
  65. Loukopoulos, P.; Zolkiewski, G.; Bennett, I.; Sampath, S.; Pilidis, P.; Duan, F.; Sattar, T.; Mba, D. Reciprocating compressor prognostics of an instantaneous failure mode utilising temperature only measurements. Appl. Acoust. 2019, 147, 77–86. [Google Scholar] [CrossRef]
Figure 1. Representation of FOD panels: (a) schematic, (b) actual panel.
Aerospace 12 00963 g001
Figure 2. Experimental setup: (a) 4-point bending setup, (b) measurement setup.
Aerospace 12 00963 g002
Figure 3. Sensor locations (as seen from the top side of the panel:) (a) PZT, (b) FBG mounted on the bottom surface and impact.
Aerospace 12 00963 g003
Figure 4. Schematic representation of the acquisition sequence.
Aerospace 12 00963 g004
Figure 5. Failure types: (a) complete failure, (b) skin damage from pins, (c) deformation of leading edge, (d) skin tears.
Aerospace 12 00963 g005
Figure 6. Stiffness change vs. time and load.
Aerospace 12 00963 g006
Figure 7. Surface-bonded strain response.
Aerospace 12 00963 g007
Figure 8. Strain differential difference between pairs of sensors. (a) Sensors close to damage (within 70 mm), (b) Sensors far away from damage (larger than 70 mm).
Aerospace 12 00963 g008
Figure 9. Normalized excitation (dotted lines) at central frequencies of 50, 100, 150, 200, and 250 kHz and the corresponding normalized denoised signals measured by printed sensor LLE 2.
Aerospace 12 00963 g009
Figure 10. Normalized denoised signals measured by printed PZT sensors’ array LLE for excitation from sensor 1 at 50 kHz.
Aerospace 12 00963 g010
Figure 11. Comparison between the excitation and corresponding responses measured by standard ceramic sensors at (a) 50 kHz, (b) 150 kHz across various degradation states of the panel, and (c) 200 kHz across various degradation states of the panel.
Aerospace 12 00963 g011
Figure 12. Guided wave-based health indicator.
Aerospace 12 00963 g012
Table 1. Testing parameters.
Load No.LoadExpected MTS DisplacementLoading Rate
(kN)(mm)(mm/min)
146.6215.0
2813.2229.0
31221.1044.5
41425.7853.0
51631.0063.0
61835.5472.5
72039.9583.0
82243.7094.0
92448.33105.5
102656.00117.5
112870.12130
Table 2. FOD information.
Spec No.Impact Location [x,y] (in mm)Impact Energy (in J)Time of Impact (in Cycles)Failure Timer (in Cycles)Failure Load (in kN)
Panel 01[515,176]500330024
Panel 02[305,135]50600306522
Panel 03No impact--322624
Panel 04[505,203]551400320024
Panel 05[514,180]550330024
Table 3. Features used for PCA.
Feature NameMathematical FormulaDescription/Hyperparameters
Time-domain and Amplitude Features
mean μ = 1 N i = 1 N x i Arithmetic mean of the signal.   
std σ = 1 N i = 1 N ( x i μ ) 2 Standard deviation of the signal.   
peak_amp max i | x i | Maximum absolute amplitude.   
rms x r m s = 1 N i = 1 N x i 2 Root mean square.   
zero_crossings i = 1 N 1 1 { x i · x i + 1 < 0 } Times the signal value crosses zero.   
iqr Q 3 Q 1 Interquartile range.   
mad 1 N i = 1 N | x i μ | Mean absolute deviation from the mean.   
skewness γ 1 = 1 N i = 1 N ( x i μ ) 3 σ 3 Asymmetry of probability distribution.   
kurtosis k = 1 N i = 1 N ( x i μ ) 4 σ 4 3 Fisher’s (excess) kurtosis.   
p2p_amp max ( x ) min ( x ) Peak-to-peak amplitude.   
energy E = i = 1 N x i 2 Sum of the squared signal values.   
crest_factor C F = max i | x i | x r m s Ratio of peak amplitude to the RMS.   
clearance_factor C L F = max i | x i | ( 1 N i = 1 N | x i | ) 2 Indicates the presence of impulses.   
impulse_factor I F = max i | x i | 1 N i = 1 N | x i | Ratio of peak value to mean absolute value.   
shape_factor S F = x r m s 1 N i = 1 N | x i | Ratio of RMS to mean absolute value.   
Peak Features (where k is the number of peaks found)
n_peakskTotal number of detected peaks.
Hyperparameter: min peak `height = 0’.
peak_mean μ P = 1 k j = 1 k p j Mean amplitude of the detected peaks ( p j ).   
peak_std σ P = 1 k j = 1 k ( p j μ P ) 2 Standard deviation of peak amplitudes.   
peak_dist_mean μ D = 1 k 1 j = 1 k 1 d j Mean distance (in samples) between
consecutive peaks ( d j ).   
peak_dist_std σ D = 1 k 1 j = 1 k 1 ( d j μ D ) 2 Standard deviation of inter-peak distances.   
Envelope Features (where A is the signal envelope via Hilbert transform)
env_mean μ e n v = 1 N i = 1 N A i Mean of the signal’s instantaneous amplitude.   
env_max max i A i Maximum of the signal envelope.   
env_std σ e n v = 1 N i = 1 N ( A i μ e n v ) 2 Standard deviation of the signal envelope.   
env_kurtosis k e n v = 1 N i = 1 N ( A i μ e n v ) 4 σ e n v 4 3 Kurtosis of the signal envelope values.   
env_skewness γ 1 , e n v = 1 N i = 1 N ( A i μ e n v ) 3 σ e n v 3 Skewness of the signal envelope values.   
Frequency-domain Features (where P ( f ) is the Power Spectral Density)
dom_freq f d o m = arg max f P ( f ) Dominant frequency with the highest power.   
mean_freq f m e a n = f f · P ( f ) f P ( f ) Spectral centroid; the “center of mass” of
the spectrum.   
Disclaimer/Publisher’s Note: The statements, opinions and data contained in all publications are solely those of the individual author(s) and contributor(s) and not of MDPI and/or the editor(s). MDPI and/or the editor(s) disclaim responsibility for any injury to people or property resulting from any ideas, methods, instructions or products referred to in the content.