Article

Study on Thermal Stratification and Heat Transfer Characteristics in a Fuel Tank of Hypersonic Vehicles

School of Aerospace Engineering, Huazhong University of Science and Technology, Wuhan 430074, China
*
Author to whom correspondence should be addressed.
Aerospace 2025, 12(11), 1020; https://doi.org/10.3390/aerospace12111020
Submission received: 13 October 2025 / Revised: 5 November 2025 / Accepted: 6 November 2025 / Published: 18 November 2025

Abstract

This research presents numerical and experimental investigations of thermal stratification occurring in the fuel tank of a hypersonic vehicle. The effects of heating power on the stability, intensity, development rate, and heat distribution characteristics of thermal stratification in the water tank are evaluated. The Richardson number, Stratification number, penetration time, and thermal stratification energy ratio are used for this evaluation. Additionally, the field synergy principle is introduced to reveal the flow and heat transfer mechanisms. The numerical model is in good agreement with the experimental results at different heating powers. It is observed that the stability and intensity of thermal stratification exhibit a rapid increase initially and then tend to stabilize gradually with increased heating time. Higher heating power enhances the development rate and stability and alters the heat distribution characteristics of the thermal stratification. Moreover, heat transfer is primarily dominated by heat conduction in the vicinity of the wall and top region of the fuel tank. In contrast, the bottom region is characterized by an unsteady alternating distribution of heat conduction and convection, where the range of heat conduction is more extensive. Finally, the experiment demonstrates that the phenomenon of thermal stratification within the fuel tank is more pronounced.

1. Introduction

Hypersonic vehicles are crucial for commercial and military purposes due to their high flight speed and strong defense capabilities [1,2]. However, as the flight speed and range of these vehicles increase, the aerodynamic thermal environment becomes more severe. This is especially evident in the fuel tank, where the transfer of aerodynamic heat causes an increase in fluid temperature and a decrease in fluid density. As a result, thermal stratification occurs, with the higher temperature (lower density) fluid flowing upward and the lower temperature (higher density) fluid flowing downward due to buoyancy forces [3]. This phenomenon can lead to local overheating of the fuel tank and the possibility of local boiling and vaporization, which may result in cavitation in the transfer pump and negatively impact engine performance. Therefore, the thermal stratification in the fuel tank is critical for the overall performance of aerospace vehicles [4,5,6].
Since the 1960s, an increasing number of researchers have conducted simulations and predictions for thermal stratification in fuel tanks. Vliet et al. [7] developed a simplified approximate integral model of thermal stratification based on bottom heating. The numerical model was applicable to cylindrical tanks, but less so to non-flat-bottom tanks compared to experimental results. Fan et al. [8] conducted an analytical study via the energy and momentum equation in the presence of a heated side wall in a closed storage tank. The analytical and experimental results agreed well under low heat flux conditions. Daigle et al. [9] proposed a simplified dynamic model to investigate the impact of natural convection-driven thermal stratification in a liquid hydrogen cryogenic fuel tank under various operating conditions. Their study found that an increase in gravity would lead to improved heat transfer from the fluid to the wall. Liu et al. [10] conducted a numerical simulation and showed that intermittent oscillation could affect the thermal stratification characteristics in a low-temperature fuel tank. They observed a significant change in steam temperature near the wall when sloshing occurred. According to Duan et al. [11], a prediction model for thermal stratification in the fuel tank was developed by employing a moving boundary method. The development of the boundary layer during the early heating stage of the tank could enhance free convection. However, the subsequent development would weaken free convection.
Relatively comprehensive quantitative assessment methods have been proposed to quantify thermal stratification and control buoyancy-driven convection in tanks, particularly in water and energy storage tanks. For example, Bouhal et al. [12] evaluated the thermal stratification performance of vertical water storage tanks using dimensionless numbers such as the Richardson number [13,14] and Stratification number [15,16], considering various internal plate layout schemes. They found that the flat plate at mid-height effectively enhanced thermal performance. In a similar vein, Wang et al. [17] developed a new inlet equalizer to mitigate thermal stratification issues in water storage tanks. Their results indicated that as the inlet flow rate increased, the Richardson number decreased while the Mix number [18,19] exhibited a decreasing-then-increasing trend. Furthermore, the equalizer reduced the mixing between hot and cold water, thus improving thermal stratification. To further promote thermal stratification, Kumar et al. [20] incorporated phase change material in the top of a hot water storage tank and assessed thermal stratification performance using the Stratification number. Additionally, Erdemir et al. [21,22] examined the effects of baffle arrangement on thermal stratification in vertical and horizontal water storage tanks, using the Richardson number as the evaluation criterion. They demonstrated that appropriate baffle arrangements could enhance thermal stratification. Quantitative research on thermal stratification within fuel tanks is valuable in facilitating the design of thermal protection systems and fuel tanks for aircraft to ensure fuel stability under severe aerodynamic heating conditions. This research holds significant theoretical and engineering implications for the successful execution of flight missions.
This study aims to investigate the mechanism and provide a quantitative analysis of thermal stratification in the fuel tank of hypersonic vehicles under extreme thermal conditions. While extensive research has been conducted on thermal stratification in water and energy storage tanks, the thermal environment outside the fuel tank of high-speed and long-range hypersonic vehicles is much more severe, making the impact of thermal stratification on the reliability of the thermal protection system more significant. In order to validate the methodology and elucidate the underlying mechanism, experimental and simulation studies were initially conducted using water. Subsequently, experimental studies were carried out using fuel to provide further substantiation for these investigations. The paper is structured as follows: Section 2 describes the experimental setup used to obtain the experimental results, and Section 3 presents and validates the numerical model using the experimental results. The theoretical analysis method is introduced in Section 4, and Section 5 evaluates the stability, intensity, development rate, and heat distribution characteristics of thermal stratification in the fuel tank quantitatively, using the Richardson number, Stratification number, penetration time, and thermal stratification energy ratio, respectively. In addition, the field synergy principle is employed to reveal the mechanism of thermal stratification. Finally, the thermal stratification characteristics of fuel in the tank under the heat flux are further examined. This study aims to explore the thermophysical mechanism of thermal stratification in a fuel tank and provide guidance for future research to mitigate this phenomenon.

2. Experiment System

The tank heating system was designed to investigate the temperature distribution and heat transfer characteristics during thermal stratification. Figure 1 illustrates the main components of the experimental system, including the tank, the heating and insulation module, the temperature measurement module, the flow meter, the piping and the valves. The tank has an internal radius of 150 mm, a cylindrical section with a length of 400 mm and a short radius of 50 mm at each end. This tank is constructed of 304 stainless steel and the thickness of the shell is 2 mm. A silicone rubber resistance heater with a maximum heating temperature of 523.15 K was used to heat the cylindrical section of the tank, and aluminum silicate insulation was used to isolate the heat exchange with the outside world. The heating power is controlled by regulating the voltage of the heater with a transformer. The cylindrical section of the fuel tank is equipped with a heater, which serves to simulate the aerodynamic heat flux transmitted through the thermal protection system into the fuel tank. The two ends of the cylindrical section are assumed to be perfectly insulated.
The present paper expounds upon experimental investigations conducted on two working fluids: water and fuel. In the instance of water being utilized as the working fluid, the heating powers employed were 202 W, 435 W, 667 W, and 900 W. However, when fuel was employed as the working fluid, and taking into consideration the prevailing safety concerns, experimental studies were conducted exclusively on the thermal stratification phenomenon within the storage tank at a heating power of 550 W.
In the tank, K-type thermocouples with an accuracy of ±0.2 K (in the range of 0–523.15 K) are arranged to measure the temperature change of the fluid at different heights. The arrangement of the thermocouples is shown in Figure 1. Eighteen thermocouples are arranged vertically, with a spacing of 50 mm between the 1st–4th points, 30 mm between the 4th–5th points, 10 mm between the 5th–16th points, and 5 mm between the 16th–18th points. To accurately capture the temperature distribution characteristics, the thermocouples located in the top region of the fuel tank are densely arranged due to the significant temperature gradient. The positional coordinates of the thermocouples are listed in Table 1. A temperature recorder (MT-X) with an accuracy of ±0.1 K is used to collect the real-time temperature data every second. The real-time heating power data of the heater was collected every second by a power meter (three-phase electric parameter tester, PM9830). Before the experiment, the thermocouples were initially placed in a constant-temperature oil bath to ensure the accuracy of temperature measurements. The calibration of the thermocouples and temperature loggers was then performed using a mercury thermometer to further ensure measurement precision.
The specific procedure for conducting this experiment is as follows:
  • To begin, activate the stirring apparatus in the thermostatic liquid container. Adjust the thermostat to ensure that the temperature of the inlet fluid remains constant and uniformly distributed.
  • Open valves 2 and 4 while closing valve 3. Start pump 5 to transport the fluid from the thermostatic liquid container to the tank. Monitor flow meter 7 and regulate the pump flow rate to prevent any damage to the thermocouple caused by excessive flow. When a small amount of fluid overflows into the overflow vessel, close valve 2.
  • Monitor the thermocouple readings. Once the temperature distribution is steady, switch on the heater and simultaneously activate the temperature and power recorder.
  • After heating for 1600s, turn off the heater, temperature recorder, and power recorder. Open valve 3, activate pump 8, and transfer the heated fluid to the heated liquid container while observing flow meter 8. Once the fluid has been transferred, close valve 3 and stop pump 8.
All K-type thermocouples used in this study were individually calibrated within the experimental temperature range, yielding a measurement uncertainty of ±0.7 K (coverage factor k = 2). The power meter was verified using a standard resistive load, and its measurement uncertainty was determined to be ±0.8%. The systematic errors primarily originated from thermocouple calibration (±0.5 K) and power measurement accuracy (±0.5%), while the random errors associated with temperature and power readings were estimated to be ±0.3 K and ±0.4%, respectively. To ensure data reliability, each experimental condition was repeated at least three times, and the reported data represent the average of the repeated measurements. The standard deviations of heat flux and wall temperature from the repeated tests were below 1.2% and 1.5%, respectively, demonstrating good repeatability of the experimental results.

3. Numerical Simulation

3.1. Numerical Method

The flow and heat transfer processes of the fluid are described by the continuity, momentum, and energy conservation equations. The Rayleigh number and Reynolds number of the fluid inside the storage tank remained within the laminar regime throughout the range of heating power and duration considered in this study. Therefore, a laminar flow model was adopted for the numerical simulations. The specific control equations are as follows:
Continuity equation:
ρ t + ( ρ u ) x + ( ρ v ) y + ( ρ w ) z = 0
where ρ represents the density of the fluid, t represents the time, and u , v , and w are the components of the velocity vector in the x , y , and z direction.
Momentum equation:
( ρ u ) t + ( ρ u u ) x + ( ρ u v ) y + ( ρ u w ) z = x ( μ u x ) + y ( μ u y ) + z ( μ u z ) + [ ( ρ u 2 ) x ( ρ u v ) y ( ρ u w ) z ] p x
( ρ v ) t + ( ρ v u ) x + ( ρ v v ) y + ( ρ v w ) z = x ( μ v x ) + y ( μ v y ) + z ( μ v z ) + [ ( ρ u v ) x ( ρ v 2 ) y ( ρ v w ) z ] p y
( ρ w ) t + ( ρ w u ) x + ( ρ w v ) y + ( ρ w w ) z = x ( μ w x ) + y ( μ w y ) + z ( μ w z ) + [ ( ρ u w ) x ( ρ v w ) y ( ρ w 2 ) z ] p z + g ( ρ ρ 0 )
where μ represents the viscosity, p represents the pressure, and g represents the acceleration due to gravity.
Energy equation:
( ρ E ) t + [ u ( ρ E + p ) ] = [ k e f f T j h j J j + ( τ e f f u ) ]
where k e f f represents the effective thermal conductivity coefficient, h j represents the enthalpy of the fluid, J j represents the diffusive flux of the fluid, and the first term on the right side of the equation represents the energy transfer due to heat conduction, mass diffusion, and viscous dissipation. E represents the sum of internal energy, potential energy, and kinetic energy.
The commercial software ANSYS FLUENT 19.0 is used to solve the governing equations and simulate the unsteady flow and heat transfer of the thermal stratification in the tank. The pressure and velocity are linked using the SIMPLE algorithm, and the continuity, momentum, and energy equations are discretized by the second-order upwind scheme.

3.2. Physical Parameters and Boundary Conditions

The temperature-dependent fluid properties are used to describe the buoyancy forces and convective heat transfer. Gravity acts in the negative direction of the y-axis with a magnitude of 9.81 m/s2. The following equations describe the density, specific heat capacity, dynamic viscosity, and thermal conductivity of water as functions of polynomials [18].
Density:
ρ = 999.8 + 0.06755 T 0.008788 T 2 + 7.824 T × 10 5 T 3 5.734 × 10 7 T 4 + 1.901 × 10 9 T 5
Specific heat capacity:
C p = 4.217 0.00338 T + 0.0001142 T 2 1.924 × 10 6 T 3 + 1.724 × 10 8 T 4 6.156 × 10 11 T 5
Dynamic viscosity:
μ = 0.001789 5.994 × 10 5 T + 1.383 × 10 6 T 2 2.105 × 10 8 T 3 + 1.811 × 10 10 T 4 6.51 × 10 13 T 5
Thermal conductivity:
λ = 0.5558 + 0.002425 T 1.839 × 10 5 T 2 + 1.46 × 10 7 T 3 1.934 × 10 9 T 4 + 1.106 × 10 11 T 5
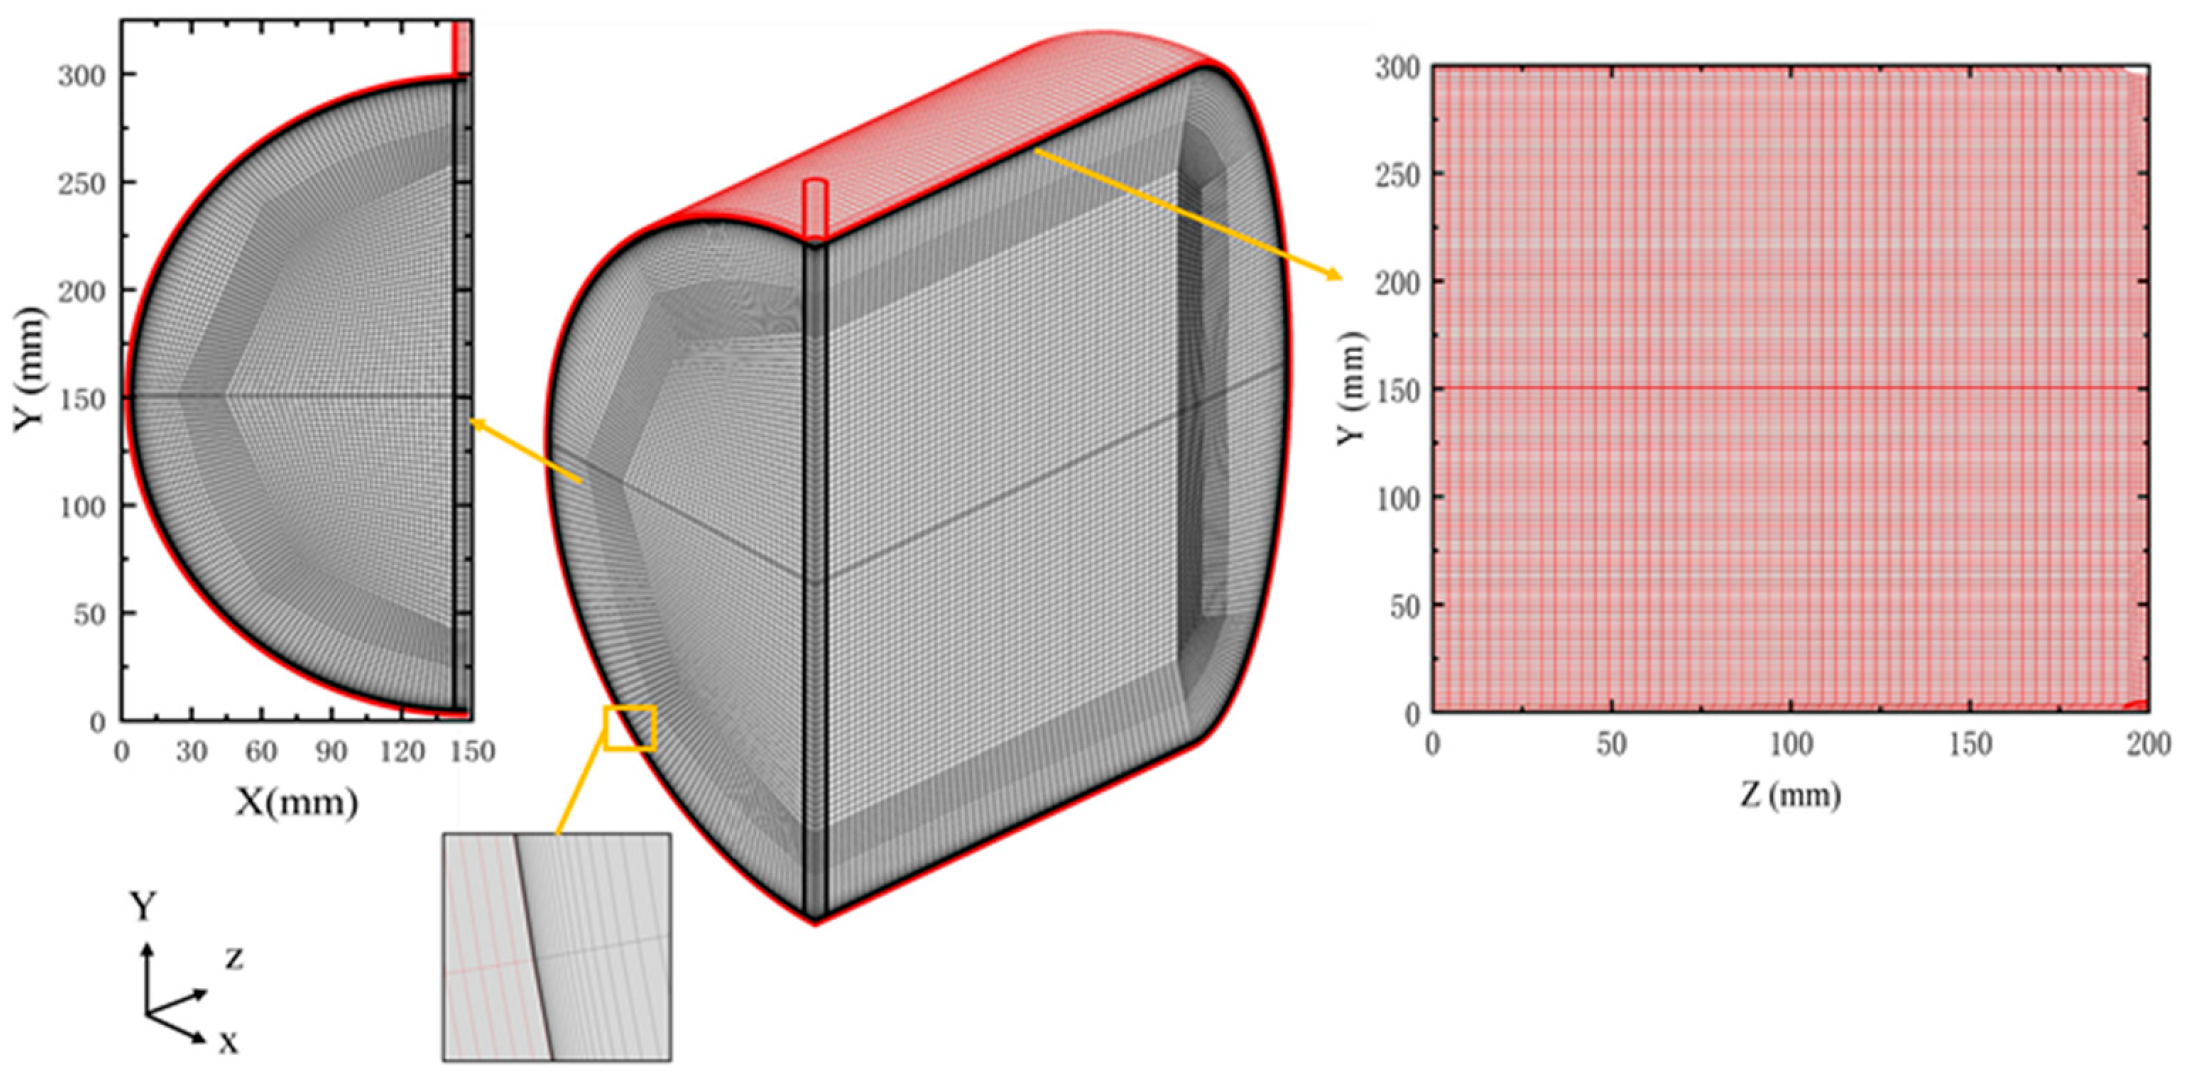
As shown in Figure 2, a quarter-symmetric tank model is used to conserve computational resources. The overflow outlet is positioned at the top of the tank with a relative pressure of 0 Pa (the reference pressure is atmospheric pressure). The initial temperature of the fluid and tank is set to 301.65 K, and the initial velocity of the fluid is 0 m/s. The experimentally measured heating power over time is applied to the outer wall of the cylindrical section of the tank. It is assumed that the heat flux from the heating surface is homogeneous. An adiabatic wall is applied at the curved end. The inner wall of the fuel tank is modeled as a fluid–solid coupled wall based on the no-slip boundary condition.

3.3. Grid Convergence

ANSYS ICEM was used to draw the grid of the tank. The red grid is the solid region, and the gray grid is the fluid region, as shown in Figure 2. The grid independence was verified under a heating power of 900 W with a heating time of 1600 s. Five different structured computational grids of the fluid region were compared, as shown in Table 2. Three different structured computational grids of the solid region were compared, as shown in Table 3. The boundary layer grid is adapted near the inner wall of the tank to capture the changes in temperature, density and velocity.
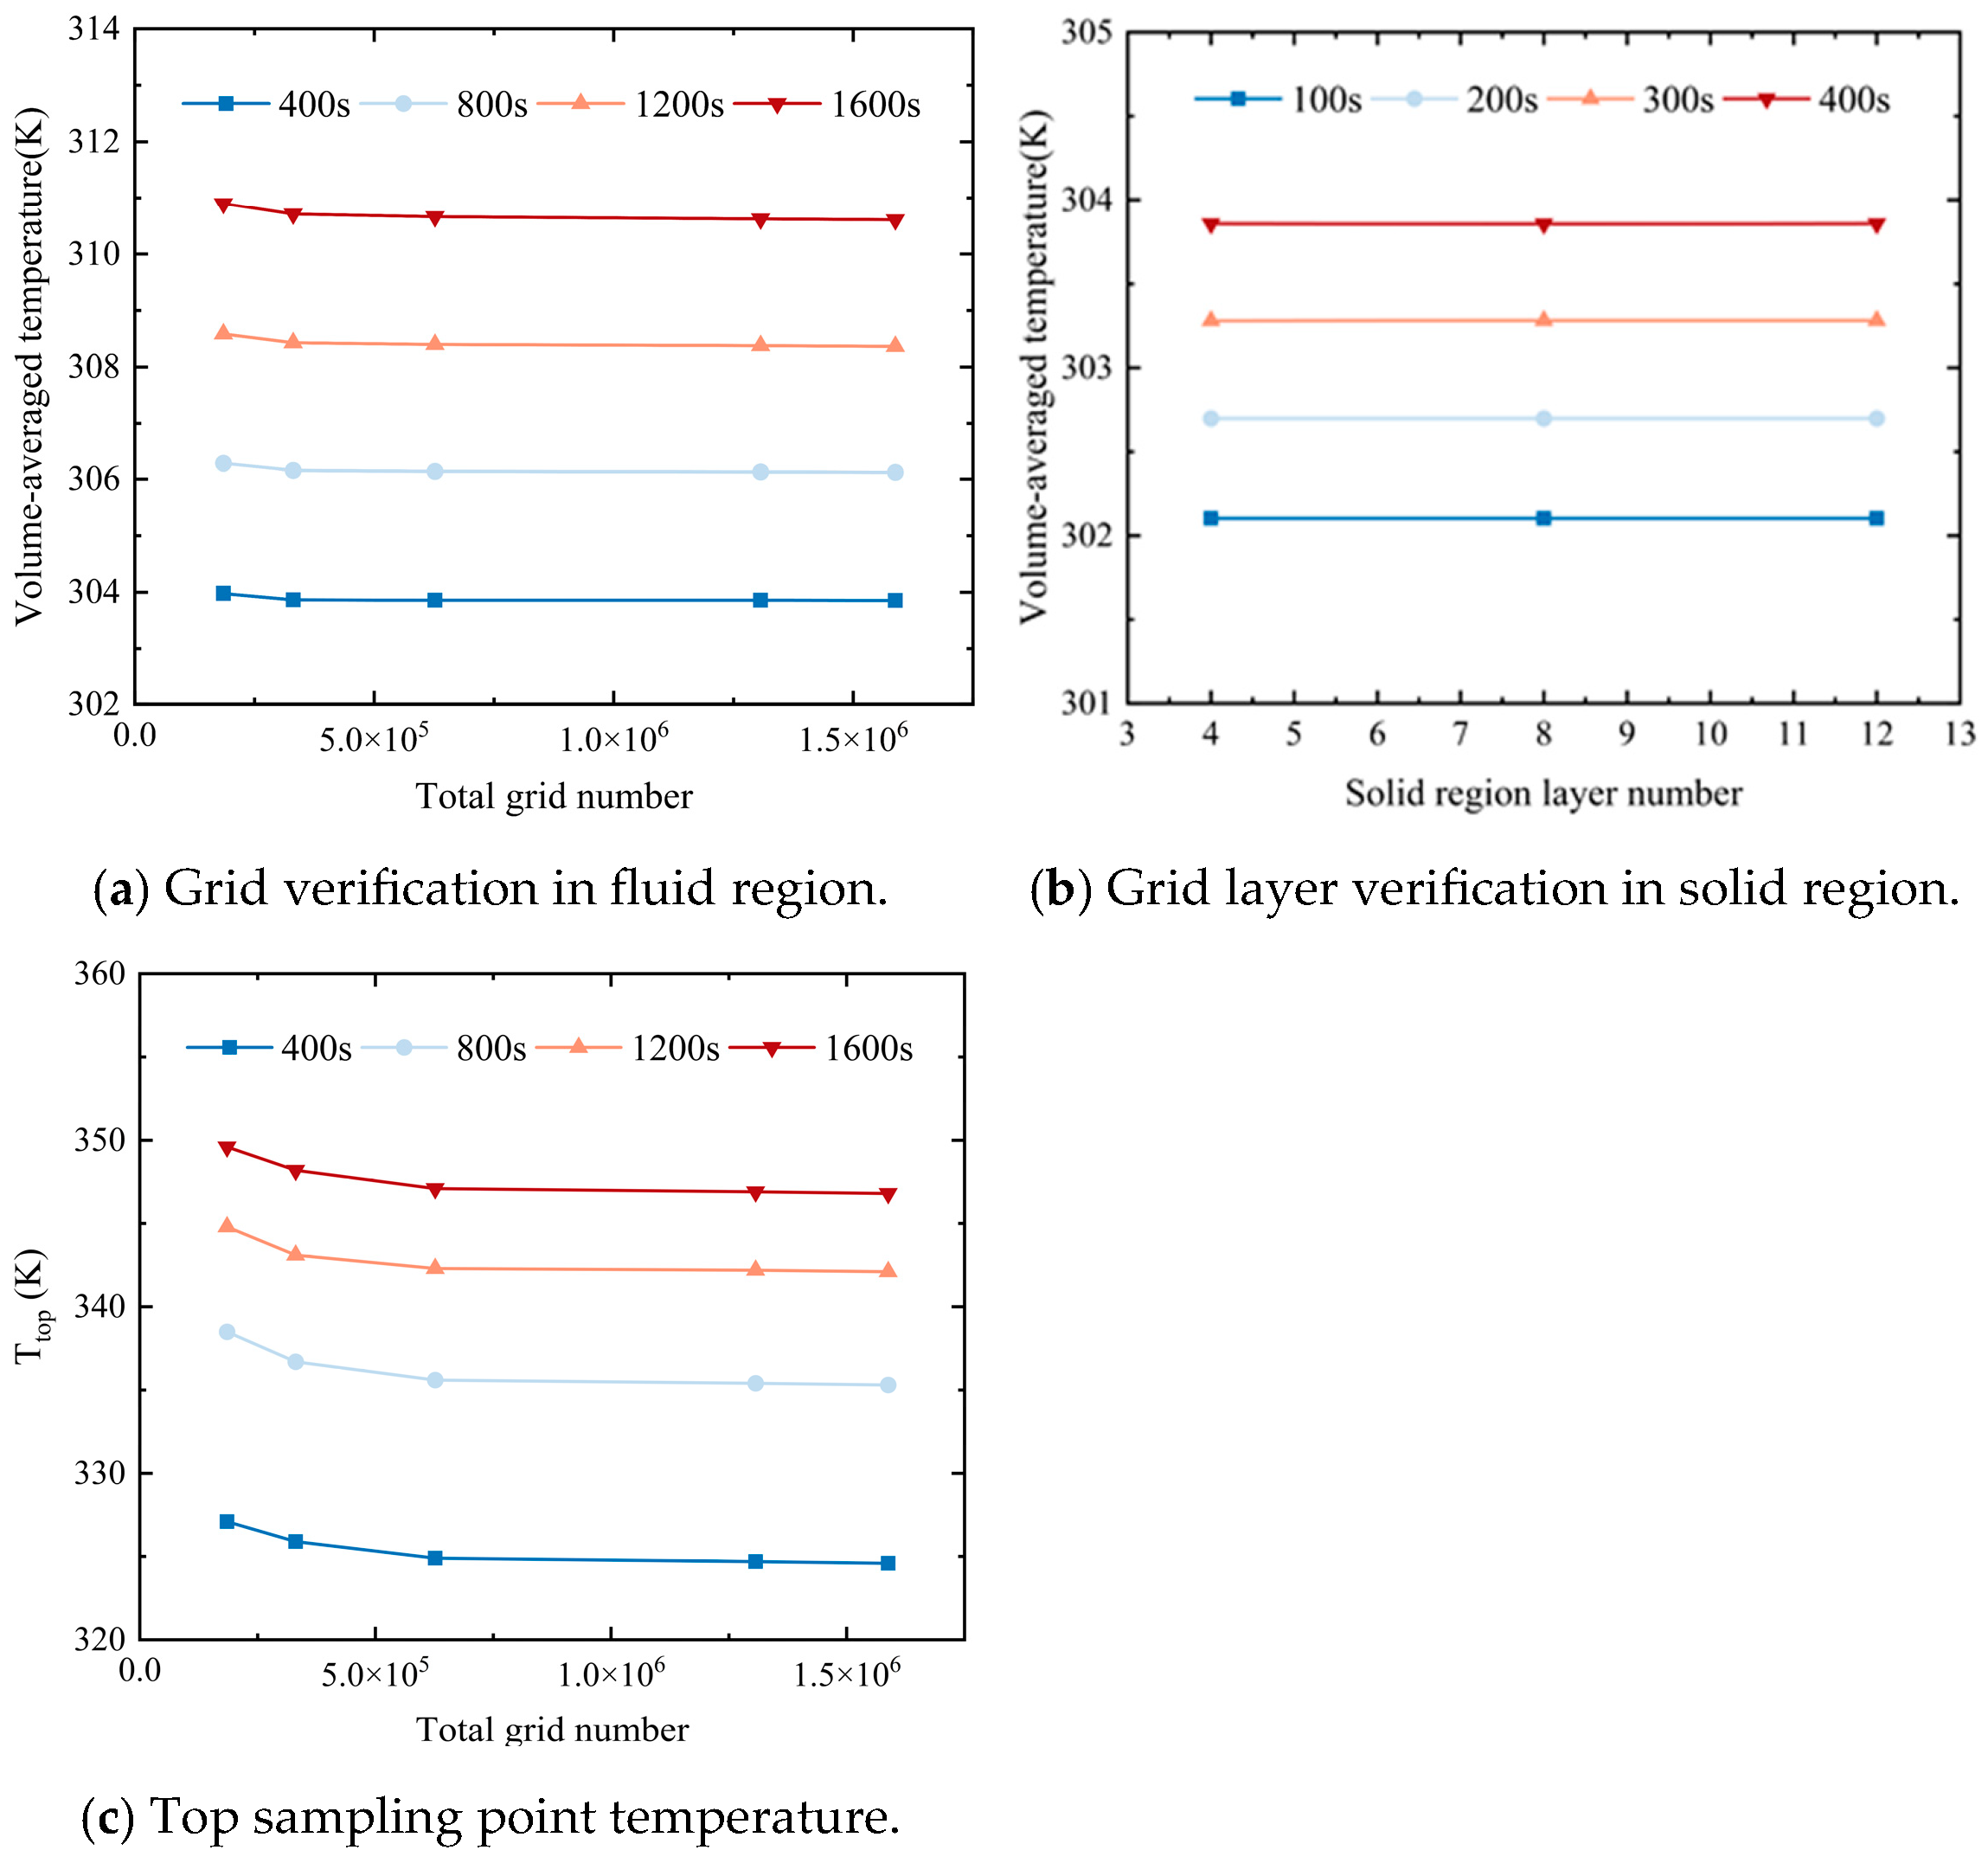
The volume-averaged temperature of the fluid at different times is illustrated in Figure 3a. When the grid thickness of the first layer in the fluid region decreased from 0.005 mm to 0.002 mm, the grid number increased from 1,306,870 to 1,587,990. The relative deviation of the volume-averaged temperature of the fluid region obtained by simulation is less than 0.1%. According to Figure 3b, when the number of grid layers in the solid region increases from 4 to 12 and the corresponding number of solid region grids increases from 35,508 to 105,276, the relative deviation of the volume-averaged temperature is also less than 0.1%. As shown in Figure 3c, when the total mesh number increases from 1,306,870 to 1,587,990, the temperature variation rate at the top sampling point inside the tank remains below 1%. Therefore, considering the computational accuracy and cost, a fluid region grid with a first grid height of 0.005 mm and a solid region grid with eight layers are used. The total number of grids is 1,306,870.
In the numerical simulations, a time step of 0.01 s was adopted to ensure temporal stability and spatial accuracy. Under this setting, the overall Courant number (CFL) remained below 1, thereby guaranteeing numerical stability and convergence. The choice of the 0.01 s time step was based on a time-step independence verification conducted with four different values: 0.4 s, 0.2 s, 0.1 s, and 0.05 s. The results showed that the temperature distributions obtained with time steps of 0.1 s and 0.05 s were nearly identical, whereas significant deviations were observed when using 0.4 s and 0.2 s. The mesh quality was evaluated using the minimum orthogonal quality metric, which yielded a minimum value of 0.1, indicating that no significant mesh distortion occurred and that the grid resolution was sufficient to accurately capture the natural convection characteristics within the tank.

3.4. Validation of Numerical Methods

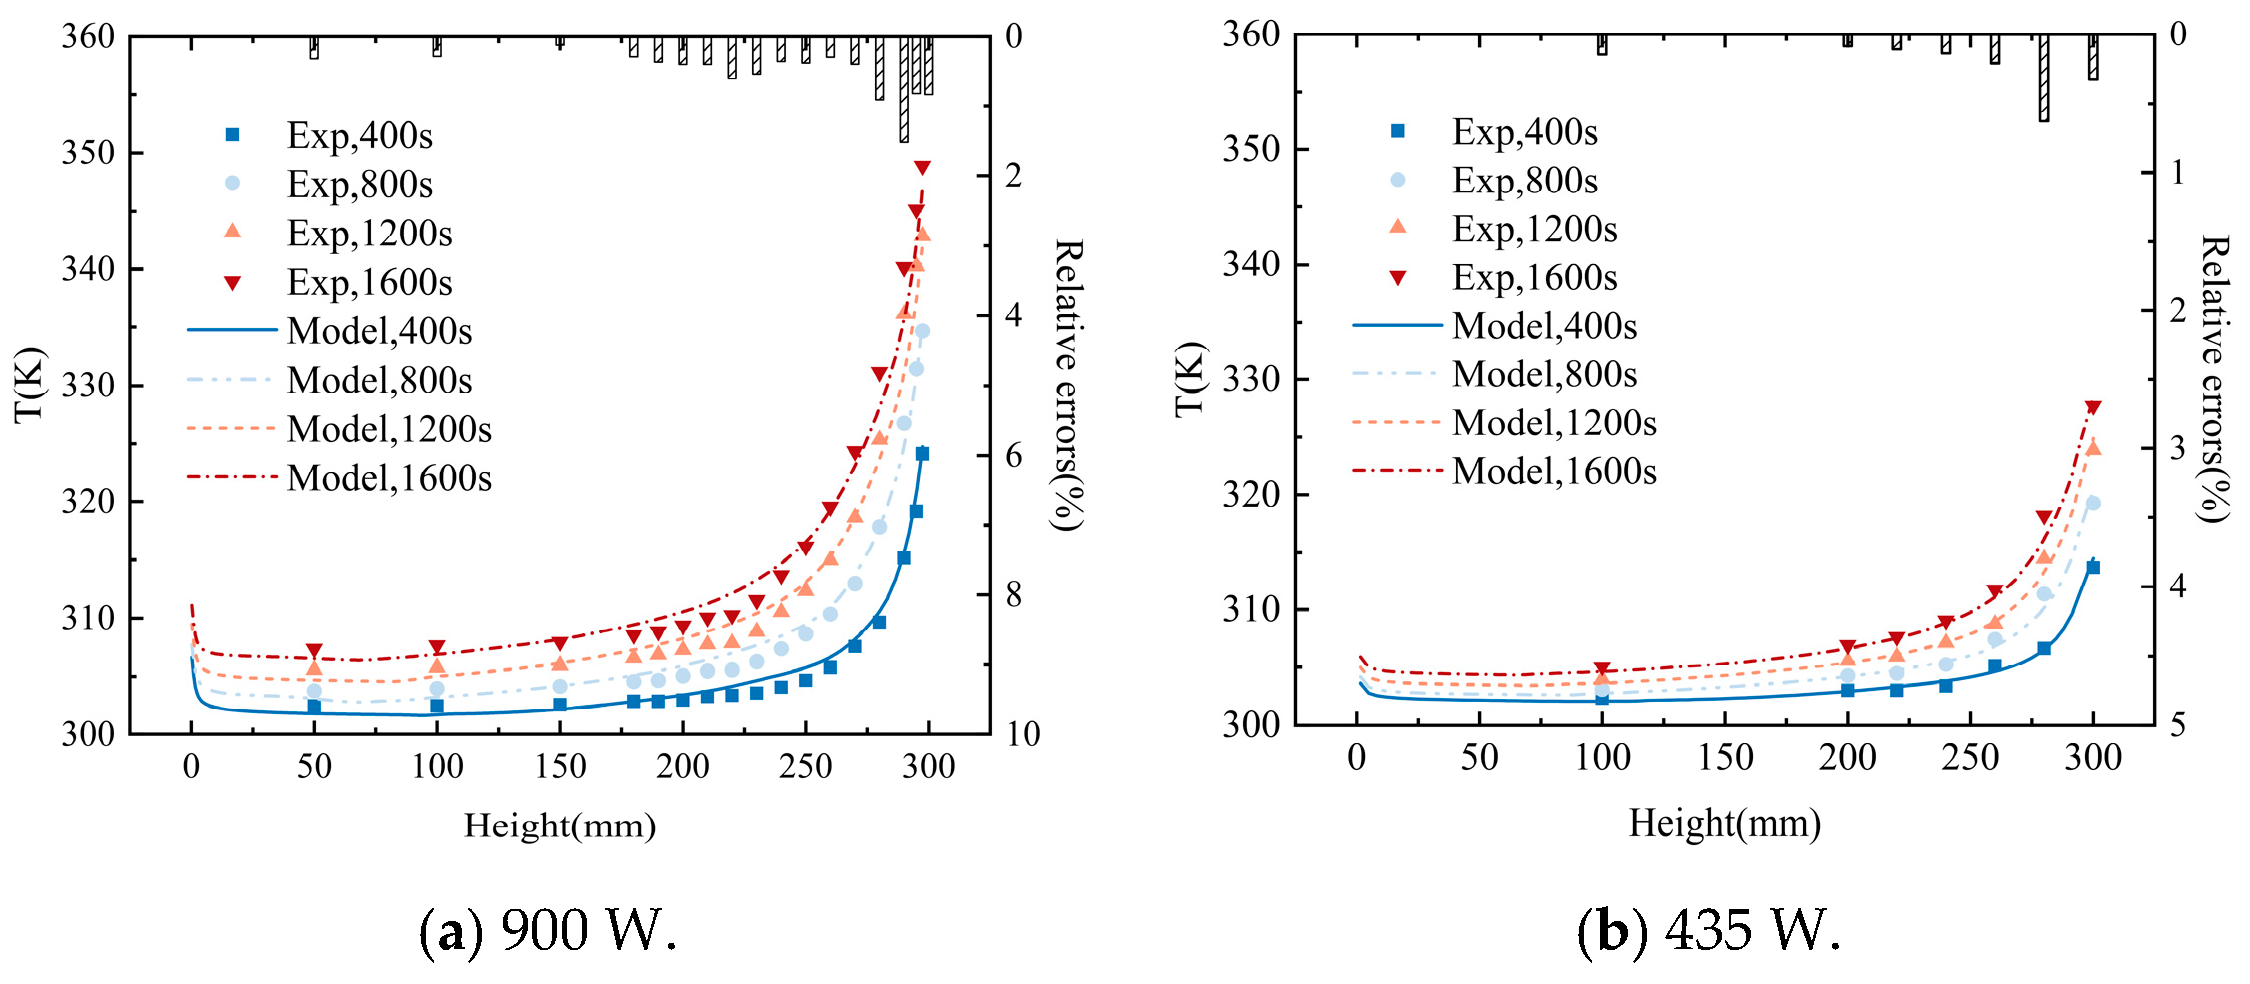
The numerical simulation is further validated based on the experimental results with different heating powers. Figure 4a,b show the temperature variation along the height with a heating power of 900 W and 435 W, respectively. Compared to the experimental results, the maximum relative error is less than 2%, demonstrating the accuracy and reliability of the numerical method. The relative error histogram in Figure 4, located on the upper x-axis, illustrates that the relative error at the top of the fuel tank is considerably higher than in other regions. This can be attributed to the higher temperature gradient distribution at the top of the fuel tank and the corresponding heightened flow state.

4. Theoretical Analysis Method

4.1. Quantification of Thermal Stratification

The Richardson number, Stratification number, and penetration time were applied to evaluate the stability, intensity, and development rate of thermal stratification in the fuel tank. In addition, the thermal stratification energy ratio is proposed to analyze the heat distribution characteristic of thermal stratification.
The Richardson number is widely used to describe the stability of thermal stratification, which indicates the ratio of buoyancy and inertia force in natural convection. Furthermore, a Richardson number greater than 1 indicates that the convection caused by buoyancy is more robust than the convection caused by mixing. Therefore, the thermal stratification is more stable in a tank with an increase in Richardson number. In this study, the Richardson number is expressed as follows:
R i = g β L ( T t o p T b o t t o m ) V m a i n 2
where g is the gravitational acceleration, β is the coefficient of thermal expansion, L is the characteristic length, T t o p is the temperature of the fluid at the top of the tank, T b o t t o m is the temperature of the fluid at the bottom of the tank, and V m a i n is the volume-averaged velocity of the fluid in the tank.
The Stratification number is defined as the ratio between the average temperature gradient and the maximum temperature gradient of the fluid in the tank. It could be used to quantify the intensity of thermal stratification in the tank. A formula for calculating the Stratification number in a hot water storage tank was first proposed by Fernandez [23]:
S t r = ( T / y ) t ( T / y ) max
where
( T / y ) t = 1 N 1 i = 1 N 1 T i T i + 1 Δ y
T / y max = T max T i n i / L
i represents the temperature measurement nodes, N represents the number of nodes, Δ y represents the distance between nodes, T max represents the boiling point of the fluid under normal pressure, and T i n i represents the initial temperature of the fluid.
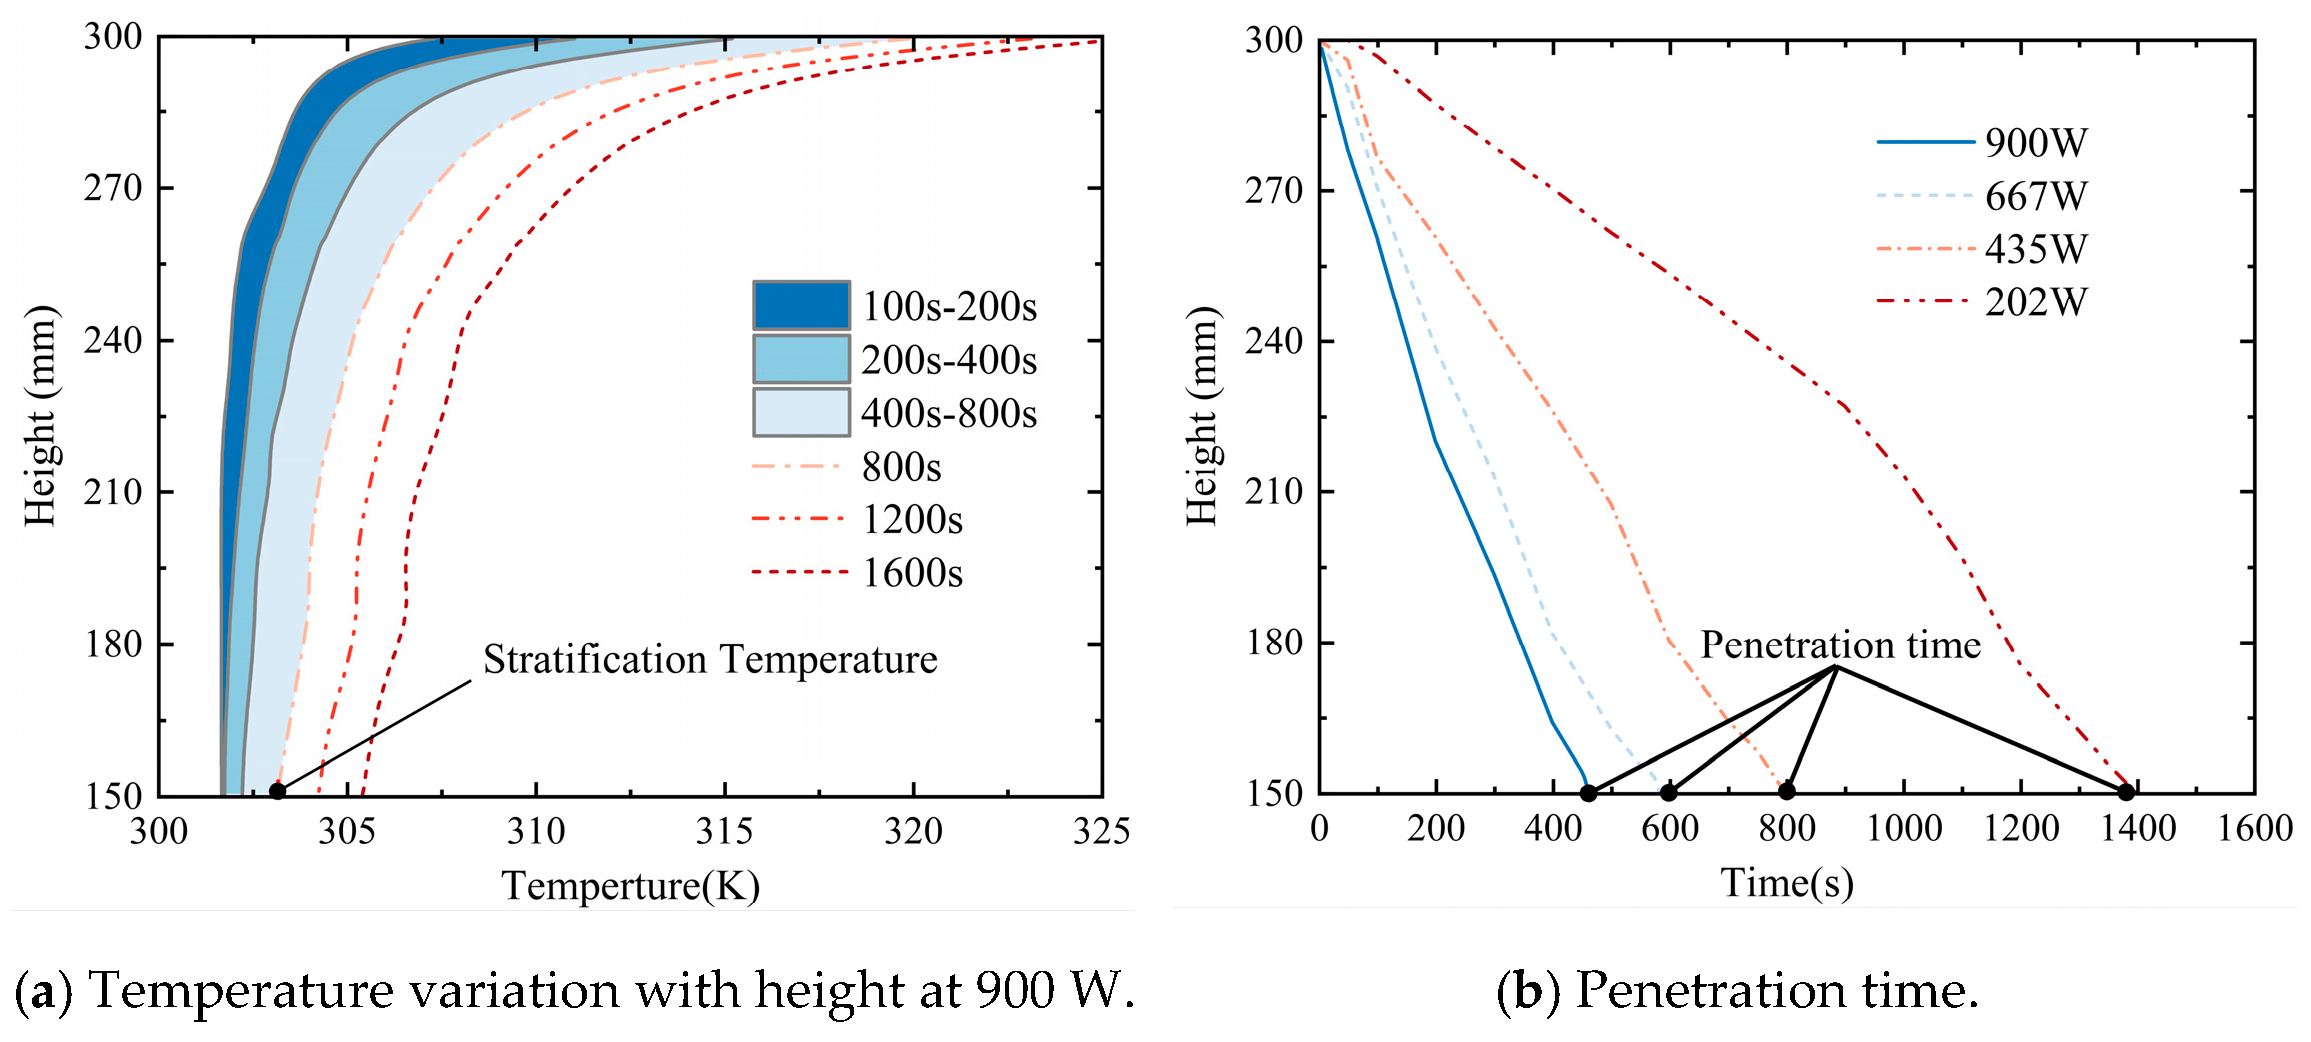
Furthermore, the range of thermal stratification is quantified with the “stratification temperature”, defined as the fluid temperature exceeding 303 K. The fluid that reaches the “stratification temperature” is in the region of thermal stratification. Meanwhile, the “penetration time” is introduced to quantify the development rate of the thermal stratification. The “penetration time” t p is defined as the time required for the temperature of the fluid at mid-height (y = 150 mm) to reach the “stratification temperature”.
In addition, the thermal stratification energy ratio η s t r is proposed to evaluate the ratio of the heat absorbed by the fluid in the region of thermal stratification to that by the total fluid, which is described as follows:
η s t r = Q s t r Q i n p u t Q s h e l l
Q = ρ C p V Δ T
where Q i n p u t , Q s t r , and Q s h e l l represent the heat input from the heater, the heat absorbed by the thermal stratification and the heat absorbed by the tank shell, respectively.

4.2. Field Synergy Principle

The field synergy principle (FSP) was first proposed by Guo [24] and has been successfully applied to heat transfer analysis in many fields [25,26,27,28], which can reveal the characteristics of heat transfer in thermal stratification. According to this principle, the heat exchange capacity is not only affected by the magnitude of the temperature gradient field and the velocity field but also by the synergy between them, i.e., the dot product of the temperature gradient and the velocity:
U T = U T cos θ
The synergy angle represents the intersection angle between the temperature gradient and velocity vector. The synergy angle is defined as follows:
θ = a r cos ( U ¯ T ¯ U ¯ T ¯ ) ( 180 π )
The synergy between the velocity and temperature gradient fields is better when the synergy angle is 0° or 180°. However, the field synergy angle of fluid in the tank is in a range that is less than 90° and higher than 90°, making it difficult for the synergy to be effectively compared. Therefore, the synergy angle range is set to [0, 90°] for effective comparisons, and the modified synergy angle is defined as follows [29]:
θ = a r cos ( U ¯ T ¯ U ¯ T ¯ ) ( 180 π )

5. Results and Discussion

5.1. Temperature and Flow Field Distribution

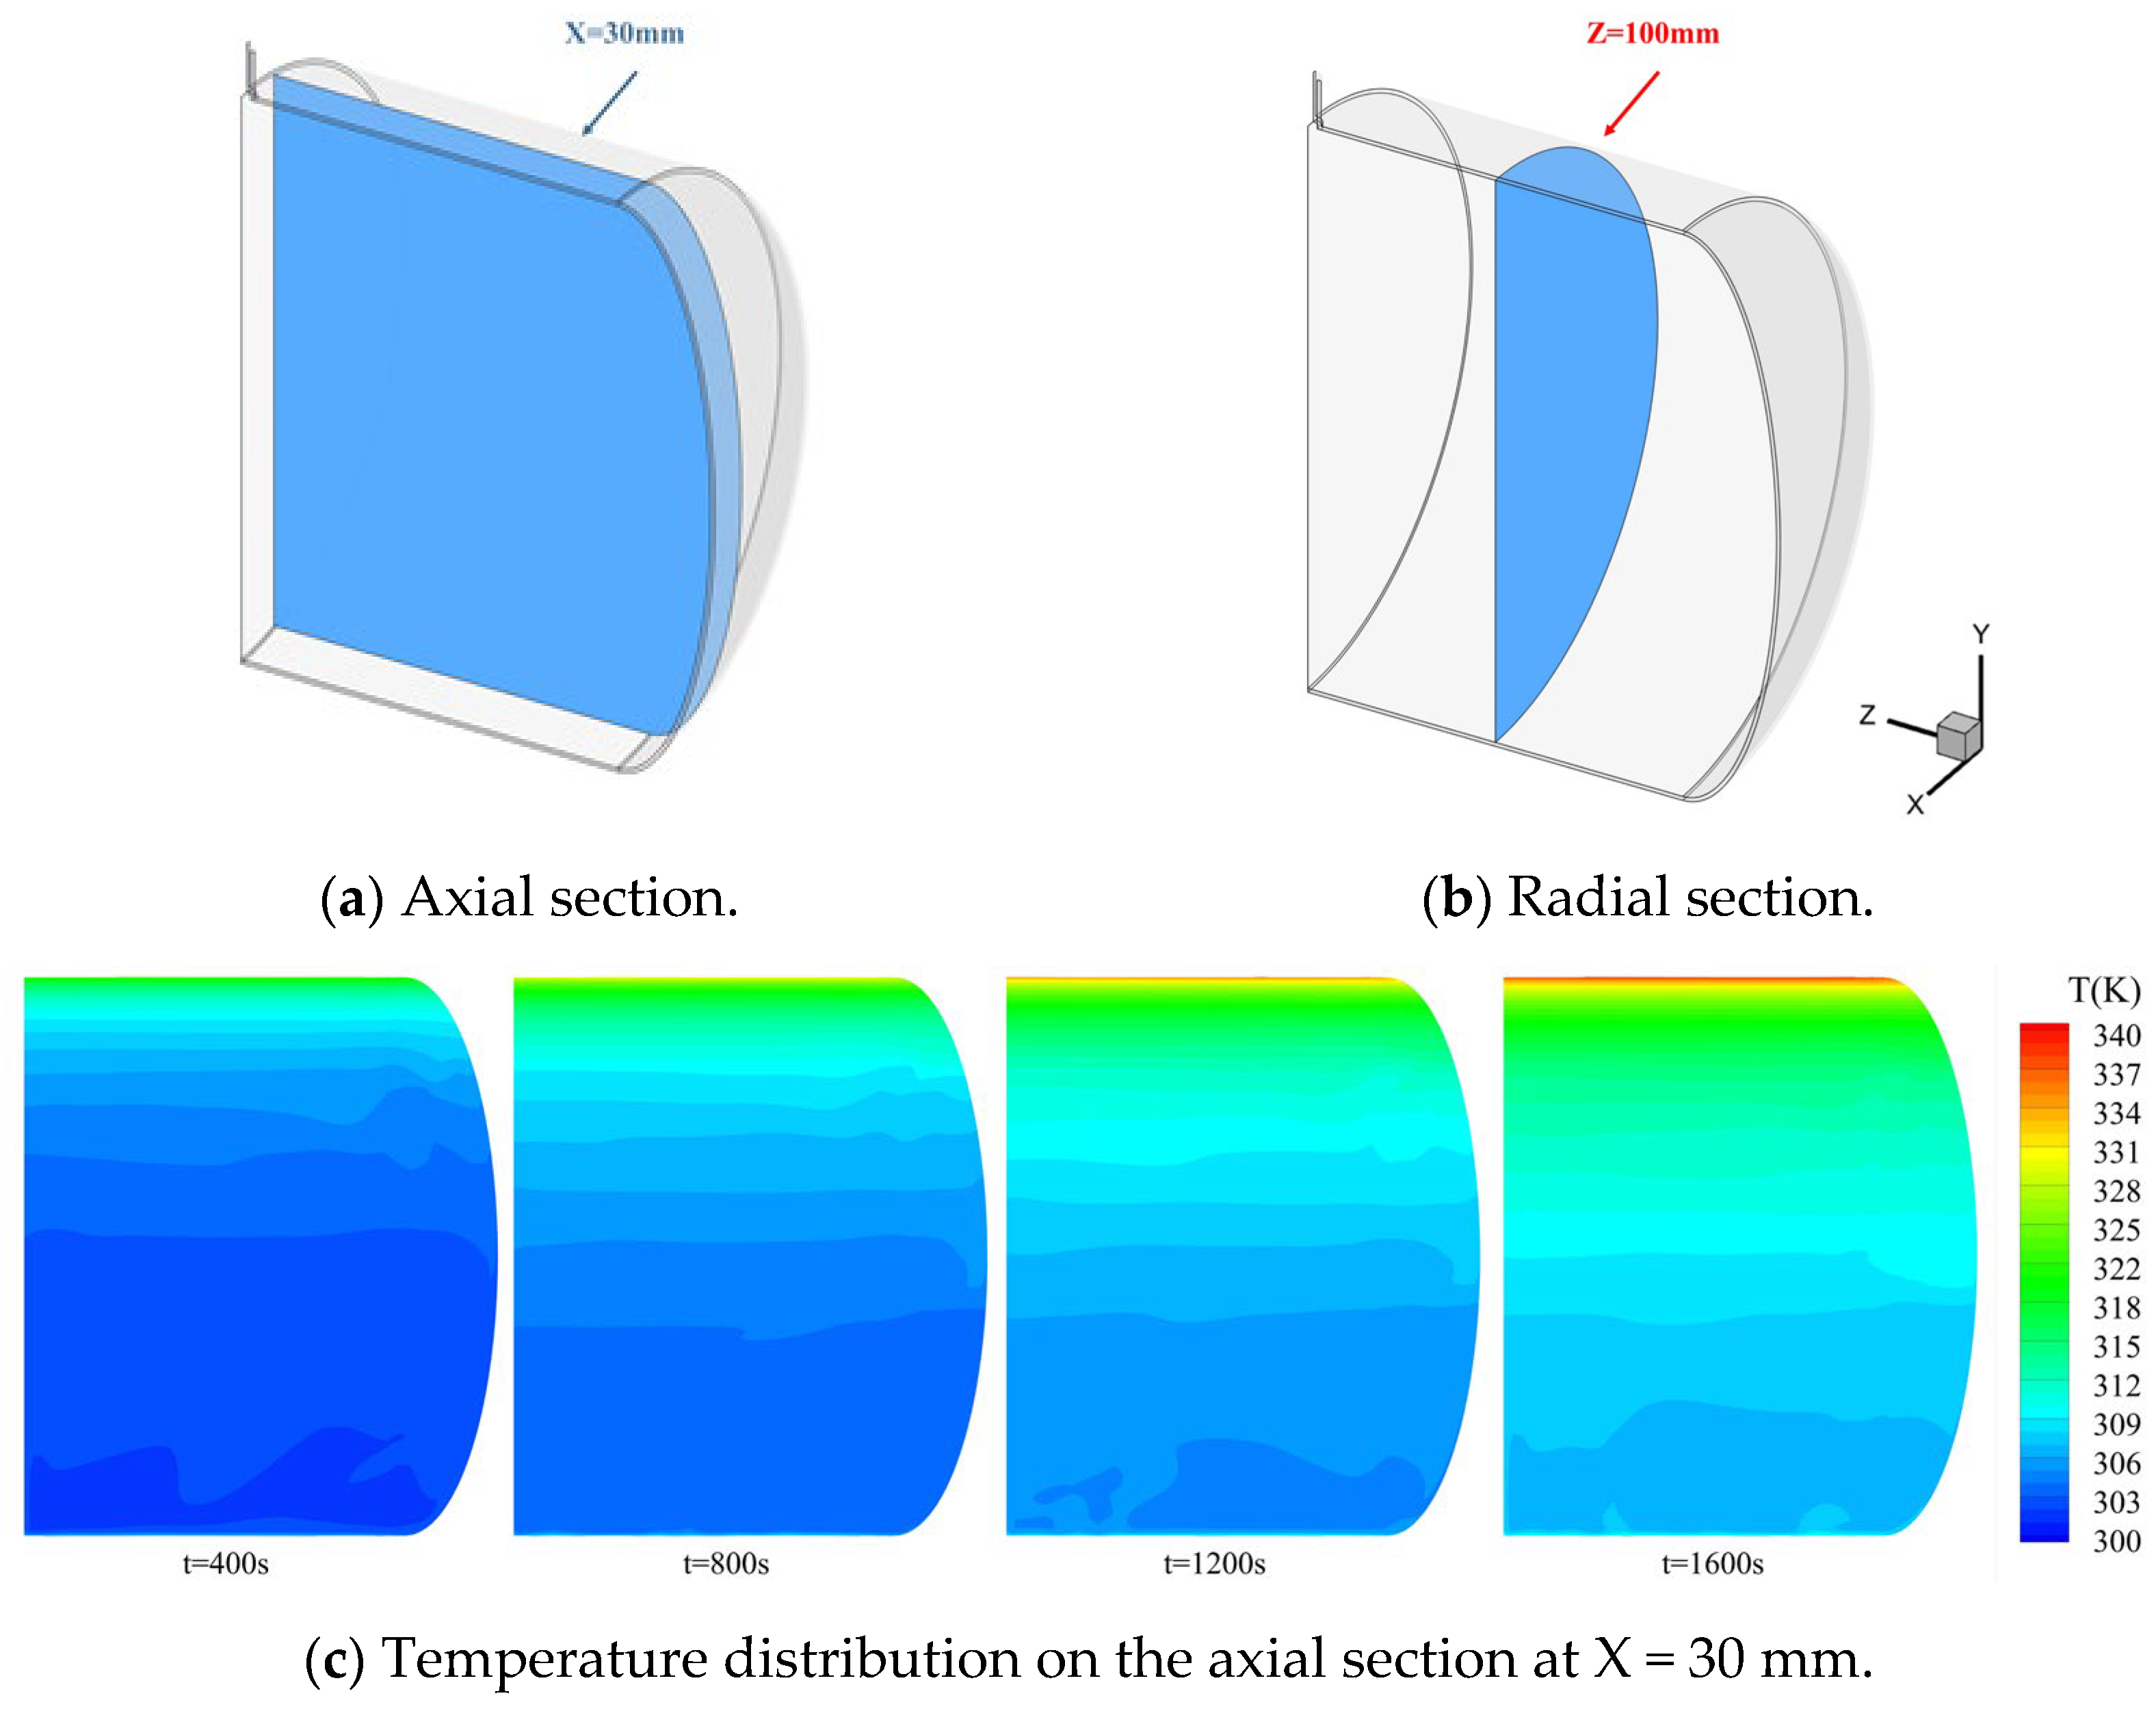
To investigate the flow and heat transfer evolution of thermal stratification, the axial and radial sections of the tank are depicted in Figure 5a,b respectively. As shown in Figure 5c, a significant thermal stratification phenomenon is observed in the axial section. It is indicated that the hot fluid is concentrated in the top region of the tank, with a sharp drop in temperature away from the top wall. In fact, except for the region near the tank end, the temperature remains nearly constant at the same height. Consequently, the subsequent analysis of thermal stratification is only conducted for the radial section at Z = 100 mm, as shown in Figure 5b.
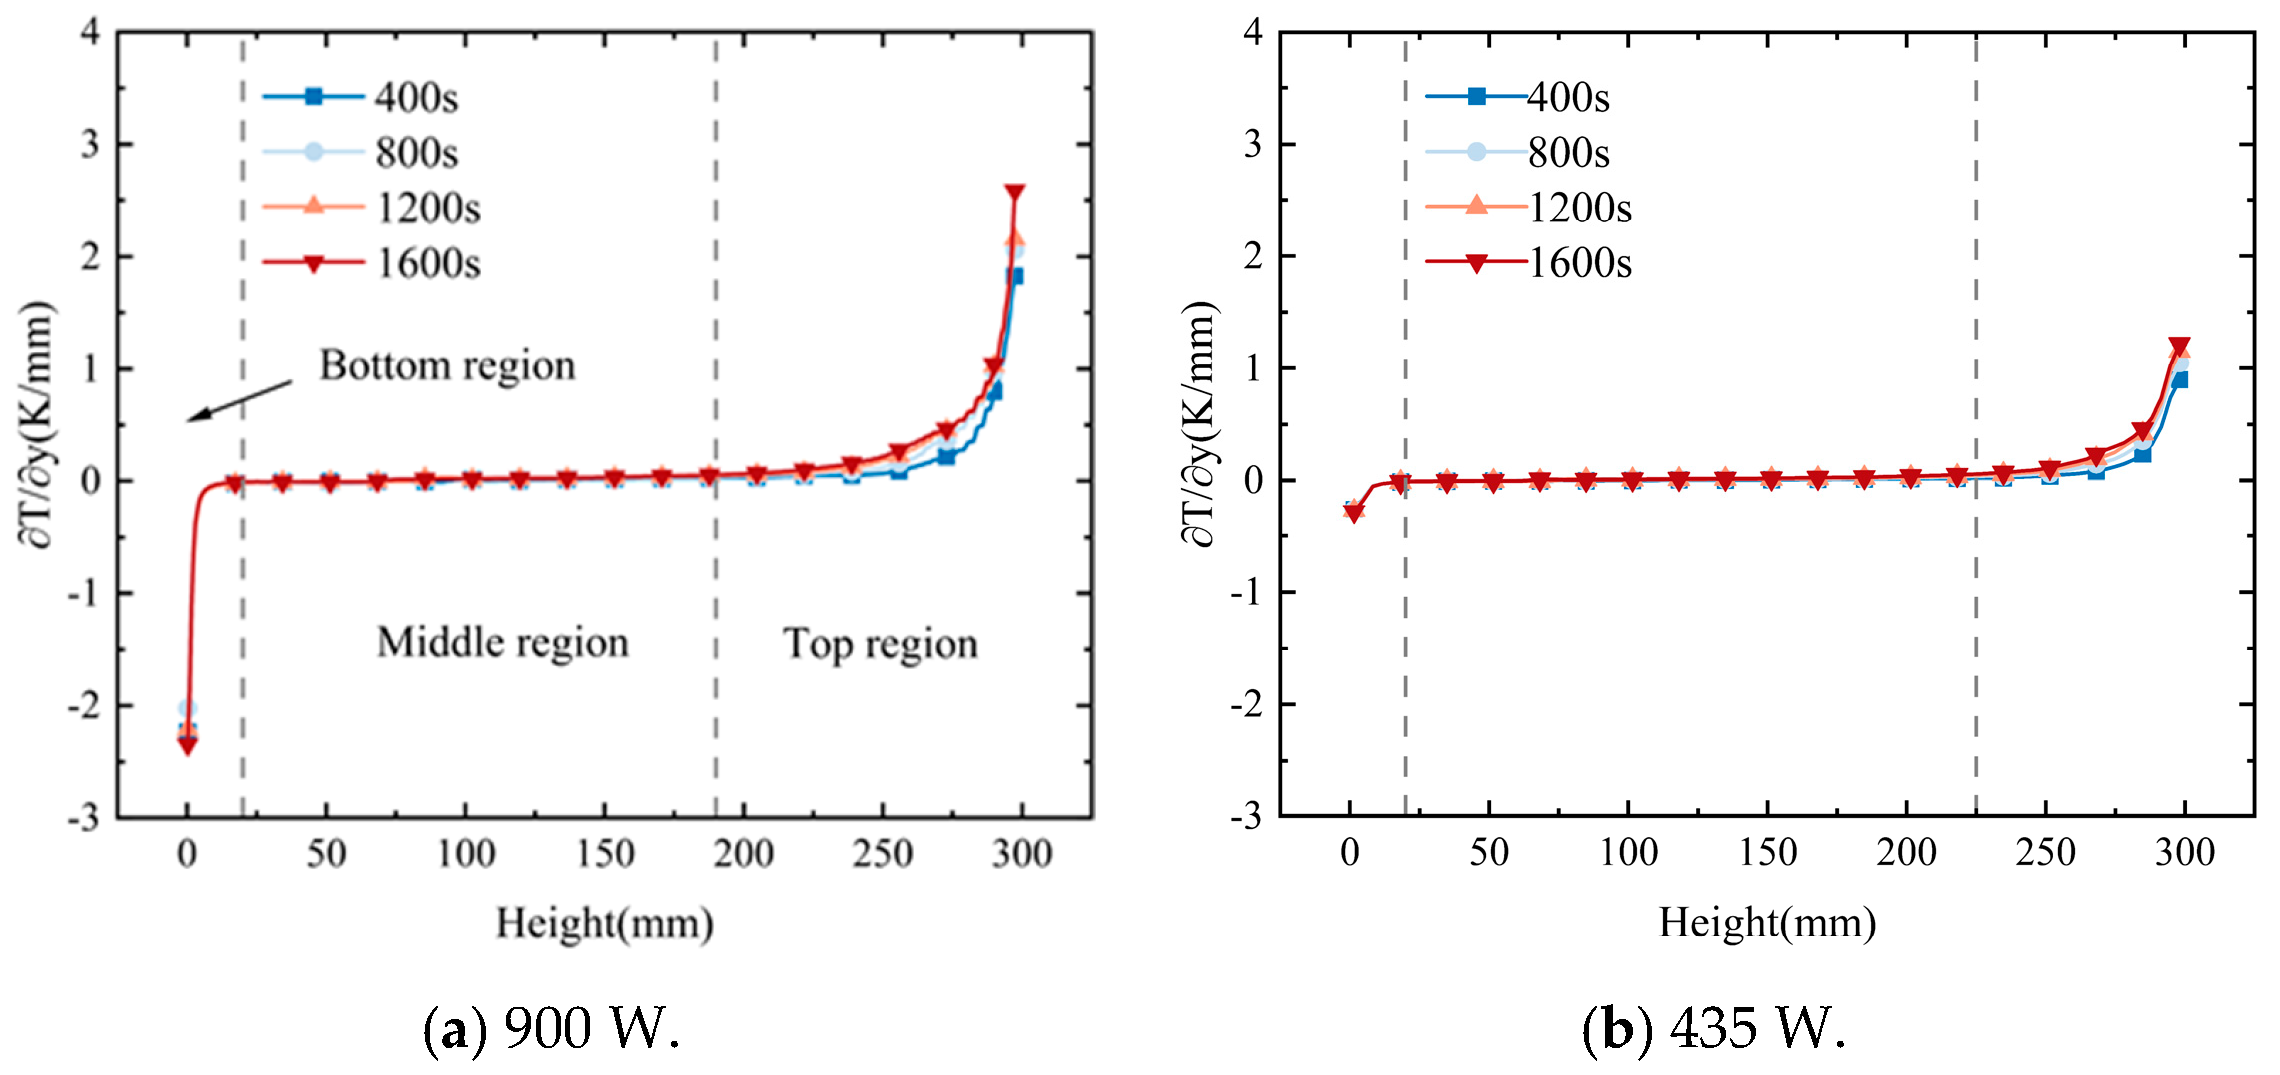
Based on the height, the fluid in the tank can be divided into three regions, as shown in Figure 6. The top region is characterized by dominant thermal stratification, which is caused by the concentration of hot fluid and leads to a significant temperature variation rate. As the heating time increases, the magnitude of the temperature variation rate in the top region also increases. On the other hand, the thermal stratification in the middle region is not as pronounced. The bottom region, however, experiences a considerable temperature variation rate in the boundary layer. This rate remains relatively constant during the heating process due to the upward flow of heated fluid. Increasing the heating power simultaneously expands the range of thermal stratification, resulting in higher temperatures and temperature variation rates.
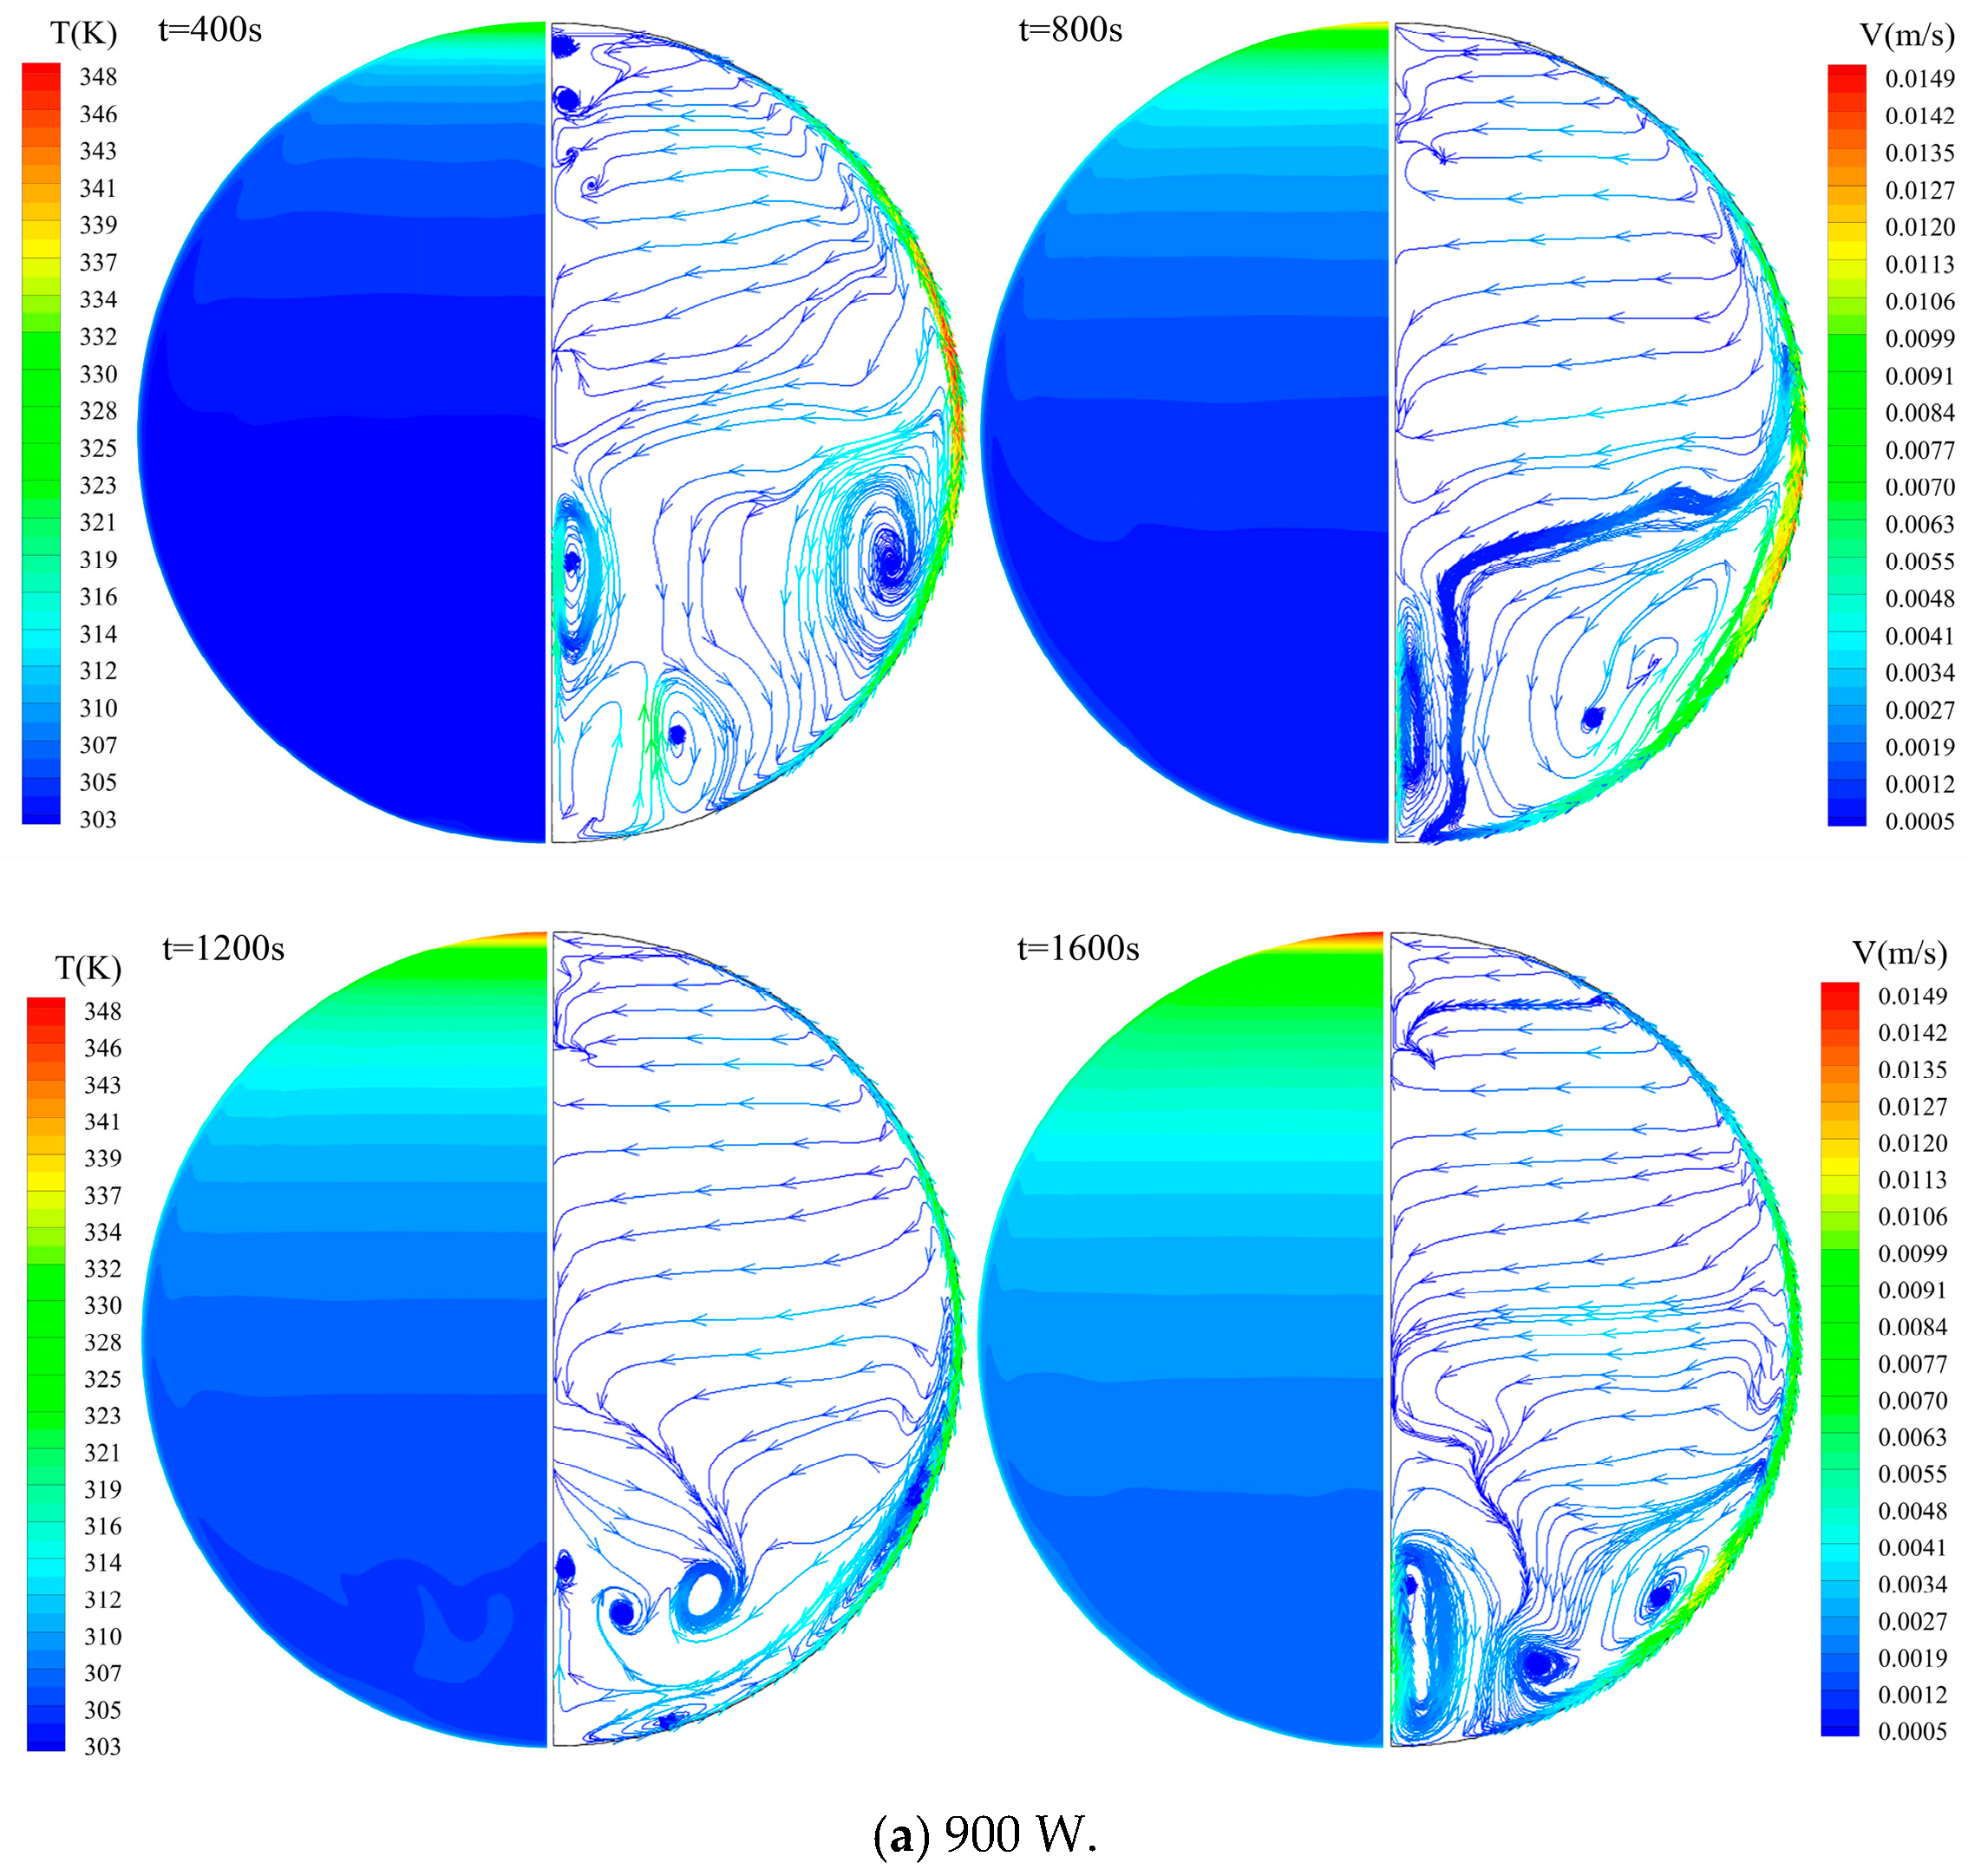
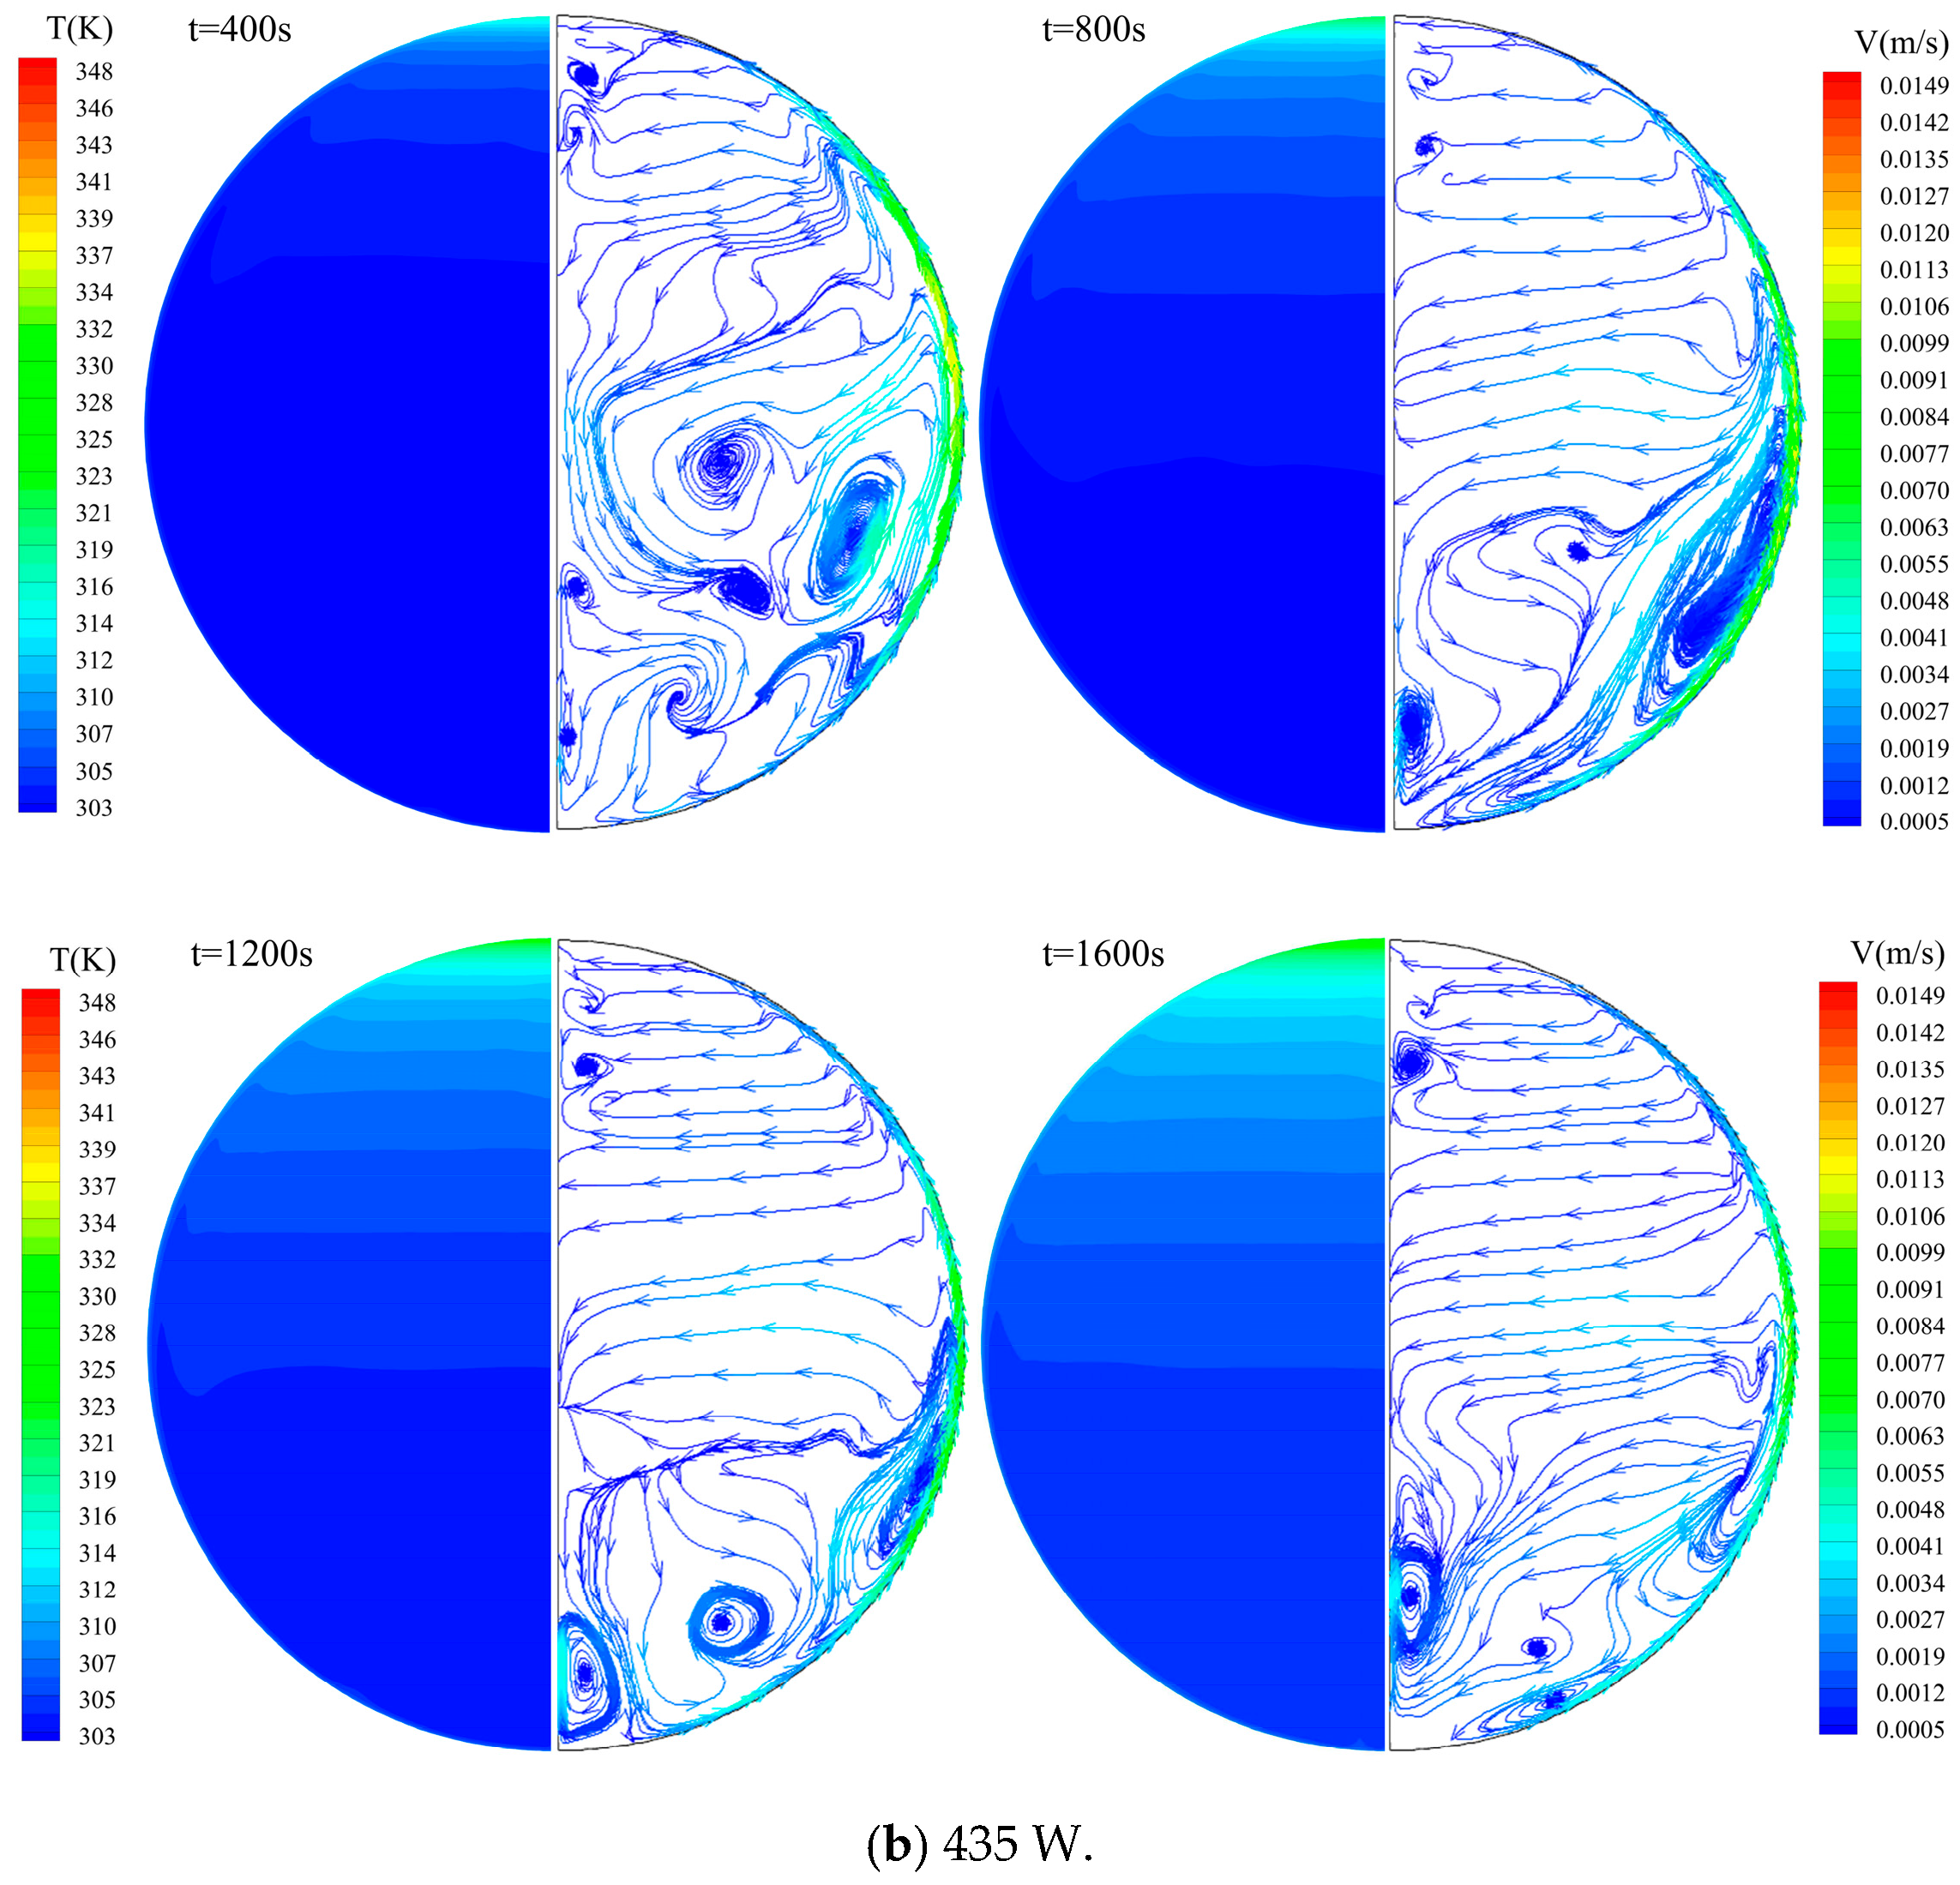
Figure 7 demonstrates the distribution of temperature, streamline, and velocity magnitude. It can be observed that heating reduces the density of the fluid against the wall, causing the low-density fluid to flow upward along the wall. Additionally, the velocity of the low-density fluid increases with further heating, reaching its maximum at the middle height and then decreasing as it flows upward to the top of the tank. The streamlines illustrate that as the hot fluid separates from the wall and flows upward, the cold fluid far away from the wall flows downward due to fluid continuity. Subsequently, the cold fluid is heated again and flows upward, resulting in a large-scale eddy flow. These distribution characteristics of the fluid remain unchanged when the heating power decreases. However, the temperature and velocity near the wall decrease, leading to a weakened thermal stratification as observed in Figure 6.

5.2. Quantitative Analysis of Thermal Stratification

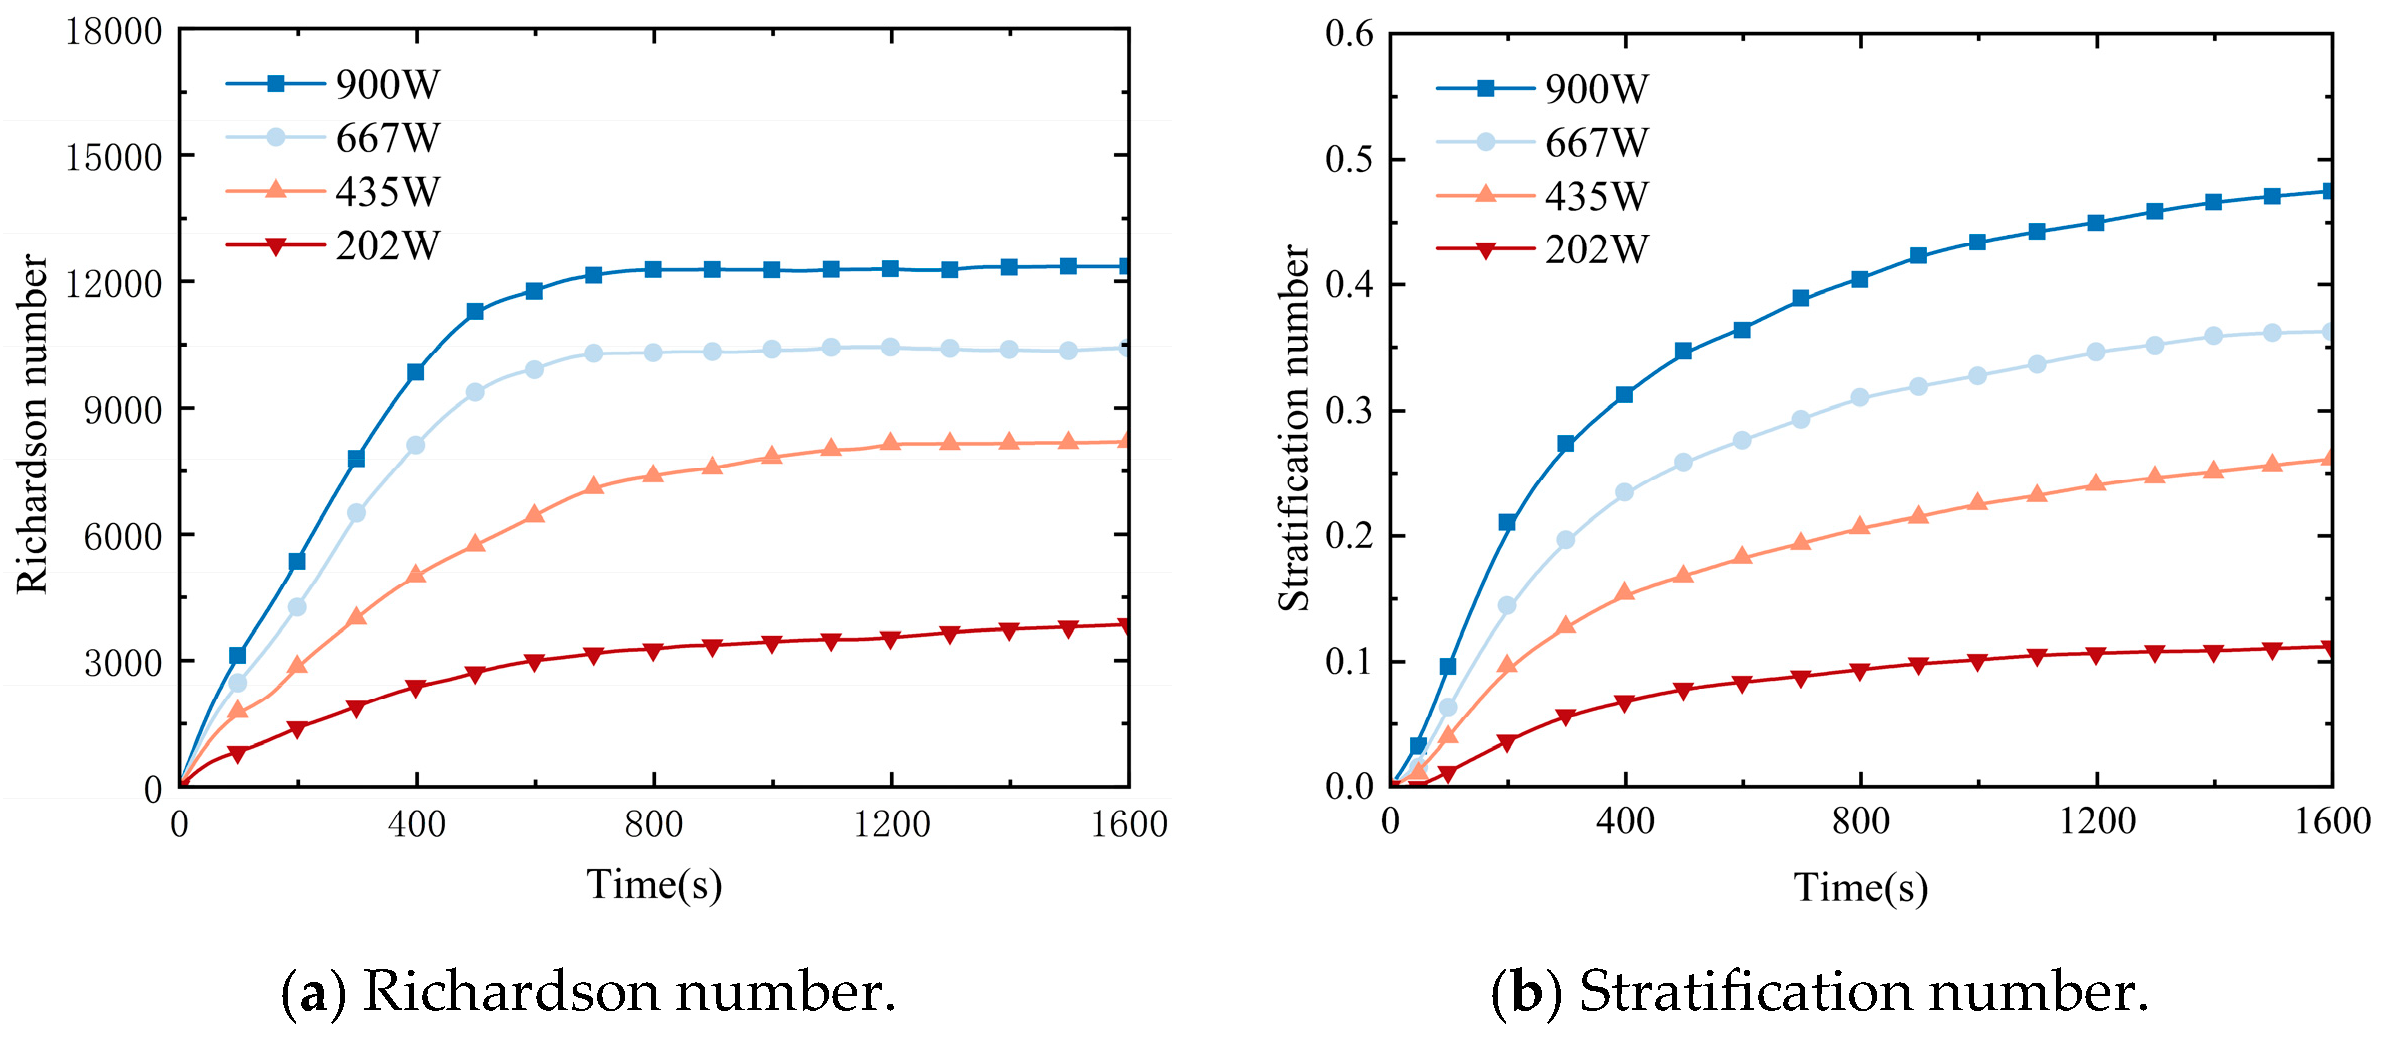
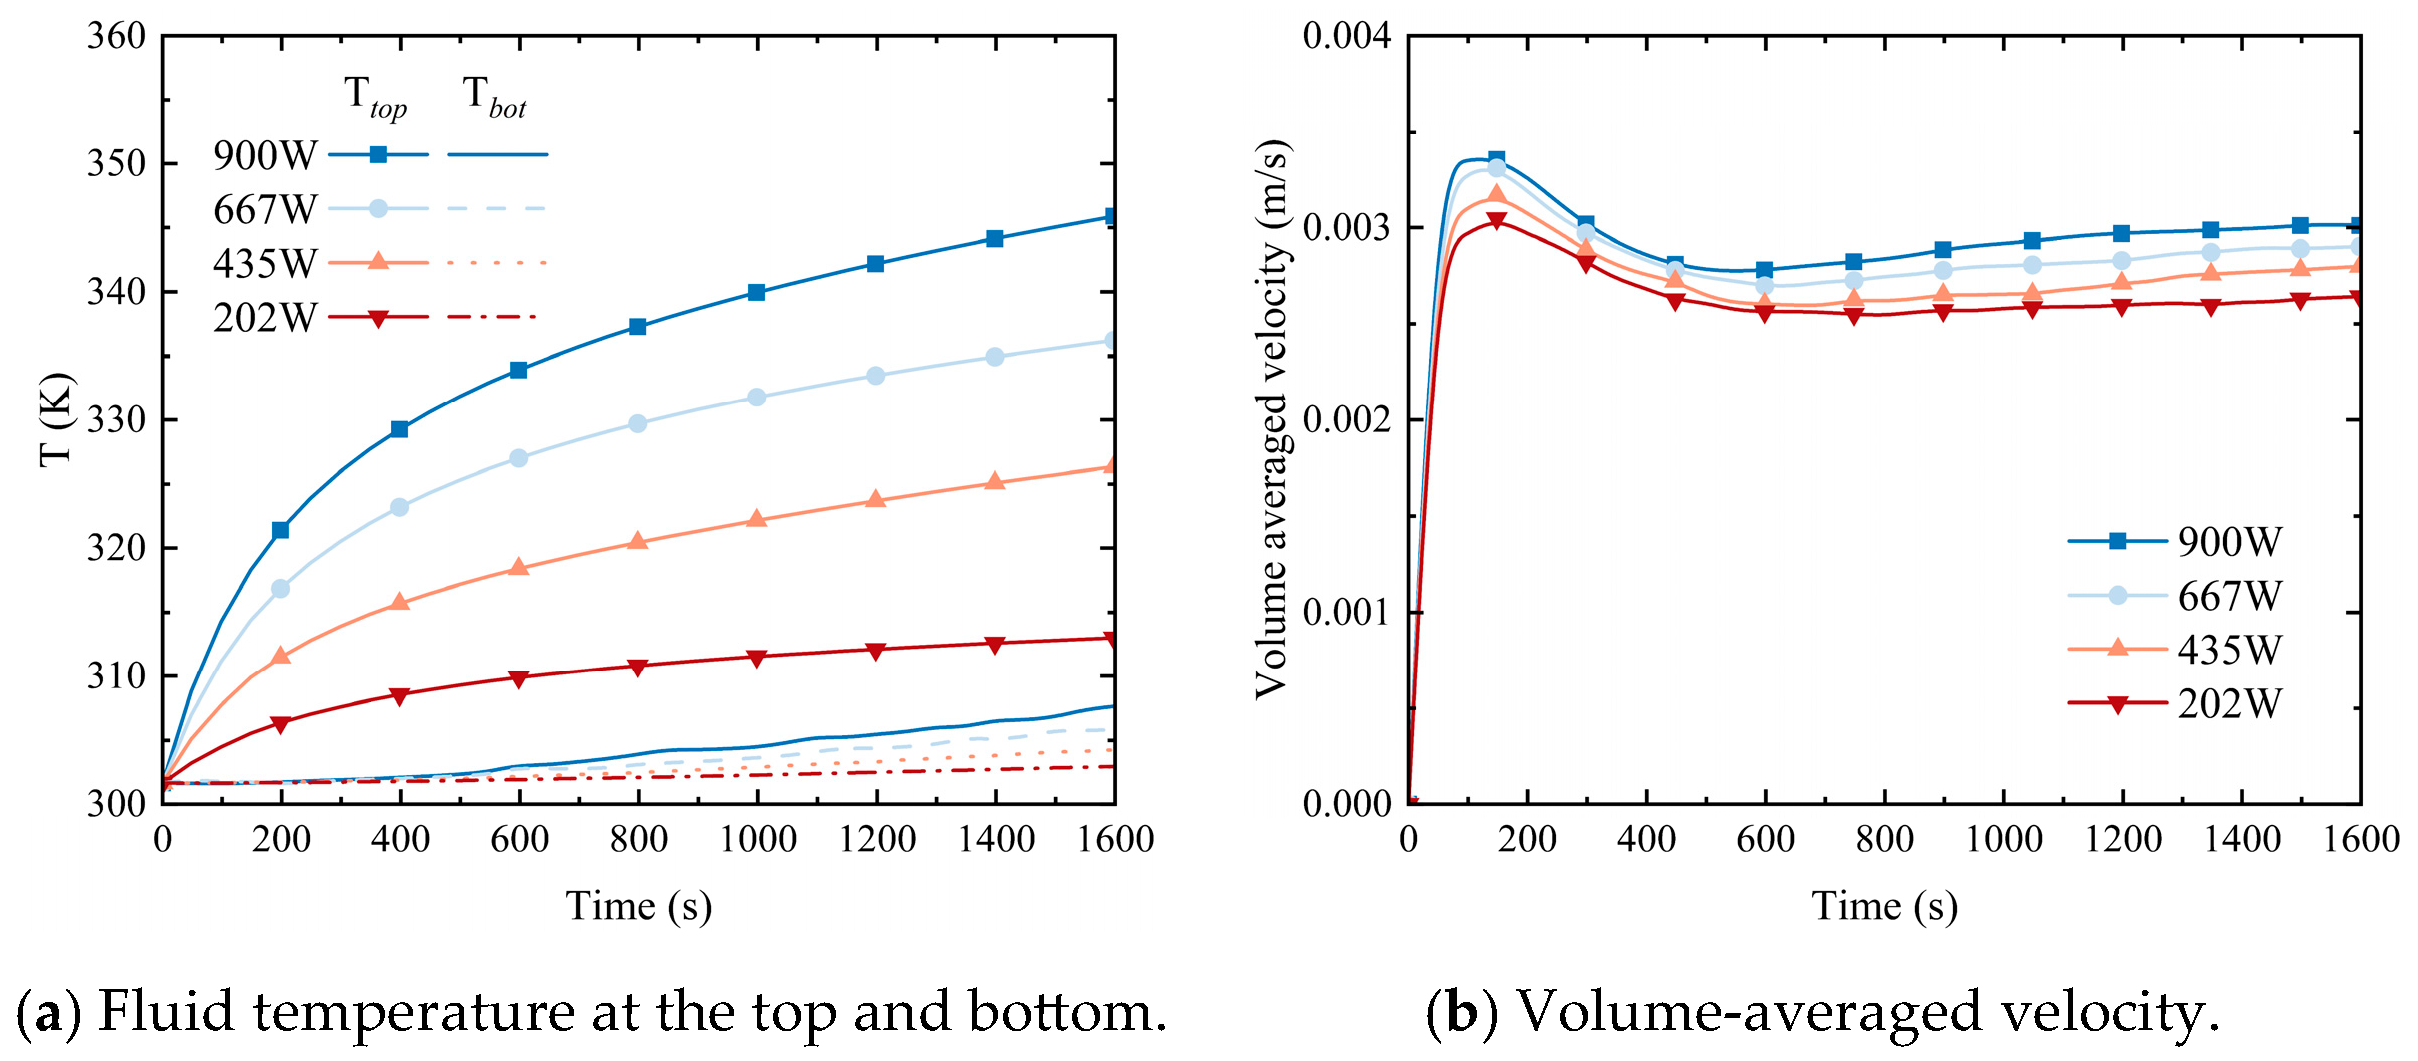
The Richardson number of the fluid in the tank at different times with the variation of heating powers is illustrated in Figure 8a. As the hot fluid flows upward and concentrates in the top region, the temperature difference between the fluid at the top and bottom gradually increases, as shown in Figure 9a. Meanwhile, the volume-averaged velocity increases sharply, as shown in Figure 9b. Therefore, a significant increase in the Richardson number indicates that the evaluation of the temperature difference between the top and bottom enhances the stability of the thermal stratification during the initial heating stage. After the volume-averaged velocity reaches its maximum value, it decreases significantly while the temperature difference continues to increase, consequently leading to a further increase in the Richardson number. With the development of heat transfer, the thermal stratification gradually permeates downward. However, the increase rate of the temperature difference decreases and the volume-averaged fluid velocity also increases slowly. As a result, the Richardson number gradually stabilizes, indicating that the thermal stratification tends to be steady. Furthermore, Figure 8a demonstrates that the higher the heating power, the greater the Richardson number at the same time and the shorter the time required for the Richardson number to stabilize. Specifically, at the time of 1600 s, the Richardson number reached 12,357, 10,424, 8199, and 3851 for the heating power of 900 W, 667 W, 435 W, and 202 W, respectively.
Figure 8b presents the Stratification number, which quantifies the intensity of thermal stratification, as defined in Equation (11). The temperature difference between the top and bottom of the tank primarily determines the change in the Stratification number. Therefore, a similar trend is observed over time, as shown in Figure 9a. The intensity of thermal stratification initially increases rapidly and then gradually continues to increase. At 1600 s, as the heating power increased from 202 W to 900 W, the Stratification number increased from 0.11 to 0.47, corresponding to an approximate 4.27-fold enhancement. In general, lower heating power leads to a lower intensity and a slower growth rate of thermal stratification.
Figure 10a exhibits the temperature distribution at various times from the top to the height of y = 150 mm in the tank with a heating power of 435 W. According to the definition of “stratification temperature” in Section 4.2, it takes about 800 s to reach “stratification temperature” for the fluid at y = 150 mm. The variations of penetration height with time for different heating powers are further provided in Figure 10b. For the heating power of 900 W, 667 W, 435 W, and 202 W, the penetration time is 463 s, 583 s, 798 s, and 1398 s, respectively. Compared with the lowest heating power, the penetration time at the highest heating power decreased by approximately 66.88%, demonstrating that higher thermal input can significantly accelerate the formation and stabilization of thermal stratification.
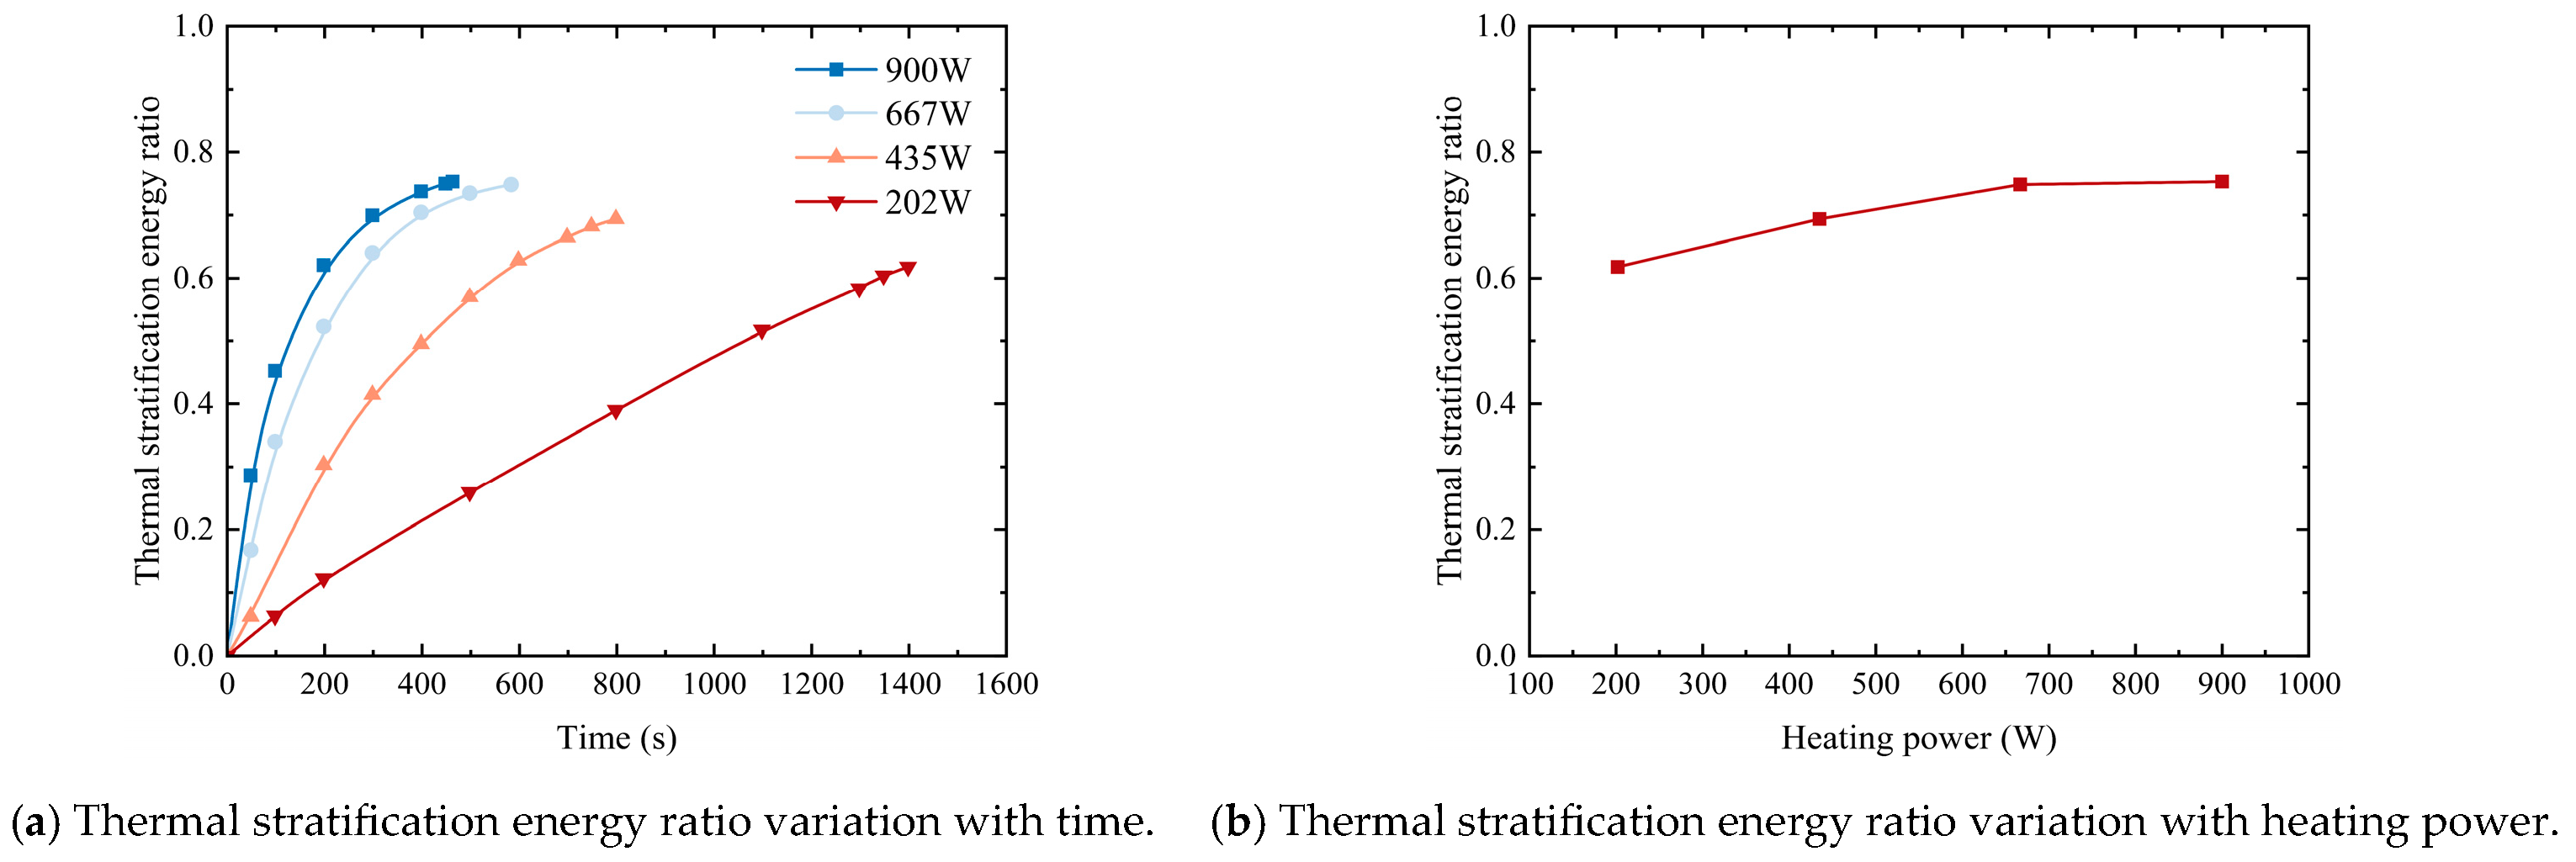
Figure 11 shows the change in thermal stratification energy ratio corresponding to the penetration time under different heating powers. In Figure 11a, the thermal stratification energy ratio increased sharply in the initial stage and then gradually. For higher heating power, the thermal stratification intensity increases, thus further enhancing the thermal stratification energy ratio, as shown in Figure 11b. It could be observed that due to the limitation of the heat transfer characteristics of the thermal stratification, the thermal stratification energy ratio will gradually tend to a constant value with the increased heating power.

5.3. Field Synergy Characteristics Analysis

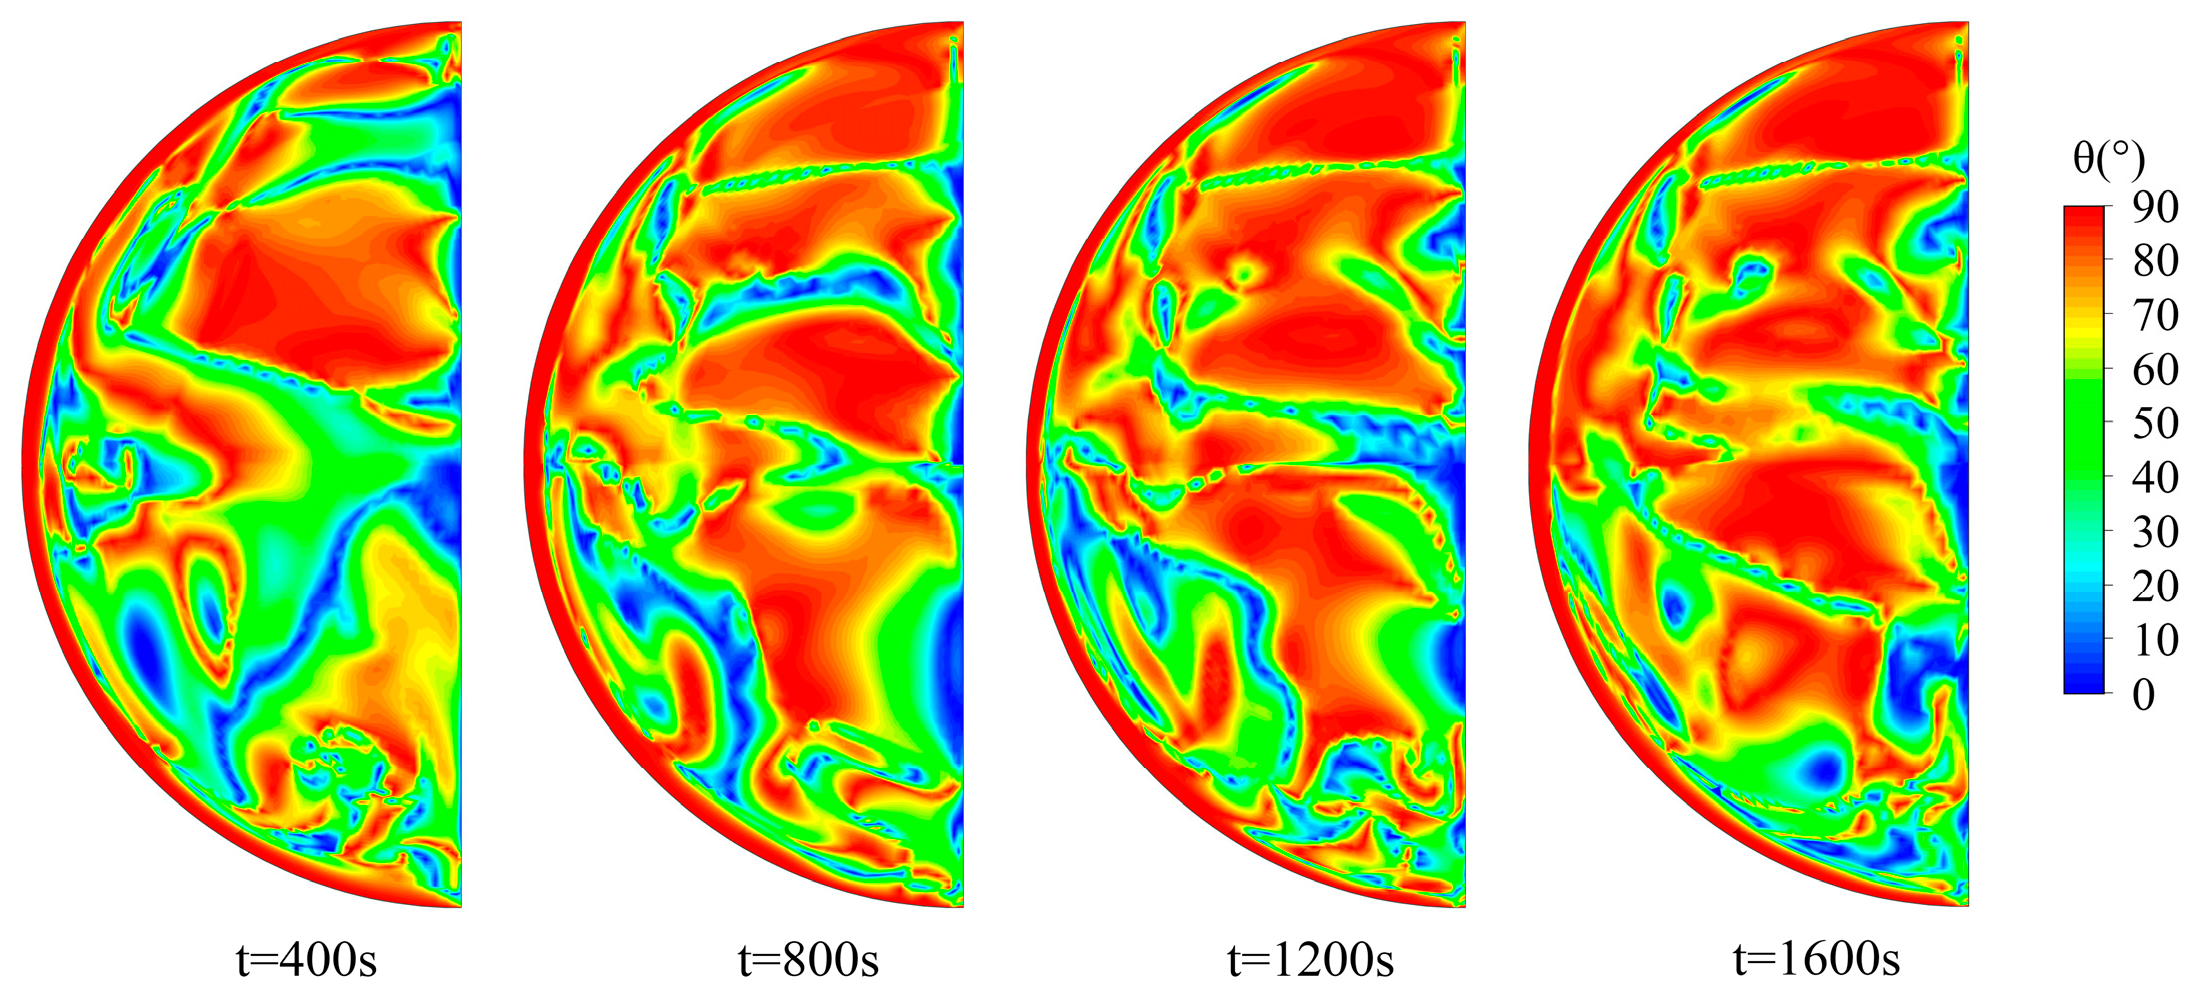
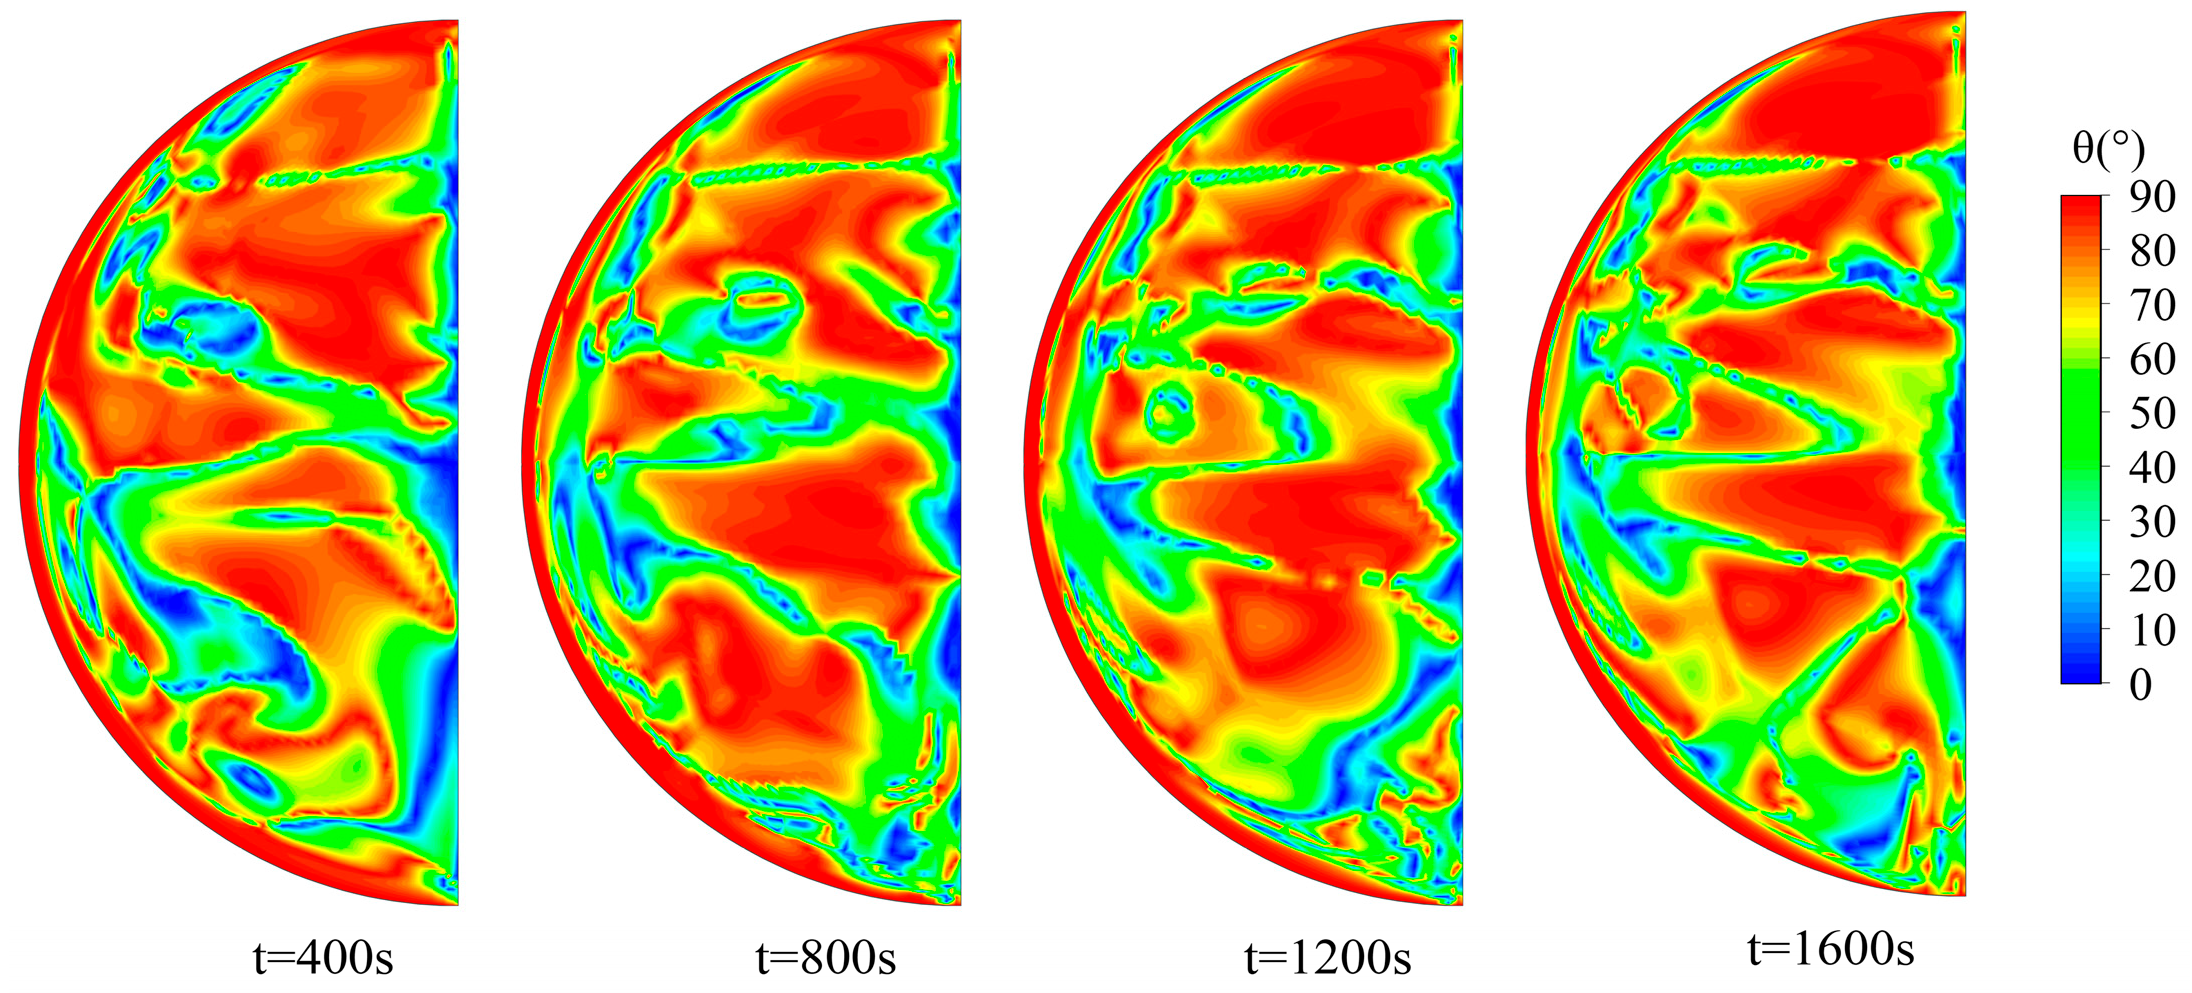
Figure 12 and Figure 13 illustrate the synergy angle distribution on the radial section of the tank. It is observed that the synergy angle in the near-wall region is close to 90°, indicating that heat transmission in the boundary layer is dominated by heat conduction rather than convection. This occurs because the fluid in the vicinity of the wall undergoes tangential flow along the wall, while the temperature gradient is oriented perpendicular to the wall. When the heating time increases, thermal stratification occurs as the high-temperature fluid gradually concentrates in the top region. As a result, the synergy angle in this region increases and finally stabilizes in the range and magnitude, which is caused by the gradual stabilization of the temperature and flow fields in the top region of the tank.
This phenomenon explains the tendency for overheating experienced at the top region of horizontally positioned fuel tanks in numerous hypersonic vehicles. In the bottom region of the tank, a remarkable unsteady synergistic field development is observed. The distribution range and magnitude of synergy angles change noticeably with time. The range of high synergy angles (higher than 70 degrees) is significantly more extensive than the region of low synergy angles (lower than 20 degrees), with the low synergy angle region mainly distributed between different high synergy angle regions. Thus, the bottom region of the tank is also dominated by heat conduction, and the vital convection region is located at the edge of the high heat conduction region. Additionally, the time for forming a stable synergistic field in the thermal stratification is shorter with the increase in heating power, as can be seen in the comparison between Figure 12 and Figure 13 at t = 400 s.
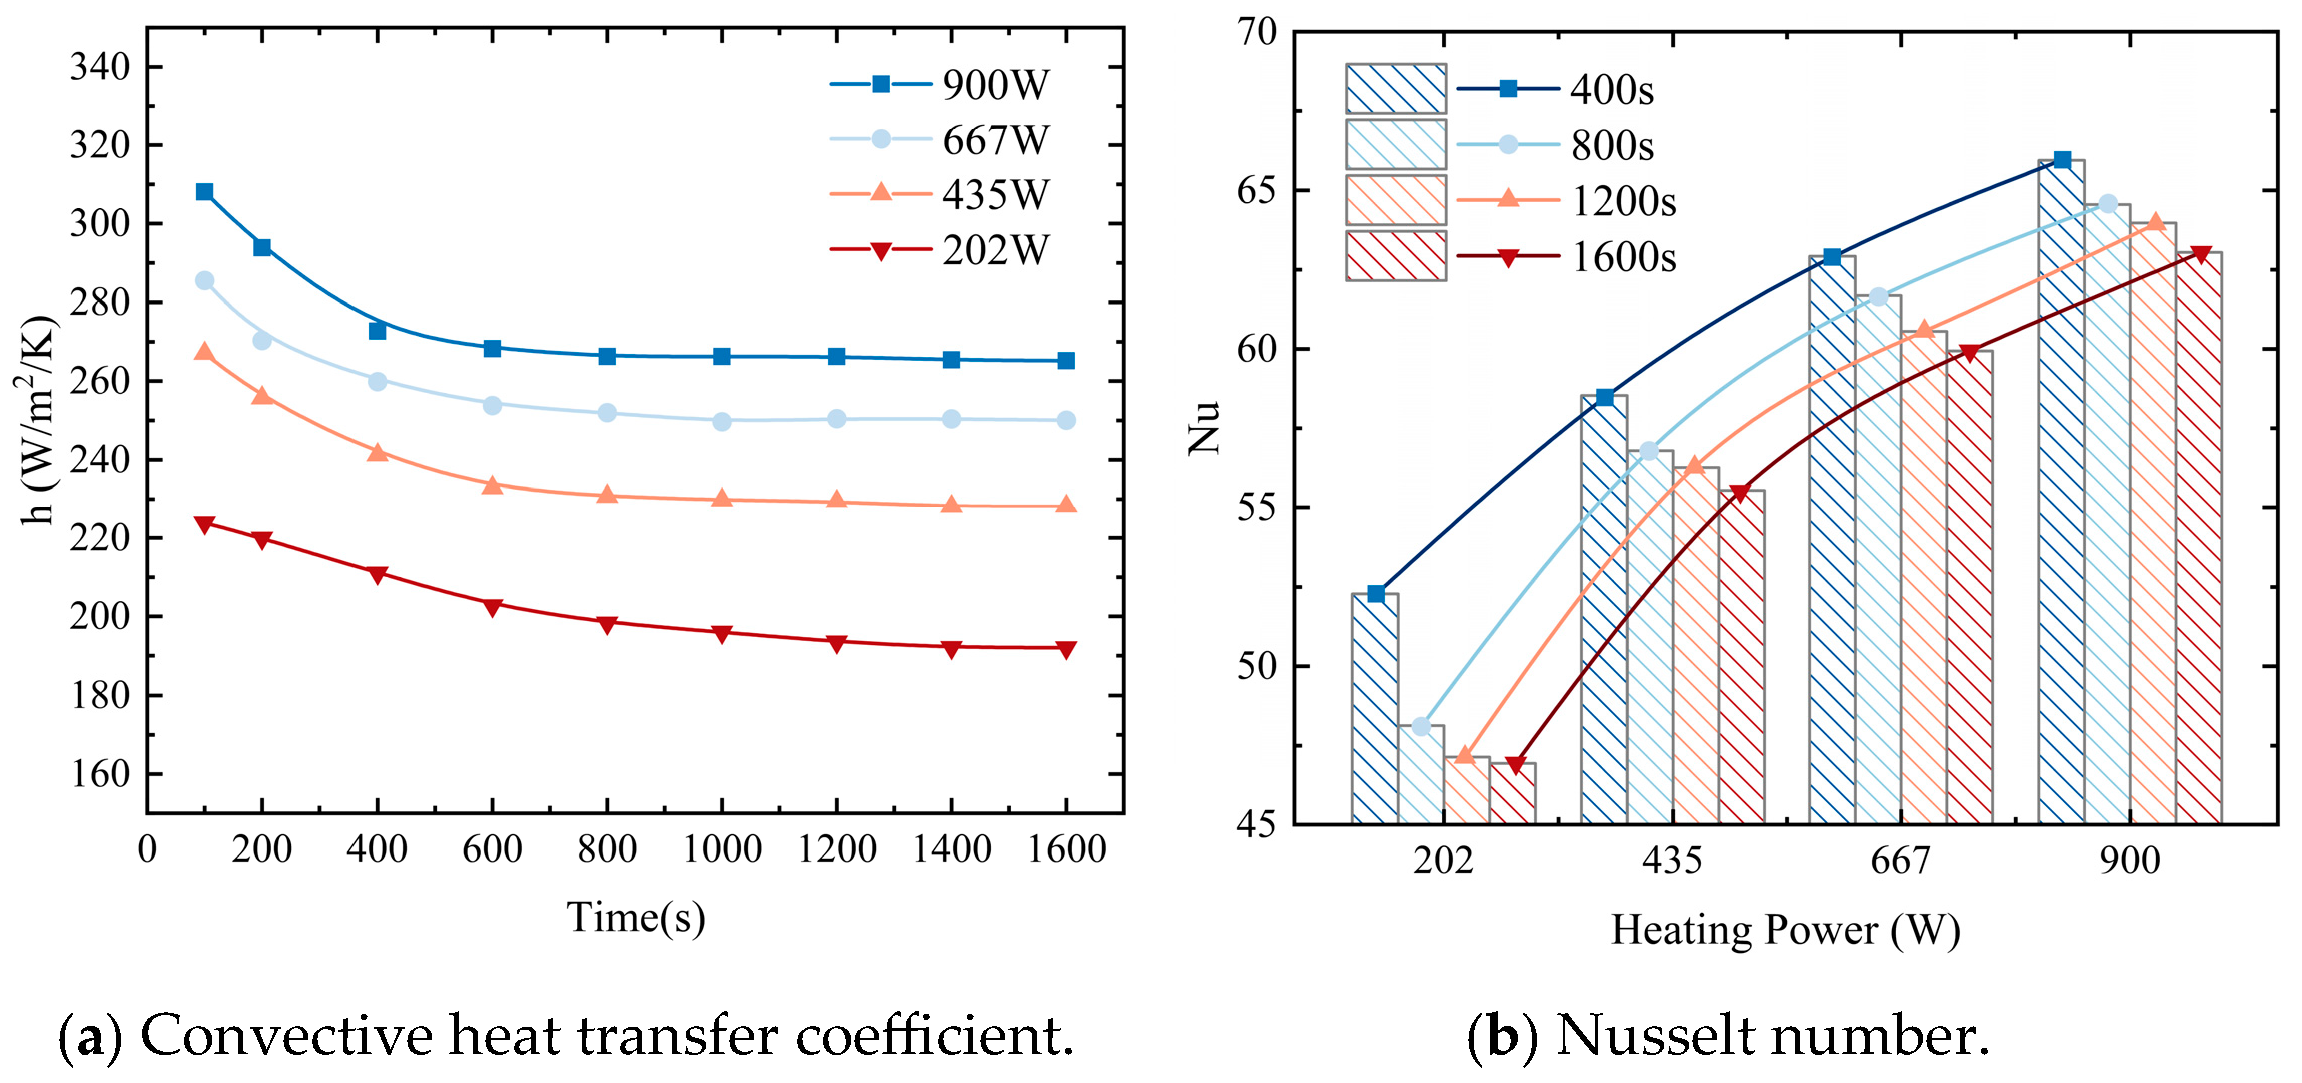
Figure 14 depicts the fluctuations in the convective heat transfer coefficient and Nusselt number pertaining to the inner wall of the entire tank under diverse heating power conditions. It is evident that as the heating time increases, the convective heat transfer coefficient gradually decreases and tends to a constant value. Similarly, the Nusselt number also decreases, indicating the continuous downward permeation of heat conduction-based thermal stratification, which stabilizes the intensity and stability of the stratification. The decrease in convection-based heat transfer leads to stabilization. Furthermore, higher heating power results in simultaneous increases in the temperature gradient, convective heat transfer coefficient, and Nusselt number. The increase in heating power reduces the time needed for thermal stratification. Consequently, the decreasing trend of the convective heat transfer coefficient at high heating power is significantly steeper than that at low heating power at the beginning of heating.

5.4. Analysis of Thermal Stratification Characteristics of Fuel

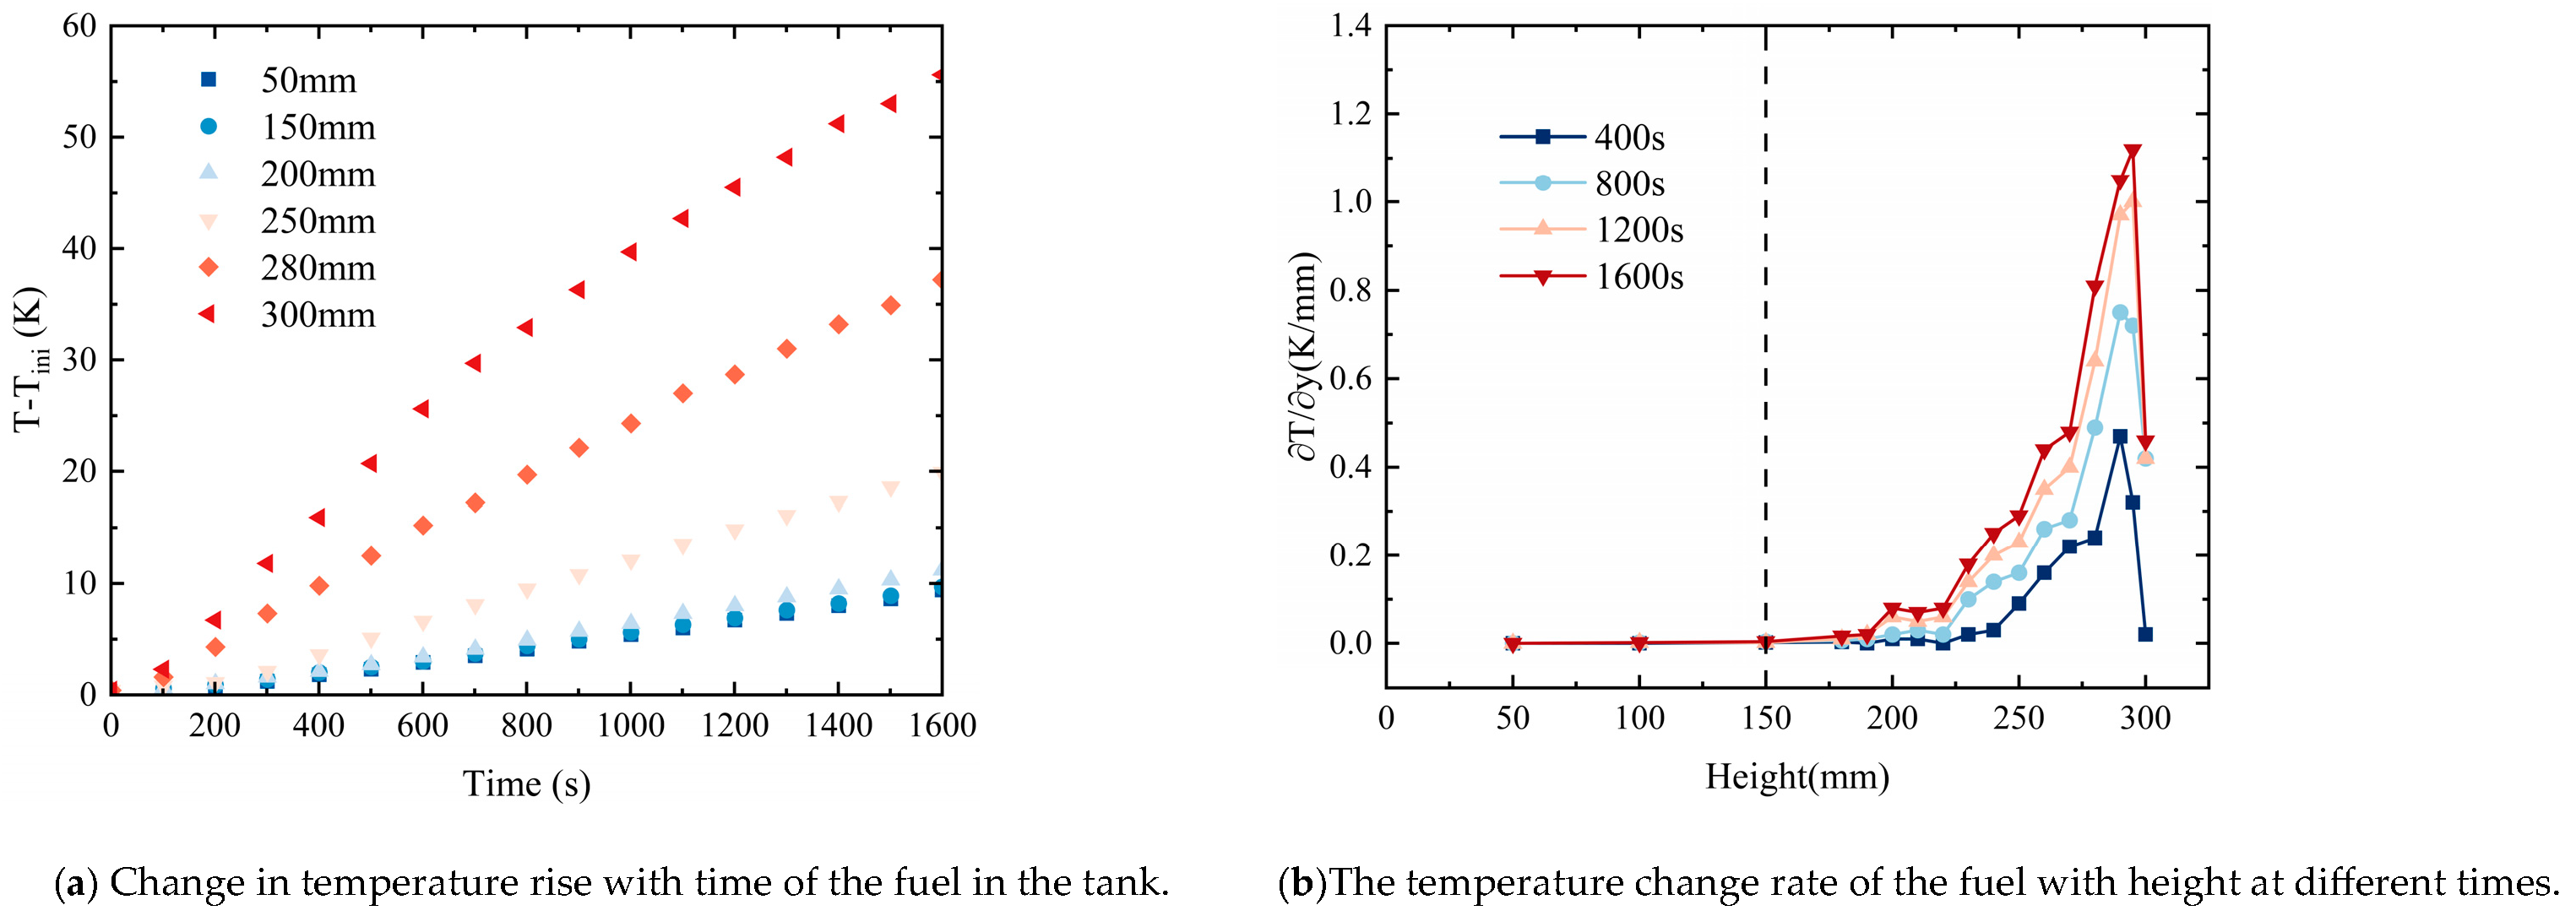
An experiment was further conducted to validate the study on thermal stratification by using fuel instead of water in the tank. The purpose of this experiment was twofold: firstly, to further support the method of quantifying the prevalence of thermal stratification in the tank’s working medium under the influence of external heat flow; and secondly, to investigate the flow and heat transfer mechanisms involved in the formation of thermal stratification. Figure 15 illustrates the observed thermal stratification characteristics of kerosene in the fuel tank at different time intervals while maintaining a heating power of 550 W. The results indicated that as the heating time increased, the thermal stratification in the fuel became more pronounced. At a heating time of 1600 s, the temperature difference between the top and bottom of the tank reached approximately 50 K, demonstrating a larger thermal stratification range compared to when water is used as the working medium. However, the low specific heat of kerosene and the rapid temperature rise at the top of the fuel tank led to boiling and vaporization, causing a decrease in the kerosene interface and exposing the thermocouple to the gas phase region. Consequently, the rate of temperature change at the top was significantly reduced. This reveals that the physical properties of aviation kerosene undergo significant changes under the influence of external heat flow, resulting in more intense thermal stratification and gasification phenomena.

6. Conclusions

In this study, numerical simulation and experiment were conducted to investigate the heat transfer and fluid flow characteristics of the thermal stratification in the fuel tank. The stability, intensity, development rate, and heat distribution characteristics of the thermal stratification in the tank were quantified, and its heat transfer and fluid flow characteristics were revealed. The main conclusions are as follows:
(1)
For the circular fuel tank in this study, the heated fluid reaches the maximum upward-flow velocity at the middle height of the tank and then separates from the upper wall, resulting in a large-scale vortex. The higher the heating power, the more obvious the above phenomenon.
(2)
With the increase in heating time, the stability and strength of thermal stratification increase sharply at first and then tend to be stable gradually. A higher heating power markedly promotes the formation and stabilization of thermal stratification, resulting in a more uniform and stable temperature field. As the heating power increases from 202 W to 900 W, the stratification intensity increases by approximately 4.27 times, while the corresponding penetration time decreases by about 66.88%.
(3)
According to the field synergy principle, relatively stable heat conduction regions with high synergy angles (close to 90°) appear near the wall and at the top of the tank. The other regions are characterized by apparent unsteady and non-uniform alternating distributions of high and low synergy angles, where the high synergy angle region is more extensive. Therefore, the heat transfer of the fluid inside the tank is mainly dominated by conduction.
In this study, the quantitative assessment method of thermal stratification performance in the field of the water storage tank is applied to the field of the fuel tank, and the heat transfer characteristics of thermal stratification in a fuel tank are analyzed by the field synergy principle to provide a reference for the optimal design of a fuel tank. The above phenomenon will be more obvious when the working medium is fuel.

Author Contributions

Conceptualization, Y.X. and H.L.(Huaping Liu); methodology, Y.X.; software, Y.X.; validation, Y.X., H.L.(Haokun Li) and H.L.(Huaping Liu); formal analysis, R.F.; investigation, Z.Y.; resources, Y.X.; data curation, G.Z.; writing—original draft preparation, Y.X.; writing—review and editing, Y.X. and H.L.(Haokun Li); visualization, Y.X.; supervision, H.L.(Huaping Liu) All authors have read and agreed to the published version of the manuscript.

Funding

This research received no external funding.

Data Availability Statement

The data supporting this study’s findings are available from the corresponding author upon reasonable request.

Conflicts of Interest

The authors declare that they have no known competing financial interests or personal relationships that could have appeared to influence the work reported in this paper.

References

  1. Zhang, S.; Li, X.; Zuo, J.; Qin, J.; Cheng, K.; Feng, Y.; Bao, W. Research Progress on Active Thermal Protection for Hypersonic Vehicles. Prog. Aerosp. Sci. 2020, 119, 100646. [Google Scholar] [CrossRef]
  2. Zhu, Y.; Peng, W.; Xu, R.; Jiang, P. Review on Active Thermal Protection and Its Heat Transfer for Airbreathing Hypersonic Vehicles. Chin. J. Aeronaut. 2018, 31, 1929–1953. [Google Scholar] [CrossRef]
  3. Birk, A.M.; Cunningham, M.H. Liquid Temperature Stratification and Its Effect on BLEVEs and Their Hazards. J. Hazard. Mater. 1996, 48, 219–237. [Google Scholar] [CrossRef]
  4. Zhang, W.; Cheng, J.; Song, Y.; Chen, Z.; Chen, W.; Gao, R. Experimental and Numerical Study of the Liquid Nitrogen Accumulator Based on Two-Phase Thermal Stratification. Int. J. Therm. Sci. 2023, 184, 107937. [Google Scholar] [CrossRef]
  5. Joseph, J.; Agrawal, G.; Agarwal, D.K.; Pisharady, J.C.; Sunil Kumar, S. Effect of Insulation Thickness on Pressure Evolution and Thermal Stratification in a Cryogenic Tank. Appl. Therm. Eng. 2017, 111, 1629–1639. [Google Scholar] [CrossRef]
  6. Liang, Z.; Liu, D.; Wang, X.; Zhang, J.; Wu, H.; Qing, X.; Wang, Y. FBG-Based Strain Monitoring and Temperature Compensation for Composite Tank. Aerosp. Sci. Technol. 2022, 127, 107724. [Google Scholar] [CrossRef]
  7. Vliet, G.C. Stratification with Bottom Heating. J. Spacecr. Rockets 1966, 3, 1142–1144. [Google Scholar] [CrossRef]
  8. Fan, S.C.; Chu, J.C.; Scott, L.E. Thermal Stratification in Closed Cryogenic Containers. In Advances in Cryogenic Engineering; Timmerhaus, K.D., Ed.; Springer: Boston, MA, USA, 1969; pp. 249–257. [Google Scholar]
  9. Daigle, M.J.; Smelyanskiy, V.N.; Boschee, J.; Foygel, M. Temperature Stratification in a Cryogenic Fuel Tank. J. Thermophys. Heat Transf. 2013, 27, 116–126. [Google Scholar] [CrossRef]
  10. Liu, Z.; Feng, Y.; Lei, G.; Li, Y. Fluid Thermal Stratification in a Non-Isothermal Liquid Hydrogen Tank under Sloshing Excitation. Int. J. Hydrogen Energy 2018, 43, 22622–22635. [Google Scholar] [CrossRef]
  11. Duan, Z.; Sun, H.; Cheng, C.; Tang, W.; Xue, H. A Moving-Boundary Based Dynamic Model for Predicting the Transient Free Convection and Thermal Stratification in Liquefied Gas Storage Tank. Int. J. Therm. Sci. 2021, 160, 106690. [Google Scholar] [CrossRef]
  12. Bouhal, T.; Fertahi, S.; Agrouaz, Y.; El Rhafiki, T.; Kousksou, T.; Jamil, A. Numerical Modeling and Optimization of Thermal Stratification in Solar Hot Water Storage Tanks for Domestic Applications: CFD Study. Sol. Energy 2017, 157, 441–455. [Google Scholar] [CrossRef]
  13. Rendall, J.; Abu-Heiba, A.; Gluesenkamp, K.; Nawaz, K.; Worek, W.; Elatar, A. Nondimensional Convection Numbers Modeling Thermally Stratified Storage Tanks: Richardson’s Number and Hot-Water Tanks. Renew. Sustain. Energy Rev. 2021, 150, 111471. [Google Scholar] [CrossRef]
  14. Ding, T.; Meng, Z.; Chen, K.; Fan, G.; Yan, C. Experimental Study on Thermal Stratification in Water Tank and Heat Transfer Characteristics of Condenser in Water-Cooled Passive Residual Heat Removal System of Molten Salt Reactor. Energy 2020, 205, 118052. [Google Scholar] [CrossRef]
  15. Abdelhak, O.; Mhiri, H.; Bournot, P. CFD Analysis of Thermal Stratification in Domestic Hot Water Storage Tank during Dynamic Mode. Build. Simul. 2015, 8, 421–429. [Google Scholar] [CrossRef]
  16. Kumar, K.; Singh, S. Investigating Thermal Stratification in a Vertical Hot Water Storage Tank under Multiple Transient Operations. Energy Rep. 2021, 7, 7186–7199. [Google Scholar] [CrossRef]
  17. Wang, Z.; Zhang, H.; Dou, B.; Huang, H.; Wu, W.; Wang, Z. Experimental and Numerical Research of Thermal Stratification with a Novel Inlet in a Dynamic Hot Water Storage Tank. Renew. Energy 2017, 111, 353–371. [Google Scholar] [CrossRef]
  18. Chandra, Y.P.; Matuska, T. Numerical Prediction of the Stratification Performance in Domestic Hot Water Storage Tanks. Renew. Energy 2020, 154, 1165–1179. [Google Scholar] [CrossRef]
  19. Gao, L.; Lu, H.; Sun, B.; Che, D.; Dong, L. Numerical and Experimental Investigation on Thermal Stratification Characteristics Affected by the Baffle Plate in Thermal Storage Tank. J. Energy Storage 2021, 34, 102117. [Google Scholar] [CrossRef]
  20. Kumar, G.S.; Nagarajan, D.; Chidambaram, L.A.; Kumaresan, V.; Ding, Y.; Velraj, R. Role of PCM Addition on Stratification Behaviour in a Thermal Storage Tank—An Experimental Study. Energy 2016, 115, 1168–1178. [Google Scholar] [CrossRef]
  21. Erdemir, D.; Altuntop, N. Improved Thermal Stratification with Obstacles Placed inside the Vertical Mantled Hot Water Tanks. Appl. Therm. Eng. 2016, 100, 20–29. [Google Scholar] [CrossRef]
  22. Erdemir, D.; Atesoglu, H.; Altuntop, N. Experimental Investigation on Enhancement of Thermal Performance with Obstacle Placing in the Horizontal Hot Water Tank Used in Solar Domestic Hot Water System. Renew. Energy 2019, 138, 187–197. [Google Scholar] [CrossRef]
  23. Fernández-Seara, J.; Uhı’a, F.J.; Sieres, J. Experimental Analysis of a Domestic Electric Hot Water Storage Tank. Part II: Dynamic Mode of Operation. Appl. Therm. Eng. 2007, 27, 137–144. [Google Scholar] [CrossRef]
  24. Guo, Z.Y.; Li, D.Y.; Wang, B.X. A Novel Concept for Convective Heat Transfer Enhancement. Int. J. Heat Mass Transf. 1998, 41, 2221–2225. [Google Scholar] [CrossRef]
  25. Zhang, L.; Li, J.; Li, Y.; Wu, J. Field Synergy Analysis for Helical Ducts with Rectangular Cross Section. Int. J. Heat Mass Transf. 2014, 75, 245–261. [Google Scholar] [CrossRef]
  26. Li, Y.; Liu, G.; Rao, Z.; Liao, S. Field Synergy Principle Analysis for Reducing Natural Convection Heat Loss of a Solar Cavity Receiver. Renew. Energy 2015, 75, 257–265. [Google Scholar] [CrossRef]
  27. Shen, J.; Zeng, L.; Liu, Z.; Liu, W. Performance Investigation of PEMFC with Rectangle Blockages in Gas Channel Based on Field Synergy Principle. Heat Mass Transf. 2019, 55, 811–822. [Google Scholar] [CrossRef]
  28. Wang, B.; Hong, Y.; Hou, X.; Xu, Z.; Wang, P.; Fang, X.; Ruan, X. Numerical Configuration Design and Investigation of Heat Transfer Enhancement in Pipes Filled with Gradient Porous Materials. Energy Convers. Manag. 2015, 105, 206–215. [Google Scholar] [CrossRef]
  29. Liu, Y.; Dong, Y.; Xie, L.; Zhang, C.; Xu, C. Heat Transfer Enhancement of Supercritical CO2 in Solar Tower Receiver by the Field Synergy Principle. Appl. Therm. Eng. 2022, 212, 118479. [Google Scholar] [CrossRef]
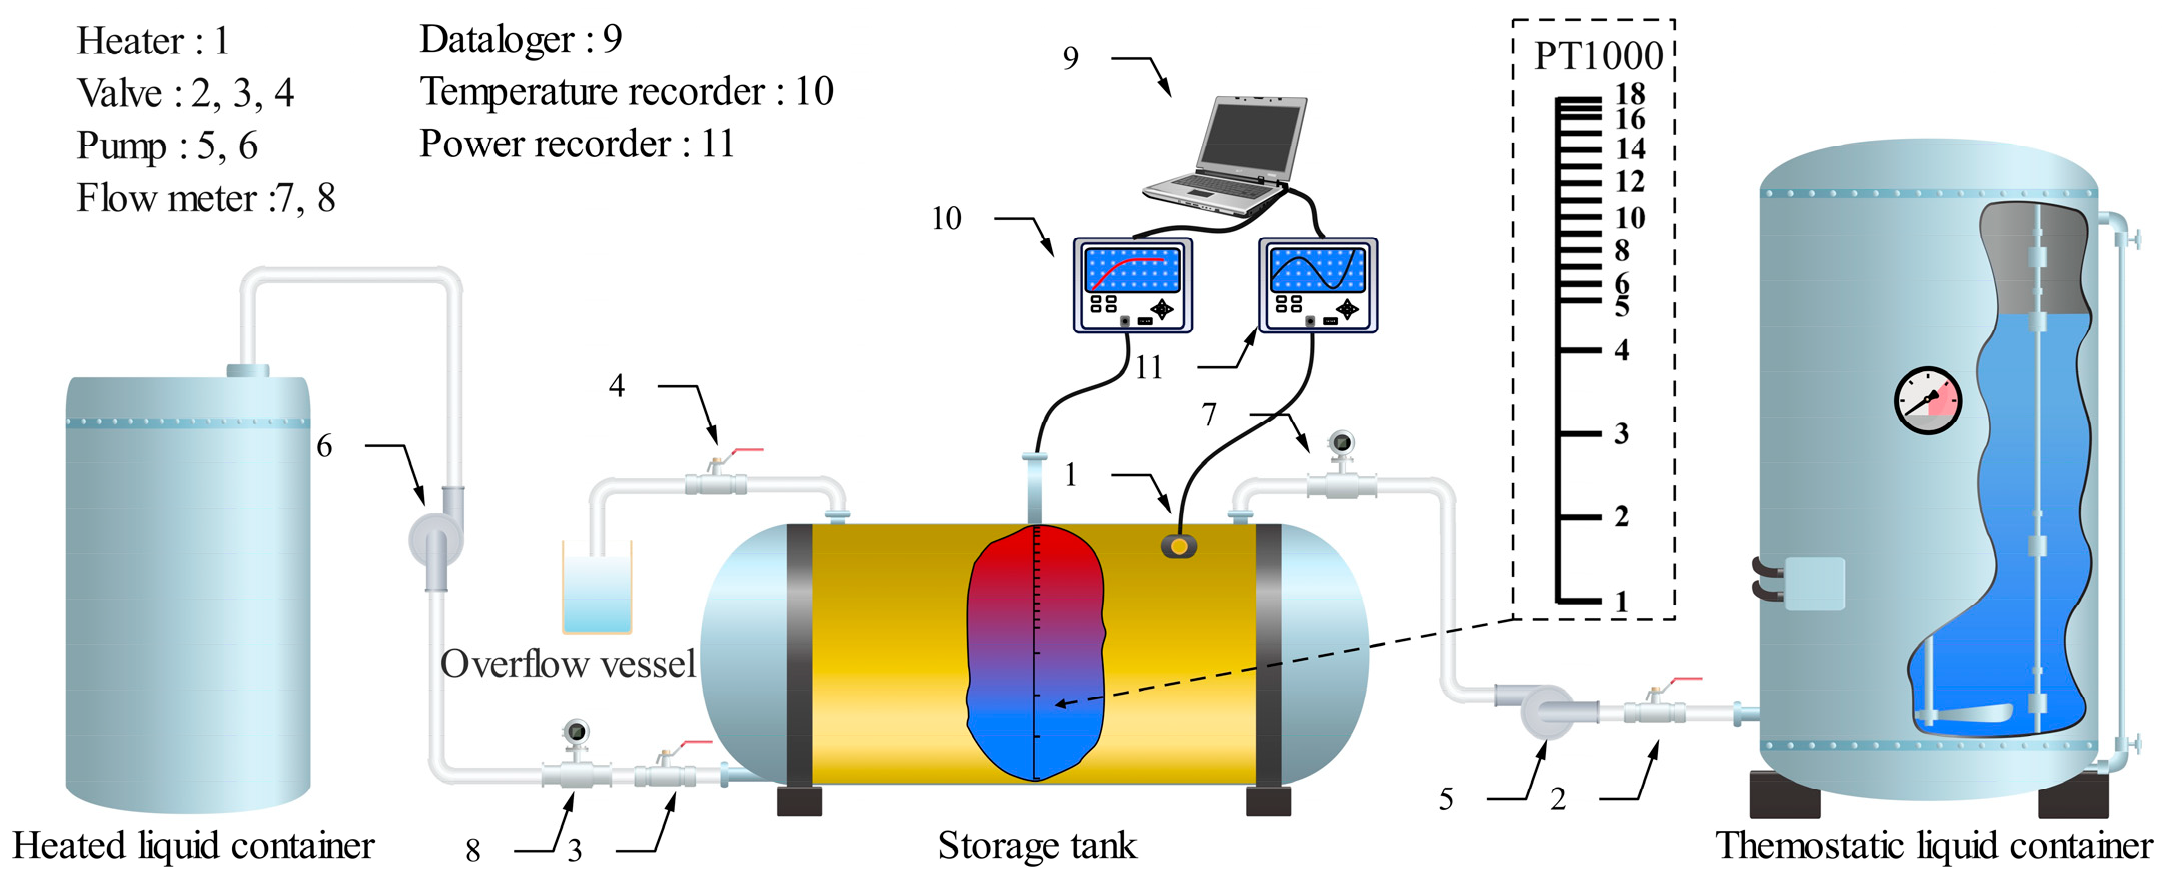
Figure 1. Schematic diagram of the experimental device.
Aerospace 12 01020 g001
Figure 2. Computational grid.
Aerospace 12 01020 g002
Figure 3. Grid independence verification.
Aerospace 12 01020 g003
Figure 4. Comparison of the numerical transient temperatures with experimental data.
Aerospace 12 01020 g004
Figure 5. Axial section and temperature distribution and analysis of the radial section.
Aerospace 12 01020 g005
Figure 6. Rate of temperature variation with height in the model.
Aerospace 12 01020 g006
Figure 7. The distribution of temperature (left side of the section) and flow field (right side of the section) under different heating powers.
Aerospace 12 01020 g007aAerospace 12 01020 g007b
Figure 8. Richardson number and Stratification number under different heating powers.
Aerospace 12 01020 g008
Figure 9. Time variations of temperature and volume-averaged velocity of fluid.
Aerospace 12 01020 g009
Figure 10. Penetration time under different heating powers.
Aerospace 12 01020 g010
Figure 11. Thermal stratification energy ratio of thermal stratification.
Aerospace 12 01020 g011
Figure 12. The distribution of synergy angle in the radial section when the heating power is 435 W.
Aerospace 12 01020 g012
Figure 13. The distribution of synergy angle in the radial section when the heating power is 900 W.
Aerospace 12 01020 g013
Figure 14. Heat transfer characteristics at different heating powers.
Aerospace 12 01020 g014
Figure 15. Thermal stratification characteristics of the fuel in the tank.
Aerospace 12 01020 g015
Table 1. Positional coordinates of the thermocouples.
NoX (mm)Y (mm)Z (mm)NoX (mm)Y (mm)Z (mm)
115000101502300
2150500111502400
31501000121502500
41501500131502600
51501800141502700
61501900151502800
71502000161502900
81502100171502950
91502200181503000
Table 2. Computational grid definition of the fluid region (the number of grid layers is eight in the solid region).
Mesh 1Mesh 2Mesh 3Mesh 4Mesh 5
Grid typeHexahedral
Thickness of first row (mm)0.0020.0050.010.020.05
Mesh gradient ratio1.2
Total grid number1,587,9901,306,870626,874330,942185,138
Table 3. Computational grid definition of the solid region (the thickness of the first row in the fluid region is 0.01 mm).
Mesh S1Mesh S2Mesh S3
Grid typeHexahedral
Solid region layer number4812
Thickness of each row (mm)0.50.250.1667
Solid region grid number35,50870,392105,276
Disclaimer/Publisher’s Note: The statements, opinions and data contained in all publications are solely those of the individual author(s) and contributor(s) and not of MDPI and/or the editor(s). MDPI and/or the editor(s) disclaim responsibility for any injury to people or property resulting from any ideas, methods, instructions or products referred to in the content.