Article

Toward Greener Propulsion: An LCA-Based Environmental Performance Classification of In-Space Propulsion Options †

by
Lily Blondel-Canepari
1,*,
Lorenz Affentranger
2,
Sara Morales Serrano
2 and
Angelo Pasini
1
1
Department of Civil and Industrial Engineering (DICI)—Aerospace Division, University of Pisa, 8 Via Gerolamo Caruso, 56122 Pisa, Italy
2
European Space Research and Technology Center (ESTEC), Keplerlaan 1, 2201 AZ Noordwijk, The Netherlands
*
Author to whom correspondence should be addressed.
This paper is an extended version of our paper published in the 2024 Space Propulsion Conference in Glasgow, UK, 20–23 May 2024.
Aerospace 2025, 12(11), 1003; https://doi.org/10.3390/aerospace12111003
Submission received: 30 July 2025 / Revised: 24 October 2025 / Accepted: 28 October 2025 / Published: 10 November 2025
(This article belongs to the Special Issue Green Propellants for In-Space Propulsion)

Abstract

As space activities expand rapidly, especially the in-orbit population, concerns about their environmental consequences are growing. For in-space propulsion, this is particularly true under the increasing regulatory pressure on hydrazine-based legacy propellants. In response to that, this study presents a cradle-to-gate Life Cycle Assessment (LCA) of the four main current options for in-space liquid bipropellant systems—MON-3/MMH, 98%-HTP/Ethanol, 98%-HTP/RP-1 and N2O/Ethane—each evaluated as a complete system including propellant-combination loading and sized propulsion-architecture manufacturing. The comparison is performed against a representative 2 kN Orbital Transfer Vehicle (OTV) mission scenario delivering a total Δ v of 2300 m/s. Each solution’s environmental performance is quantified across 15 midpoint indicators, using ESA’s space-specific LCA database and combined through an Analytical Hierarchy Process (AHP) single-score for easier comparison. Results show that while HTP/Ethanol achieves the lowest impact at the propellant-loading level, the N2O/Ethane system obtains the lowest overall footprint once the full propulsion system architecture, sized for the mission, is included, with a total environmental impact 63% lower than the legacy MON-3/MMH system. A key outcome of this study is that manufacturing propulsion components dominates the life-cycle footprint, bringing up to 95% of the total impact for HTP-based systems and approximately 64% for MON-3/MMH and self-pressurizing architectures, mainly due to the energy-intensive production of titanium and aluminum tanks. In light of these results, this paper proposes a mission-driven definition of “greener” propulsion, requiring at least a 50% reduction in the combined total and human-toxicity impacts, together with a lower Global Warming Potential (GWP) than legacy hydrazine-based systems, given that GWP was identified as the most critical environmental concern to address. However, the study also shows that considering only GWP would have led to an incorrect conclusion, and therefore advises against relying on single-impact environmental assessments. Additional replacement criteria for in-space propellants include cost-efficiency, reliability and global propulsive performance. This work implements a system-level environmental performance assessment and classification framework for in-space liquid propulsion options, providing a structured approach for selecting and qualifying more sustainable alternative candidates for future mission scenarios.

1. Introduction

1.1. Scope and Objectives

This paper begins with an overview of the current landscape of the so-called “green” propellants, with a focus on their integration into the evolving ecosystem of Orbital Transfer Vehicles (OTVs) supporting the in-orbit servicing market. Each propellant combination of the study exhibits distinct physical and operational characteristics, often requiring tailored propulsion-system designs to exploit their full potential. As a result, different combinations can be better suited to different mission profiles. However, a fundamental challenge remains in terms of environmental performance: there is no universally accepted definition of what qualifies a propellant, or a propulsion system, as “green” or “greener”. The term lacks consensus and regulatory clarity within the space sector [1,2]. In chemical propulsion particularly, the label “greener” is often used loosely to describe alternatives to hydrazine that are less toxic and less dangerous to handle. Yet, according to established Life Cycle Assessment (LCA) frameworks, notably ISO 14040 [3] and ISO 14044 [4], environmental claims should be based on transparent, multi-criteria evaluation across the full life cycle rather than on single-issue attributes such as toxicity.
This paper addresses that gap by highlighting the urgent need for space-specific environmental assessment methods. It introduces a system-level evaluation framework, developed in collaboration with ESA’s CleanSpace Office, which assesses the environmental performance of in-space propulsion systems holistically. Rather than focusing solely on the propellant, this approach includes both the physical architecture of the propulsion system (referred to as the dry architecture in this paper) and the fluids involved (propellants and, where applicable, pressurizing gases).
The ultimate objective is to propose a clear and operational definition of what “greener” means for in-space propulsion. This includes setting performance-based environmental standards and proposing system-level figures of merit to guide the replacement of conventional propellants and the evaluation of candidate alternatives.

1.2. The Rapid Increase of Space Activities

Figure 1 illustrates the exponential growth in space activity worldwide over the past 23 years, highlighting both the number of launches and payload deployments. Notably, 2021 and 2022 saw a sharp increase by approximately 30% in annual launches compared to previous years, followed by an additional 18% growth in 2023 [5]. The increase in deployed payloads has been even more striking: 2020 witnessed a 197% surge, followed by 40% in 2021, 32% in 2022, and 17% in 2023 [5]. These figures reflect significant advancements in launcher capabilities, improvements in space logistics and new trends in payload miniaturization. As a result, the payload ratio has considerably increased, reaching 13.40% in 2025 [5], an indicator of growing efficiency across the space transportation sector.

1.3. Role and Impact of Orbital Transfer Vehicles (OTVs)

At the center of the expansion of in-space activities and payload deployment stands the development of orbital stage systems—orbital transfer vehicles (OTVs), also known as kick stages—which are becoming indispensable add-ons to modern space missions. Originally designed to extend the launchers capabilities, they now serve as efficient end-to-end transportation enablers in space logistics by delivering “last mile” delivery [6]. By taking over orbit insertion and transfer duties, they reduce the propulsion burden on payloads, maximize launcher utility, and enable the deployment of multiple satellites to different orbits in a single mission. This efficiency not only lowers launch costs but also helps satellites save fuel for long-term operations, increasing their useful lifespan and economic return [7].
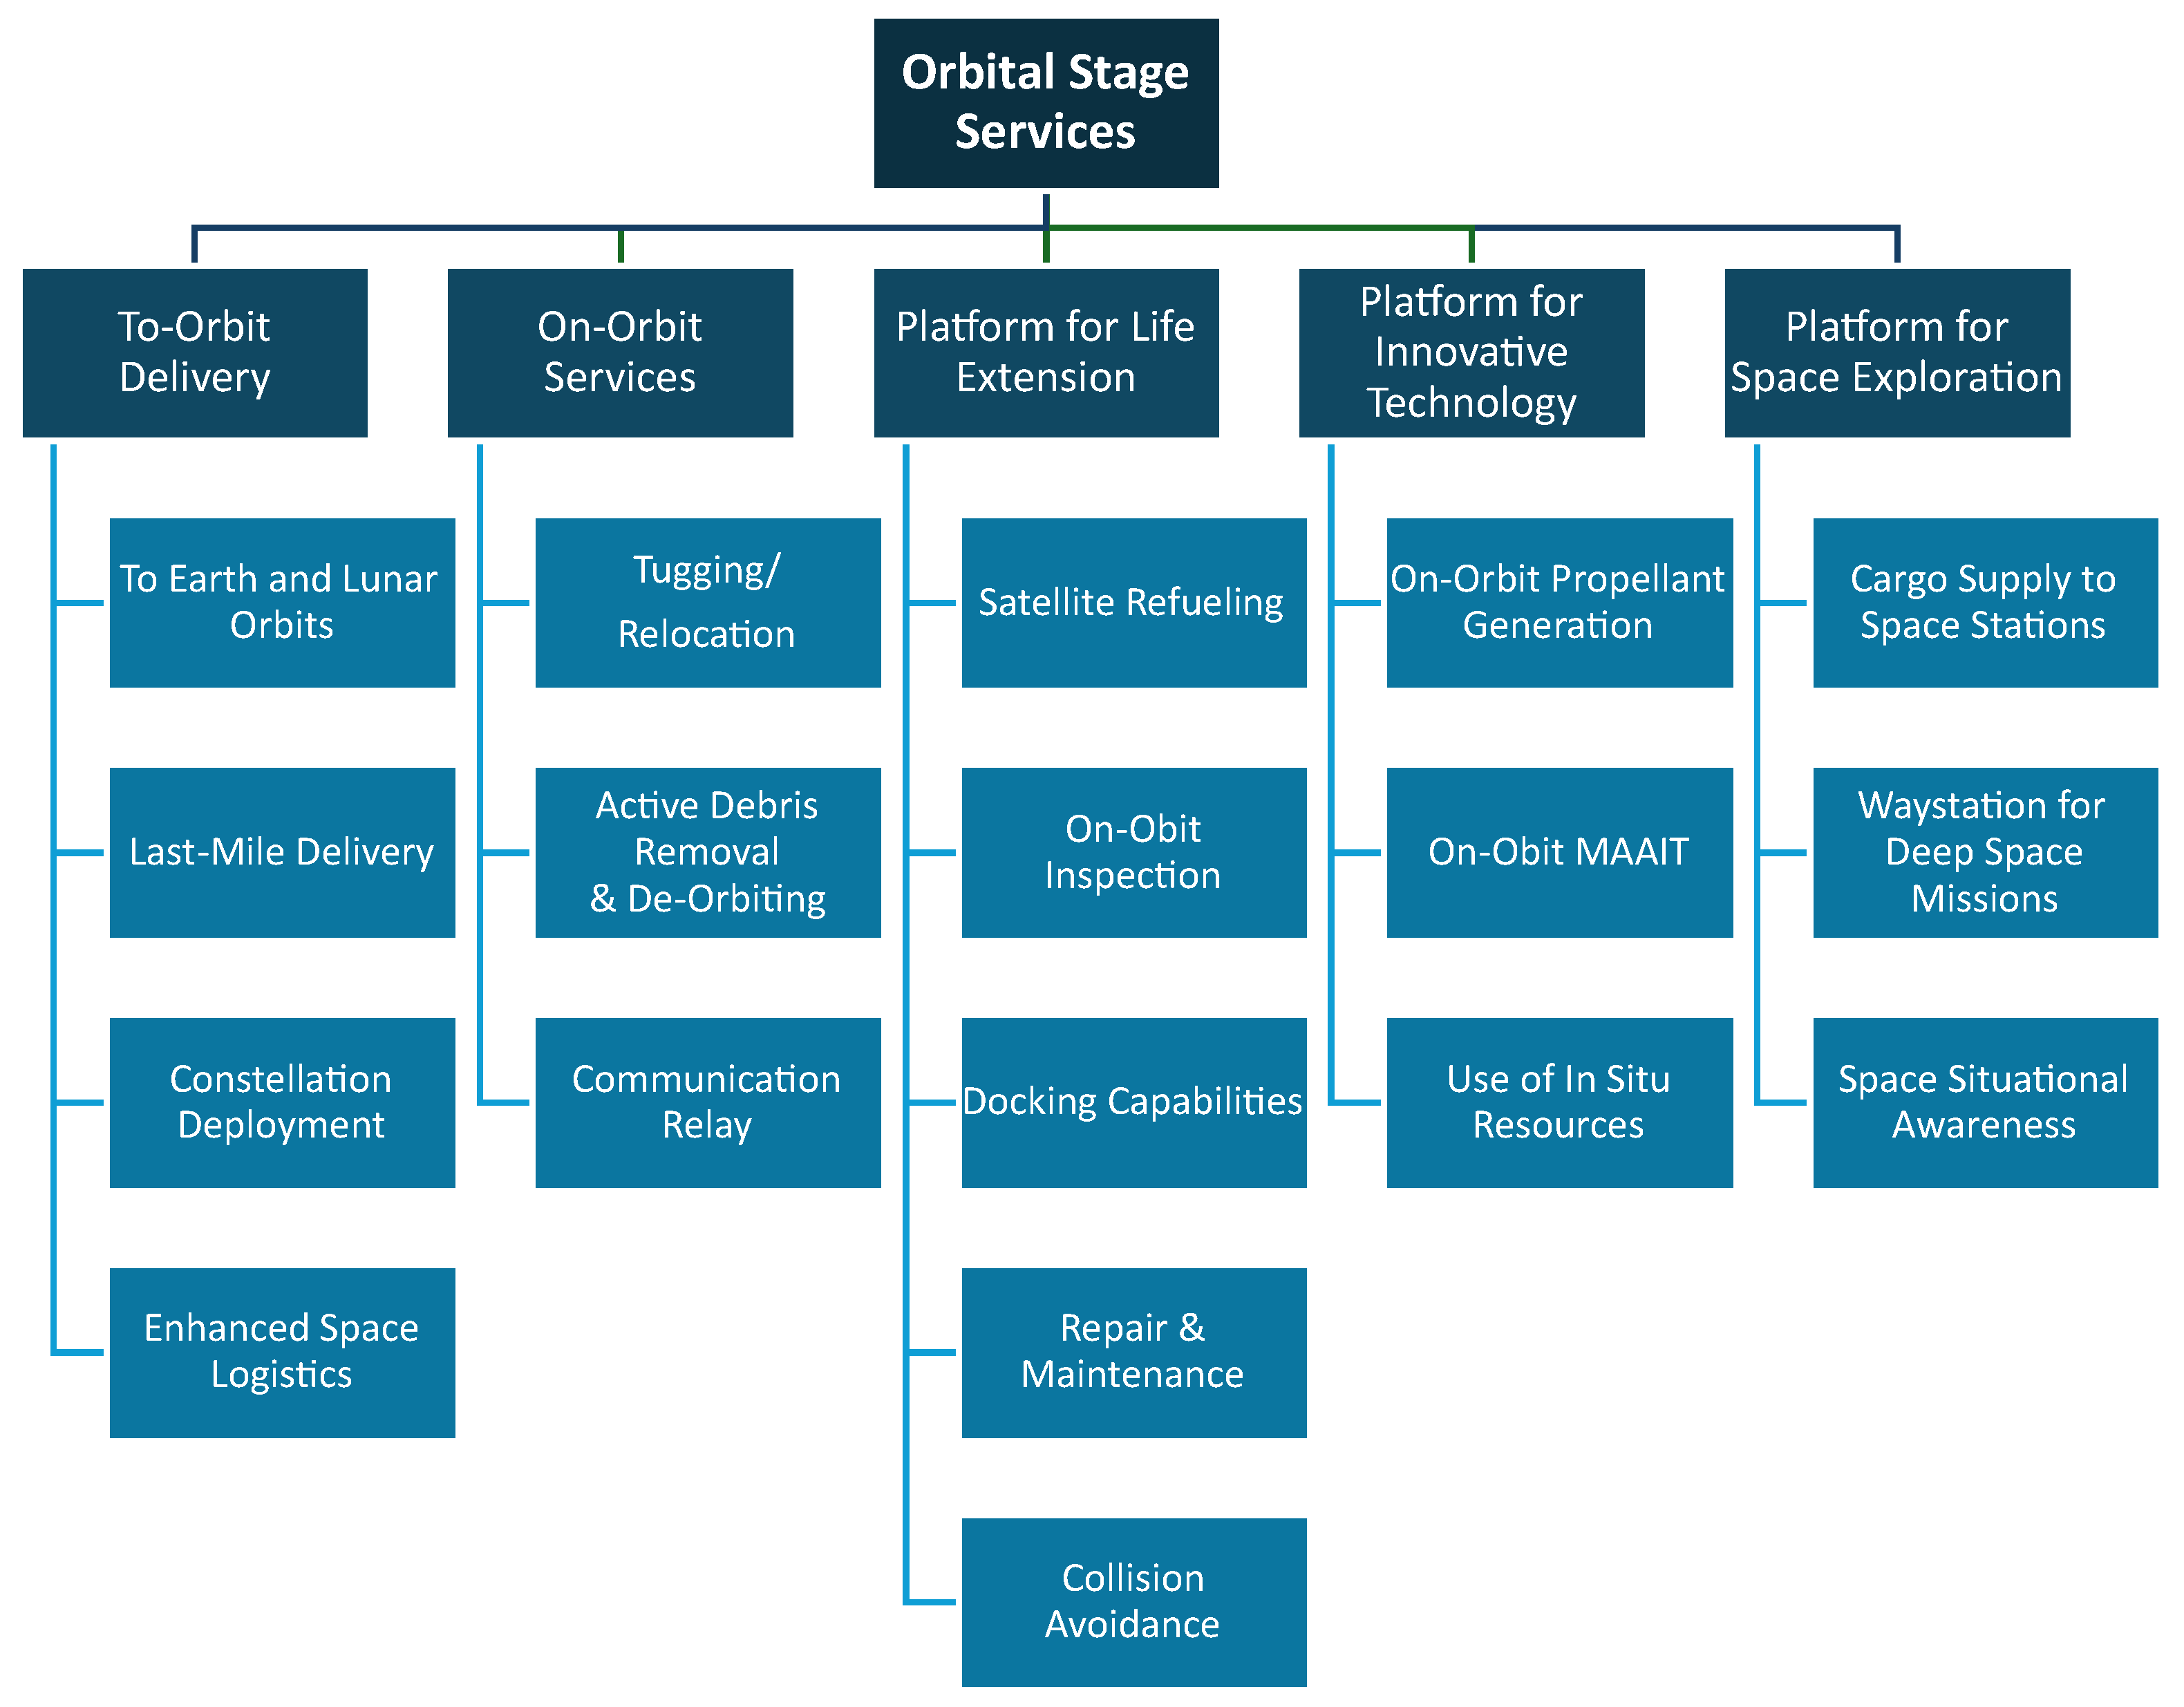
Beyond last-mile delivery deployment, OTVs support a wide range of in-space services (see Figure 2), including payload relocation (tugging), active debris removal (ADR), inspection & repair, life extension and even serving as communication relays. The modularity of modern OTV designs allows the integration of specialized kits, such as robotic arms or docking mechanisms, making them adaptable to many different mission objectives. As demand grows for satellite constellations, cislunar transport and on-orbit assembly, OTVs are emerging as central enablers of sustainable in-space logistics and of a circular, service-based space economy [8].

1.4. The Shift Toward Greener Liquid Propulsion

Because OTV missions are often long, demanding and versatile, they need restartable, throttleable, high-thrust propulsion with on-orbit storability, which makes storable liquid chemical systems the default choice. However, the sector is now transitioning away from conventional propellants toward greener alternatives. Traditionally dominated by hydrazine and its hypergolic fuel derivatives, monomethylhydrazine (MMH) and unsymmetrical dimethylhydrazine (UDMH), usually paired with nitrogen tetroxide (NTO), the field now faces increasing pressure to transition toward safer and more sustainable options. Indeed, these legacy compounds pose major safety and operational challenges, requiring SCAPE (Self-Contained Atmospheric Protective Ensemble) suits and stringent ground-handling protocols. During hydrazine fueling, facilities restrict non-essential personnel from the area and conduct operations with SCAPE-equipped teams under strict procedures [9].
This transition is being accelerated by tightening environmental regulations. In the European Union, the REACH legislation listed hydrazine as a Substance of Very High Concern (SVHC) in 2011 due to its carcinogenicity, which can trigger authorization requirements and restrictions on its use within the European market, with the stated goal of eventual phase-out [10]. In the United States, hydrazine is instead classified by the Environmental Protection Agency (EPA) as a "probable human carcinogen" based on weight-of-evidence criteria. However, this classification does not in itself constitute a ban: instead, it informs risk assessments and workplace exposure limits under OSHA and EPA programs. Therefore, while both jurisdictions acknowledge the severe hazards of hydrazine, the EU regulatory pathway relies on authorization and potential phase-out, whereas the U.S. approach is based on classification and management of exposure risks rather than a ban. At the international level, the United Nations is also responding: the upcoming 24th edition of the UN Model Regulations on the Transport of Dangerous Goods, effective in 2027, will introduce stricter handling and packaging requirements for hydrazine (UN 2029) under special provisions [11,12].
In parallel, the increasing costs of maintaining and operating legacy-propellants infrastructure together with the momentum generated by sustainability initiatives such as the European Green Deal [13] are driving both commercial and institutional actors to re-evaluate their dependence on toxic propellants. Although space transportation is smaller in scale compared to other sectors (254 successful launches and 2608 payloads deployed in 2024 [5] versus 10.7 million aviation flights in Europe alone [14]), the environmental impact of legacy space propellants is disproportionately high. Using diesel as a benchmark, hydrazine and monomethylhydrazine exhibit Global Warming Potentials approximately 36× and 63× greater than diesel, respectively, and producing 1 kg of these substances can generate up to 116× the environmental footprint of producing 1 kg of diesel. These high figures are an incentive to transition away from legacy propellants toward lower-impact (“greener”) alternatives.

1.4.1. Limitations of Traditional “Green” Claims

Despite growing interest, the use of the term “green” remains inconsistent and often unsubstantiated. A 2021 investigation by the European Commission found that 42% of environmental claims were exaggerated, misleading, or false, many bordering on unfair commercial practices under EU law, while 59% lacked easily accessible evidence [15]. In response, the European Commission proposed the Green Claims Directive in 2023 to ensure that environmental claims are scientifically substantiated and independently verified, with implications across all sectors including aerospace [16].
Among the space community, “green” in propulsion is often used to designate propellants that are less toxic than hydrazine or simply that are not hydrazine. While this distinction is a useful starting point for handling and safety considerations, it is not sufficient for environmental qualification. Indeed, a low-toxicity propellant might still exhibit high Global Warming Potential (GWP), require energy-intensive production processes or present long-term environmental risks. In the absence of standardized metrics, such as those provided by Life Cycle Assessment, the label “green” remains highly subjective and susceptible to green-washing.

1.4.2. The Need for Space-Specific Environmental Assessment

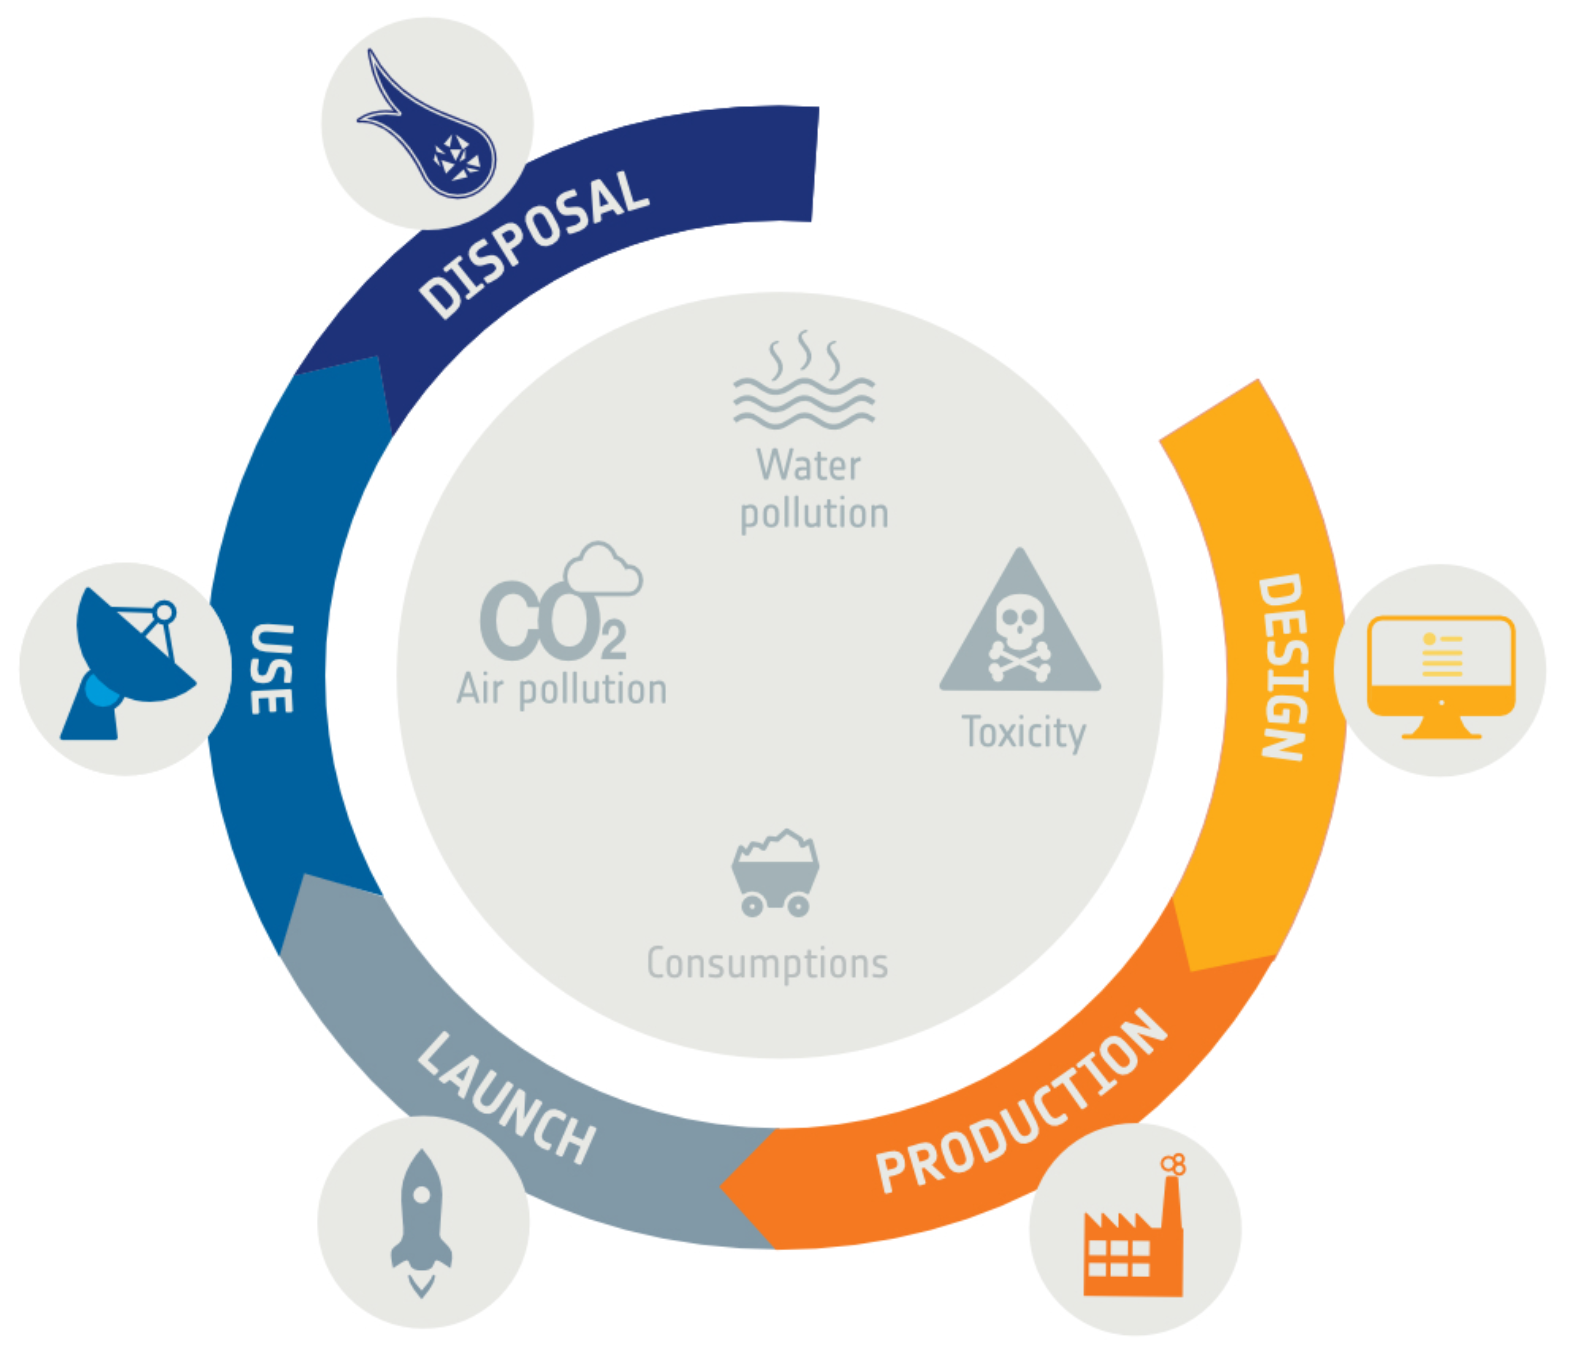
As the space sector transitions from decades of steady growth into a phase of rapid expansion, the need to understand and mitigate its environmental impacts has become increasingly urgent to ensure its long-term sustainable development and to avoid misleading “green” claims. Among available tools, Life Cycle Assessment stands out as a standardized and internationally recognized method, defined by ISO 14040 and 14044, for quantifying environmental impacts from raw-material extraction to end-of-life, as illustrated in Figure 3.
Recognizing this need, the European Space Agency has made environmental sustainability a priority, as formalized in its Green Agenda 2025 [18]. This commitment reflects the growing necessity to understand and manage the environmental repercussions of space programs, providing ESA with the necessary insights to meet regulatory requirements and to lead sustainable innovation across the European space industry. However, while LCA has been successfully applied across different industries, its application to the space sector presents distinct challenges due to its low production rates that limit the transfer of industrial-scale LCA practices, the unique environmental impacts of launch activities which release substances across all the atmospheric layers with poorly characterized effects on global warming and ozone depletion [19], the reliance on highly specialized materials and mission-specific manufacturing processes not represented in standard inventories and the extended development timelines that complicate life-cycle tracking and data collection from completed missions.
To overcome these limitations, ESA’s CleanSpace Office developed the ESA LCA Database, a dedicated collection of space-specific datasets [20,21], built on background data from Ecoinvent and the European Reference Life Cycle Database (ELCD). Since 2023, the updated ESA LCA database has been accessible to all ESA Member State stakeholders through the Space Debris User Portal [22] (requiring an Ecoinvent license) and is compatible with both SimaPro and openLCA software. The associated methodological framework and data guidelines are detailed in the ESA LCA Handbook [23], first issued in 2016 and updated in 2025 to incorporate user feedback and recent developments. The long-term goal is to implement environmental considerations as early as possible in the concurrent design process of future space systems and missions, where design flexibility is greatest and potential for impact is most significant. Indeed, it is estimated that up to 80% of a product’s environmental impact is determined during the early design phase [24,25].
While the present study focuses on the environmental dimension of sustainability, ongoing research at the University of Strathclyde extends this approach to Life Cycle Sustainability Assessment (LCSA). The resulting Strathclyde Space Systems Database (SSSD) integrates environmental (LCA), economic (LCC) and social (S-LCA) aspects in line with ISO standards and ESA guidance, enabling early-phase evaluation of multi-criteria environmental, economic and social sustainability trade-offs within the University’s Concurrent Design Studio.

2. Modeling the Environmental Performance of In-Space Propulsion Systems

This section presents the methodology used to evaluate the environmental performance of the different in-space propulsion options. It begins with an overview of the propulsion technologies considered, followed by a description of the orbital transfer vehicle (OTV) mission scenario used as basis for the comparison. The next subsection then details the implementation of the assessment framework, including the main assumptions and assessment steps.

2.1. Overview of In-Space Propulsive Options

While new in-space propulsion options are being actively developed, time-sensitive missions such as last-mile satellite delivery or on-orbit servicing still mainly rely on well-established high-thrust liquid bipropellant systems. Cold-gas thrusters, the simplest chemical propulsion option, are excluded due to their low thrust and low specific impulse, which make them suitable for attitude control rather than for the kick-stage main propulsion which targets a 2 kN thrust capability. Solid propulsion is ruled out for its inability to reignite or throttle that makes it unsuitable for orbital stage performing multiple orbit-insertion maneuvers for last-mile satellite deliveries or on-orbit servicing. Other non-chemical systems, such as nuclear-electric propulsion, are currently at low technology readiness levels and fall outside the scope of this study, which focuses on the most relevant and mature propulsion options for orbital stages.
As the demand for these categories of mission grows, so does the production of these propulsion systems and their associated environmental footprint. In this context, this study evaluates and compares the environmental performance of main bipropellant propulsion options. Due to limitations in available liquid oxidizers, these systems can be classified into three main families:
  • Legacy propellants: with NTO or a derivative (MON-1 or MON-3) as oxidizer, paired with hydrazine derivatives as fuel like monomethylhydrazine (MMH).
  • Greener semi-hypergolic alternatives: including High-Test Peroxide (usually 98%-HTP) as oxidizer, paired with light low-vapor-pressure hydrocarbon fuels such as RP-1 or ethanol.
  • Self-pressurizing systems: with nitrous oxide (N2O) as oxidizer combined with a high-vapor pressure fuel such as ethane or propylene.
Table 1 provides a more detailed overview of the specific propellant combinations investigated here, highlighting their associated system-level advantages and limitations.
Propulsion by its very nature relies on reactive and often hazardous compounds, intentionally brought together to release energy. As such, any propulsion system is intrinsically both environmentally and biologically active. This work aims to raise awareness on the environmental impacts that occur even before launch and to offer a framework for quantifying them during the design and manufacturing phases. Identifying the nature of these hazards and finding ways to minimize them through alternative materials, cleaner or less energy-consuming production methods is central to the eco-design approach. Indeed, its ultimate goal is to deliver the same system performance while reducing the overall environmental footprint.

2.2. Life Cycle Assessment Methodology

2.2.1. Goal and Scope

Life Cycle Assessment is a standardized and systematic method used to evaluate the potential environmental impacts of a product or system across its entire life cycle. According to ISO 14044, the LCA process is made of four main stages: (1) goal and scope definition, (2) inventory analysis, (3) impact assessment, and (4) interpretation that are illustrated in Figure 4.
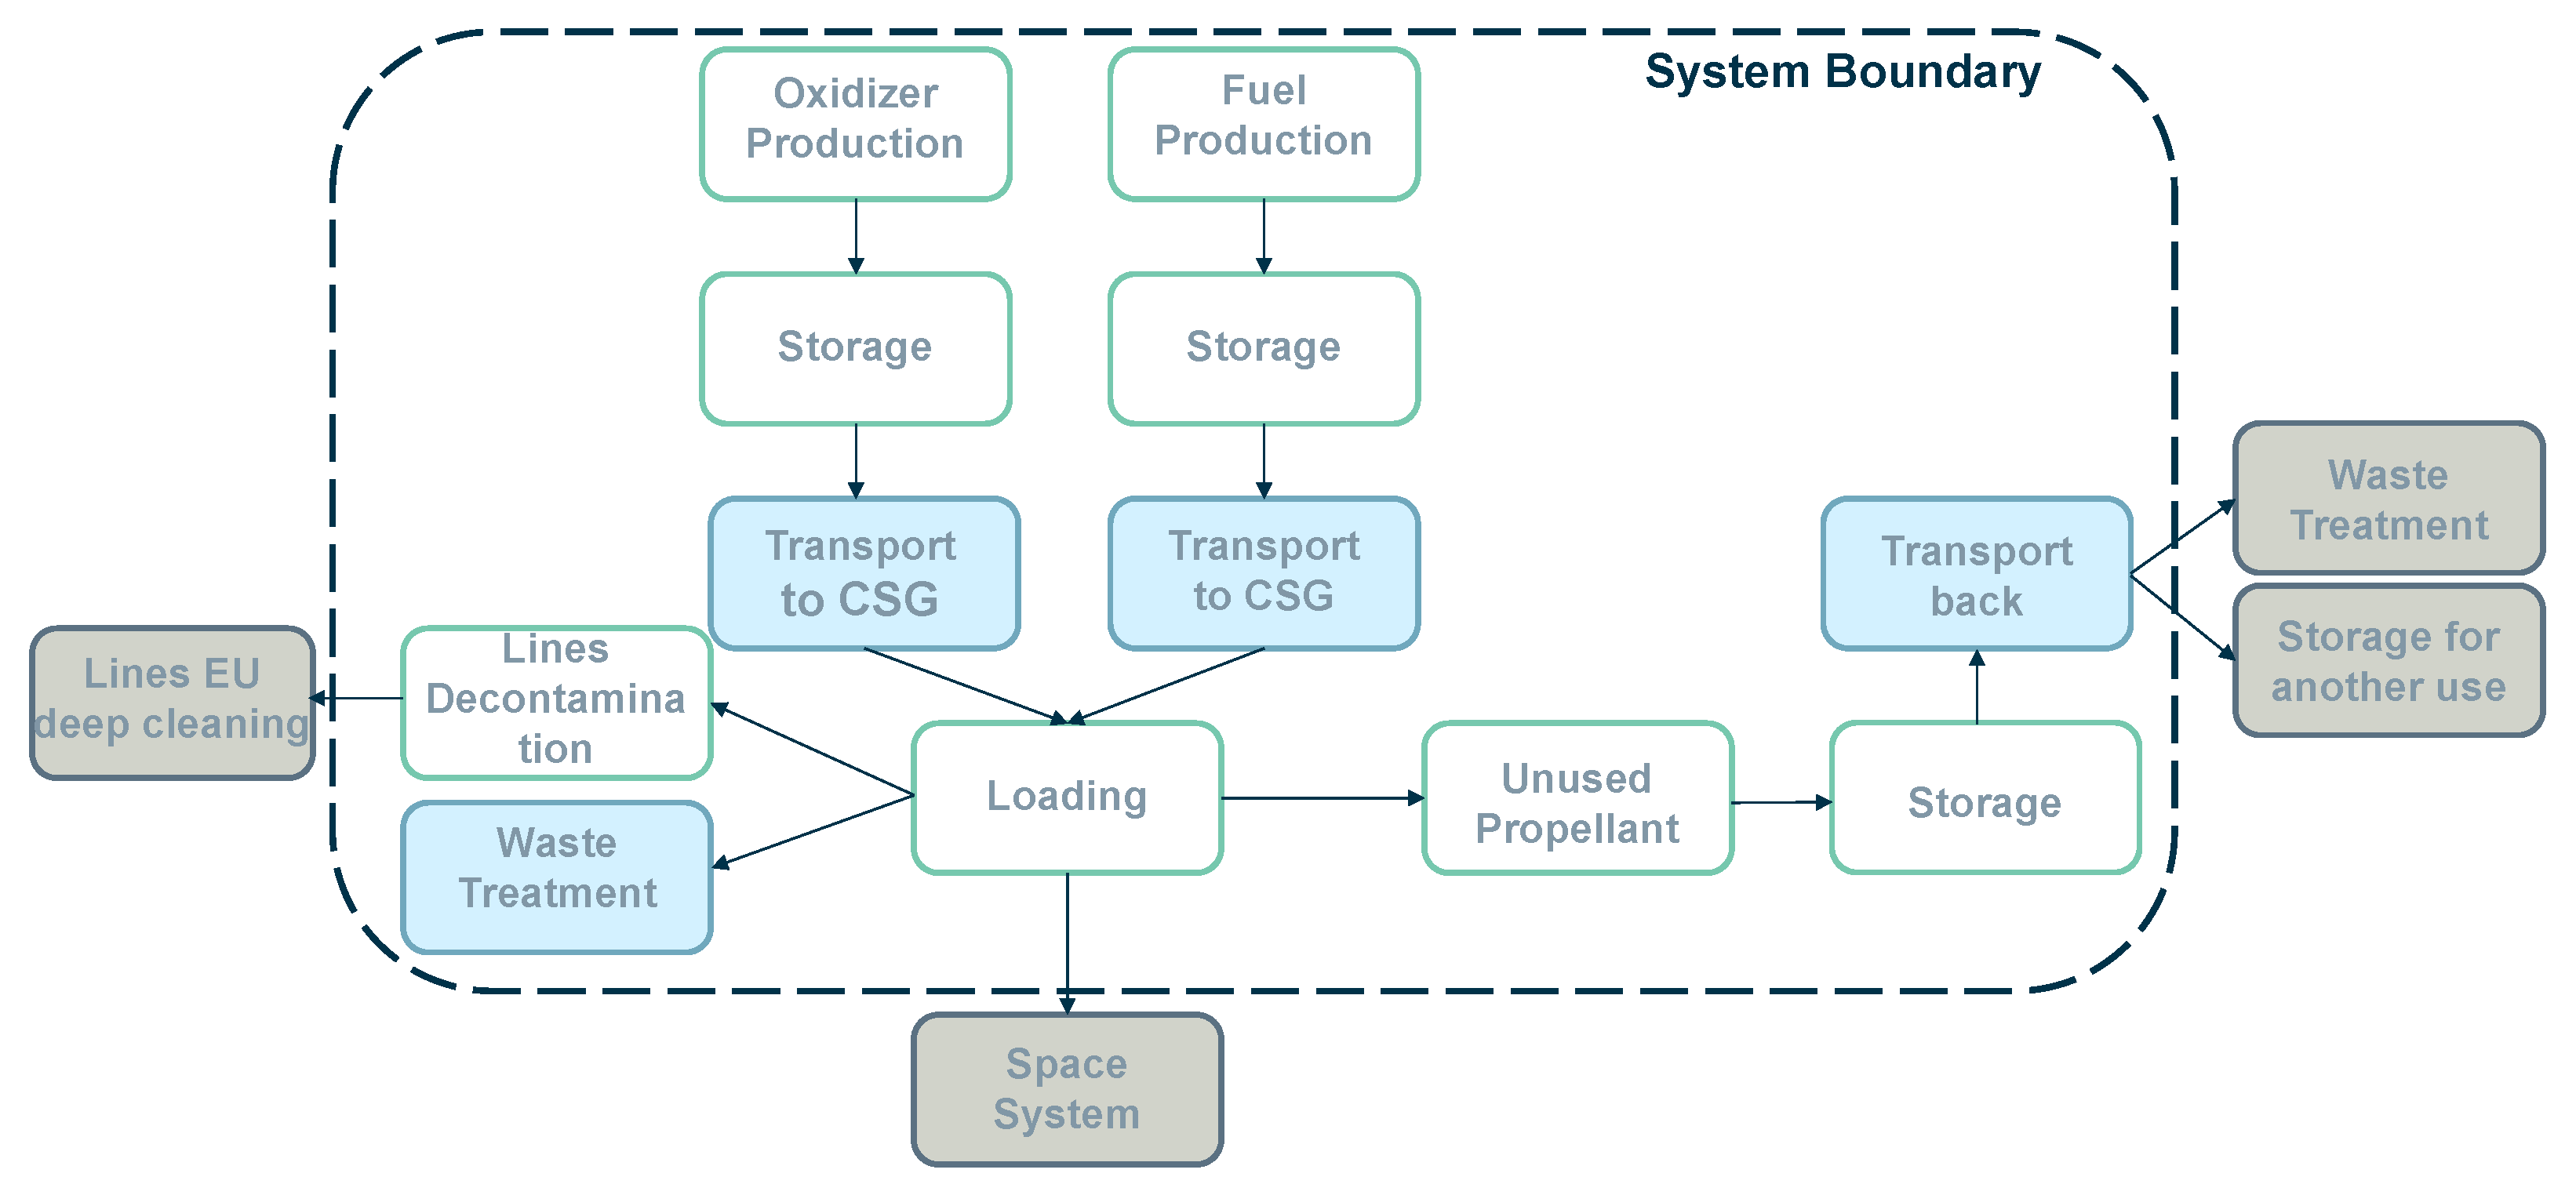
In this study, the goal is to assess the environmental performance of alternative bipropellant systems for Orbital Transfer Vehicles. The assessment considers impacts from the ground-based phases only, illustrated in Figure 5, from raw material extraction to the point of loading the propellant into the spacecraft (i.e., from cradle-to-gate).
The launch, in-space operation, and end-of-life phases are currently excluded from this study of in-space systems, based on the assumptions that in-space emissions have negligible impact on the Earth’s atmosphere and that end-of-life disposal strategies are not yet integrated into standard life cycle frameworks. However, the environmental impact of the launch phase, particularly the proportional contribution of a spacecraft or OTV to the total launch emissions, should be considered. This factor is expected to become a significant design driver, especially regarding mass and volume constraints. The results are intended to support early-stage decision-making regarding system architecture and propellant selection, guided by a sustainability criteria. By quantifying and comparing environmental performance, the findings also contribute to the broader discourse on what should be defined as a “greener” propulsion system.

2.2.2. Functional Unit and System Boundaries

To ensure consistency and comparability, environmental assessments based on Life Cycle Assessment are structured around two fundamental concepts: the Functional Unit (FU) and the system boundary. These elements provide the basis for evaluating different systems or scenarios by linking all input and output flows to a common function and within a defined framework.
Definition 1.
Functional Unit: A quantified description of the performance of a product system for use as reference unit [23].
  • In this study, two types of functional units are used to capture both material-level and mission-level impacts:
    -
    1 kg of chemical or material produced.
    -
    1 kg of propellant loaded into the spacecraft.
These unit-mass-based functional units align with standard LCA datasets, which report impacts per kilogram of substance produced or loaded. However, in this study, they are used to conduct performance-based assessments by calculating the total mass of propellant and associated materials required by the propulsion system to fulfill a fixed mission objective. This includes the raw materials needed to manufacture the propulsion system components and the propellant mass required to perform the mission maneuvers. This approach enables a system-level comparison of the environmental performance of different propulsion options within the same mission scenario, incorporating their key characteristics such as specific impulse, propellant density, and oxidizer-to-fuel ratio [21,27,28].
Definition 2.
System Boundary: Specifies which processes and activities are included or excluded from the analysis, and therefore modeled in the environmental assessment.
  • The life cycle inventories are modeled using a cradle-to-gate approach, including the inputs of materials and processes required for the different components and chemicals that constitute the propulsion system. The defined system boundaries cover all relevant stages up to launcher integration, including production, transportation, testing, storage, handling, and fueling operations. The specific processes involved in propellant loading are illustrated in Figure 6, while Figure 9 presents the system boundary applied to the overall propulsion system modeling.

2.2.3. Environmental Impact Categories

Environmental impacts are assessed using two types of indicators: midpoint and endpoint [29]. Midpoint indicators represent problem-oriented, intermediate environmental impacts (e.g., ozone depletion, eutrophication, or ecotoxicity), while endpoint indicators reflect damage-oriented outcomes at a broader level [30,31], such as impacts on human health, ecosystems, or resource availability [32]. Midpoint indicators are generally preferred in scientific studies due to their stronger methodological consensus and lower uncertainty [30]. For this reason, and based on previous ESA studies, this work assesses the environmental performance of different in-space propulsion options using the 15 midpoint impact categories described in the ESA LCA handbook [23]. These categories, along with the internationally recognized methods used for their calculation, are listed in Table 2.
To facilitate comparison across propulsion options, the 15 midpoint impact indicators are combined into a single-environmental-performance-score developed at the European Space Agency. This composite score is based on the Analytical Hierarchy Process (AHP), with indicator weights derived from a survey involving experts from both the space and LCA communities.
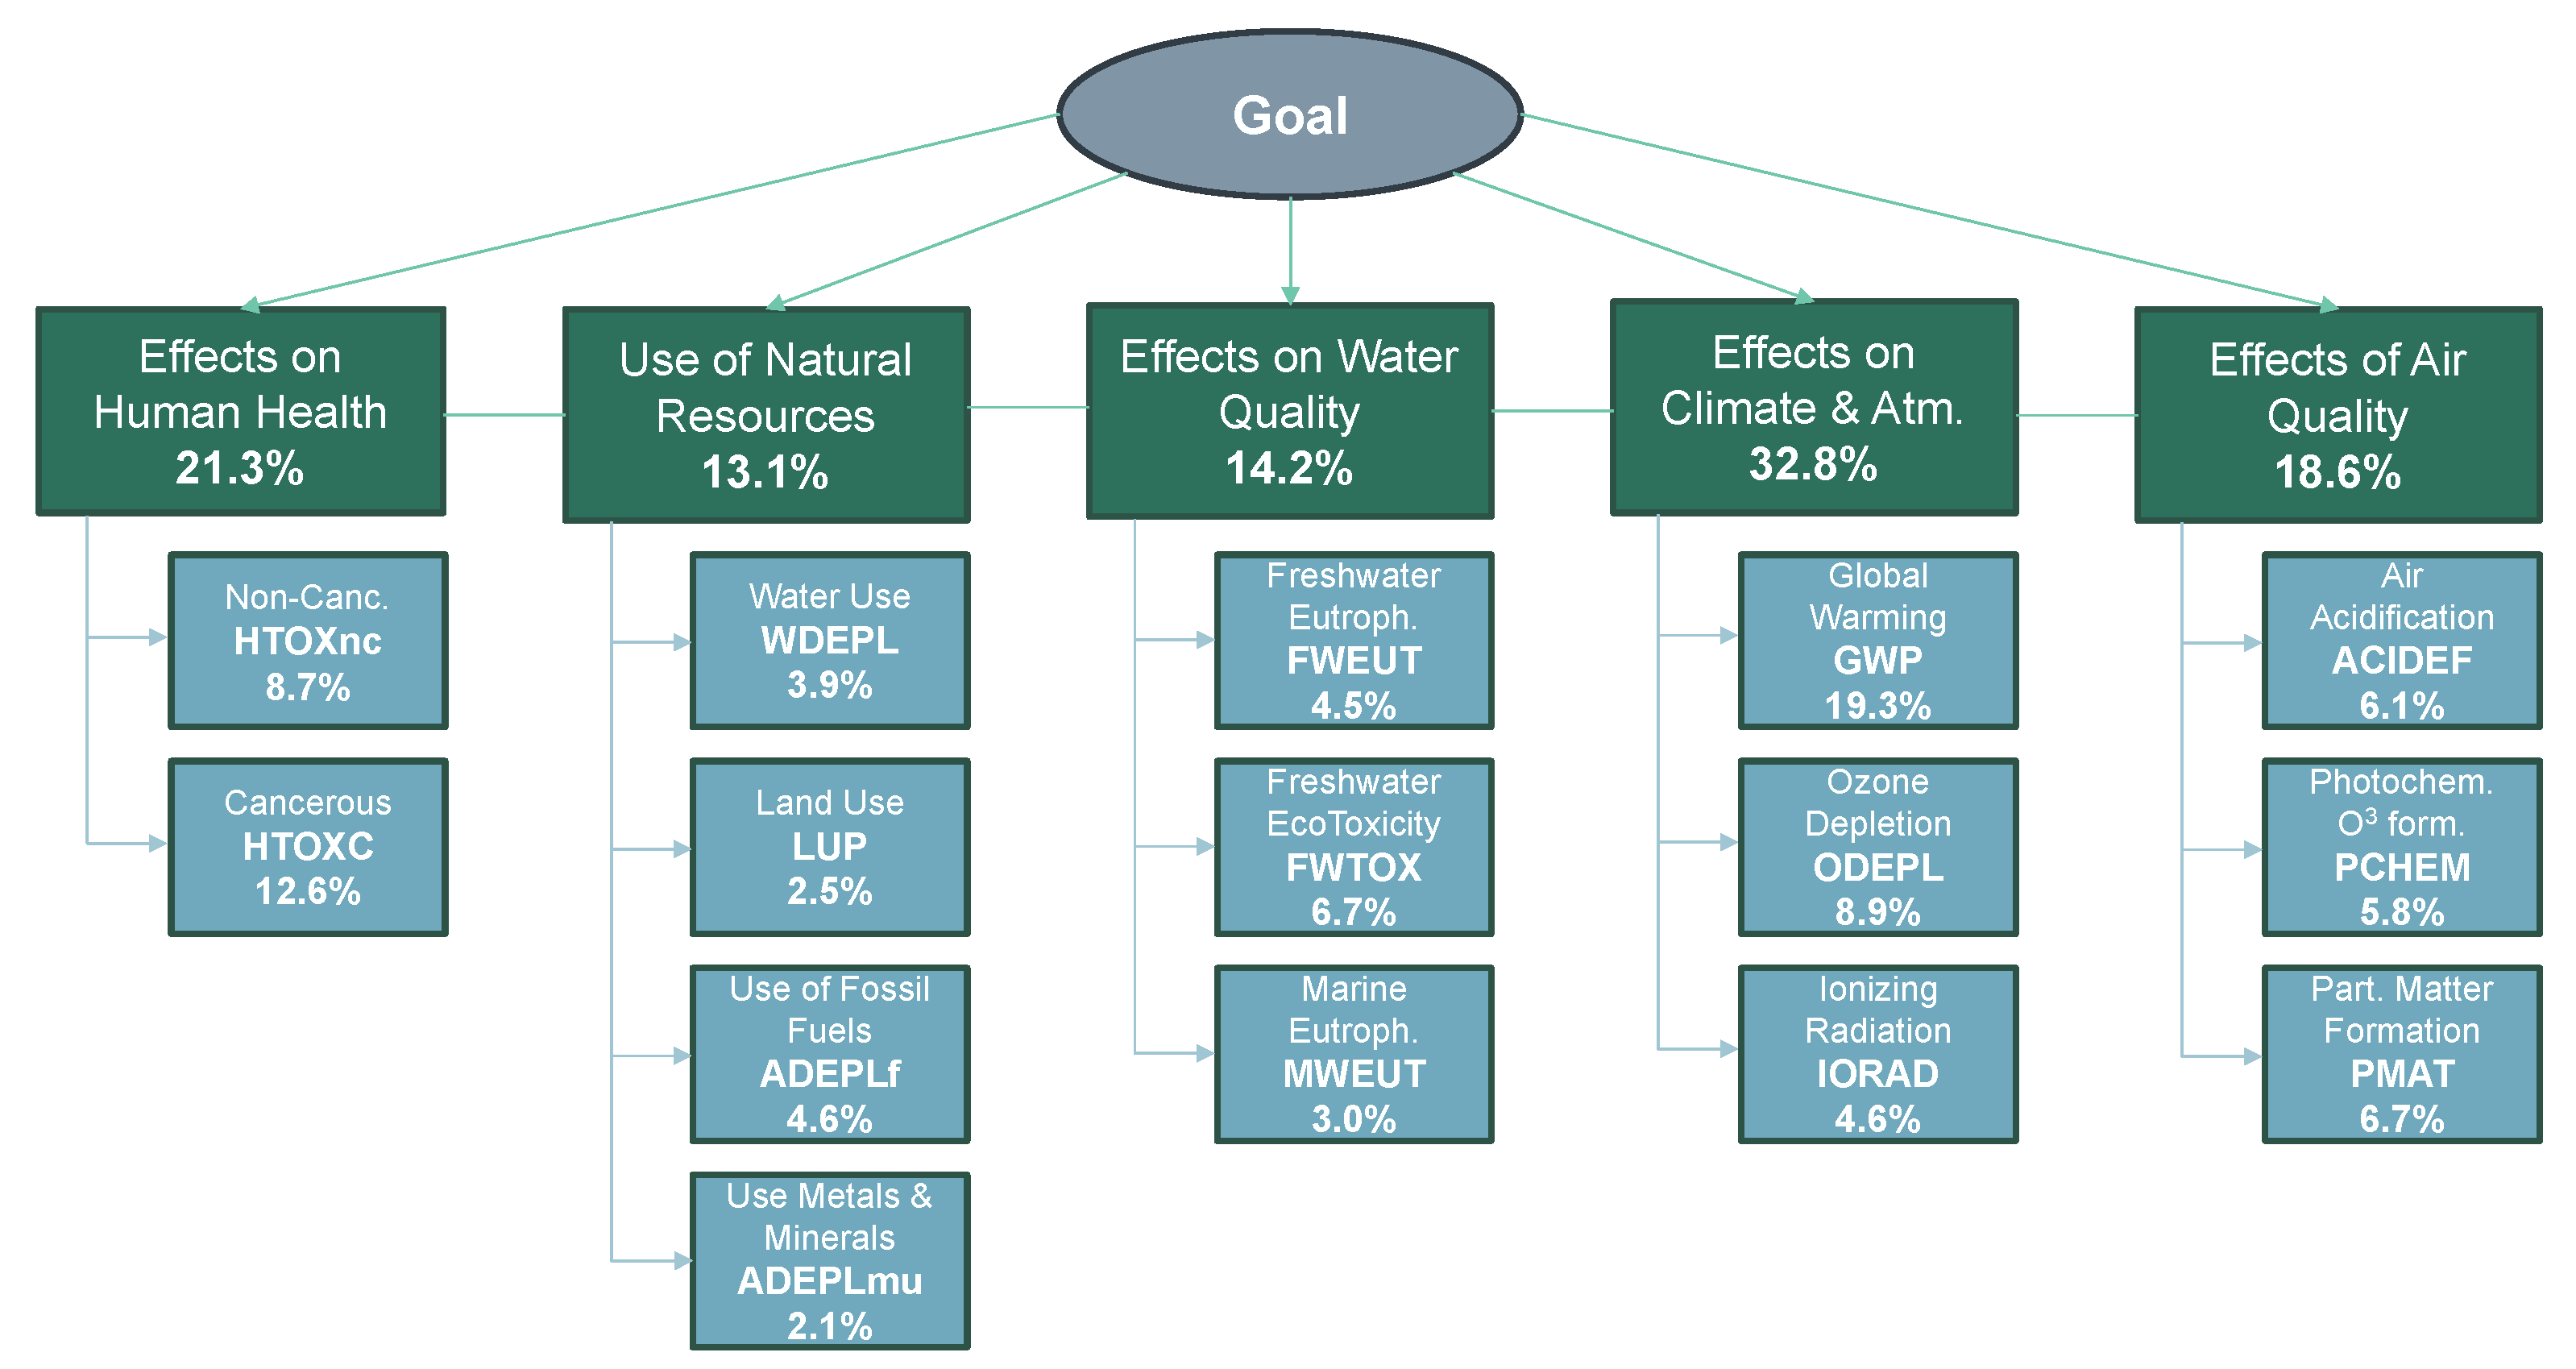
In the following sections, LCA results are presented for each propulsion option, showing both the characterization values for individual impact indicators and the overall AHP-based score, displayed as the leftmost bar in each graph. To compute this single score, individual indicator results were first normalized according to the Product Environmental Footprint (PEF) guidelines [32], which scale each impact relative to a reference value representing the average annual environmental footprint per global citizen, based on United Nations data. These normalized values were then weighted using the AHP-derived scores shown in Figure 7 and summed to produce the final single environmental performance score.

2.3. Framework and Assumptions of the Study

This study is based on a harmonized framework that integrates propulsion system modeling within a Life Cycle Assessment tool to compare the environmental performance of different in-space propulsion options for a specific mission scenario. The LCA modeling is performed using SimaPro v9.4.0.3 [39], with space-specific data sourced from the ESA LCA database (v1.2.0f) [23], initially developed in 2016 [20,21] to connect the generic Ecoinvent [40] background database to space applications with a focus on the European market. The background processes are modeled with version v3.9.1 of Ecoinvent with cut-off allocation. The results presented in the following sections reflect this configuration with infrastructure contributions excluded and long-term emissions included. In order to reflect real-world operational conditions, a set of assumptions and modeling simplifications related to both propulsion and LCA-methodology have been applied:
  • When fueling operations take place at the Guiana Space Centre (CSG), twice the amount of propellant required for the mission is transported to the site to ensure an operational backup.
  • All transport operations are modeled using data from the Ecoinvent v3 database.
  • A 10% production margin on the mission propellant is assumed from cradle to gate. This margin includes: (i) a 2% residual margin on the propellant mass computed from the Tsiolkovsky equation to complete the mission (ESA regulation [41]), and (ii) additional margins for ullage, line priming/purging, and transport/storage losses. The 10% margin is applied consistently to all propellant options to ensure a fair comparison. Note that this value does not represent the quantity of propellant treated during decontamination/waste treatment. Instead, decontamination is modeled separately using a fixed procedure and fixed decontaminant quantities per pipe operation, specific to each propellant combination.
  • Cleanroom operations are modeled using the S5B facility at CSG for all propellant combinations although different equipment is used for each combination.
  • Passivation of components and high-rigor cleaning steps specific to HTP handling are not included in the current scope.
  • Any unused propellant remaining after fueling is returned to the supplier and, in theory, stored for potential reuse. However, due to the uncertainty regarding whether it is actually reused, the full production burden of this spare quantity is included within the system boundaries for each propellant combination.
  • In-situ line cleaning is included in the study, but more extensive decontamination procedures, such as return transport to Europe, are excluded.
  • Tank modeling considers only the flight model, excluding the qualification route development.
  • To ensure consistency across the different tank types, the manufacturing processes are standardized using the titanium tank production route as the reference baseline.

2.4. Reference System and Mission Scenario

This study uses an Orbital Transfer Vehicle (OTV) as the reference system [42,43], selected for its key role in meeting the increasing demand for delivering multiple payloads to different Earth orbits. Being at the forefront of space logistics, the OTV provides an ideal platform for integrating novel propulsion technologies. To define a representative mission scenario, the OTV is modeled with a total wet mass of 3200 kg and equipped with a main engine capable of generating 2 kN of thrust. The mission objective is to achieve multi-orbits payload delivery, requiring a total Δ v of 2300 m/s.
The study adopts a system-level comparison of different bipropellant combinations, focusing on performance characteristics such as propellant densities, oxidizer-to-fuel (O/F) ratio, specific impulse ( I s p ) to compute the total propellant mass needed for the mission. These values, summarized in Table 3, form the basis for sizing and designing the propulsion system. Accordingly, the environmental performance assessment accounts for the manufacturing footprint of the entire propulsion system to understand the implications associated with each propellant choice. By employing a mission-centered framework, the analysis ensures that environmental impacts are considered within a realistic and operationally relevant context.
The output results are based on the modeling assumptions described in the previous section. As propulsion technologies evolve and higher-fidelity performance data becomes available, the findings should be updated to reflect more accurate environmental impacts across candidate technologies.

2.5. Modeling of Propulsive Architectures

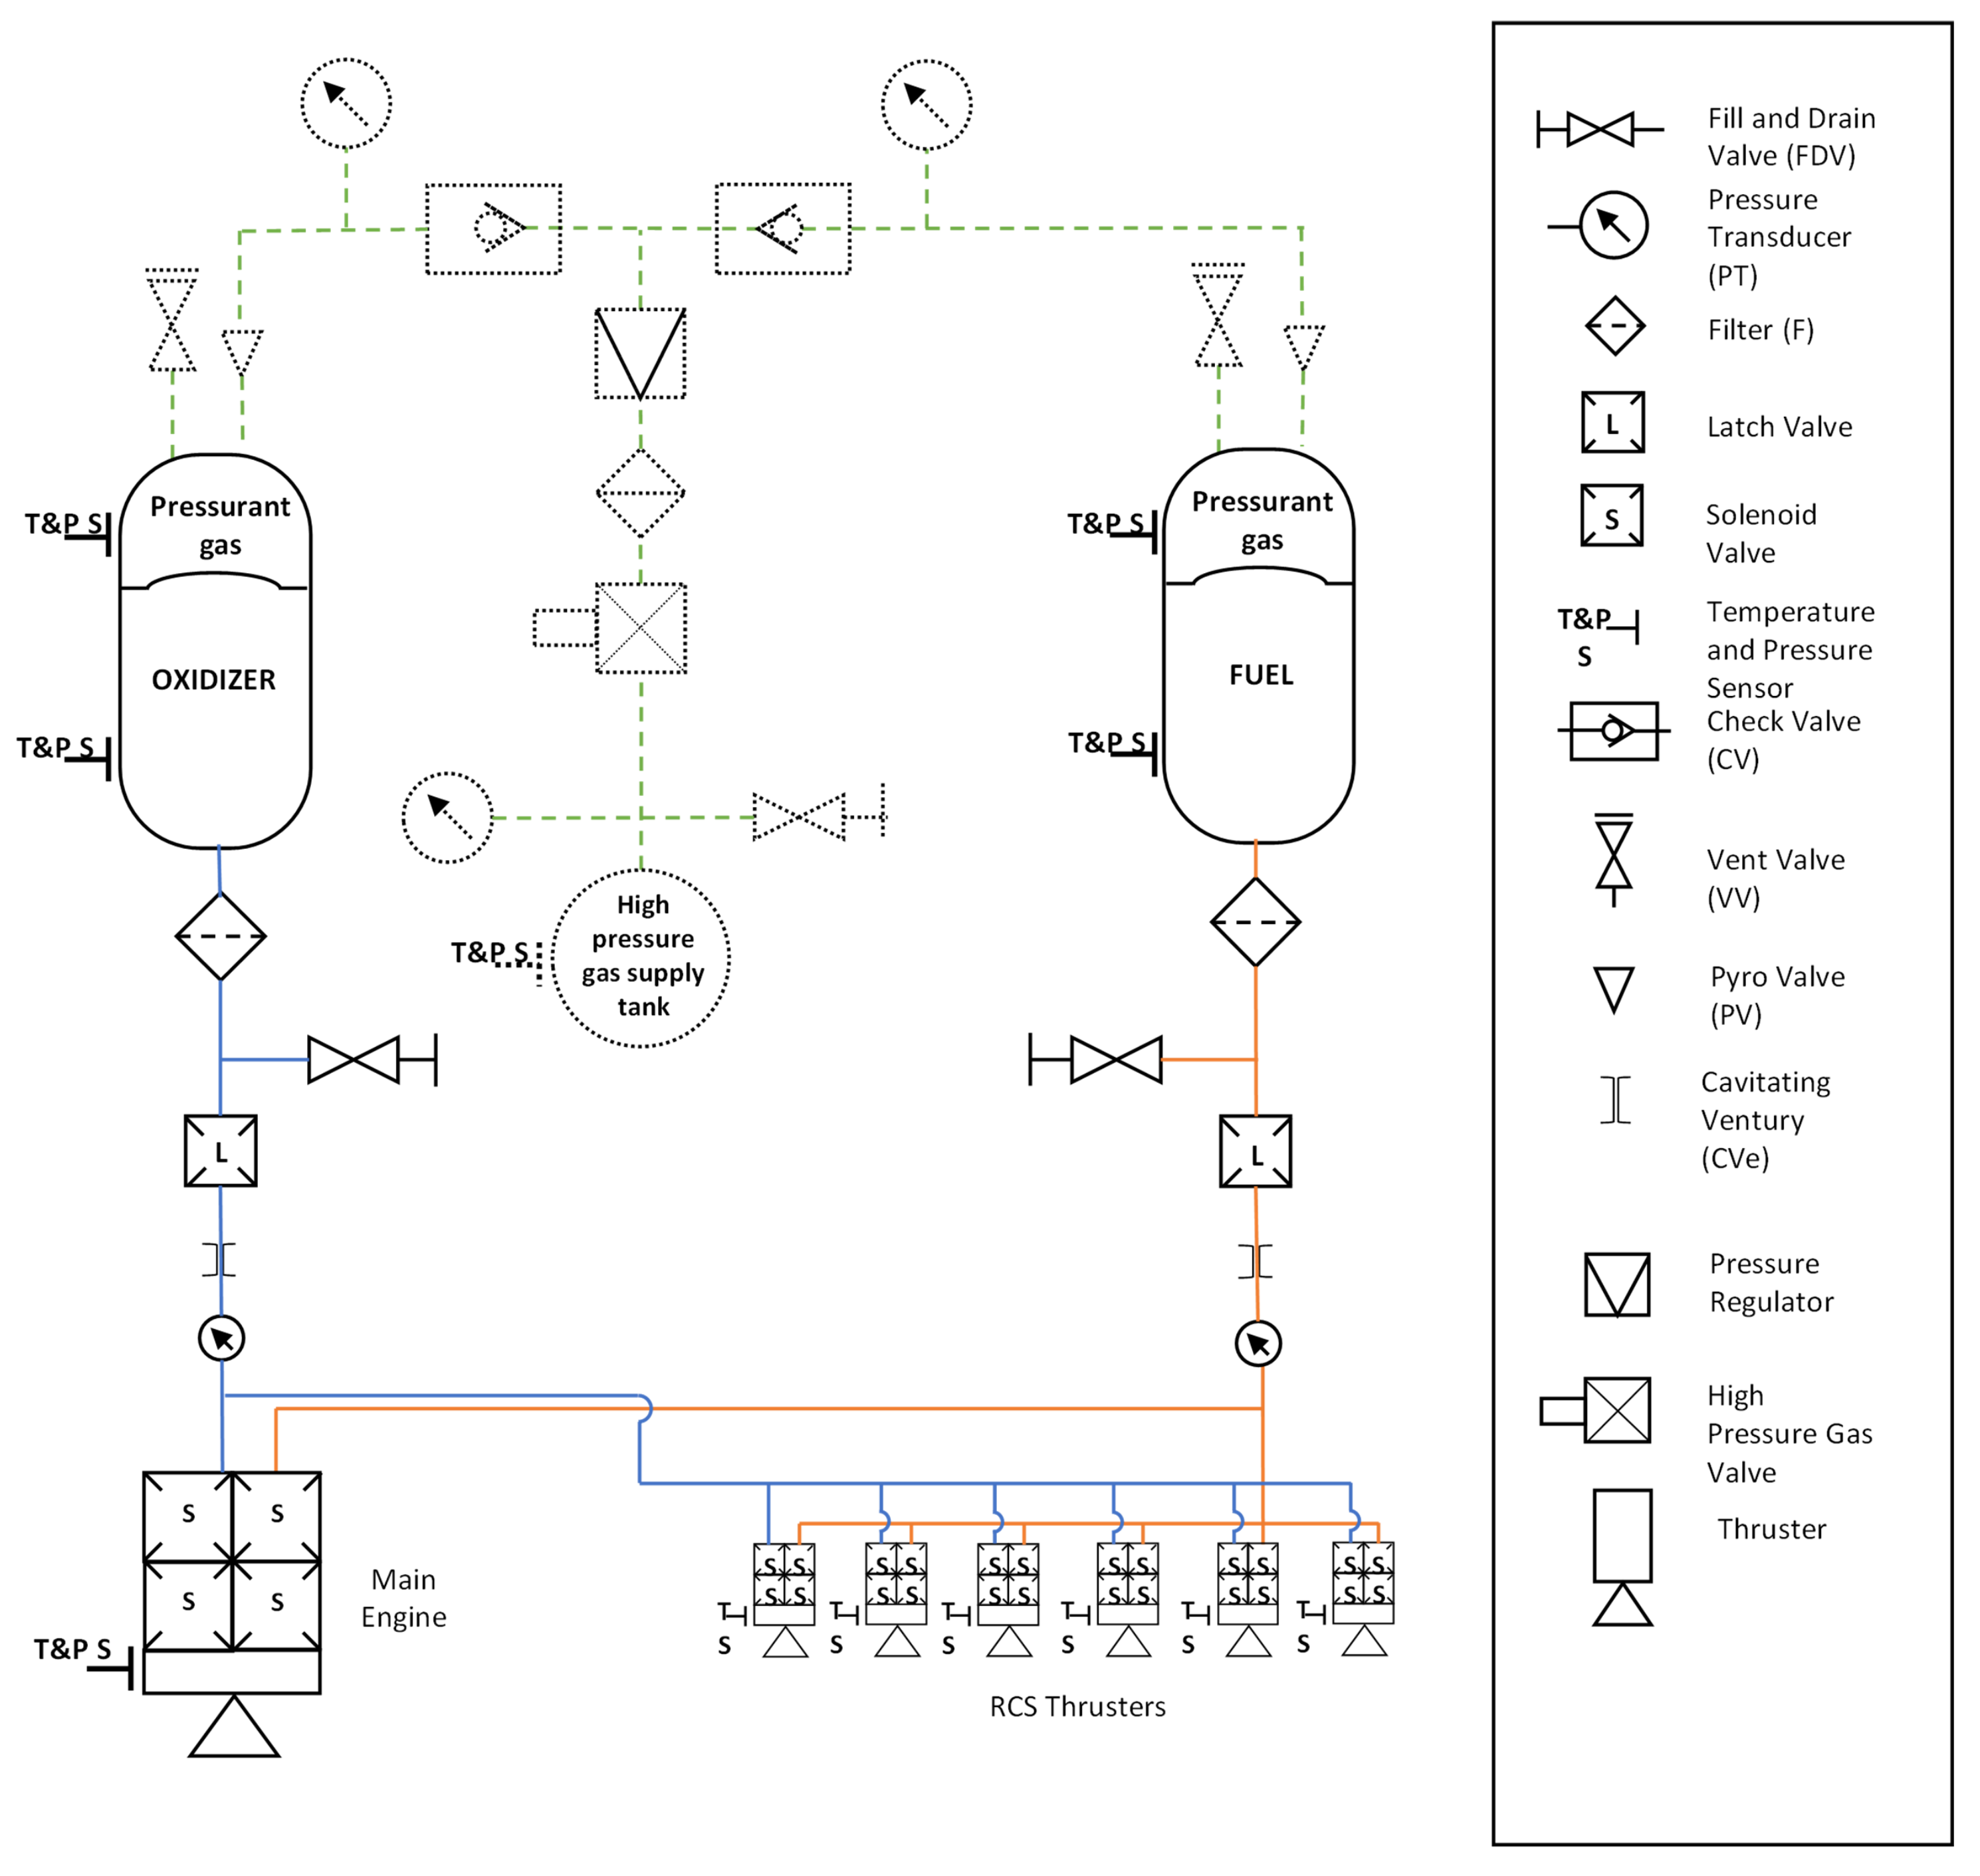
To assess the environmental impacts of different propulsion system configurations, this study defines and analyzes a baseline liquid bipropellant system architecture. The reference setup, illustrated in Figure 8, includes all components necessary for nominal operation and serves as baseline for comparing the environmental performance of alterative architectures tailored to different propellant combinations.

2.5.1. Overview of the Reference Architecture

The baseline architecture includes typical components for pressure-fed and self-pressurizing systems, with material selections and component types tailored to each propellant combination. The specific configuration and material choices are detailed in Table 4. In Figure 8, solid lines represent components common to all architectures, while dashed lines indicate elements unique to pressure-fed systems.
The piping system was estimated to have an approximated total length of 20–30 m, depending on the chosen architecture. To accommodate the engine’s thrust of 2 kN, 3/4-inch diameter pipes were selected. Their mass per unit length (kg/m) then varies with the material selected, titanium or aluminum, based on its compatibility with the propellant combination.

2.5.2. Tank Modeling and Material Selection

The most critical components of the propulsion architecture are the propellant and pressurant tanks as they significantly affect the whole system mass and environmental impact. Each tank is designed for its corresponding propellant combination without relying on particular existing designs. The mass of a tank, m T , is computed with the following equation [44,45]:
m T = 2 π S F r 3 1 + L r ρ w σ w P prop
where:
  • S F is the safety factor
  • L is the length of the cylindrical part and r the radius of the spherical part
  • ρ w is the density of the wall material
  • σ w is the allowable stress of the wall material
  • P prop is the propellant storage pressure inside the tank
This equation is used to compute the tank shell mass for each propellant combination. Cylindrical tanks ( L r = 2 ) are used for storing the fuel and oxidizer with a safety factor of 2, while spherical tanks ( L r = 0 ) are used for storing the pressurizing gas, here Helium, with a safety factor of 1.5 and an initial pressure of 200 bar. The propellant storage pressure and the material selected are the main drivers for the resulting tank mass since they determine the tank wall thickness. For the HTP and legacy options, the storage pressure inside the propellant tanks was derived from the combustion-chamber operating pressure, including a 30% pressure loss in the feed lines, resulting in 20 bar. For the N2O & Ethane combination, instead, the storage pressure was set directly at 65 bar, due to the compounds high vapor pressures.
The selection of the tank materials is guided by their mechanical properties and compatibility with the stored fluids. Table 4 summarizes the component counts for each propellant-specific architecture, while Table 5 presents the selected materials density, strength, and the strength-to-density ratio σ w / ρ w .
For the MON-3/MMH architecture, both the propellant tanks and the pressurant tank are constructed entirely from titanium alloy. In the case of HTP-based combinations, the propellant tanks consist of an aluminum AA5254 liner reinforced with a carbon-fiber-reinforced polymer (CFRP) overwrap. For simplicity, this configuration is modeled with a composition of 80% aluminum AA5254 and 20% CFRP by mass. Finally, the tanks used for the self-pressurizing system are modeled as a 50/50 blend of titanium alloy and CFRP overwrap, to balance mechanical strength and weight efficiency. The successive calculations used to estimate the raw material quantities required for manufacturing these tanks align with the assumptions and methodologies presented in the ESA reports [20,46].

2.5.3. Definition of Dry vs. Wet Propulsive Architectures

In order to differentiate the scope of the impact analysis, the study distinguishes between dry and wet propulsive architectures as described below and as summarized in Table 6:
  • The dry architecture includes only the manufacturing of the components listed in Table 4, based on mass and volume estimates.
  • The wet architecture expands this boundary to incorporate all mission-related operations: propellant loading, pressurizing gas, fueling losses, and line decontamination, as depicted in Figure 9.
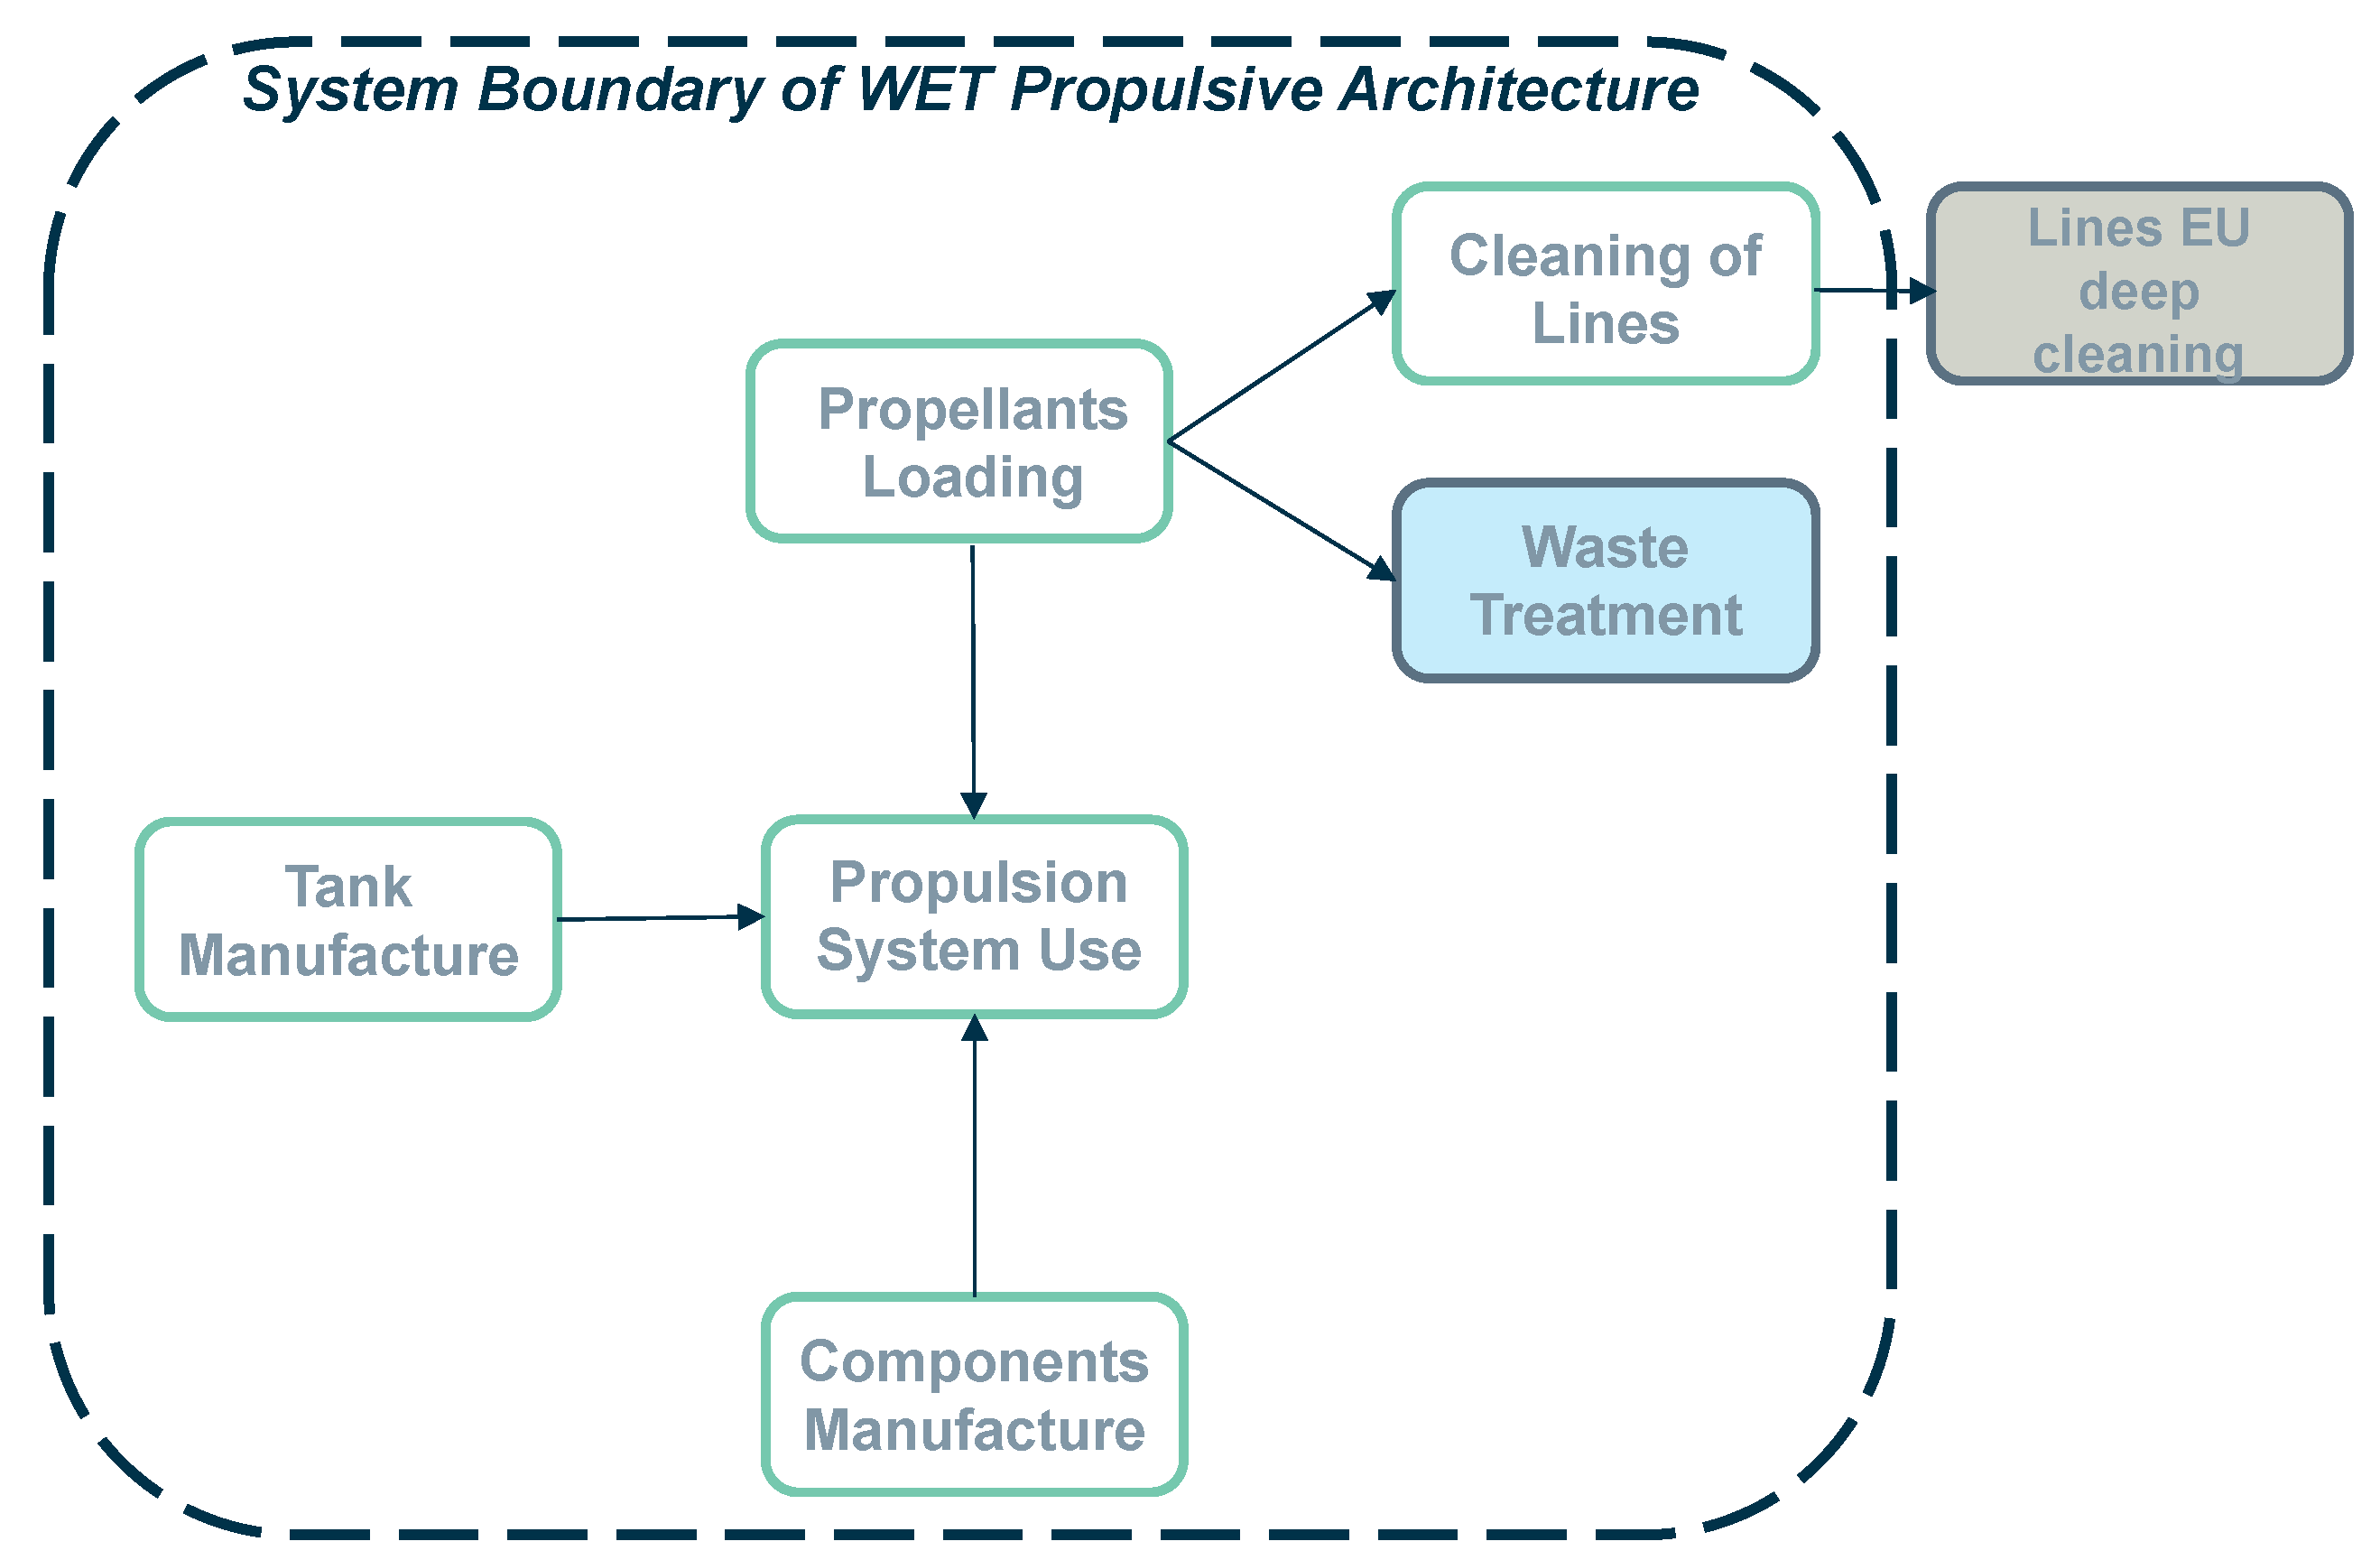
Figure 9. System boundary for the life cycle assessment of the wet propulsive architectures.
Aerospace 12 01003 g009

2.5.4. Approach to Environmental Impact Comparison

The results of the environmental impact assessment are presented in a comparative format to highlight the key differences across propellant combinations and propulsion system architectures.
First, in Section 3.1, the environmental impacts associated with the production and loading of the quantities of propellant required to fulfill the mission scenario, based on the values reported in Table 3, are presented. For each environmental indicator, the impact of each propellant combination is normalized to the highest-impact one, typically MON-3/MMH, and presented in a heatmap to highlight the relative performance of each combination.
Next, Section 3.3 presents the environmental impacts of the different propulsion system architectures, in Figure 11, including all structural components but excluding the propellants. These impacts are shown in a normalized format: for each indicator, the results are expressed relative to the architecture with the highest impact, which is set at 100%. This is meant to increase the visibility of relative differences, which tend to become subtler. Finally, Figure 12 shows the combined contributions of dry architecture manufacturing and propellant loading, expressed again as fractions of most impactful wet propulsion system.
Each of these graphs contains 16 columns: 15 correspond to the individual impact indicators considered in this study, while the leftmost (first) column represents the AHP single-score, which combines the 15 indicators into a single value for comparative purposes. The final graph, Figure 15, presents the AHP single-scores for each propulsion option, showing the ratio of the total AHP impact attributable to the dry architecture versus that associated with propellant loading.

3. Environmental Performance Results

3.1. Performance-Based Comparison of Propellant Production & Loading

Figure 10 presents a comparative overview of the environmental impacts of the production and loading of each propellant combination required to fulfill the mission scenario defined in Section 2.4. For each impact indicator, values are normalized to the most impactful propellant combination, almost always MON-3/MMH, highlighting the relative environmental performance of the alternatives.
The analysis confirms that the legacy MON-3/MMH combination dominates in all environmental impact categories. This is consistent with per-kilogram results, which already showed higher impacts for MON-3/MMH that remain even when accounting for its higher specific impulse, which reduces the total amount of propellant needed for the mission. In addition, the ideal O/F ratio which is higher than one reduces the amount of MMH needed, but this is insufficient to offset MMH’s environmental burden, particularly high due to its energy-intensive production process, especially during the distillation stage. In addition, MMH is produced through specialized, small-scale manufacturing exclusively for space applications, which amplifies its environmental footprint.
In contrast, the greener alternatives, HTP/Ethanol or HTP/RP-1 and N2O/Ethane, exhibit significantly lower total scores. However, their individual profiles vary. For instance, the N2O/Ethane system shows relatively high contributions in the Global Warming Potential (GWP), Particulate Matter Formation (PMAT), Marine Water Eutrophication (MWEUT), and Water Depletion (WDEPL) categories. This is explained by the large quantities of nitrous oxide required (due to its high O/F ratio, cf. Table 3) and the environmental cost of its production. Indeed, nitrous oxide is produced through ammonia oxidation, a process that is highly energy-intensive and dependent on fossil fuels. The upstream production of ammonia contributes substantially to CO2 emissions and releases nitrogen monoxide (NO) and nitrous oxide, contributing to atmospheric pollution and greenhouse gas effects. Additionally, the use of liquid oxygen as an oxidizing agent adds further environmental burden due to the energy-intensive nature of its production.
The loading phase, shown in the right panel of Figure 10, is more nuanced than the production data. As detailed in Figure 5, the loading phase includes all cradle-to-gate ground operations spanning storage, transport, fueling, and decontamination. While fueling activities are carried out in the same room, the procedures differ based on the toxicity and physical properties of each propellant. The legacy MON-3/MMH combination involves particularly intensive handling and decontamination due to its high toxicity. In contrast, the self-pressurizing N2O/Ethane combination benefits from simplified handling: it does not require complex waste treatment or specialized decontamination protocols, as it can be filtered directly through air purification systems. However, it still shows a notable impact in the Use of Metals and Minerals (ADEPLmu) category, mainly due to the need for large-volume storage tanks. Meanwhile, HTP-based systems, although generally cleaner during production, still require safety and waste management procedures during loading. At present, decontamination protocols for these greener options at the CSG site remain hypothetical, as these procedures are not yet established. The absence of detailed data on HTP-related waste management might contribute to an under-representation of its impacts in the graph. In practice, HTP residues require more complex treatment than the self-pressurizing systems, reinforcing the latter’s environmental and operational advantages.
Since the data represents the production and loading impacts of each propellant combination for the entire mission, the contribution is largely driven by the oxidizers, due to the high oxidizer-to-fuel ratios of the greener options. Because oxidizers are needed in greater quantities, they contribute disproportionately to the overall environmental burden, particularly in HTP/RP-1 and N2O/Ethane systems where the O/F ratios significantly exceed 1 reaching values as high as 7.

3.2. Phase Contributions in the Cradle-to-Gate LCA

As mentioned above, all bipropellant combinations studied exhibit oxidizer-to-fuel ratios greater than one, with some greener alternatives reaching values as high as 7. This indicates that the quantity of oxidizer required for the mission significantly exceeds the one of the fuel, making the oxidizer the main contributor to the environmental impacts across the cradle-to-gate life cycle of the propellant combinations.
To better understand the drivers behind the impacts of each oxidizer, this study analyzes the contributions of each life cycle phase—production, storage, transport to CSG, transport of unused propellant, and clean-room fueling operations—using the functional unit of 1 kg of propellant produced. Decontamination has been excluded from this part of the analysis, as its inclusion disproportionately overshadows all other contributions and is not representative of a functional unit of just 1 kg of propellant, given that the fueling infrastructure is decontaminated using a fixed procedure that is not proportional to the amount of propellant fueled.
  • For MON-3 and 98%-HTP, the production phase dominates, accounting for approximately 90% of the total impact (excluding decontamination).
  • In contrast, for N2O, the storage phase is the main contributor to environmental impact. This is due to nitrous oxide’s intrinsic high Global Warming Potential and the nature of its storage: although stored as a liquid under high pressure, any leakage results in the release of gaseous N2O, which is more likely to escape and directly contributes to greenhouse gas emissions. Unlike MON-3 and HTP, where potential losses are typically captured and treated through decontamination, losses of N2O during storage are released directly into the atmosphere.

3.3. Impact of Propellant-Specific Dry Architecture
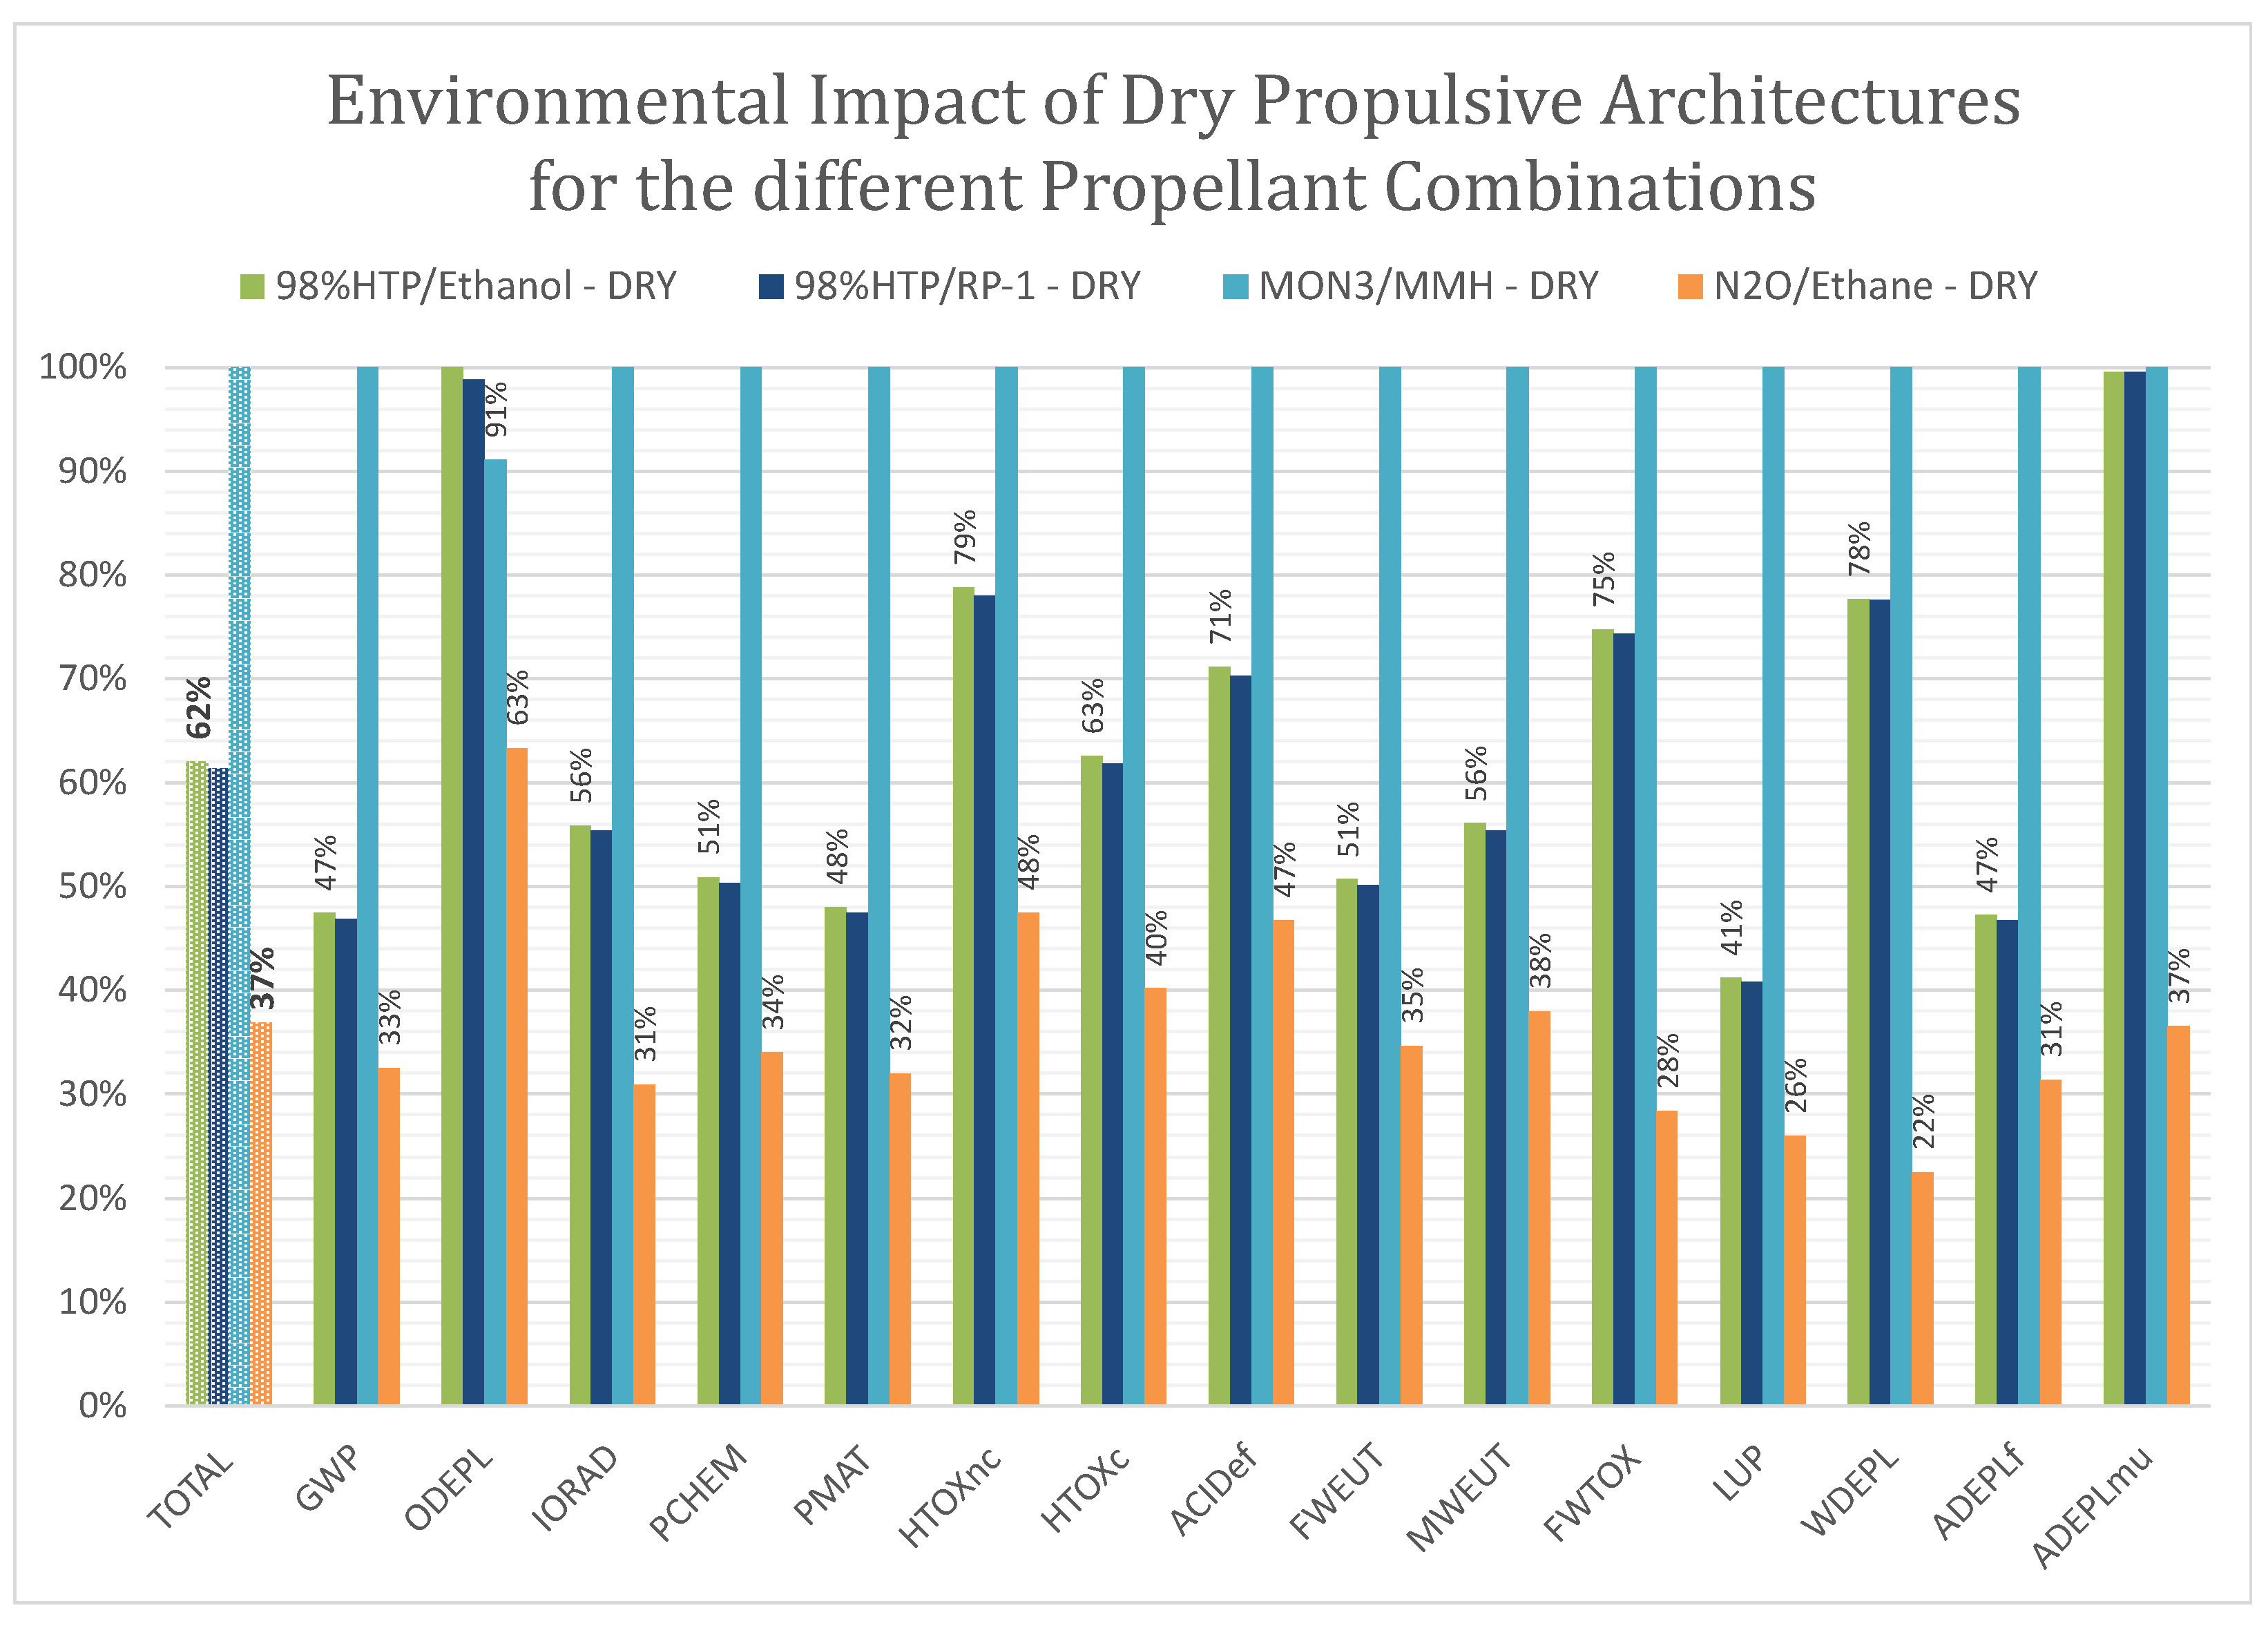
Figure 11 compares the environmental impacts associated with the production of the dry propulsion architectures tailored to each propellant combination, as detailed in Table 4. This part of the analysis focuses exclusively on the manufacturing phase of the components and excludes propellant loading, pressurization and decontamination.
Figure 11. Environmental impact of the dry propulsive architecture for all four types of propellant combinations.
Aerospace 12 01003 g011
Among the architectures assessed, the configuration using MON-3/MMH featuring titanium tanks exhibits the highest environmental impact across all categories except for ozone depletion (ODEPL). This outcome is attributed to the energy-intensive and polluting processes involved in titanium extraction and manufacturing. Notably, the titanium-based architecture shows a pronounced impact on freshwater ecotoxicity, driven by water pollution from strip mining operations and chemical-intensive refining.
On the contrary, the HTP-based architecture, which uses aluminum tanks with carbon fiber overwrap, demonstrates lower overall impact in most categories but stands out in ozone depletion and mineral resource use (ADEPLmu). The latter is mainly linked to the aluminum liner, whose production has high raw material demands and contributes significantly to both ozone layer degradation and metal depletion indicators. Although aluminum is less energy-intensive than titanium on a per-kilogram basis, the higher mass of aluminum-based tanks, along with the environmental cost of carbon fiber production, result in a significant overall footprint.

3.4. Impact of Wet Architecture Including Propellants

Figure 12 compares the environmental impacts of the complete “wet” propulsive architectures, including the manufacturing of components, the production and loading of propellants, and the pressurizing gases where necessary. This broader scope reveals more pronounced differences between the different propulsion options compared to the dry architecture analysis.
Figure 12. Environmental impact of the wet propulsive baseline architecture for all four types of propellant combinations. Impacts include components, propellants, pressurization, and decontamination processes.
Aerospace 12 01003 g012
In this analysis, the relative impact of the HTP-based architecture decreases from 62% (dry-only scenario) to 42% of the total impact of the legacy MON-3/MMH system (normalized to 100% as it is the highest impact). This reduction is due to the significantly higher environmental burden of the MON-3/MMH propellant itself with respect to the HTP combinations, which dominates the wet architecture impact. Meanwhile, the self-pressurizing N2O/Ethane system retains a consistent impact ratio of 37% relative to the legacy architecture.
The figure also illustrates category-specific differences. The MON-3/MMH system shows the highest overall environmental impact, dominating most impact categories except Ozone Depletion Potential (ODEPL) and Water Depletion (WDEPL). HTP-based architectures show lower total impact but still rank high in toxicity categories, reaching 71% and 56% of MON-3/MMH in non-carcinogenic and carcinogenic toxicity respectively.
Meanwhile, the N2O/Ethane system, despite exhibiting 69% of the Global Warming Potential (GWP) of MON-3/MMH, achieves the lowest environmental impact across most categories, including the lowest overall single-score, this is despite the relatively high weight assigned to GWP in the AHP analysis. However, it also highlights a critical limitation: the risk of oversimplifying environmental performance by focusing solely on carbon neutrality or on a single indicator like GWP. In fact, despite the high weighting of GWP, approximately 80% of the total single-score impact arises from the other environmental indicators. If GWP had been used as the sole evaluation metric, the conclusion would have been entirely different, likely excluding N2O/Ethane as a viable option. This contrast highlights the importance of a global, multi-criteria approach in accurately assessing the sustainability of propellant alternatives.

3.5. Relative Contributions: Dry Architecture vs. Propellant Loading

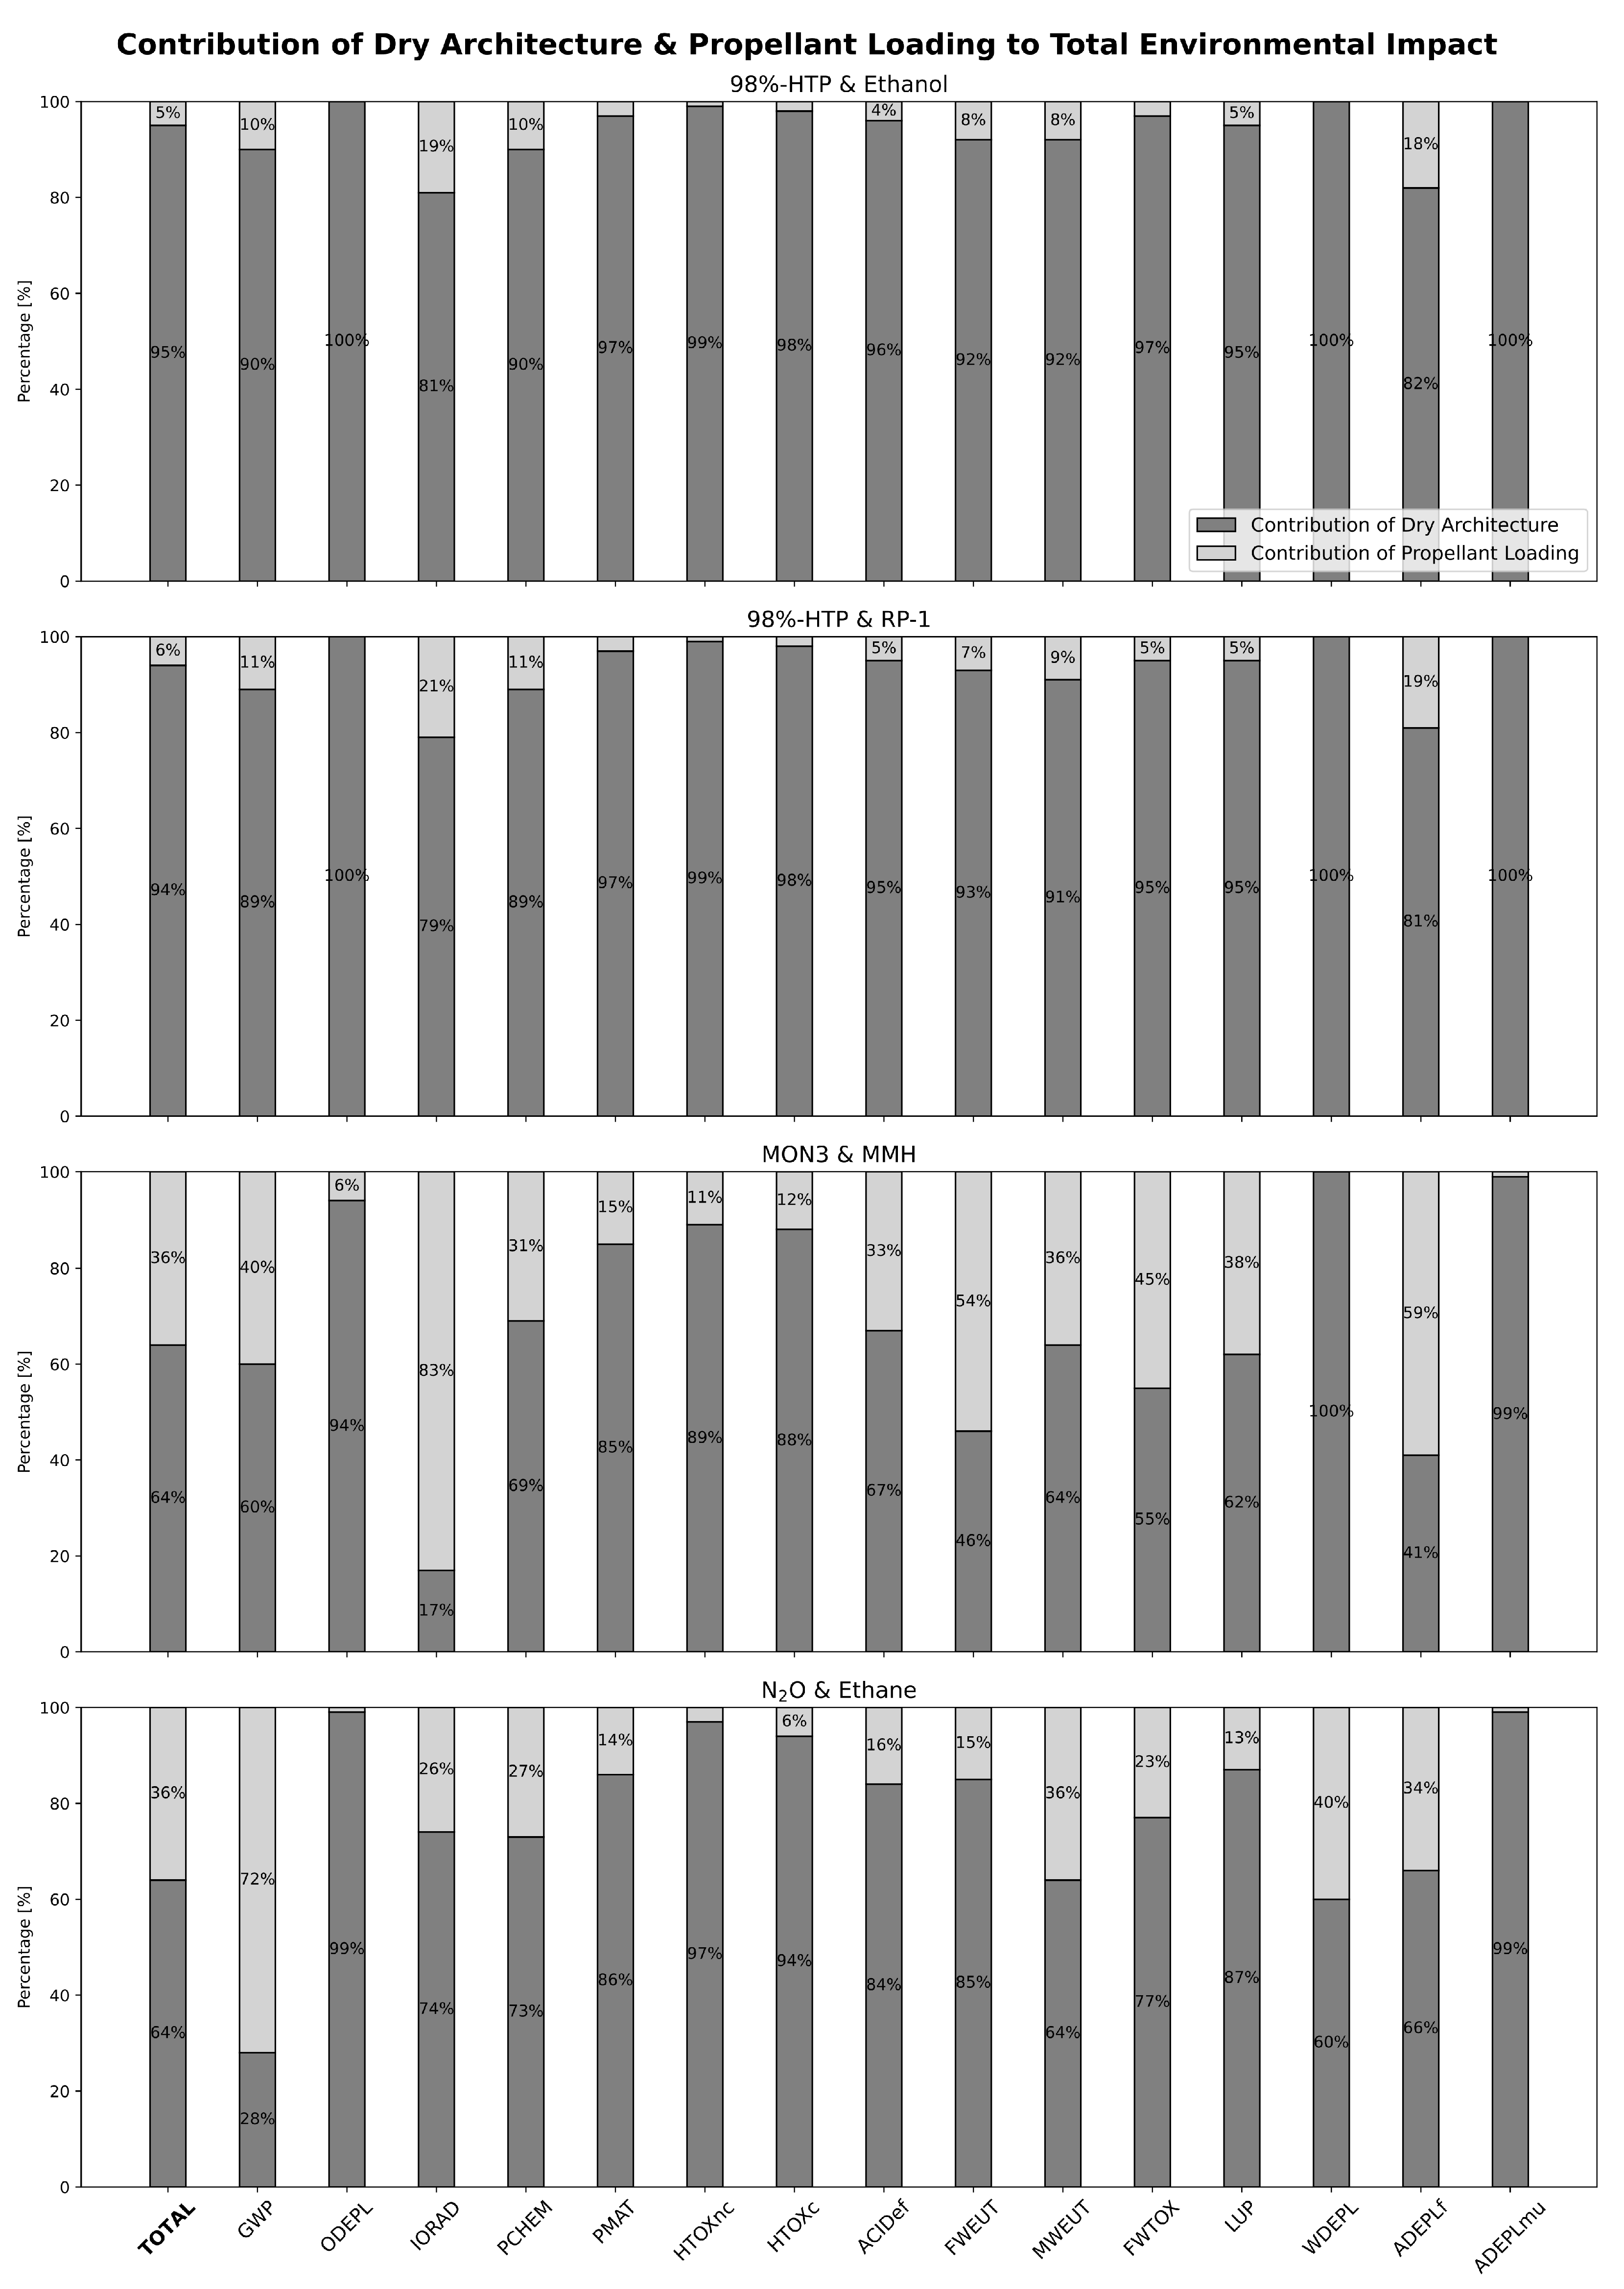
Figure 13 compares the environmental impact contributions of the dry propulsion architecture versus the one of the propellant loading, which together form the total wet architecture for each propellant combination. Impacts are shown by environmental indicator, with the far-left bar in each group representing the overall AHP-single-score impact.
Across the different systems, the relative contributions of the dry architecture and propellant loading vary significantly. For HTP-based systems, the dry architecture accounts for the majority of the environmental burden, reaching over 90% of the total impact. This is due to the low overall impact of HTP propellants themselves, which results in a greater share being attributed to component manufacturing. However, it is important to note that this analysis does not currently account for the passivation process required for HTP system components prior to fueling. The absence of this procedure may lead to an underestimation of the true environmental impact of propellant handling for HTP.
In contrast, both the MON-3/MMH and N2O/Ethane systems show a more balanced distribution, with the dry architecture contributing 64% of the total impact in each case. However, while the proportional split is identical, the absolute environmental impact is not. As seen in Figure 12, the total impact of the N2O/Ethane system is only 37% that of the legacy MON-3/MMH architecture. Therefore, although the dry share is equivalent in percentage terms, the environmental burden it represents is significantly lower in the N2O/Ethane case.
A closer look at indicator-specific contributions reveals important differences among the systems:
  • For MON-3/MMH, propellant loading is the dominant contributor in several impact categories, notably Ionizing Radiation (IORAD, 83%), Fossil Resource Depletion (ADEPLF, 59%), and Freshwater Eutrophication (FWEUT, 54%).
  • For HTP-based systems, propellant-related contributions remain below 21% across all categories, with the most affected being IORAD and ADEPLF.
  • In the case of N2O/Ethane, Global Warming Potential (GWP) is the most impacted category, with 72% of the total attributed to propellant-loading emissions. Significant contributions are also seen in Water Depletion (WDEPL, 40%) and Marine Water Eutrophication (MWEUT, 36%).

3.6. Environmental Classification of In-Space Propulsive Options

To support the transition away from legacy propellants, namely MON-3/MMH bipropellant systems and Hydrazine for monopropellant systems, this study evaluates a range of alternative chemical compounds and complete propulsion system architectures through a cradle-to-gate life cycle perspective. The assessment covers both the environmental impacts of individual propellants (per kilogram) and the system-level performance within a representative GEO mission scenario intended for an orbital transfer vehicle, where the quantity of each propellant combination required to fulfill the mission is accounted for.

3.6.1. Classification of Propellant Loading

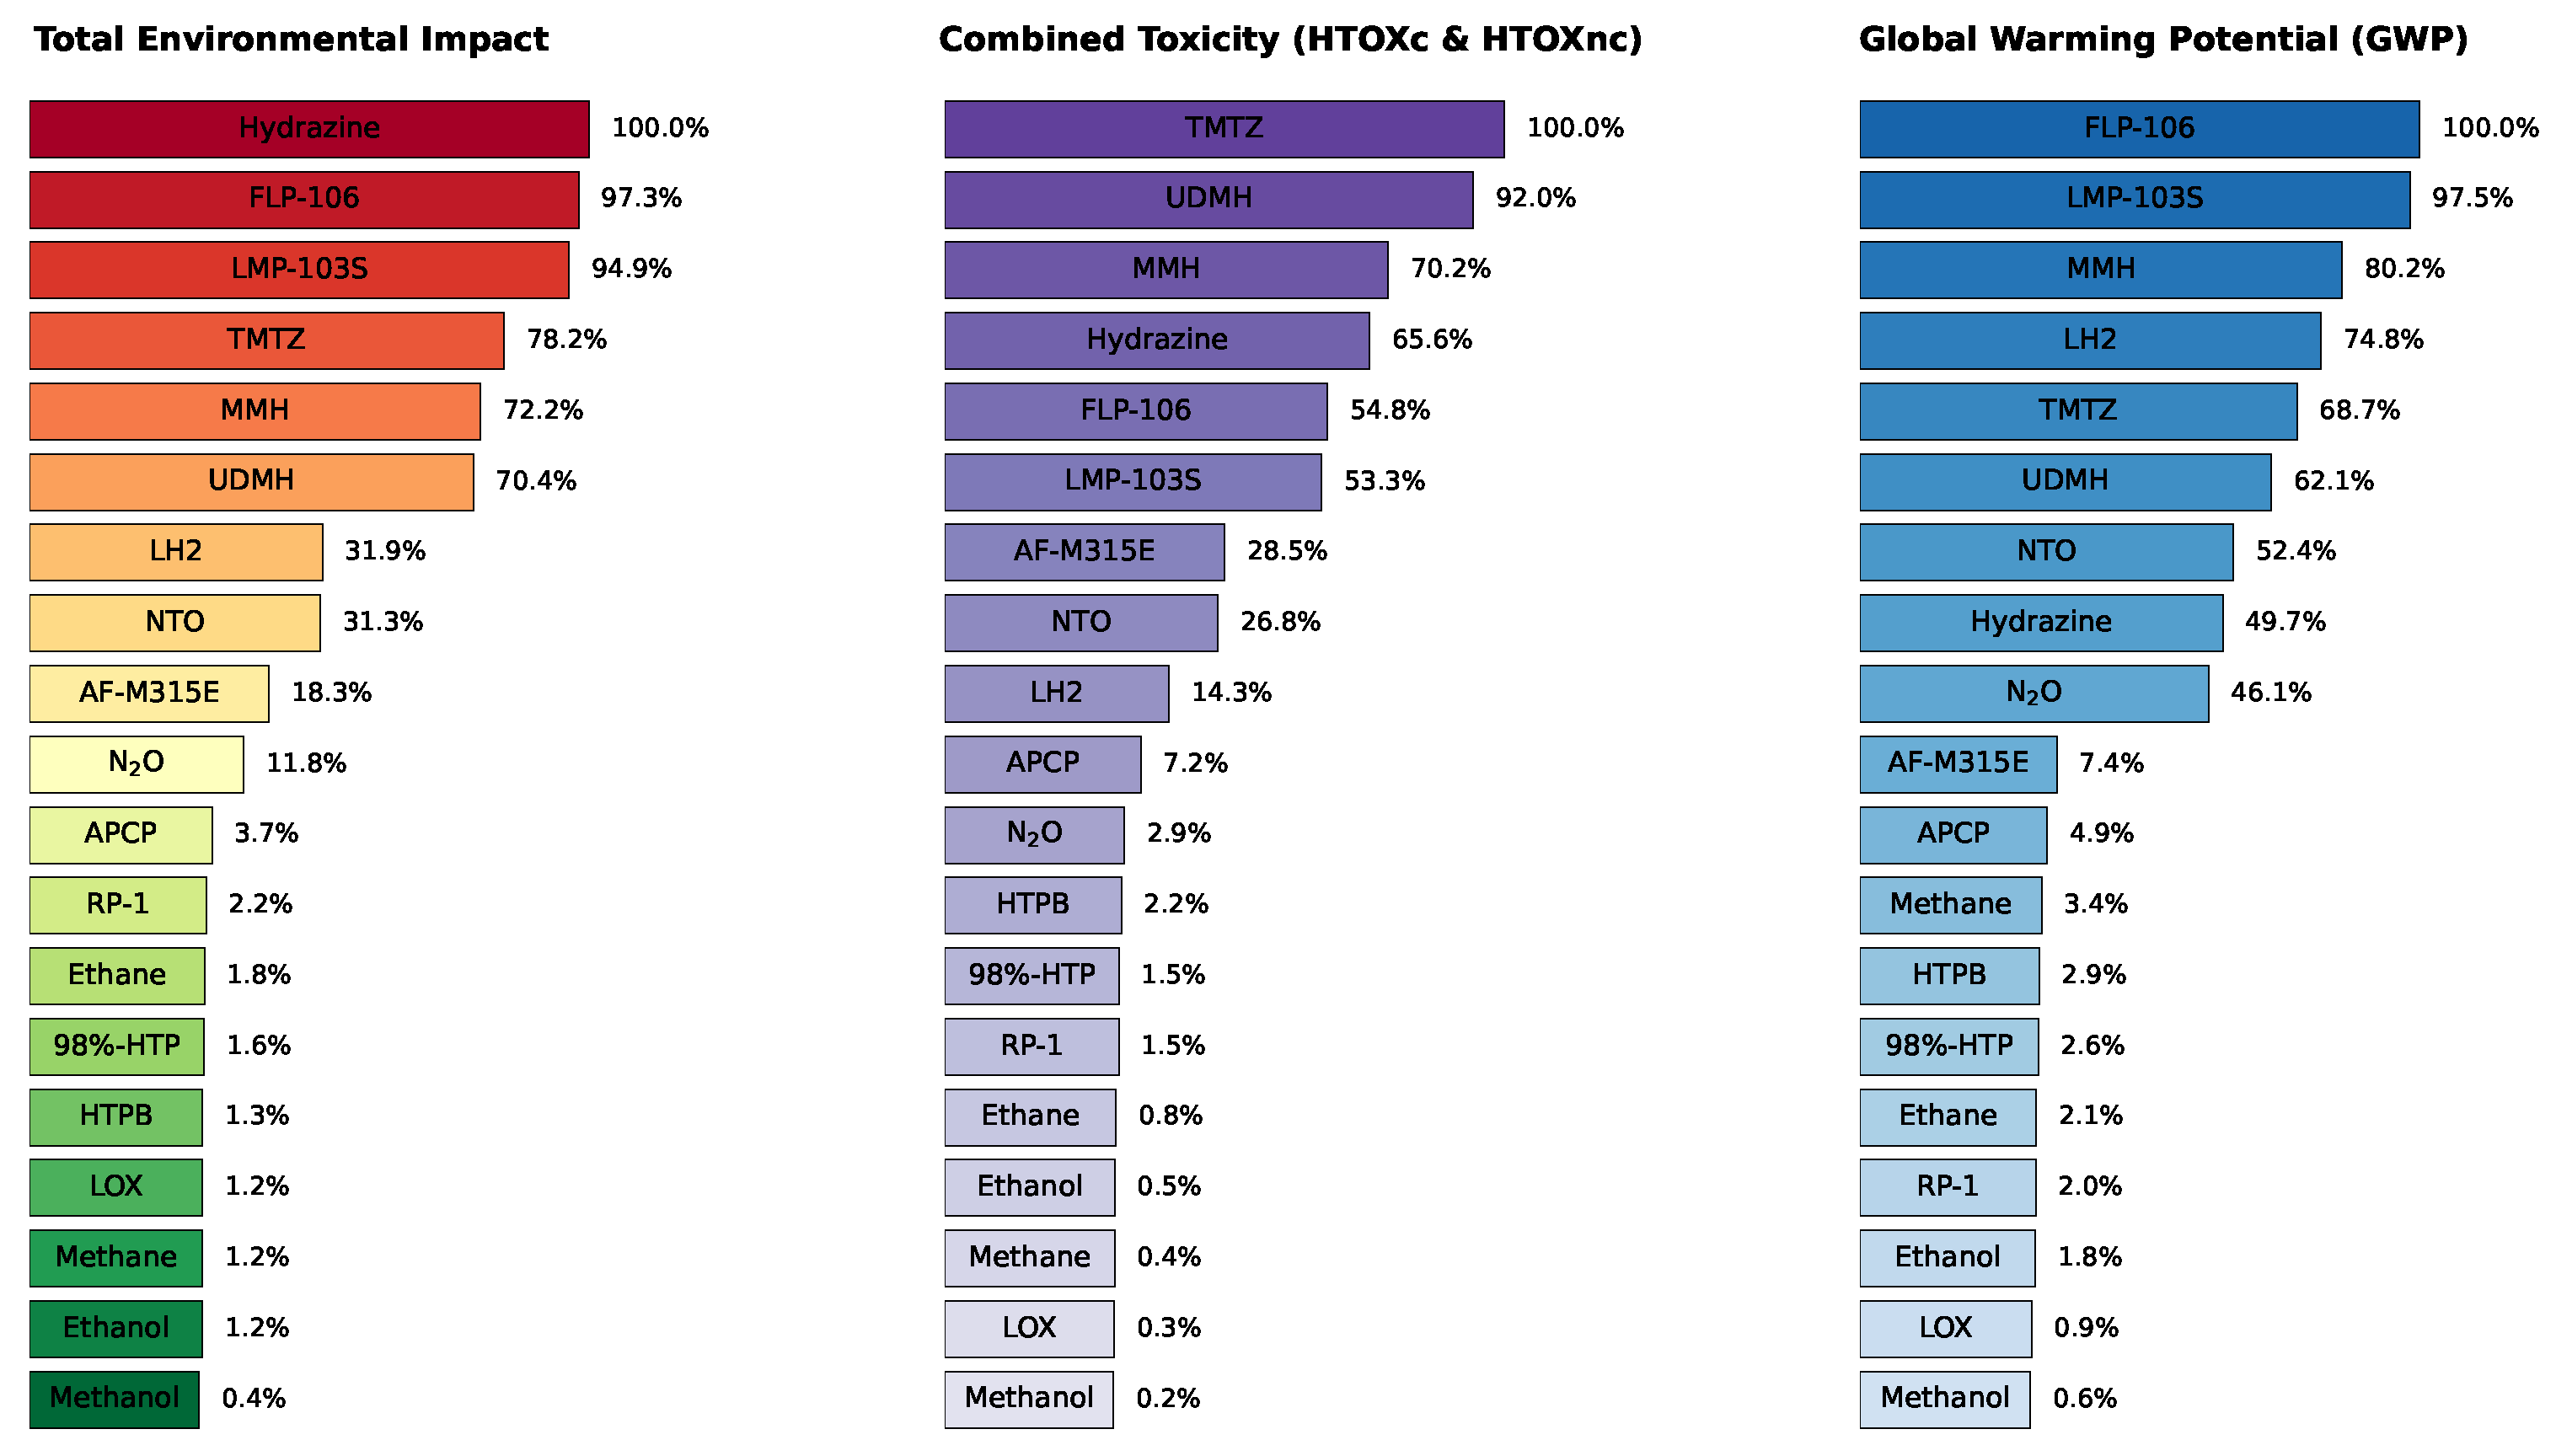
Figure 14 presents a per-kilogram environmental impact comparison of different chemical compounds commonly used in liquid, cryogenic, or hybrid space propulsion, without distinguishing between their roles as monopropellants, oxidizers, or fuels. The aim is to compare the environmental impact associated with loading 1 kg of each compound into the space system.
The figure reports results for three impact metrics: the total AHP single-score (left), combined human-toxicity (center), and Global Warming Potential (right). Each metric has been normalized to the compound with the highest impact in its respective category, set to 100%, with all other results expressed as a percentage of that value. Combined human-toxicity was calculated by integrating both carcinogenic and non-carcinogenic toxicity indicators, using the relative AHP-weights. This category was included, as toxicity represents the most frequently cited and significant environmental burden for which hydrazine is commonly criticized. GWP, on the other hand, was included because AHP survey participants ranked it as the most concerning environmental indicator.
Interestingly, although Hydrazine shows the highest total AHP single-score, it does not rank highest in combined human-toxicity. Its derivatives, UDMH and MMH, exhibit greater toxic impacts. Additionally, Hydrazine’s GWP is relatively low (below 50% of the normalized maximum), with compounds such as FLP-106 and LMP-103S emerging as more impactful in that category. Among the evaluated substances, methanol stands out as the most environmentally benign across all categories. Ethanol also performs well and is identified as the most environmentally-friendly hydrocarbon fuel among current candidates for liquid propulsion.
It is important to note that these results are based on currently available life cycle assessment data and may evolve with future updates. As of now, these results provides the basis for the definition of greener propellants proposed in the conclusion section.

3.6.2. Classification of Propulsion Systems
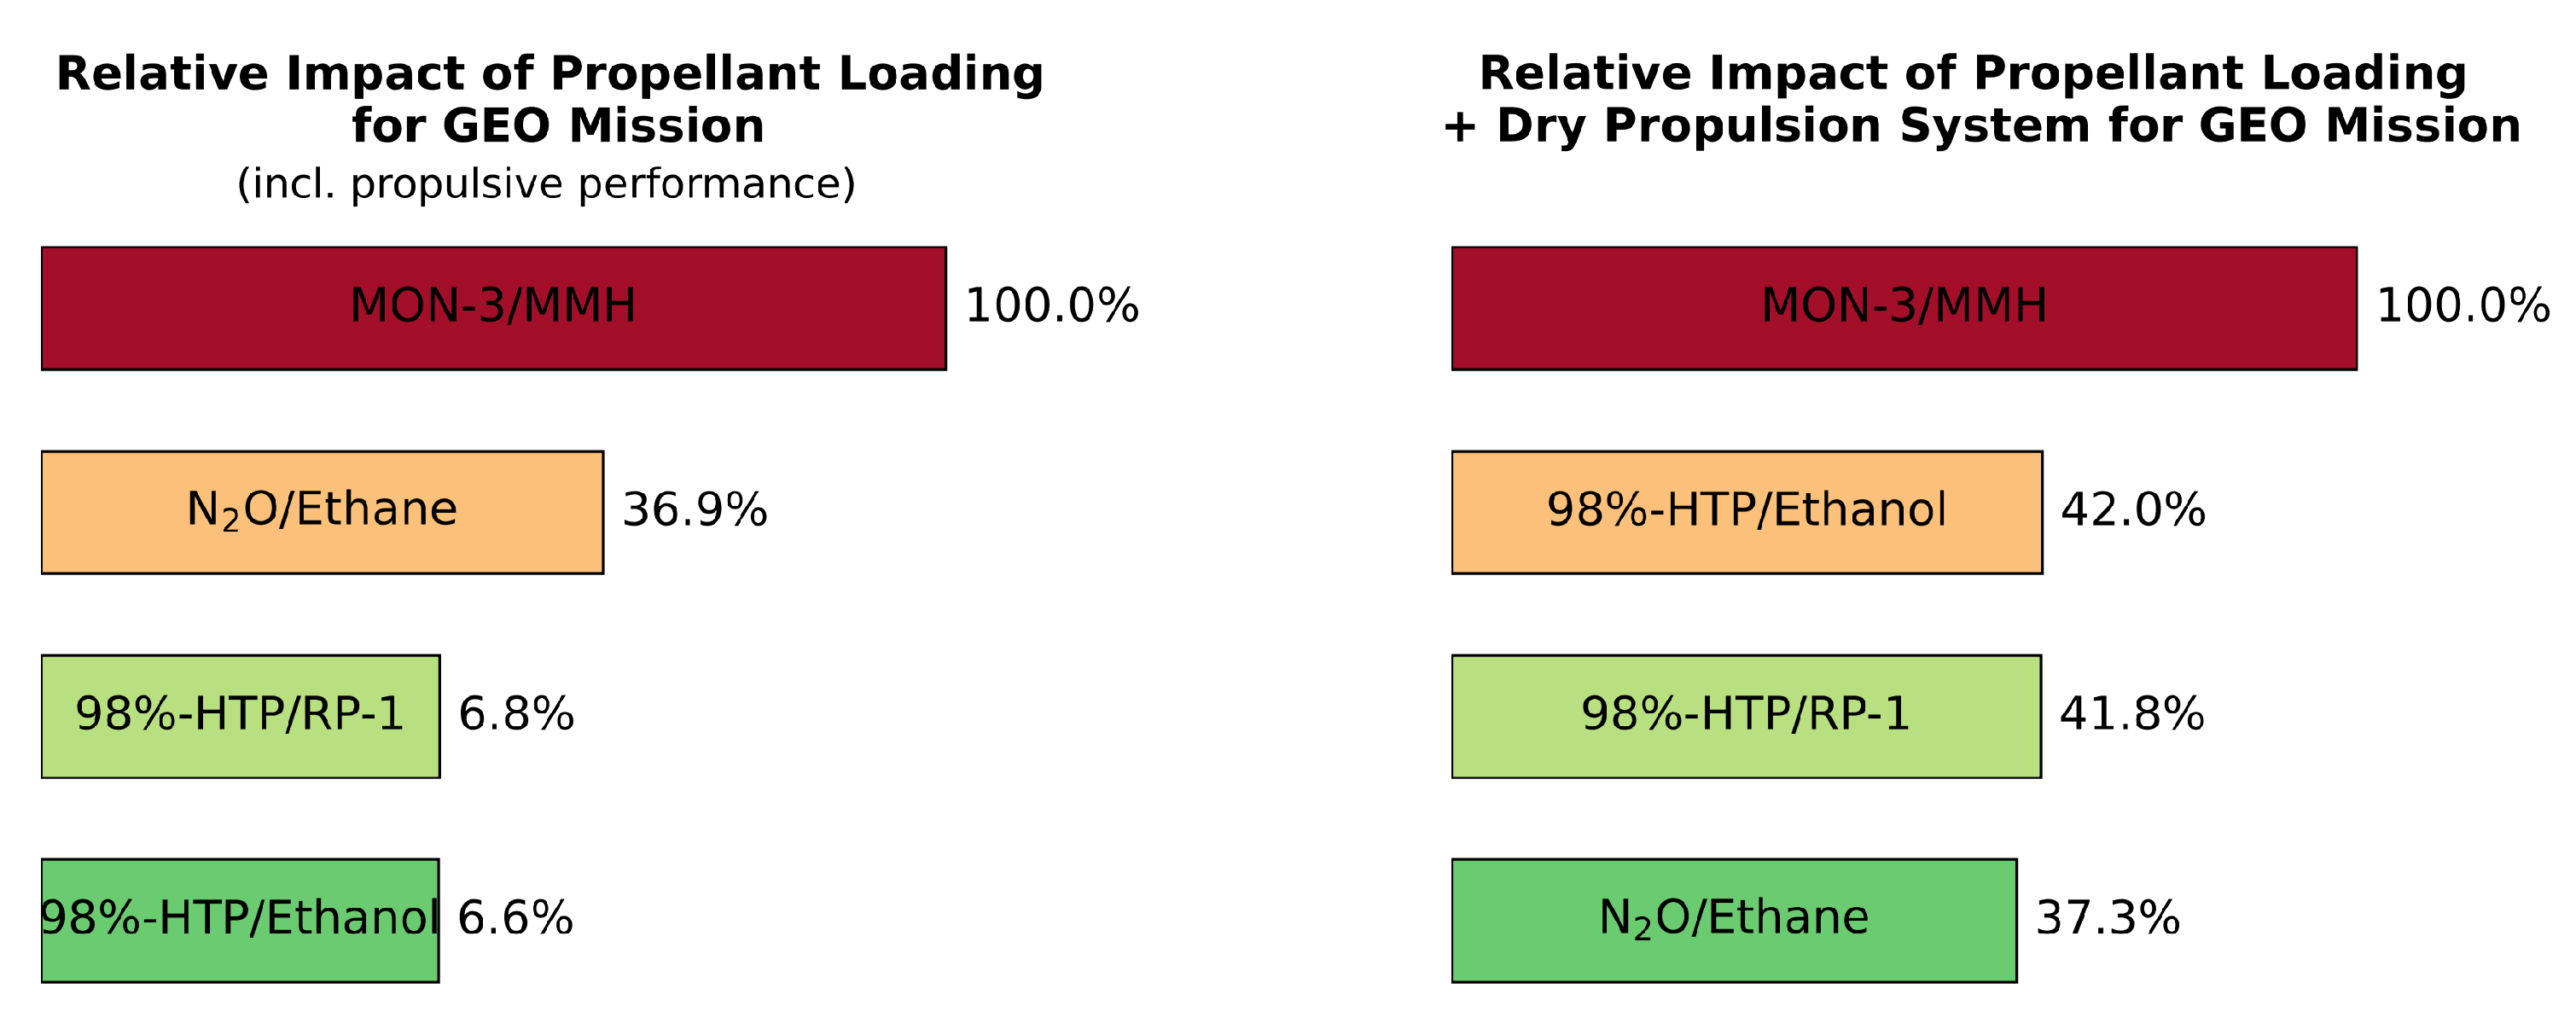
Extending the analysis to the full propulsion system level, Figure 15 compares the total combined environmental impact of three alternative bipropellant systems against the legacy MON-3/MMH, within the reference mission scenario defined in this study as the “GEO mission” (see Section 2.4). Together, these four systems have been the focus of this study and represent the main current options of the liquid bipropellant in-space propulsion landscape.
Figure 15. Total combined environmental impact for the mission scenario: propellant-only contribution (left) and full propulsion system (right).
Aerospace 12 01003 g015
Figure 15 shows that when considering the propellants alone, the HTP/Ethanol combination achieves the lowest environmental impact. However, once the dry propulsion architecture is included, the N2O/Ethane configuration emerges as the greenest option. This comparison highlights an important point: too much emphasis has often been placed on the propellants alone, while the broader system-wide view should be prioritized, as the majority of the environmental impact comes from the propulsive dry architecture rather than from the propellant itself as shown in Figure 13.
With respect to toxicity and Global Warming Potential, both greener alternatives demonstrate lower impacts than the legacy MON-3/MMH system. However, the N2O/Ethane combination exhibits a high GWP due to storage losses of nitrous oxide, a potent greenhouse gas. The HTP-based systems, on the other hand, show elevated ozone depletion scores compared to the legacy option, which raises concern given its close link to climate-change effects. In terms of combined human-toxicity, while HTP combinations are more toxic than the self-pressurized N2O/Ethane system, they remain significantly less toxic, approximately half, compared to the legacy system.
Given the close environmental performance scores of the three greener systems, other mission requirements will ultimately determine whether HTP/RP-1, HTP/Ethanol, or N2O/Ethane should be selected.

4. Conclusions & Ways Forward

4.1. Conclusions

This study aimed to assess and compare the environmental performance of current in-space liquid propulsion options, with the goal of moving away from the legacy hydrazine-based system MON-3/MMH, whose toxicity makes ground operations too stringent, costly and dangerous. Removing this barrier not only improves safety but also opens the door for new actors to develop their own propulsion systems and test facilities without the operational risks and costs linked to legacy propellants. This is becoming increasingly attractive in today’s evolving space landscape.
However, too often, alternative systems are labeled as “green” simply because they are less toxic than hydrazine, or worse, just because they are not hydrazine. That shortcut is misleading and insufficient. To provide a more rigorous and evidence-based answer, this study, carried out during an ASCenSIon-project PhD-secondment from the University of Pisa to ESA’s CleanSpace Office, uses a life cycle assessment approach to evaluate the environmental performance of the most relevant liquid bipropellant options currently available for in-space propulsion.
The analysis covers a full cradle-to-gate scope, from propellant production to loading into the spacecraft. To ensure realistic and system-level relevance, propulsion systems were all sized for a representative multi-orbit GEO delivery mission scenario of an orbital transfer vehicle. The environmental performance was assessed across 15 midpoint impact indicators and complemented by an overall single-score computed through the Analytic Hierarchy Process with input from the space and LCA communities collected through dedicated surveys. Global Warming Potential was identified as the most pressing impact category to address and therefore has the highest representation in the AHP weights. The resulting single-score was used to compare propulsion options with respect to mission-driven priorities.
The study presents the environmental impacts of: (i) loading each propellant combination into the space system, (ii) manufacturing the dry propulsion architecture fine-tuned to the specific propellants and (iii) the total impact of the complete propulsion system (wet architecture), including all structural components, propellants and pressurizing gases. In terms of propellant loading alone, HTP-based combinations showed the lowest single-score impact. However, when considering the dry propulsion system, the self-pressurizing N2O/Ethane system came out with the lowest impact. When both are combined, the N2O/Ethane configuration emerges as the greenest overall option.
A key insight comes from analyzing the contribution breakdown between dry architecture manufacturing and propellant loading: for all systems, the majority of the environmental burden comes from the dry propulsion system, not from the propellants. Specifically, this contribution reaches 64% for MON-3/MMH and N2O/Ethane, and up to 95% for HTP-based systems. This strongly supports the idea that “green” status must be assigned at system level, not just to the propellant itself.
Interestingly, N2O/Ethane is very impactful in terms of GWP due to storage losses, yet it still ranks as the greenest overall option. This drawback could be mitigated through improved system design, including leak-proof composite tanks, high-integrity valve technologies and closed-loop recovery measures during ground operations and storage, which can significantly reduce nitrous oxide release and therefore lower its effective GWP [47]. Because nitrous oxide readily vaporizes upon leakage due to its high vapor pressure, such containment measures are particularly important.
However, the current ranking of N2O/Ethane in GWP vs in AHP clearly illustrates the risk of reducing environmental evaluation to a single indicator, such as carbon emissions or GWP alone, as this would have led to the wrong conclusion and the exclusion of N2O/Ethane. Indeed, environmental performance is more complex and requires a holistic, multi-criteria approach. Building on these results, the next section proposes a recommended metric for evaluating propellant replacements, along with a definition of what should qualify as “greener” in the context of in-space propulsion.

4.2. Next Steps

As life cycle assessment continues to gain momentum in the space sector, its use and systematic implementation still face several challenges. Long development cycles often delay data availability and many space-specific processes are complex and difficult to model. Progress is further slowed by limited transparency in manufacturing data, as many processes are proprietary and not fully disclosed. This lack of accessible data remains a barrier to developing a complete and increasingly reliable space LCA database. As a result, not all specific data were fully available for this study. To address this, the study implemented the simplifications and adaptations described earlier in Section 2.3. While these have introduced some uncertainty in absolute environmental impact results, it was offset by the comparative nature of the study, which focuses on evaluating different in-space propulsion solutions relative to one another. Most components in the propulsion architectures were modeled in SimaPro using generic 1 kg unit datasets. The total mass of these components was estimated through market research on off-the-shelf parts (valves, sensors) selected to match the requirements of each system. These mass estimates were then entered in the SimaPro software to create system-level datasets tailored to each propellant-specific configuration.
Although the propellant life cycles were modeled from cradle-to-gate, dry architecture component data currently reflect only the manufacturing phase. While this stage often dominates the environmental impact, future work should aim to extend this scope to include downstream phases as more data become available. The supply chain of each propellant should be updated over time based on newly available data and evolving geopolitical landscape or supply chain conditions, which can significantly affect the results. In parallel, the LCA database should be regularly updated to incorporate new materials and manufacturing techniques, as these can significantly impact the manufacturing footprint of the dry architecture, particularly for the propellant tanks, which are the main contributors. Indeed, one of the key outcomes of this study is to encourage the adoption of greener MAIT techniques rather than focusing only on greener propellants.
Looking ahead, this framework should be expanded to assess the environmental impact of the entire life cycle, not limited to the ground phase, particularly by incorporating the launch phase and end-of-life strategies. Including these stages will provide a more complete assessment and help avoid possible shifts of the environmental burden to other phases. Ideally, this study should be integrated into a broader, holistic framework that also accounts for secondary effects on mass and power budgets. These factors influence not only the environmental performance but also critical mission parameters such as payload capacity and overall cost. For example, the share of launch-phase impact (in [%]) should be reflected as it varies according to the mass and volume the spacecraft occupies relative to the launcher’s capacity. In the present study, however, the total mass of the orbital transfer vehicle remains constant to ensure a meaningful comparison, only the mass distribution between the propulsion system and payload capacity changes.
All these aspects should be integrated as early as possible into the design process through eco-design (aimed at delivering equivalent system performance while reducing overall mission environmental impact) and design-for-demise, which ensures that the system complies with measures preventing in-space pollution, such as passivation, controlled de-orbiting, or disposal in graveyard orbits. However, a lot of research is currently ongoing to quantify the atmospheric impacts of space activities, particularly those associated with re-entry, which are not yet understood. Consequently, this field is expected to evolve considerably in the coming years.
Similar whole-life approaches are already used beyond the space sector (for example in defense lifecycle programs and civil-aerospace initiatives such as NASA’s Environmentally Responsible Aviation and GPIM), reinforcing the recommendation to extend this study toward a Whole-Life Assessment that covers production, launch, use and EoL stages.

4.3. Proposed Criteria for Greener Propulsion

Based on the analysis presented, the label green should not be applied blindly to any non-hydrazine compound. Instead, it should result from a dedicated environmental qualification and comparison that identifies a compound as “greener”, rather than “green” in absolute terms, according to a recognized methodology such as life cycle assessment. Most importantly, this qualification should consider the entire propulsion system, including both the propellants and the dry propulsive architecture, from cradle to gate.
Aerospace 12 01003 i001
These requirements are chosen to ensure that the green label is both standardized and application-relevant. The 50% reduction target applies to both combined human toxicity and total combined environmental impact. In the first case, since human toxicity is one of the main drawbacks of legacy propellants, a greener propellant should demonstrate a significant improvement in this area. In the second case, setting a 50% reduction threshold in the single-score, representing the total combined environmental impact, ensures that the main environmental hotspots are addressed. This means that either one major environmental indicator is significantly reduced, or that several indicators show meaningful improvements without causing substantial burden shifting. Based on the results of this study, the proposed criteria represent a suitable and realistic target for qualifying in-space propulsion systems as environmentally responsible. By formalizing a set of quantitative thresholds, these criteria are intended to establish common standards and guidelines that can serve as a basis for future policy development on sustainable propulsion and on what can reasonably be defined as a “greener” or “environmentally responsible” in-space propulsion system.
To this date, no international LCA standard prescribes a universal numeric cutoff for “green” status. However, the EU Product Environmental Footprint (PEF) framework emphasizes lifecycle, multi-criteria assessment and transparent substantiation of claims. The 50% figure is adopted here to provide a clear bar that avoids trivial “green” claims. It is supported by two main considerations:
  • Alignment: it represents a substantial, easily interpretable improvement aligned with current climate policy ambitions. For example, the EU’s “Fit for 55” aims to reduce net greenhouse gas emissions by 55% by 2030 [48] while the United States’ has pledged to cut net greenhouse gas emissions by 61-66% below 2005 levels by 2035 [49].
  • Feasibility: it is already achieved by several candidate in-space propulsion systems evaluated in this study.
This criterion is therefore proposed not as a definitive regulatory cutoff but as a starting point for discussion, standardization, and eventual policy development within the space community.

4.4. Recommended Metrics for Propellant Replacement

However, replacing legacy propellants such as hydrazine or MON-3/MMH requires more than a focus on environmental impact, it calls for a complete and global reassessment of what constitutes a viable and forward-looking alternative. This challenge is at the heart of every trade-off faced by the space industry, whether when developing a new propulsion system or selecting one for a given mission. In each case, the objective is to identify the best compromise that aligns with specific requirements while addressing broader sustainability concerns.
To support this transition, a robust, multi-criteria evaluation framework is essential, one that accounts for the evolving environmental expectations of today’s missions while preserving the operational reliability of legacy systems, which have been optimized over decades of flight heritage. This balance is particularly difficult to achieve for emerging alternatives, which must meet increasingly complex demands under new performance, safety and regulatory constraints.
In response to this need, this study concludes by proposing a set of recommended figures of merit for evaluating propellant replacements. These metrics build on the ones introduced in NASA’s 2014 report on Recommended Figures of Merit for Green Monopropellants [9] and are summarized in Table 7.

Author Contributions

Conceptualization, L.B.-C.; methodology, L.B.-C.; software, L.B.-C. and ESA; validation, L.A. and S.M.S.; formal analysis, L.B.-C.; investigation, L.B.-C.; resources, ESA; data curation, L.B.-C.; writing—original draft preparation, L.B.-C.; writing—review and editing, L.A., S.M.S. and A.P.; visualization, L.B.-C.; supervision, L.A. and A.P.; project administration, A.P.; funding acquisition, A.P. All authors have read and agreed to the published version of the manuscript.

Funding

The project leading to this application has received funding from the European Union’s Horizon 2020 research and innovation programme under the Marie Sklodowska-Curie grant agreement No 860956. It is part of the ASCenSIon project, an Innovative Training Network (ITN) to advance space access capabilities (ASCenSIon Project Website, https://ascension-itn.eu/). This funding includes the APC.

Data Availability Statement

The data used in this study are available on request from the European Space Agency, as implemented in the ESA Life Cycle Assessment Database.

Acknowledgments

A wholehearted thank you goes to the TEC-SYE and CleanSpace teams for warmly welcoming me into their department, actively involving me in their activities, and providing the tools, guidance and support needed to successfully carry out this study. I am especially grateful to the entire EcoDesign Team for their continuous support and guidance throughout the project and to Ferran Valencia Bel for his expert input on propulsion systems and operations, which helped shape the study into a more representative and meaningful one. I would also like to extend my thanks to Johan Berg Pettersen for his dedicated support and expertise on life cycle assessment methodology.

Conflicts of Interest

The authors declare no conflicts of interest.

Abbreviations

The following abbreviations are used in this manuscript:
AbbreviationDefinition
ADRActive Debris Removal
AHPAnalytical Hierarchy Process
CFRPCarbon Fibre Reinforced Polymer
ECSSEuropean Cooperation for Space Standardization
ESAEuropean Space Agency
FUFunctional Unit
GEOGeostationary Orbit
GHSGlobal Harmonized System
GNCGuidance, Navigation & Control
GWPGlobal Warming Potential
HTOXCHuman Toxicity—Carcinogenic
HTOXNCHuman Toxicity—Non-Carcinogenic
HTPHigh-Test Peroxide
IspSpecific Impulse
LCALife Cycle Assessment
LCILife Cycle Inventory
LEOLow Earth Orbit
LRELiquid Rocket Engine
MAITManufacturing, Assembly, and Integration Technology
MEOPMaximum Expected Operating Pressure
MMHMonomethylhydrazine
MON-3Mixed Oxides of Nitrogen
NTONitrogen Tetroxide (N2O4)
N2H4Hydrazine
N2ONitrous Oxide
ODEPLOzone Depletion
OFOxidizer-to-Fuel Ratio
OTVOrbital Transfer Vehicle
REACHRegistration, Evaluation, Authorization, and Restriction of Chemicals
RP-1Rocket Propellant-1
SCAPESelf-Contained Atmospheric Protective Ensemble
SVHCSubstance of Very High Concern
TRLTechnology Readiness Level
UDMHUnsymmetrical Dimethylhydrazine

References

  1. Dallas, J.A.; Raval, S.; Alvarez Gaitan, J.P.; Saydam, S.; Dempster, A.G. The Environmental Impact of Emissions from Space Launches: A Comprehensive Review. J. Clean. Prod. 2020, 255, 120209. [Google Scholar] [CrossRef]
  2. Gulczyński, M.; Vennitti, A.; Scarlatella, G.; Dominguez Calabuig, G.J.; Blondel-Canepari, L.; Weber, F.; Sarritzu, A.; Bach, C.; Deeken, J.; Schmiel, T.; et al. RLV Applications: Challenges and Benefits of Novel Technologies for Sustainable Main Stages. In Proceedings of the 72nd International Astronautical Congress, Dubai, United Arab Emirates, 25–29 October 2021. [Google Scholar]
  3. ISO 14040; Environmental Management—Life Cycle Assessment—Principles and Framework. International Organization for Standardization: Geneva, Switzerland, 2006.
  4. ISO 14044; Environmental Management—Life Cycle Assessment—Requirements and Guidelines. International Organization for Standardization: Geneva, Switzerland, 2006.
  5. United States Space Command. Space-Track; United States Space Command: Colorado Springs, CO, USA, 2024. [Google Scholar]
  6. Blondel-Canepari, L.; Ordonez-Valles, L.; Tajmar, M.; Jasjukevics, A.; Wolf, M.; Dussy, S.; Apel, U.; Pasini, A. Roadmap Towards a Greener Kick-Stage Propulsion System. In Proceedings of the 73rd International Astronautical Congress (IAC), Paris, France, 18–22 September 2022. [Google Scholar]
  7. Sarritzu, A.; Blondel-Canepari, L.; Gelain, R.; Hendrick, P.; Pasini, A. Analytical Hierarchy Process-Based Trade-Off Analysis of Green and Hybrid Propulsion Technologies for Upper Stage Applications. Int. J. Energetic Mater. Chem. Propuls. 2023, 22, 1–25. [Google Scholar] [CrossRef]
  8. Sarritzu, A.; Pasini, A. Performance comparison of green propulsion systems for future Orbital Transfer Vehicles. Acta Astronaut. 2024, 217, 100–115. [Google Scholar] [CrossRef]
  9. Marshall, W.M.; Deans, M.C.; National Aeronautics and Space Administration Glenn Research Center. Recommended Figures of Merit for Green Monopropellants; American Institute of Aeronautics and Astronautics: Reston, VA, USA, 2014. [Google Scholar]
  10. Schmidt, E.W.; Wucherer, E.J. Hydrazine(s) vs. Nontoxic Propellants-Where Do We Stand Now? In Proceedings of the 2nd International Conference on Green Propellants for Space Propulsion (ESA SP-557), Sardinia, Italy, 7–8 June 2004. [Google Scholar]
  11. United Nations. Committee of Experts on the Transport of Dangerous Goods and on the Globally Harmonized System of Classification and Labelling of Chemicals—Report of the Sub-Committee of Experts on the Transport of Dangerous Goods on Its Sixty-Third Session; United Nations: New York, NY, USA, 2023. [Google Scholar]
  12. Becker, T.; Reiff-Musgrove, O.; Space Energetic Materials Working Group (EMWG). REACH + Regulatory and Activities Update. 2024. [Google Scholar]
  13. Commission to the European Parliament; European Council; European Economic and Social Committee; Committee of the Regions. The European Green Deal; European Commission: Brussels, Belgium, 2019. [Google Scholar]
  14. Eurocontrol. European Aviation Overview; Eurocontrol: Brussels, Belgium, 2024. [Google Scholar]
  15. European Commission. European Commission-Press Release Screening of Websites for “Greenwashing”: Half of Green Claims Lack Evidence; European Commission: Brussels, Belgium, 2021. [Google Scholar]
  16. Ragonnaud, G.; Ashton, D.; European Parliamentary Research Service. “Green Claims” Directive: Protecting Consumers from Greenwashing (PE 753.958); European Parliament: Strasbourg, France, 2024. [Google Scholar]
  17. Delaval, J. CleanSpace Blog. 2020. [Google Scholar]
  18. European Space Agency (ESA). ESA Agenda 2025—Make Space for Europe; European Space Agency: Paris, France, 2021. [Google Scholar]
  19. Dominguez Calabuig, G.J.; Wilson, A.; Bi, S.; Vasile, M.; Sippel, M.; Tajmar, M. Environmental life cycle assessment of reusable launch vehicle fleets: Large climate impact driven by rocket exhaust emissions. Acta Astronaut. 2024, 221, 1–11. [Google Scholar] [CrossRef]
  20. Pettersen, J.B.; Bergsdal, H.; Silva, E.J.; Bjørnbet, M.M.; Estrela, M.A.; Chaves, P.A.; Skaar, C. Life Cycle Assessment (LCA) of Manufacturing Process and Space Materials; ESA: Paris, France, 2016. [Google Scholar]
  21. European Space Agency (ESA); Pettersen, J. Life Cycle Assessment of Space Propellants; European Space Agency (ESA): Paris, France, 2016. [Google Scholar]
  22. European Space Agency (ESA). Space Debris User Portal; European Space Agency (ESA): Paris, France, 2023. [Google Scholar]
  23. European Space Agency (ESA). Space System Life Cycle Assessment (LCA) Guidelines; European Space Agency (ESA): Paris, France, 2016. [Google Scholar]
  24. Wilson, A.R.; Vasile, M. Life cycle engineering of space systems: Preliminary findings. Adv. Space Res. 2023, 72, 2917–2935. [Google Scholar] [CrossRef]
  25. Wilson, A.R.; Vasile, M. Integrating Life Cycle Assessment of Space Systems into the Concurrent Design Process. In Proceedings of the 68th International Astronautical Congress (IAC), Adelaide, Australia, 25–29 September 2017; pp. 25–29. [Google Scholar]
  26. Blondel Canepari, L.; Affentranger, L.; Morales Serrano, S.; Tormena, E.; Padilla Gutierrez, E.; Pasini, A.; Valencia Bel, F. Towards Greener Propulsion: Environmental Categorization of Liquid In-Space Propulsion Systems via Life Cycle Analysis. In Proceedings of the Space Propulsion 2024, Glasgow, Scotland, 20–23 May 2024. [Google Scholar]
  27. Schabedoth, P.E.; Pettersen, J.B. Life Cycle Assessment of Rocket Launches and the Effects of the Propellant Choice on Their Environmental Performance; NTNU: Trondheim, Norway, 2020. [Google Scholar]
  28. Henry, H. Life Cycle Assessment: Green Rocket Fuel; ISU: Norwood, MA, USA, 2009. [Google Scholar]
  29. Wilson, A.R. Advanced Methods of Life Cycle Assessment for Space Systems. Ph.D. Thesis, University of Strathclyde, Glasgow, Scotland, 2019. [Google Scholar]
  30. Benini, L.; Sala, S.; Manfredi, S.; Małgorzata, G.; European Commission—Joint Research Centre Institute for Environment and Sustainability. Indicators and Targets for the Reduction of the Environmental Impact of EU Consumption: Overall Environmental Impact (Resource) Indicators; European Commission: Brussels, Belgium, 2014. [Google Scholar]
  31. Verkammen, M. Consensus-Based Single-Score Life Cycle Assessment for Space Missions. Master’s Thesis, TU Delft, Delft, The Netherlands, 2023. [Google Scholar]
  32. Sala, S.; Cerutti, A.K. Development of a Weighting Approach for the Environmental Footprint; Publications Office of the European Union: Luxembourg, 2018. [Google Scholar] [CrossRef]
  33. Bernstein, L.; Bosch, P.; Canziani, O.; Chen, Z.; Christ, R.; Davidson, O.; Hare, W.; Huq, S.; Karoly, D.; Kattsov, V.; et al. Climate Change 2007: Synthesis Report; Canadian Electronic Library: Ottawa, ON, Canada, 2013. [Google Scholar]
  34. World Meteorological Organization (WMO). Scientific Assessment of Ozone Depletion; World Meteorological Organization: Geneva, Switzerland, 1998. [Google Scholar]
  35. Huijbregts, M.A.J.; Steinmann, Z.J.N.; Elshout, P.M.F.; Stam, G.; Verones, F.; Vieira, M.; Zijp, M.; Hollander, A.; van Zelm, R. ReCiPe 2016—A harmonized life cycle impact assessment method at midpoint and endpoint level—Report I: Characterization. Int. J. Life Cycle Assess. 2017, 22, 138–147. [Google Scholar] [CrossRef]
  36. European Commission—Joint Research Centre—Institute for Environment and Sustainability. International Reference Life Cycle Data System (ILCD) Handbook —Recommendations for Life Cycle Impact Assessment in the European conte4xt; European Commission: Brussels, Belgium, 2011. [Google Scholar]
  37. Rosenbaum, R.K.; Bachmann, T.M.; Gold, L.S.; Huijbregts, M.A.J.; Jolliet, O.; Juraske, R.; Koehler, A.; Larsen, H.F.; MacLeod, M.; Margni, M.; et al. USEtox—The UNEP-SETAC toxicity model: Recommended characterization factors for human toxicity and freshwater ecotoxicity in life cycle impact assessment. Int. J. Life Cycle Assess. 2008, 13, 532–546. [Google Scholar] [CrossRef]
  38. Bruijn, H.; Duin, R.; Huijbregts, M.A.J.; Guinee, J.B.; Gorree, M.; Heijungs, R.; Huppes, G.; Kleijn, R.; Koning, A.; Oers, L.; et al. (Eds.) Handbook on Life Cycle Assessment: Operational Guide to the ISO Standards; Springer: Dordrecht, The Netherlands, 2022. [Google Scholar]
  39. PRé Sustainability. SimaPro v9.4.0.3. [Software]. 2024. Available online: https://simapro.com/ (accessed on 20 February 2025).
  40. Ecoinvent Association. Ecoinvent Database v3.9.1 [Software]. 2024. Available online: https://www.ecoinvent.org (accessed on 20 February 2025).
  41. European Space Agency (ESA). Margin Philosophy for Science Assessment Studies; European Space Agency: Paris, France, 2012. [Google Scholar]
  42. Blondel-Canepari, L.; Alforja Ruiz, I.; Ayala Fernández, L.; Gelain, R.; Glaser, C.; Ordoñez Valles, L.; Sarritzu, A.; Anthoine, J.; Apel, U.; Hendrick, P.; et al. Conceptual study of technologies enabling novel green expendable upper stages with multi-payload/multi-orbit injection capability. In Proceedings of the IAC 2021, 72nd International Astronautical Congress, Dubai, United Arab Emirates, 25–29 October 2021. [Google Scholar]
  43. Alforja Ruiz, I.; Lavagna, M. Design of the Optimal Trajectory for Multi-Payload Multi-orbit Injection for an Upper Stage. In Proceedings of the 9th European Conference for Aeronautics and Space Sciences, Lille, France, 27 June–1 July 2022. [Google Scholar]
  44. d’Agostino, L. Liquid Propellant Rockets 1. 2020. [Google Scholar]
  45. d’Agostino, L. Liquid Propellant Rockets 2. 2020. [Google Scholar]
  46. Benton, J.; Ballinger, I.; Jaekle, D.; Osborn, M. Design and Manufacture of a Propellant Tank Assembly. In Proceedings of the 43rd AIAA/ASME/SAE/ASEE Joint Propulsion Conference & Exhibit, Cincinnati, OH, USA, 8–11 July 2007; AIAA Paper 2007-5559. [Google Scholar]
  47. Bashmakov, I.; Nilsson, L.; Acquaye, A.; Bataille, C.; Cullen, J.; de la Rue du Can, S.; Fischedick, M.; Geng, Y.; Tanaka, K. Climate Change 2022: Mitigation of Climate Change. Contribution of Working Group III to the Sixth Assessment Report of the Intergovernmental Panel on Climate Change; Cambridge University Press: Cambridge, UK, 2022. [Google Scholar] [CrossRef]
  48. Erbach, G.; Jensen, L.; Chahri, S.; Claros, E. BRIEFING Towards Climate Neutrality: Fit for 55 Package; European Parliament: Strasbourg, France, 2024. [Google Scholar]
  49. United States of America; United Nations Framework Convention on Climate Change. The United States of America Nationally Determined Contribution: Reducing Greenhouse Gases in the United States—A 2035 Emissions Target. 2024. [Google Scholar]
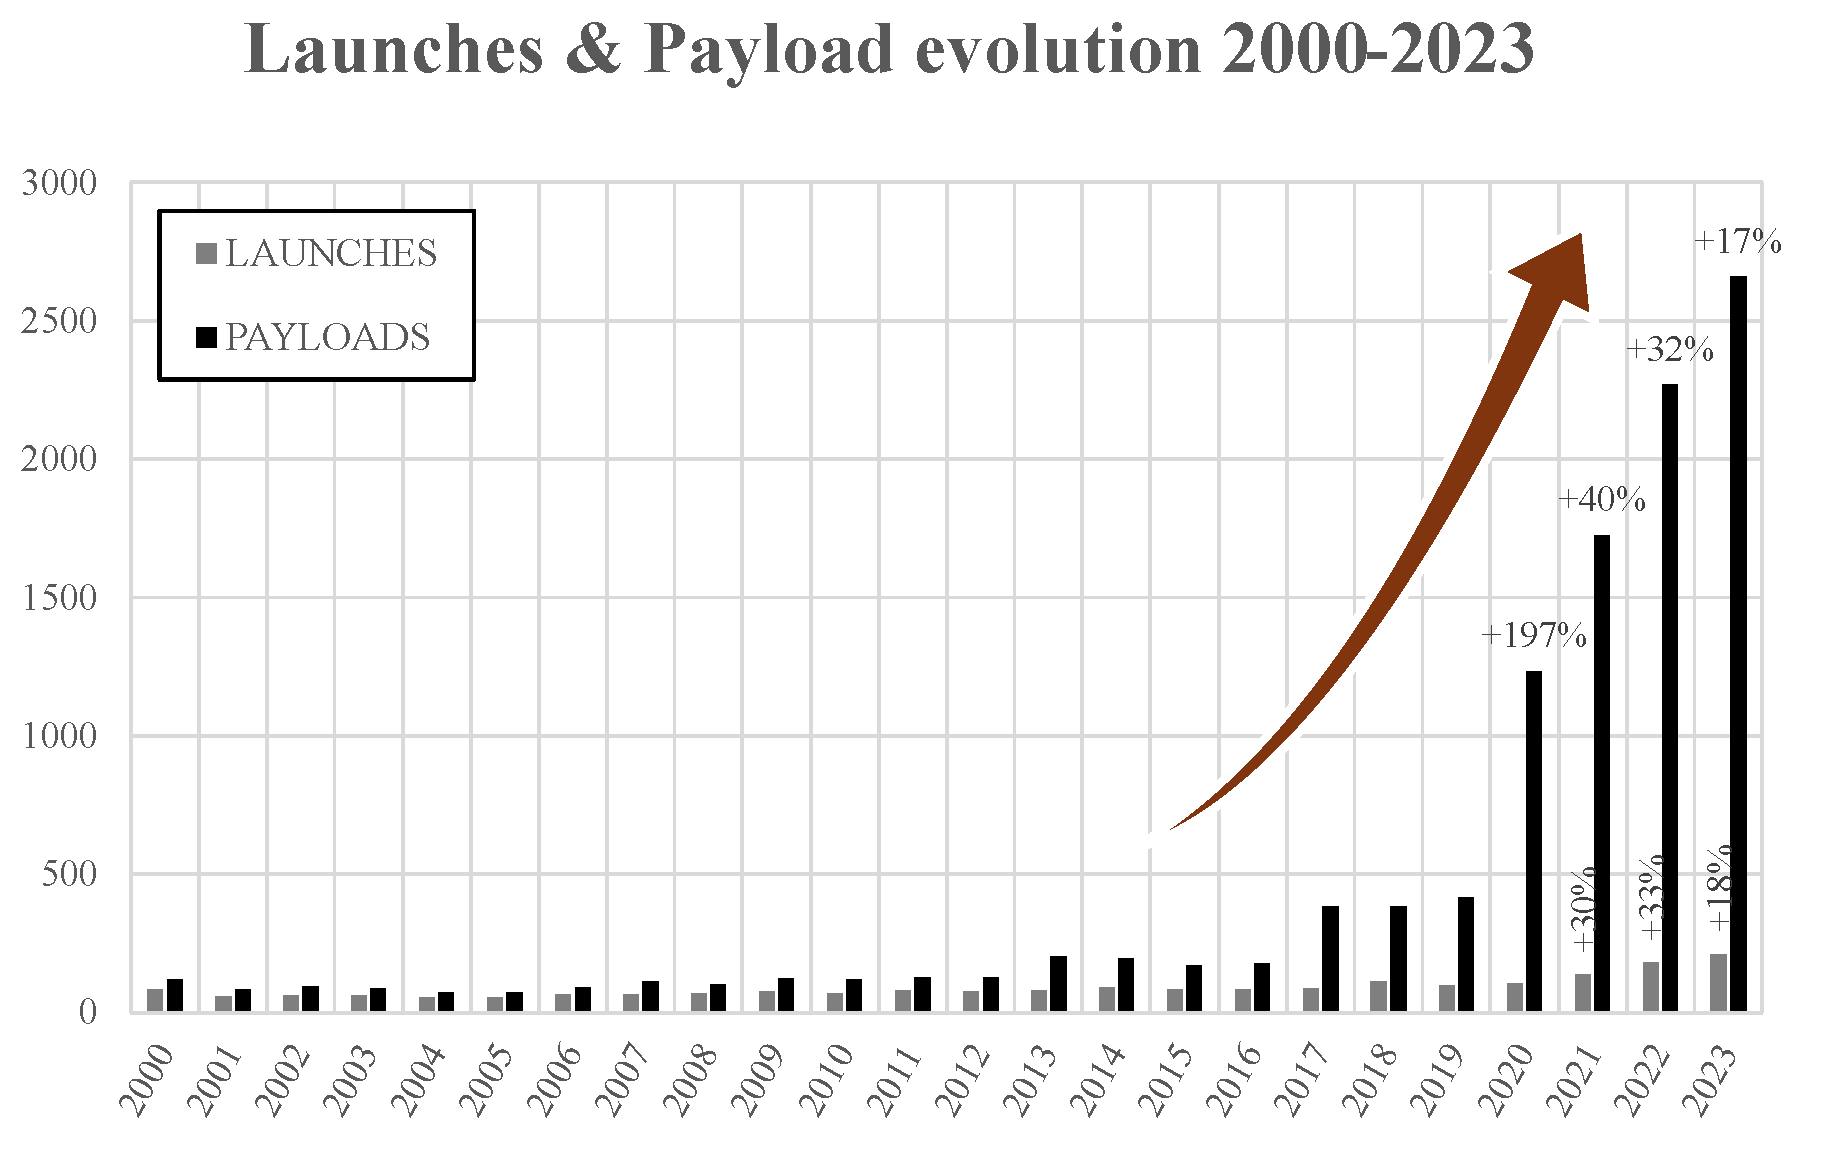
Figure 1. Evolution of Space Activities: Launches & Payload Deployments (2000–2023) [5].
Aerospace 12 01003 g001
Figure 2. Services enabled by Orbital Transfer Vehicles. The main ones being, TO-orbit delivery and ON-orbit servicing.
Aerospace 12 01003 g002
Figure 3. Life cycle phases ©ESA [17].
Aerospace 12 01003 g003
Figure 4. The four stages of conducting a life cycle analysis study. Reprinted from [3].
Aerospace 12 01003 g004
Figure 5. Ground life cycle stages considered in this study, from cradle to gate. Data is categorized as either production, referring solely to the production stage, or as loading, including all stages up to the loading phase.
Aerospace 12 01003 g005
Figure 6. Illustration of System Boundary for Loading the whole Propellant Required for the Mission into the Space System: In this diagram, green elements are modeled using the ESA database. Blue elements represent direct inputs from the Ecoinvent v3 cut-off allocation background database. Grey elements indicate final products or activities that are outside the system’s boundaries.
Aerospace 12 01003 g006
Figure 7. Weighting factors for the 15 impact indicators derived via the Analytical Hierarchy Process (AHP, n = 53 ). Respondent expertise: European Space Agency 29%, academics–propulsion 23%, aerospace industry 13%, academics–sustainability 13%, academics–aerospace 12%, other industry 8%, and climate scientists 2%.
Aerospace 12 01003 g007
Figure 8. Baseline bipropellant propulsive architecture: Solid lines indicate components common to the two types of propulsion systems considered here (i.e., pressure-fed and self-pressurized), whereas dashed lines identify components unique to specific propellant combinations.
Aerospace 12 01003 g008
Figure 10. Environmental impact of producing and loading the different propellant combinations for the mission scenario. Impacts values are normalized per category to the highest-impact option across selected midpoint indicators.
Aerospace 12 01003 g010
Figure 13. Respective contribution of the Dry Propulsive Architecture (dark grey) and of the Propellant Loading (light grey) to the Total Combined Environmental Impact of the Wet Architecture for each propellant combination.
Aerospace 12 01003 g013
Figure 14. Environmental impact comparison for loading 1 kg of chemical compounds used in various propulsion systems. Results are shown for the total AHP single-score (left), combined human-toxicity (center), and Global Warming Potential (right).
Aerospace 12 01003 g014
Table 1. Pros and Cons of the different propellant combinations under study. Main current liquid bipropellants alternatives for in-Space Propulsion [26].
Propulsion SystemPROSCONS
MON-3/MMH High I s p , hypergolic
Well-established technology with extensive flight heritage
Compatible with existing propulsion architectures and ground infrastructure
Highly toxic
Complex handling & safety measures, increased operational costs
Regulatory and environmental concerns may restrict future use
98% HTP/EthanolLower toxicity than MON-3/MMH
Ethanol is renewable and widely available
Good performance across a wide range of applications
Lower I s p than MON-3/MMH
Ethanol’s low energy density requires larger fuel tanks
Requires an ignition strategy
HTP natural decomposition demands considerations on material compatibility
98% HTP/RP-1Higher (and broader) max I s p than HTP/Ethanol
Good storability
Less toxic than hydrazine-based propellants
HTP is highly reactive and requires careful storage and handling protocols
Requires an ignition system
Soot formation during combustion may degrade performance and increase maintenance
N2O/EthaneLow toxicity
Long-term storability
Easier hardware manufacturing
Self-pressurizing, simplified system
Inexpensive and widely available propellants
Lower I s p vs. conventional and other greener alternatives
Low propellant density demands larger tanks
Requires high-pressure storage
Low energy content per unit mass
Table 2. The 15 midpoint impact indicators of the Life Cycle Assessment were selected based on the ESA LCA handbook [23] and on the 2016 ESA study on LCA of space propellants [21], which built on the ILCD framework with adaptations for the space sector. The selected indicators represent the categories for which robust data coverage is available in the ESA LCA database and which are thought most relevant to cradle-to-gate processes in propellant production and propulsion system manufacturing. The relative weighting of each indicator, used for prioritization, is shown in Figure 7. Characterization methods are referenced accordingly.
Impact IndicatorUnitsRepresentationMethodology Used
Global Warming Potential (GWP)kg CO2 eq.Measures the potential for emissions to contribute to global climate change.IPCC 2007(100 years)  [33]
Ozone Depletion Potential (ODEPL)kg CFC-11 eq.Assesses the potential for substances to deplete the stratospheric ozone layer.WMO 1999 ODPs  [34]
Ionizing Radiation (IORAD)kBq U-235 eq.Evaluates impact from ionizing radiation, related to radioactive decay.ReCiPe 2016  [35]
Photochemical Ozone Formation (PCHEM)kg NMVOC eq.Estimates potential for ground-level ozone (smog) formation from reactive gas emissions.ReCiPe 2016  [35]
Particulate Matter Formation (PMAT)Disease incidenceMeasures health effects of fine particulate matter.ILCD 2011  [36]
Human Toxicity, Non-Carcinogenic (HTOXNC)CTUhAssesses non-carcinogenic toxicity of chemical emissions to humans.USEtox  [37]
Human Toxicity, Carcinogenic (HTOXC)CTUhAssesses carcinogenic toxicity of chemical emissions to humans.USEtox  [37]
Acidification Potential (ACIDEF)mol H+ eq.Quantifies acidification of soil and water due to acidic emissions.CML 2002  [38]
Freshwater Eutrophication (FWEUT)kg P eq.Measures nutrient pollution in freshwater due to phosphorus.CML 2002  [38]
Marine Eutrophication (MWEUT)kg N eq.Assesses nitrogen enrichment in marine ecosystems.CML 2002  [38]
Freshwater Ecotoxicity (FWTOX)CTUeEvaluates toxic effects on freshwater aquatic life.USEtox  [37]
Land Use Potential (LUP)PointsMeasures impact of land occupation and transformation.ILCD 2011  [36]
Water Depletion (WDEPL)m3 world eq. deprivedQuantifies freshwater use contributing to scarcity.ILCD 2011  [36]
Abiotic Resource Depletion—Fossil (ADEPLF)MJAssesses use of fossil energy resources.CML 2002  [38]
Abiotic Resource Depletion—Minerals/Metals (ADEPLMU)kg Sb eq.Estimates depletion of metal and mineral resources.ReCiPe 2016  [35]
Table 3. Masses of the different propellant combinations required to complete the mission scenario, as determined by their respective densities, oxidizer-to-fuel ratios (O/F), and specific impulses ( I s p ).
Propellant
Combination
Density
[kg/m3]
O/F
Ratio
I sp
[s]
Mass
[kg]
MON-3/MMH1440/8751.653251024/620
98%-HTP/Ethanol1437/7894.503001420/315
98%-HTP/RP-11437/8007.503051514/202
N2O/Ethane785/3407.002951535/219
Table 4. Components list for the three propulsion architectures. Tanks and pipes are listed separately as main components while all the other ones are grouped as auxiliary components. The last row reports the estimated total mass of these auxiliary items, based on market data.
ComponentMON-3 & MMH98% HTP & Ethanol or RP-1N2O & Ethane
Main Components
Oxidizer TankCyl. TiAl6V4Cyl. AA5254 with CFRP overwrapCyl. C. Fiber with TiAl6V4 liner
Fuel TankCyl. TiAl6V4Cyl. AA5254 with CFRP overwrapCyl. C. Fiber with TiAl6V4 liner
Pressurizing He Vessel22
3/4-inch TubingTitaniumAluminumTitanium
Auxiliary Components
Filters442
Pyro Valves22
Vent Valves22
Fill & Drain Valves442
Latch Valves222
Cavitating Venturi222
Pressure Transducers662
Pressure Regulator22
High-pressure Gas Valve22
Temperature & Pressure Sensors664
Solenoid Valves202020
Main Thrusters555
Estimated auxiliary-component mass [kg]42.342.737
Table 5. Tank material properties.
MaterialDensity [kg/m3]Ultimate Strength [MPa] σ w ρ w [Pa kg−1m3]
Titanium Ti6Al4V4420950 2.15 × 10 5
Aluminium AA52542700350 1.30 × 10 5
Carbon Fiber19002500 1.32 × 10 6
Table 6. Comparative overview of environmental assessment components for dry and wet propulsive architectures.
Dry ArchitectureWet Architecture
Includes manufacturing of componentsIncludes all elements from the dry architecture
+ Loading of required propellant for the mission
+ Decontamination of fueling lines (by propellant type)
+ Treatment of fueling losses
+ Pressurizing gas loading for mass-flow maintenance
Table 7. Propellant replacement goals for in-space propulsion.
MetricGoals
Environmental ImpactTotal combined environmental impact less than half the one of the legacy system;
Combined toxicity below 50% of the legacy system, with no carcinogenic or mutagenic risks;
Global warming potential lower than the one of the legacy system.
ReliabilityOperational risk comparable to hydrazine-based systems;
Compatibility with passivation, de-orbiting strategies, and with easily demisable materials;
Broad material and architectural compatibility for modularity of use.
CostPost-qualification system expected to achieve a reduction in propulsion system cost compared with hydrazine-based systems;
Eliminates the need for SCAPE suits and stringent safety protocols, reducing recurring ground-operations costs relative to hydrazine baselines.
Propulsive PerformancePayload capacity meeting or exceeding the one of the legacy system;
Operational lifespan comparable to the legacy system;
No long-term performance degradation;
Compatibility with the implementation of other innovative technologies.
Note: Publicly available quantitative data for cost and reliability are limited, as these parameters vary significantly between facilities depending on personnel, safety procedures, and handling frequency. Accordingly, the values in Table 7 are presented qualitatively and should be interpreted as indicative performance and sustainability targets. Published NASA data on green monopropellants [9], along with vendor specifications for protective equipment, provide general order-of-magnitude context for these metrics.
Disclaimer/Publisher’s Note: The statements, opinions and data contained in all publications are solely those of the individual author(s) and contributor(s) and not of MDPI and/or the editor(s). MDPI and/or the editor(s) disclaim responsibility for any injury to people or property resulting from any ideas, methods, instructions or products referred to in the content.