Article

Aerodynamic Performance Enhancement of Ram Air Turbine Blades with Different Tip Configurations

1
College of Aerospace Engineering, Nanjing University of Aeronautics and Astronautics, Nanjing 210016, China
2
Jincheng Nanjing Engineering Institute of Aircraft Systems, Aviation Industry Corporation of China, Nanjing 210016, China
*
Author to whom correspondence should be addressed.
Aerospace 2025, 12(10), 937; https://doi.org/10.3390/aerospace12100937
Submission received: 23 July 2025 / Revised: 10 October 2025 / Accepted: 11 October 2025 / Published: 17 October 2025
(This article belongs to the Section Aeronautics)

Abstract

A ram air turbine serves as a critical emergency power system for aircraft. To mitigate aerodynamic losses from tip vortices, this study proposes three blade tip enhancement configurations: a tip plate, tip contraction, and winglet. Numerical results indicate that the tip plate slightly improves the power at low tip speed ratios (TSRs); however, at medium and high TSRs—typical of turbine operation—power gains turn negative, and thrust loads increase significantly, failing to balance the gain and load. In contrast, the tip contraction—applied to the outer 5% span—enhances the power output at medium to high TSRs, with a maximum power increase of 2.05%, and consistently reduces thrust loads across all TSRs. Its highest power–thrust net gain coefficient reaches 3.85%, indicating strong potential for optimizing power efficiency and load mitigation. The winglet achieves the greatest power enhancement, increasing the power across all TSRs, with a maximum power increase of 7.59%. However, its thrust load also increases accordingly, resulting in a power–thrust net gain coefficient lower than the tip contraction. Further optimization of the winglet parameters using an orthogonal experimental design revealed that the optimized winglet increased the power output by 8.69% compared to the baseline configuration, thereby increasing the maximum power–thrust net benefit coefficient from 1.72% before optimization to 3.95%.

1. Introduction

The ram air turbine (RAT) is extensively utilized as an emergency power source in large commercial and transport aircraft. It can be rapidly deployed in critical situations where both the main and auxiliary power systems fail, harnessing the oncoming airflow to rotate its blades. This rotation drives a generator or hydraulic pump, thereby supplying electrical or hydraulic energy to essential systems such as flight control computers and actuators [1,2,3,4]. With the rise of more electric and all-electric aircraft, the demand for emergency power has increased significantly [5,6,7], requiring RATs with higher power outputs to match the architecture of new-generation high-power avionics systems [8,9]. Power enhancement can be achieved by increasing the size of the turbine or improving the wind energy extraction efficiency. However, enlarging the turbine poses spatial constraints within the already limited structural envelope of the aircraft. As a result, enhancing the efficiency of wind energy utilization emerges as the preferred strategy for increasing the power output of the RAT.
The wind energy extraction efficiency of the RAT can be enhanced through optimization of the blade airfoil and structural configuration. For example, Bolaños-Vera et al. [10] arranged three different airfoils along the blade span, effectively reducing aerodynamic drag and enhancing the glide ratio of the aircraft. However, this multi-airfoil design resulted in a lower power output than for blades with a single airfoil. Saad et al. [11] studied a counterrotating ram air turbine with improved power performance, but its structural complexity and increased weight pose challenges for practical applications. Gadda et al. [12] mounted gurney flaps at the root of the blade, yielding an increase in the RAT power output at medium to high tip speed ratios. Notably, significant aerodynamic losses occur in the blade tip region and play a vital role in the power output of the RAT. Improving the aerodynamic efficiency in this region has a notable effect on the overall performance of the RAT. Therefore, investigating the aerodynamic loss characteristics of the blade tip region and developing effective control strategies are matters of critical importance for enhancing the power output of RATs. In this context, Zhang et al. [13] introduced a tip plate structure into RAT blades to suppress tip vortices and improve aerodynamic performance in the tip region. Nevertheless, the existing research on blade tip losses in RATs remains relatively scarce.
Although there has been limited research on RAT blade tip flow control, winglets have been extensively studied and applied as effective wing tip flow control technologies for fixed-wing aircraft [14,15]. Scholars have extensively researched the aerodynamic performance of various winglet configurations, including wingtip fences, blended winglets, spiroid winglets, and multiple winglet configurations [16,17,18,19]. Among these, blended winglets have been widely applied in aircraft because of their excellent drag reduction performance and relatively simple structure.
The research on aerodynamic optimization of the blade tips of wind turbines, a type of wind energy extraction device, can provide references for enhancing RAT power. The influence of winglet parameters on the efficiency of horizontal axis wind turbines has been widely studied. The research on winglet length indicates that longer winglets result in higher power and thrust coefficients [20,21,22]. Other parameters, such as the curvature radius, sweep angle, taper ratio, and twist angle, have also been investigated [20,23,24]. These parameters generally exhibit a certain degree of regularity, with the power and thrust increasing as the curvature radius decreases, performance improvements observed when the twist angle at the blade tip is positive, and higher aerodynamic efficiency typically achieved with a lower taper ratio, whereas the sweep angle exerts only a minor influence. However, their effects may vary under different operating conditions. Additionally, tip contraction has garnered increasing attention as an alternative aerodynamic enhancement strategy. Related studies have examined the influence of parameters such as the contraction onset location, taper distribution, and variation in twist angle on the aerodynamic performance of wind turbines [25,26,27,28,29]. Findings indicate that a well-designed tip contraction can significantly reduce thrust loads and enhance the overall turbine power output, offering valuable insights for optimizing the blade tip geometry of RATs.
The application scope of the blade tip configuration research is continuously expanding, extending beyond conventional wind turbines to emerging energy devices. Song et al. [30] investigated an Archimedes spiral wind turbine (ASWT) for urban low-wind environments and proposed a winglet-enhanced configuration. Using numerical simulations, they evaluated the aerodynamic effects of key geometric parameters. The results indicate that the cant angle is the dominant parameter. Furthermore, in tidal turbine research, Zhang et al. [31] combined CFD with flume tank experiments and showed that a 45° winglet cant increased the turbine efficiency by approximately 11% while substantially reducing blade load fluctuations; mechanistically, the winglet shifts the onset of tip vortex formation away from the rotor plane.
In summary, the research on tip configurations has been continuously expanding and deepening across different energy utilization scenarios, as well as novel energy devices. This provides new research motivation and engineering value for their further application to RATs. Based on this background, this study takes a certain RAT as the research object and designs three tip configurations: the tip plate, tip contraction, and tip winglet. The effects of each tip configuration on the RAT power output and its power enhancement mechanism are analyzed via numerical simulation methods. The research results can provide engineering references for the power enhancement design of RAT blade tips.

2. Physical Model and Numerical Method

2.1. Physical Model Introduction

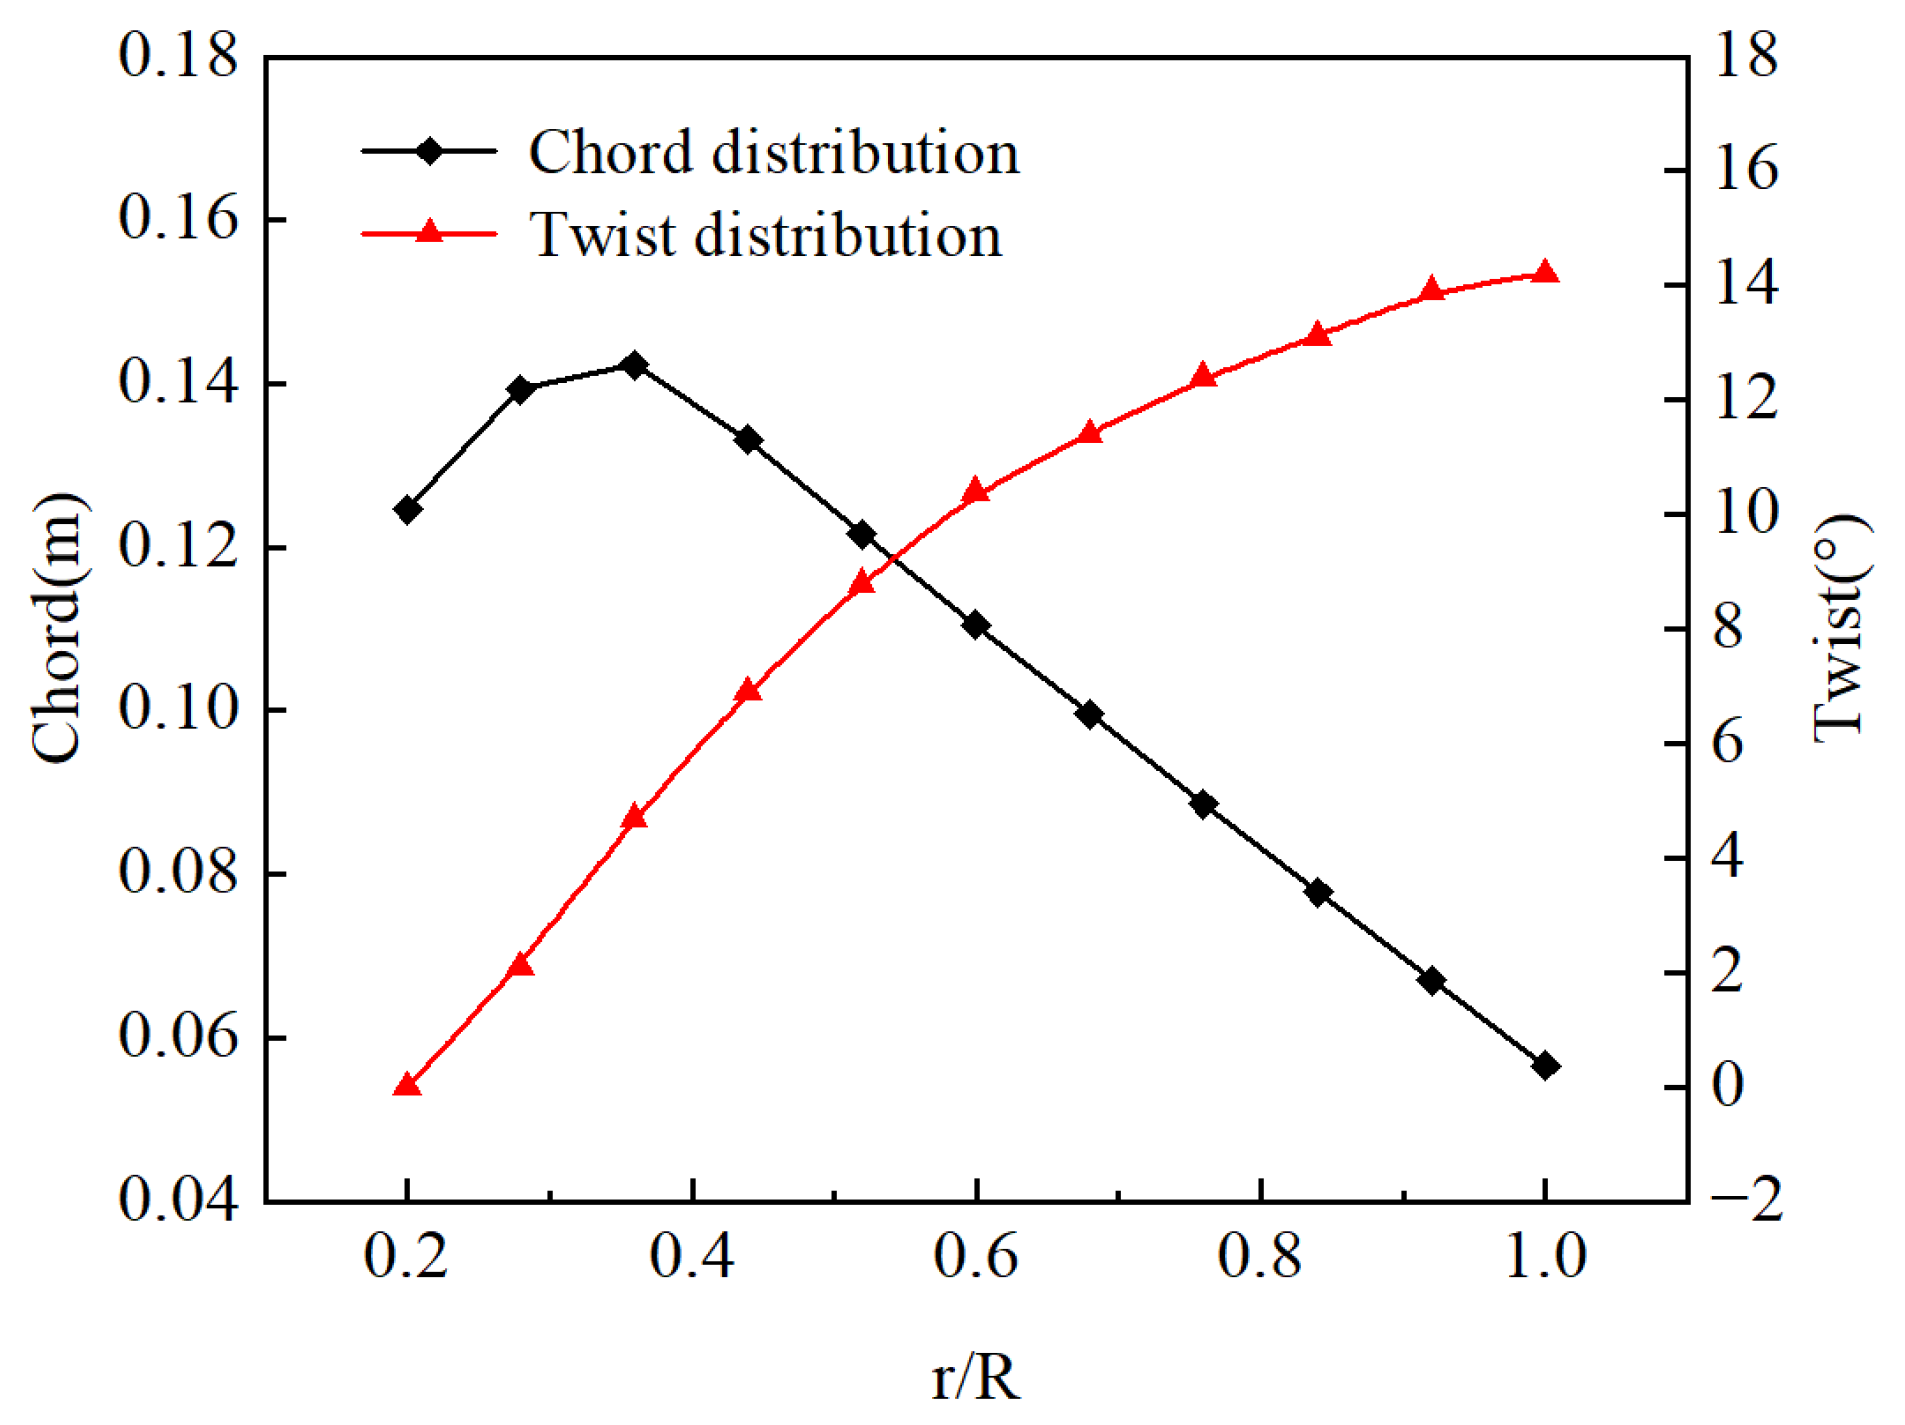
Figure 1 depicts the geometric schematic of the complete RAT model analyzed in this study, comprising two blades. The turbine has a radius of 457 mm, and the baseline blade design features a straight tip and a spanwise twist distribution, with a tip chord length of 57 mm. The spanwise chord and twist distributions are shown in Figure 2. To enhance its aerodynamic efficiency, three alternative blade tip configurations were developed as modifications of the baseline. All configurations retained the same blade length to ensure a consistent comparative analysis.

2.2. Modeling Strategy

This study performs numerical simulations on the basis of three-dimensional, Reynolds-averaged, Navier–Stokes (RANS) equations using the commercial computational fluid dynamics (CFD) software ANSYS FLUENT 2022R1. In the simulations, the transition-SST (4-equation) model was selected because it provides more accurate predictions of torque and thrust by accounting for the laminar-to-turbulent transition, which in turn allows for a more accurate assessment of the torque and power increments among the three configurations. A steady-state solver was employed and the coupled solver algorithm was used for pressure–velocity coupling. The coupled solver simultaneously updates the momentum and continuity equations within each iteration, thereby enhancing the numerical stability and accelerating convergence. Second-order schemes were adopted for spatial discretization. The rotor speed range is 4580~6490 r/min and the freestream velocity range is 40~120 m/s. The local Mach number at the blade tip can exceed 0.65 due to the high rotational speed. Therefore, the flow in the present study was modeled as compressible.
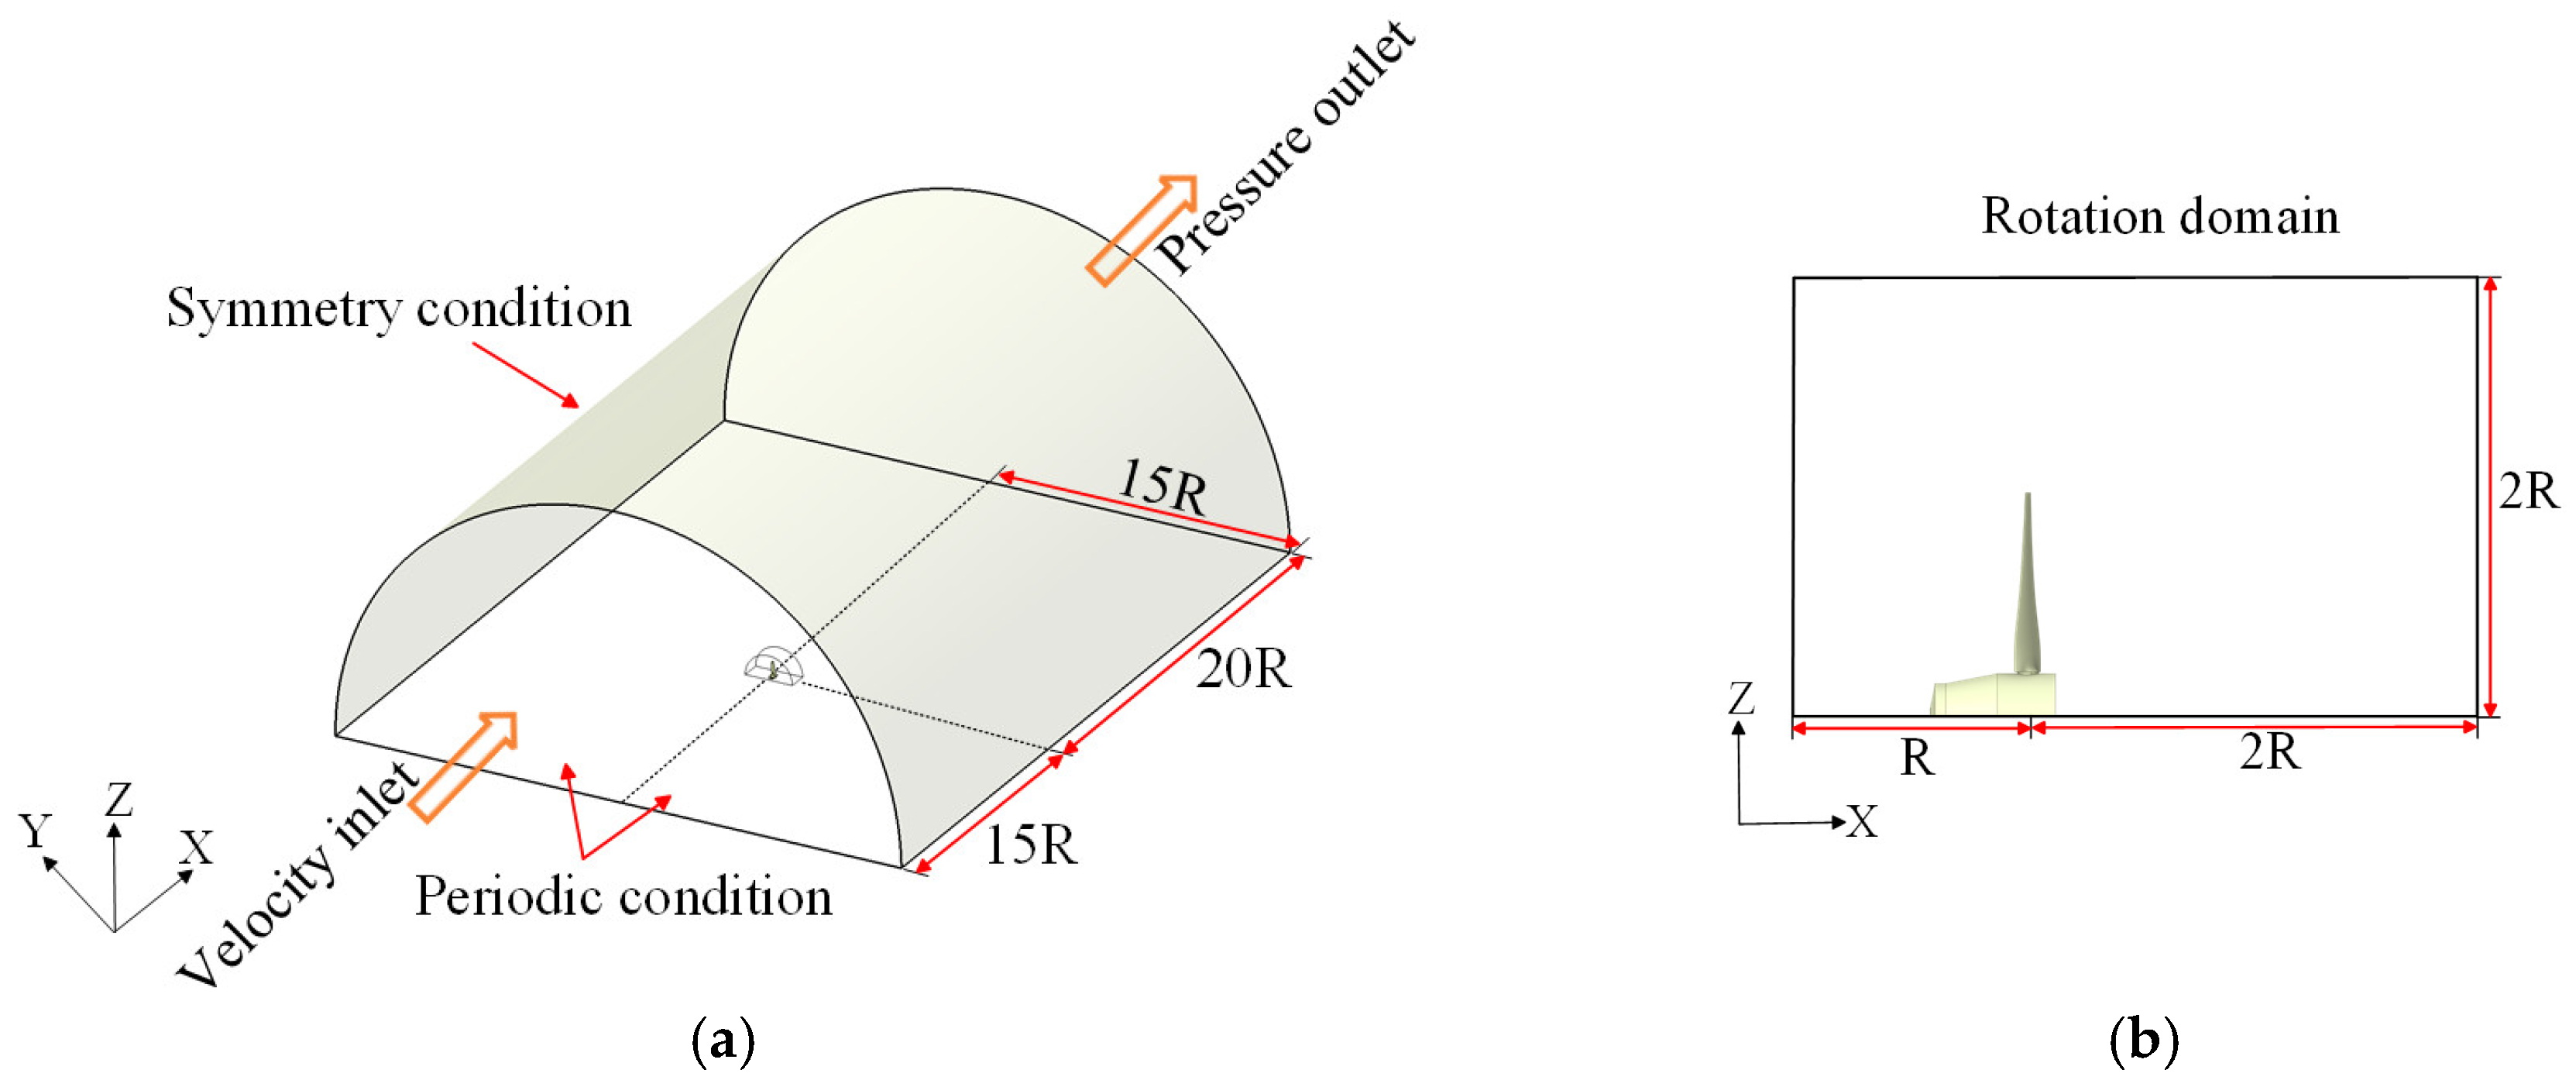
The multiple reference frame (MRF) method was used to simulate the rotation of the RAT. Given the rotational periodicity of the flow under stationary flow and constant rotational speed conditions, periodic boundary conditions were applied to reduce the computational domain to half of the physical geometry, thereby improving the simulation efficiency. Figure 3 illustrates the setup of the computational domain and boundary conditions. The inlet of the flow field, positioned 15R upstream from the rotor, is defined with a velocity inlet condition. At the downstream end, 20R away from the rotor, a pressure outlet condition is specified. Considering the actual situation, a symmetry boundary condition was applied to the side surface of the domain 15R from the turbine’s centerline, as it allows tangential flow to pass freely without imposing additional inflow constraints, and the computational domain is sufficiently large to avoid affecting the solution. The bottom boundary of the domain is modeled using a periodic condition. Within the rotating frame region, the radial distance from the interface to the turbine’s centerline was set to 2R. The upstream boundary was located at a distance of R upstream of the rotor disk, while the downstream boundary was placed 2R downstream of the rotor disk.

2.3. Grid Independence Analysis

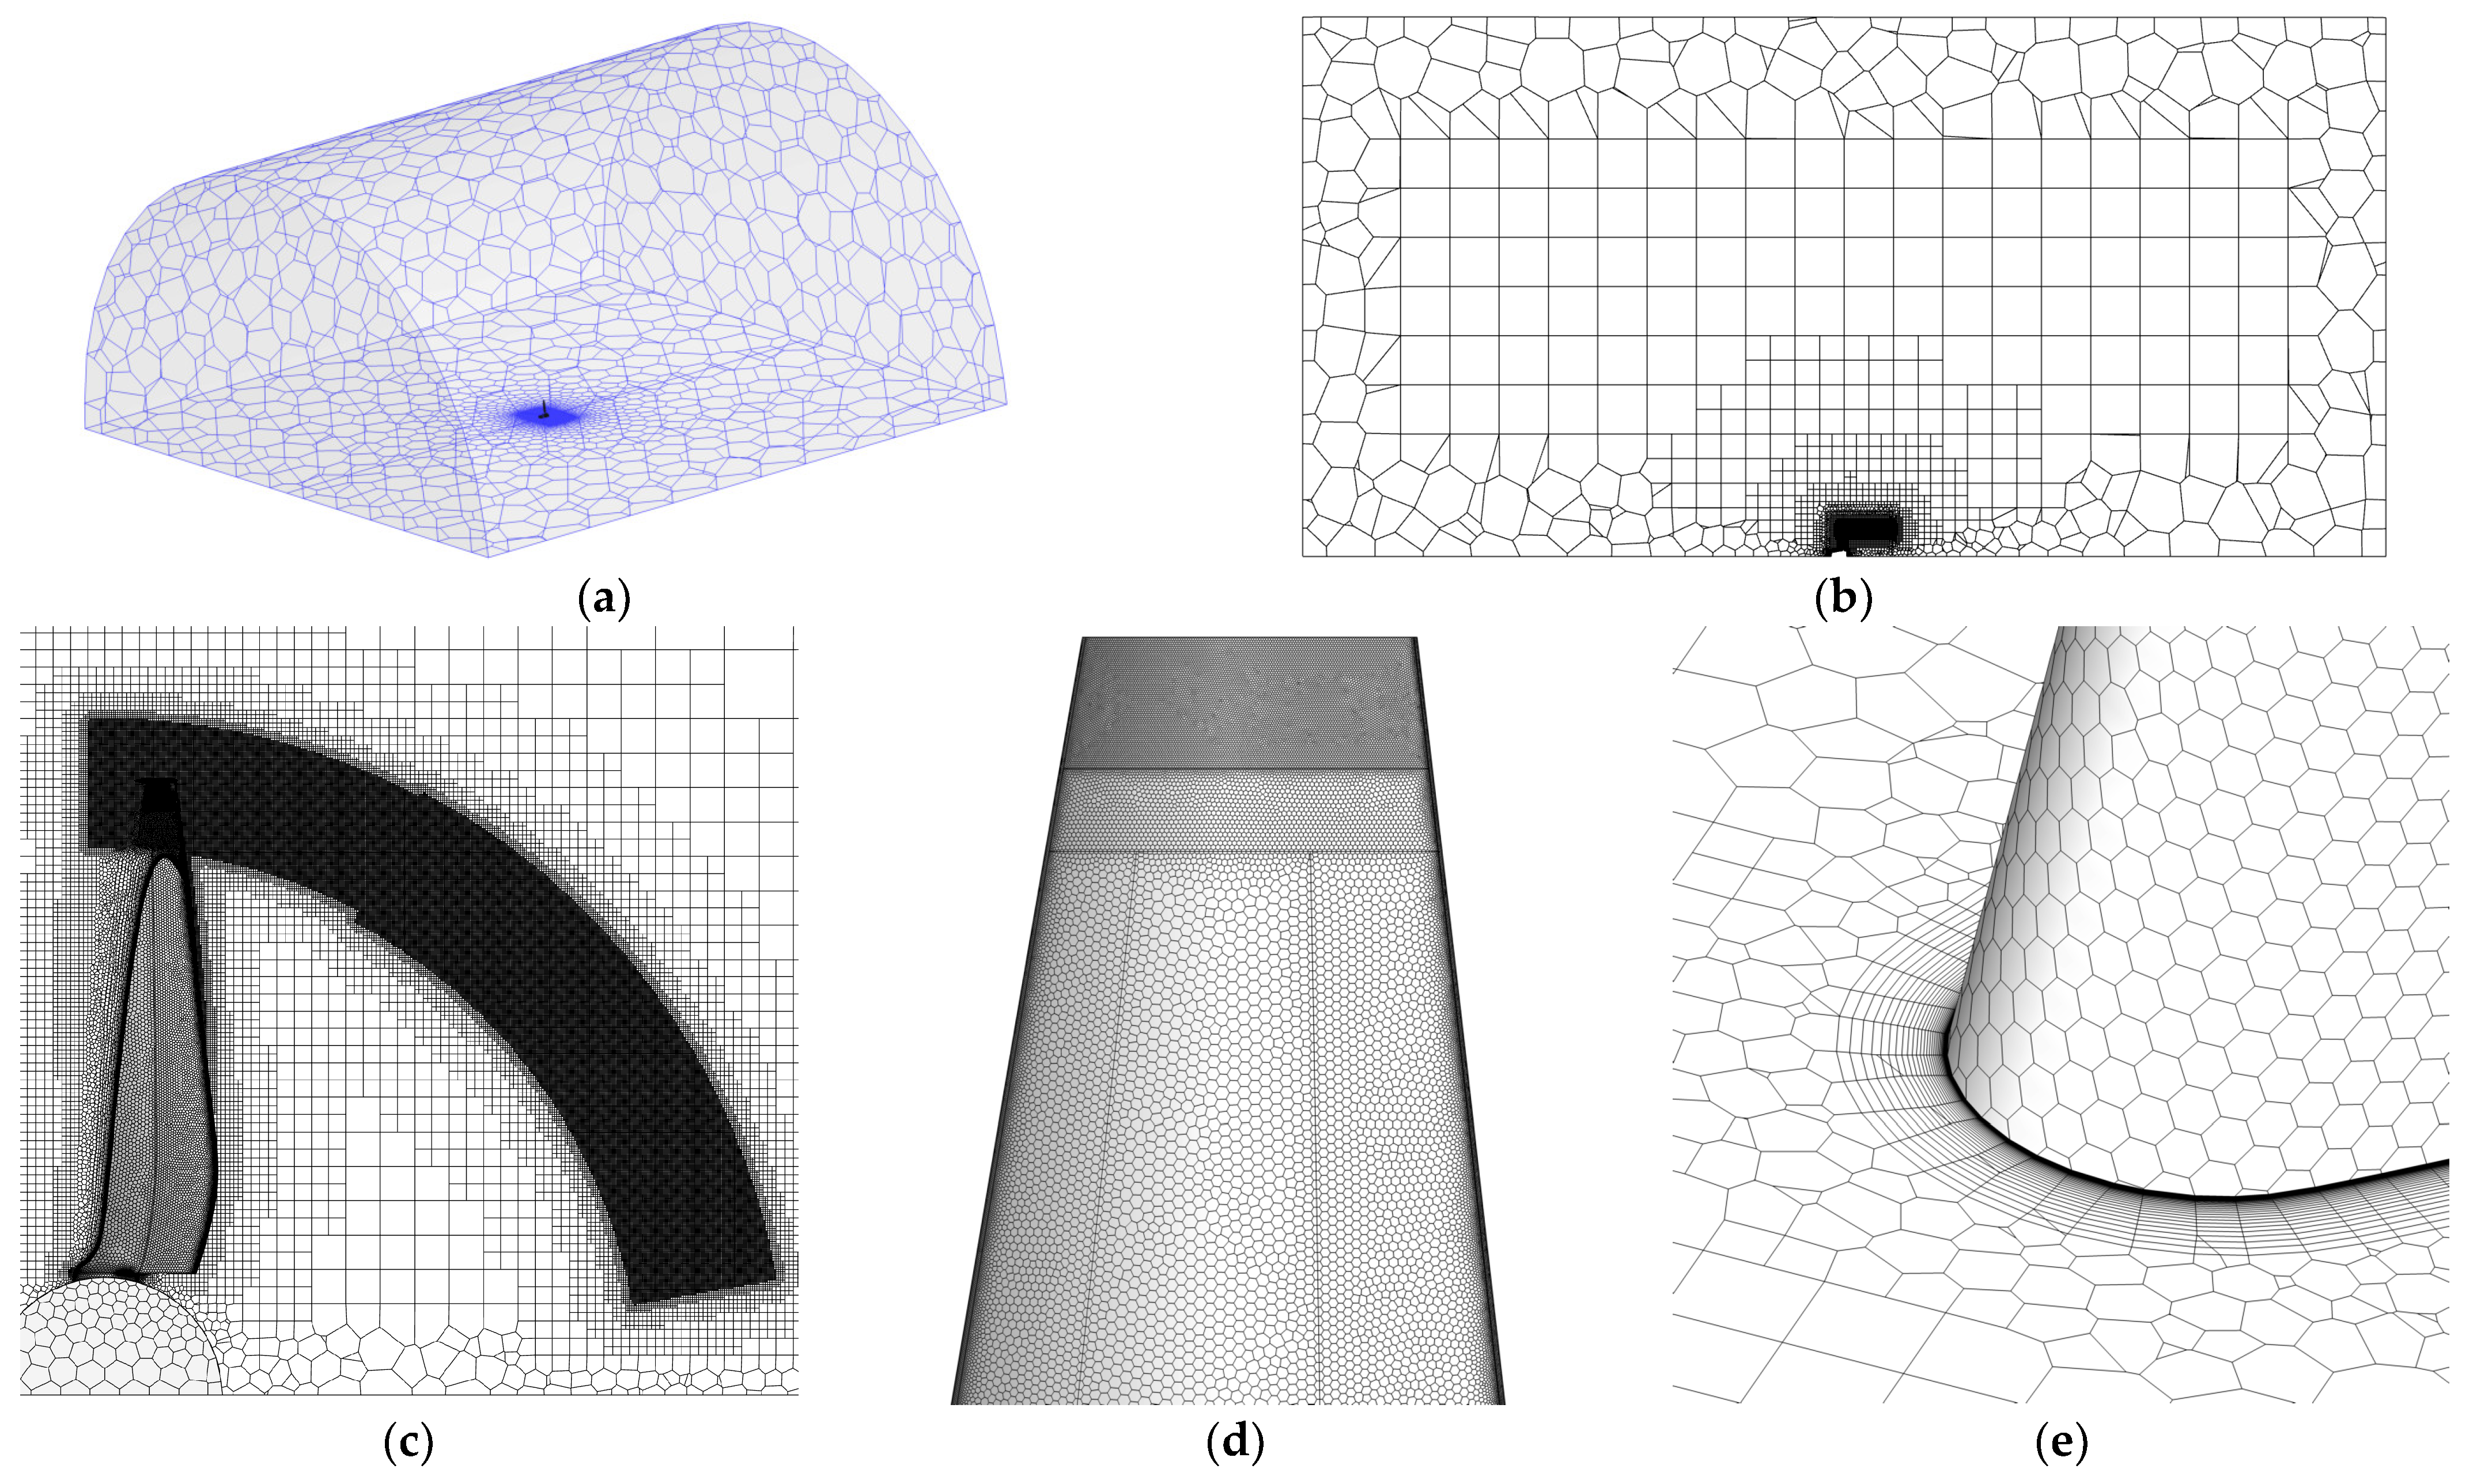
A mesh independence study was performed by generating three grid configurations with varying element counts to assess the effect of the mesh density on the simulation accuracy. Three grid resolutions were employed, designated as G01, G02, and G03, with refined grid sizes of 1000 mm, 800 mm, and 500 mm at the side boundary of the flow domain, and corresponding interface mesh sizes of 40 mm, 20 mm, and 10 mm, respectively. To accurately capture the boundary layer flow phenomena, the first-layer height on the blade surface is set to 1.2 × 10⁻⁶ m, ensuring that the y+ value is less than or equal to one on the majority area of the blade surface. Additionally, to accurately capture tip vortex structures, mesh refinement zones are implemented in the blade tip wake region. For the mesh study, a representative operating condition was chosen with an inlet velocity of 70 m/s and a rotational speed of 5200 r/min. The characteristics of the three mesh setups and their corresponding simulation results are presented in Table 1.
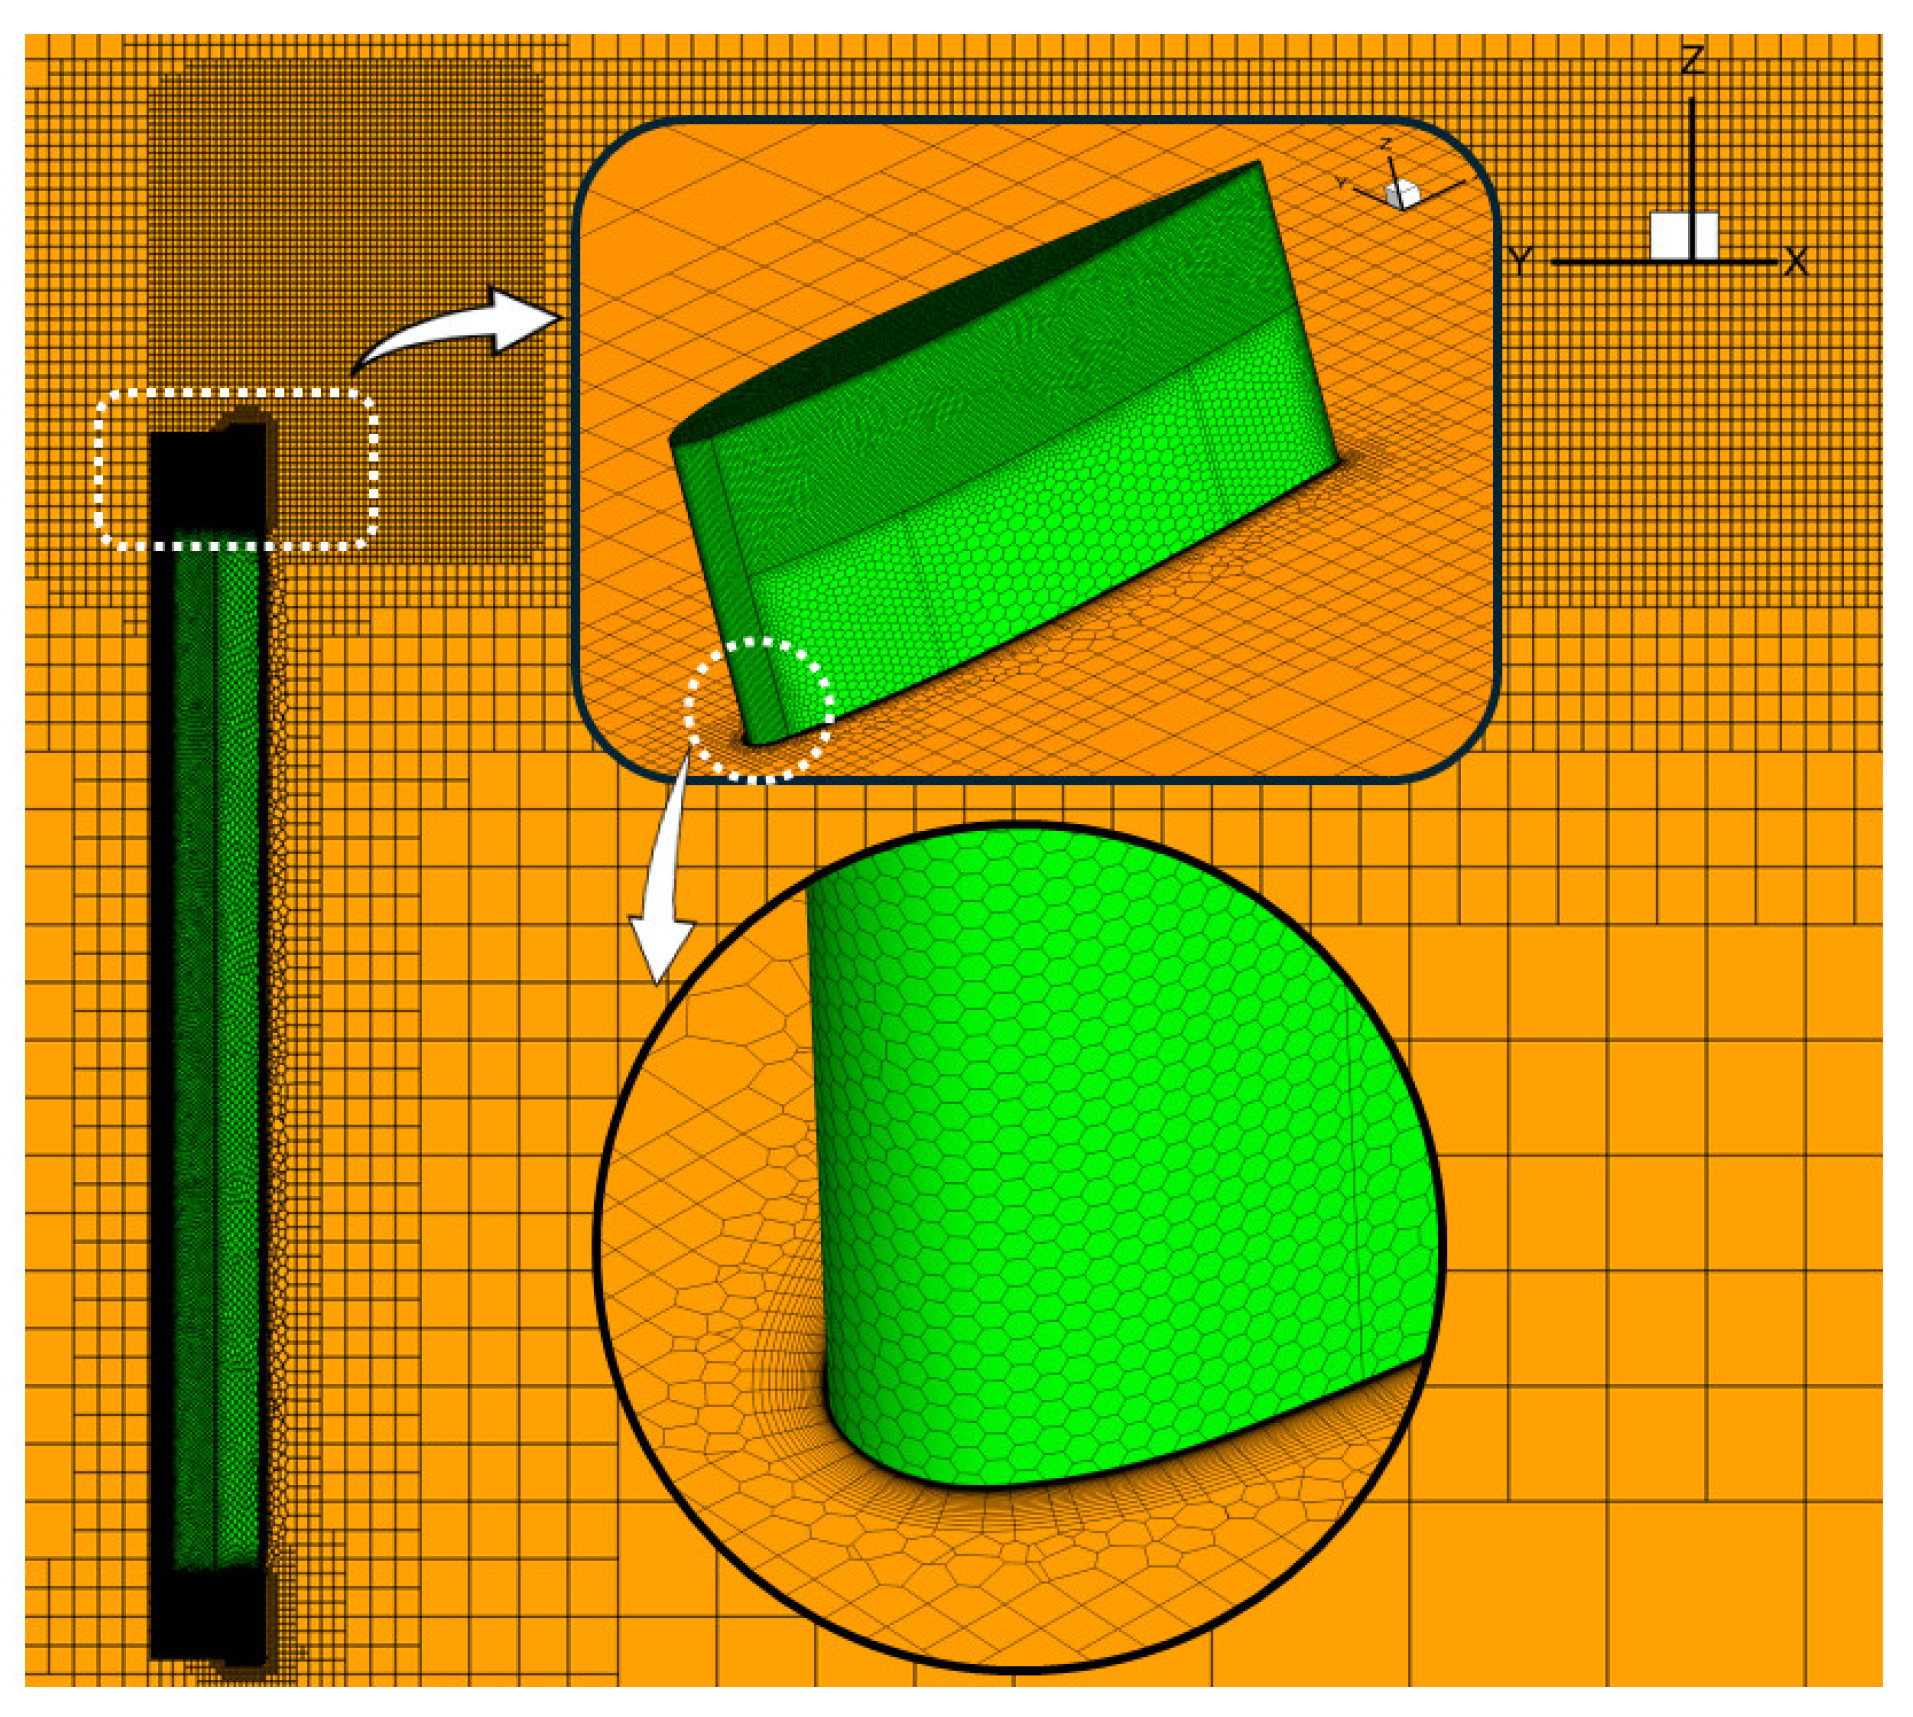
When the mesh was refined from G01 to G02, the simulated torque varied by approximately 0.28%. Further refinement to G03 resulted in only a 0.014% change in torque. The corresponding axial thrust values across the three mesh levels differed by less than 0.15%, demonstrating that both torque and thrust predictions are insensitive to further mesh refinement beyond G02. Therefore, the G02 mesh was selected for subsequent simulations. Figure 4 illustrates the mesh used in the model simulation.

2.4. CFD Validation Using Experimental Data

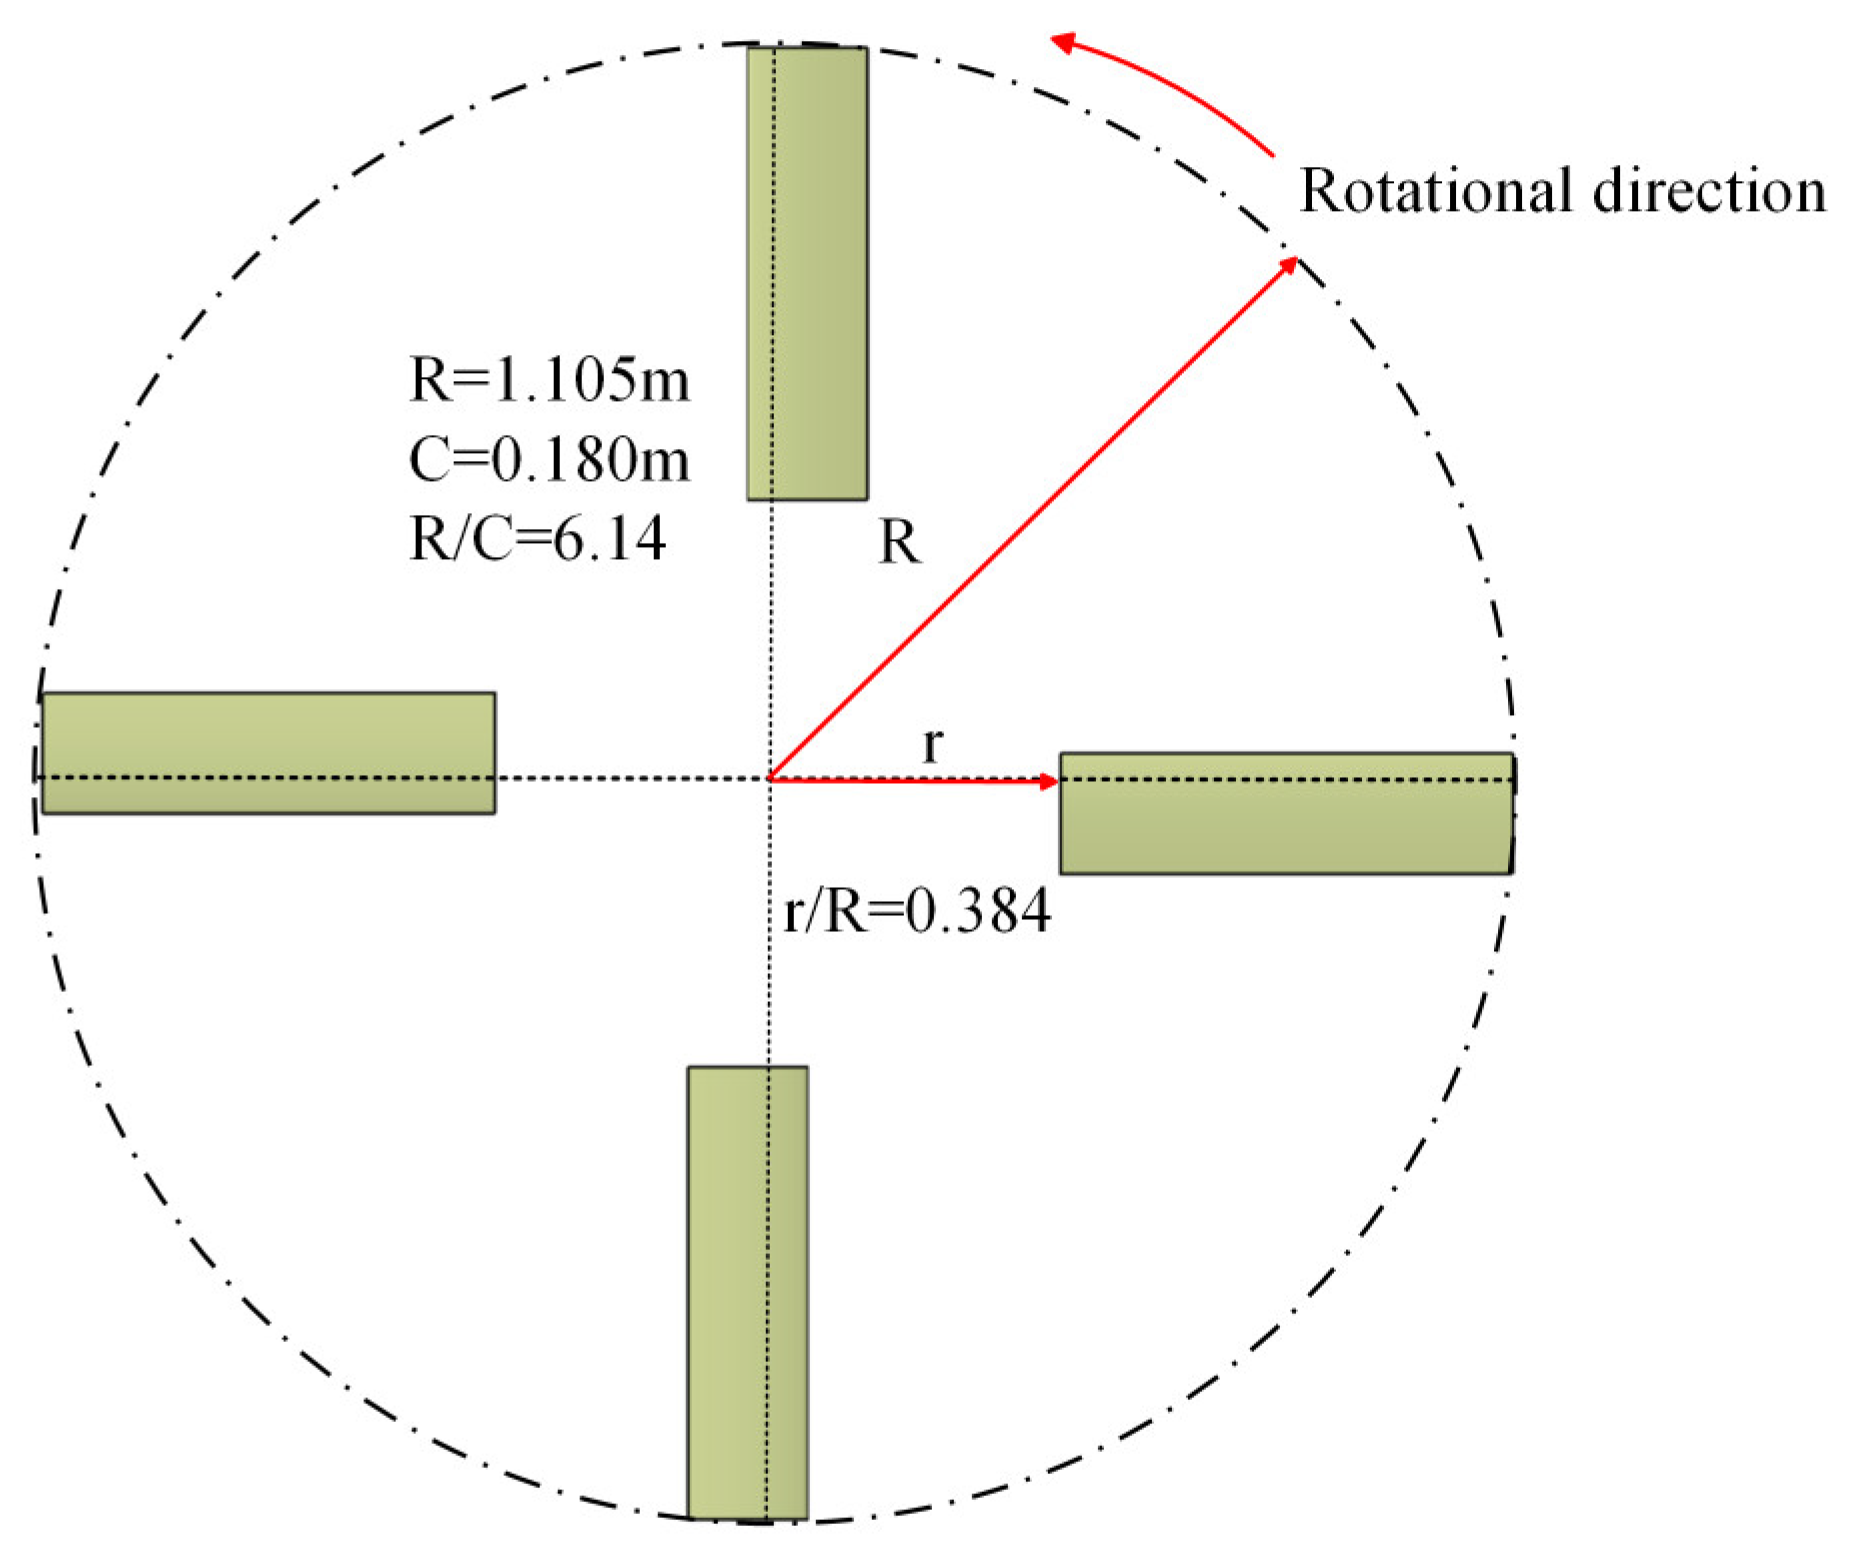
There are no available aerodynamic experimental data for the RAT used in this study. The papers reviewed by the author also do not report any aerodynamic experiments on the RAT. To validate the reliability of the numerical method employed, the Lynx helicopter tail rotor was selected for comparison. This rotor shares comparable characteristics with the present RAT model in terms of the tip Mach number and blade chord length, making it an appropriate reference case. The Lynx tail rotor is composed of four rigid, straight, untwisted blades, each measuring 1.105 m in length with a chord length of 0.180 m. In the experimental setup, the blade section up to 0.384 r/R was excluded to allow for connection to the hub and drive mechanism. Consistent with this approach, the current validation model also omits the hub attachment structure, retaining only the blade portion for simulation purposes, as shown in Figure 5.
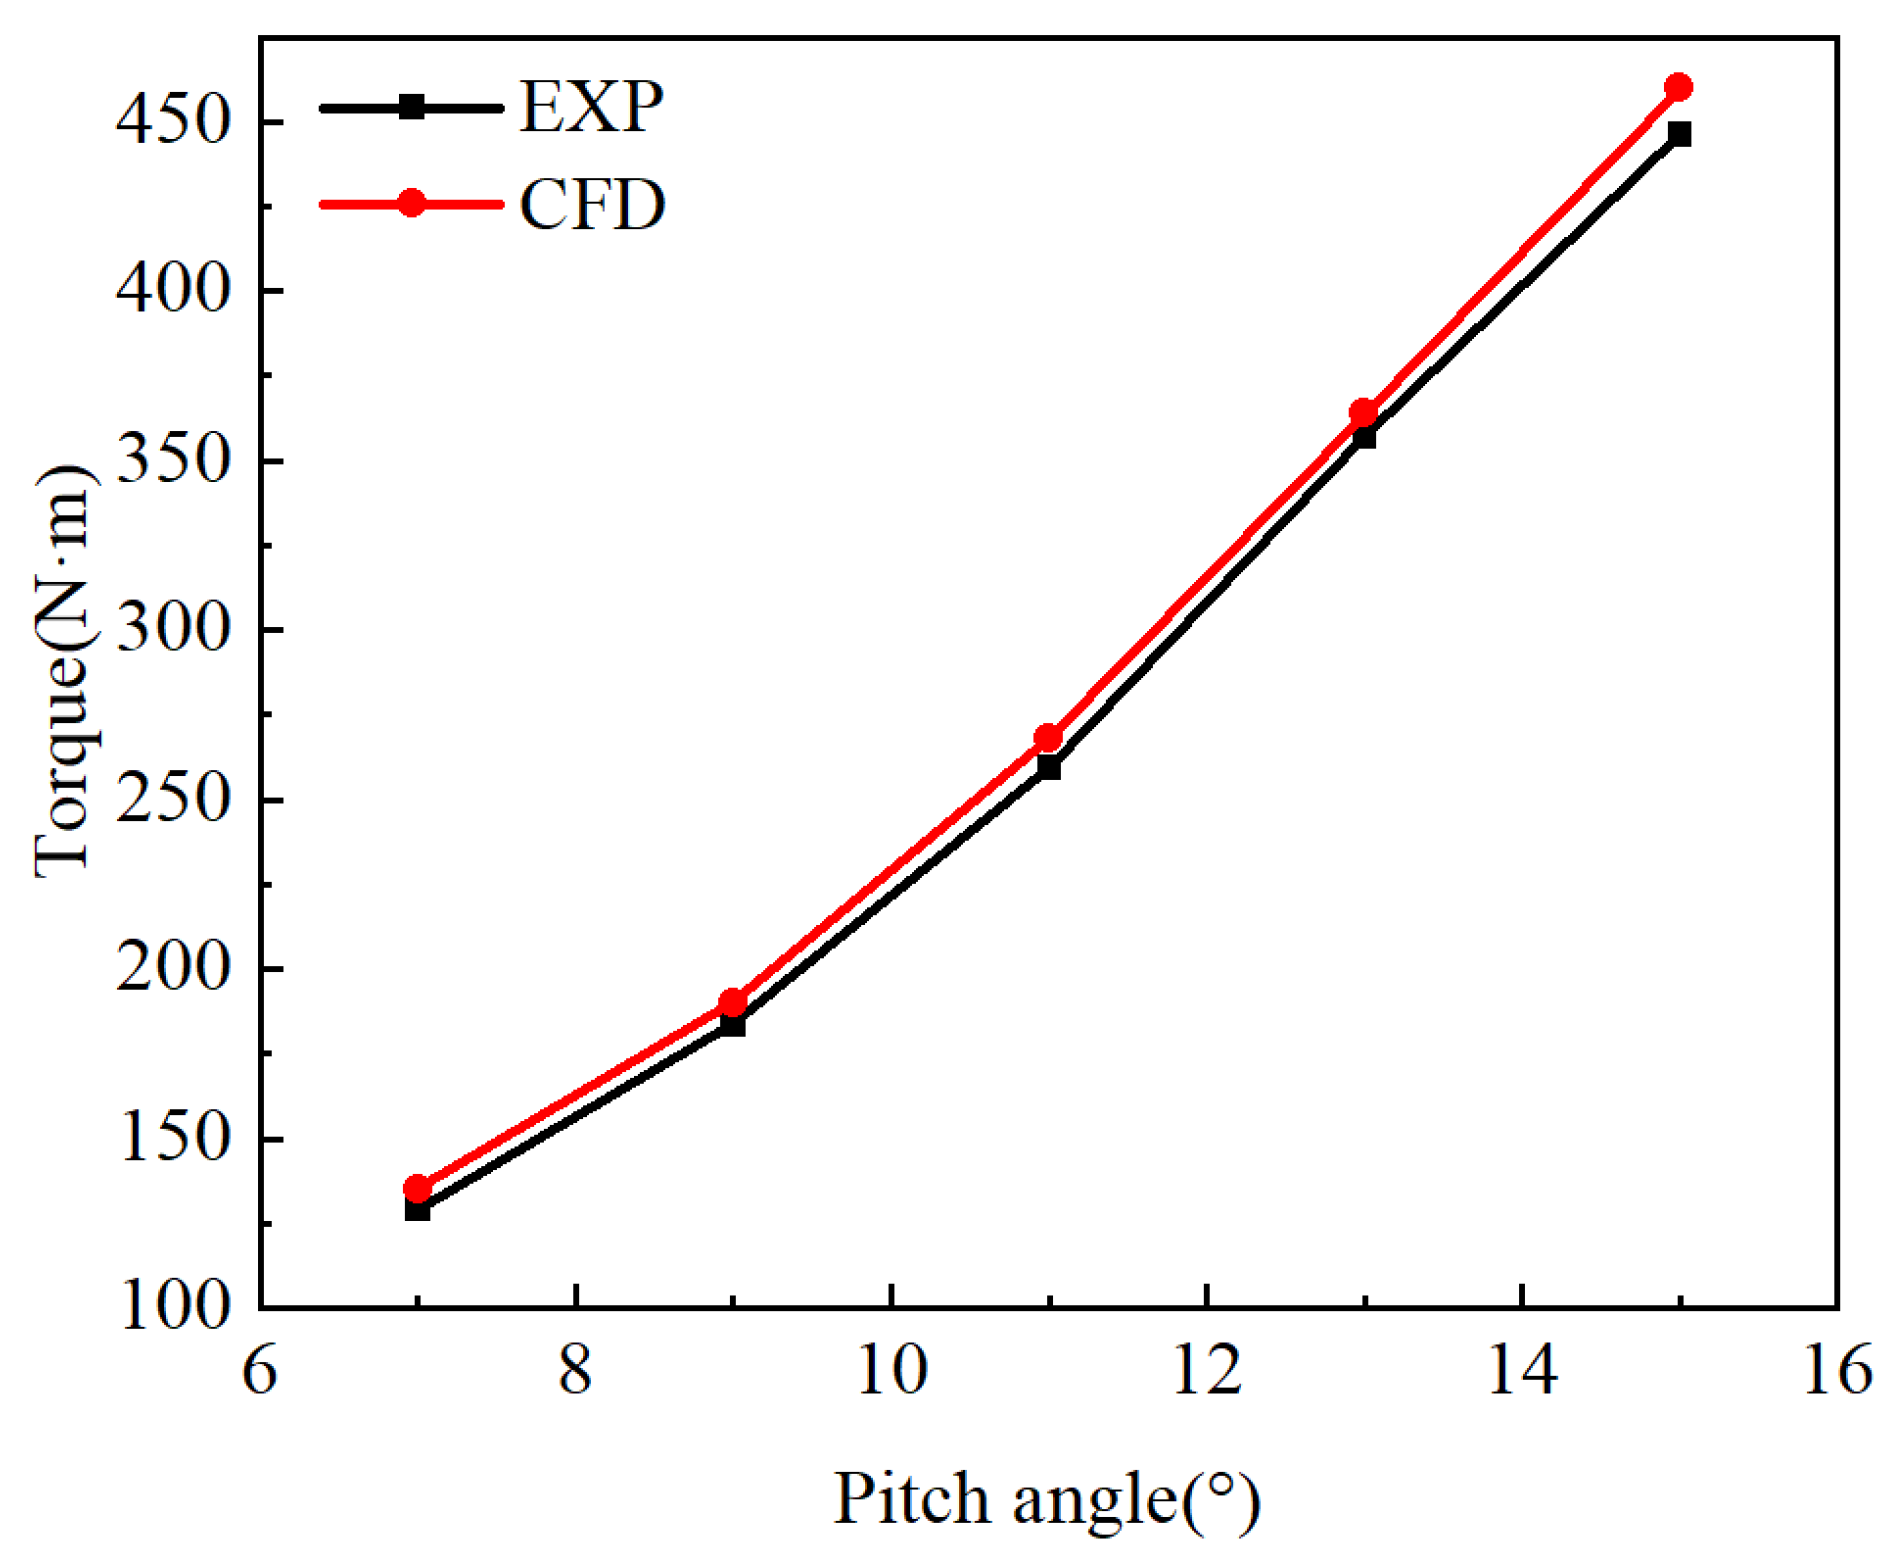
The tail rotor in this study operates under hovering conditions, which correspond to an axial flow state. By leveraging the model’s periodic symmetry, a quarter sector of the full geometry is used to construct the computational mesh. Figure 6 displays the mesh structure on the tail rotor blade surface and in the surrounding flow domain. To enhance the credibility of the results, the mesh for the rotor was generated using the same refinement strategy as for the RAT, and the domain proportions were kept consistent with the RAT case. The tail rotor simulation also employed the same numerical settings as the RAT to ensure consistency. Numerical simulations are carried out at a tip Mach number of 0.52 over a blade pitch angle range from 7° to 15°. The simulation outcomes are then compared with experimental measurements for validation [32]. As shown in Figure 7, the computed torque values increase with the pitch angle and exhibit strong agreement with the experimental data across the tested range, thereby confirming the reliability of the simulation approach employed in this study.

3. Analysis of the Influence of Different Blade Tip Configurations on the Aerodynamic Performance of the RAT

3.1. Aerodynamic Performance of the Baseline Configuration

The curves of the power and thrust coefficients of the RAT as functions of the tip speed ratio (TSR) reflect its energy extraction capability and thrust loading characteristics, and are among the key indicators for evaluating turbine performance. The power coefficient, thrust coefficient, and tip speed ratio are defined as follows:
C P = P 1 2 ρ A V 0 3
C T = T 1 2 ρ A V 0 2
TSR = ω R V 0
where P is the turbine shaft power, T is the axial thrust, ρ is the air density, A is the swept area of the rotor, ω is the rotation speed, R is the turbine radius, and V 0 is the free flow speed.
To comprehensively evaluate the subsequent three configurations in terms of the power output and load control, this paper defines the power–thrust net gain coefficient as follows:
η n e t = ( Δ C P C P 0 Δ C T C T 0 ) × 100 %
In the equation, Δ C P and Δ C T represent the incremental power coefficient and thrust coefficient of each configuration relative to the baseline configuration, respectively, whereas C P 0 and C T 0 denote the power coefficient and thrust coefficient of the baseline configuration; Δ C P / C P 0 represents the relative change in the power coefficient, indicating the performance enhancement; Δ C T / C T 0 represents the change in thrust load, which is considered the cost of the aerodynamic performance. This coefficient quantifies the net benefit of the power gain relative to the thrust cost. A value of η n e t > 0 indicates that the power improvement outweighs the increase in thrust, implying better aerodynamic efficiency. Conversely, η n e t < 0 suggests that the increase in thrust exceeds the gain in power, resulting in a lower overall aerodynamic benefit.
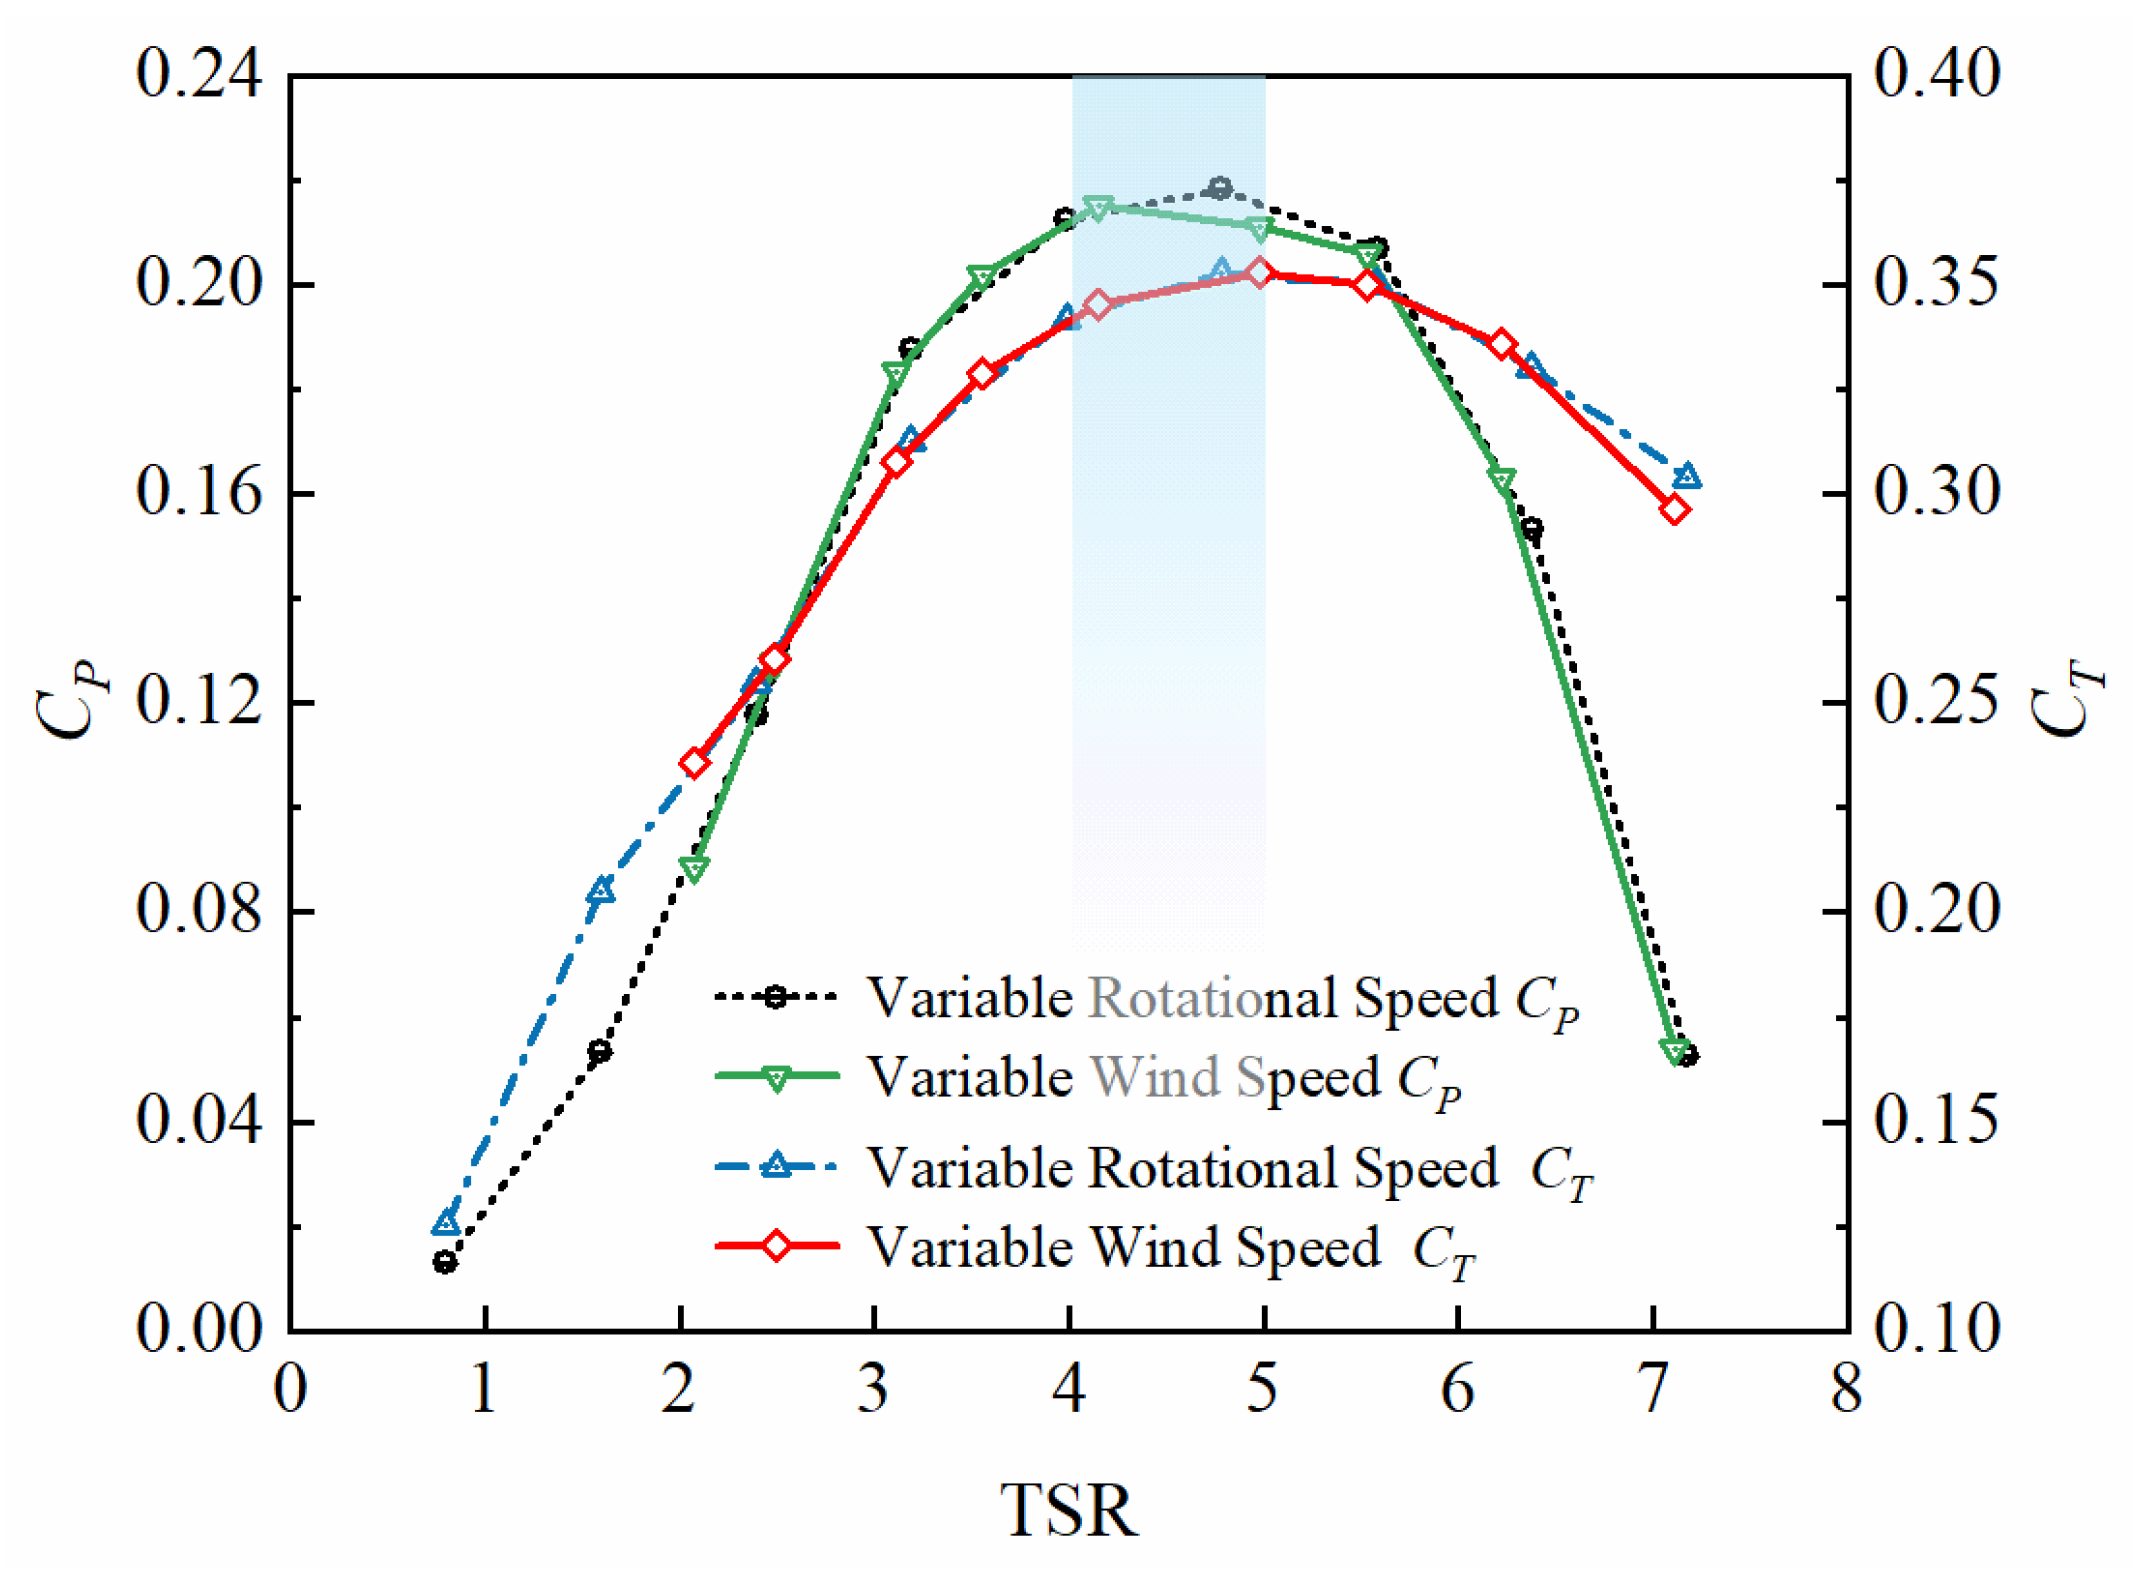
As shown in Equation (3), changes in either the velocity or the rotational speed clearly alter the TSR. In numerical simulations, two common methods are employed to achieve different TSRs. One involves maintaining a constant rotational speed while varying the freestream velocity, and the other involves holding the freestream velocity constant while adjusting the rotational speed. Both approaches are utilized in this study. In the first set of simulations, the rotational speed is fixed at 5200 r/min, with TSR variation achieved by modifying the freestream velocity. In the second set, the freestream velocity is fixed at 70 m/s, and the TSR is adjusted by varying the rotational speed. The corresponding power and thrust coefficient curves are presented in Figure 8.
As shown in Figure 8, the power and thrust coefficient curves obtained via the two approaches exhibit no significant differences, indicating that either method is essentially equivalent for simulating different TSRs. Under the same pitch angle, the power coefficient initially increases and then decreases with increasing TSR values. The thrust coefficient shows a similar peak trend. This suggests that the RAT achieves its maximum wind energy conversion efficiency at a specific tip speed ratio, where the power coefficient reaches its peak value.
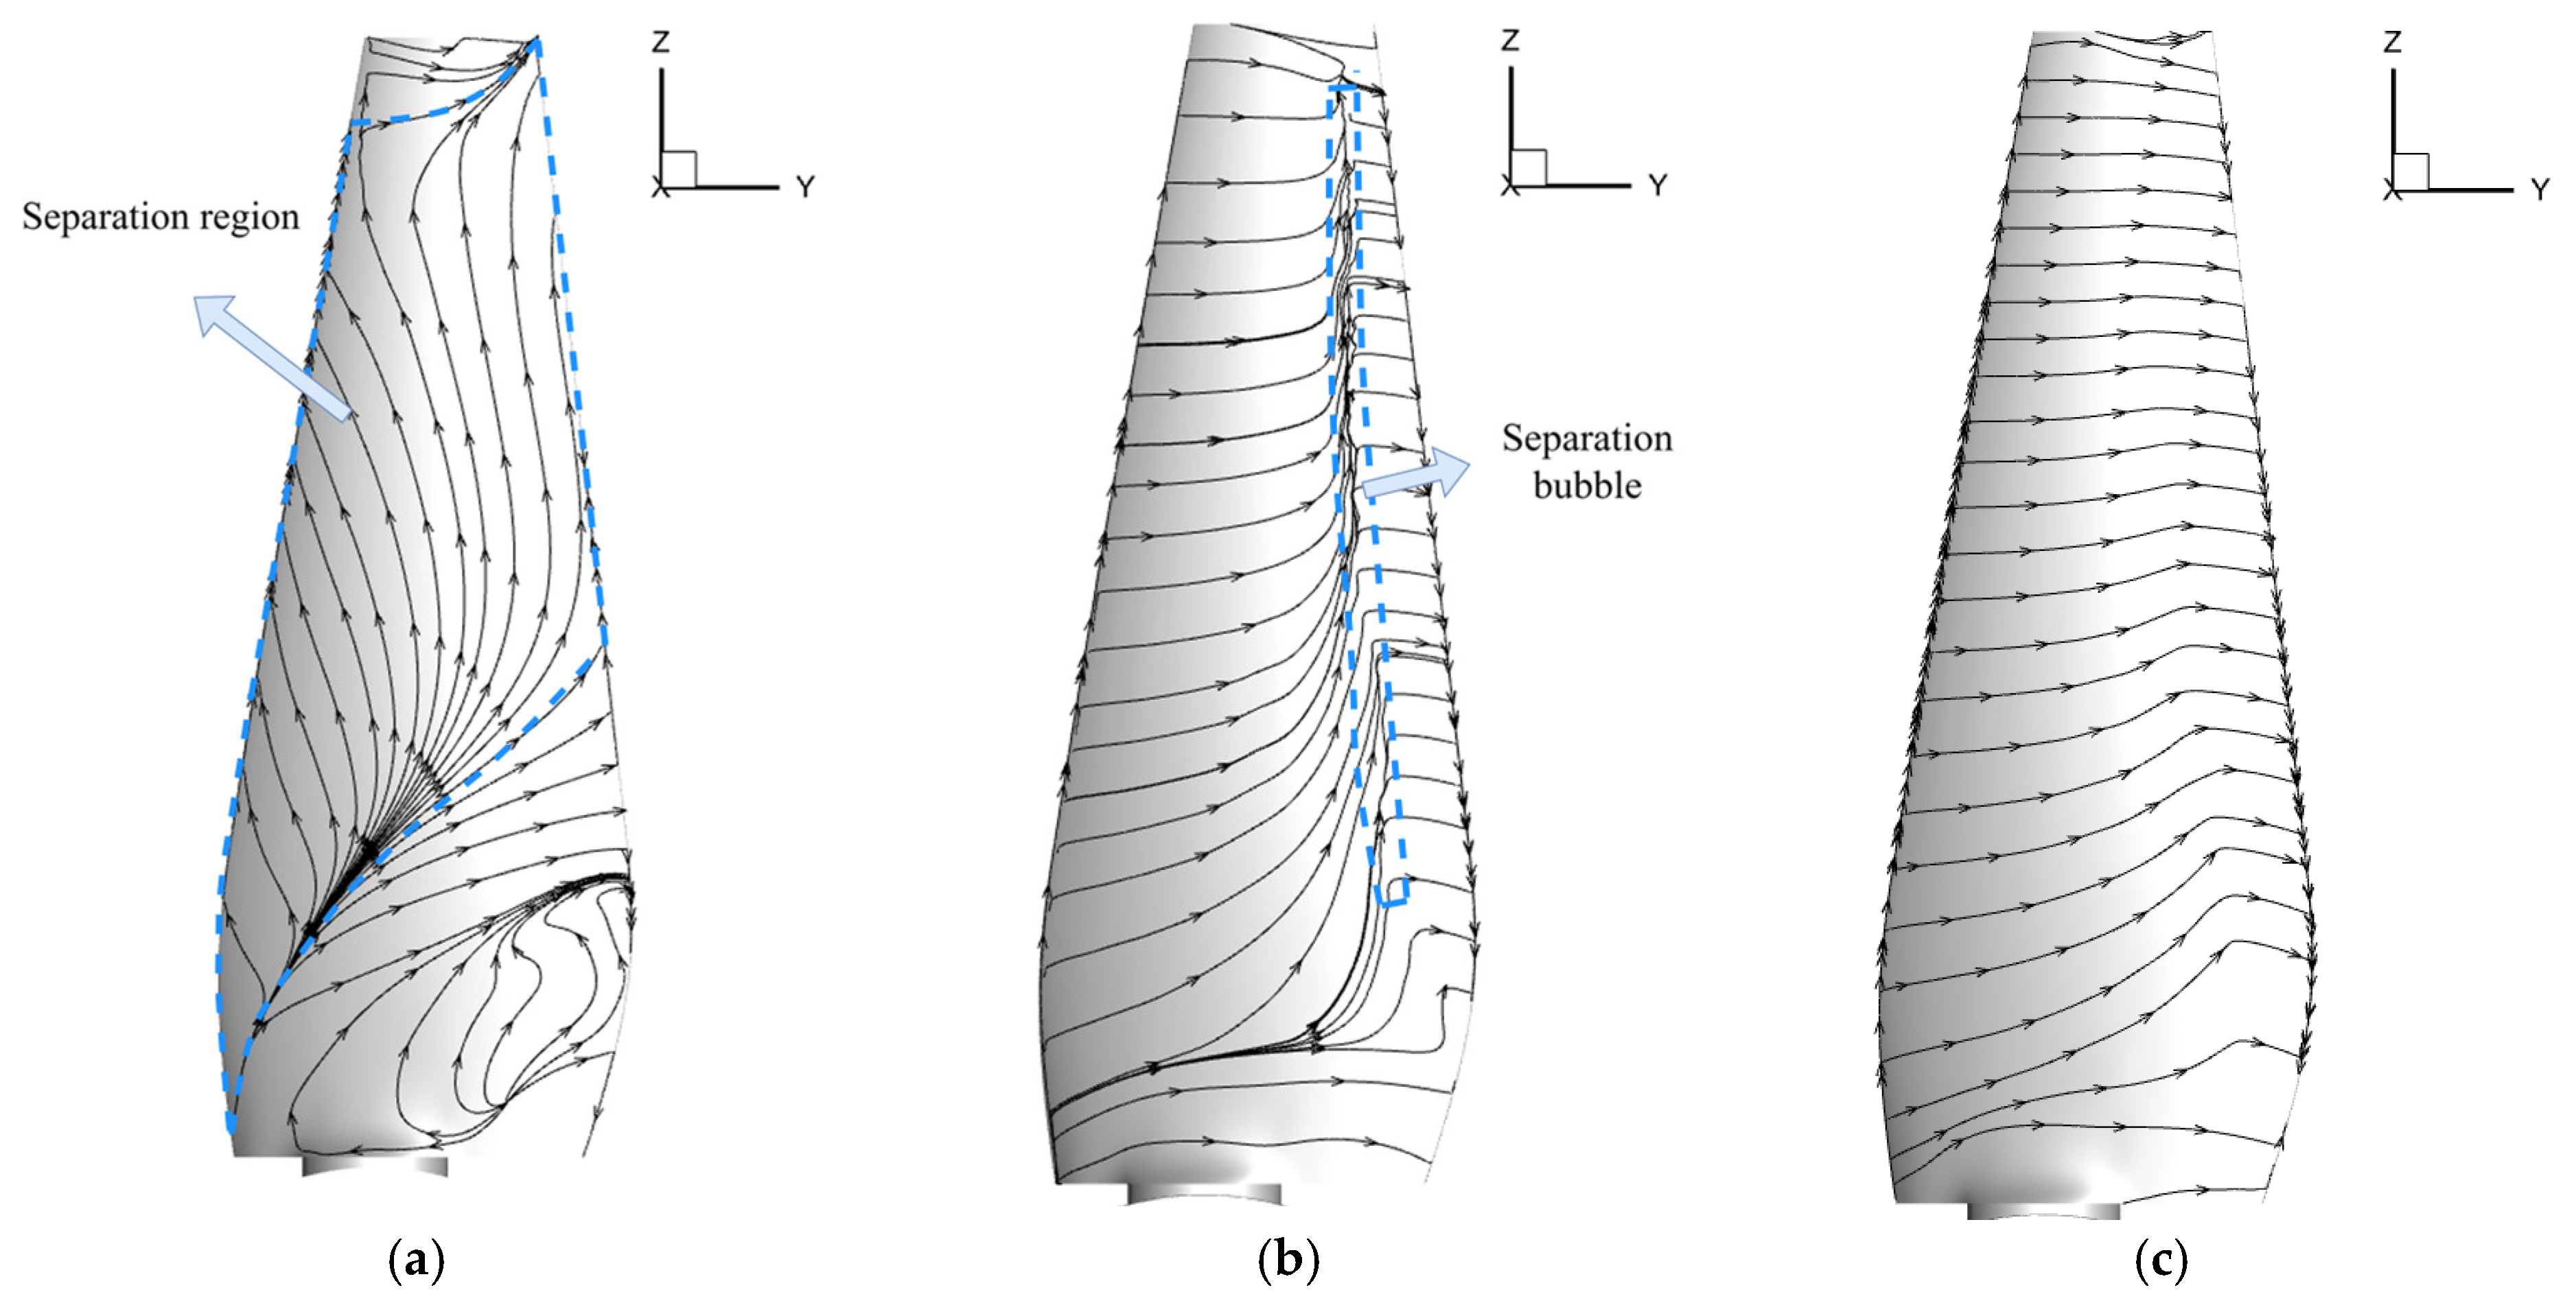
Three typical TSR values—representing low, medium, and high conditions—are selected to analyze the surface streamlines on the blade’s suction surface, as illustrated in Figure 9. At a low TSR of 2.39, the streamlines predominantly move spanwise toward the leading edge and tip, indicating significant flow separation across the blade surface. As the TSR increases to a medium level of 4.78, the extent of flow separation decreases considerably, and most of the surface experiences attached flow. At a high TSR of 7.17, the suction side of the blade is almost entirely dominated by attached flow, with negligible separation observed. These flow behavior transitions are closely linked to variations in the angle of attack; lower TSRs correspond to higher angles of attack and separated flow, while higher TSRs result in lower angles of attack and more stable attached flow. Effective wind energy capture is achieved only within an optimal TSR range, where aerodynamic conditions allow the blade to operate efficiently. To thoroughly examine the influence of blade tip modifications on RAT aerodynamic performance, subsequent sections analyze the trends in power and thrust coefficients over a wide spectrum of TSRs.

3.2. Aerodynamic Performance of the Tip Plate Configuration

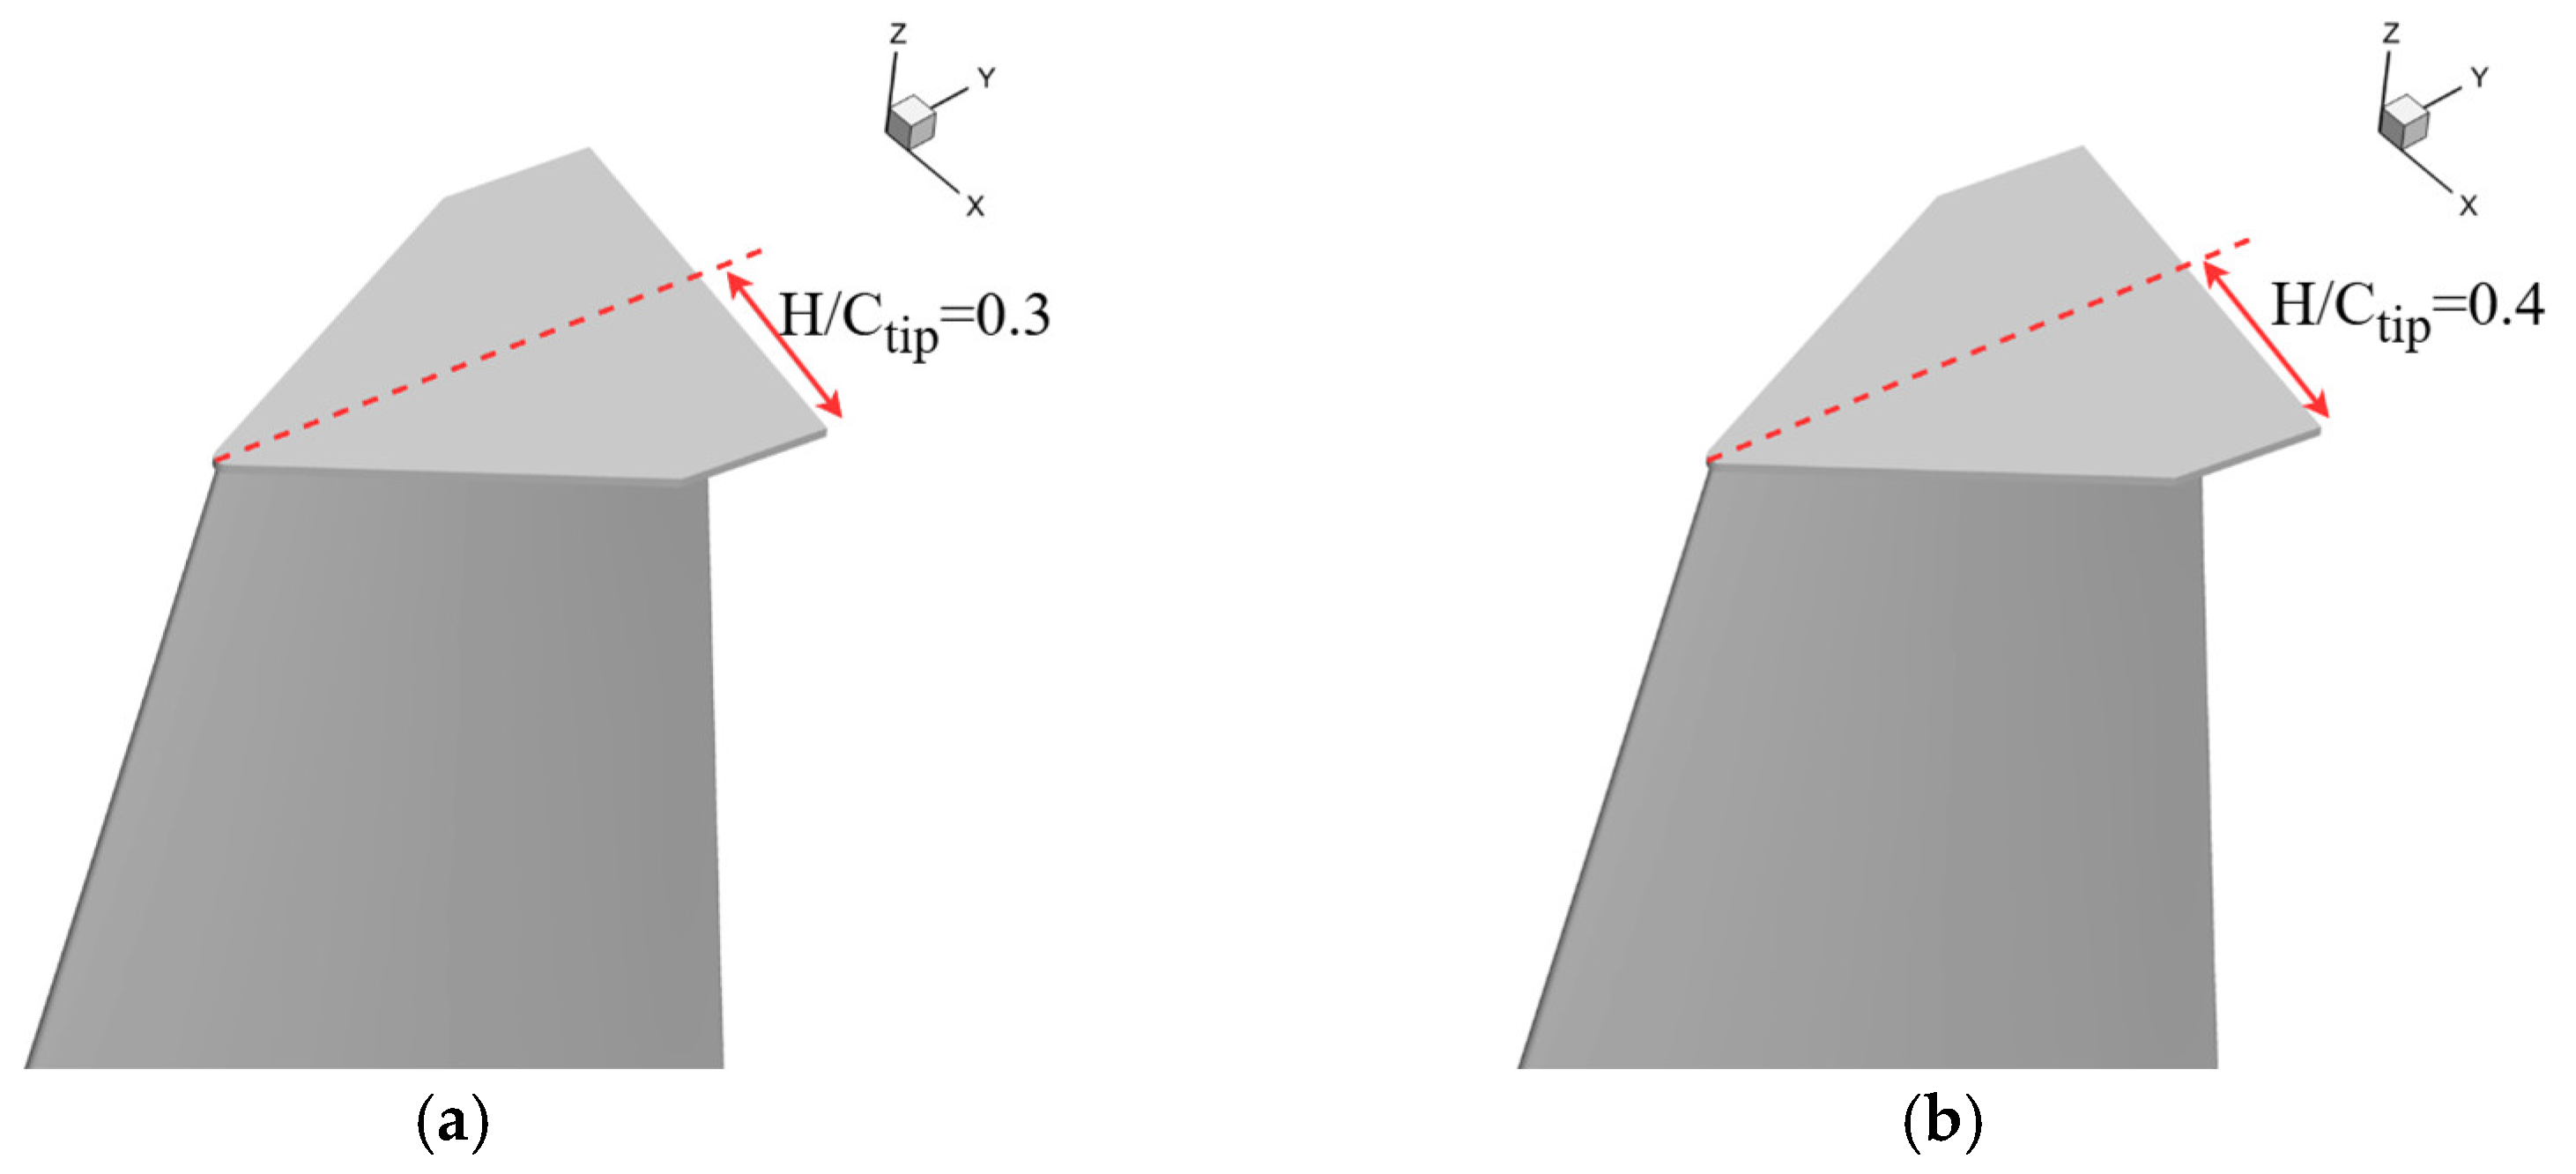
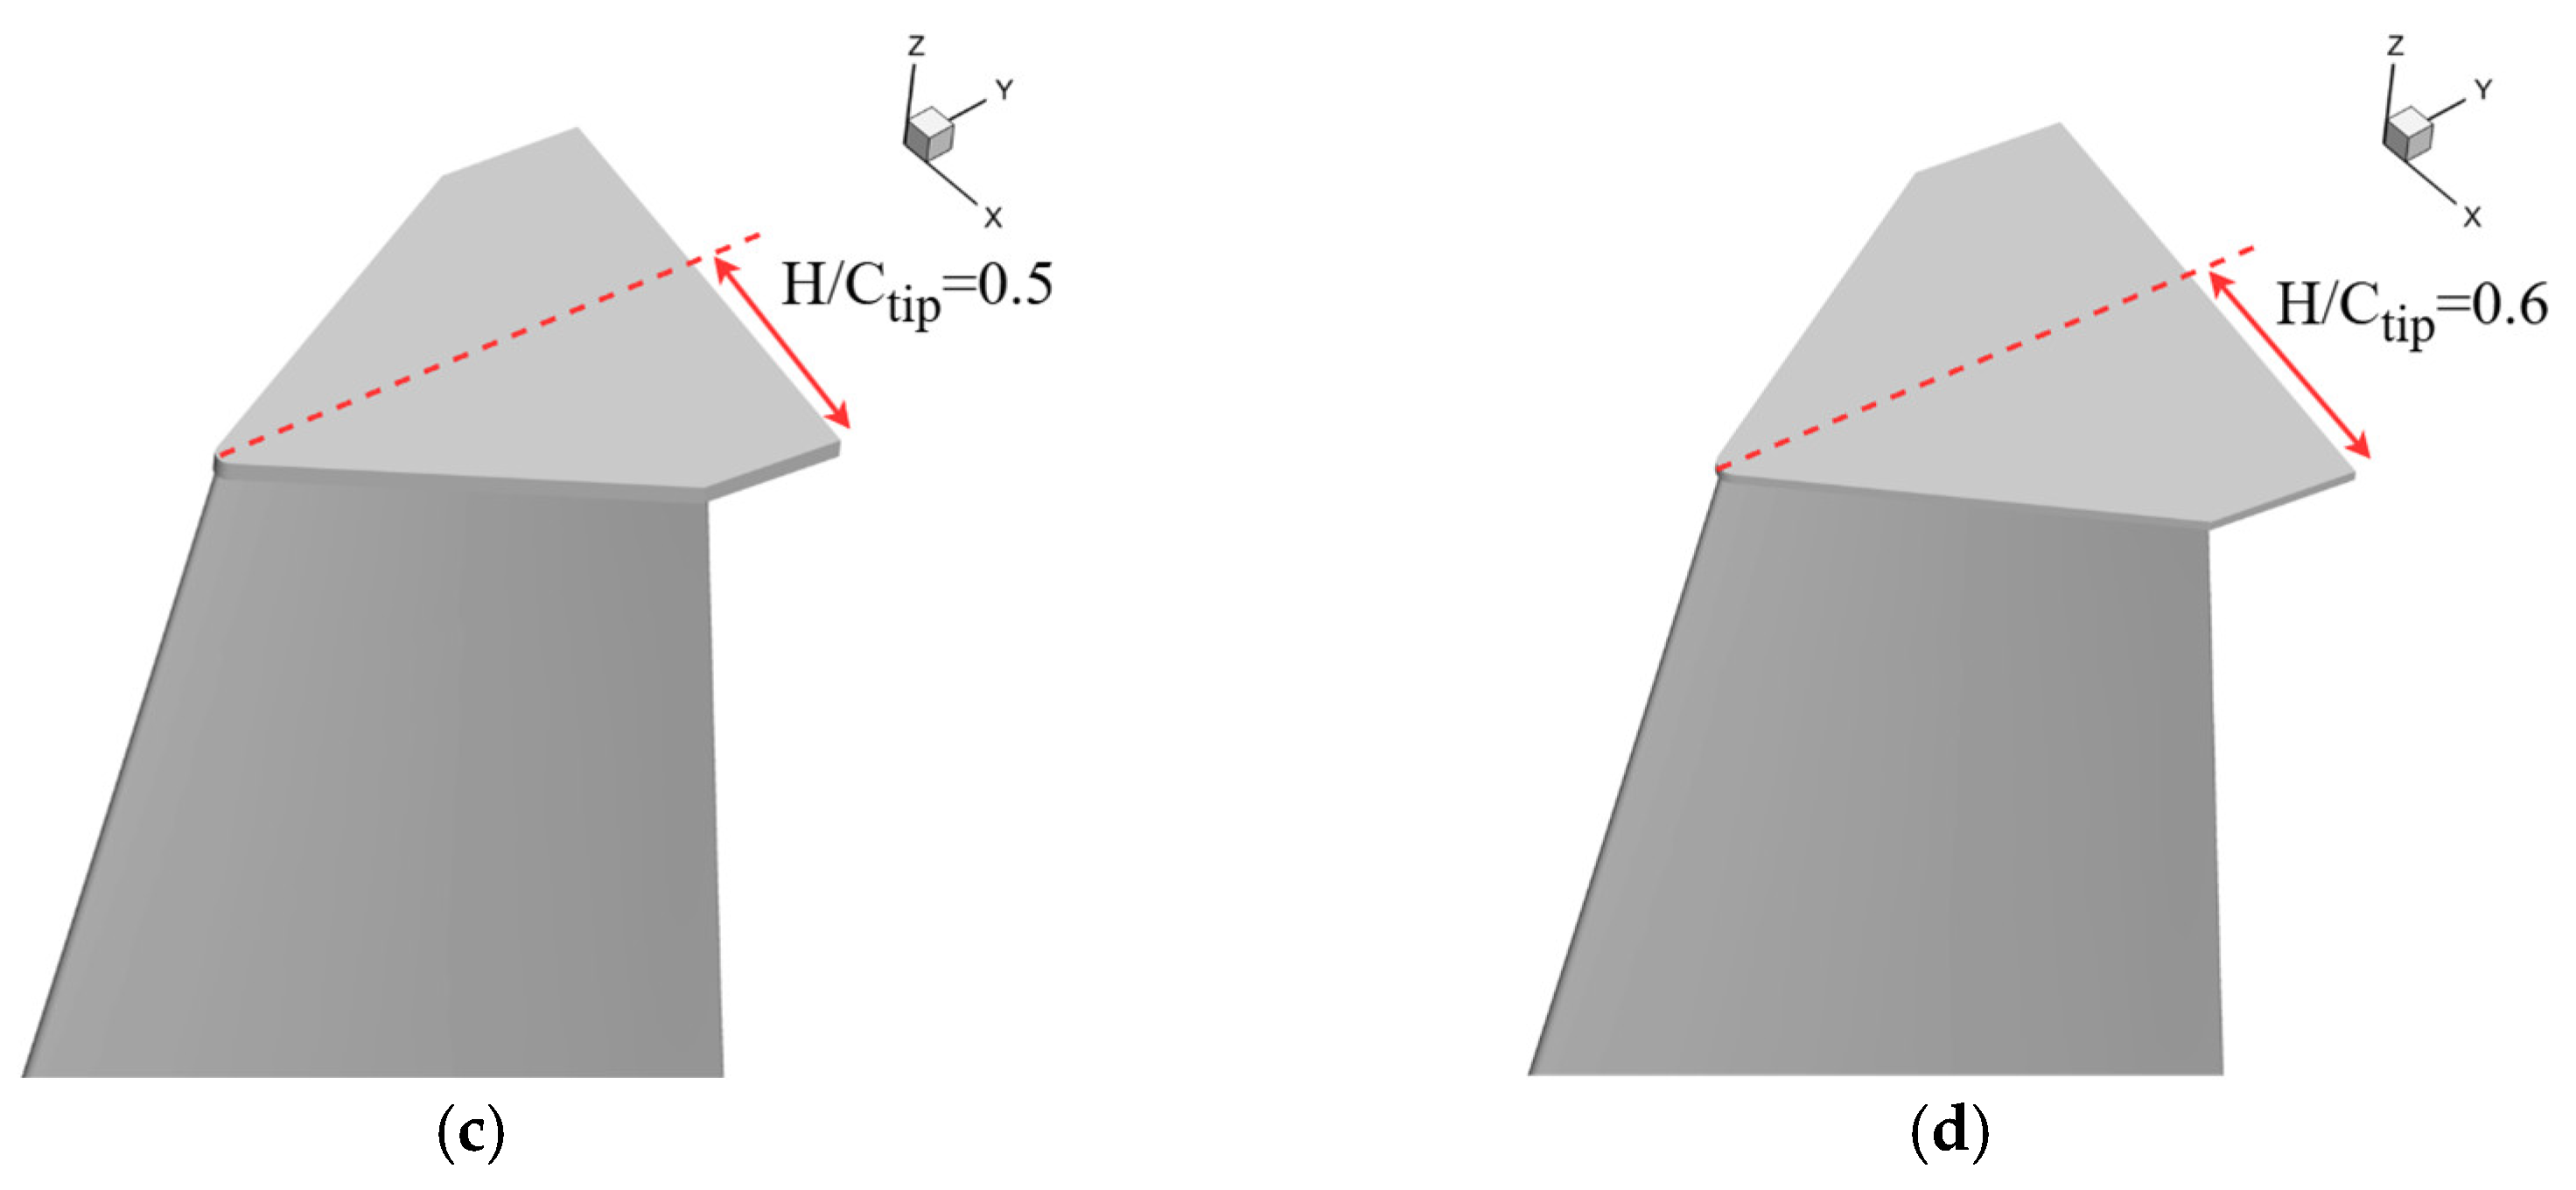
The tip plate configuration incorporates a flat plate at the blade tip, similar to a wingtip fence, with a taper ratio of 0.3 and a thickness of 3 mm. Among its geometric features, the tip plate height is generally regarded as one of the key parameters influencing tip vortex suppression and overall aerodynamic efficiency. To evaluate the influence of the tip plate height on the aerodynamic performance of the turbine, four height ratios were selected for an analysis, defined as the ratio of tip plate height H to tip chord length Ctip, i.e., H/Ctip =0.3,0.4,0.5, and 0.6. For all these cases, the taper ratio and thickness of the tip plate were kept constant. The corresponding geometries are shown in the Figure 10. It should be noted that the objective of this study is not to optimize the geometry of the tip plate but rather to investigate the effect of height variation on the aerodynamic characteristics of the blade.
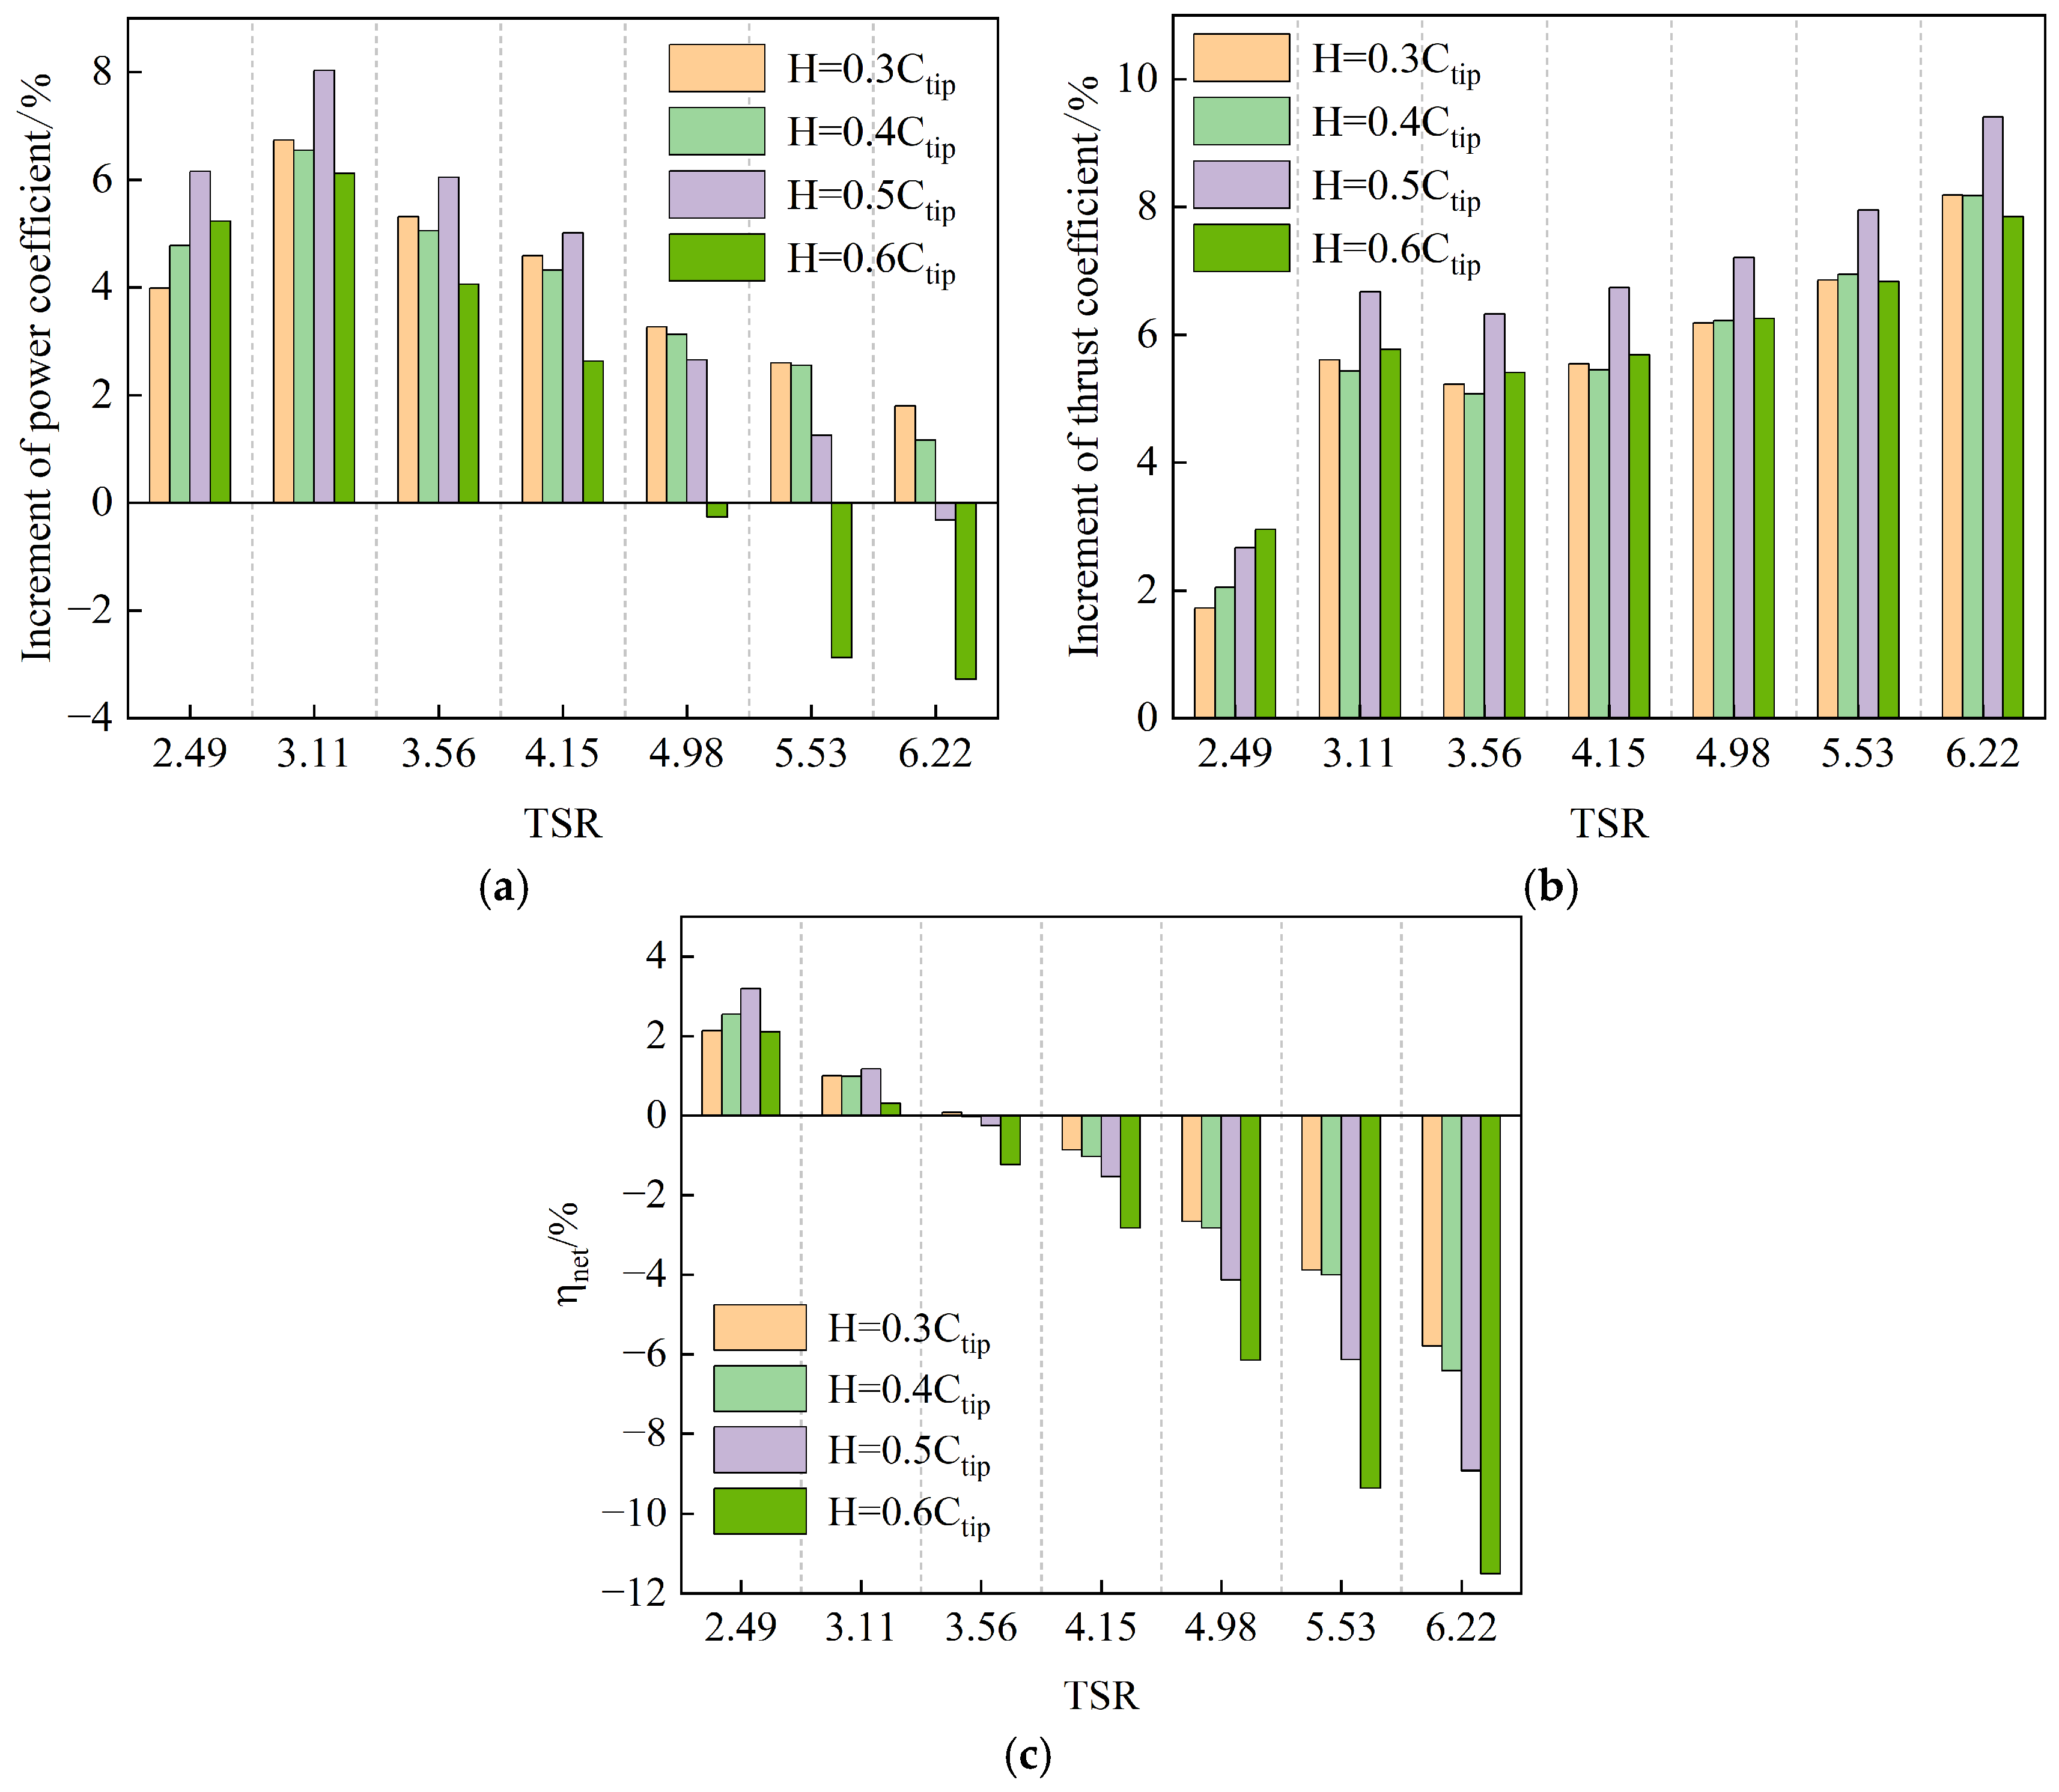
Based on numerical simulations, Figure 11 presents the specific increments in the power coefficient, thrust coefficient, and power–thrust net gain coefficient of the tip plate configurations relative to the baseline configuration at various TSRs. As shown in Figure 11a, the tip plate can enhance the power output under most simulated conditions, with the most pronounced improvement occurring at a tip plate height of 0.5Ctip, where the power coefficient increases by 8.03% at TSR = 3.11. However, as illustrated in Figure 11b, the introduction of the tip plate leads to a significant increase in thrust load across all tip speed ratios. In terms of efficiency, Figure 11c shows that positive gains are observed only at low TSRs (TSR = 2.49 and 3.11), while at medium and high TSRs the efficiency decreases sharply with increasing TSRs and remains negative. Since the normal operating range of the RAT lies in the medium to high TSRs, the tip plate configuration with heights between 0.3Ctip and 0.6Ctip fails to achieve a positive net gain coefficient.

3.3. Aerodynamic Performance of the Blade Tip Contraction Configuration

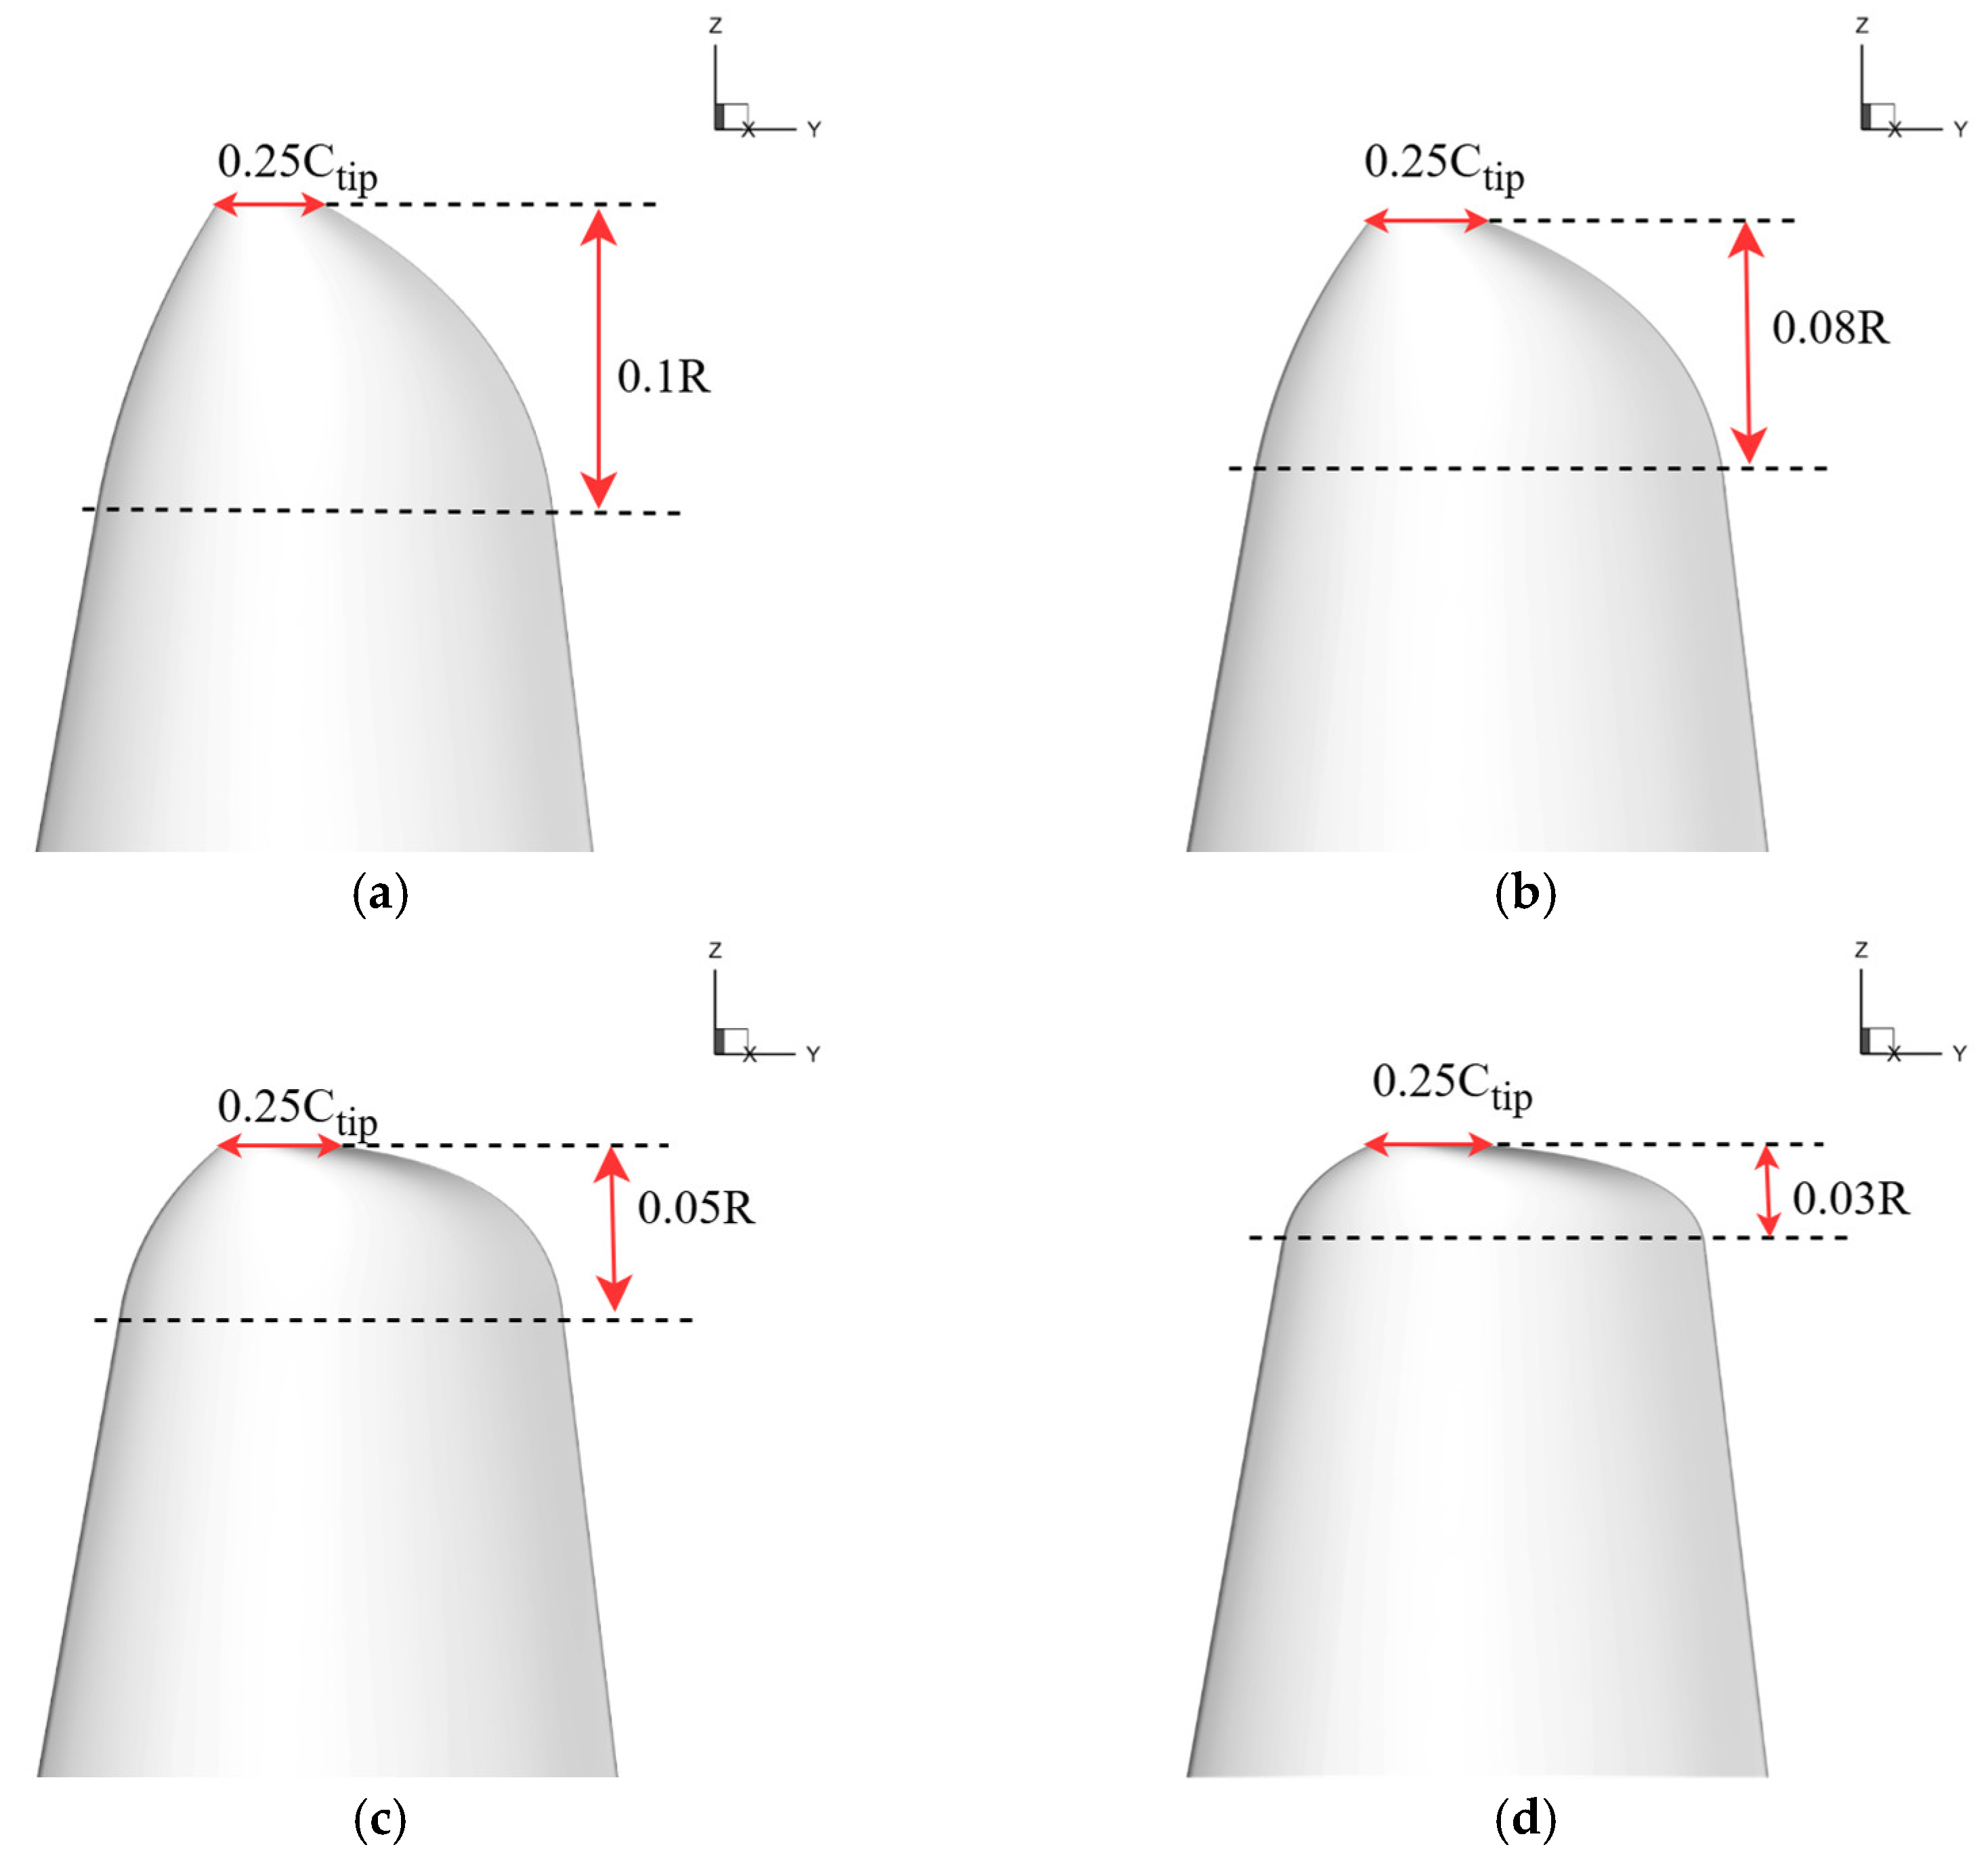
The tip contraction configuration features a reduced chord length at the blade tip, where the tip chord is reduced to 25% of the original chord length with a smooth geometric transition applied along the span. Among the geometric parameters, the contraction position is particularly critical, as its variation exerts a significant influence on the aerodynamic performance of the blade. To assess this effect, a comparative analysis was conducted for four contraction starting positions (r/R = 0.90, 0.92, 0.95, and 0.97). The corresponding geometries are shown in Figure 12.
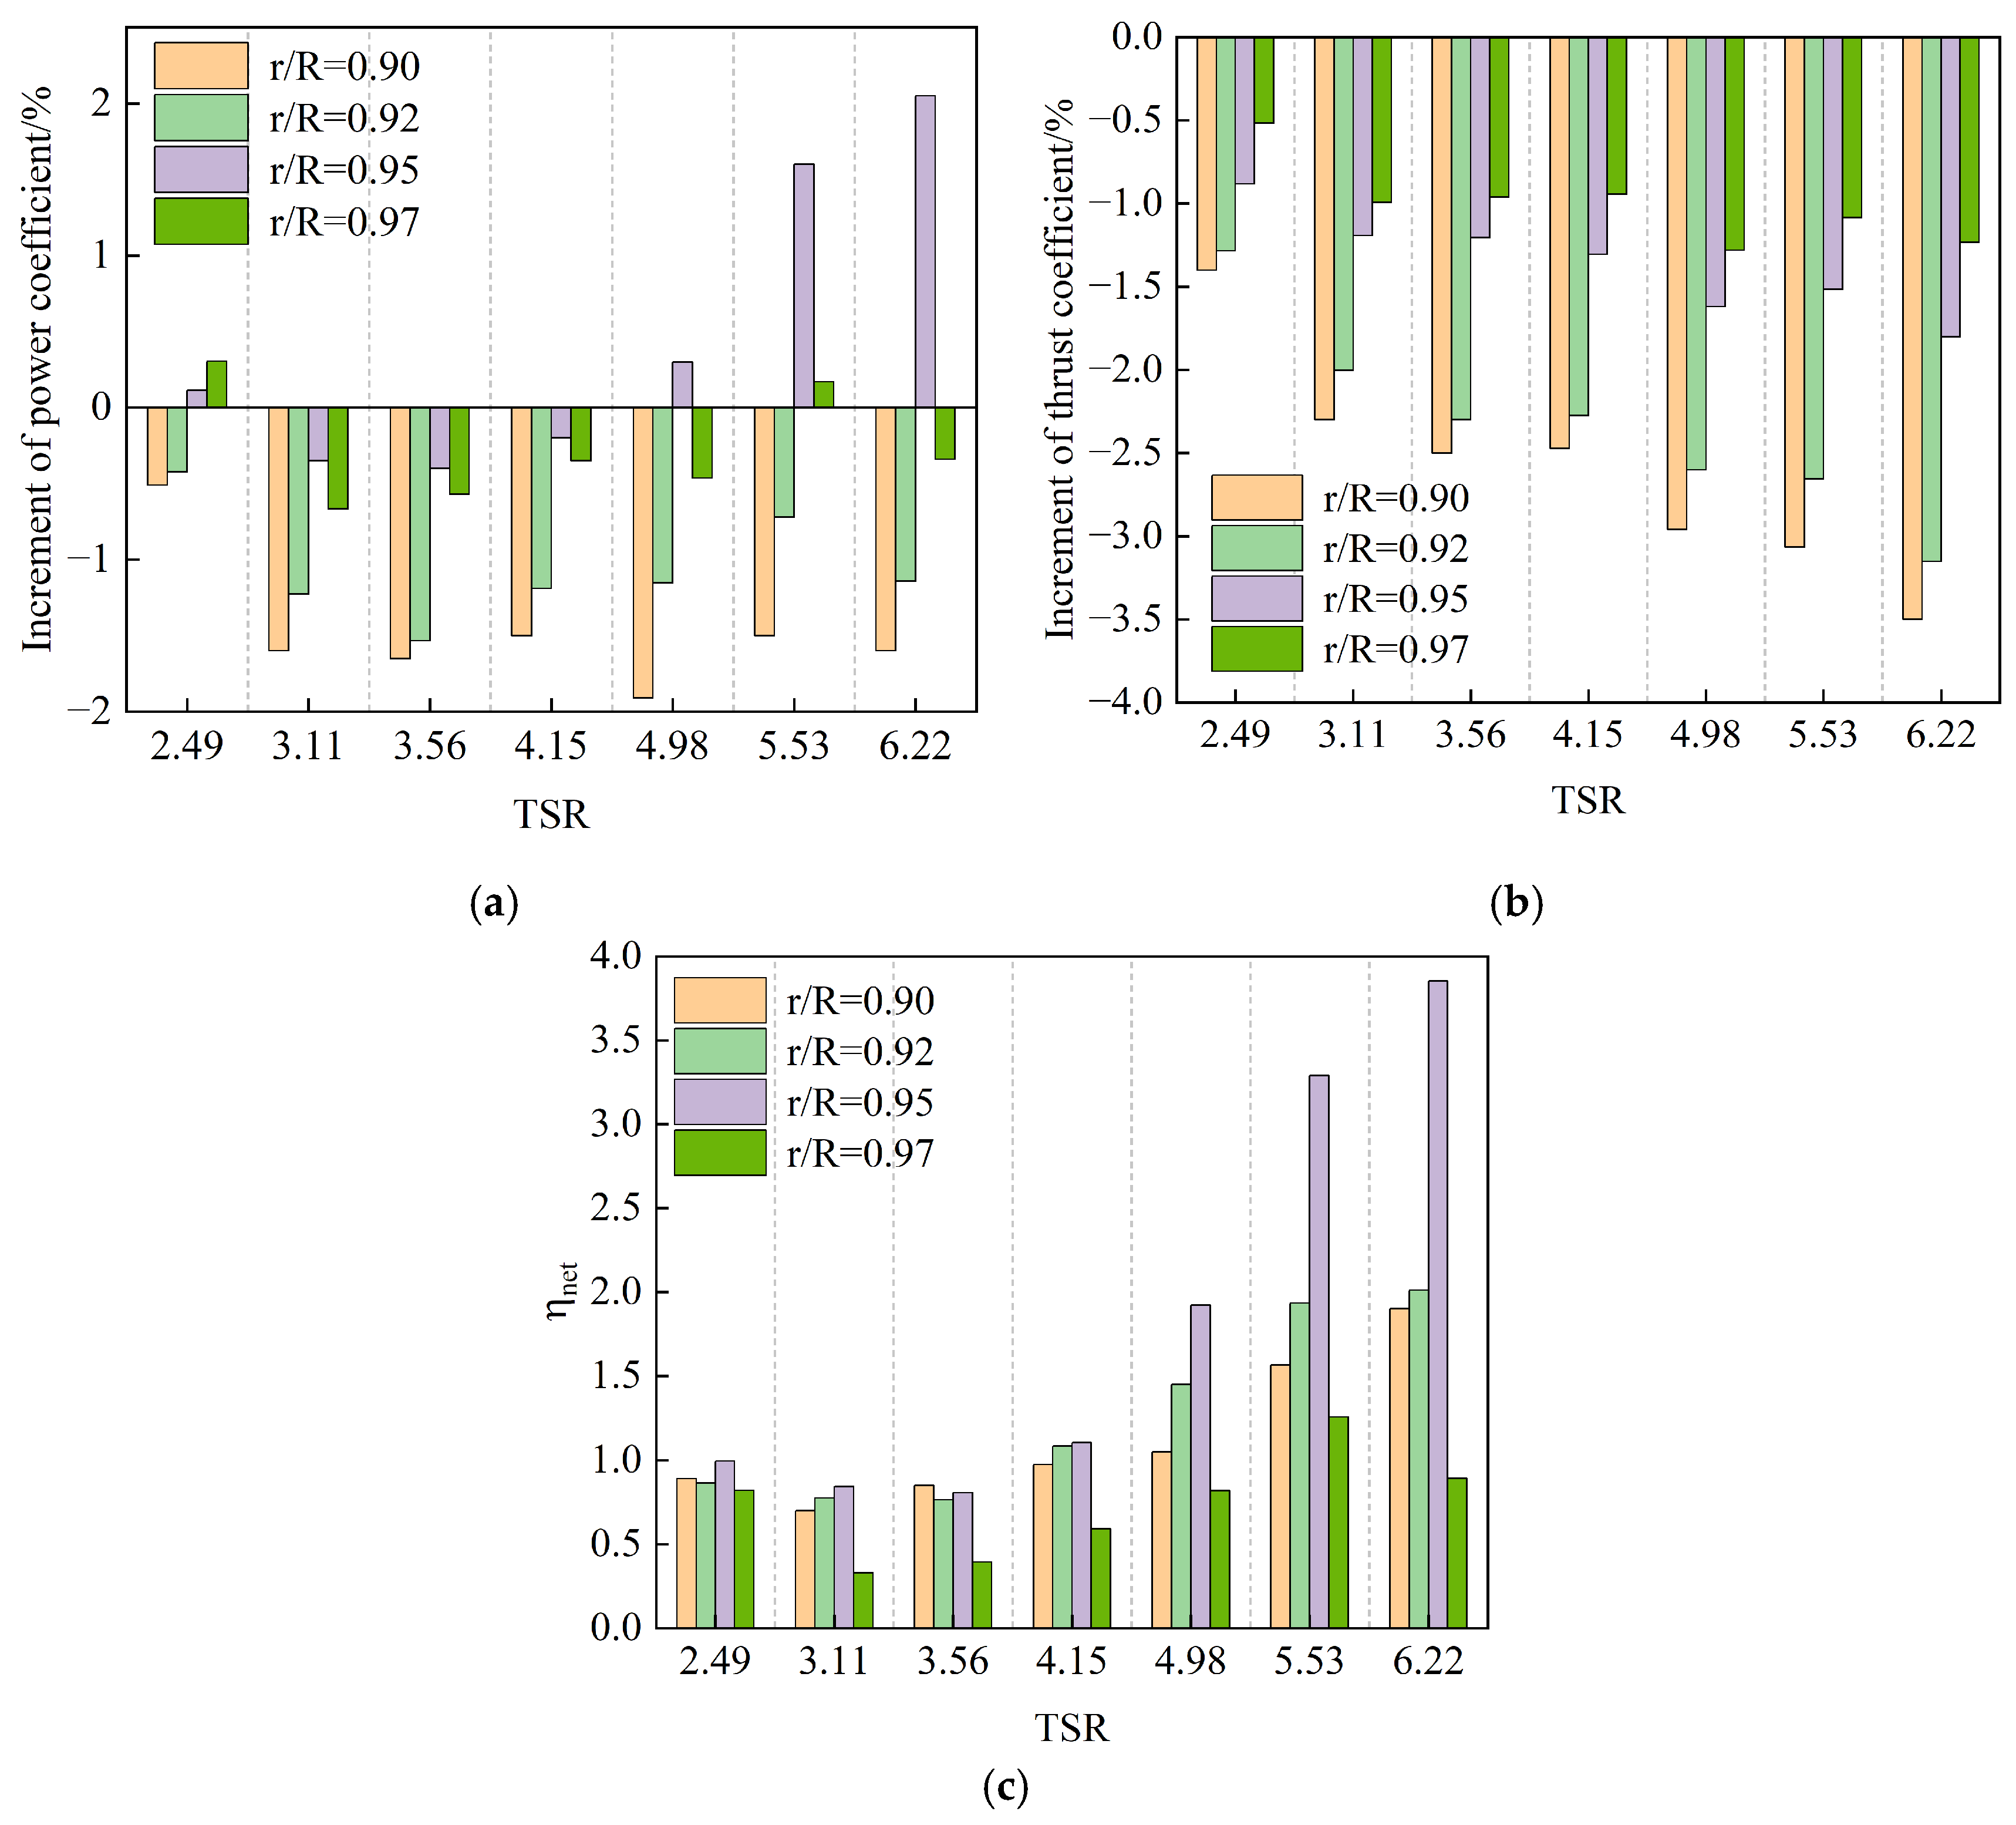
Based on numerical simulations, the specific increments in the power coefficient, thrust coefficient, and power–thrust net gain coefficient of the tip contraction configuration relative to the baseline configuration at various TSRs are shown in Figure 13.
As shown in Figure 13a, tip contraction leads to a reduction in the power coefficient under most operating conditions. However, when the contraction starting position is set to r/R = 0.95, an improvement in the power coefficient can be achieved at high TSRs (TSR > 4.98). Figure 13b indicates that tip contraction effectively reduces the thrust load across all operating conditions. Furthermore, Figure 13c demonstrates that tip contraction consistently yields a positive net gain coefficient in all simulated cases, and the benefit increases significantly with higher TSRs, with the r/R = 0.95 configuration showing the most pronounced effect. Therefore, tip contraction is an effective means of enhancing RAT blade tip performance, and for the turbine simulated in this study, the recommended optimal contraction starting position is r/R = 0.95. The contraction case starting at r/R = 0.95 is hereafter defined as the W2 configuration.
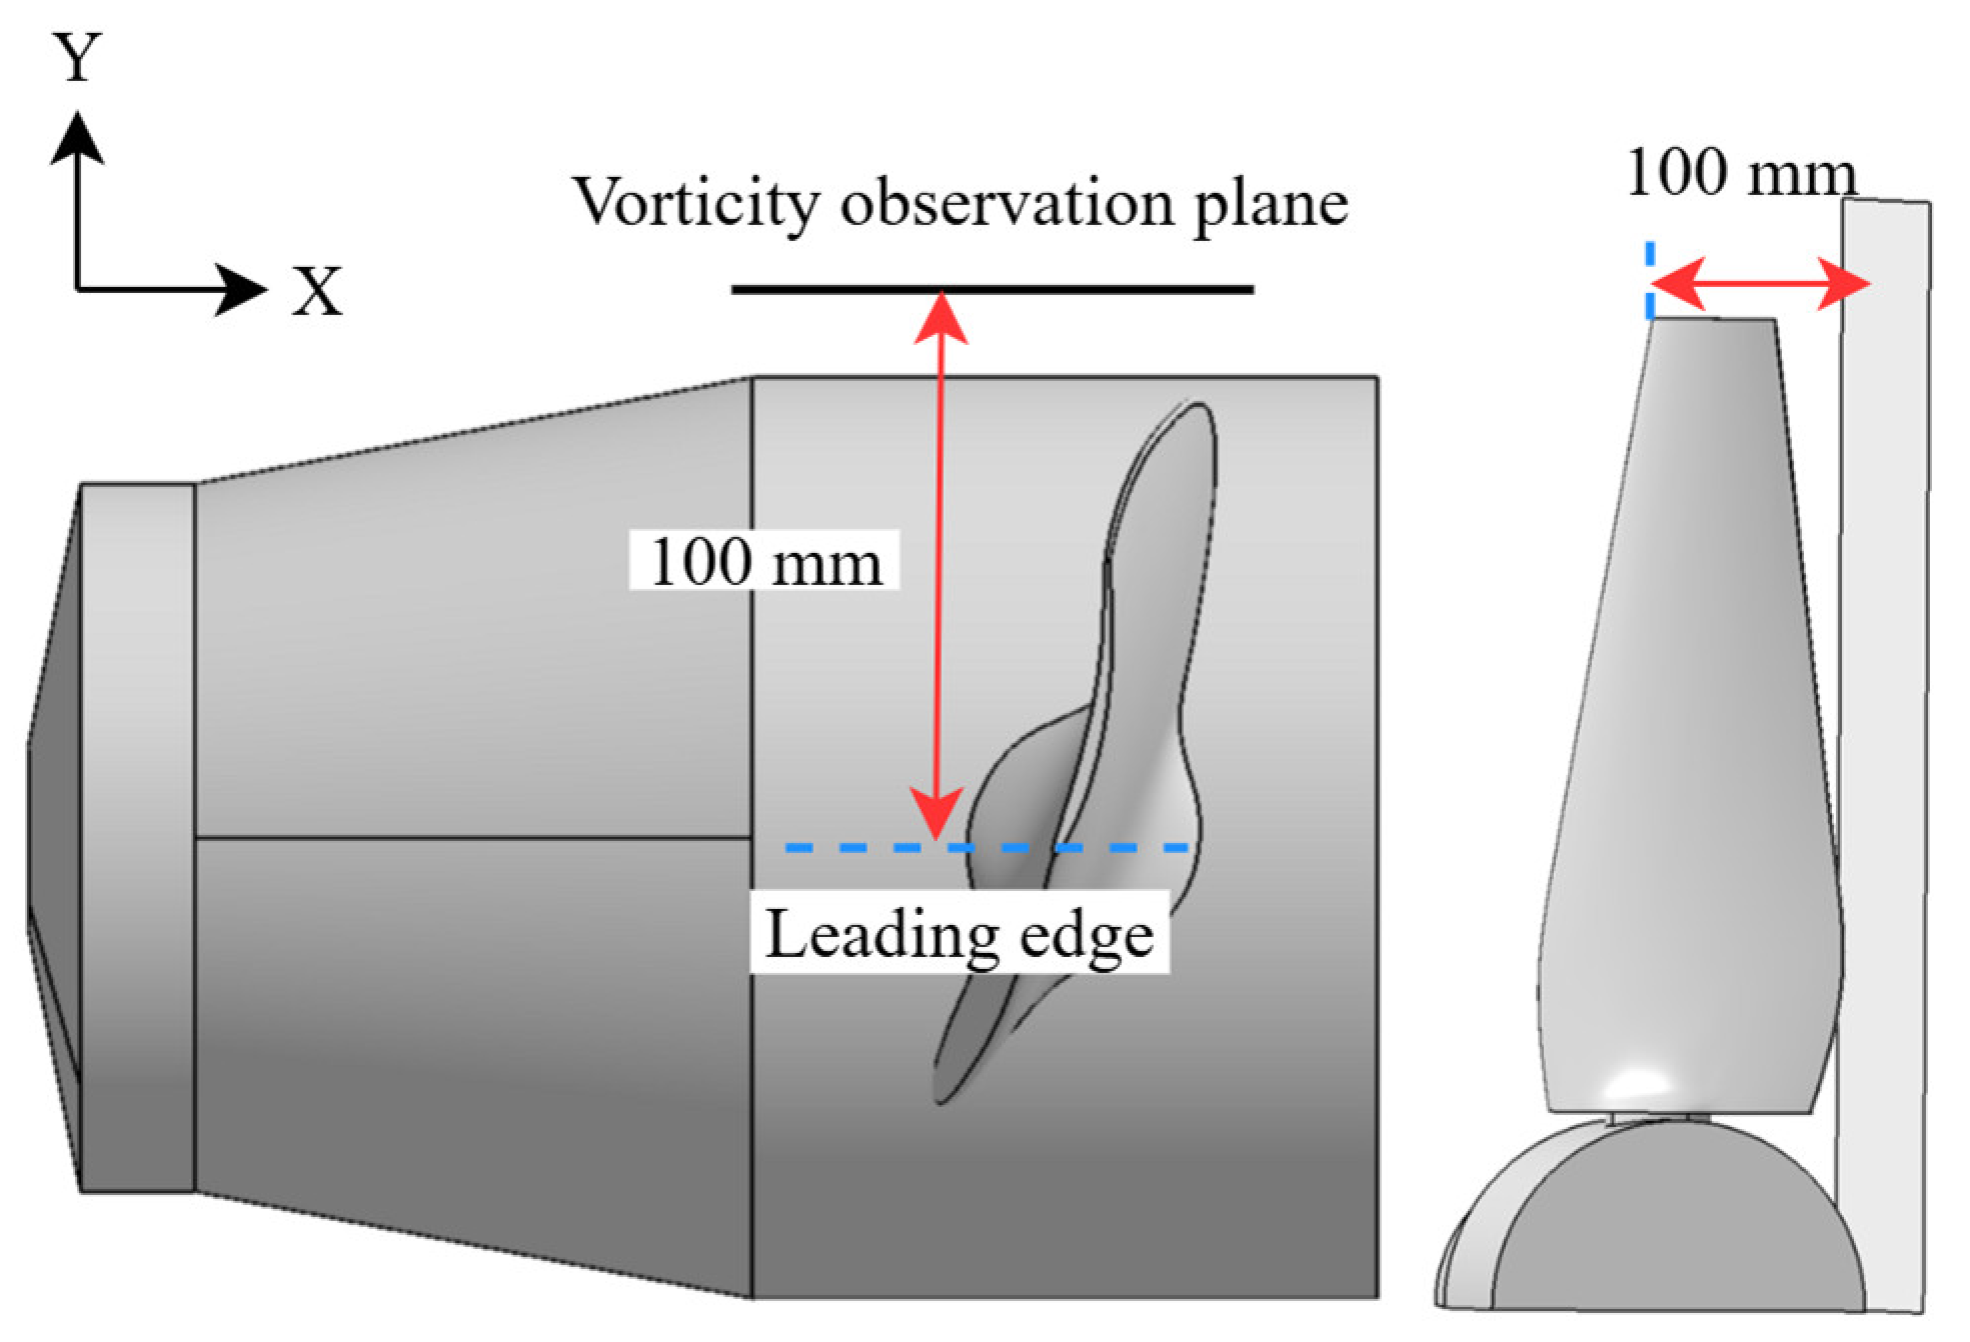
To investigate the flow field characteristics of the tip contraction configuration, the case with a contraction starting position of r/R = 0.95 is selected, and two operating conditions associated with notable power improvements—TSR = 5.53 and TSR = 6.22—are analyzed. A comparative study is conducted between the W2 and baseline configurations, focusing on the vorticity contours of the tip vortex and the corresponding peak vorticity values in the wake region. For this purpose, a vorticity observation plane is positioned 100 mm downstream from the blade’s leading edge in the baseline configuration, as shown in Figure 14. Vorticity ( W ) is calculated using the following expression:
W = × u
where W denotes the vorticity vector and u is the velocity vector.
Figure 15 shows a comparison of the vorticity contours between the baseline and W2 configurations. For the baseline configuration (left), the high-vorticity region (in red) covers a larger area, indicating a stronger tip vortex. In contrast, the W2 configuration (right) results in a significantly smaller high-vorticity region, suggesting that the tip contraction design effectively weakens the strength of the tip vortex and reduces aerodynamic losses in the tip region.
A quantitative assessment of vortex core strengths for both configurations on the observation plane was carried out, with the results presented in Table 2. At TSR = 6.22, the maximum vorticity of the tip vortex in the baseline configuration is 52,804 s−1, while in the W2 configuration it decreases to 43,512 s−1, indicating a 17.6% reduction in vortex intensity. Similarly, at TSR = 5.53, the maximum vorticity in the baseline configuration is 67,156 s−1, which is reduced to 61,008 s−1 in W2, corresponding to a 9.2% decrease.

3.4. Aerodynamic Performance of the Winglet Configuration

Figure 16 illustrates the local geometric configuration of the winglet. As shown in Figure 17, the W3 winglet design is defined by three main shape parameters: the twist angle, cant angle, and winglet height. For this study, the W3 configuration uses a twist angle of 0°, a cant angle of 90°, and a winglet height of 25 mm. The winglet airfoil is a NACA0006 profile, which has a thickness comparable to that of the blade tip section. This design is hereafter referred to as the W3 configuration.
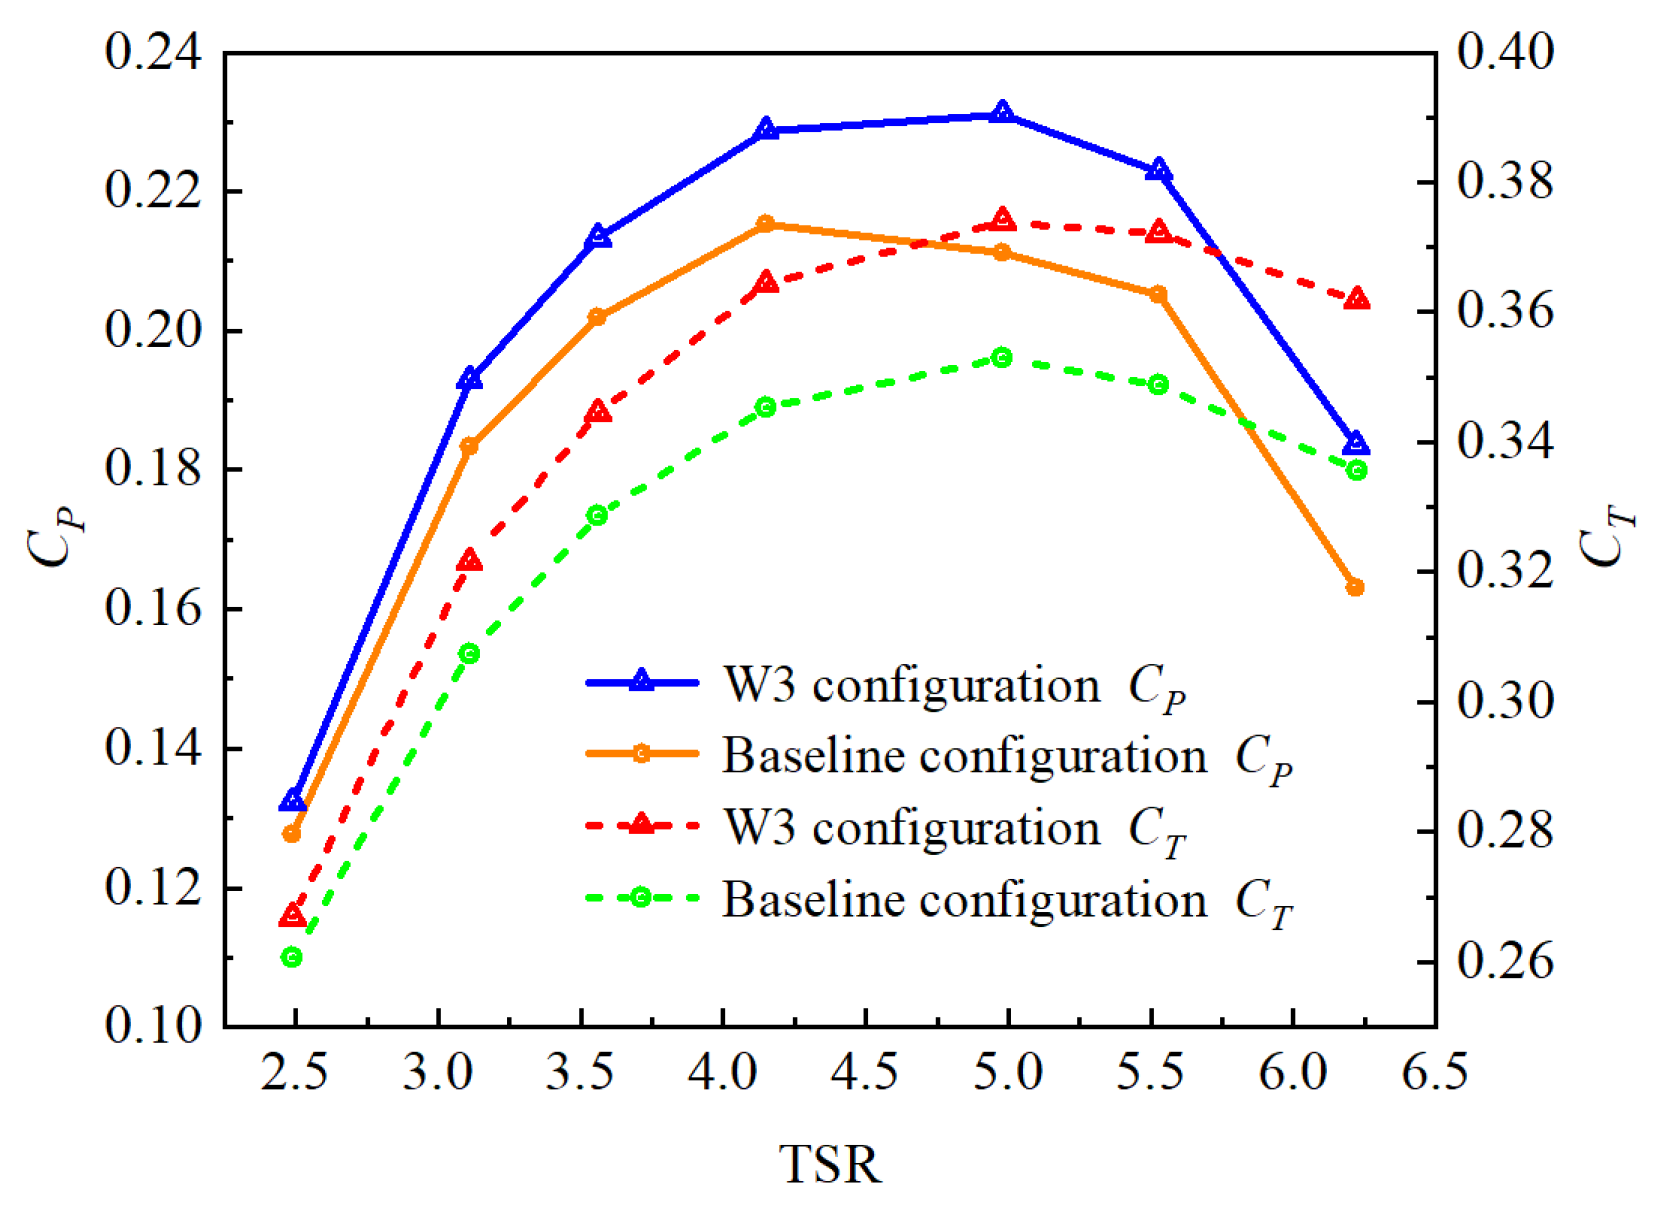
The power and thrust coefficient curves of the W3 and baseline configurations, obtained from numerical simulations, are compared in Figure 18. The specific increments in the power and thrust coefficients of the W3 configuration relative to those of the baseline configuration at various TSRs are shown in Figure 19.
As shown in the figures, the W3 configuration consistently yields a higher power output than the baseline configuration across all TSRs, with the power coefficient increment exhibiting an increasing trend as the TSR increases. Moreover, the thrust coefficient increment of the W3 configuration remains lower than its corresponding power coefficient increment at all TSRs, indicating that it effectively controls the load level while enhancing the power output. In the range of TSR > 4.15, the W3 configuration demonstrates a particularly pronounced power enhancement effect, with improvements in power coefficient exceeding 5% under all evaluated conditions. Notably, at TSR = 6.22, the W3 configuration achieves its peak performance, exhibiting a 7.59% increase in power coefficient relative to the baseline configuration.
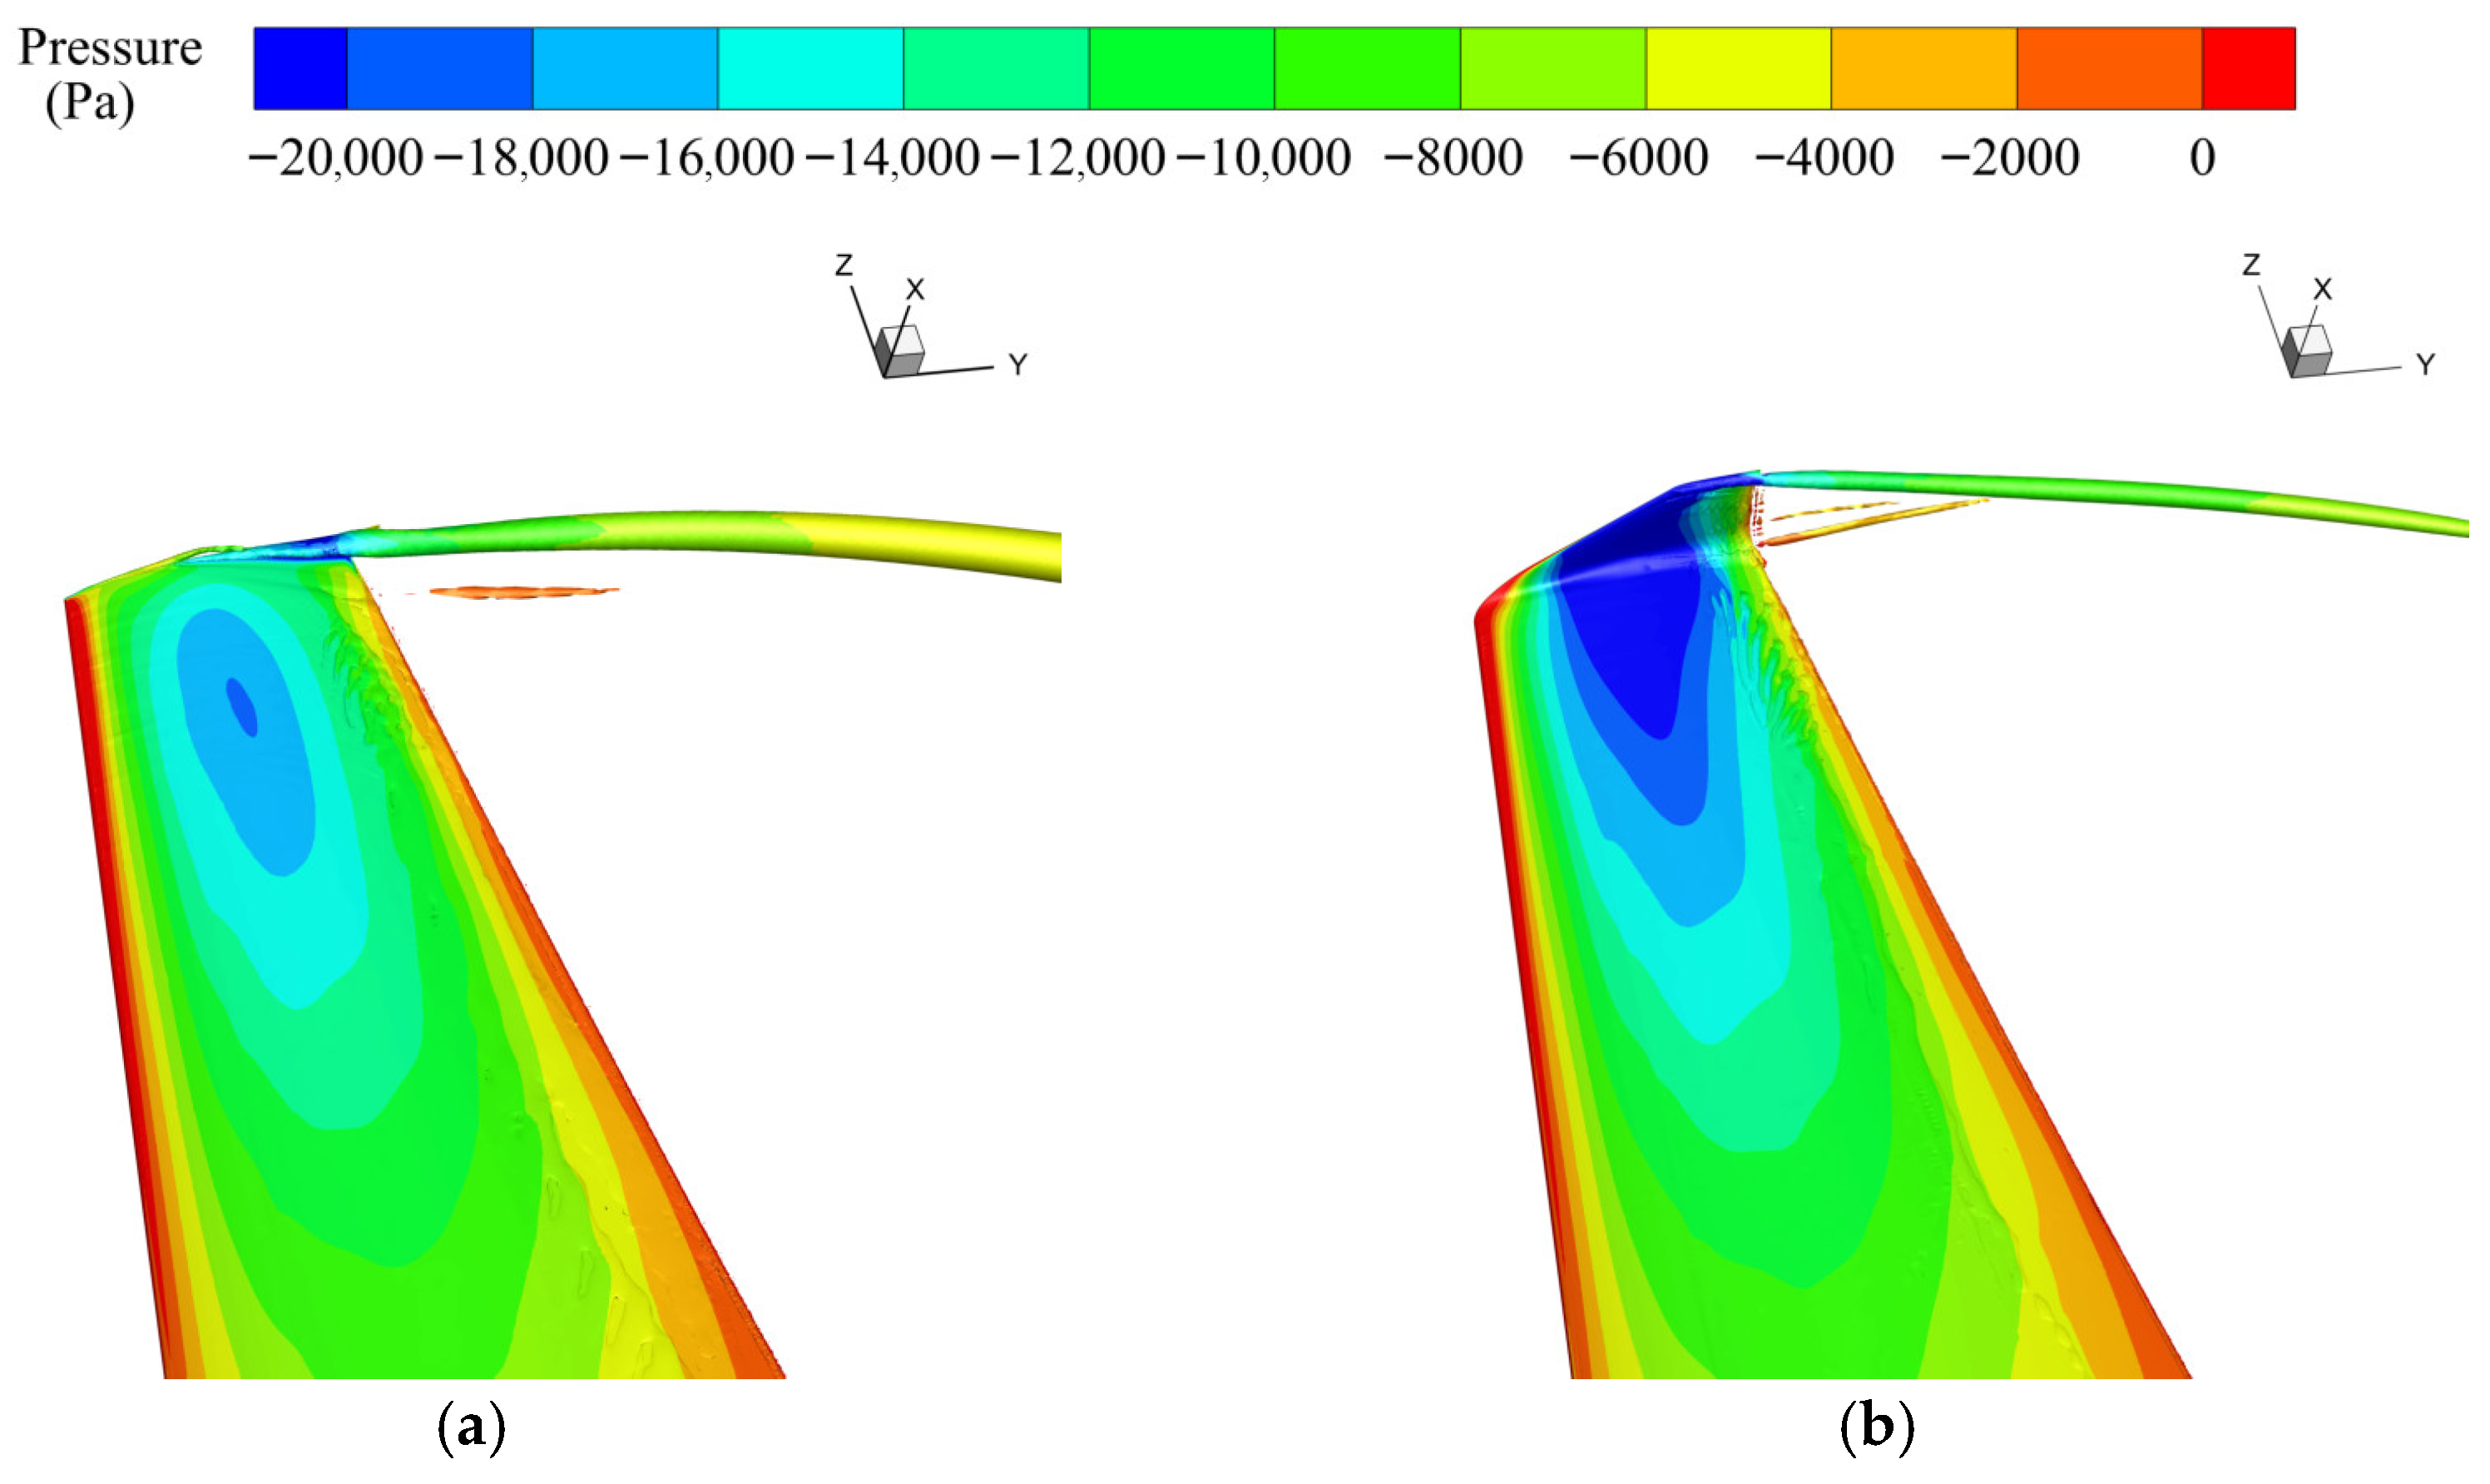
Figure 20 shows the vortex structure identification and analysis in the flow field based on the Q-criterion, aiming to investigate the flow mechanism by which the winglet improves the pressure distribution near the blade tip. In both configurations, the vortices are visualized using an iso-surface of Q = 4 × 10⁸. The iso-surface is colored according to the pressure of the flow field. This figure shows that the winglet significantly alters the spatial distribution of the tip vortex. Compared to the baseline configuration, the vortex shedding location in the W3 configuration is distinctly higher and displaced farther from the blade surface. A larger low-pressure region is formed near the blade tip, which improves the aerodynamic performance of the blade and the flow environment at the blade ends.

3.5. Comprehensive Performances of the Four Configurations

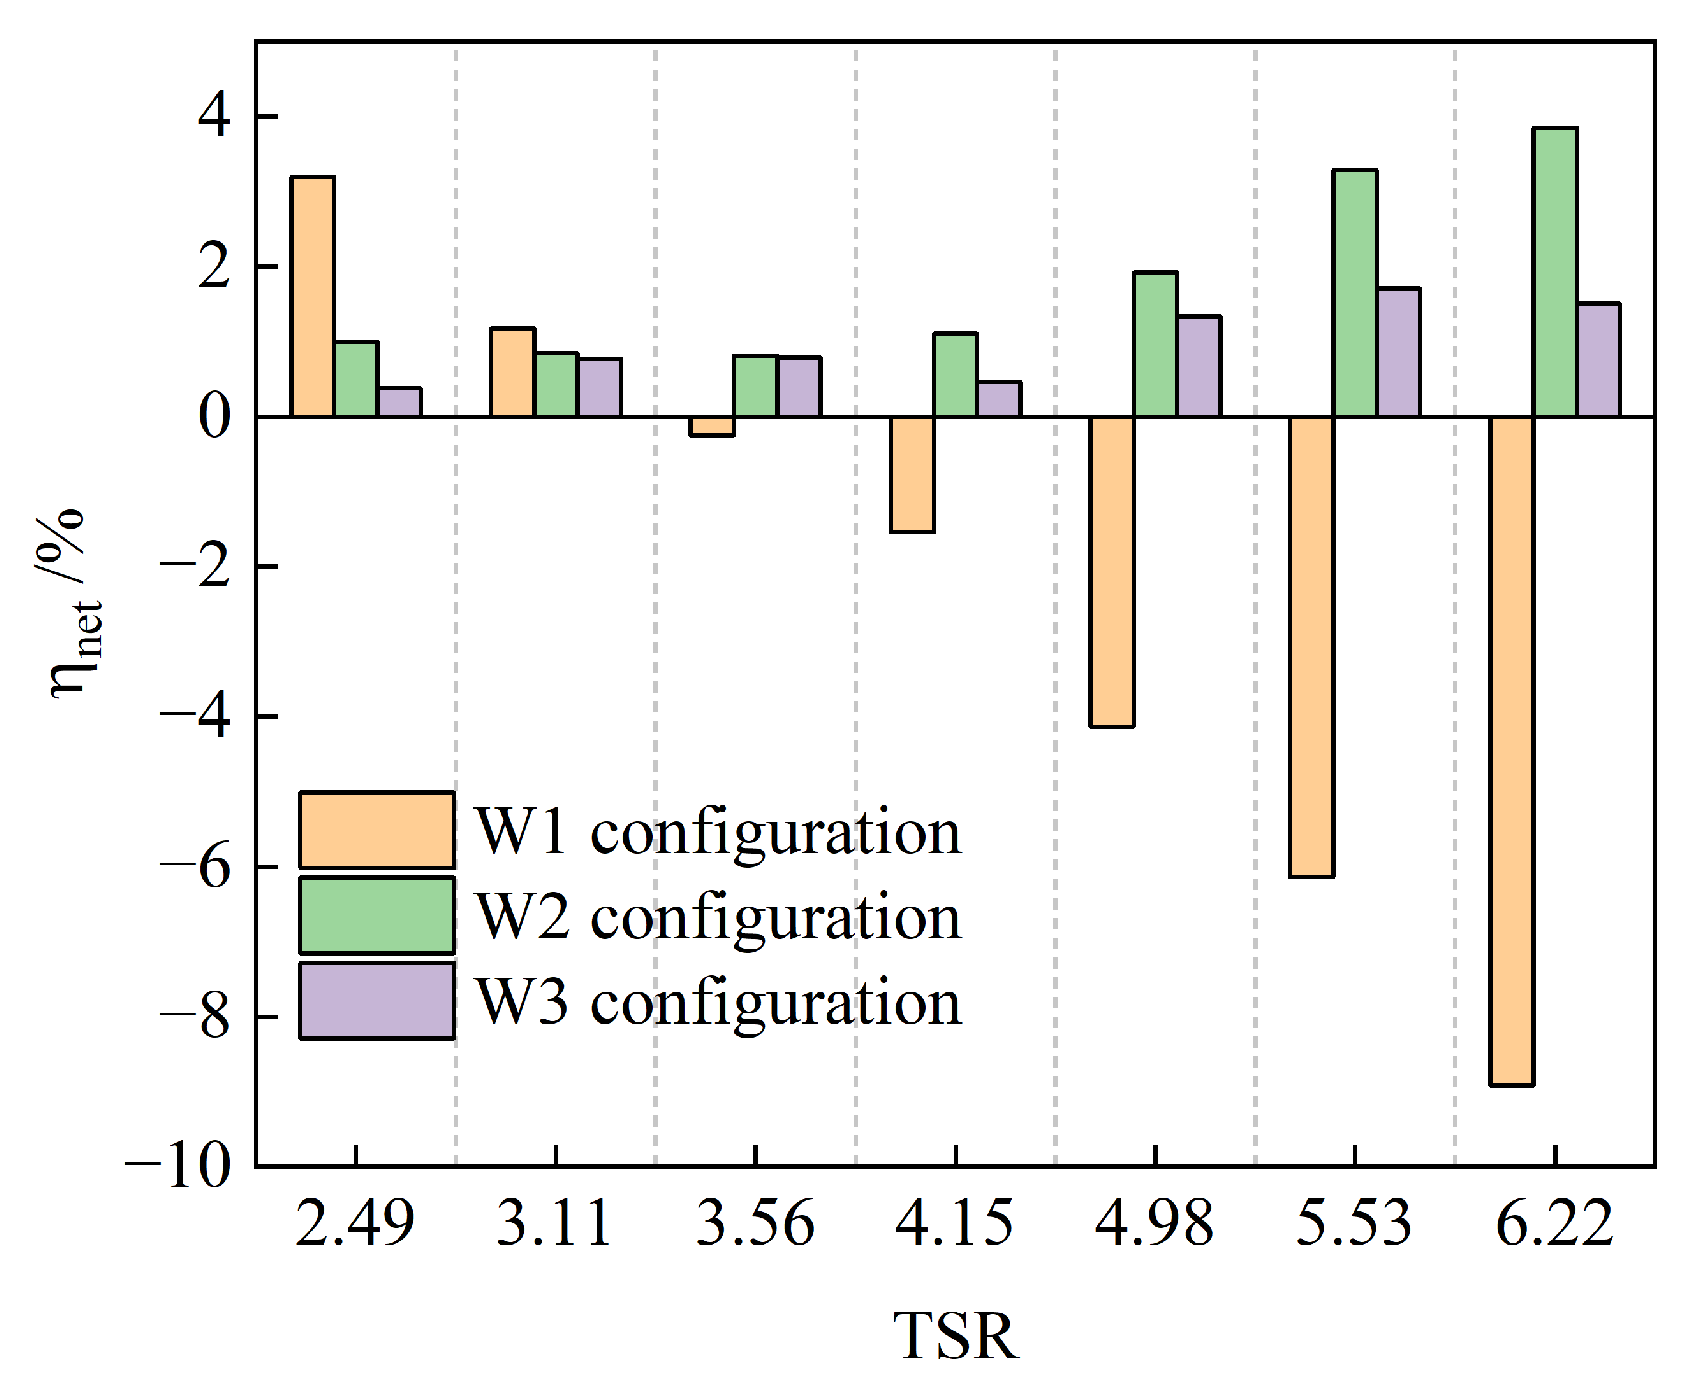
The power–thrust net gain coefficients for the three configurations are shown in Figure 21. The W1 configuration shows limited power gain in the medium to high TSR range. Moreover, as the thrust coefficient increases significantly, η n e t decreases below zero, indicating poor power gain benefits. In contrast, the W2 configuration achieves a certain degree of power increase at medium to high TSRs while simultaneously reducing the thrust load across the entire simulated TSR range, resulting in a positive η n e t value. Compared with the W2 configuration, the W3 configuration demonstrates superior power increase performance across all tip speed ratio conditions; however, the accompanying increase in thrust load results in a lower η n e t than that of the W2 configuration.
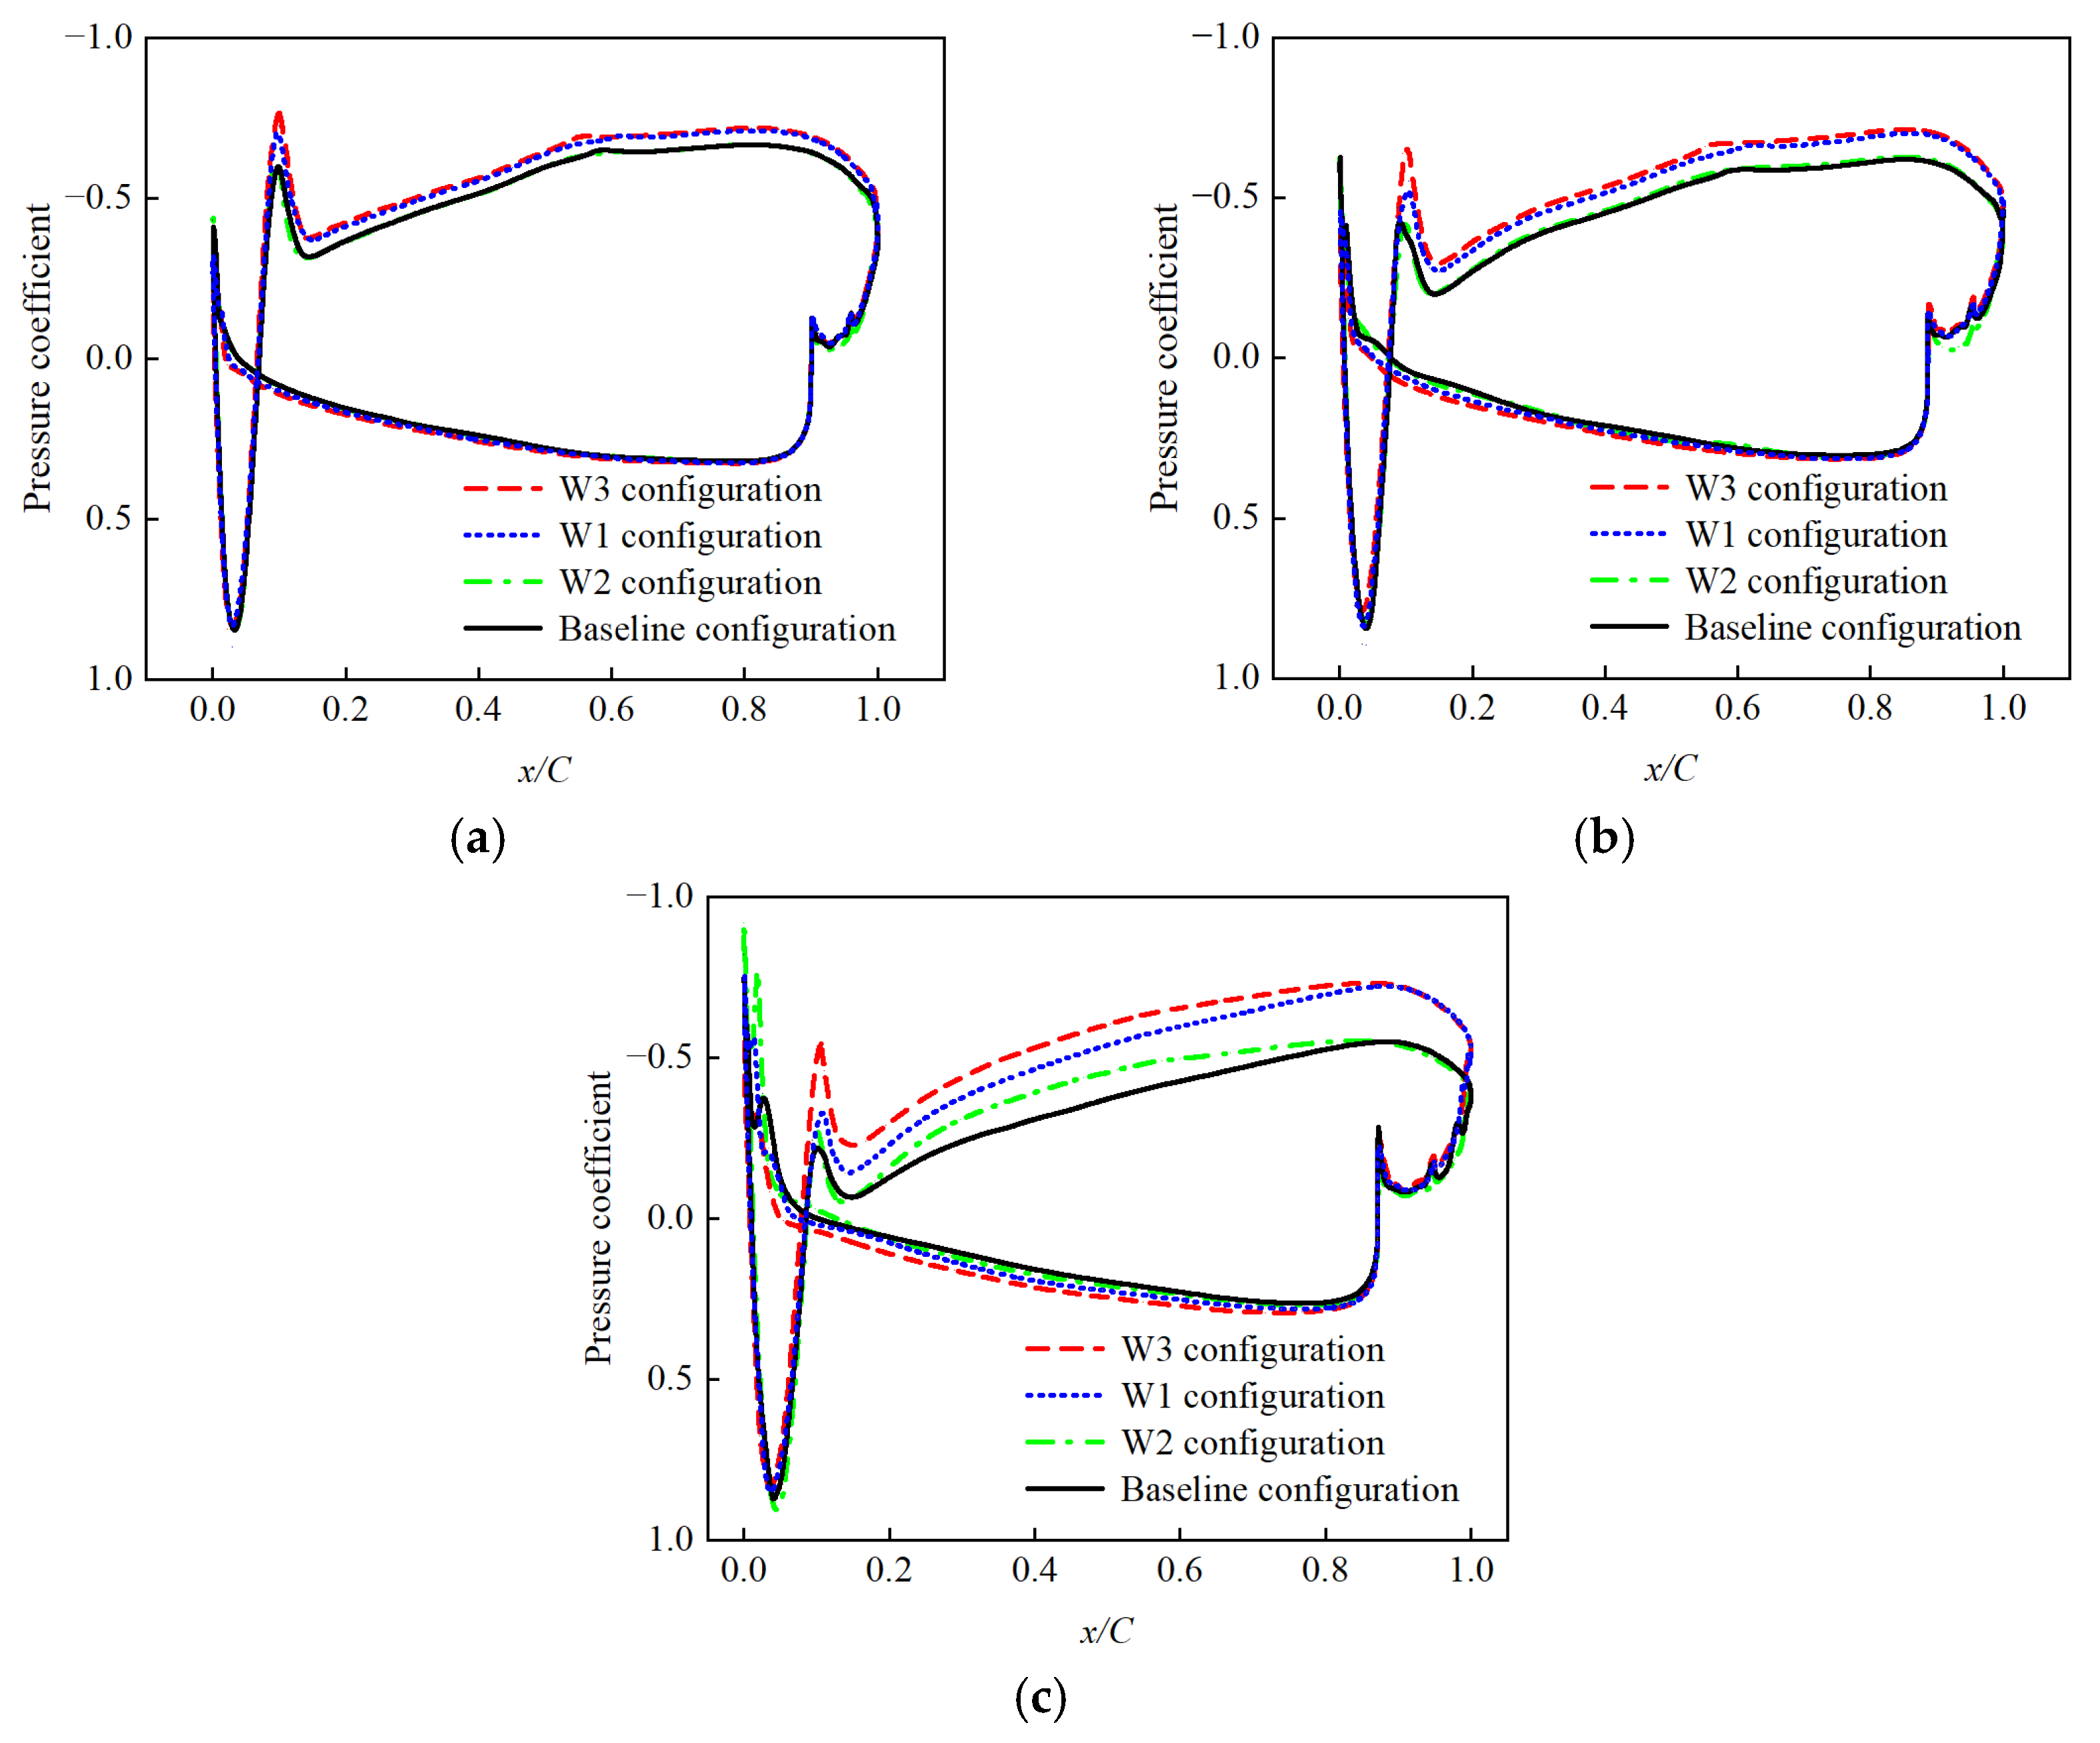
To assess the impact of each configuration on the aerodynamic forces at different radial positions along the blade, three monitoring sections were placed at r/R = 0.85, 0.90, and 0.95. The pressure coefficient distributions at these sections for each configuration are shown in Figure 22. It is evident that all three modified tip configurations enhance the aerodynamic performance by increasing the absolute value of the pressure coefficient on the suction side of the blade. Among them, the W3 configuration exhibits the highest absolute pressure coefficient values across all three sections, indicating a significant improvement in pressure distribution within the tip region. This enhancement leads to a greater pressure differential between the suction and pressure sides, thereby increasing the local aerodynamic force. The W1 configuration also demonstrates an increase in the suction-side pressure coefficient at all three sections; however, the magnitude of improvement is less than that observed for the W3 configuration, resulting in a comparatively weaker aerodynamic enhancement. The W2 configuration shows pressure distributions at the P1 and P2 sections that closely resemble those of the baseline configuration, with only minor improvements observed in the P3 section. This finding indicates that the impact of tip contraction on aerodynamic performance is confined primarily to the local tip region and has minimal influence on non-contracted region.

4. Parametric Optimization of the Winglet

As discussed in Section 3.5, for the tip plate, the thrust load increase at medium-high TSRs is greater than the power increase, which limits its optimization potential. For the tip contraction, although it can reduce the thrust load across all TSRs, it yields a notable torque improvement only at high TSRs. Considering that the primary objective is power enhancement, the winglet configuration, which shows significant potential for power improvement, was selected for further optimization using an orthogonal experimental design (OED) to determine the optimal arrangement of three design parameters: the cant angle, twist angle, and winglet height. Additionally, the influence of each design parameter on the power improvement effect was analyzed.

4.1. Orthogonal Experimental Design (OED)

The objective of the OED is to identify the relative significance of various design parameters and to determine their optimal combinations. In this study, each parameter is assigned three discrete levels. The specific design parameters along with their corresponding levels are presented in Table 3.
In this study, the L9(33) orthogonal array is adopted to design the samples, where ‘L’ represents the orthogonal array and 9 represents the total number of samples needed in the array. The orthogonal array used in this study, along with its corresponding power and thrust coefficients, is listed in Table 4.
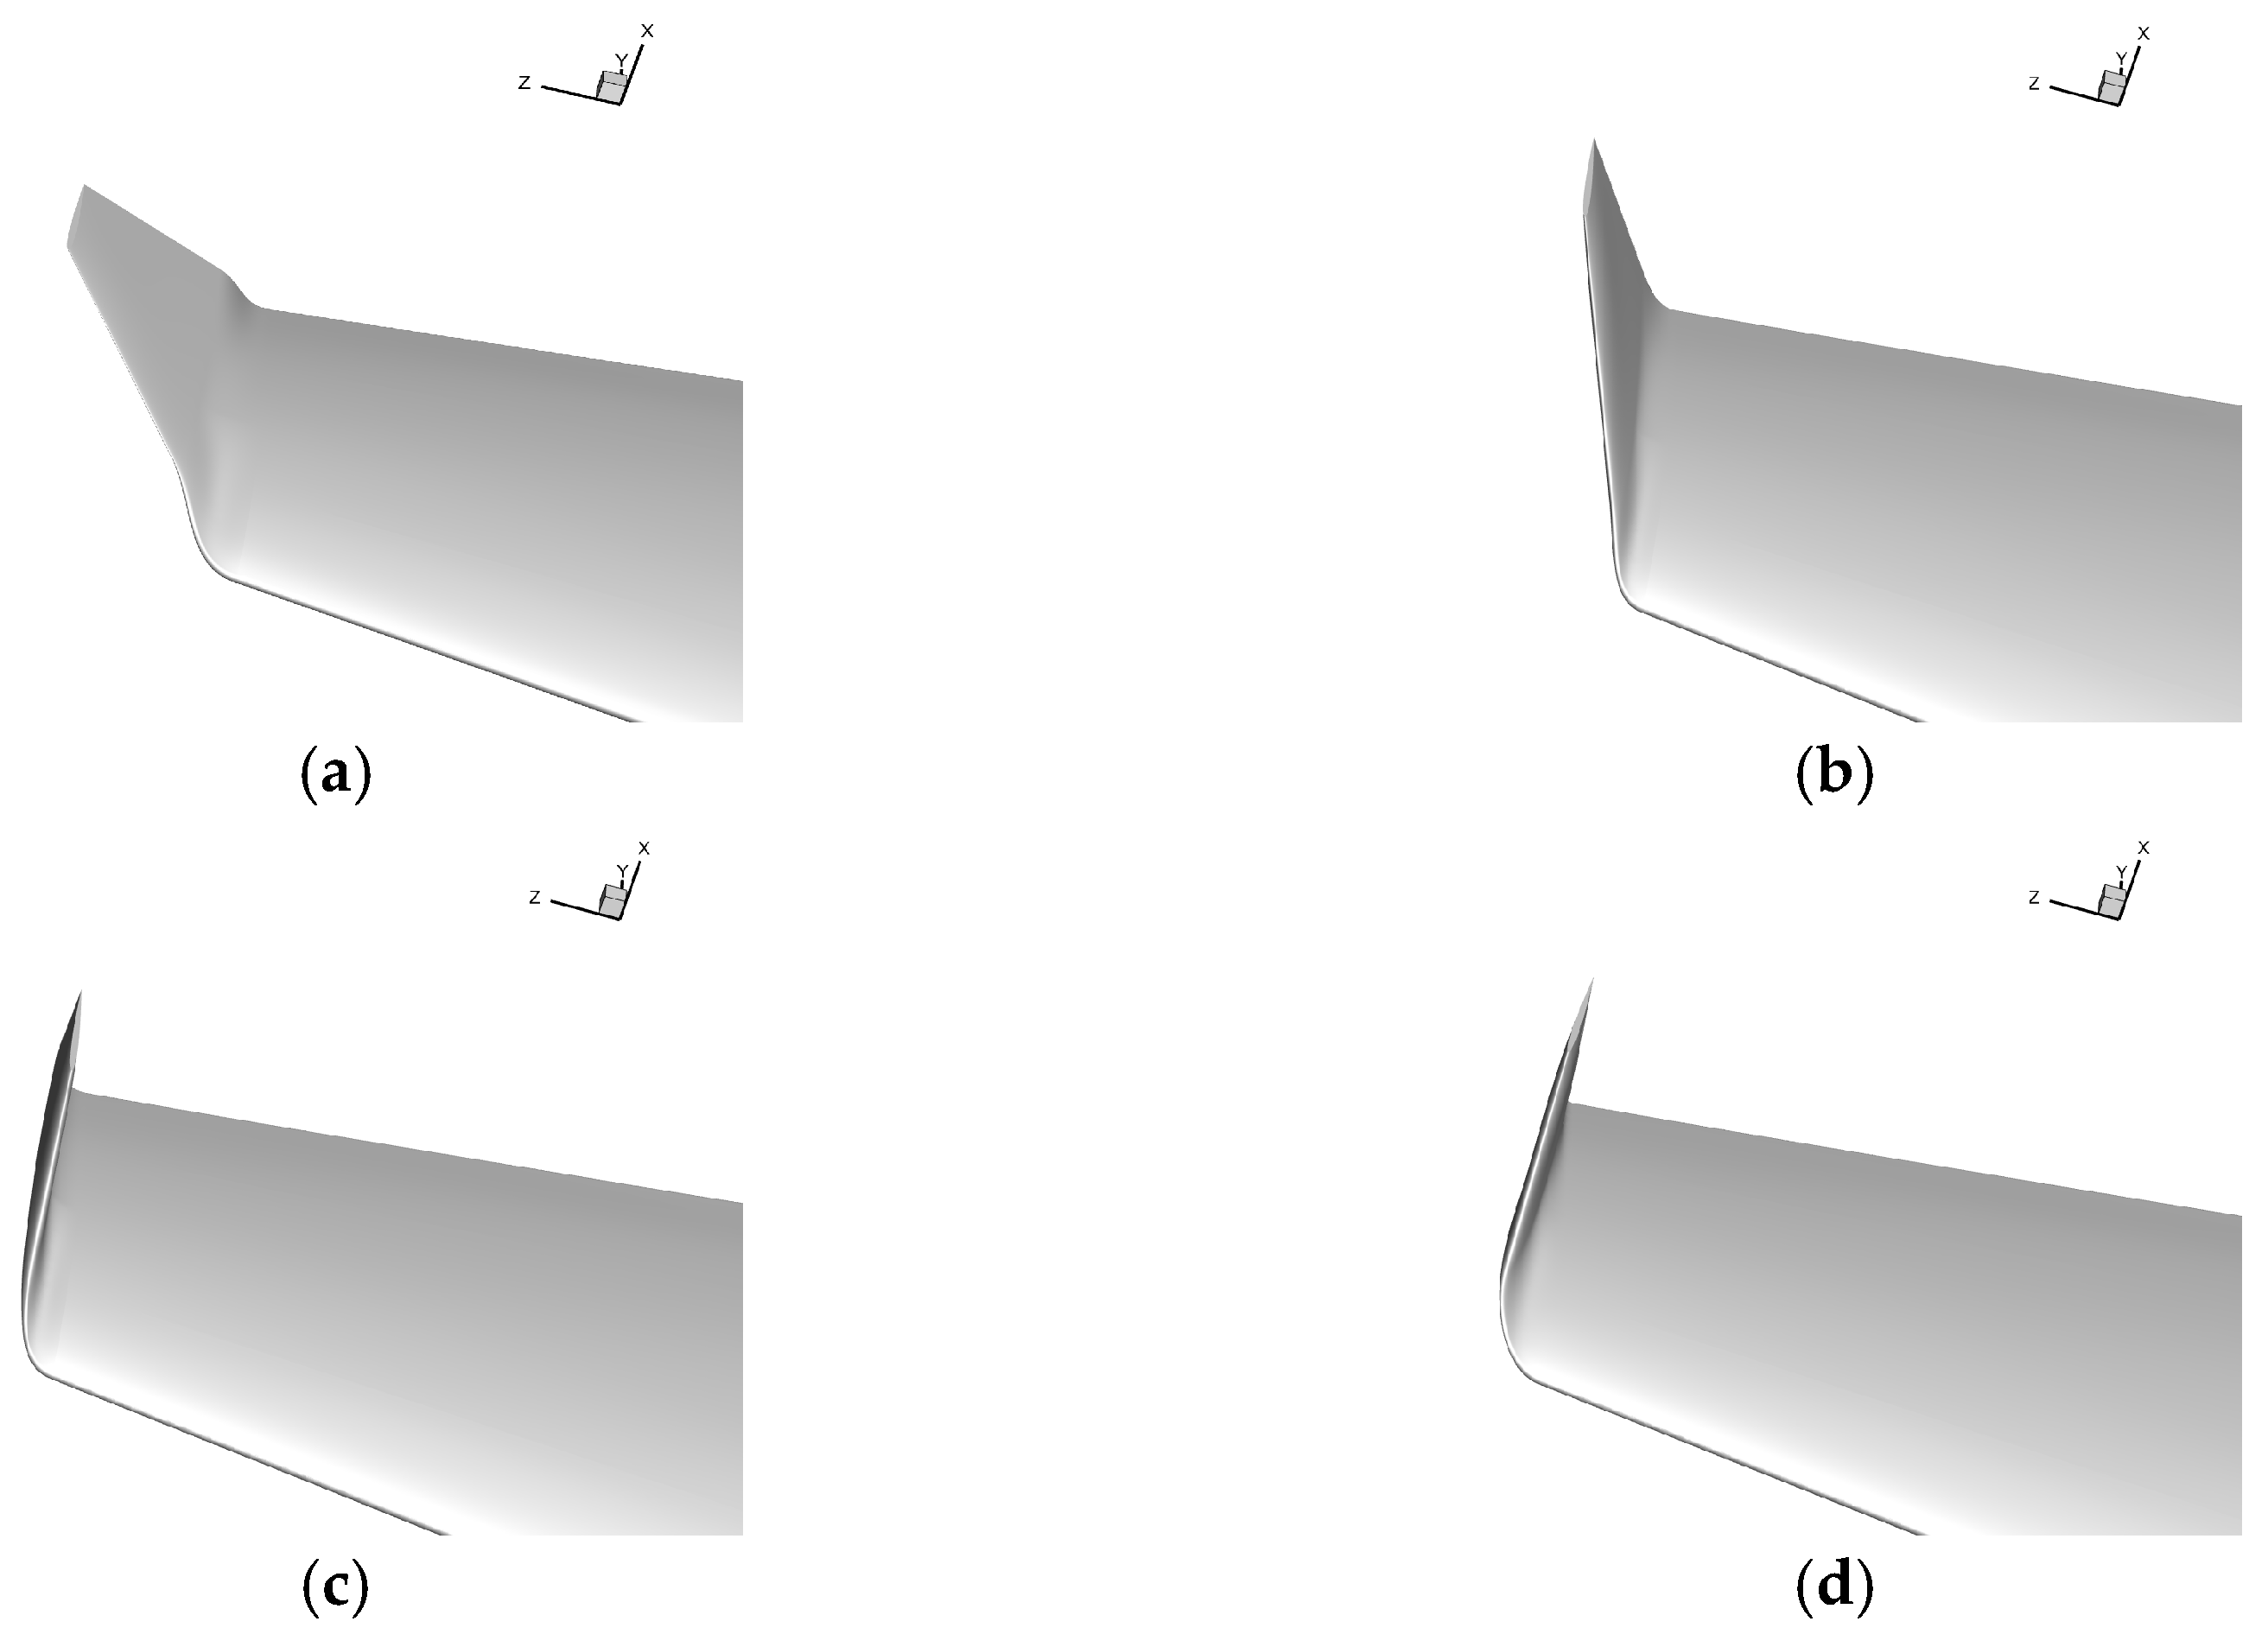
To visually illustrate the arrangement of winglet configurations, some examples are provided in Figure 23.

4.2. Analysis of OED Results

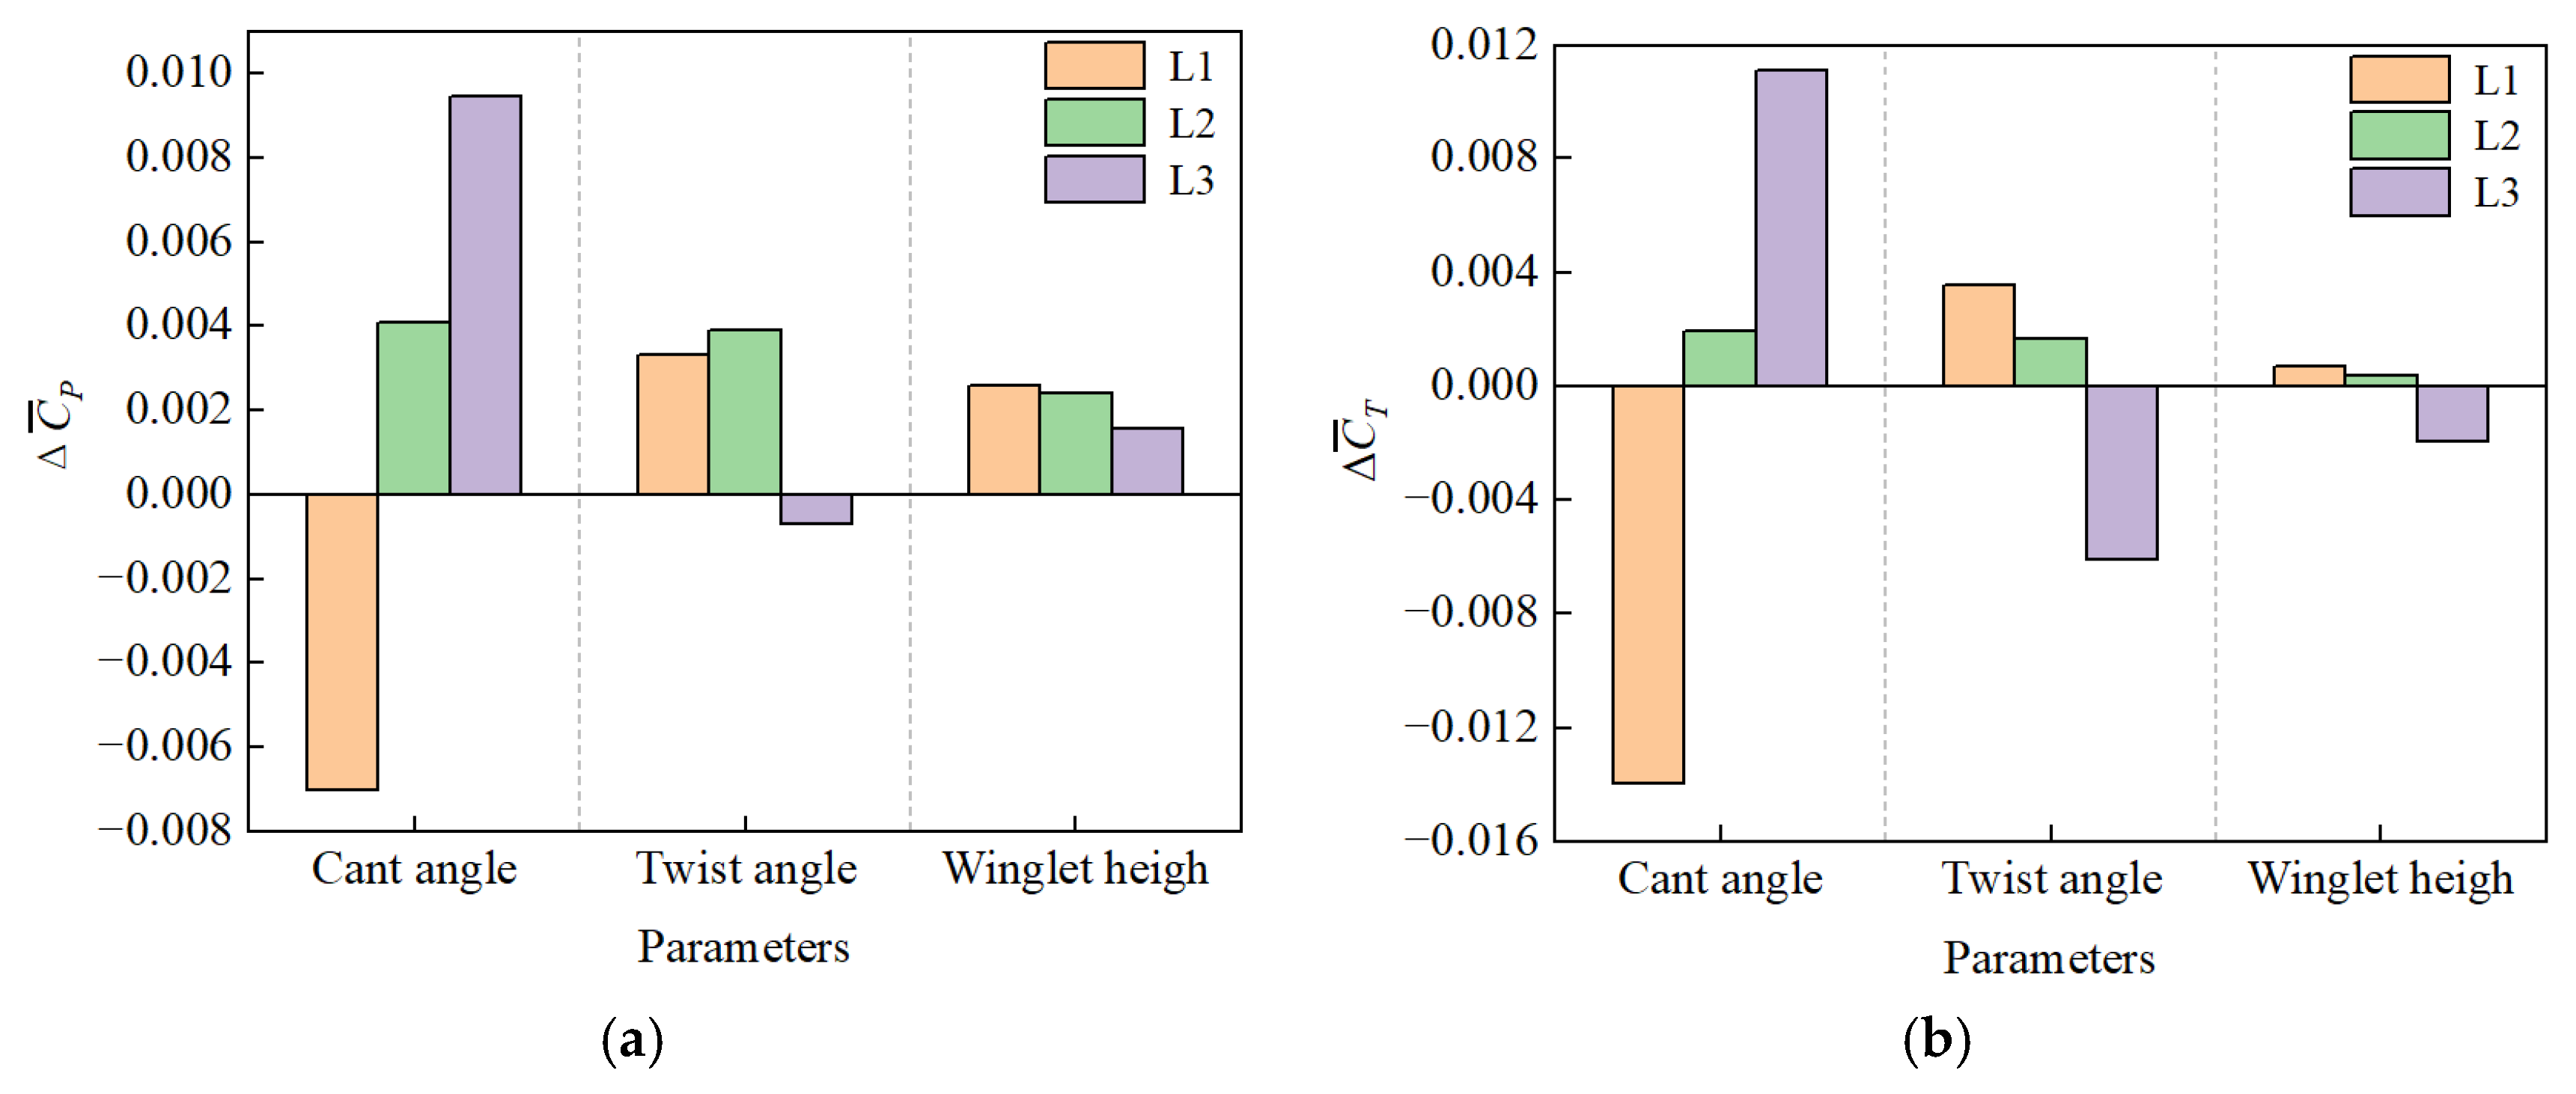
Since the power and thrust coefficients of the 9 cases investigated are listed in Table 5, an analysis of the range is presented based on these results to assist in identifying the significance of the design variables. The mean power coefficient increment ( Δ C ¯ P ) is defined as the difference between the mean power coefficients at different parameters and different levels and the power coefficient of the baseline configuration, Cp0 = 0.2019. Similarly, the increase in the mean thrust coefficient ( Δ C ¯ T ) is calculated in the same manner. R is the range between the maximum and minimum values of a specific variable at different levels.
As shown in Table 5, the cant angle exhibits the highest R value, indicating that it has the most significant influence on the power and thrust coefficients. The relative importance of the design parameters is ranked in order of the cant angle, twist angle, and height. Figure 24 provides a clearer visual representation of these effects. It illustrates that the mean power coefficient increment increases with the cant angle, accompanied by a corresponding rise in the thrust coefficient increment. Given that the primary objective of the winglet design is to enhance the power output and that the cant angle has the greatest impact, level 3 is selected for this parameter. For the twist angle, the greatest power enhancement occurs at the L2 level, and the increase in the mean thrust coefficient decreases from L1 to L2. Therefore, the L2 level is chosen for the twist angle. Although increasing the winglet height from L1 to L2 results in a 7.7% reduction in the mean power coefficient increment, the corresponding mean thrust coefficient increment is reduced by 57.1%. Thus, the L2 level is selected for the winglet height.

4.3. Aerodynamic Characterization of Winglet with Optimized Parameters

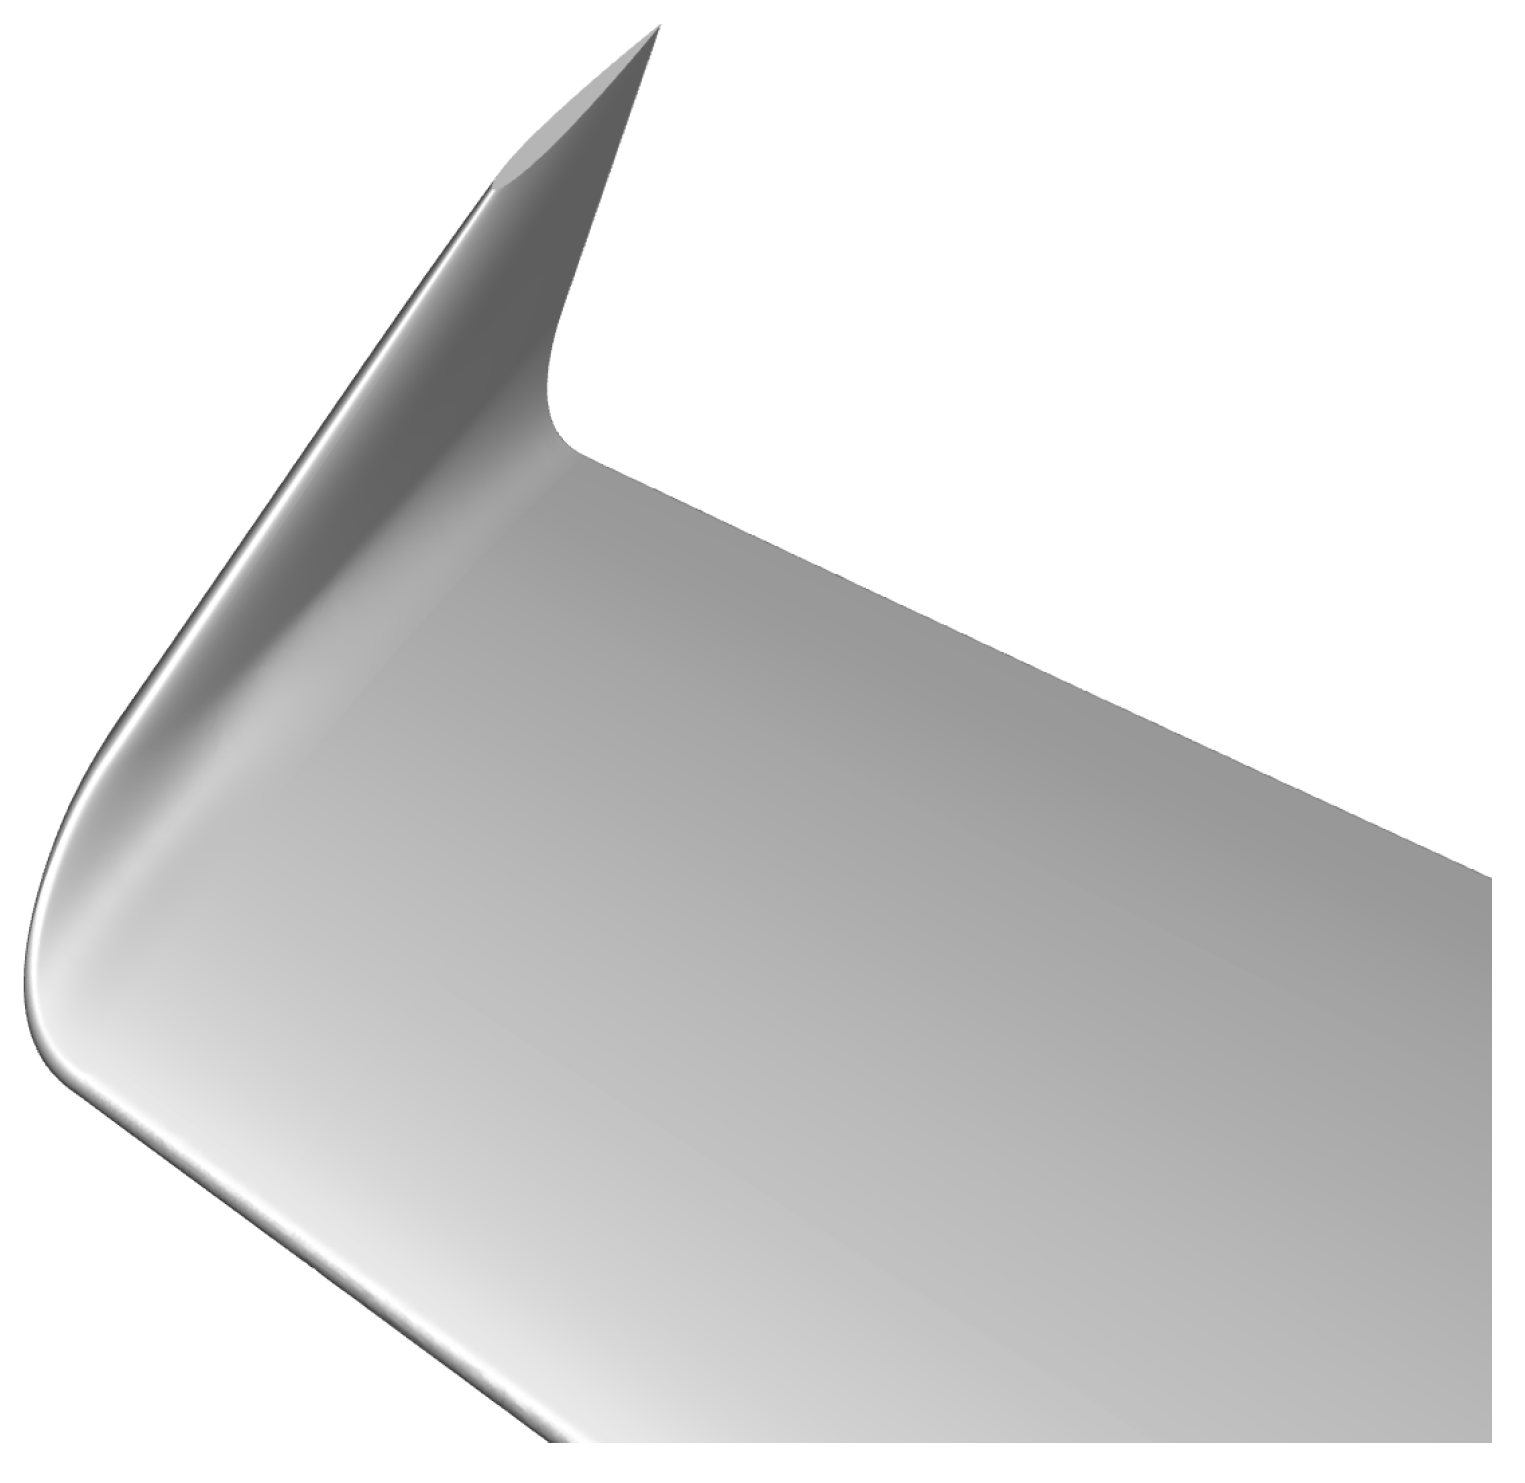
As described in Section 4.2, the optimal combination of design parameters within the defined range includes a 90° cant angle, a 4° twist angle, and a winglet height of 25 mm. Figure 25 illustrates the winglet designed on the basis of the optimal set of parameter levels, which is referred to as the W3-X configuration.
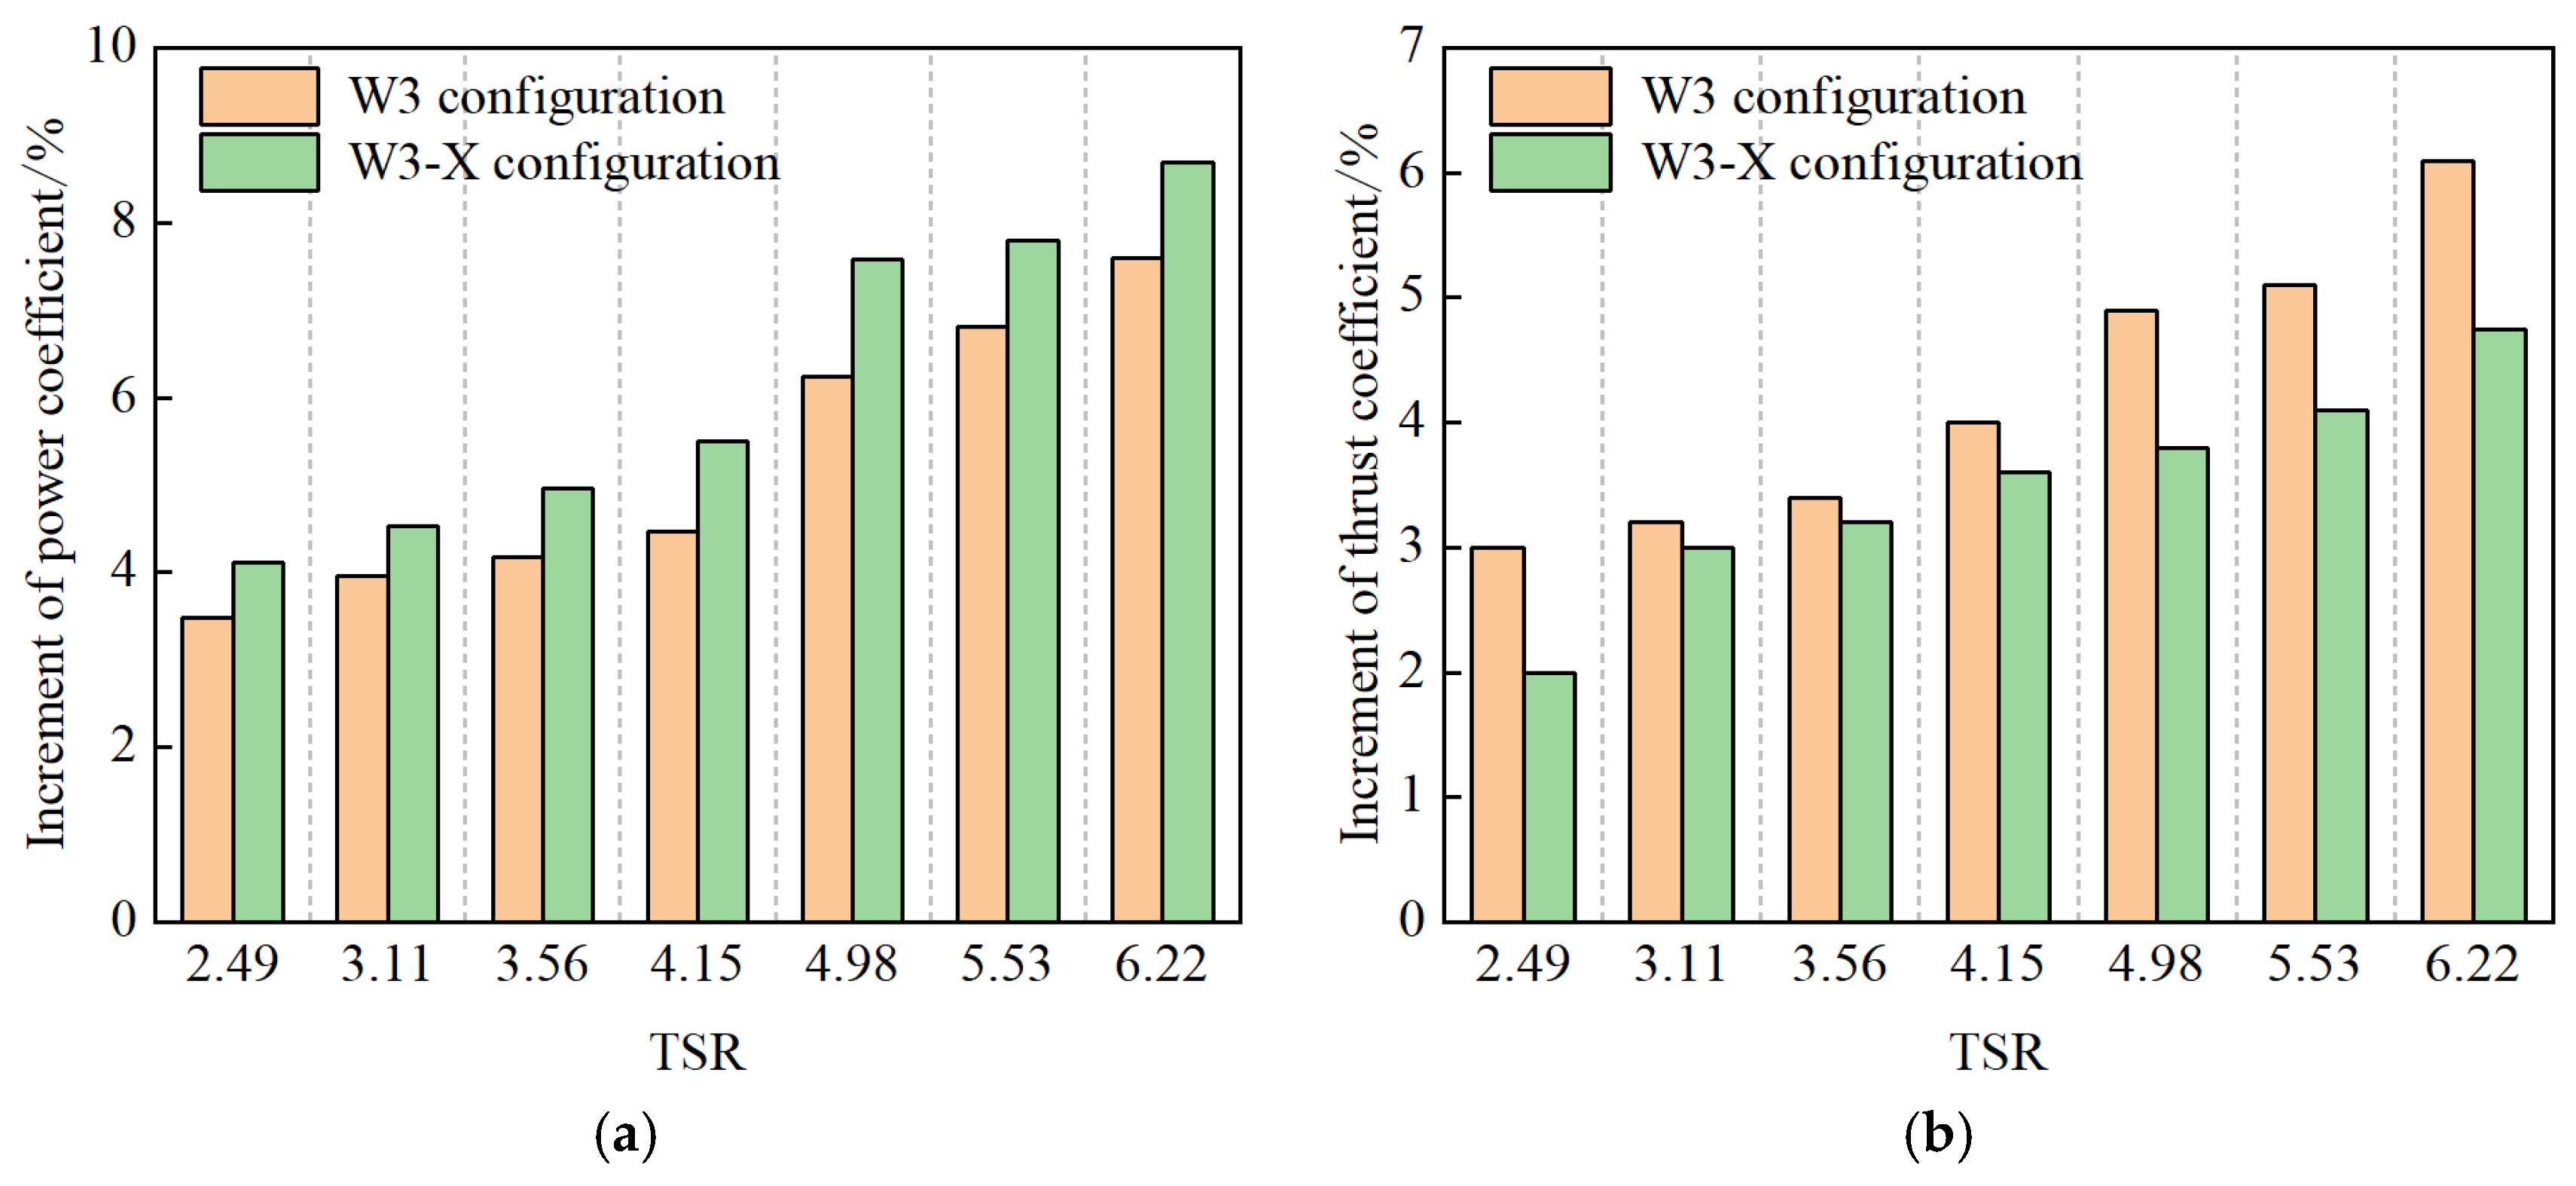
Figure 26 displays the changes in power and thrust coefficients relative to the baseline configuration, comparing the performance of the W3 configuration before and after optimization. The findings show that the optimized W3-X variant not only delivers a greater enhancement in power output but also achieves a further reduction in thrust. This results in a notable improvement in overall aerodynamic efficiency.
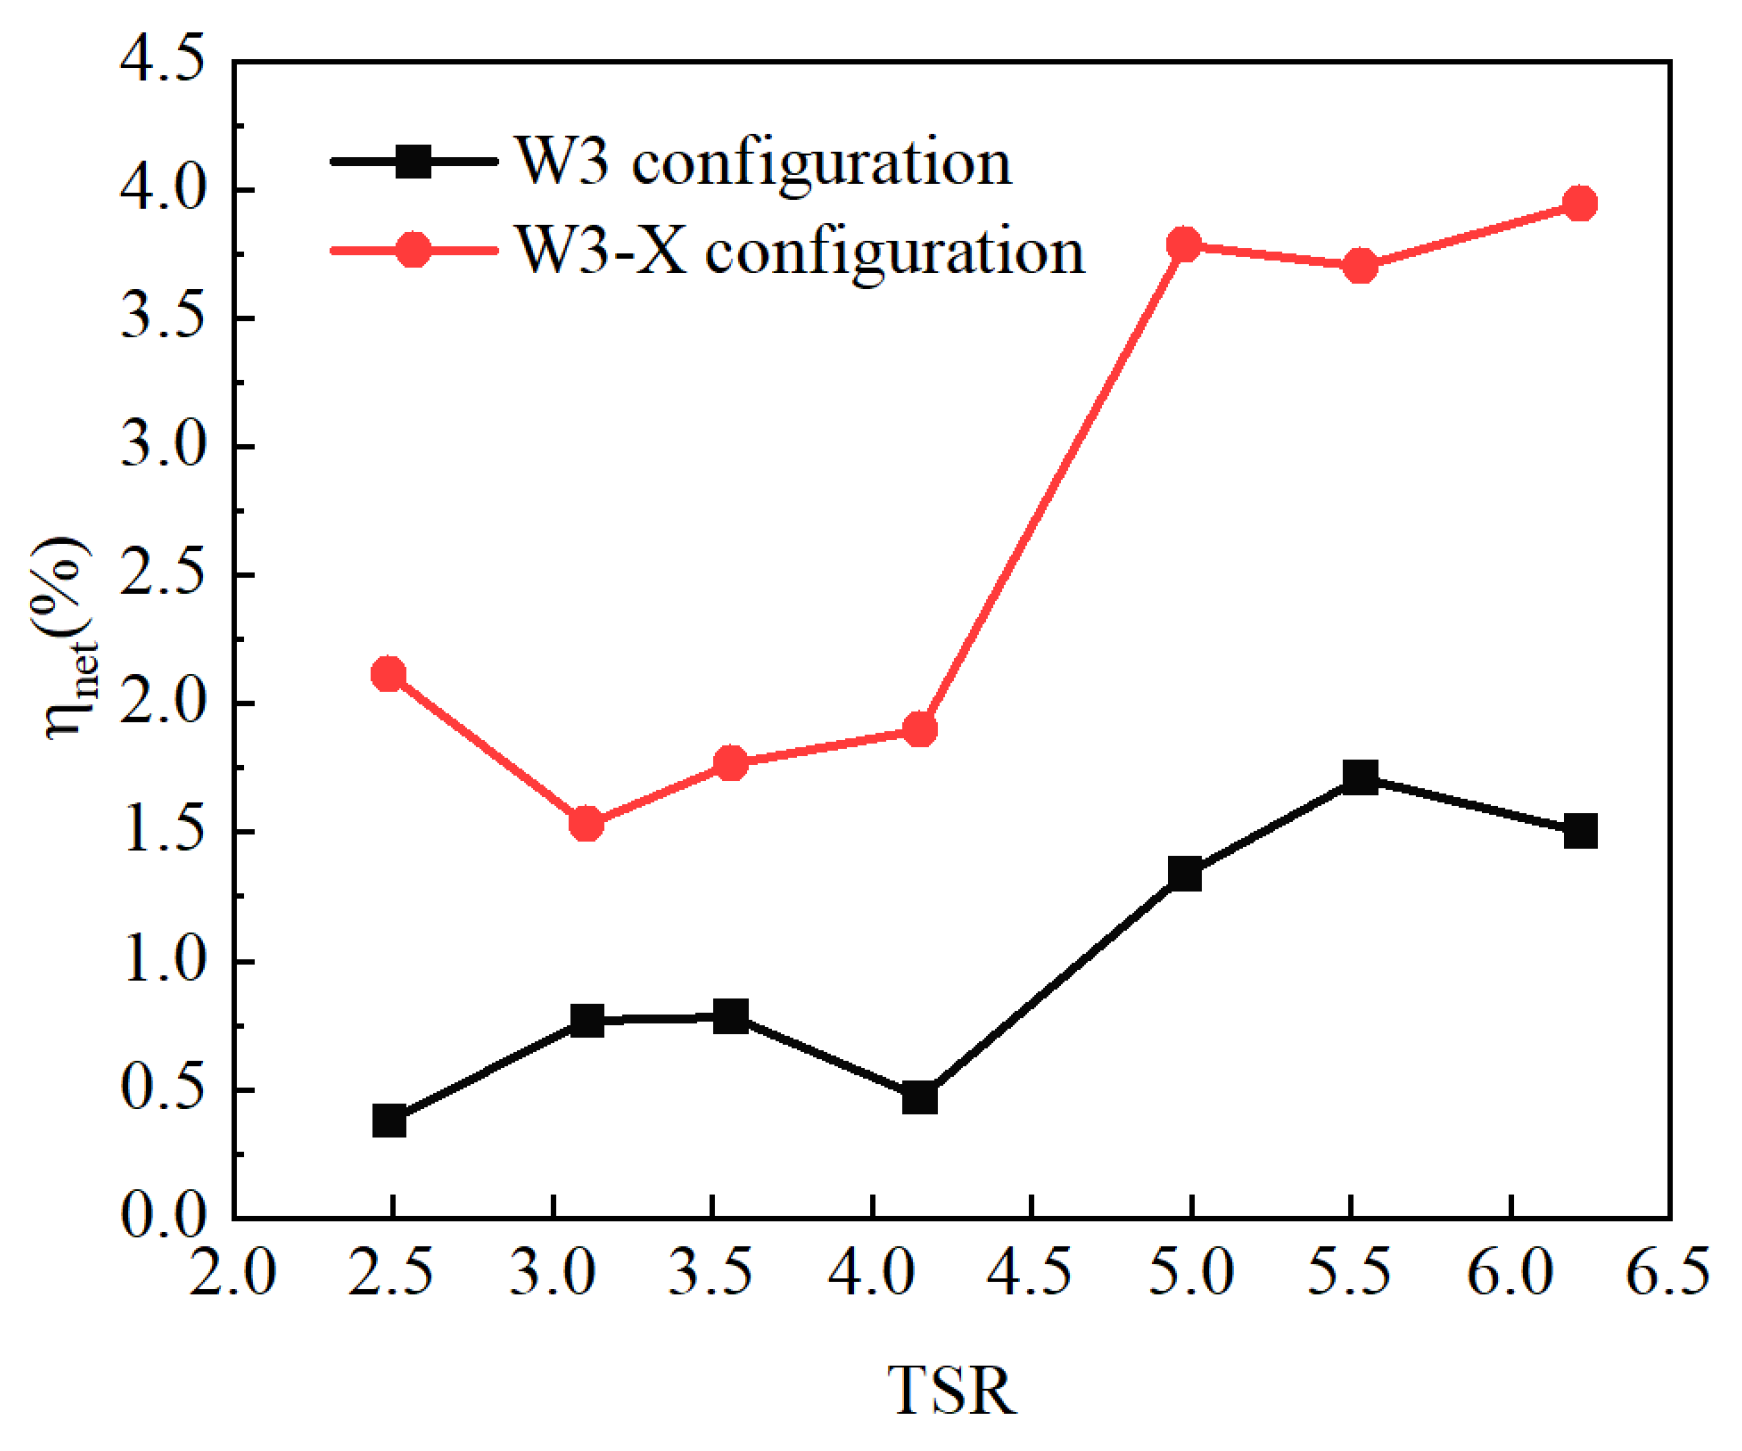
Figure 27 presents a comparison of the power–thrust net gain coefficients for the W3 and W3-X configurations across a range of TSRs. The W3-X configuration consistently delivers higher net gain values under all tested conditions, demonstrating that the optimized winglet design not only increases the power output but also achieves a more balanced and controlled rise in thrust. This highlights its enhanced aerodynamic effectiveness.
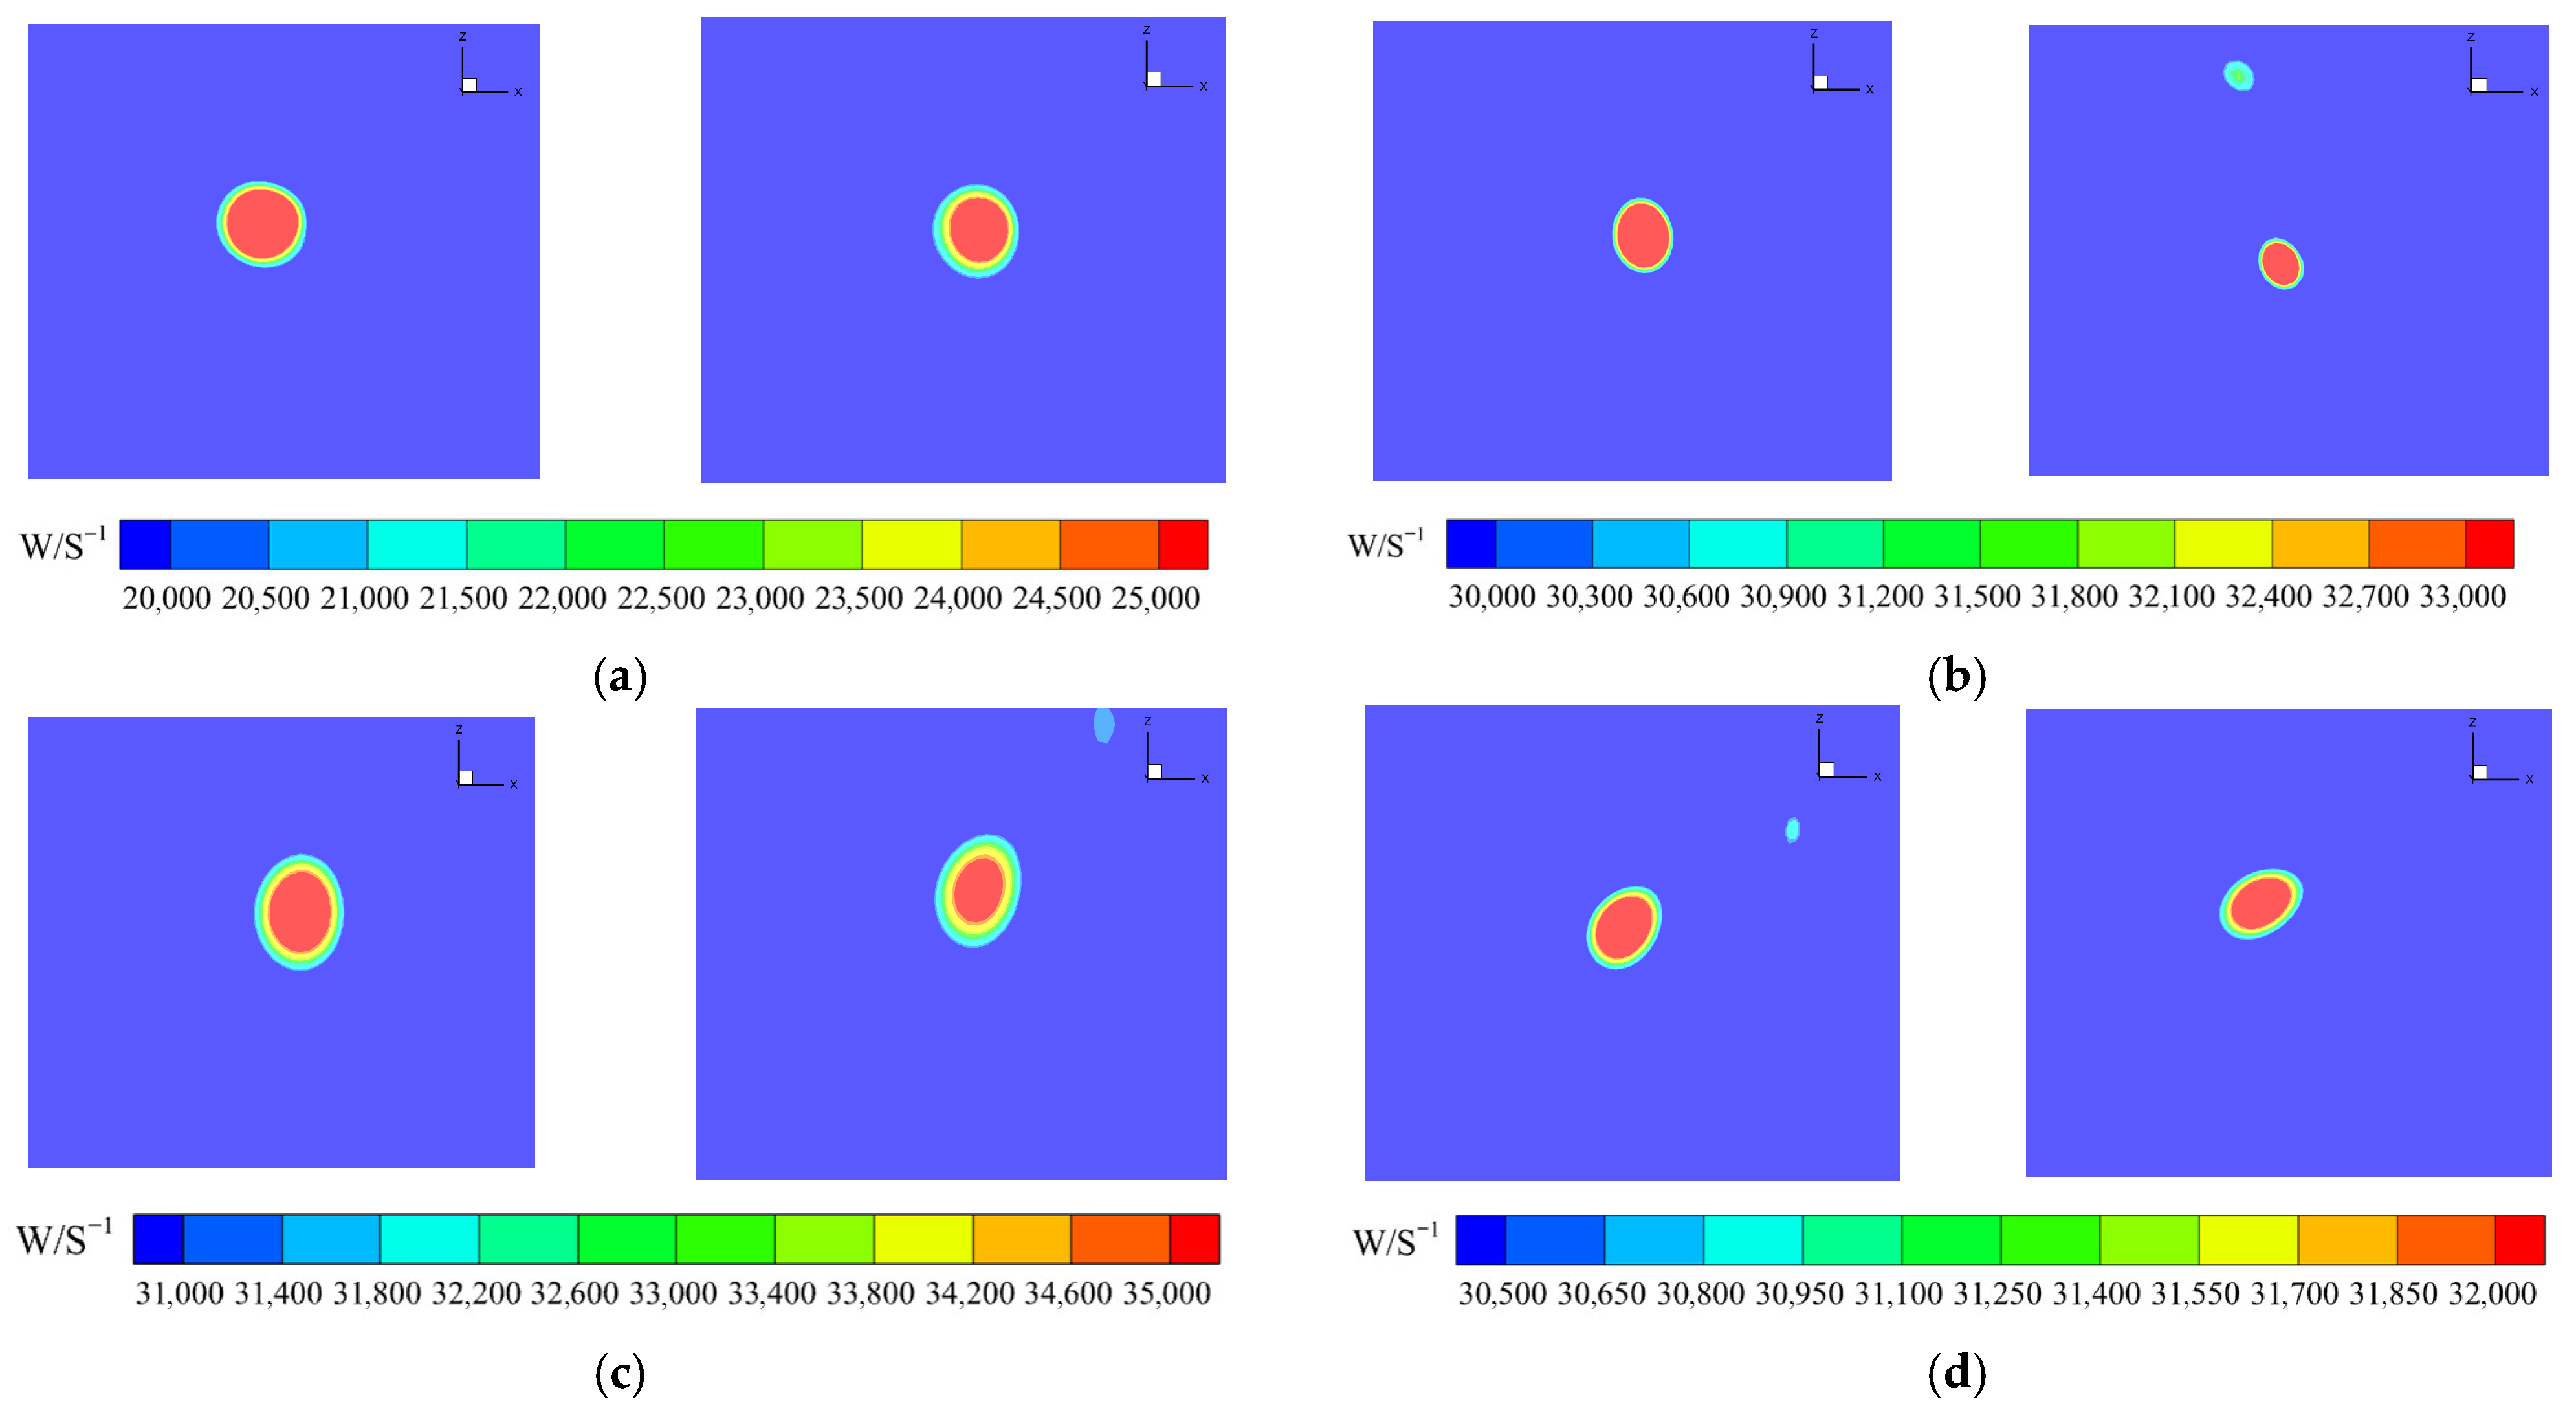
Figure 28 compares the vorticity distribution in the near-wake region of the blade across different TSRs. The left column illustrates results for the W3 configuration, while the right column corresponds to the optimized W3-X configuration. As depicted in Figure 28a–c, the W3-X configuration exhibits notable changes in the vorticity field near the blade tip. Compared to the W3 configuration, the areas of high vorticity are significantly diminished and the peak vorticity values are reduced, indicating a weakening of the tip vortex intensity. As shown in Figure 28d, under TSR = 2.49, although the reduction in the high-vorticity area is less pronounced than that under medium and high TSRs, the W3-X configuration still exhibits a smaller high-vorticity region than the W3 configuration does, indicating that it retains some vortex suppression capability even at low TSRs. In summary, the W3-X configuration effectively reduces the core strength and spatial extent of the tip vortex across all TSR conditions, thereby exerting a positive influence on the flow field structure.
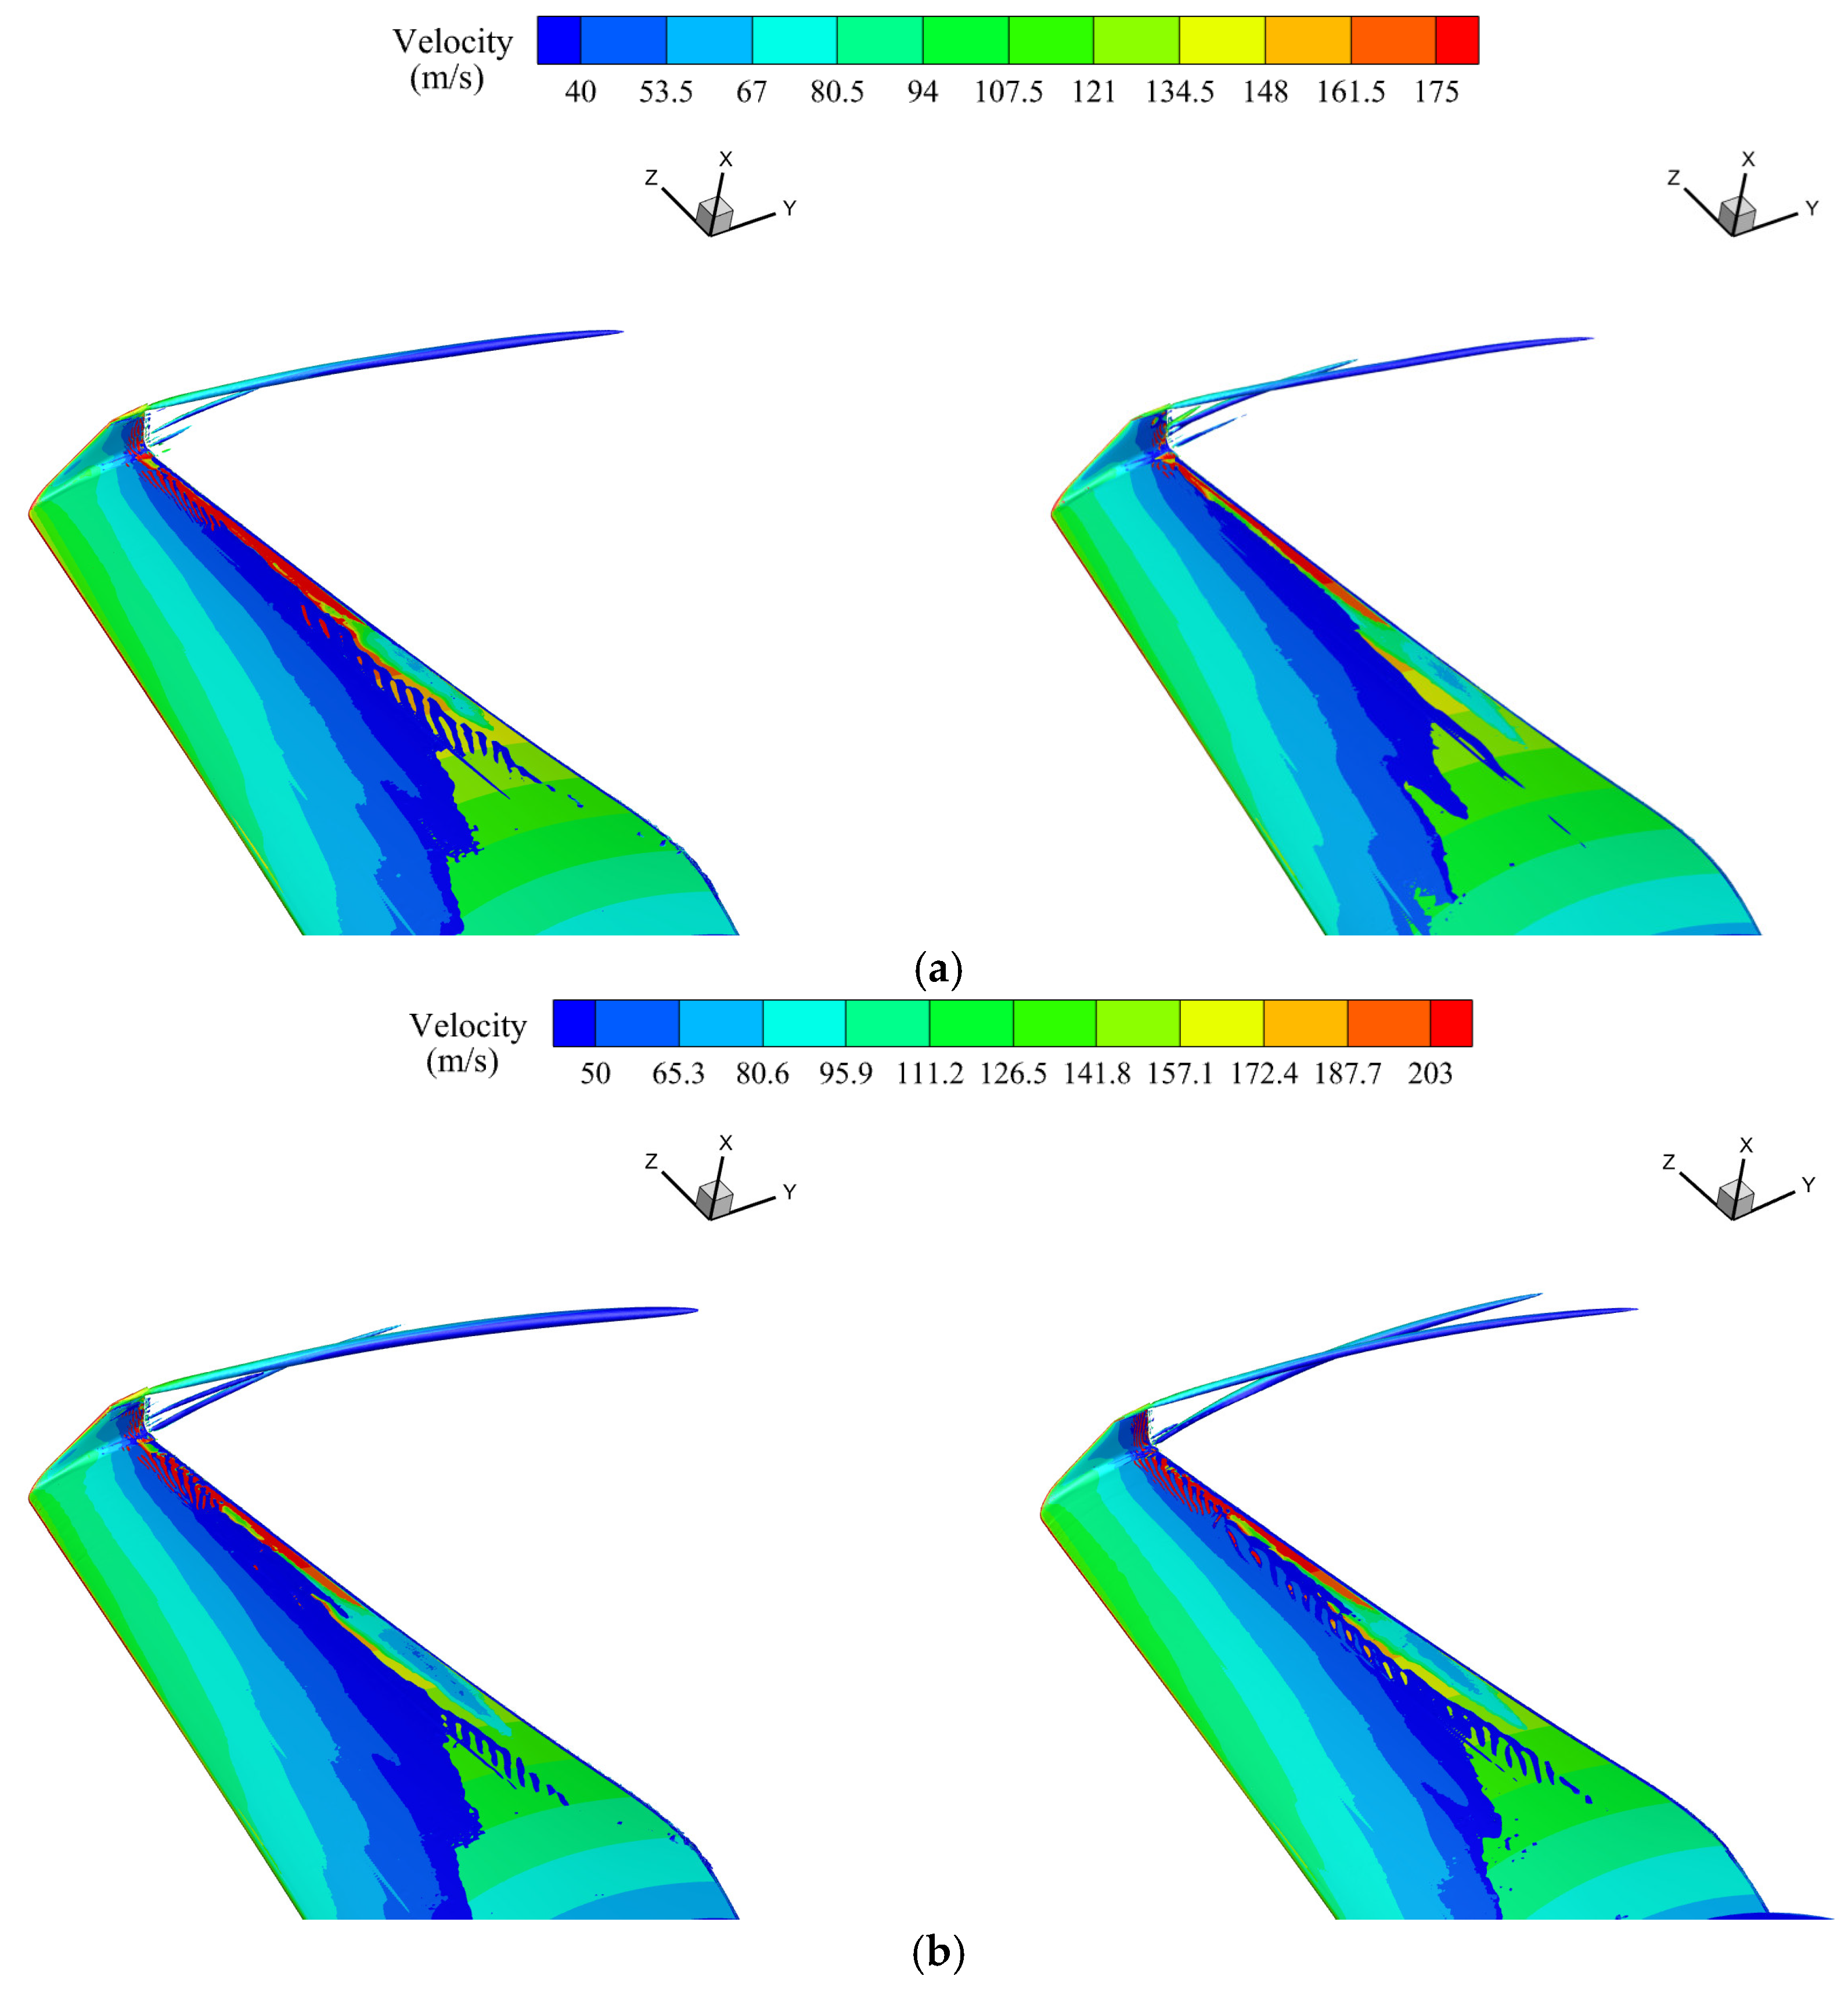
Figure 29 shows the iso-surface contours of the tip vortex structures in the flow field for the W3 and W3-X configurations under different TSRs, visualized using the Q-criterion (Q = 4.0 × 10⁸). The iso-surfaces are generated based on the magnitude of the resultant velocity within the flow field. The results for the W3 configuration are shown on the left, while those for the optimized W3-X configuration are displayed on the right. Under identical inflow conditions, a longer vortex filament typically signifies a stronger vortex intensity and more pronounced pressure interactions near the blade tip. These interactions reduce the pressure differential between the suction and pressure surfaces, thereby diminishing the power generation efficiency. In contrast, shorter vortex filaments reflect weaker tip flow interactions and indicate better aerodynamic performance. As seen in the figure, the W3-X configuration produces a smaller vortex region than the W3 configuration. The winglet-optimized W3-X design achieves reductions in both the extent and intensity of tip vortex structures.

4.4. Influence of Blade Tip Mach Number on Winglet Aerodynamic Performance

Under the previously discussed condition with an inlet velocity of 100 m/s and a rotational speed of 5200 r/min, the blade tip Mach number reaches a maximum of 0.79. For ram air turbines intended for higher speed applications, the tip Mach number may enter the high-subsonic/transonic regime. Therefore, this subsection examines how the tip Mach number affects the aerodynamic efficiency gain of the winglet configuration. To assess the influence of high-subsonic/transonic compressibility on the aerodynamic performance, we keep the tip speed ratio at TSR = 4.15 (which corresponds to the maximum power coefficient of this turbine), and starting from the TSR = 4.15 baseline case, simultaneously increase the rotational speed and freestream velocity to obtain two additional operating conditions, such that the tip Mach number lies in the high-subsonic/transonic regime. The parameters for the three cases are listed in Table 6. The tip Mach number (Mtip) is defined as follows:
M tip = ( ω R ) 2 + V 0 2 a
where ω is the rotation speed, R is the turbine radius, V 0 is the free flow speed, and a is the local speed of sound.
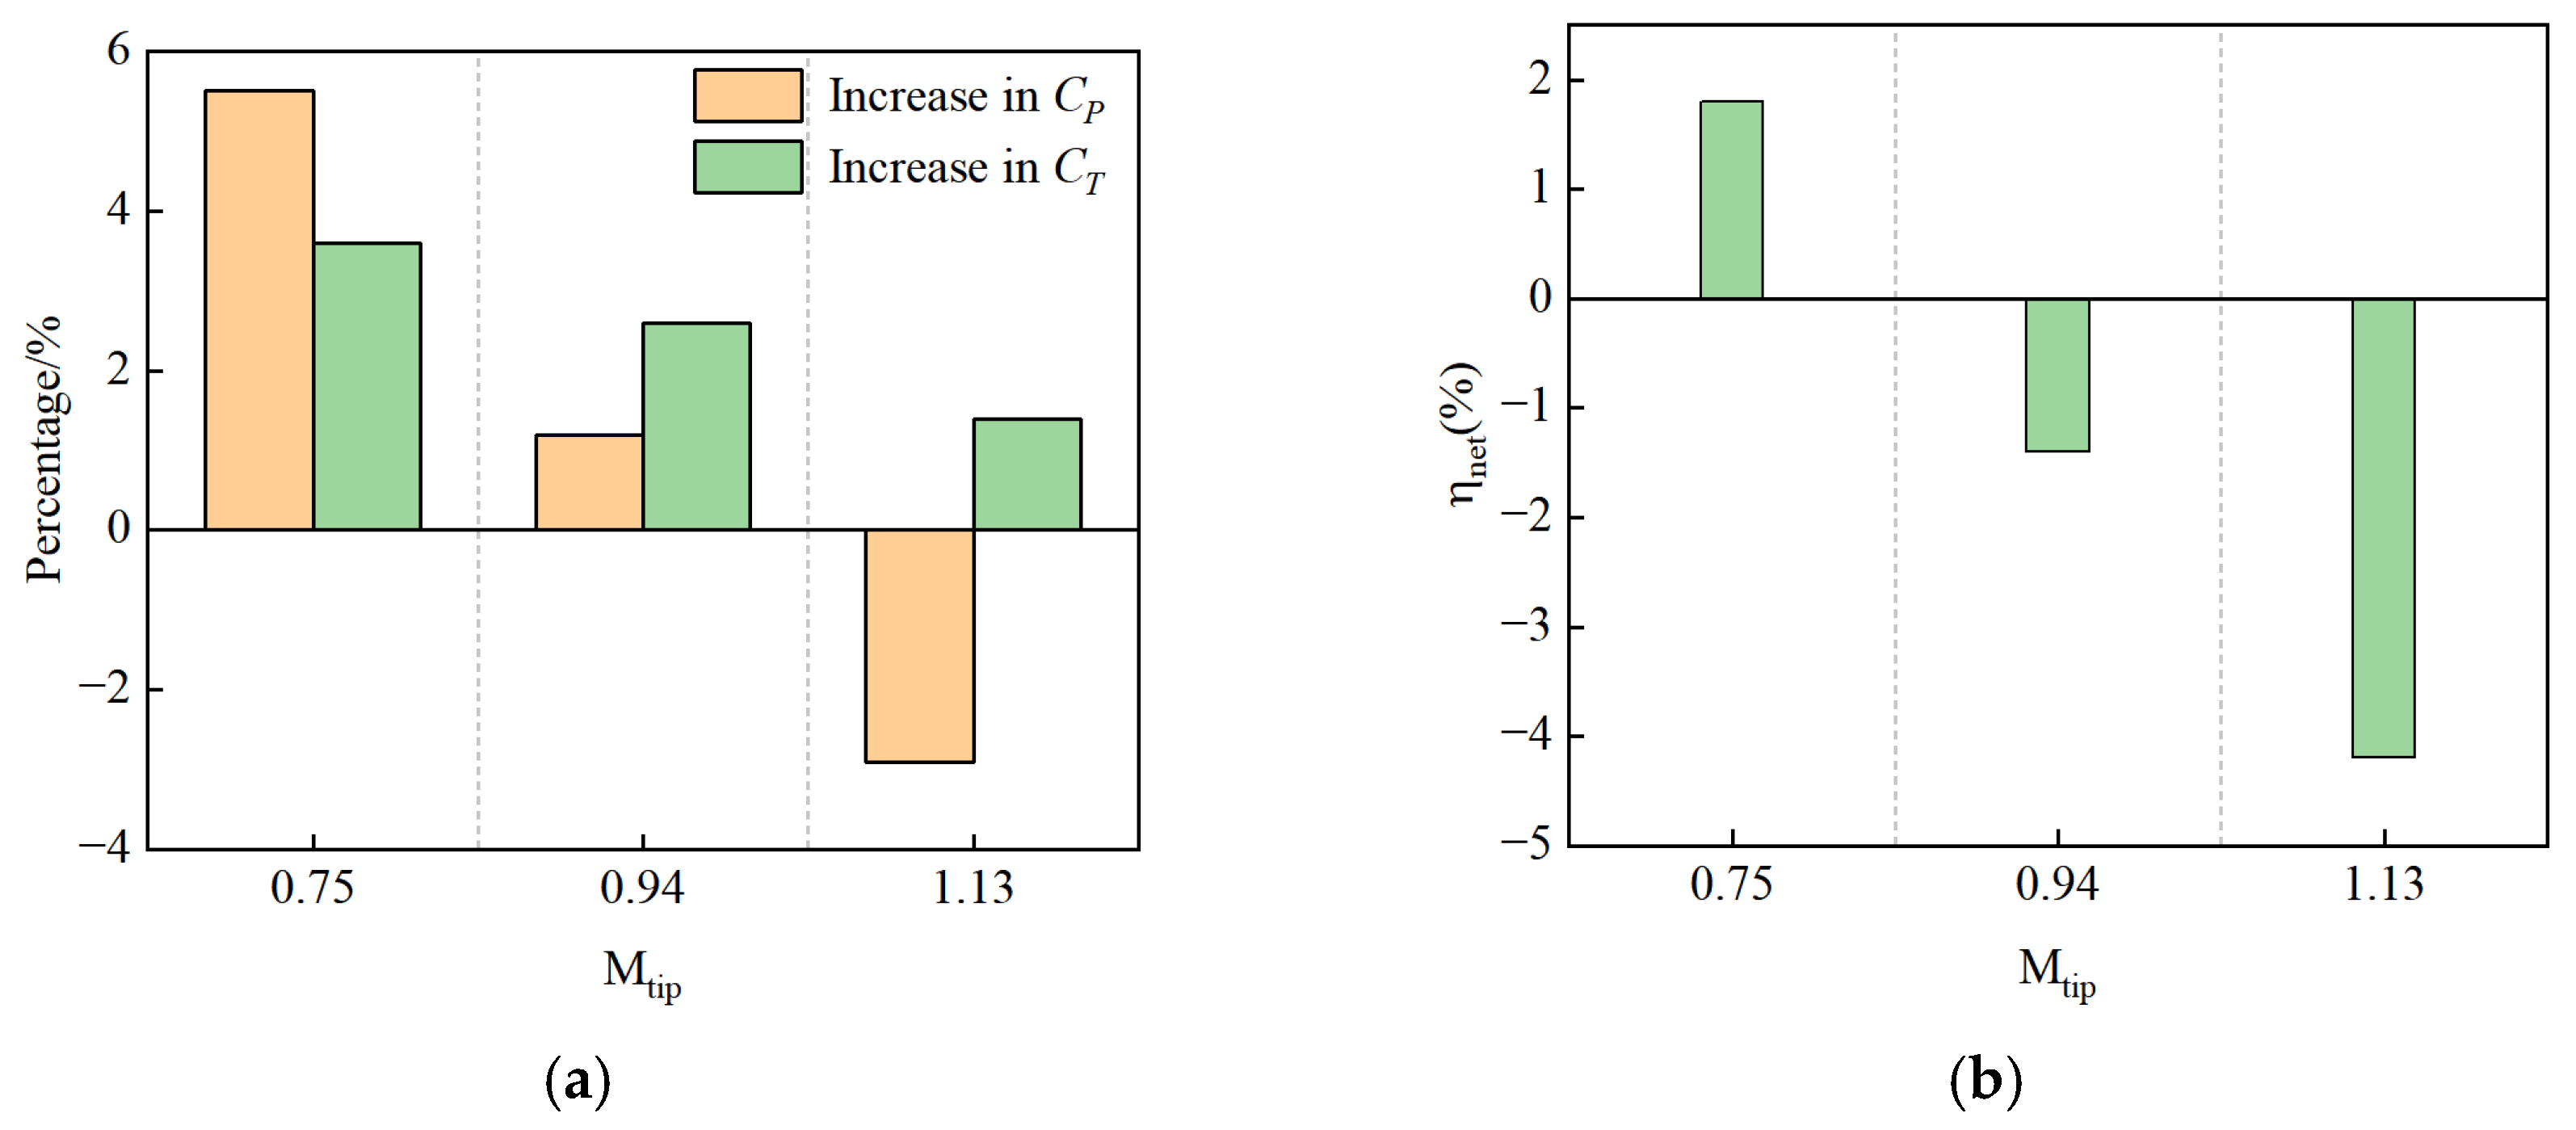
Figure 30 presents the specific increments in the power and thrust coefficients of the W3-X configuration relative to the baseline, together with the power–thrust net gain coefficient, at various tip Mach numbers. It can be seen that as the tip Mach number increases, the increment in C P decreases progressively and becomes negative at Mtip = 1.13, and the increment in thrust load also diminishes. Consequently, the power–thrust net gain coefficient decreases with increasing Mtip and becomes negative when the blade tip operates in the high-subsonic (Mtip = 0.94) and supersonic (Mtip = 1.13) regimes.
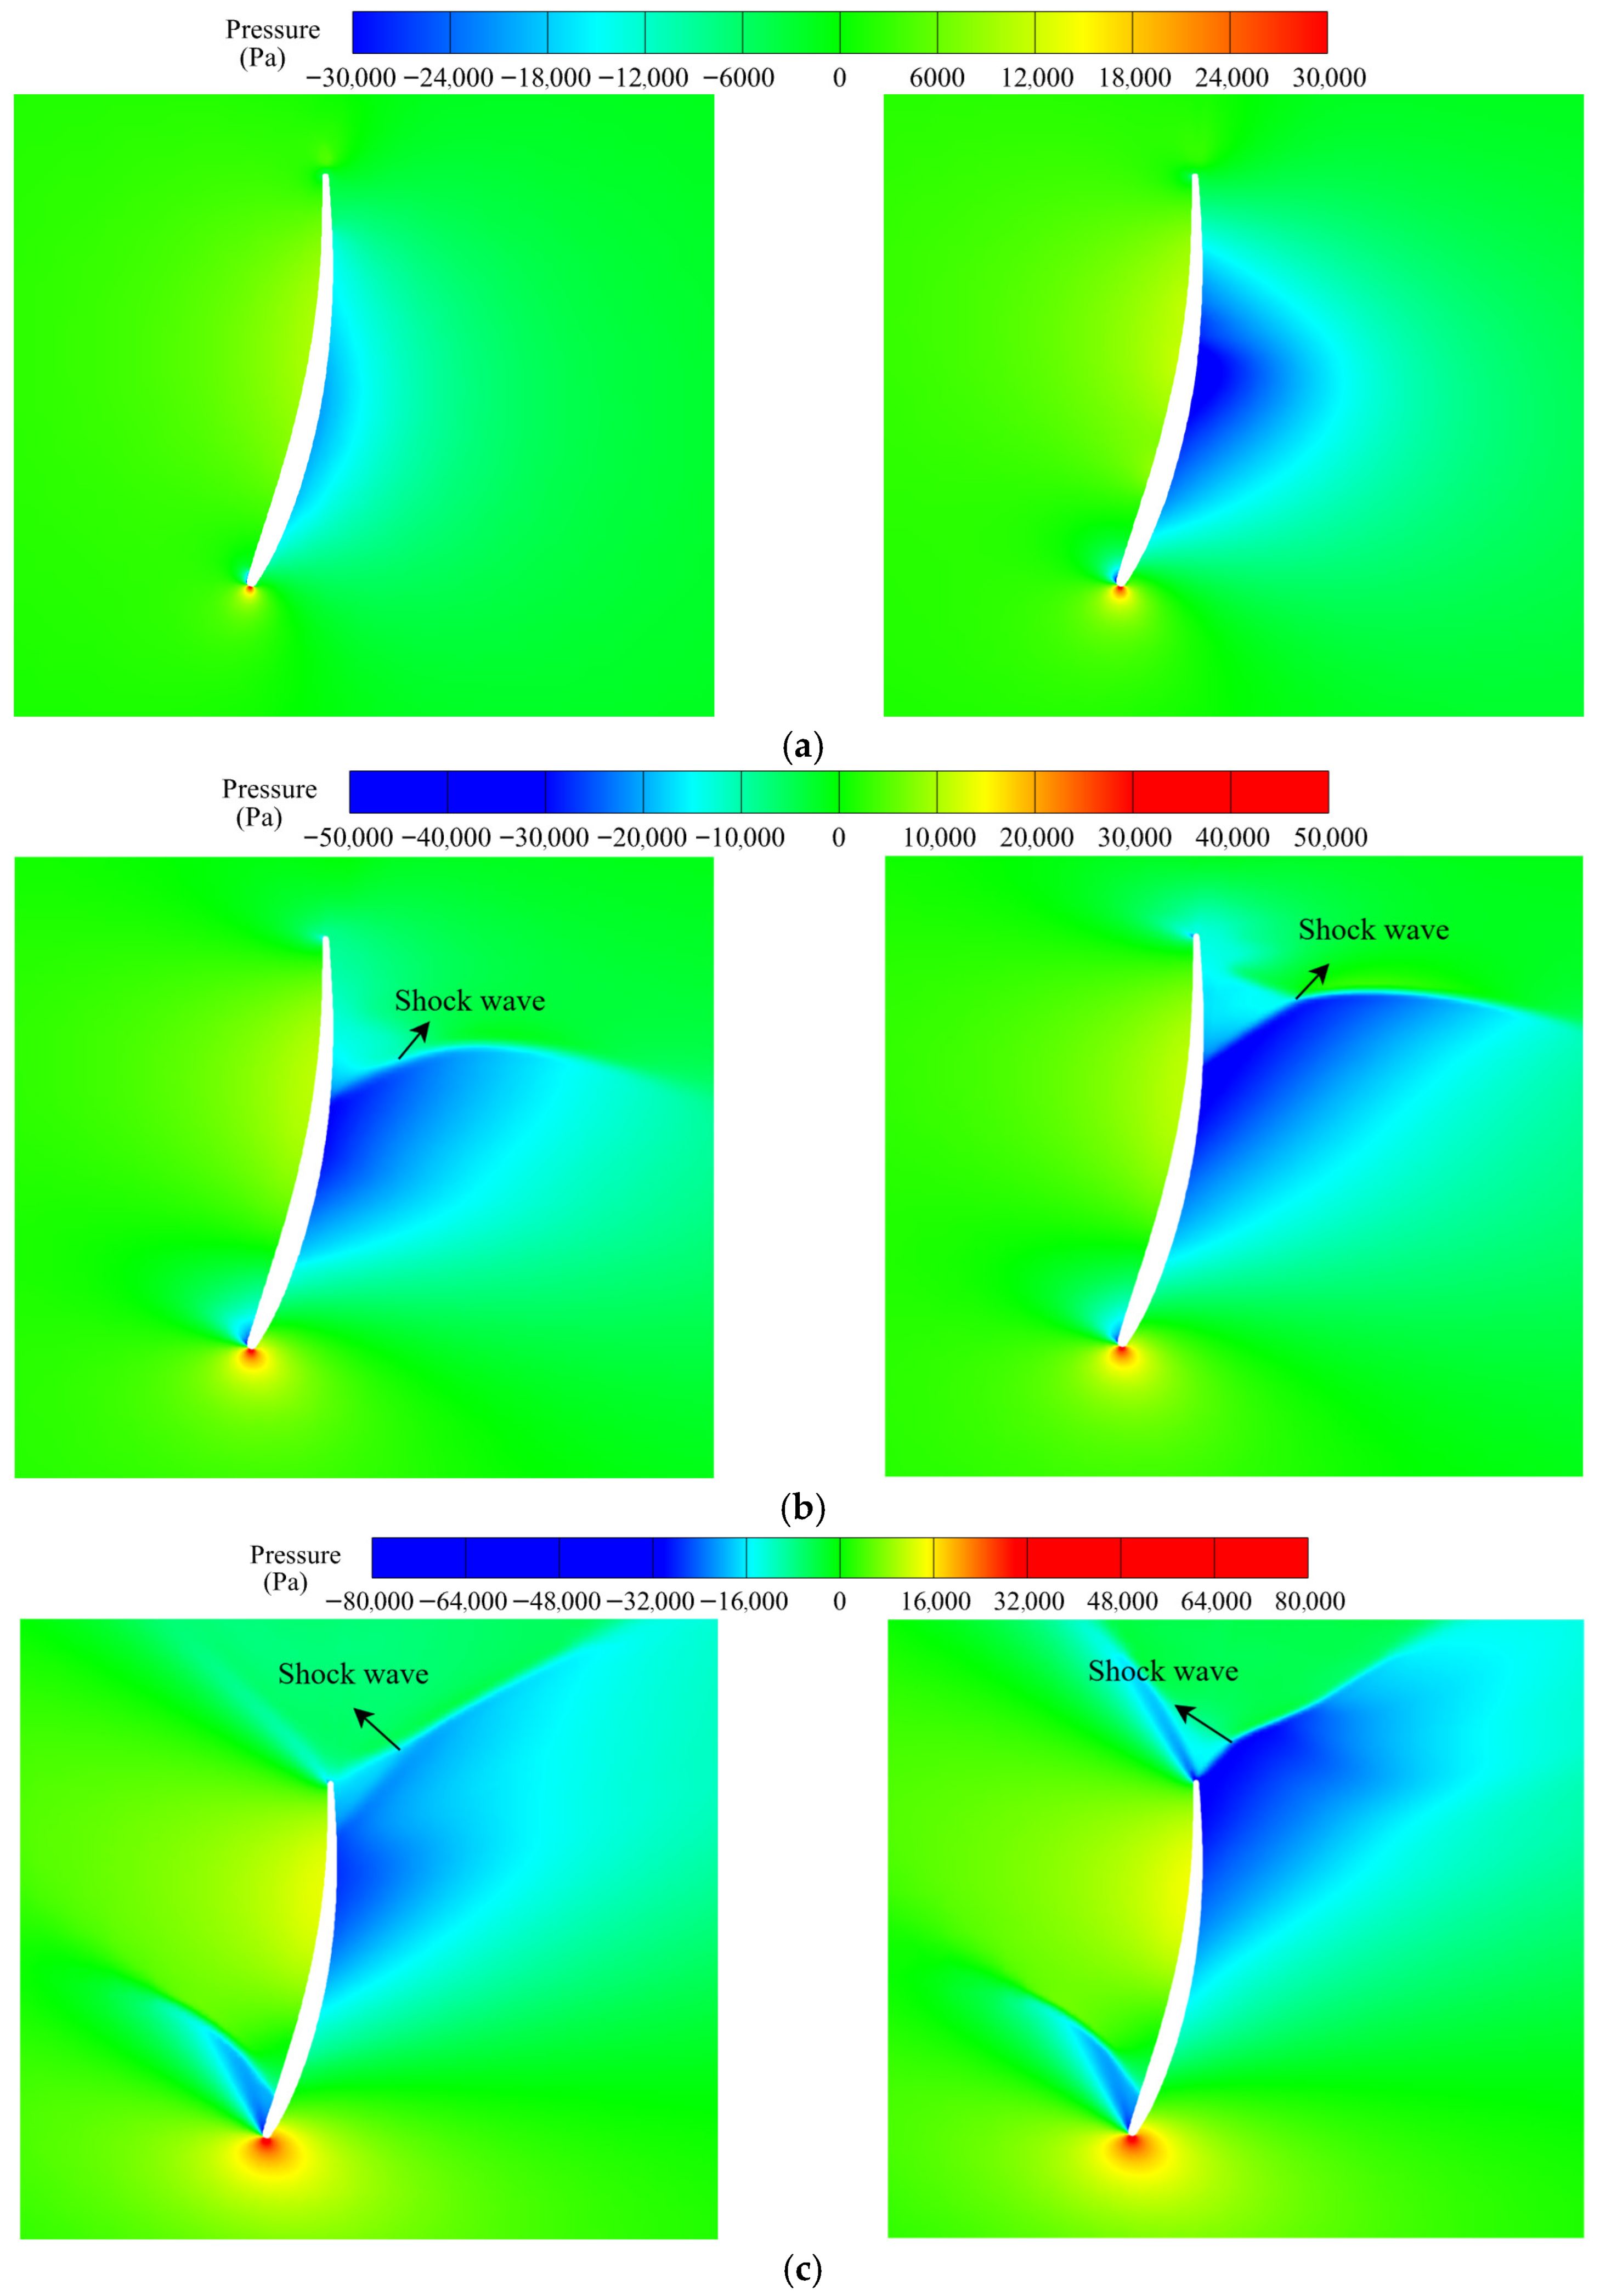
Figure 31 shows the pressure contours at the radial section r/R = 0.95 for the three operating conditions. At Mtip = 0.75, no shock wave can be observed. The W3-X configuration exhibits a more pronounced low-pressure region on the suction side, which increases the pressure difference between the suction and pressure sides in the tip region and enhances the aerodynamic performance. At Mtip = 0.94 and Mtip = 1.13, a shock wave appears on the suction side for both configurations. The pressure contours for the W3-X configuration show a stronger shock than the baseline, affecting a larger area.

5. Conclusions

This paper numerically studies the effects of three tip configurations, namely the tip plate, tip contraction, and winglet configurations, on the power output by the RAT. By introducing a power–thrust net gain coefficient to comprehensively evaluate the overall performance of each configuration in terms of the power output and load control, the winglet configuration, which demonstrated the highest power enhancement potential, was shown to be an optimized design variable arrangement based on the OED approach. Compared with those of the baseline configuration, the aerodynamic performance improvements of the three tip configurations are as follows.
The tip plate configuration can provide certain power enhancements at low tip speed ratios, particularly with a height of 0.5Ctip. Nevertheless, its application inevitably leads to in significant increases in thrust load under all operating conditions. In the medium to high tip speed ratio range of conventional air turbine operation, the power–thrust net gain coefficients become negative for all cases. Consequently, the tip plate configuration cannot achieve an effective balance between the power gain and load control, making it difficult to use as an effective power gain configuration.
The tip contraction configuration significantly reduces the thrust load, with this effect becoming increasingly pronounced as the tip speed ratio rises. Although it generally reduces the power coefficient, the configuration with a contraction starting position at r/R = 0.95 achieves a power increase of up to 2.05% and a maximum power–thrust net gain coefficient of 3.85%. These findings indicate that a properly designed tip contraction exhibits strong potential for the integrated optimization of power enhancement and load reduction initiatives.
The winglet configuration exhibited the most favorable power augmentation characteristics among the three evaluated configurations, delivering consistent power increases across all tip speed ratios, with a peak improvement of 7.59%. However, this enhancement was accompanied by an increase in thrust load, limiting the maximum power–thrust net gain coefficient to 1.72%, which was lower than that achieved by the tip contraction configuration.
Using the orthogonal experimental design method, the winglet configuration—identified as having the highest power enhancement potential—underwent parameter optimization. The optimized design resulted in an 8.69% increase in power output while effectively mitigating the associated rise in thrust load, thereby elevating the maximum power–thrust net gain coefficient to 3.95%. The flow field analysis confirmed that the optimized configuration significantly weakened the tip vortex intensity and reduced its spatial extent, contributing to lower energy losses in the tip region.
These findings provide a valuable reference for improving the aerodynamic efficiency of ram air turbine blades and highlight the strong potential for practical engineering applications. It is worth noting that both tip contraction and winglet configurations exhibited positive effects in this study. As tip contraction and winglet configurations have been widely demonstrated to be effective in wind turbines and fixed-wing aircraft, the conclusions can be considered credible when extended to other RAT configurations or similar turbine applications. Nevertheless, further numerical or experimental studies are required to fully establish their general applicability.

Author Contributions

Conceptualization, H.L. and W.Z.; methodology, H.L. and W.Z.; software, H.L.; validation, H.L. and Y.L.; formal analysis, H.L.; investigation, H.L.; resources, J.W. and C.R.; data curation, H.L.; writing—original draft preparation, H.L.; writing—review and editing, H.L. and W.Z.; visualization, H.L.; supervision, C.R.; project administration, W.Z. and C.R.; funding acquisition, W.Z. All authors have read and agreed to the published version of the manuscript.

Funding

This work was supported by the National Key R&D Program of China under grant no. 2022YFE0207000. The research represents one of the outcomes supported by this project.

Data Availability Statement

The data that support the findings of this study are available from the corresponding author upon reasonable request.

Conflicts of Interest

Authors Chunyu Ren, Jian Wang were employed by the company Aviation Industry Corporation of China. The remaining authors declare that the research was conducted in the absence of any commercial or financial relationships that could be construed as a potential conflict of interest.

References

  1. Maré, J.-C.; Fu, J. Review on Signal-by-Wire and Power-by-Wire Actuation for More Electric Aircraft. Chin. J. Aeronaut. 2017, 30, 857–870. [Google Scholar] [CrossRef]
  2. Guo, X.; Jiang, J. Rotational Speed Stability of Ram Air Turbine Under Aerodynamic Loads. Int. J. Struct. Stab. Dyn. 2024, 2650058. [Google Scholar] [CrossRef]
  3. Zhang, X.; Ding, S.; Du, F.; Ji, F.; Guo, S. Numerical Simulation on Aerodynamic Performance of Ram Air Turbine Based on Mixed Flow Field. In Volume 7: Fluids Engineering, Proceedings of the ASME 2018 International Mechanical Engineering Congress and Exposition, Pittsburgh, PA, USA, 9 November 2018; American Society of Mechanical Engineers: Pittsburgh, PA, USA, 2018. [Google Scholar]
  4. Saad, M.; Moh, M.; Mohd, S.B.; Zulkafli, M.F. A Survey on the Use of Ram Air Turbine in Aircraft. In Proceedings of the AIP Conference Proceedings, Jogjakarta, Indonesia, 1–3 August 2017. [Google Scholar]
  5. Zhang, Q. The Design of More-Electric Engine Power Systems. Ph.D. Thesis, University of Strathclyde, Glasgow, UK, 16 February 2024. [Google Scholar]
  6. Xu, Z.; Qi, Y.; Guerrero, J.M.; Vasquez, J.C.; Wang, Y.; Zhao, H.; Li, W.; Wu, Y. Stability-Oriented Impedance Modeling, Analysis, and Shaping for Power Supply System in More-Electric Aircraft: A Review. IEEE Trans. Transp. Electrif. 2024, 10, 9351–9365. [Google Scholar] [CrossRef]
  7. Gębura, A.; Szelmanowski, A.; Jacyna-Gołda, I.; Gołda, P.; Kalbarczyk, M.; Tomaszewska, J. Concepts and Experiments on More Electric Aircraft Power Systems. Energies 2025, 18, 1653. [Google Scholar] [CrossRef]
  8. Zhao, X.; Wang, L.; Zhou, M. Comparative Analysis of Ram Air Turbine System for Large Civil Aircraft. In Proceedings of the CSAA/IET International Conference on Aircraft Utility Systems (AUS 2022), Nanchang, China, 17–20 August 2022. [Google Scholar]
  9. Aguida, M.E.; Che, Y.; Yang, J. Technological Advancements and Future Prospects of Electrical Power Systems for Sustainable More Electric Aircraft. Propuls. Power Res. 2024, 13, 475–486. [Google Scholar] [CrossRef]
  10. Bolaños-Vera, M.A.; Ortiz-Pérez, A.S.; Durazo-Romero, E.S.; Pérez-Mota, J.E.; González-Uribe, L.A.; Pérez-Reyes, I. Numerical Analysis of Aerodynamic Performance of the Ram Air Turbine in an Aircraft. Heliyon 2024, 10, e32039. [Google Scholar] [CrossRef] [PubMed]
  11. Saad, M.M.M.; Mohd, S.; Zulkafli, M.F.; Samiran, N.A.; Didane, D.H. CFD Simulation Study on the Performance of a Modified Ram Air Turbine (RAT) for Power Generation in Aircrafts. Fluids 2021, 6, 391. [Google Scholar] [CrossRef]
  12. Gadda, K.S.; Avila Zaya, M.G.; Venkatesan, N.; Avital, E.J. Small Wind Ram Air Turbine Blade Geometric Modification for Performance. In Proceedings of the 14th UK Conference on Wind Engineering, Southampton, UK, 4–6 September 2024. [Google Scholar] [CrossRef]
  13. Zhang, D.; Yang, F.; Zhai, X.; Lu, Y. Research on Blade Tip Spoiler of Ram Air Turbine. In Proceedings of the 5th International Forum on Avionics Systems for Civil Aircraft, Shanghai, China, 19–21 April 2016. (In Chinese). [Google Scholar]
  14. Gharbia, Y.; Derakhshandeh, J.F.; Alam, M.M.; Amer, A.M. Developments in Wingtip Vorticity Mitigation Techniques: A Comprehensive Review. Aerospace 2023, 11, 36. [Google Scholar] [CrossRef]
  15. Cheng, H.; Ji, B.; Long, X.; Huai, W.; Farhat, M. A Review of Cavitation in Tip-Leakage Flow and Its Control. J. Hydrodyn. 2021, 33, 226–242. [Google Scholar] [CrossRef]
  16. Narayan, G.; John, B. Effect of Winglets Induced Tip Vortex Structure on the Performance of Subsonic Wings. Aerosp. Sci. Technol. 2016, 58, 328–340. [Google Scholar] [CrossRef]
  17. Gavrilović, N.N.; Rašuo, B.P.; Dulikravich, G.S.; Parezanović, V.B. Commercial Aircraft Performance Improvement Using Winglets. FME Trans. 2015, 43, 1–8. [Google Scholar] [CrossRef]
  18. Shelton, A.; Tomar, A.; Prasad, J.; Smith, M.J.; Komerath, N. Active Multiple Winglets for Improved Unmanned-Aerial-Vehicle Performance. J. Aircr. 2006, 43, 110–116. [Google Scholar] [CrossRef]
  19. Utomo, M.S.K.T.S.; Yohana, E.; Mahendra, C.; Utama, I.Y. Analysis of Blended Winglet Parameters on the Aerodynamic Characteristics of NXXX Aircraft Using Computational Fluid Dynamics (CFD). Results Eng. 2024, 24, 102901. [Google Scholar] [CrossRef]
  20. Farhan, A.; Hassanpour, A.; Burns, A.; Motlagh, Y.G. Numerical Study of Effect of Winglet Planform and Airfoil on a Horizontal Axis Wind Turbine Performance. Renew. Energy 2019, 131, 1255–1273. [Google Scholar] [CrossRef]
  21. Khaled, M.; Ibrahim, M.M.; Abdel Hamed, H.E.; AbdelGwad, A.F. Investigation of a Small Horizontal–Axis Wind Turbine Performance with and without Winglet. Energy 2019, 187, 115921. [Google Scholar] [CrossRef]
  22. Johansen, J.; Sørensen, N.N. Numerical Analysis of Winglets on Wind Turbine Blades Using CFD. In Proceedings of the European Wind Energy Congress, Milan, Italy, 7–10 May 2007. [Google Scholar]
  23. Zhang, Z.; Kuang, L.; Han, Z.; Zhou, D.; Zhao, Y.; Bao, Y.; Duan, L.; Tu, J.; Chen, Y.; Chen, M. Comparative Analysis of Bent and Basic Winglets on Performance Improvement of Horizontal Axis Wind Turbines. Energy 2023, 281, 128252. [Google Scholar] [CrossRef]
  24. Gertz, D.; Johnson, D.A.; Swytink-Binnema, N. An Evaluation Testbed for Wind Turbine Blade Tip Designs—Winglet Results. Wind Eng. 2012, 36, 389–410. [Google Scholar] [CrossRef]
  25. Madi, M.; Tuswan, T.; Arirohman, I.D.; Ismail, A. Comparative Analysis of Taper and Taperless Blade Design for Ocean Wind Turbines in Ciheras Coastline, West Java. Kapal 2021, 18, 8–17. [Google Scholar] [CrossRef]
  26. Johansen, J.; Sørensen, N.N. Numerical Investigation of Three Wind Turbine Blade Tips; Technical Report RISO-R-1353(EN); Risø National Laboratory, Wind Energy Department: Roskilde, Denmark, 2002; Available online: https://www.google.com/url?sa=t&source=web&rct=j&opi=89978449&url=https://orbit.dtu.dk/files/7712498/ris_r_1353.pdf&ved=2ahUKEwioiN3f16qQAxVcCTQIHTgCLpcQFnoECBcQAQ&usg=AOvVaw1o2yJUx_ED0twP3u7tOhY9 (accessed on 21 July 2025).
  27. Giguere, P.; Selig, M.S. Design of a Tapered and Twisted Blade for the NREL Combined Experiment Rotor; Technical Report NREL/SR-500-26173; National Renewable Energy Laboratory (NREL): Golden, CO, USA, 1999.
  28. Kaya, M.; Elfarra, M. Effect of Taper Distribution on the Torque and Thrust Generated by a Wind Turbine Rotor Blade. In Proceedings of the 2019 10th International Renewable Energy Congress (IREC), Sousse, Tunisia, 26–28 March 2019; IEEE: Piscataway, NJ, USA, 2019; pp. 1–6. [Google Scholar]
  29. Madsen, M.H.A.; Zahle, F.; Horcas, S.G.; Barlas, T.K.; Sørensen, N.N. CFD-Based Curved Tip Shape Design for Wind Turbine Blades. Wind Energy Sci. 2022, 7, 1471–1501. [Google Scholar] [CrossRef]
  30. Song, K.; Huan, H.-T.; Wei, L.-C.; Liu, C.-X. Performance Analysis of a Modified Archimedes Spiral Wind Turbine Having Winglet on Blade. Energy 2025, 333, 137389. [Google Scholar] [CrossRef]
  31. Zhang, D.; Liu, D.; Liu, X.; Xu, H.; Wang, Y.; Bi, R.; Qian, P. Unsteady Effects of a Winglet on the Performance of Horizontal-Axis Tidal Turbine. Renew. Energy 2024, 225, 120334. [Google Scholar] [CrossRef]
  32. Signor, D.B.; Acree, C.W.; Sebrell, W.A. Performance and Loads Data from an Outdoor Hover Test of a Lynx Tail Rotor; Technical Report NASA-TM-101057; National Aeronautics and Space Administration (NASA), Ames Research Center: Moffett Field, CA, USA, 1989.
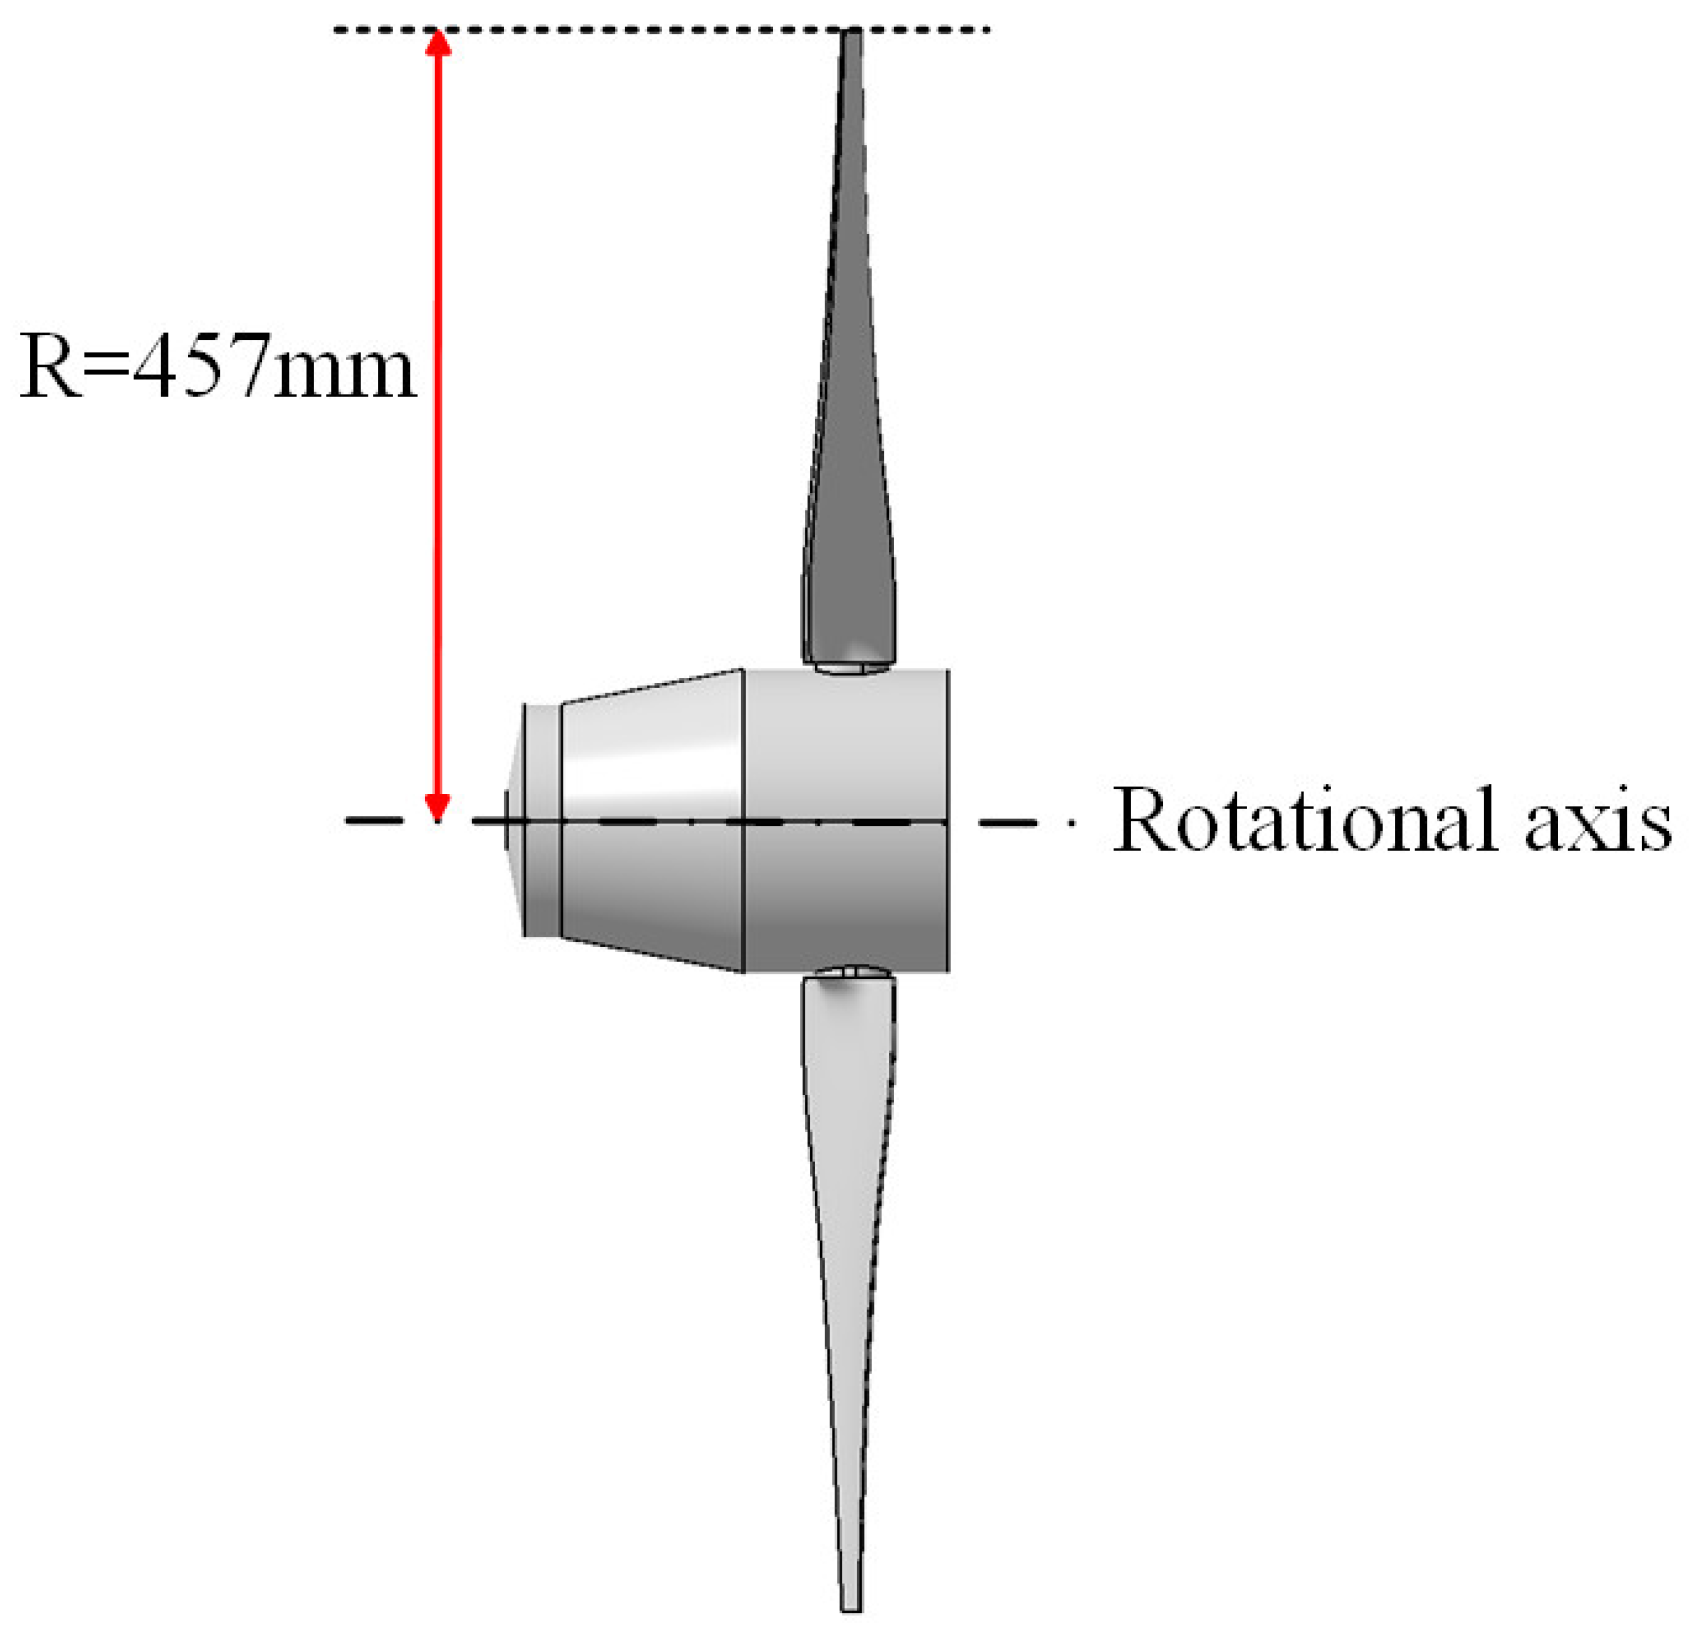
Figure 1. Geometry model of the Ram Air turbine.
Aerospace 12 00937 g001
Figure 2. Chord and twist distributions along the blade span.
Aerospace 12 00937 g002
Figure 3. Schematic of the computational domain and the boundary conditions: (a) external computational domain and boundary conditions; (b) geometry of the MRF rotating region.
Aerospace 12 00937 g003
Figure 4. The surface mesh of the RAT blade and the corresponding flow field mesh: (a) mesh of the background; (b) mesh slice views of the side; (c) wake mesh refinement zone; (d) blade tip surface mesh; (e) mesh of the blade cross-section.
Aerospace 12 00937 g004
Figure 5. Top view of the computational model for the Lynx tail rotor.
Aerospace 12 00937 g005
Figure 6. Flow field and surface mesh of the Lynx tail rotor.
Aerospace 12 00937 g006
Figure 7. Comparison of the simulated and experimental torque values of the Lynx tail rotor.
Aerospace 12 00937 g007
Figure 8. Variation in the aerodynamic performance of the baseline configuration with the TSR.
Aerospace 12 00937 g008
Figure 9. Surface streamlines on the suction surface of the blade under different TSRs: (a) TSR = 2.39; (b) TSR = 4.78; (c) TSR = 7.17.
Aerospace 12 00937 g009
Figure 10. Tip plate configurations with different heights: (a) H/Ctip = 0.3; (b) H/Ctip = 0.4; (c) H/Ctip = 0.5; (d) H/Ctip = 0.6.
Aerospace 12 00937 g010aAerospace 12 00937 g010b
Figure 11. Increments in the power coefficient and thrust coefficient of the tip plate configurations relative to the baseline configuration, and their power–thrust net gain coefficient: (a) increment of power coefficient; (b) increment of thrust coefficient; (c) power–thrust net gain coefficient.
Aerospace 12 00937 g011
Figure 12. Tip contraction configurations with contraction position: (a) r/R = 0.9; (b) r/R = 0.92; (c) r/R = 0.95; (d) r/R = 0.97.
Aerospace 12 00937 g012
Figure 13. Increments in the power coefficient and thrust coefficient of the tip contraction configurations relative to the baseline configuration, and their power–thrust net gain coefficient: (a) increment of power coefficient; (b) increment of thrust coefficient; (c) power–thrust net gain coefficient.
Aerospace 12 00937 g013
Figure 14. Observation plane for the vorticity analysis.
Aerospace 12 00937 g014
Figure 15. Comparison of vorticity contours between the baseline configuration (left) and the W2 configuration (right): (a) TSR = 6.22; (b) TSR = 5.53.
Aerospace 12 00937 g015
Figure 16. Illustration of winglet configuration.
Aerospace 12 00937 g016
Figure 17. Definition of the key geometric parameters of the blade tip winglet: (a) definition of winglet height and cant angle; (b) definition of twist angle.
Aerospace 12 00937 g017
Figure 18. Comparison of the power and thrust coefficient curves between W3 and the baseline configurations.
Aerospace 12 00937 g018
Figure 19. Increments in the power coefficient and thrust coefficient of the W3 configuration relative to the baseline configuration.
Aerospace 12 00937 g019
Figure 20. Comparison of blade tip vortex shedding between the W3 and baseline configurations: (a) baseline configuration; (b) W3 configuration.
Aerospace 12 00937 g020
Figure 21. Power–thrust net gain coefficients of the three configurations at different TSRs.
Aerospace 12 00937 g021
Figure 22. Comparison of pressure distributions at different blade sections for the four configurations: (a) P1 section; (b) P2 section; (c) P3 section.
Aerospace 12 00937 g022
Figure 23. Some examples of winglet configurations in an orthogonal array: (a) case 2; (b) case 4; (c) case 7; (d) case 9.
Aerospace 12 00937 g023
Figure 24. Mean increases in the power coefficient and thrust coefficient: (a) mean increases in the power coefficient; (b) mean increases in the thrust coefficient.
Aerospace 12 00937 g024
Figure 25. The designed winglet using the optimal variable level arrangement.
Aerospace 12 00937 g025
Figure 26. Power and thrust coefficient increments of the W3 and W3-X configurations: (a) power coefficient increment; (b) thrust coefficient increment.
Aerospace 12 00937 g026
Figure 27. Comparison of power–thrust net gain coefficients before and after optimization at various TSRs.
Aerospace 12 00937 g027
Figure 28. Comparison of vorticity contours between the W3 configuration (left) and the W3-X configuration (right): (a) TSR = 6.22; (b) TSR = 4.98; (c) TSR = 4.15; (d) TSR = 2.49.
Aerospace 12 00937 g028
Figure 29. Wake structure comparison of the W3 (left) and W3-X (right) blade configurations: (a) TSR = 6.22; (b) TSR = 4.98.
Aerospace 12 00937 g029
Figure 30. Increments of the power and thrust coefficients and the combined power–thrust net gain coefficient of the W3-X configuration relative to the baseline at different tip Mach numbers: (a) increments in the power and thrust coefficients; (b) power–thrust net gain coefficient.
Aerospace 12 00937 g030
Figure 31. Pressure contours of the baseline configuration (left) compared with the W3-X configuration (right): (a) Mtip = 0.75; (b) Mtip = 0.94; (c) Mtip = 1.13.
Aerospace 12 00937 g031
Table 1. Grid independence verification and computational results.
GridBlade Surface Mesh Number (×104)Growth RateMesh Number
(×104)
Torque (N·m)Thrust (N)
G01321.2077350.72643.16
G02531.15144750.58642.27
G03781.10213550.51641.78
Table 2. Comparison of the vorticity extremes in tip vortices between the two configurations.
TSRBlade Tip ConfigurationMaximum Vorticity (s−1)
5.53Baseline configuration67,156
5.53W2 configuration61,008
6.22Baseline configuration52,804
6.22W2 configuration43,506
Table 3. Design parameters and design levels of the winglet.
ParametersLevels
L1L2L3
Cant angle (°)306090
Twist angle (°)048
Winglet height (mm)202530
Table 4. L9(33) standard orthogonal array for the parametric study of the winglet.
OED No.Cant Angle (°)Twist Angle (°)Winglet Height (mm)CPCT
1300250.19660.3412
2304200.19860.3413
3308300.18950.3372
4600300.20810.3354
5604250.20600.3297
6608200.20390.3269
7900200.21100.3204
8904300.21280.3202
9908250.21030.3037
Table 5. Average and range of parametric effects on power and thrust coefficient increments.
LevelsCant Angle (°)Twist Angle (°)Winglet Height (mm)
Δ C ¯ P L1−0.00700.00330.0026
L20.00410.00390.0024
L30.0095−0.00070.0016
R ( Δ C ¯ P ) /0.01650.00460.0010
Δ C ¯ T L1−0.01400.00360.0007
L20.00190.00170.0003
L30.0111−0.0061−0.0020
R ( Δ C ¯ T ) /0.02510.00970.0027
Table 6. Parameters for the three operating conditions.
CaseRotational Speed (r/min)Freestream Velocity (m/s)TSRMtip
15200604.150.75
26500754.150.94
37800904.151.13
Disclaimer/Publisher’s Note: The statements, opinions and data contained in all publications are solely those of the individual author(s) and contributor(s) and not of MDPI and/or the editor(s). MDPI and/or the editor(s) disclaim responsibility for any injury to people or property resulting from any ideas, methods, instructions or products referred to in the content.