Article

Quaternary Correlation Prediction Compensation for Heading Commands in Virtual Autopilot

by
Yutong Zhou
* and
Shan Fu
Department of Automation, School of Automation and Intelligent Sensing, Shanghai Jiao Tong University, Shanghai 200240, China
*
Author to whom correspondence should be addressed.
Aerospace 2025, 12(10), 936; https://doi.org/10.3390/aerospace12100936 (registering DOI)
Submission received: 10 September 2025 / Revised: 15 October 2025 / Accepted: 16 October 2025 / Published: 17 October 2025
(This article belongs to the Section Aeronautics)

Abstract

Virtual commands serve as the essential framework for establishing interaction between the virtual pilot and the MCP in autopilot scenarios. Conventional proportional-integral-derivative (PID) controllers are insufficient to ensure accurate flight trajectories due to system hysteresis. To overcome this limitation, a quaternary correlation prediction compensation PID (QCPC-PID) approach is introduced for computing virtual heading commands in autopilot tasks. The method integrates multi-feature statistics, entropy-based predictive compensation, and quaternary correlations. First, flight trajectory error statistics are dynamically calculated using signed error distances to assess deviation levels. Second, a predictive structure based on information entropy is applied to enhance PID compensation. Third, quaternary correlation dependence is established to generate virtual heading commands. The findings confirm the effectiveness of the method in improving flight convergence. The incorporation of predictive structures and quaternary correlations is critical for achieving predictive compensation during PID tuning, thereby reducing flight trajectory deviations. The quaternary correlation prediction compensation method ensures superior performance of PID control in modeling heading adjustment behavior under autopilot conditions.

1. Introduction

Modeling virtual human behaviors provides a means to investigate the human–computer interaction process [1,2]. In an autopilot flight scenario, virtual commands represent the control actions of a pilot directed to the mode control panel (MCP). To accomplish a mission from one position to another, the virtual pilot inputs virtual heading or altitude commands into the MCP to adjust heading or altitude, respectively. The current and target positions can be used to compute the virtual heading commands [3]. However, flight trajectories often deviate significantly from the planned path due to pronounced hysteresis in the aircraft system. Such hysteresis results from the high inertia of the aircraft and the unstable external airflow. Furthermore, the virtual heading command can only be specified with integer precision, making it difficult to eliminate trajectory deviations. The proportional-integral-derivative (PID) control algorithm is a classical method for computing virtual heading commands [4,5,6], yet the degree of trajectory deviation is highly sensitive to the PID parameter settings. Genetic algorithms offer a conventional optimization-based approach for tuning PID parameters [7,8], but the required number of iterations may exceed the number of heading adjustments.
Given that strong system hysteresis often leads to deviations of flight trajectories from the planned path, compensation strategies provide a feasible means to improve flight convergence. Feedforward [9] and feedback [10,11] controls are two conventional compensation methods that enhance the application of the PID algorithm in high-hysteresis systems. In general, feedforward control relies on the observation of disturbance signals  [12,13,14], whereas feedback control depends on error utilization [15,16]. Since external airflow is unstable and disturbances are random, applying feedback compensation by evaluating flight trajectory errors may be more effective than feedforward compensation based on disturbance estimation. Although the differential unit in PID predicts error changes [17], PID control cannot adequately capture the direct effect of future states on decision-making [18]. Incorporating a predictive structure within feedback compensation offers a viable approach for computing virtual heading commands to achieve improved flight performance.
Performance compensation is a type of feedback control method [19,20], and the choice of assessment indicators plays a critical role in its effectiveness. Instant error is a commonly used indicator [21,22,23], yet it often fails to capture the overall characteristics of error, as flight trajectories typically deviate from the planned path due to aircraft inertia, unstable airflow, and the limited heading precision of the MCP. Statistical error information can provide stronger support for evaluation. Incorporating error statistics into the predictive structure can enhance the convergence of flight trajectories. Since different statistics represent distinct data characteristics, their weights may vary. Information entropy provides a means of quantifying information importance [24] and can be applied to compute objective information weights [25]. In addition, establishing correlations between the PID algorithm and the predictive structure can further reduce trajectory deviations. Unlike the direct application of compensation structures in PID algorithms [26], correlating PID parameters with predictive parameters can strengthen their dependence and improve PID tuning performance. Achieving more convergent flight trajectories requires addressing the dual challenge of integrating error statistics into the predictive structure and establishing the dependence between PID control and the prediction unit.
A quaternary correlation prediction compensation PID (QCPC-PID) method is proposed to compute virtual heading commands for improved flight convergence. The method incorporates a predictive structure derived from flight trajectory error statistics and establishes correlation dependence between the PID control and the predictive structure. As a result, the flight trajectory achieves closer convergence to the planned path. The main contributions are summarized as follows.
(1)
The signed error distance is defined to compute flight trajectory error statistics, enabling dynamic assessment of flight convergence degrees;
(2)
The influence of trajectory deviations is reflected in the weights of different error statistics, which are applied to construct the predictive structure and compensate for the PID control process;
(3)
Virtual heading commands are generated through the quaternary correlation dependence between PID control and the predictive structure, leading to more convergent flight trajectories.

2. Preliminaries

For a flight mission from the initial position S ( l o n S , l a t S , a l t S ) to the target position T ( l o n T , l a t T , a l t T ) , the virtual pilot operates the autopilot through heading or altitude commands, where l o n , l a t , and  a l t denote longitude, latitude, and altitude, respectively. The virtual altitude commands are set to the target altitude a l t T , while the virtual heading command requires computation to ensure satisfactory flight performance. When the aircraft turns to the commanded heading, that is, when the current heading H C matches the previously set virtual heading command, the  m t h heading adjustment is executed. The heading H C T from the current position C ( l o n C , l a t C , a l t C ) to the target T can be determined as [27]:
H C T ( m ) = mod 180 π arctan 2 cos ( l a t C ) sin ( l a t T ) sin ( l a t C ) cos ( l a t T ) cos ( l o n T l o n C ) sin ( l o n T l o n C ) cos ( l a t T ) + 360 , 360 ,
where arctan 2 ( · ) returns a value in the range π to π . In a similar manner, the heading H S T from S to T can also be calculated.
The PID algorithm can be applied to compute virtual heading commands to improve trajectory performance. However, flight convergence is sensitive to parameter settings, and conventional PID control cannot directly incorporate the future state of errors. Introducing a predictive structure and establishing the dependence between the PID parameters and the prediction module can enhance overall flight performance.

3. Methodology

The QCPC-PID method introduces a prediction compensation structure for PID control and establishes quaternary correlations between the PID parameters and the predictive parameter. Specifically, the multi-feature statistical component dynamically computes the error statistics of the flight trajectory. The predictive parameter calculation component applies the information entropy to design the predictive structure. The relationship establishment component defines the correlation between the predictive structure and PID control to generate virtual heading commands. The overall method is illustrated in Figure 1.

3.1. Multi-Feature Statistics

Error statistics of the flight trajectory are computed to dynamically evaluate deviation levels. Due to aircraft inertia, unstable external airflow, and the limited precision of MCP heading settings, the trajectory may deviate from the planned path. In some cases, the trajectory fluctuates around the planned path.
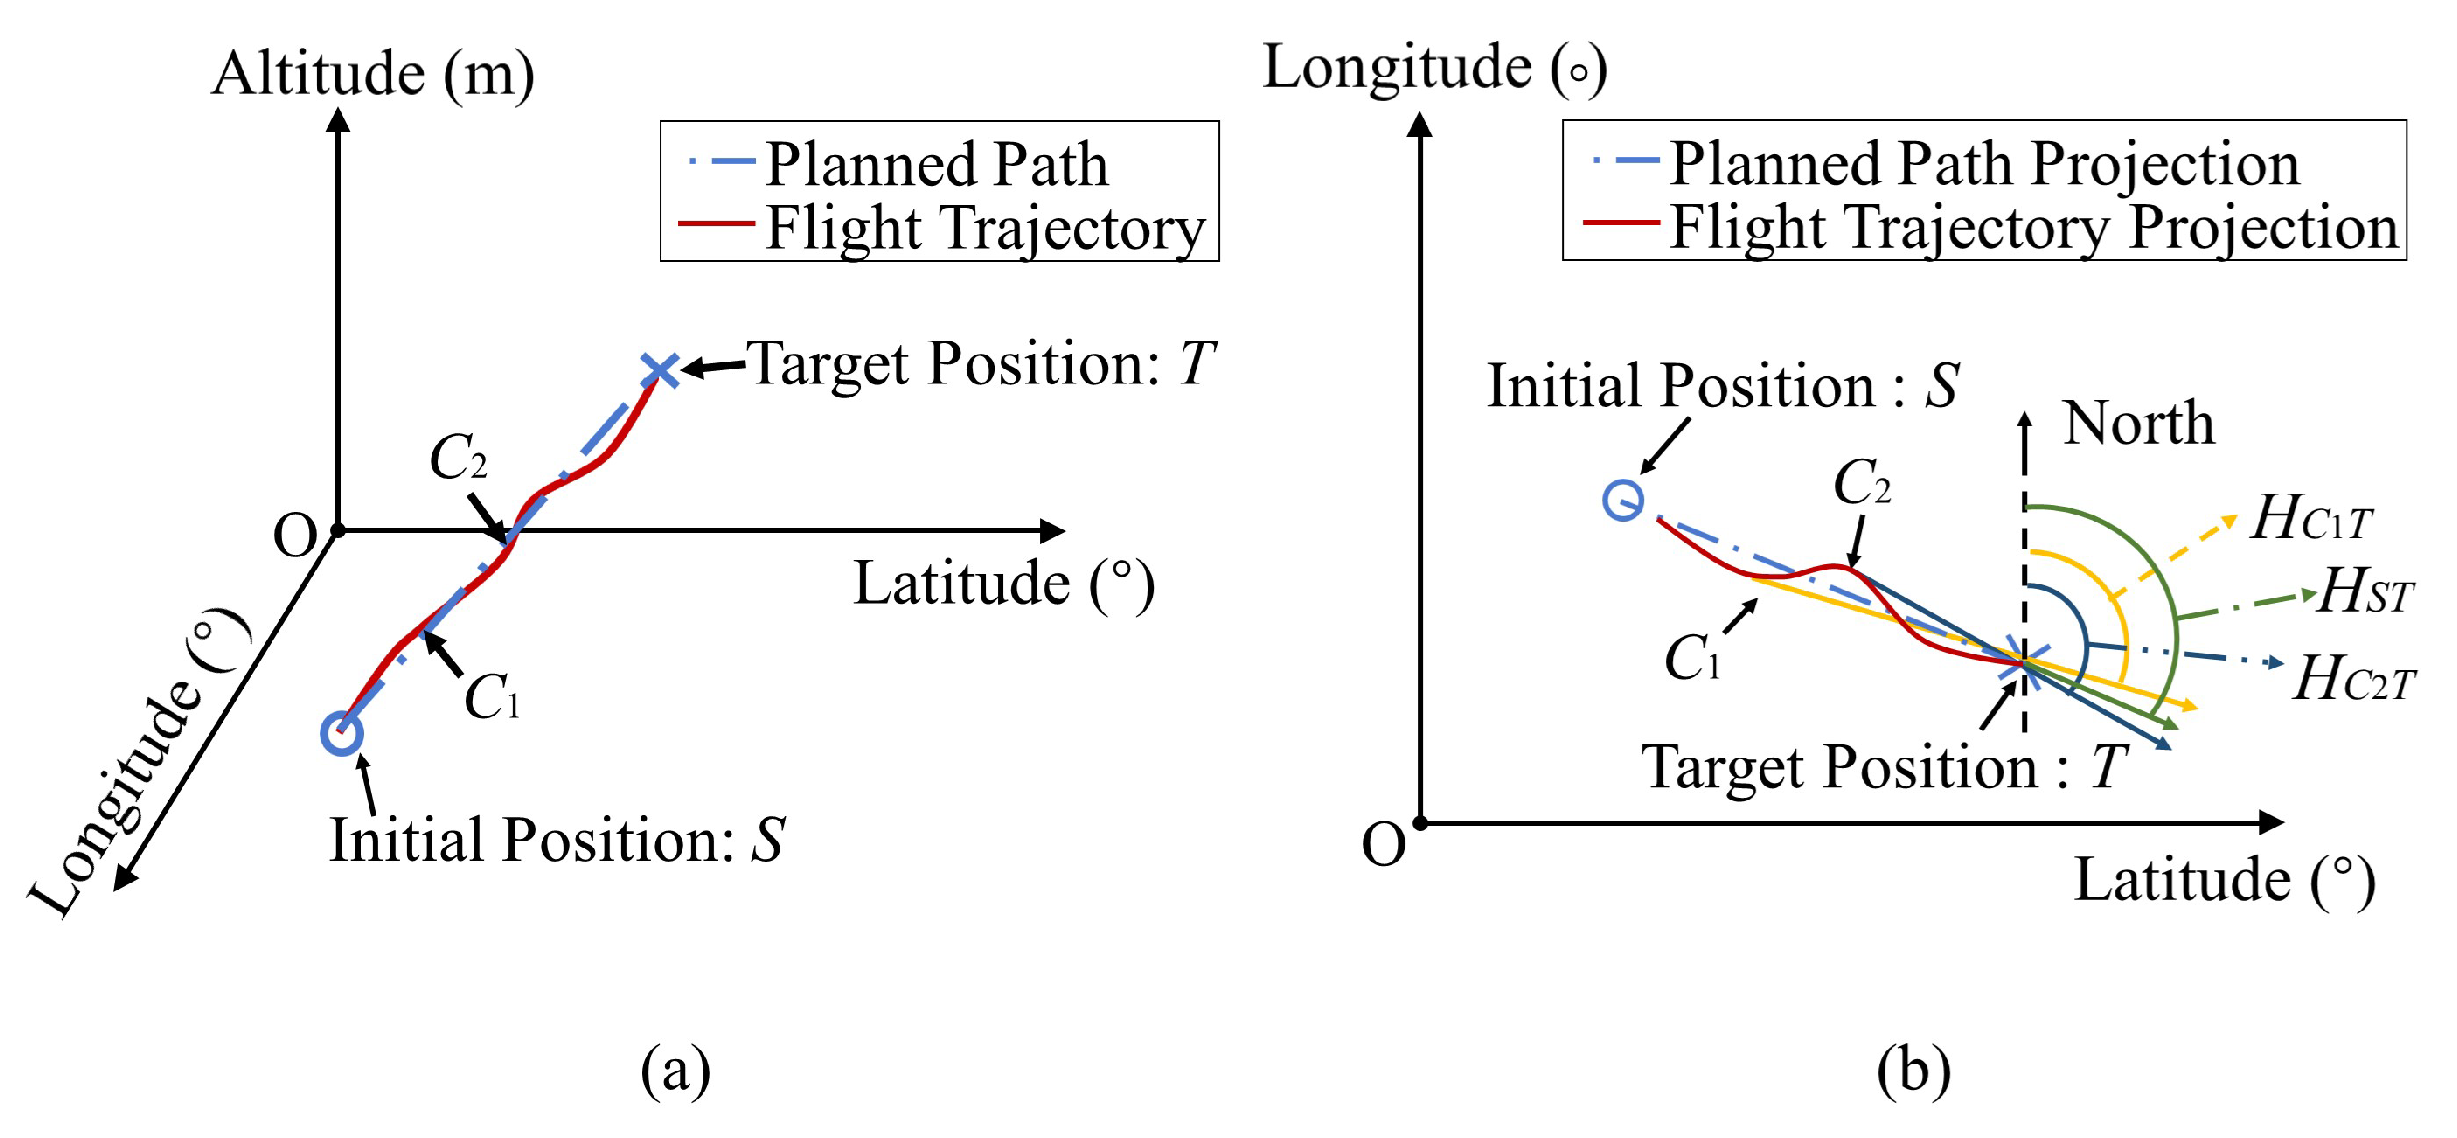
A representative flight trajectory is illustrated in Figure 2. As shown in Figure 2b, the projection of the flight trajectory may intersect the projection of the planned path several times when the trajectory fluctuates around the planned path in Figure 2a. Owing to these intersections, a size relationship can be identified among the headings from C 2 , S, and  C 1 to T, namely H C 2 T > H S T > H C 1 T . This indicates a relationship between trajectory fluctuations and the magnitude of heading values. To reflect the effect of deviations caused by such fluctuations, the signed error distance D i s e r r s i g n e d is defined as the signed distance deviation from the current position to the planned path. For the j t h sampling point, the sign is determined by the size relationship between the headings H C j T and H S T . The signed error distance D i s e r r s i g n e d is expressed as
D i s e r r s i g n e d ( j ) = | | ( x T x S , y T y S , z T z S ) × ( x C j x S , y C j y S , z C j z S ) | | 2 | | ( x T x S , y T y S , z T z S ) | | 2 , H C j T H S T | | ( x T x S , y T y S , z T z S ) × ( x C j x S , y C j y S , z C j z S ) | | 2 | | ( x T x S , y T y S , z T z S ) | | 2 , H C j T < H S T .
The error statistics of the flight trajectory are computed in an iterative way. They are the mean value m e a n and the root mean square value r m s of D i s e r r s i g n e d , where m e a n is defined as
m e a n ( j ) = D i s e r r s i g n e d ( 1 ) , j = 1 ( j 1 ) m e a n ( j ) + D i s e r r s i g n e d ( j ) j , j > 1
and the value r m s is defined as
r m s ( j ) = | D i s e r r s i g n e d ( 1 ) | , j = 1 ( j 1 ) [ r m s ( j 1 ) ] 2 + [ D i s e r r s i g n e d ( j ) ] 2 j , j > 1 .
At the beginning of each heading adjustment, the index j is reinitialized to 1. The flight trajectory is then dynamically evaluated again using the statistics m e a n and r m s of D i s e r r s i g n e d .

3.2. Predictive Parameter Calculation

The predictive parameter calculation component designs the predictive structure using information to capture the impact of flight trajectory deviations on heading adjustments. Trajectory deviations are assessed using multiple error statistics to represent the overall characteristics of the errors. Since different error statistics contribute unequally, the information entropy can quantify the importance of multi-source data [28], which can also be applied to objectively determine the weights of different error statistics. The predictive structure H p C ( m ) directly incorporates the future states of errors and is defined, based on linear functions, as 
H p C ( m ) = k p C [ 2 E ( m ) E ( m 1 ) ] ,
where k p C denotes the predictive parameter. The heading error E ( m ) can be calculated by Equation (6), and  E ( 0 ) is endowed with 0.
E ( m ) = H C T ( m ) H S T .
The predictive parameter k p C is determined using entropy-based weights. First, the information entropy of m e a n and r m s is calculated through the maximum-minimum normalization [29]. The entropy e m e a n of m e a n is defined as
e m e a n = m e a n m i n m a x m i n · ln m e a n m i n m a x m i n ,
where m a x and m i n represent the maximum and minimum values of D i s e r r s i g n e d , respectively. Similarly, the entropy e r m s of r m s is given by
e r m s = r m s m i n m a x m i n · ln r m s m i n m a x m i n .
Second, the weights of the statistics are generated. The weight ω m e a n of m e a n is calculated as
ω m e a n = 1 e m e a n 2 e m e a n e r m s ,
and the weight ω r m s of r m s is obtained as
ω r m s = 1 e r m s 2 e m e a n e r m s .
Finally, the predictive parameter k p C is computed as Equation (11), where D i s e r r s i g n e d ( 0 ) is endowed with 0.
k p C = D i s e r r s i g n e d ( j ) D i s e r r s i g n e d ( j 1 ) ω m e a n · m e a n + ω r m s · r m s · E ( m ) E ( m 1 ) , m > 1 D i s e r r s i g n e d ( j ) D i s e r r s i g n e d ( j 1 ) ω m e a n · m e a n + ω r m s · r m s , m = 1 .
When m i n and m a x are equal or the denominator of Equation (11) is 0, k p C is assigned directly a value of 0. The predictive parameter k p C is then stored in the sequence K p C , and the predictive structure is used to compensate the PID control to ensure a more convergent trajectory to the planned path.

3.3. Quaternary Correlation Establishment

The relationship establishment component constructs quaternary correlations among the predictive parameter and the PID parameters to compute the virtual heading commands. Since the initial heading error may be small, a sufficient accumulation of errors is required to compute the commands; otherwise, the resulting trajectory may have poor convergence. To address this, the discrete positional PID algorithm is combined with the predictive compensation structure to generate the heading change H C , expressed as
H C ( m ) = k p E ( m ) + k i r = 0 m E ( r ) + k d [ ( E ( m ) E ( m 1 ) ] + H p C ( m ) ,
where k p , k i , and  k d denote the proportional, integral, and derivative parameters, respectively. The parameter k p is calculated as
k p = E ( m 1 ) E ( m ) , m > 1 1 , m = 1 ,
k i is calculated as
k i = E ( m 1 ) r = 1 m E ( r ) , m > 1 E ( m ) r = 1 m E ( r ) , m = 1 ,
and k d is calculated as
k d = E ( m ) E ( m 1 ) E ( m 1 ) , m > 1 1 , m = 1 ,
If the denominators of Equations (13)–(15) are very small, proportional, integral, and derivative parameters may be abnormally large values, and a standardized operation is required. Hence, when E ( m ) or E ( m 1 ) is less than 0.001, combined with the function · that rounds down the given value, the standardized operation is given as
k p = k p max k p , k i , k d + 1 ,
k i = k i max k p , k i , k d + 1 ,
k d = k d max k p , k i , k d + 1 .
Then, the parameters k p , k i , and  k d are stored in the sequences K p , K i , and  K d , respectively. Since both the predictive and the PID parameters are linked to the heading errors, their correlation dependence is modeled using the normal copula distribution function C n , applied to establish the correlation dependence among these parameters, which is defined as
C n ( k p , k i , k d , k p C ) = k p , k i , k d , k p C | P | 1 2 exp { 1 2 P T ( P 1 I ) Φ 1 ( k p ) Φ 1 ( k i ) Φ 1 ( k d ) Φ 1 ( k p C ) } d k p d k i d k d d k p C ,
where P is the correlation coefficient matrix, I represents the unit matrix, Φ 1 ( · ) is the inverse standard normal function, and  Φ ( · ) denotes the multivariate normal distribution with the correlation matrix P. The matrix P is defined as
P = 1 ρ ( K p , K i ) ρ ( K p , K d ) ρ ( K p , K p C ) ρ ( K p , K i ) 1 ρ ( K i , K d ) ρ ( K i , K p C ) ρ ( K p , K d ) ρ ( K i , K d ) 1 ρ ( K d , K p C ) ρ ( K p , K p C ) ρ ( K i , K p C ) ρ ( K d , K p C ) 1 ,
where ρ ( · ) indicates the correlation coefficient between two sequences. The direct construction of quaternary correlations is computationally demanding; therefore, a two-step procedure is employed to establish the correlation between the predictive and PID parameters. The overall process of generating virtual heading commands based on these correlations is shown in Figure 3.
First, the correlation coefficient matrix P is decomposed using Cholesky factorization, expressed as
P = Q T Q
where Q denotes the upper triangular matrix. To perform Cholesky factorization, P must be a symmetric positive definite matrix. Eigenvalue flipping is a feasible technique to repair the non-positive definite matrix to be a positive definite one [30]. However, the flipping operator may affect correlation relations when repairing the matrix P in the asymmetric positive definite case. For computational considerations and to preserve the intended correlation relationships, combined with the study of Cholesky factorization [31], the squared sum of the correlation coefficients, namely ρ 2 = ρ 2 ( K p , K i ) + ρ 2 ( K p , K d ) + ρ 2 ( K p , K p C ) + ρ 2 ( K i , K d ) + ρ 2 ( K i , K p C ) + ρ 2 ( K d , K p C ) , should generally remain less than 1. If  ρ 2 1 , normalization is applied as
ρ ( A , B ) = ρ ( A , B ) ρ 2 + 1 ,
where ρ ( A , B ) is successively replaced by every one of the six correlation coefficients.
Second, quaternary correlations are constructed. Let X = ( X p , X i , X d , X p C ) T = Q T Y 1 and Y 1 = Φ 1 ( k p ) , Φ 1 ( k i ) , Φ 1 ( k d ) , Φ 1 ( k p C ) T , then the quaternary correlations are expressed as
k p = Φ ( X p ) ,
k i = Φ ( X i ) ,
k d = Φ ( X d ) ,
k p C = Φ ( X p C ) .
Based on the above steps, the correlation dependence between the PID control and the predictive structure is established. If the flight trajectory gradually deviates from the planned path, k p and k i will decrease; meanwhile, k d and k p C will increase; after establishing quaternary correlations, the updated parameters can help improve flight convergence. The virtual heading command H ( m ) is then determined as
H ( m ) = mod ( H C T + H C + 360 , 360 ) .
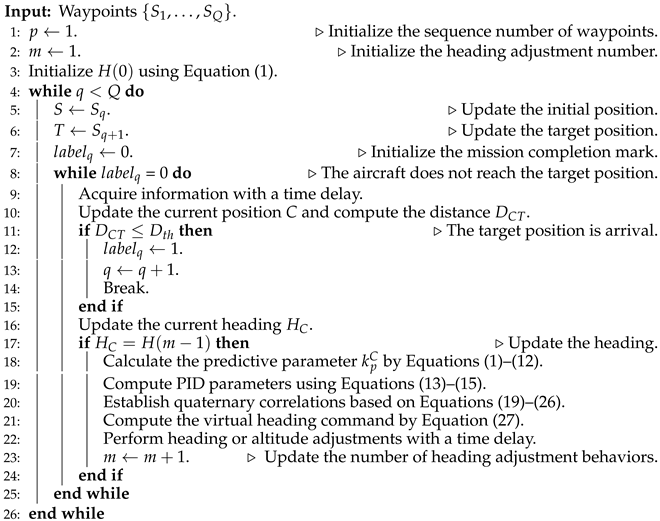
Algorithm 1 outlines the flight mission procedure under the QCPC-PID framework. Given a waypoint sequence { S 1 , , S Q } , the virtual pilot executes the mission using both virtual altitude and heading commands. The multiple-waypoint is treated as a sequence of two-waypoint flights. Specifically, the initial position S and the target position T are sequentially assigned as S q and S q + 1 , where S q denotes the q t h waypoint.
Algorithm 1 Multiple-waypoint mission by QCPC-PID method
Aerospace 12 00936 i001
For each two-waypoint flight, the virtual altitude command is set to the target altitude. Once the Euclidean distance D C T from the current position to the target falls below a specified distance threshold D t h , the segment is considered complete and l a b e l q = 1 is used to indicate its completion. Furthermore, to account for the time required for information acquisition and heading or altitude adjustments, random time delays r a n d ( 0.5 , 3.0 ) that obey the uniform distribution are introduced into the mission process.
For a Q-waypoint flight mission, there are Q 1 flight segments. Each segment follows a stepwise computational process based on the corresponding equations. Consequently, the computational complexity of a single segment is O ( n ) , and the overall complexity of the mission is O ( Q · n ) . The total simulation time depends on the number of heading adjustments m and the average interval T S between two adjustments. The interval T S is influenced by the time required to acquire information, adjust the heading or altitude, and the interval during which the current heading matches the last virtual heading command. Therefore, the total simulation time can be approximated as O ( Q · m · T S ) .

4. Experiment and Discussion

Two flight missions are randomly designed in this section. The first involves two waypoints, while the second is a multiple-waypoint case with five flight waypoints. These missions cover both even and odd numbers of waypoints, enabling a comprehensive simulation verification. In each mission, five approaches are applied to compute virtual heading commands: direct adjustment using H C T , the classical PID method, AG-PID [5], TC-PID [18], and the proposed QCPC-PID method. For the even-waypoint mission, the ablation experiment is conducted to demonstrate the contribution of each component in the QCPC-PID method. Ablation studies include the QCPC-PID method with unsigned error distance statistics (QCPC-PID-uS), with no m e a n (QCPC-PID-nM) or no r m s (QCPC-PID-nR) in the predictive parameter calculation component, along with no quaternary correlations (QCPC-PID-nQ) in the relationship establishment component.
The airspeed is set to 1.17 m/s, and the distance threshold D t h is fixed at 2.50 km. The aircraft model is a Boeing 777-300 and is from the open-source platform FlightGear [32], with environmental conditions (including disturbance and noise) provided by its default settings. All methods are implemented in C# and executed 100 times for each mission. The simulations are run on a system with a 12th Gen Intel(R) Core (TM) i9-12900H 2.50 GHz processor, 16 GB RAM, and Windows 11.
Performance is evaluated using the average flight trajectory length (A_FJL), mission completion time (A_MCT), heading adjustment number (A_HAN), and three error-based metrics: maximum error (A_Max), mean error (A_Mean), and error standard deviation (A_Std) [18]. Suppose there are N flight trajectories and J sampling points on the n t h trajectory. Based on Equation (2), A_Max, A_Mean and A_Std can be computed as
A _ Max = 1 N n = 1 N max D i s e r r s i g n e d ( j ) | j = 1 , , J ,
A _ Mean = 1 N n = 1 N 1 J j = 1 J D i s e r r s i g n e d ( j ) ,
A _ Std = 1 N n = 1 N 1 J 1 j = 1 J ( D i s e r r s i g n e d ( j ) 1 J j = 1 J D i s e r r s i g n e d ( j ) ) 2 .
In addition, standard deviation measures are applied to demonstrate the consistency of the results. The measures contain the standard deviation of the maximum error (S_Max) and the mean error (S_Mean). S_Max and S_Mean can be computed as
S _ Max = 1 N 1 n = 1 N ( max D i s e r r s i g n e d ( j ) | j = 1 , , J A _ Max ) 2
S _ Mean = 1 N 1 n = 1 N ( 1 J j = 1 J D i s e r r s i g n e d ( j ) A _ Mean ) 2

4.1. Two-Waypoint Flight Case

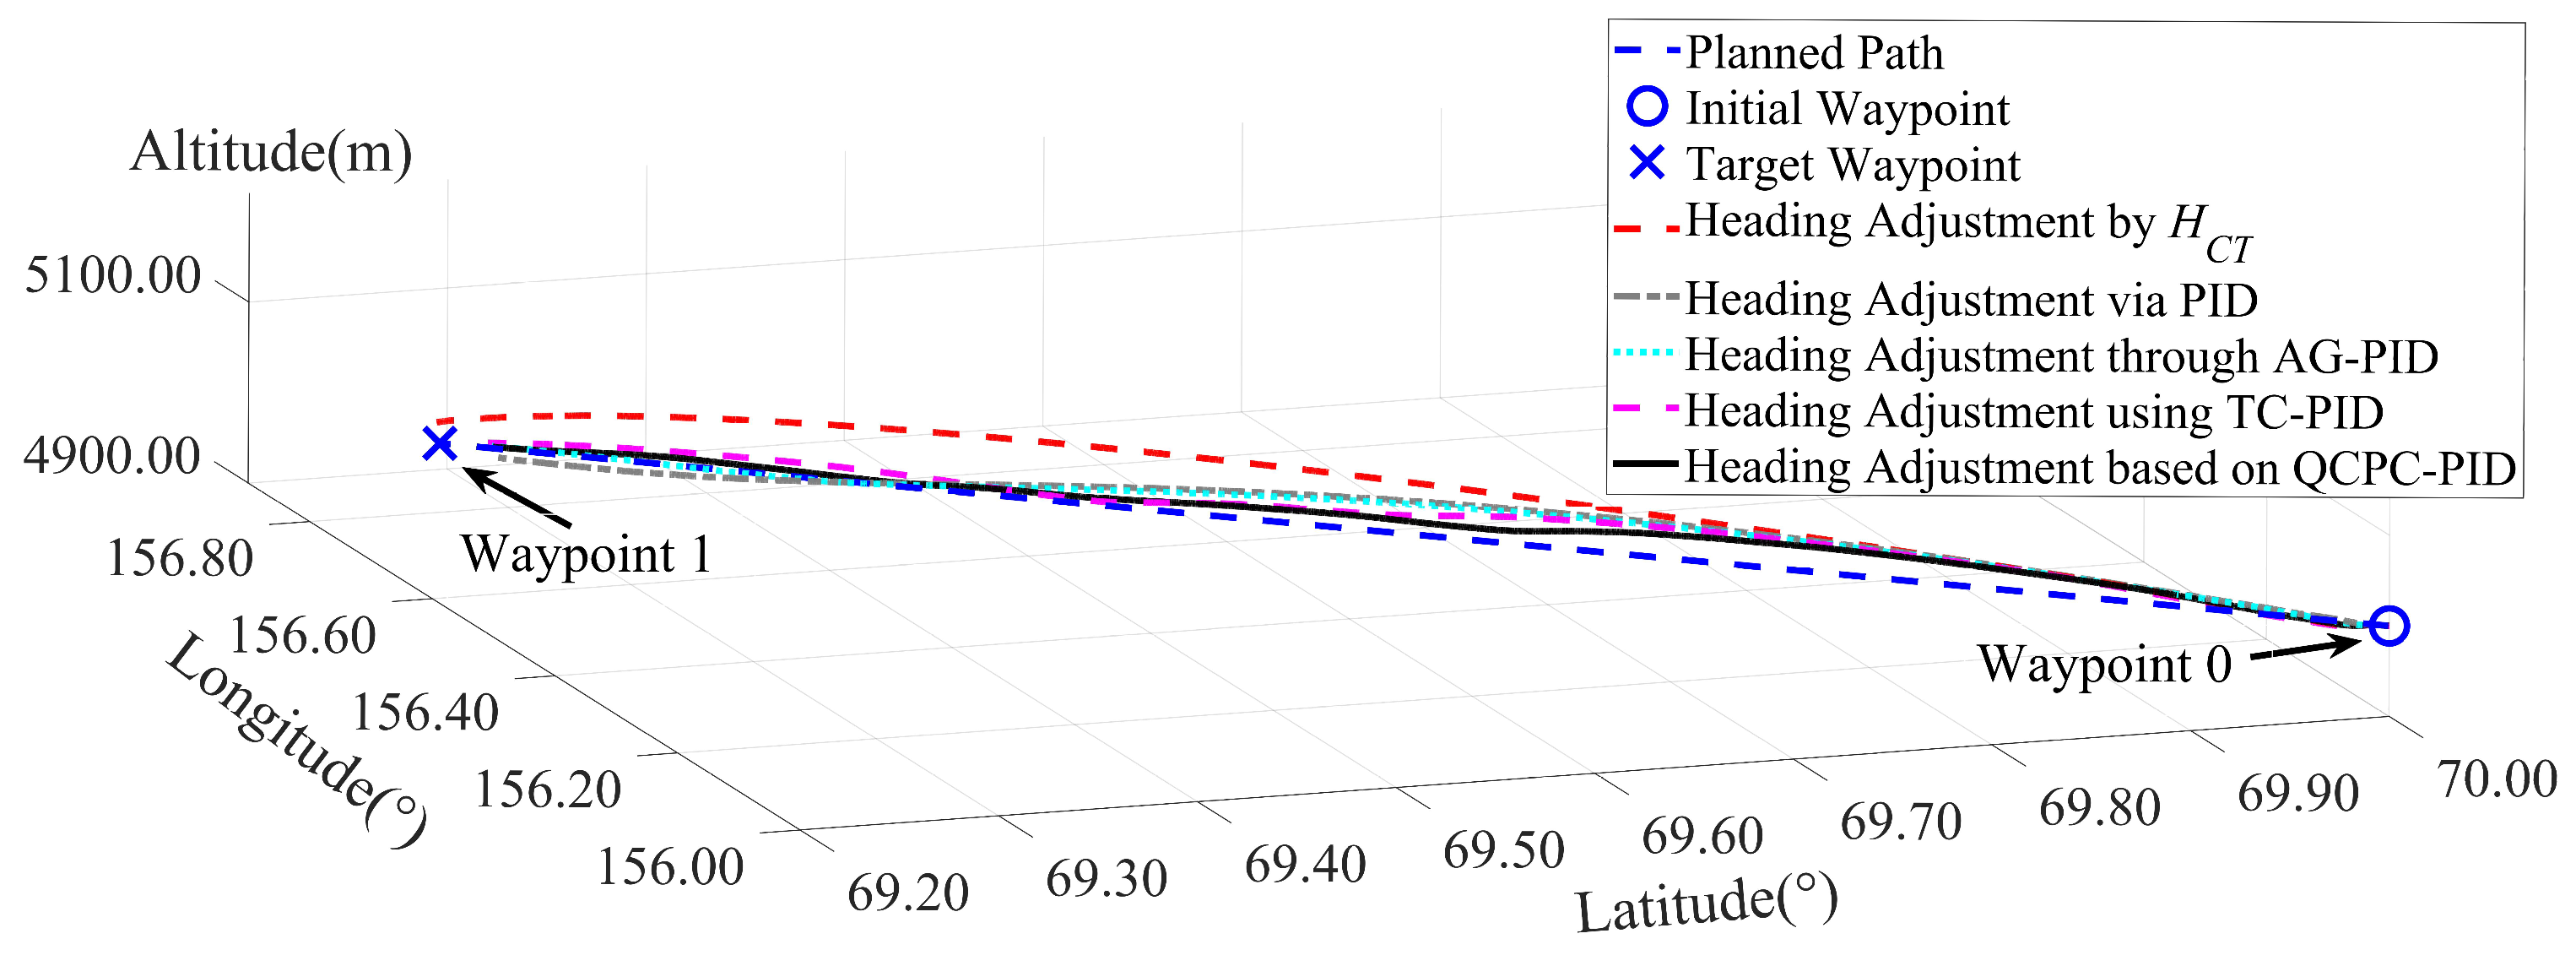
The waypoints for this mission are given in Table 1. Based on the study on PID parameter selection [33], for the two-waypoint case, the PID parameters are set as k p = 0.60 , k i = 0.23 , and k d = 0.04 , respectively. A representative set of flight trajectories is illustrated in Figure 4. The results indicate that the QCPC-PID method achieves closer convergence to the planned path than the other four heading adjustment approaches.
The results of the flight evaluation are listed in Table 2. The QCPC-PID method does not obtain minimal values for the average flight trajectory length and the average number of heading adjustments, but it has the lowest average mission completion time. Furthermore, QCPC-PID outperforms the other four methods in terms of trajectory convergence. The maximum, mean and standard deviation of the trajectory-to-path error distances are lower than those obtained by the other heading adjustment methods, which indicates that the improved accuracy may require the additional control effort. In addition, the standard deviation of the maximum error and the mean error demonstrate the consistency of the flight results for the QCPC-PID method.
The results of the ablation experiment are listed in Table 3. Multi-feature statistics, predictive parameter calculation, and quaternary correlation establishment are important to improve trajectory convergence. More precisely, the multi-feature statistical component uses signed error statistics to indicate the flight deviation levels, which can help guarantee the convergent flight; the fusion of the error statistics m e a n and r m s facilitates reducing the flight deviations; and quaternary correlations act as a more significant role in the QCPC-PID method, enhancing the flight trajectory convergence. The comparison curves of flight error distance for the five approaches, namely the H C T , PID, AG-PID, TC-PID, and QCPC-PID methods, are shown in Figure 5, where QCPC-PID consistently exhibits smaller deviations, confirming its superior convergence performance.

4.2. Multiple-Waypoint Flight Case

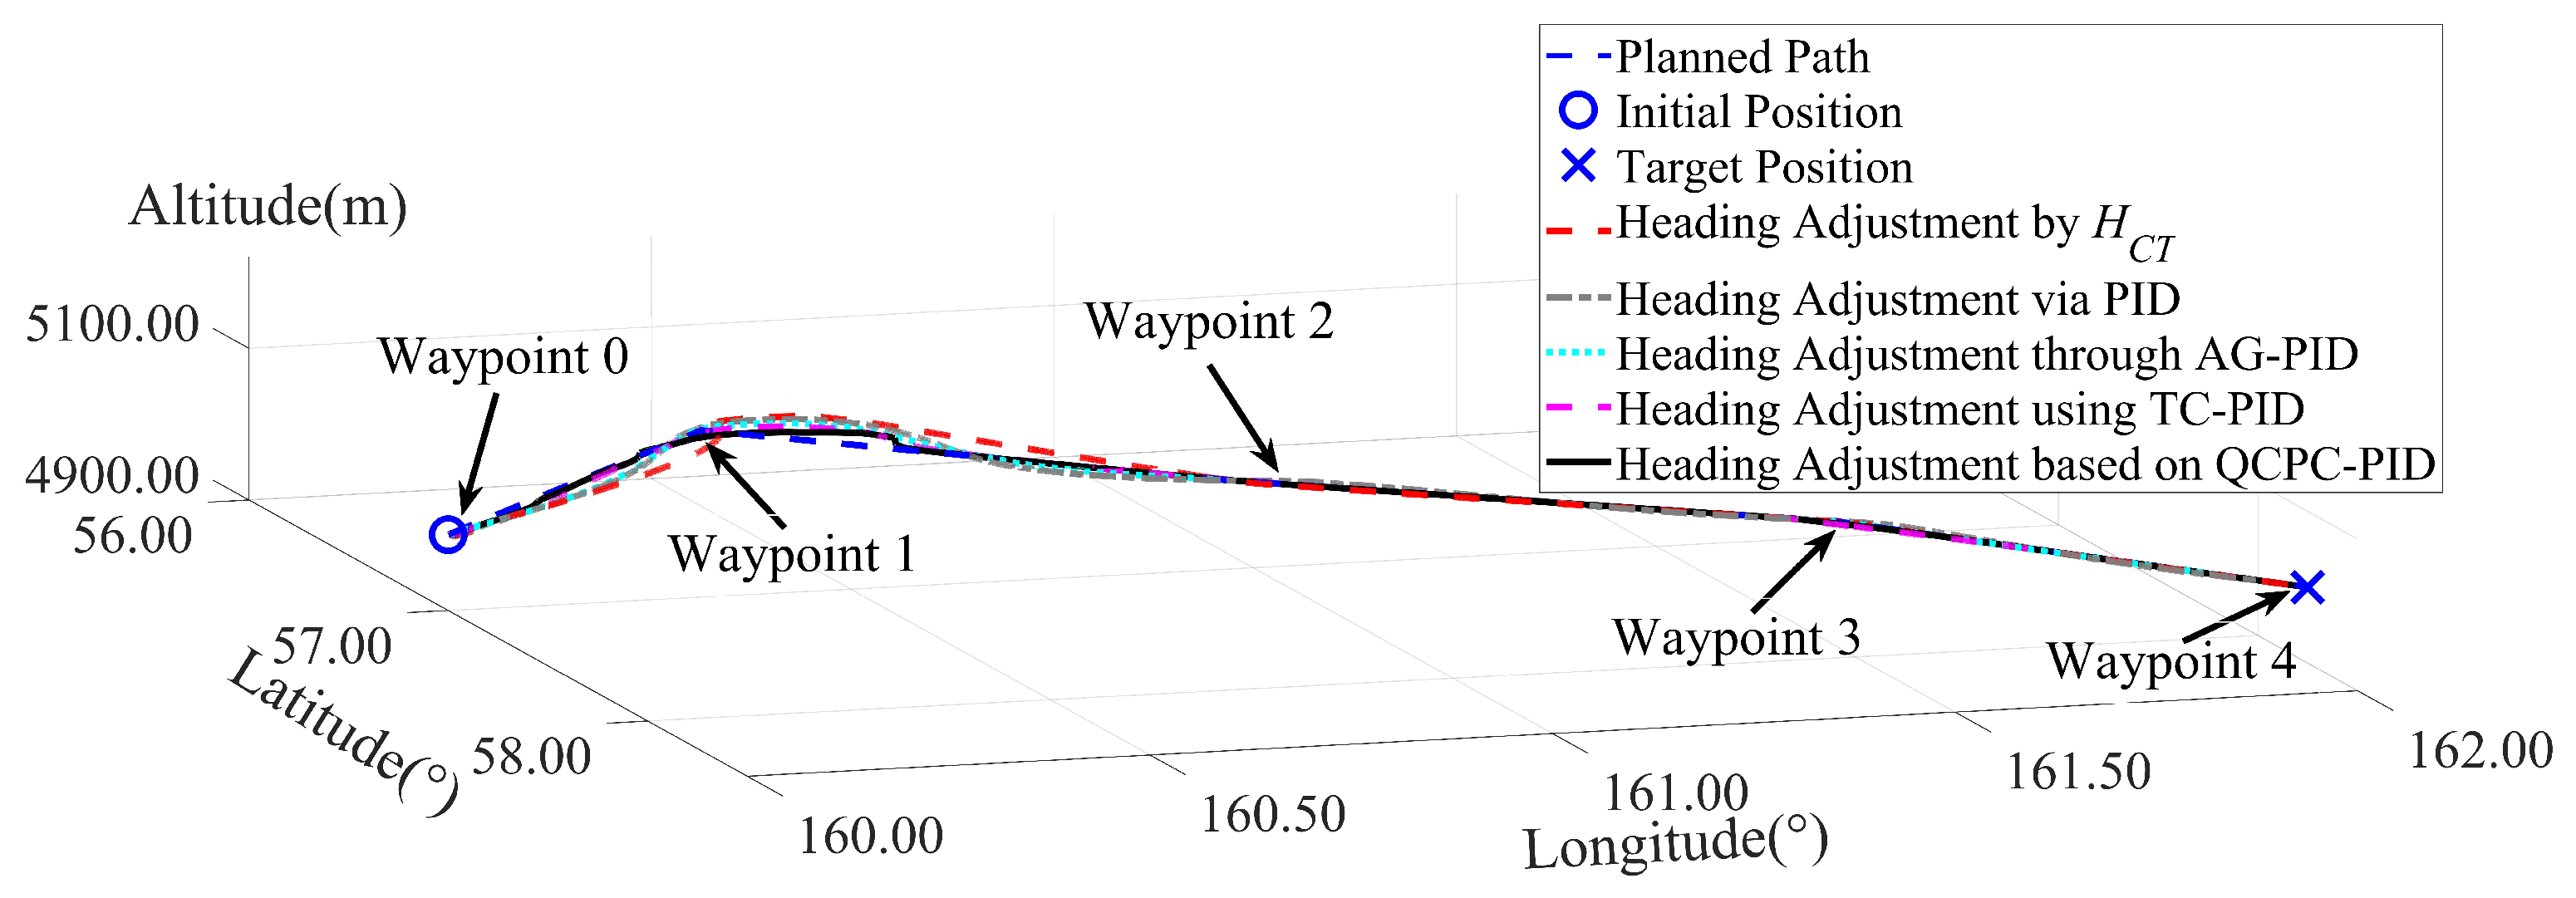
The multiple-waypoint configuration is provided in Table 4. Due to the increased complexity of flight missions, compared with the two-waypoint flight case, we properly enhance the values of the PID parameters, which facilitates the instant response by a higher proportional parameter, high-speed error correction by a bigger integral parameter, and dynamic performance improvement by a greater derivative parameter. The PID parameters k p , k i , and k d are set to 0.65, 0.26, and 0.07, respectively. Representative flight trajectories are illustrated in Figure 6. The results indicate that the QCPC-PID method produces trajectories more closely aligned with the planned path than those generated by the other four methods. The incorporation of the predictive structure and quaternary correlations contributes to achieving improved flight convergence.
Table 5 lists the results of the assessment. The QCPC-PID method demonstrates a longer flight trajectory and a greater time expenditure than the AG-PID method, while among the heading adjustment approaches by H C T directly, through PID, and using TC-PID, the QCPC-PID method produces the shortest flight trajectory and the lowest mission completion time. Nevertheless, QCPC-PID requires a higher number of heading adjustments, which could translate into an increased workload in practical applications. Moreover, the QCPC-PID method achieves lower maximum, mean, and root mean square error distances than the other approaches, indicating that increasing control activity may improve flight convergence. The standard deviations of both the maximum error and the average error indicate better consistency in the flight results obtained by the QCPC-PID method.
Figure 7 illustrates representative error distance curves for the five methods, showing that QCPC-PID exhibits smaller deviations. These results confirm that the QCPC-PID method enhances the convergence of flight trajectories toward the planned path.

4.3. Discussion

This study proposes a quaternary correlation prediction compensation structure integrated into the PID algorithm for computing virtual heading commands in autopilot flight scenarios. The multi-feature statistical component dynamically calculates error statistics of the flight trajectory. The predictive structure, constructed in the predictive parameter calculation module, incorporates the information entropy, while the relationship establishment component employs a normal copula function to form the correlation dependence between the predictive parameter and PID control. For parameter settings, the proportional parameter facilitates the quick response of the system to instant error; the integral parameter contributes to eliminating the steady error; the derivative parameter can enhance dynamic performance; the predictive parameter is conductive to fulfilling compensation for PID control. Once the flight trajectory gradually deviates from the planned path, the proportional and integral parameters will decrease; the derivative and predictive parameters will increase; after constructing the quaternary correlation dependence, these updated parameters can help improve the convergence of the flight trajectory.
The key factors enabling improved flight convergence are predictive compensation and quaternary correlations. Specifically, the predictive structure leverages trajectory error statistics and information entropy to compute the predictive parameter, dynamically linking this parameter with flight trajectory deviations. The quaternary correlations, in turn, establish relationships between the predictive and PID parameters, facilitating correlation dependence during parameter updates. Together, these mechanisms reduce the mean and standard deviation of trajectory error distances, ensuring that QCPC-PID achieves trajectories more closely aligned with the planned path, and thereby enhancing convergence performance.
However, the QCPC-PID approach does not optimally yield an optimal number of heading adjustments. As mission complexity increases, frequent course corrections may cause more additional control efforts, imposing a greater workload in human–machine interactions and highlighting the need for further optimization. When a smaller number of heading adjustments is needed, the heading adjustment approach using H C T , which is calculated by the current and target positions, may be more preferable. Future work should also involve validating and applying the heading adjustment behavior model in real-world scenarios, particularly for the quantification and assessment of air safety under various operational conditions.

5. Conclusions

This paper introduces a QCPC-PID method for computing virtual heading commands in autopilot scenarios. The approach integrates a predictive structure with the quaternary correlation dependence as its core element. Flight trajectory error statistics are dynamically derived from signed error distances, while predictive compensation is designed using information entropy. Quaternary correlations are then established between the predictive structure and PID control parameters to generate heading commands. By incorporating trajectory error statistics, the method provides a comprehensive representation of flight deviation, while quaternary correlations enable interdependence among proportional, integral, derivative, and predictive parameters. Experimental results confirm that the QCPC-PID improves the convergence of trajectories to the planned path. In general, it establishes a heading adjustment behavior model within virtual autopilot flight missions.

Author Contributions

Conceptualization, Y.Z. and S.F.; methodology, Y.Z.; software, Y.Z.; validation, Y.Z.; formal analysis, Y.Z.; investigation, Y.Z.; resources, Y.Z.; data curation, Y.Z.; writing—original draft preparation, Y.Z.; writing—review and editing, Y.Z. and S.F.; visualization, Y.Z.; supervision, Y.Z. and S.F.; project administration, Y.Z.; funding acquisition, No funding supports. All authors have read and agreed to the published version of the manuscript.

Funding

This research received no external funding.

Data Availability Statement

The data supporting this work are available on any reasonable request or can be downloaded from https://pan.baidu.com/s/1qnu9VoeBqMsmLd1aD34xOw, accessed on 15 October 2025.

Acknowledgments

The authors express gratitude to all anonymous peer reviewers, the editor-in-chief, and the associate editor for their time and help with the work. The authors also thank all participants for revising this paper. The authors appreciate the opportunity to share their work.

Conflicts of Interest

No conflict of interest is related to the work. The authors also promise that neither humans nor animals are involved in the work.

References

  1. Bresó, A.; Martínez-Miranda, J.; Botella, C.; Baños, R.M.; García-Gómez, M. Usability and acceptability assessment of an empathic virtual agent to prevent major depression. Expert Syst. 2016, 33, 297–312. [Google Scholar] [CrossRef]
  2. Zhang, X.; Sun, Y.C.; Zhang, Y.J. Evolutionary game and collaboration mechanism of human-computer interaction for future intelligent aircraft cockpit based on system dynamics. IEEE Trans. Hum.-Mach. Syst. 2022, 52, 87–98. [Google Scholar] [CrossRef]
  3. Bao, J.Y.; Zhou, Q.X.; Wang, X.W.; Liu, Z.Q. Simulation and Analysis of Human Neck Load and Injury During Sustaining Overload in Flight. Int. Ergon. Assoc. Congr. 2019, 822, 86–95. [Google Scholar] [CrossRef]
  4. Vogeltanz, T.; Jašek, R. FlightGear application for flight simulation of a mini-UAV. AIP Conf. Proc. 2015, 1648, 550014. [Google Scholar] [CrossRef]
  5. Lohani, T.A.; Dixit, A.; Agrawal, P. Adaptive PID control for autopilot design of small fixed wing UAVs. In Proceedings of the 2nd International Conference on Sustainable Technologies and Advances in Automation, Aerospace and Robotics (STAAAR-2023), Sehore, India, 15–16 December 2023; EDP Sciences: Les Ulis, France, 2024; Volume 393, pp. 1–14. [Google Scholar] [CrossRef]
  6. Revathi, V.; Rangaiah, Y.P.; Dutt, A.; Hameed, A.A.; Nagini, R.V.S.S.S.; Yadav, D.K. Design of small UAV autopilot systems using adaptive controllers, PID controllers, and AI. In Proceedings of the 2025 International Conference on Next Generation Communication & Information Processing (INCIP), Bengaluru, India, 23–24 January 2025; IEEE: Piscataway, NJ, USA, 2025; pp. 20–25. [Google Scholar] [CrossRef]
  7. Baran, H.; Bayezit, I. Advanced autopilot design with extremum-seeking control for aircraft control. Open Eng. 2024, 14, 20240044. [Google Scholar] [CrossRef]
  8. Kim, Y.H.; Geem, Z.W.; Yoon, Y. Population-based redundancy control in genetic algorithms: Enhancing max-cut optimization. Mathematics 2025, 13, 1409. [Google Scholar] [CrossRef]
  9. Roy, N.; Sengupta, A.; Sutradhar, A. An evolutionary optimization-based design of Smith delay compensator for cascade control of MIMO time-delay industrial process. Soft Comput. 2022, 26, 9339–9348. [Google Scholar] [CrossRef]
  10. Kuc, T.Y.; Han, W.G. An adaptive PID learning control of robot manipulators. Automatica 2000, 36, 717–725. [Google Scholar] [CrossRef]
  11. Zhang, Z.Y.; Li, Z.Q.; Zhou, Q.K.; Zhang, L.C.; Fan, D.P. Application in prestiction friction compensation for angular velocity loop of inertially stabilized platforms. Chin. J. Aeronaut. 2014, 27, 655–662. [Google Scholar] [CrossRef]
  12. Andrzej, P.; Carlos, R.; José, L.G.; Manuel, B.; Sebastián, D. Measurable disturbances compensation: Analysis and tuning of feedforward techniques for dead-time processes. Processes 2016, 4, 12. [Google Scholar] [CrossRef]
  13. Guo, K.; Wei, J.H.; Fang, J.H.; Feng, R.L.; Wang, X.C. Position tracking control of electro-hydraulic single-rod actuator based on an extended disturbance observer. Mechatronics 2015, 27, 47–56. [Google Scholar] [CrossRef]
  14. Shen, Y.Y.; Guo, Y.Q.; Zha, X.M.; Wang, Y. Real-time hybrid test control research based on improved electro-hydraulic servo displacement algorithm. Sensors 2023, 23, 4765. [Google Scholar] [CrossRef]
  15. Hazrat, B.; Baoqun, Y.; Muhammad, S.A.; Zeeshan, A.; Avinash, R.; Wang, Y.Z. A practical study of active disturbance rejection control for rotary flexible joint robot manipulator. Soft Comput. 2023, 27, 4987–5001. [Google Scholar] [CrossRef]
  16. Chen, L.; Jin, B.; Zhang, C.; Guo, Q. State feedback spool position control with integral compensation for servo proportional valve. Proc. Inst. Mech. Eng. Part C J. Mech. Eng. Sci. 2023, 237, 4946–4956. [Google Scholar] [CrossRef]
  17. Zhang, M.F.; Xu, C.T.; Li, L.; Wang, Z.H.M.; Zong, X. Optimization of PID controller for stepper motor speed control system based on improved sparrow search algorithm. Proc. Inst. Mech. Eng. Part C J. Mech. Eng. Sci. 2024, 238, 9397–9411. [Google Scholar] [CrossRef]
  18. Zhou, Y.T. Ternary correlation adaptive tuning for virtual autopilot commands. J. Guid. Control Dyn. 2024, 47, 1946–1951. [Google Scholar] [CrossRef]
  19. Chen, S.L.; Xie, P.; Liao, J.H. Cascade NMPC-PID control strategy of active heave compensation system for ship-mounted offshore crane. Ocean Eng. 2024, 302, 117648. [Google Scholar] [CrossRef]
  20. Shao, K.Y.; Pan, F.Y.; Yi, N.; Han, Y. Combined lateral-longitudinal vehicle trajectory tracking control based on model predictive control and fractional-order PID. In Proceedings of the IEEE 22nd International Conference on Industrial Informatics (INDIN), Beijing, China, 18–20 August 2024; IEEE: Piscataway, NJ, USA, 2024; pp. 1–6. [Google Scholar] [CrossRef]
  21. Cheong, J.; Lee, S.J. Linear PID composite controller and its tuning for flexible link robots. J. Vib. Control 2008, 14, 291–318. [Google Scholar] [CrossRef]
  22. Wang, Y.W.; Zhang, W.A.; Dong, H.; Yu, L. A LADRC based fuzzy PID approach to contour error control of networked motion control system with time-varying delays. Asian J. Control 2020, 22, 1973–1985. [Google Scholar] [CrossRef]
  23. Dai, S.J.; Zhang, W.H.; Ji, W.B.; Zhao, Y.F.; Zheng, H.W.; Mu, J.H.; Li, P.W.; Deng, R.Q. Research on constant force grinding control of aero-engine blades based on extended state observer. Ind. Robot Int. J. Robot. Res. Appl. 2022, 49, 1077–1088. [Google Scholar] [CrossRef]
  24. Zhang, R.X.; Liang, Z.W.; Wang, T.T. Node importance measurement method based on multi-attribute fusion. Mod. Phys. Lett. B 2023, 37, 2350076. [Google Scholar] [CrossRef]
  25. Roszkowska, E.; Filipowicz-Chomko, M.; Kusterka-Jefmańska, M.; Jefmański, B. The impact of the intuitionistic fuzzy entropy-based weights on the results of subjective quality of life measurement using intuitionistic fuzzy synthetic measure. Entropy 2023, 25, 961. [Google Scholar] [CrossRef] [PubMed]
  26. Pan, H.P.; Xu, Y.Y. Design and research for a multivariable neural network PID decoupling control algorithm with predictive compensation function. In Proceedings of the International Conference on Computer Application and System Modeling (ICCASM 2010), V7-360-V7-364, Taiyuan, China, 22–24 October 2010; IEEE: Piscataway, NJ, USA, 2010. [Google Scholar] [CrossRef]
  27. Rachmanto, A.D.; Iswanto, I.; Hernawati, H. Simulation and modeling of aircraft movements passing through VOR. IOP Conf. Ser. Mater. Sci. Eng. 2020, 830, 032021. [Google Scholar] [CrossRef]
  28. Li, Z.W.; Liu, J.M.; Peng, Y.C.; Wen, C.F. A novel method to information fusion in multi-source incomplete interval-valued data via conditional information entropy: Application to mutual information entropy based attribute reduction. Inf. Sci. 2024, 658, 120011. [Google Scholar] [CrossRef]
  29. Podviezko, A.; Podvezko, V. Influence of data transformation on multicriteria evaluation result. Procedia Eng. 2015, 122, 151–157. [Google Scholar] [CrossRef]
  30. Ferrari, P.; Furci, I.; Serra-Capizzano, S. Flipped structured matrix-sequences in image deblurring with reflective and anti-reflective boundary conditions. Numer. Algorithms 2025, 100, 277–309. [Google Scholar] [CrossRef]
  31. Shen, C.; Gao, H.T. Accelerating calculation of Cholesky factorization of matrix with GPU. Comput. Appl. Softw. 2016, 33, 284–287. [Google Scholar] [CrossRef]
  32. Michael, B.; Martin, S.; Stuart, B. FlightGear Flight Simulator. Available online: http://www.flightgear.org/ (accessed on 15 October 2024).
  33. Nguyen, D.D.; Duong, M.H.; Hoang, Q.C. Enhancing altitude control in quadrotors: A study on PID parameter selection and Euler angle influence. Int. J. Sustain. Aviat. 2025, 11, 251–270. [Google Scholar] [CrossRef]
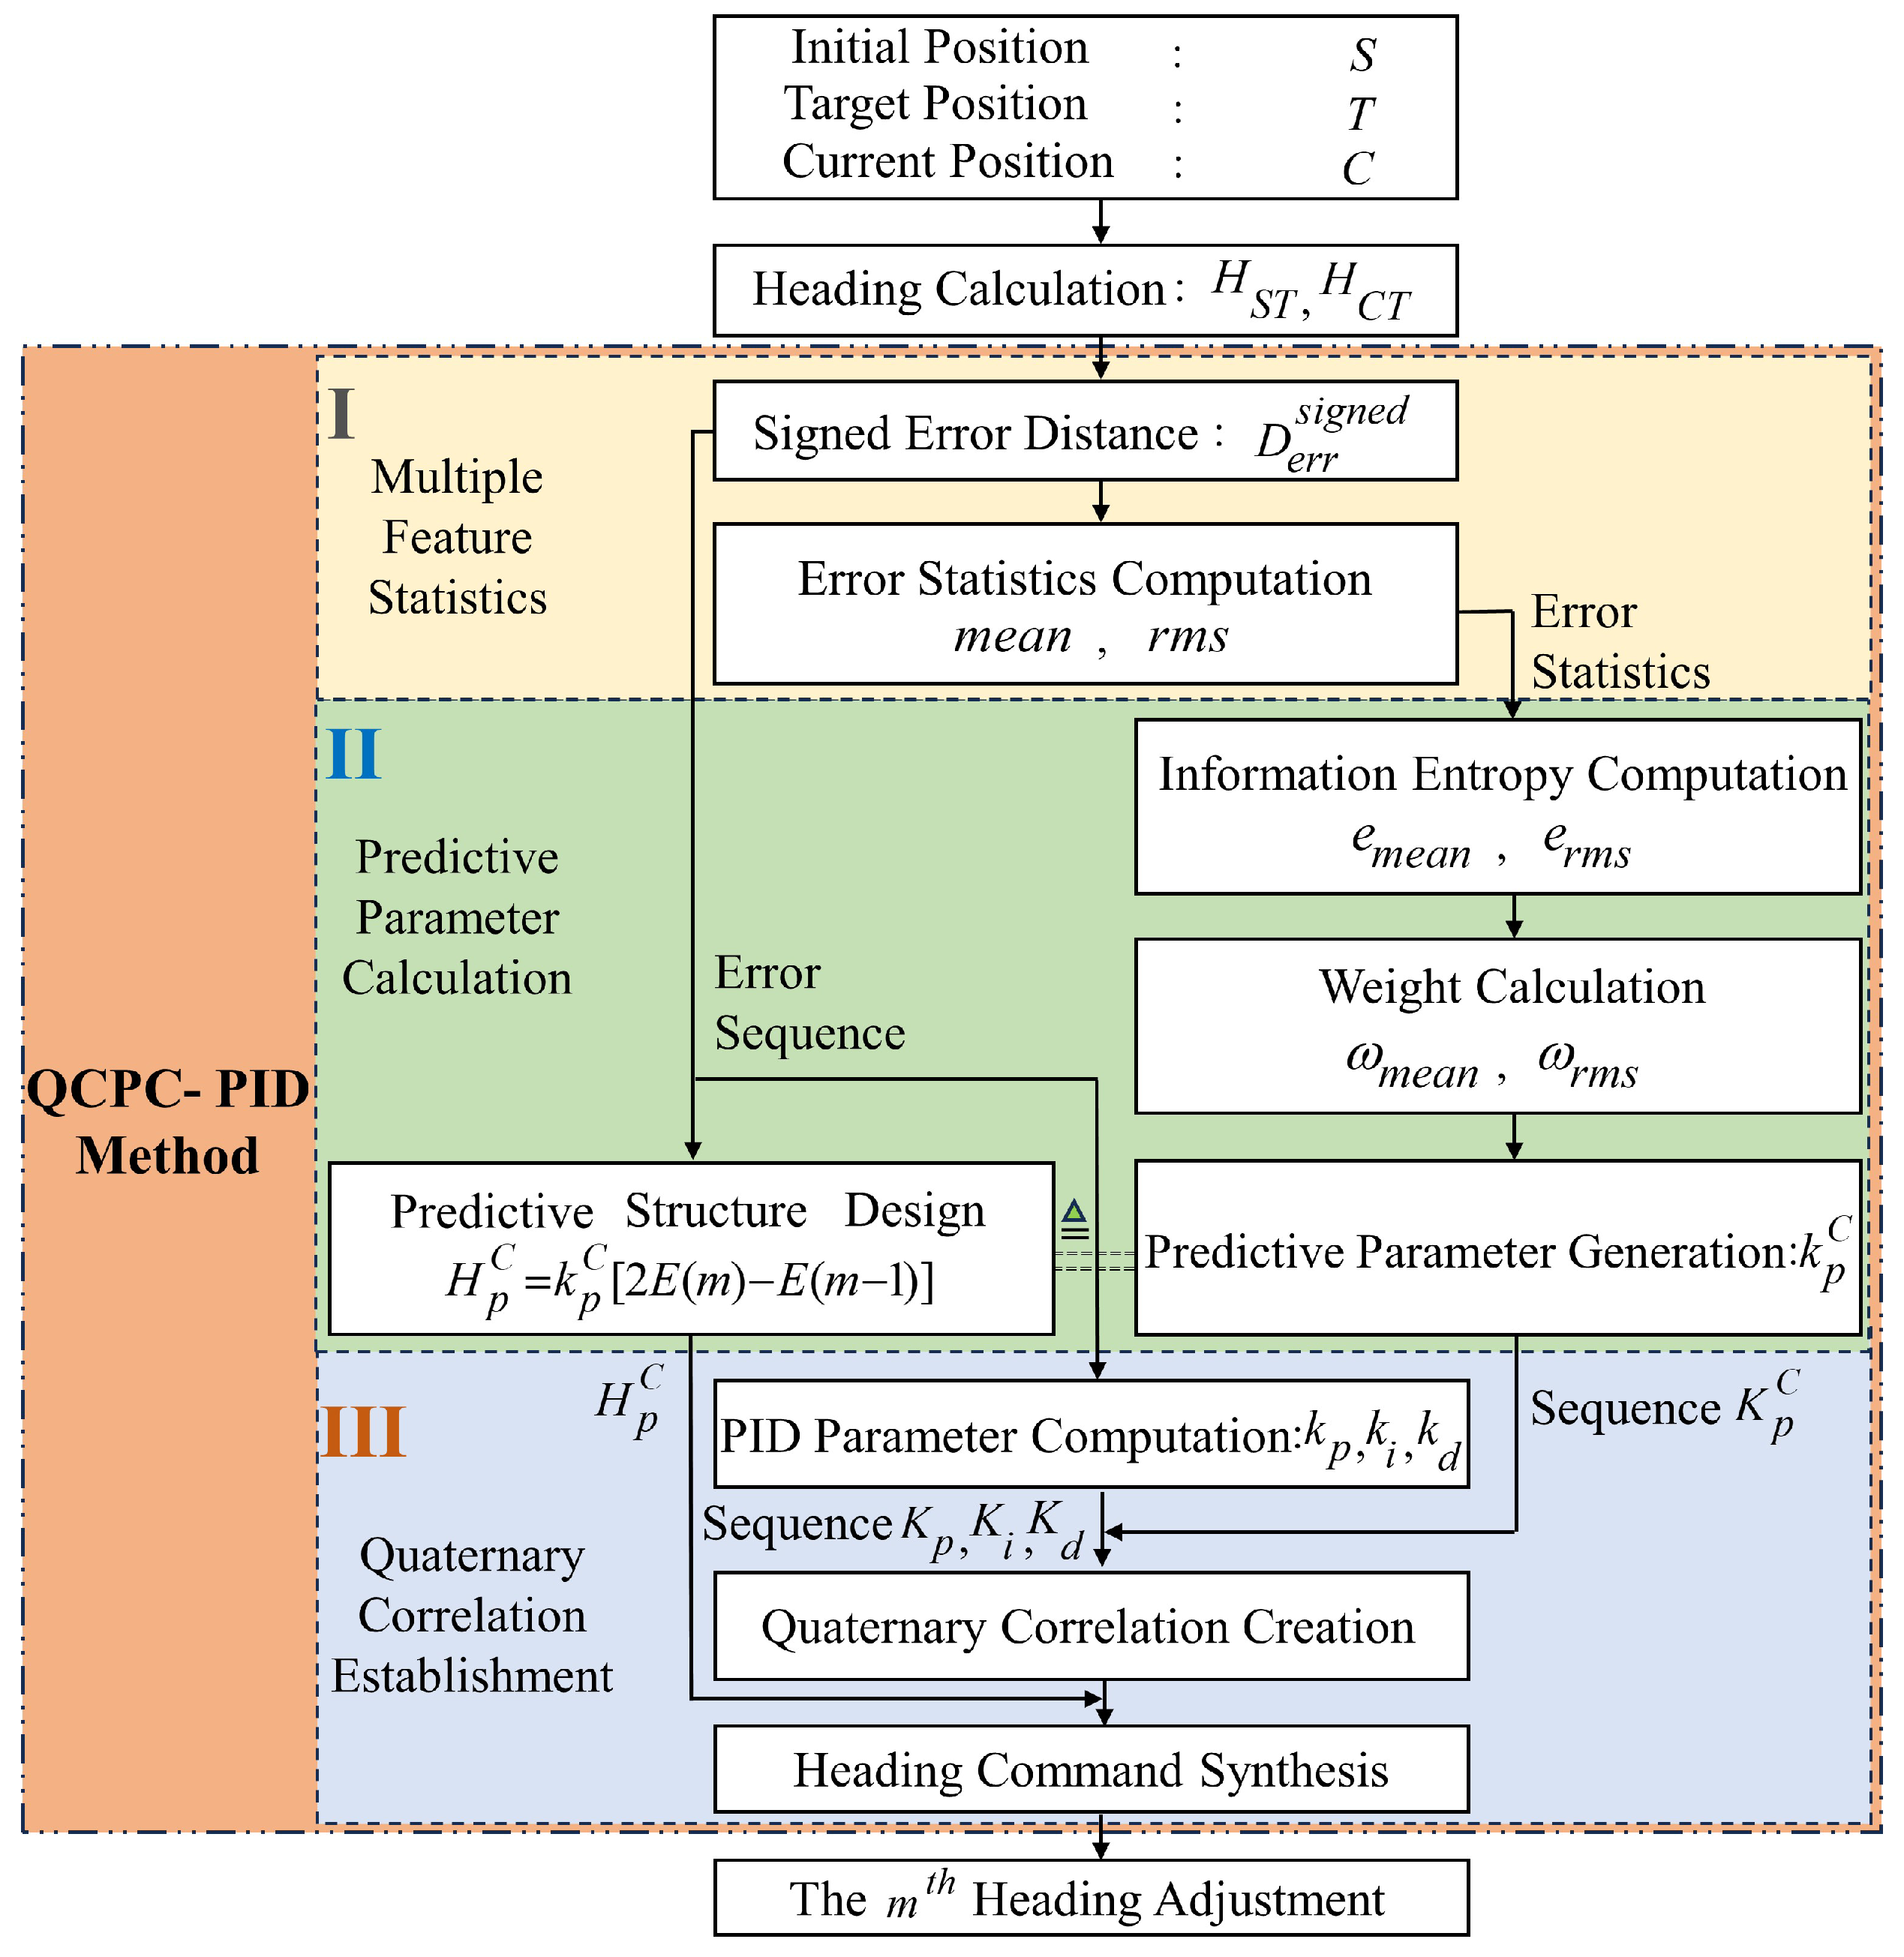
Figure 1. Quaternary correlation prediction compensation PID methodology. Part I computes error statistics to dynamically assess flight trajectory deviations. Part II constructs a predictive structure and applies the entropy of error statistics to derive the predictive parameter, enabling compensation in PID control. Part III establishes the correlation dependence between PID and predictive parameters to achieve more convergent flight trajectories.
Aerospace 12 00936 g001
Figure 2. Illustration of the flight trajectory and the planned path. Part (a) presents the trajectories in the three-dimensional coordinate system, while part (b) shows their projections in the latitude-longitude system. When the flight trajectory fluctuates around the planned path in part (a), part (b) reveals multiple intersection points between the trajectory projection and the planned path, resulting in the heading relationship H C 2 T > H S T > H C 1 T . This heading relationship reflects the trajectory fluctuation observed in part (a).
Aerospace 12 00936 g002
Figure 3. Process of generating virtual heading commands through the establishment of a quaternary correlation relationship. After calculating the PID and predictive parameters, they are stored in their respective sequences. Steps 1 and 2 are then applied to construct the quaternary correlations between the PID and predictive parameters. Finally, the virtual heading commands are computed to simulate the heading adjustment behaviors of virtual pilots in autopilot flight scenarios.
Aerospace 12 00936 g003
Figure 4. Two-waypoint flight demonstration.
Aerospace 12 00936 g004
Figure 5. Flight error distance curves in the two-waypoint flight mission. Part I is the error curves, depicting the values of error distances. Part II is the corresponding error bar, which can show the variability of corresponding results.
Aerospace 12 00936 g005
Figure 6. Multiple-waypoint flight demonstration.
Aerospace 12 00936 g006
Figure 7. Flight error distance curves in the multiple-waypoint flight mission. Part I is the error curves, which shows the values of error distances. Part II is the corresponding error bar, indicating the variability of associated results.
Aerospace 12 00936 g007
Table 1. Definition of a two-waypoint flight.
WaypointLatitude (°)Longitude (°)Altitude (m)
070.00156.005000.00
169.25156.755000.00
Table 2. Quantitative analysis of the two-waypoint flight.
MethodA_FJLA_MCTA_HANA_MaxA_MeanA_StdS_MaxS_Mean
(Using)(m)(s)(Times)(m)(m)(m)(m)(m)
H C T 88,703.40556.83236308.464255.271909.4278.65126.73
PID 87,025.72547.43273696.372031.641198.4664.0257.46
AG-PID86,655.60544.56273166.061615.711084.2658.0256.56
TC-PID86,776.21544.98272976.051298.16833.1558.1553.97
QCPC-PID86,699.37544.23272455.761176.99782.2950.6845.02
Table 3. Quantitative analysis of the ablation experiment in the two-waypoint flight mission.
MethodA_FJLA_MCTA_HANA_MaxA_MeanA_StdS_MaxS_Mean
(Using)(m)(s)(Times)(m)(m)(m)(m)(m)
QCPC-PID-uS86,841.02544.40222926.961436.20864.20115.74101.07
QCPC-PID-nM86,841.19543.32202930.901444.84892.1768.4159.44
QCPC-PID-nR86,906.98545.26232859.261441.52852.1595.53107.46
QCPC-PID-nQ86,739.99544.83254301.942837.151312.2289.4495.81
Table 4. Definition of a multiple-waypoint flight.
WaypointLatitude (°)Longitude (°)Altitude (m)
057.00160.005000.00
156.25160.505000.00
256.90161.005000.00
357.50161.605000.00
458.25162.005000.00
Table 5. Quantitative analysis of the multiple-waypoint flight.
MethodA_FJLA_MCTA_HANA_MaxA_MeanA_StdS_MaxS_Mean
(Using)(m)(s)(Times)(m)(m)(m)(m)(m)
H C T 347,639.242344.74334245.322715.541362.55443.75349.66
PID 344,823.102328.43552573.501417.78852.42380.58284.99
AG-PID341,608.602305.43552431.051283.83842.69289.92231.84
TC-PID345,158.032327.76582331.091178.30713.19264.99269.02
QCPC-PID343,842.002317.87691945.981062.89559.29253.52145.58
Disclaimer/Publisher’s Note: The statements, opinions and data contained in all publications are solely those of the individual author(s) and contributor(s) and not of MDPI and/or the editor(s). MDPI and/or the editor(s) disclaim responsibility for any injury to people or property resulting from any ideas, methods, instructions or products referred to in the content.