Article

Sand Ingestion Behavior of Helicopter Engines During Hover in Ground Effect

National Key Laboratory of Helicopter Aeromechanics, Nanjing University of Aeronautics and Astronautics, Nanjing 210016, China
*
Author to whom correspondence should be addressed.
Aerospace 2025, 12(10), 927; https://doi.org/10.3390/aerospace12100927 (registering DOI)
Submission received: 11 September 2025 / Revised: 8 October 2025 / Accepted: 10 October 2025 / Published: 15 October 2025
(This article belongs to the Special Issue Fluid Flow Mechanics (4th Edition))

Abstract

Sand ingestion exerts significant effects on the performance of helicopter engines, and it is imperative to investigate this phenomenon. In this study, the mechanisms of engine sand ingestion during helicopter hover in ground effect are analyzed. Firstly, a coupled computational model is established based on computational fluid dynamics (CFD) and the discrete element method (DEM). The aerodynamic calculation accuracy of this model is validated by comparing the pressure coefficient and tip vortex with wind tunnel test results. Subsequently, based on this method, a systematic simulation is carried out to investigate the flow field dynamics and sand cloud distribution for the helicopter at different ground-effect heights (GEHs, h). Simulation results indicate that helicopter engines can potentially directly ingest sand particles from the ground at low GEHs. When h > 2R (where R is the rotor radius), the height of sand clouds is insufficient for helicopter engines to ingest sand. Finally, guided by the simulation conclusions, a rotor test bench is designed to conduct research on sand ingestion by helicopter engines. It aims to further study how GEH and engine intake flowrate (Q) affect sand ingestion amount and distribution across the inlet cross-section. Experimental results demonstrate that the sand ingestion amount exhibits a nonlinear decreasing trend with the increasing GEH and a positive correlation with Q. At h = 0.5R, the engine directly ingests sand particles from the ground sand field, leading to a significant increase in sand ingestion. The increase reaches 11 times that at other GEHs. For the right-handed rotor in this study, the sand ingestion of the right engine is significantly higher than that of the left engine. Furthermore, for the cross-sectional position of the engine inlet in this study, over 60% of sand particles are ingested through the upper region. The research can provide scientific guidance for the design of particle separators and is of great significance for helicopter engine sand prevention.

1. Introduction

During the takeoff or landing of a helicopter in sparsely vegetated deserts, the rotor downwash entrains surface sand into a high-concentration cloud that shrouds the aircraft. Due to the engine suction, sand particles suspended near the inlet could be ingested. When operating in a Level 5 sand environment, the service life of the helicopter is reduced to one fiftieth of its design life [1]. Through experiments, Liu et al. revealed that both engine power and fuel consumption rate degrade following a quadratic function pattern with increasing sand ingestion time [2]. Therefore, the research on the sand ingestion behavior of helicopter engines is of great importance.
In the research on helicopter brownout, extensive research has been conducted on the formation mechanisms of sand clouds, which exhibits substantial significance for the research on sand ingestion in helicopter engines. John et al. concluded that the evolution of a ground vortex ahead of the rotor disk is seen to be a key element in the development of a sand cloud through experiments [3]. Using the side-field shadowgraph method, Light et al. visualized many important phenomena. These include the variation in descent and contraction rates of the tip vortices in ground effect, and the interaction between tip vortices in the far wake [4]. Based on the time-resolved smoke flow imaging, Curtiss observed the transient evolution of ground vortices, capturing their formation process during ground-effect hover [5]. Furthermore, numerous scholars proposed a series of simulation methods focusing on the helicopter flow field. Hu et al. studied the rotor–fuselage–engine aerodynamic interactions utilizing CFD numerical tools. It provides simulation approaches for the study of sand ingestion in helicopter engines [6]. Xu et al. used the multiple reference frame (MRF) method to numerically investigate the underlying mechanisms of aerodynamic interference between helicopter rotors and engine systems [7]. Steven computed the flow field characteristics of the AH-64 helicopter considering engine suction flow on the basis of the PUMA software developed independently by the University of Pennsylvania [8]. Although no research on sand ingestion in helicopter engines was conducted in the studies discussed above. The analysis of coupled flow fields of helicopter rotors and engines establishes a technical foundation for research on helicopter sand ingestion.
Based on the research of helicopter flow fields, considerable simulation studies were conducted on helicopter sand clouds. The evolution of a helicopter sand cloud with a crosswind was simulated using a helicopter brownout analysis method coupling a vortex-based solver with a discrete element method. The predicted sand clouds of the EH-60L agreed well with the flight-test data [9]. The gas–solid two-phase flow model was constructed based on the Euler-Lagrangian framework. The SST k-ω two-equation turbulence model and the soft ball model are coupled by CFD and DEM [10]. Bharath simulated sand clouds for rotorcraft undergoing landing. The flow field was modeled using an inviscid, incompressible, time-accurate Lagrangian free-vortex method. Particle tracking was used to model the sand cloud [11]. Sayan et al. characterized the flow field and the SIMPLER algorithm was adopted to solve Reynolds averaged Navier–Stokes equation. The sand behavior was solved using a Eulerian-based sand transport equation [12]. Monica demonstrated that one-way coupling of the flow and the particle motion give over an order of magnitude reduction in simulation time without any loss in accuracy [13]. However, inter-particle collisions were not accounted for in References [11,12,13]. This oversight may compromise the accuracy of the sand ingestion simulations. Further, Monica et al. proposed a Lagrangian discrete phase model (DPM), which accounts for inter-particle forces and shows close agreement with photogrammetric measurements of sand clouds [14,15]. Considering particle–particle collisions, Tan et al. developed a background grid mapping method to accelerate the simulation [16]. Xu et al. used CFD-DEM coupled model to simulate sand cloud formation at GEHs and investigated how ground-effect flow fields affect sand particle states. However, the number of sand particles modeled was relatively small [17]. These studies primarily focus on helicopter brownout, relevant simulations for sand ingestion in engines are relatively scarce. Therefore, the research direction of this paper is of great significance.
Although simulation methods have been widely used in helicopter research, the complexity of aerodynamic environments and sand particle motion cannot be fully captured by simulations. As exposed in the simulations by Phillips et al., minor changes to the setup of the simulation would potentially produce very different distribution of sand cloud [18]. Thus, experimental research on sand ingestion by helicopter engines remains indispensable. Nicholas et al. experimentally investigated the relationship between engine sand ingestion and flight conditions [19]. Simpson compared sand ingestion of helicopter engines under experimental and flight conditions. The results showed that morphological differences between standard test sands and natural sand particles substantially impact engine damage severity [20]. Cowherd quantified sand densities during hover for helicopters with various configurations. The experimental data indicated a correlation with rotor disk loading [21]. Padture found that sand particles can corrode the high-temperature ceramic coatings of engines. And methods to mitigate degradation have been proposed based on the corrosion mechanism [22]. Although their experiments were not designed to study helicopter engine sand ingestion, they have provided experimental guidelines for the research on this phenomenon. Wang established A detailed experimental procedure for the sand ingestion of a turboshaft engine. The findings provided a scientific and rational basis and reference for the sand and dust resistance design [23]. The experimental test showed that the airfoils collect almost 1.6% of the engine’s total mass ingested during a ground-idle operation [24]. Przedpelski improved the engine design and enhanced the engine’s operating capability in dusty environments based on sand ingestion tests [25]. Zhou et al. found that the simulation results of the boundary conditions of the total inlet pressure and the mass flow outlet were closer to the experimental values [26]. It means that research on helicopter sand ingestion is a necessary prerequisite for studies on engine sand protection. Furthermore, reducing engine sand ingestion is more sensible than protecting engine blades.
In this study, a CFD-DEM coupled simulation model was first used to analyze the coupled flow fields between the rotor and engine and the distribution of sand clouds comprising particles of varying sizes at different GEHs. Subsequently, guided by the experimental conclusions, the height of the rotor test bench was determined for conducting experimental research. These experiments elucidated the effects of engine intake flowrates on the total sand ingestion amount of the left and right inlets, as well as the concentration distribution across the inlet cross-section, at different ground-effect conditions. These findings lay a theoretical foundation for sand protection for helicopter engines, such as the design of particle separators.

2. CFD-DEM Coupled Computational Method

2.1. CFD Solver

2.1.1. Fluid Governing Equations

The solver STAR-CCM+, which is based on the Navier–Stokes (N-S) equations, was used to solve the flow field of a helicopter in ground-effect hover. For any control volume with a differential volume dV, the integral form of the fluid governing equations can be expressed as [27]
Γ t V W d V + ( F G ) d A = V H d V
where Γ represents the preconditioning matrix; W denotes the conserved quantities, including mass, momentum, and energy densities; F signifies the inviscid (convective) fluxes; G represents the viscous fluxes; H is the source terms. They can be further written as
W = ρ ρ v ρ E T F = ρ V ρ v V + n p ρ H V T G = 0 T T v + q ˙ n T H = 0 ρ f e ρ f e V + q ˙ h T
In this paper, the finite volume method (FVM) was employed for the spatial discretization of the N-S equations. Given the strong nonlinearity of these partial differential equations, direct analytical solutions are infeasible. Therefore, spatial discretization is indispensable prior to numerical computation.
In this study, an implicit time marching scheme was utilized for the temporal discretization of the N-S equations. Compared to explicit time integration methods, implicit methods offer a smaller memory footprint and unconditional stability. To enhance the accuracy of unsteady flow computations, a dual-time stepping method with inner iterations was employed in this study.

2.1.2. Turbulence Model

In flow field simulations, turbulence presents an inevitable challenge. The rotor flow field of a helicopter exhibits highly nonlinear turbulent behavior. Therefore, prior to conducting numerical simulations of the rotor flow, it is necessary to investigate turbulence models and incorporate an appropriate one into the governing equations of fluid motion. In this study, the shear-stress transport (SST) k-ω turbulence model was employed. This model combines the advantages of both the k-ω and k-ε models, demonstrating favorable computational accuracy and stability at high Reynolds numbers. Its non-dimensional form is expressed as
( ρ k ) t + ( ρ k v ¯ ) = [ ( μ + σ k μ t ) k ] + P k ρ β f β ( w k w 0 k 0 ) + S k
( ρ w ) t + ( ρ k v ¯ ) = [ ( μ + σ w μ t ) w ] + P w ρ β f β ( w 2 w 0 2 ) + S w
where ρ is the density; v ¯ signifies the mean velocity; μ denotes the dynamic viscosity; σ k , σ w and β are model coefficients; P k and P w are Production Terms; f β is the free-shear modification factor; f β represents the vortex-stretching modification factor; S k and S w are the user-specified source terms; k 0 and w 0 are the ambient turbulence values that counteract turbulence decay; μ t denotes the turbulent eddy viscosity.

2.2. DEM Solver

The solver EDEM, which is based on the discrete element method, was employed to simulate the motion of sand particles. During the movement of sand particles, they are subjected to three types of forces: inter-particle collisions, particle–wall or particle–surface contacts, and interactions with the surrounding fluid. The motion of each particle is determined by applying the principle of momentum conservation. The governing equations for particle i at any given time t can be expressed as
m i d v i d t = m i g + f p g , i + j = 1 k i f c o n , i , j
I i d ω i d t = j = 1 k i T i j
where m i denotes the mass of particle i; I i represents the moment of inertia of particle i; v i is the velocity vector of particle i; ω i denotes the angular velocity vector of particle i; k i represents the number of particles colliding with particle i; T i j denotes the torque exerted by particle j on particle i; f c o n , i , j represents the contact force exerted by particle j on particle i; f p g , i denotes the fluid force acting on particle i; g is the gravitational acceleration.

2.2.1. Drag Force Model

The simulation aims to explore the ground-effect height boundary of helicopter engine sand ingestion through simulations, and to guide the design of the rotor test bench. The conclusions of this paper are mainly derived from experimental data, with appropriate compromises allowed on simulation accuracy. The drag model based on the drag coefficient was adopted [28]. It can be expressed as
f d r a g , i = 1 2 C d ρ g A v p g r e l v p g r e l
where A denotes the projected area of the particle; C d represents the drag coefficient, it can be writhed as
C d = 24 / Re 24 ( 1 + 0.15 Re 0.687 ) / Re 0.44 Re 0.5 0.5 < Re 1000 Re > 1000
where R e denotes the Reynolds number as
R e = ρ g d p v p g r e l μ g
where μ g denotes the gas shear viscosity; d p represents the particle diameter; v p g r e l signifies the relative velocity between the gas and the particle.

2.2.2. Contact Force Model

In this study, in addition to collision contacts between dust particles, collision contacts between dust particles and surfaces (e.g., the ground, rotors, and fuselage) were also involved. To describe these contacts more accurately, the Hertz–Mindlin (No Slip) model, which is efficient and accurate for discrete elements, was adopted for solving the contacts between dust particles. The resultant contact force can be expressed as
F c o n t a c t = F n + F t
where F n represents the normal component; F t denotes the tangential component. They can be expressed as
F n = K n d n N n v n
F t = K t d t N t v t K t d t < K n d n K t d t C f s d t d t K t d t K n d n
where K n and K t denote the normal and tangential stiffness coefficients; N n and N t represent the normal and tangential damping coefficients; d n and d t signify the normal and tangential overlap quantities; v n and v t represent the normal and tangential components of relative velocity; C f s is the static friction coefficient.
In this paper, the contact between particles and the wall was treated as the capture mode [29]. The Hertz–Mindlin model and the Johnson–Kendall–Roberts (JKR) cohesive contact model were adopted, as shown below:
F J K R = 4 π γ E α 3 / 2 + 4 E 3 R α 3
δ = α 2 R 4 π γ α / E
where γ is defined as the surface energy; E is denoted as the equivalent Young’s modulus; α is represented as the contact radius; R is expressed as the equivalent radius; δ is designated as the normal overlap.
The most commonly used criterion for the JKR model is the energy balance criterion (adhesive energy ≥ residual kinetic energy), with the core parameter being surface energy. Han et al. adopted the Hertz–Mindlin with JKR Cohesion contact model and inverted DEM simulation parameters through angle of repose tests [30]. Considering the engineering practice of helicopter sand erosion simulation, the surface energy of dry sand particles is set to 0.03 J/m2, and the surface energy of the airframe aluminum alloy is set to 0.075 J/m2.

2.3. CFD-DEM Coupled Method

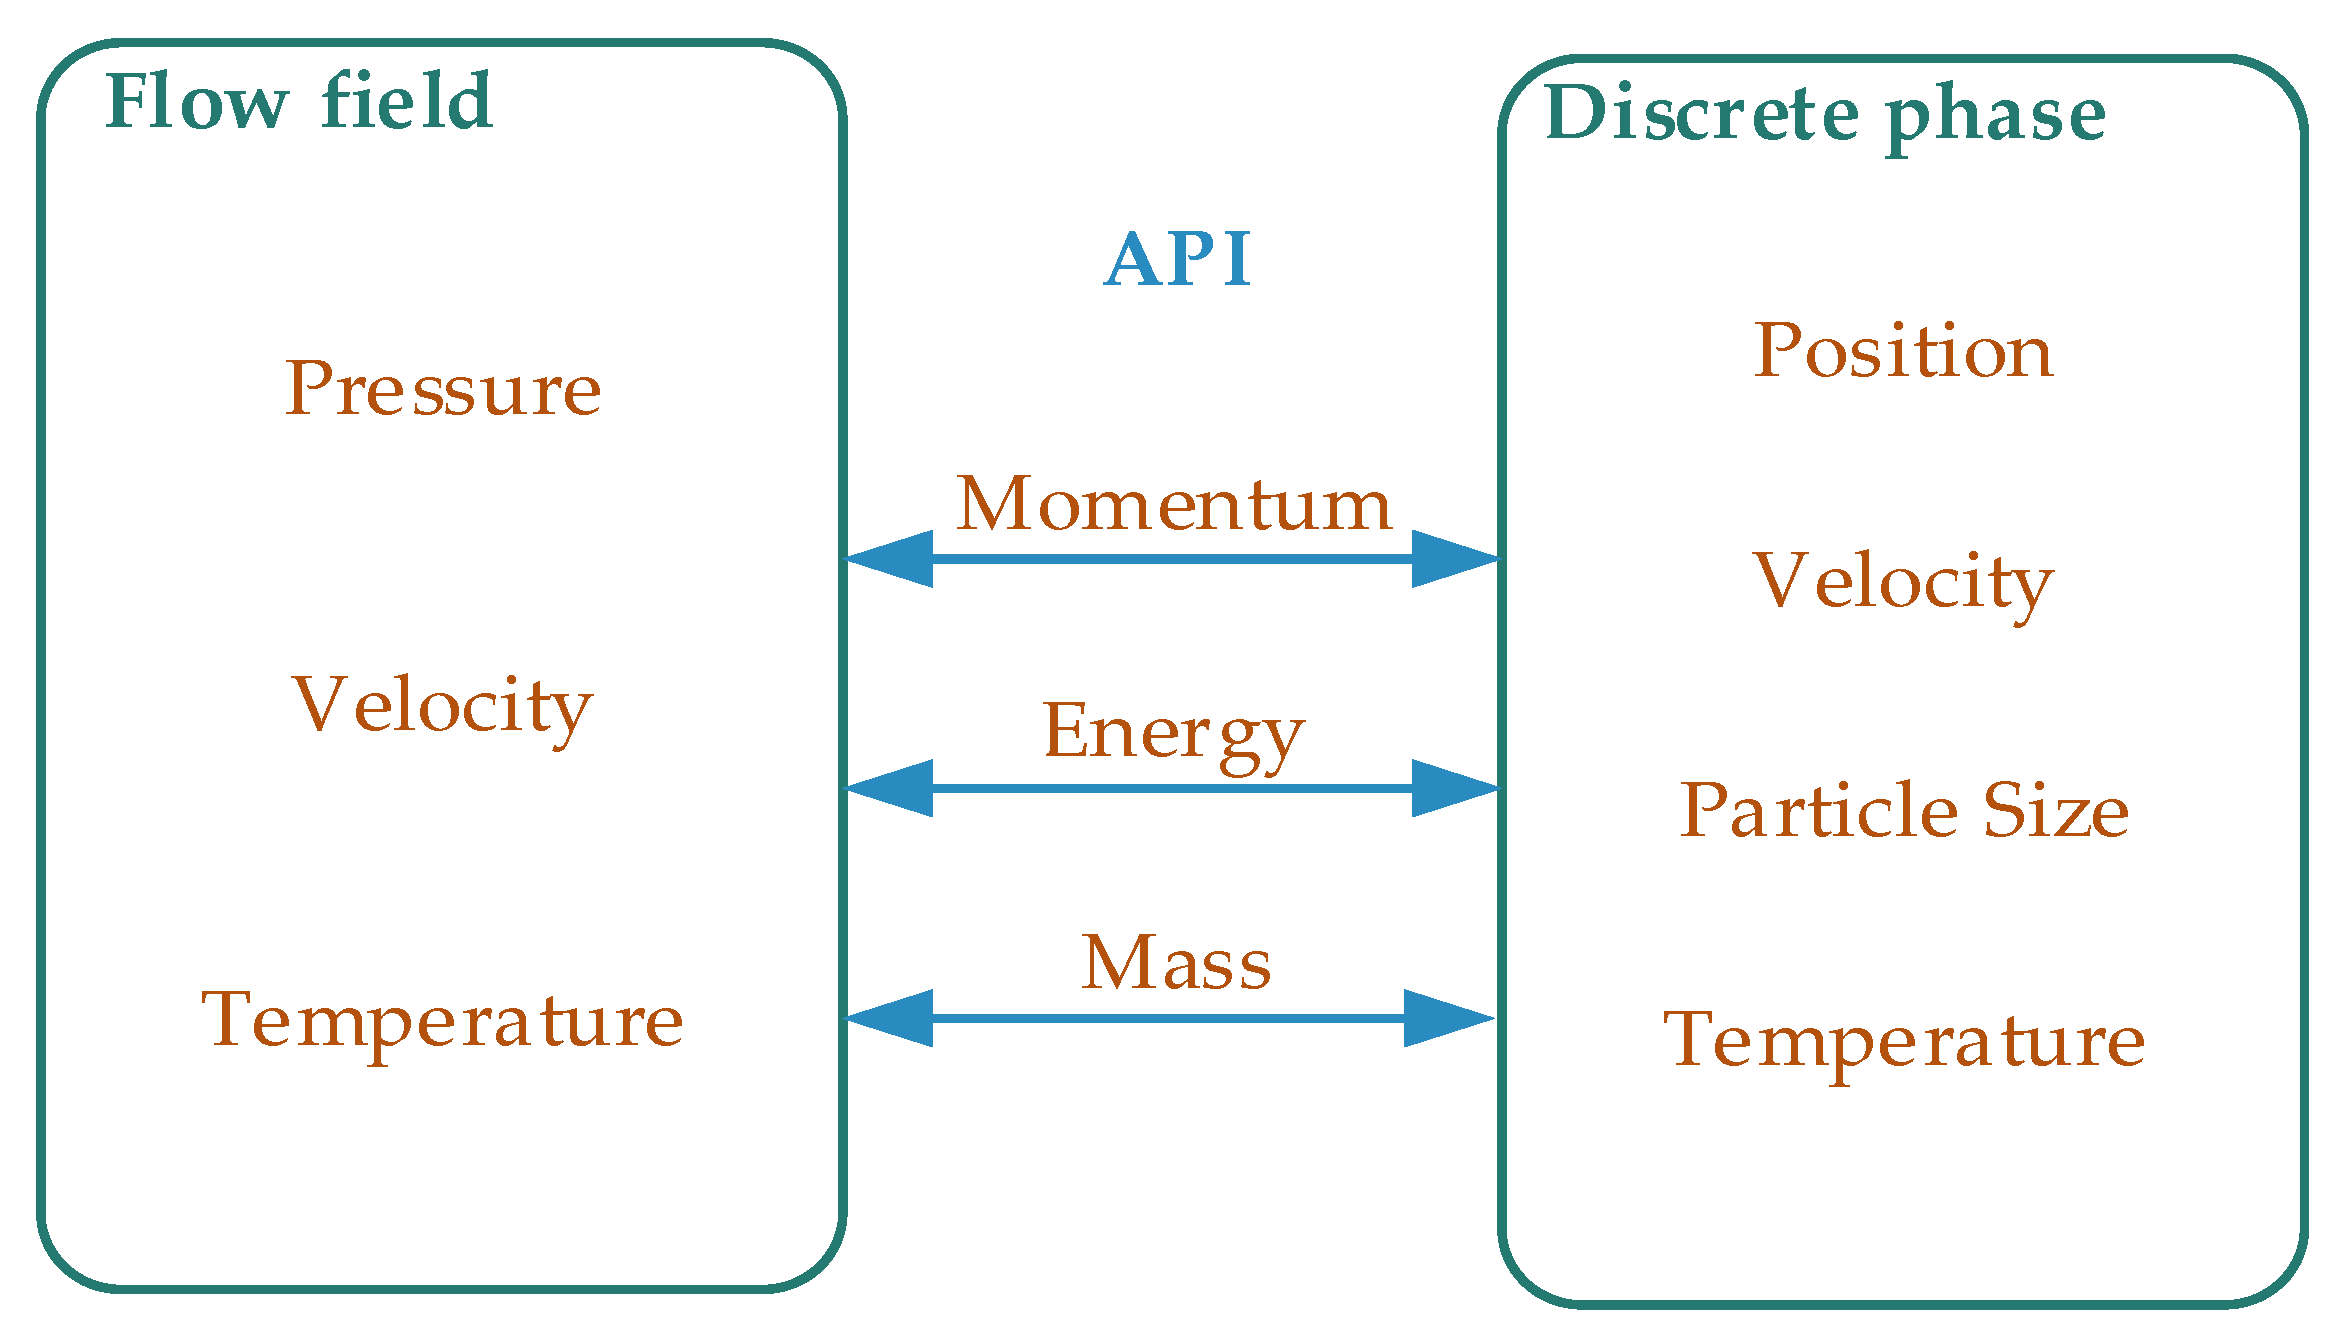
Information exchange between the flow field and sand particles is achieved via the application programming interface (API), as illustrated in Figure 1. Momentum, energy, and mass couplings exist between the fluid and solid phases. Energy coupling is primarily utilized to quantify the rates of heat and energy transfer between the fluid and solid phases. Mass coupling is mainly employed to evaluate the adsorption and desorption of substances on particle surfaces, as well as particle chemical reactions. Momentum coupling is used to characterize the drag forces exerted on particles and the momentum flux within the fluid. Due to the low concentration of sand particles in this study, energy and mass variations were not considered, with only momentum coupling being incorporated [31]. The simulations focus on investigating the motion and distribution patterns of sand particles in the flow field under the action of drag forces.
Given that the low volume fraction of sand particles in the entire computational domain, a one-way coupling simulation is adopted in this study [13]. Only the drag force exerted by the flow field on sand particles is considered, while the reaction of the particles on the flow field is neglected.
The Reynolds-averaged Navier–Stokes (RANS) method improves simulation efficiency, but loses the details of the unsteady evolution of tip vortices. The accuracy of the flow simulation will be validated in subsequent sections. A simplified particle size distribution (PSD) of sand–dust is adopted, while the effects of heat, temperature, and static electricity are neglected. Modeling of separator clean flow or re-entrainment is not performed. Since the purpose of the simulation in this paper is to determine the dimensions of the rotor test rig and assist in revealing the mechanism behind the experimental results, these simplifications are acceptable for the research scope of this paper.

2.4. Validation of the Accuracy of Flow Field Calculation

The CFD solution determines the accuracy of sand particle motion in the simulation of sand ingestion in helicopter engines. It can be divided into two parts. In the validation cases, the mesh independence was achieved through iterative mesh refinement. Firstly, based on the widely recognized Caradonna–Tung (C-T) rotor test data [33] in rotor flow field calculations, the numerical method adopted in this study for flow field computation was validated. The basic parameters of the validation case are presented in Table 1.
The grid independence test is an important process in CFD analysis [34]. The grid independence test is started for coarse mesh. Computational parameters are shown in Table 2. The mesh size is decreased and the number of elements is increased to obtain a fine mesh. The results obtained of lift values of various mesh sizes are compared. The mesh is made finer until the result variation in the analysis becomes less than 1%. The grid independence test is shown in Table 3. Finally, the finer mesh with 10,497,323 elements is fixed.
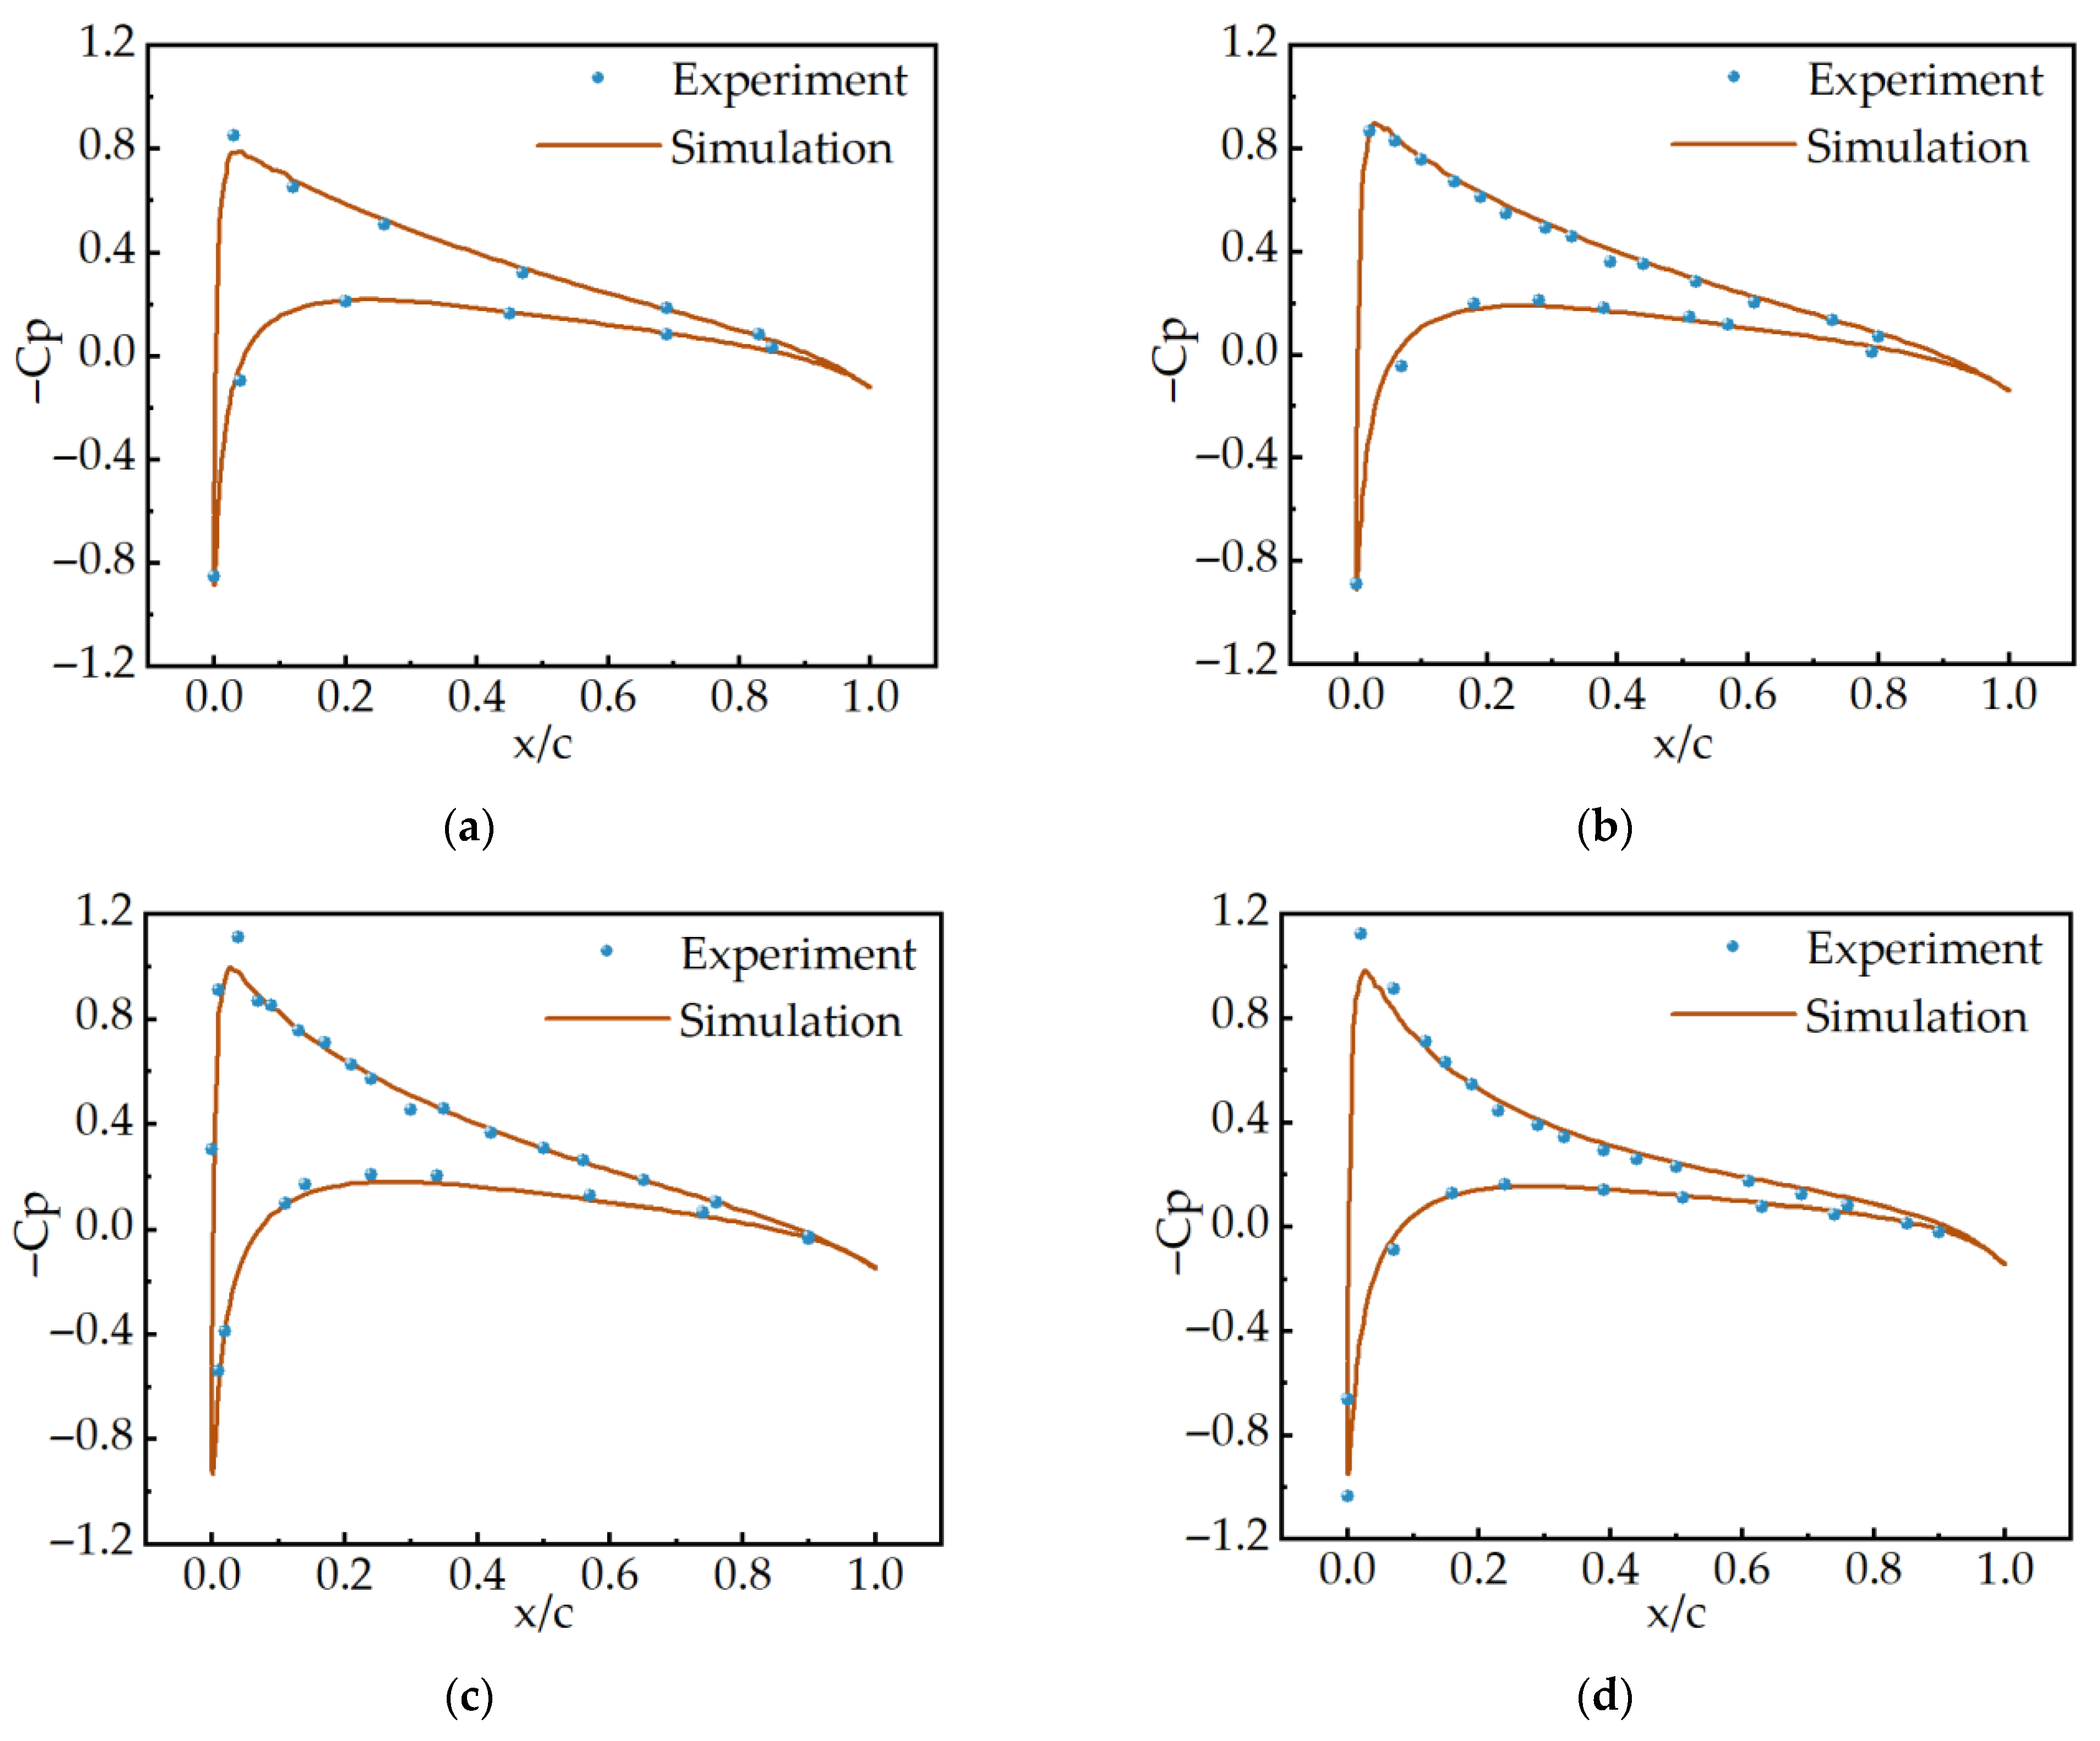
The computed results are presented in Figure 2. The ordinate represents the negative value of the pressure coefficient, where a larger value indicates a lower local pressure. The abscissa denotes the dimensionless chordwise position. The errors in pressure coefficients between the simulation results and experimental values are presented in Table 4, with error values within 0.03. The pressure coefficients of the blade are in good agreement with the experimental data, indicating that the mesh partitioning method and numerical discretization approach adopted in this study can effectively capture the flow field information in the vicinity of the rotor.
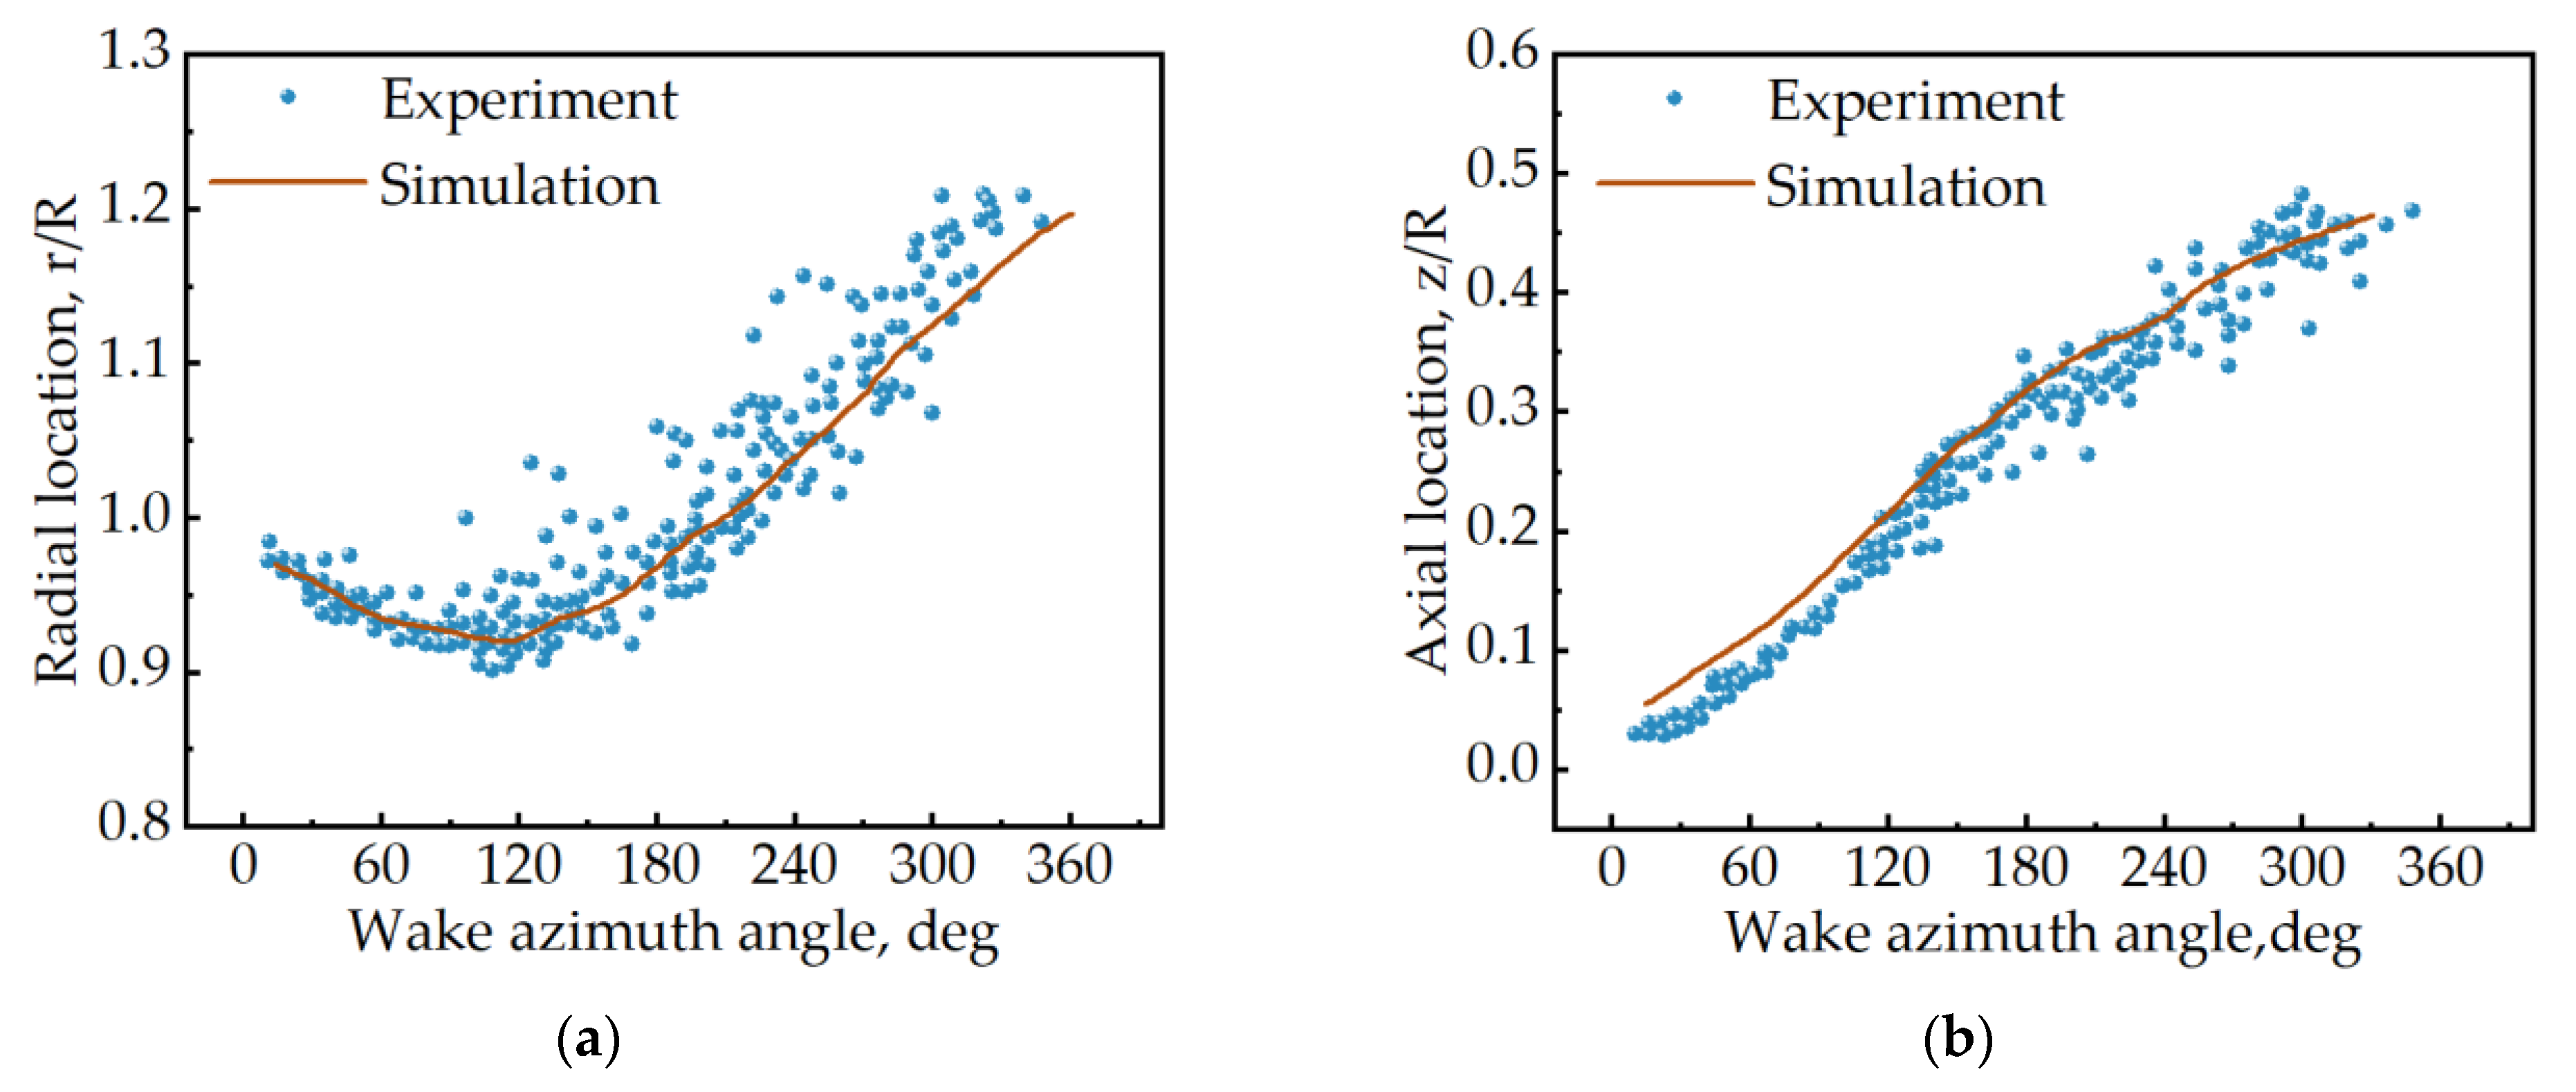
Subsequently, to further validate the capability of the numerical method in capturing rotor tip vortices, the shedding positions of tip vortices at a rotor hovering height of 0.52R were compared with experimental data. As illustrated in Figure 3, the variations in the axial and radial positions of the shed tip vortices with respect to the azimuthal angle are in good agreement with the experimental values [4]. The simulation values fall within the data band of experimental values. Therefore, this numerical method can provide accurate flow field information for DEM model.

3. Simulation of Sand Particle Motion in Sand Clouds

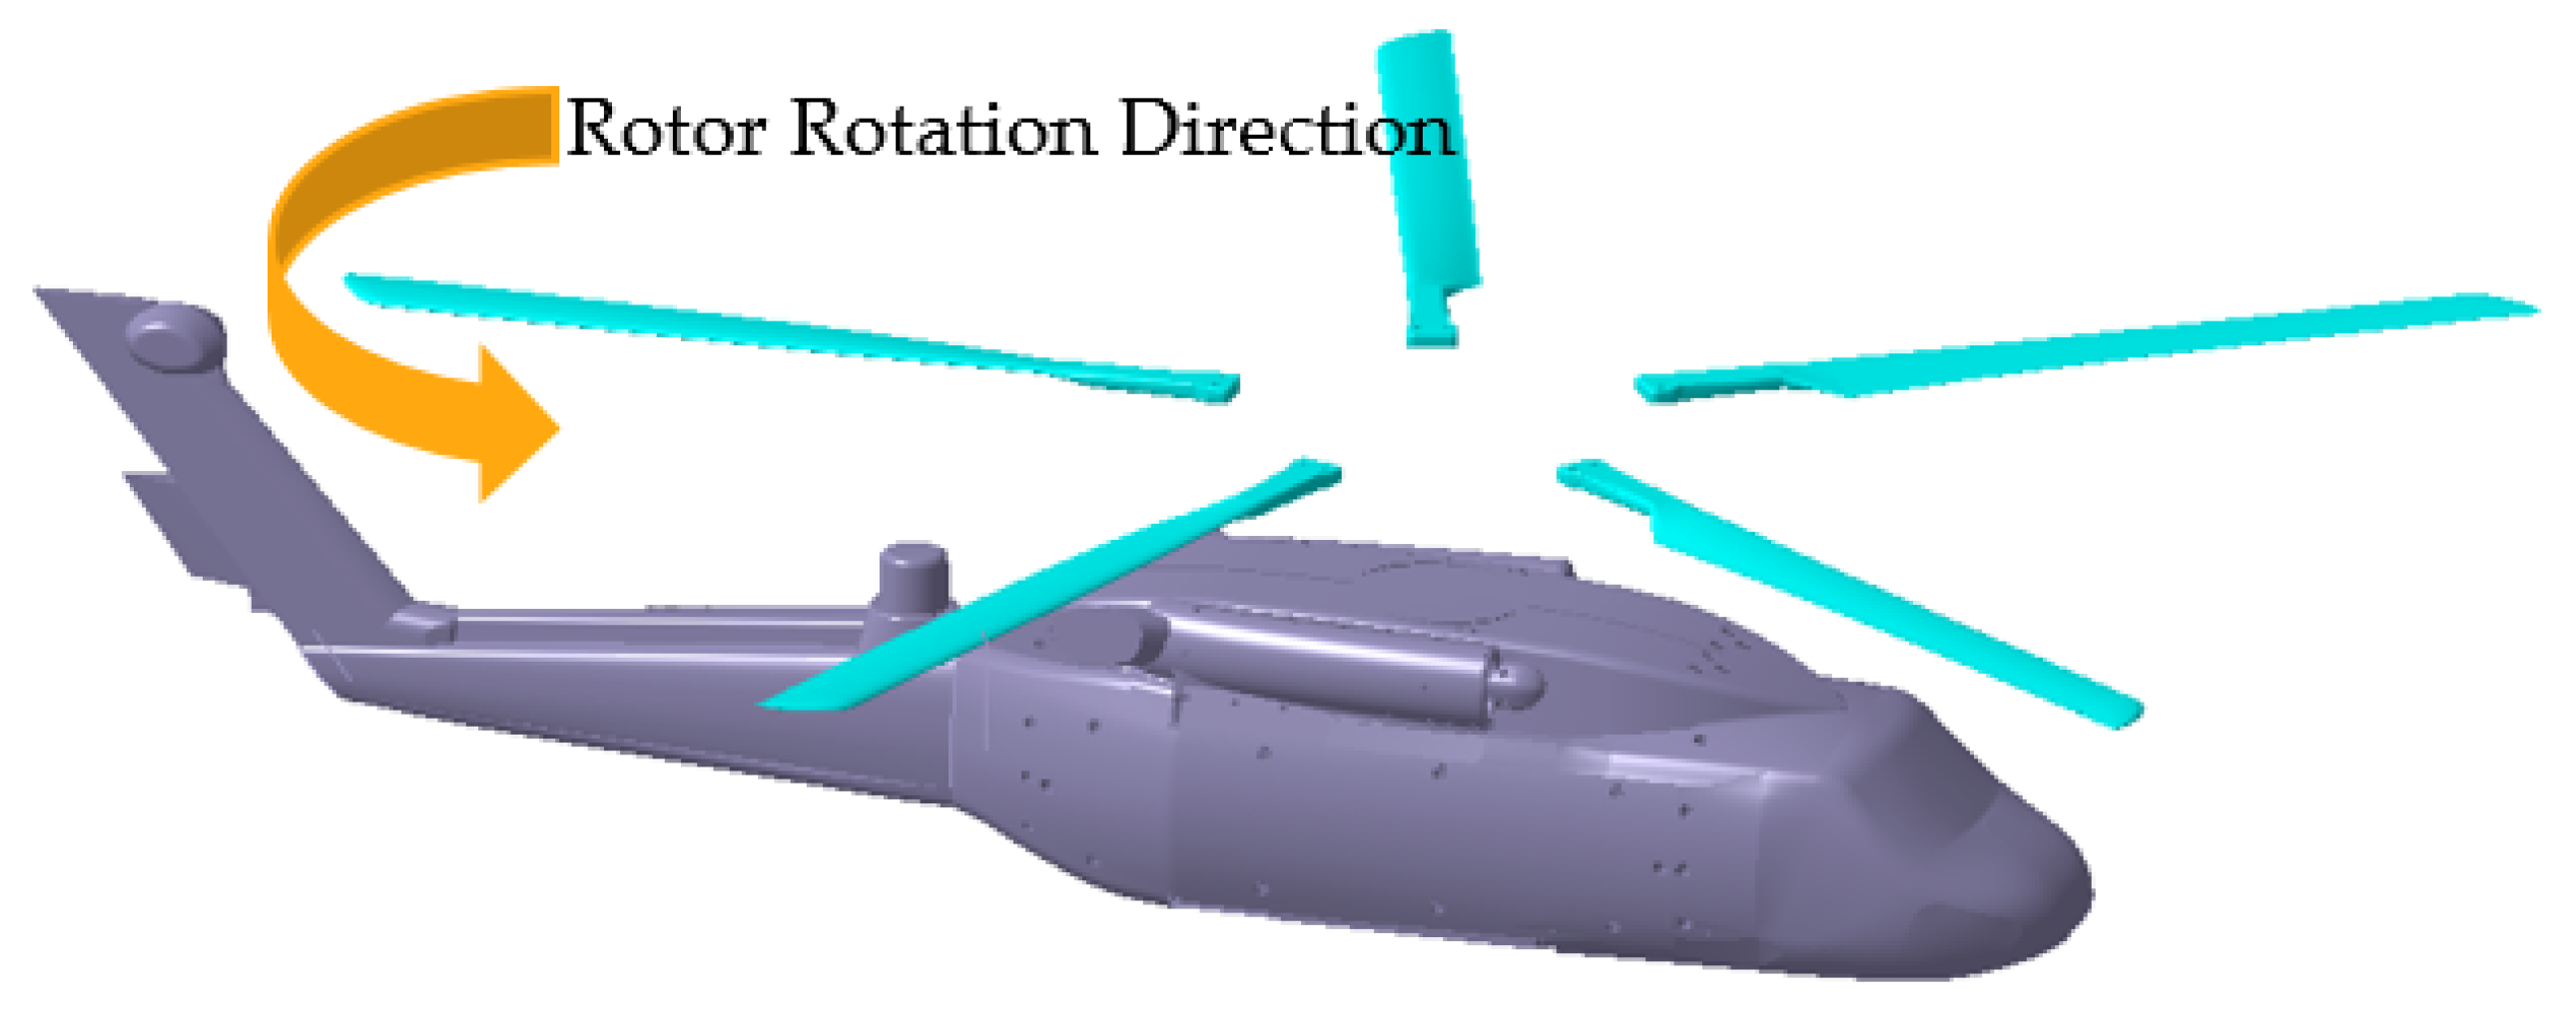
The helicopter with a right-rotating rotor is presented in Figure 4, with its associated parameters detailed in Table 5. The geometric dimensions of the experimental model are determined based on geometric similarity. The Mach number and engine inlet flow velocity are approximated with full-scale conditions. And, disk loading similarity is achieved by adjusting the pitch.

3.1. Mesh System of the Helicopter and Physical Model of Sand Particles

In this study, the computational domain was spatially discretized using unstructured meshes, and the motion of the rotor was realized via sliding mesh technology. To better capture flow field information and obtain more accurate particle motion results, mesh refinement was performed in the region beneath the rotor. The mesh configuration is presented in Figure 5.
The downwash velocity of helicopter rotors typically reaches 15 m/s. Experimental data indicate that the diameter of sand particles entrained in the air is predominantly below 500 μm at wind speeds ranging from 5 to 15 m/s [35,36]. In this study, sand particles were modeled via the multi-sphere method within EDEM, adopting spherical configurations with diameters of 10, 50, 100, and 500 μm. As shown in Figure 6, each type of particles was uniformly distributed over an 8R × 8R × 10 cm ground region. The parameters for the particles and helicopter surfaces are listed in Table 6. Table 7 lists the number of meshes and coupling-related parameters in the CFD and DEM modules.

3.2. Simulation Results

3.2.1. Helicopter Ground-Effect Flow Field

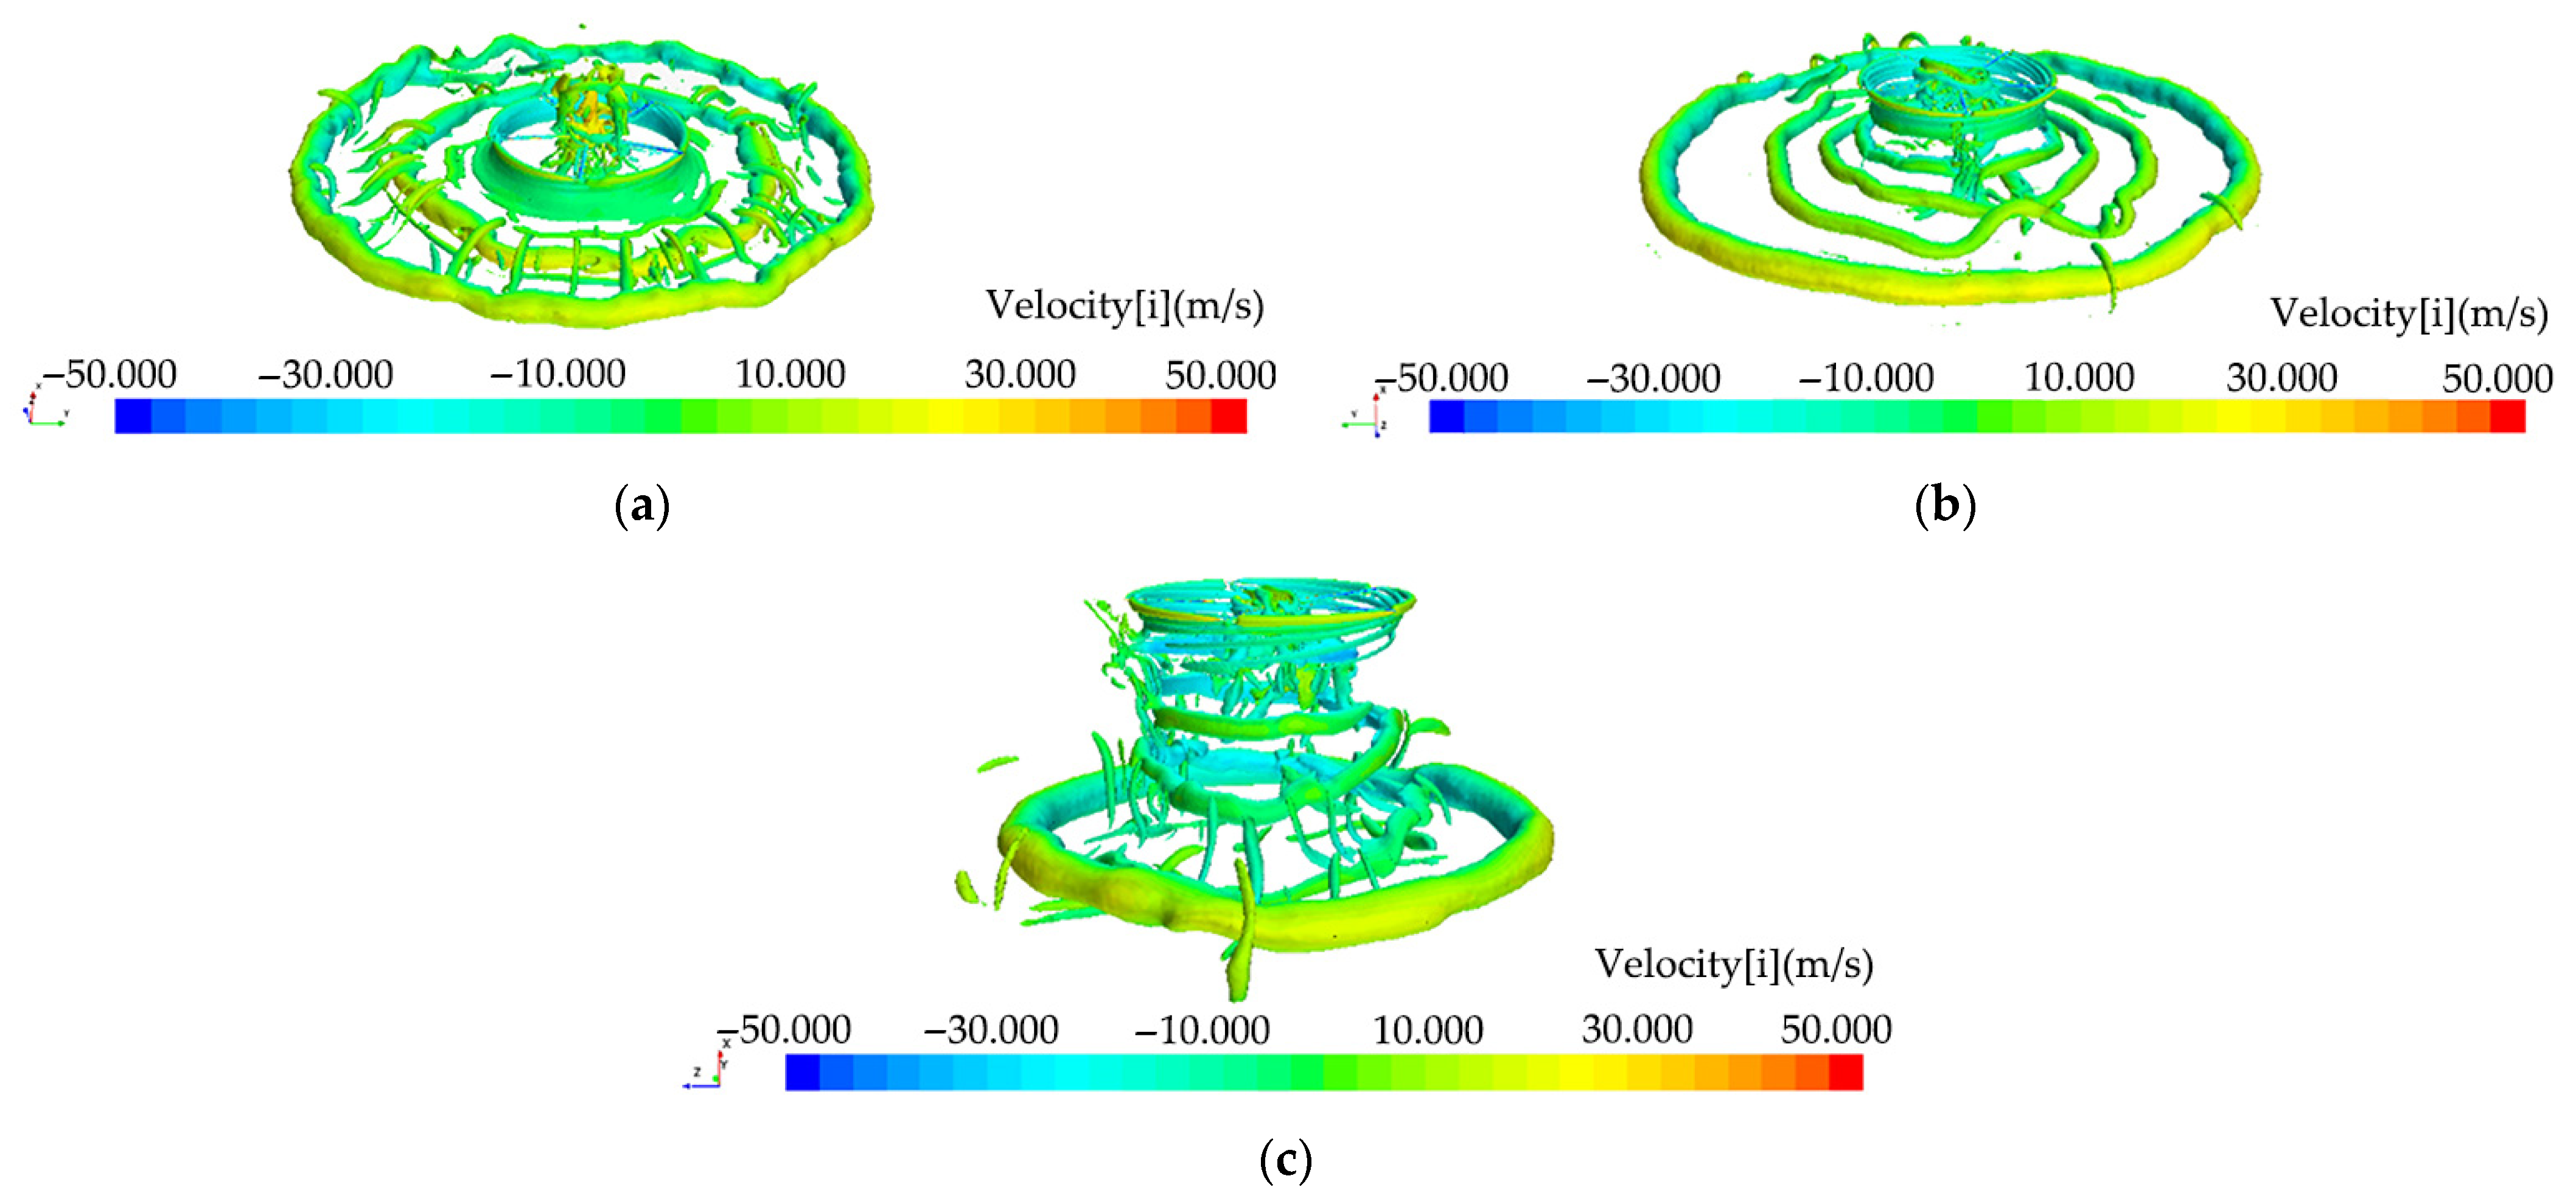
Figure 7 shows the vorticity contour of the converged flow field. Figure 7a shows the strong ground-effect condition with h/R = 0.5. The flow field exhibits a compact annular vortex structure, which is mainly concentrated in the near-ground region. The rotor downwash strongly impacts the ground, forming an “annular recirculation zone” near the ground. In terms of velocity distribution, the high-velocity regions are concentrated in the high-speed circumfluence; the low-velocity regions are clearly present in the local recirculation formed after the downwash impacts the ground. The overall vortex system is strongly constrained by the ground, with limited three-dimensional expansion.
Figure 7b shows the moderate ground-effect condition with h/R = 1. Compared with Figure 7a, the vortices in the central region begin to extend upward, the “winding degree” of the annular vortices decreases, and the vertical evolution of the flow field increases. In terms of velocity distribution, the coverage of high-velocity regions expands slightly extending vertically; the area of low-velocity regions shrinks, indicating that the intensity and scope of ground recirculation weaken with increasing height.
Figure 7c shows the weak ground effect condition with h/R = 2. The vortex structure exhibits a strong three-dimensional vertical expansion morphology. A large number of vortices extend upward from the bottom annular region, forming a “branch-like” and “spiral-like” three-dimensional vortex system. In terms of velocity distribution, the high-velocity regions are not only distributed in the bottom annular area but also extend into the upper vortex structure; the proportion of low-velocity regions further decreases and is scattered in distribution. It indicates that the ground effect is extremely weak, the rotor downwash is minimally constrained by the ground, and the vortices can develop freely in the vertical direction.
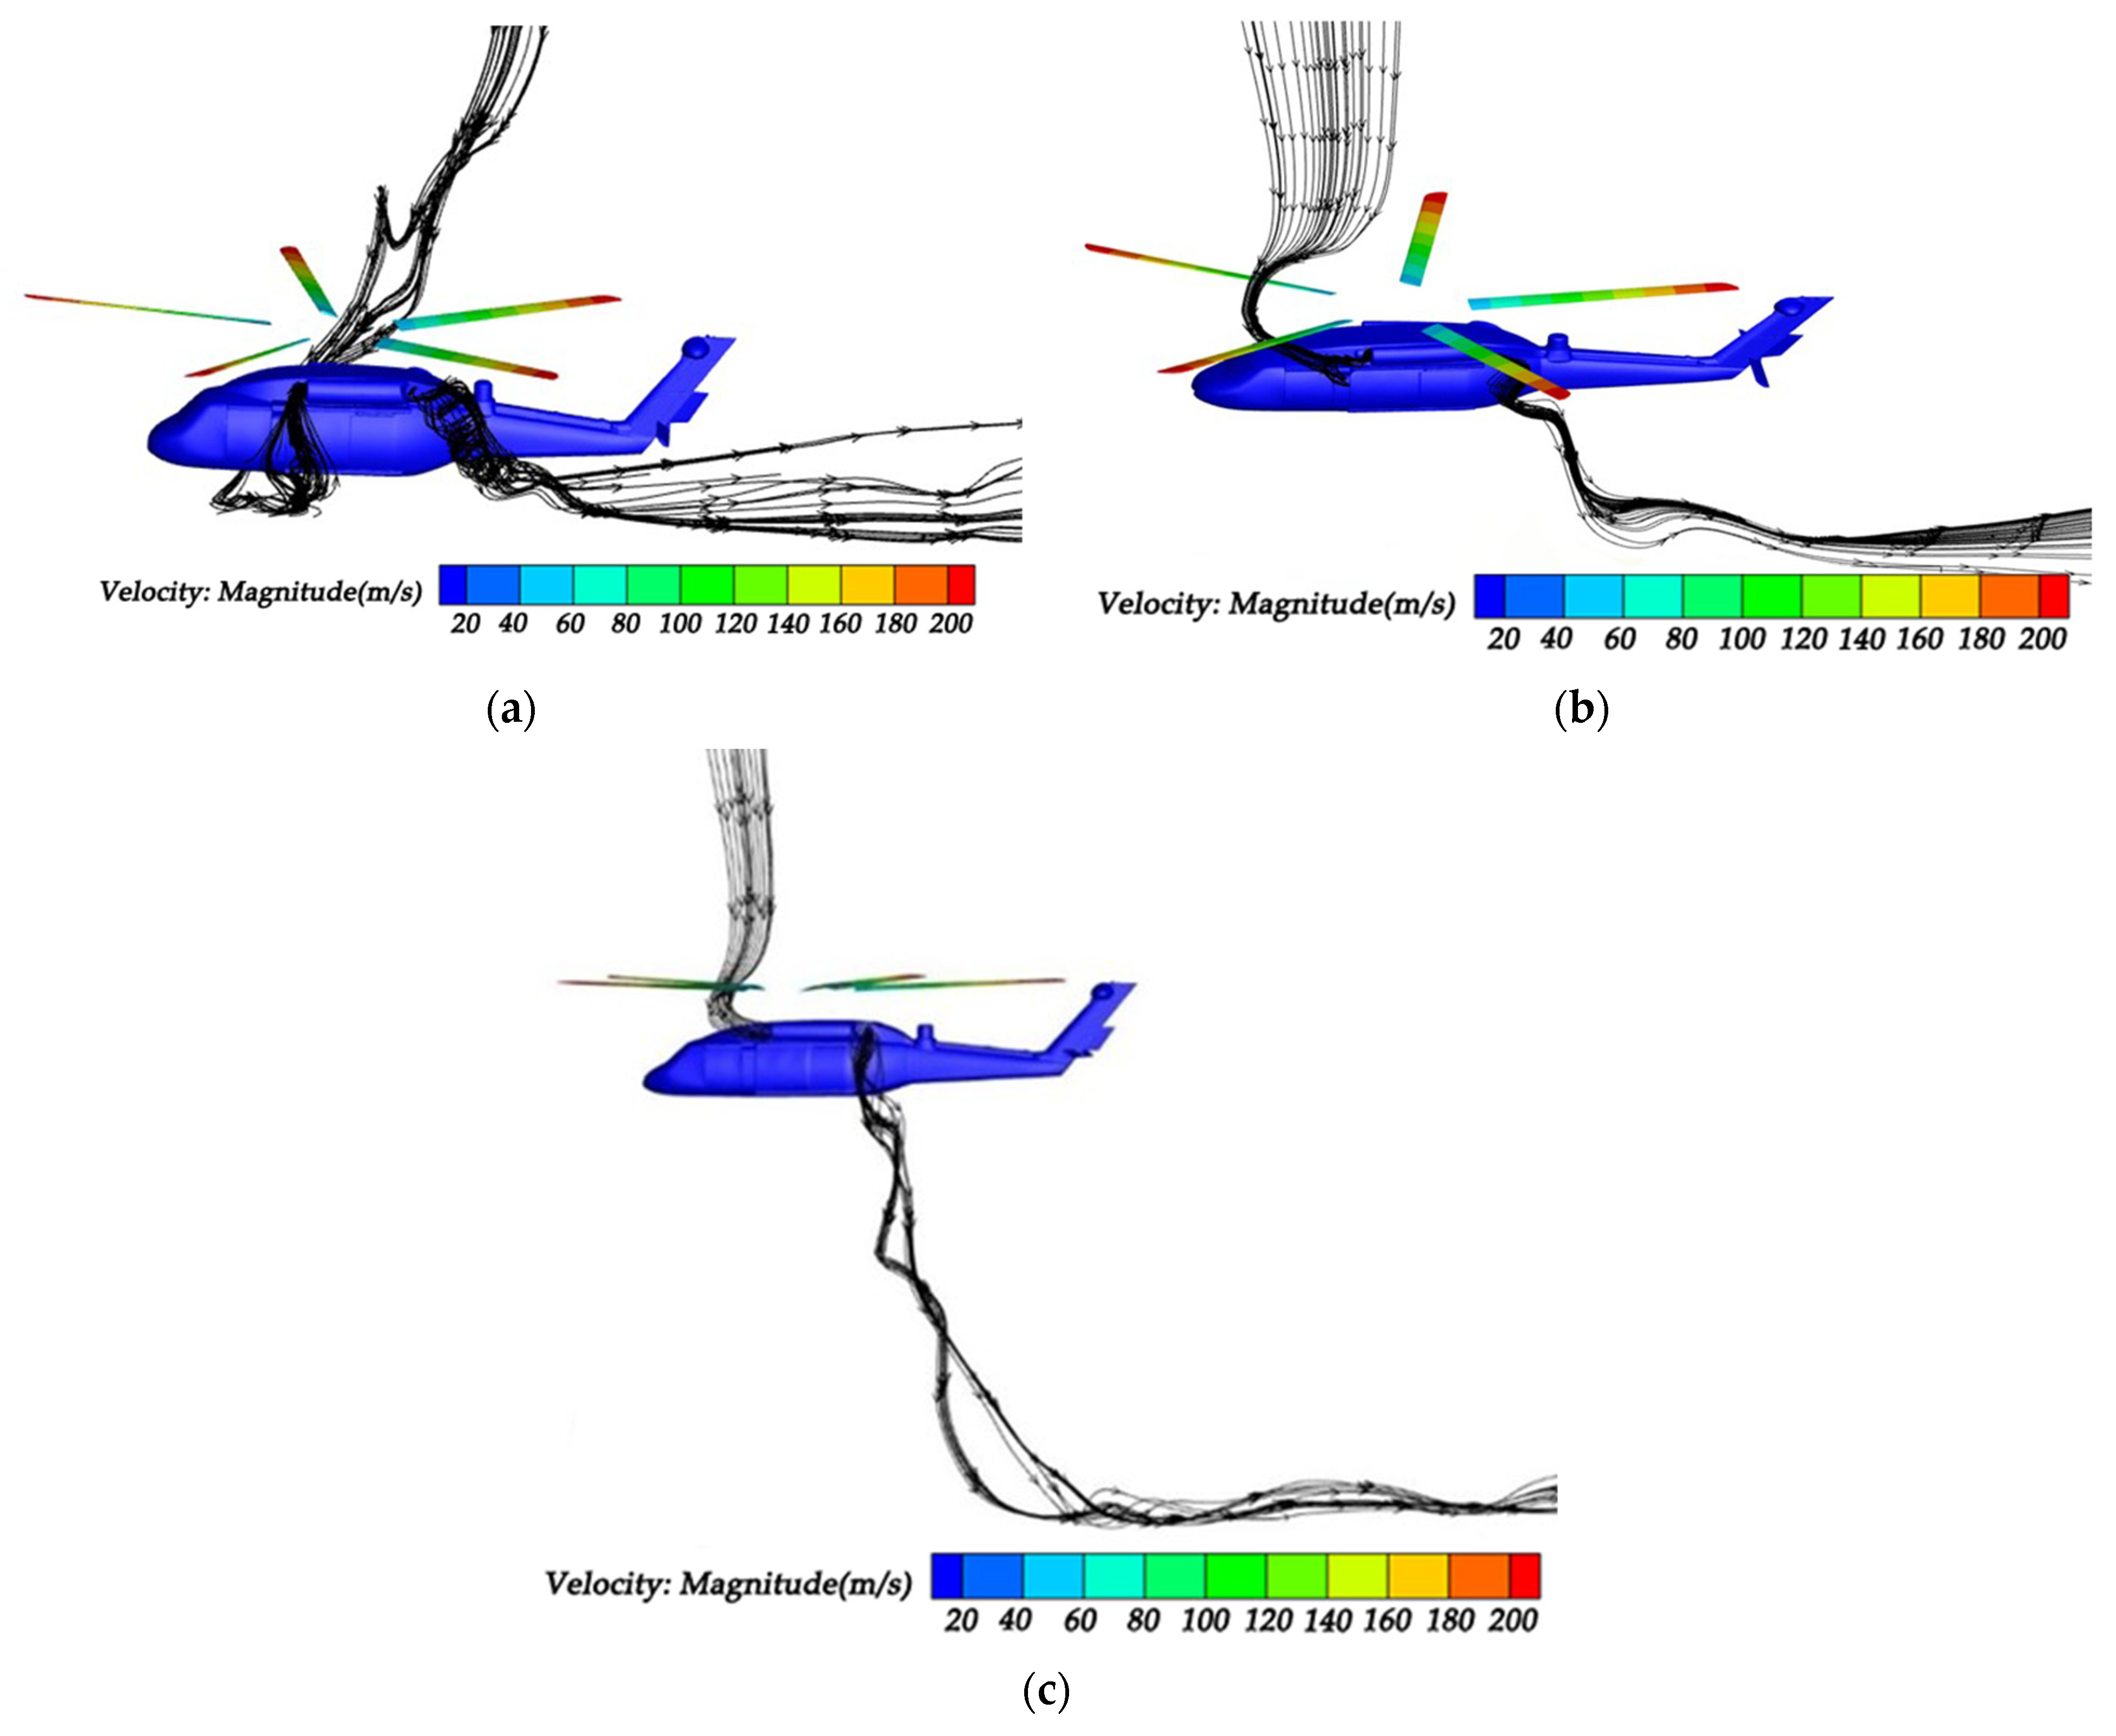
Figure 8 illustrates the converged streamline distributions at the engine inlet and outlet. Figure 8a shows the strong ground-effect condition with h/R = 0.5. The streamlines near the engine exhibit a dense and highly disordered tangled pattern. After the rotor downwash interacts violently with the ground, the airflow is reflected by the ground and converges toward the engine inlet area.
Figure 8b shows the moderate ground-effect condition with h/R = 1. Compared with Figure 8a, the interaction between the rotor downwash and the ground is weakened, and the phenomenon that the airflow is reflected from the ground to the engine inlet disappears. The airflow converges toward the engine inlet in a more orderly manner, and the streamlines have a larger expansion range in the vertical direction.
Figure 8c shows the weak ground-effect condition with h/R = 2. The streamlines near the engine exhibit an extended and smooth pattern, and turbulence almost disappears. The streamlines are guided more smoothly from below the rotor toward the engine inlet, and the flow field is close to the free-stream state.

3.2.2. Sand Cloud Distribution

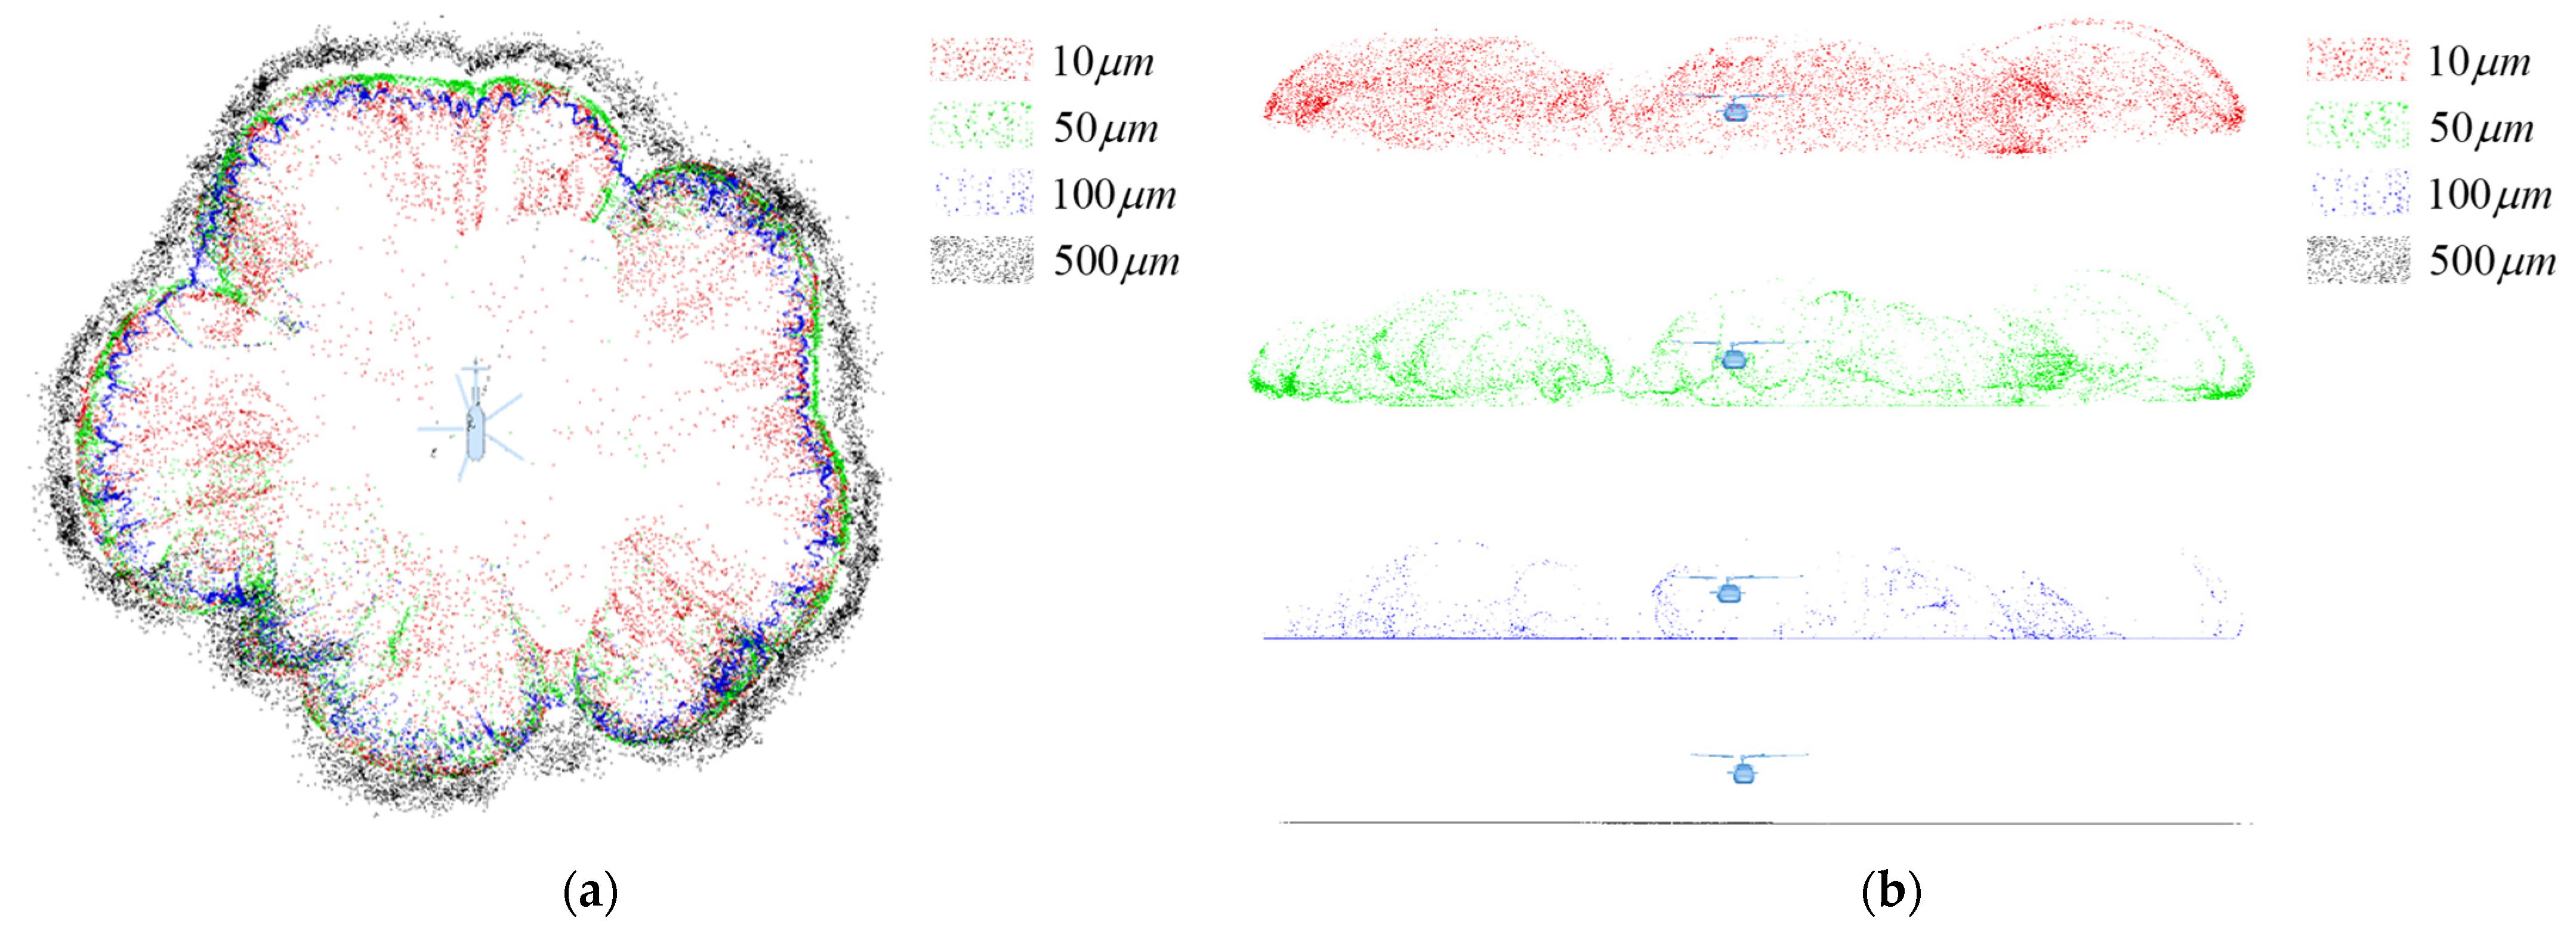
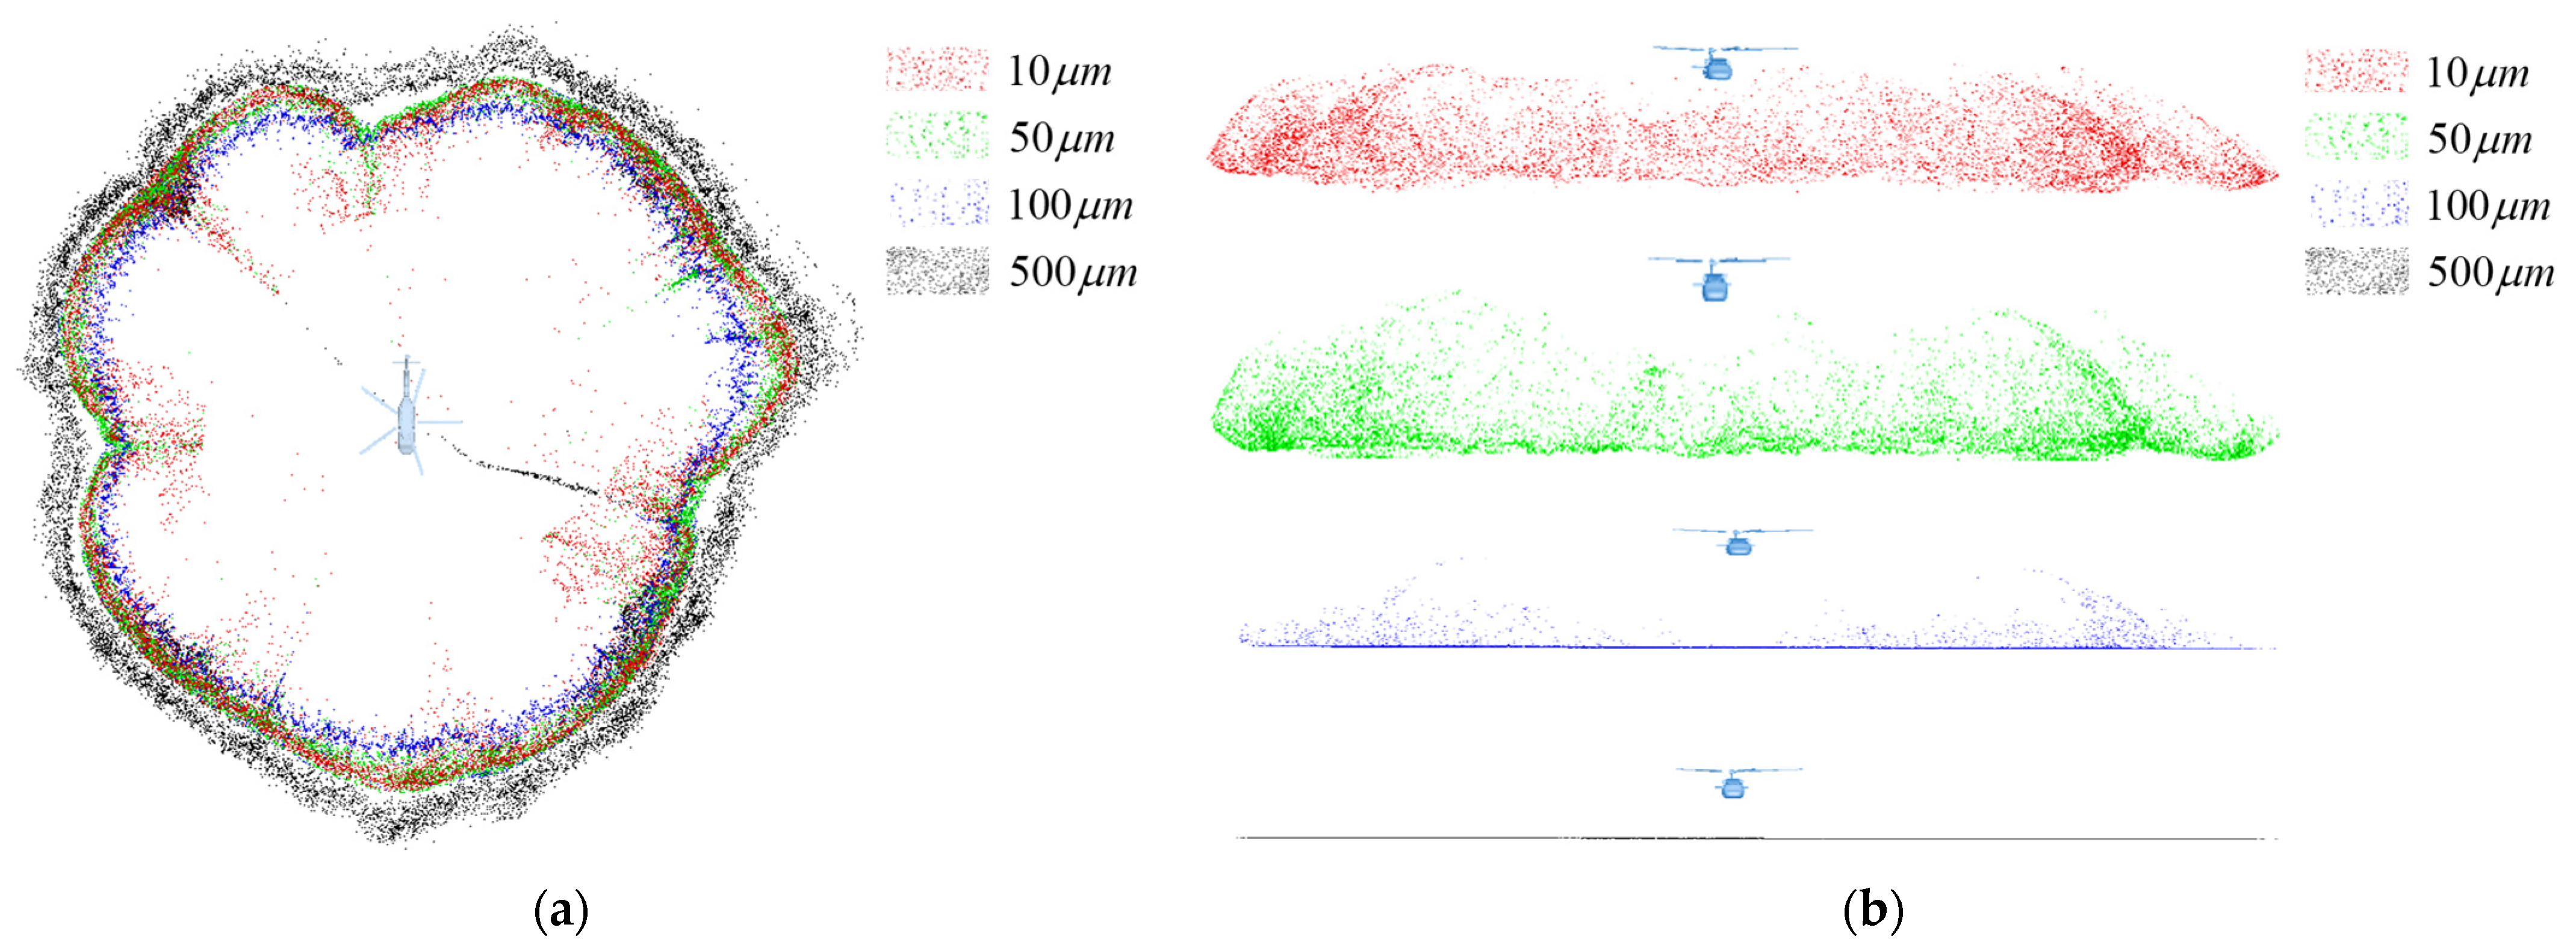
Figure 9, Figure 10 and Figure 11 present the distribution of sand clouds at the converged state. They detail the sand cloud distributions of particles with varying diameters under different GEHs. Driven by the flow field, sand particles propagate radially outward. A part of these particles is entrained by the airflow away from the ground to the vicinity of the helicopter where they may be ingested by the engine. As inferred from the comparison of top views, with increasing GEH, the concentration of sand particles around the helicopter diminishes, and the volume of sand ingested by the engine should decrease accordingly. Analysis of side views at varying GEHs shows that the height of sand clouds decreases progressively with increasing GEH. At h = 2R, the sand cloud height is significantly lower than the position of the helicopter. Comparison of side views for sand clouds with varying particle diameters indicates that the height of sand clouds decreases with increasing particle diameter, with particles exceeding 500 μm unable to be lifted from the ground.
In order to further investigate the sand ingestion behavior of the engine, statistics on whether sand particles of different diameters can be ingested by the engine under varying GEHs are compiled in Table 8. As the GEH increases, the maximum diameter of sand particles ingestible by the engine becomes smaller. When h > 2R, no sand ingestion occurs, which is associated with the sand cloud height being significantly lower than the helicopter height. Under the thrust coefficient and engine intake flowrate adopted in this study, only sand particles with a diameter smaller than 100 μm can be ingested by the engine.

4. Experiments on Sand Ingestion by Helicopter Engines

From previous simulations, the maximum GEH considered is 2R. Based on this, the rotor platform height was determined. Further, via a height-adjustable sand platform, sand ingestion experiments under varying GEHs were implemented. The engine intake flowrate is also a critical factor affecting the sand ingestion amount. Thus, two engine intake flowrate conditions (370 m3/h and 433 m3/h) were compared herein. The experimental conditions are summarized in Table 9. Each condition was repeated five times to reduce experimental errors, with each repetition lasting 60 s.
Considering that the sample size of dust under some experimental conditions is very small, sample collection was carried out after the completion of five test runs to avoid losses caused by sample collection. The average value was taken for data analysis, and the original experimental data are provided in the Table A1.

4.1. Experimental Setup

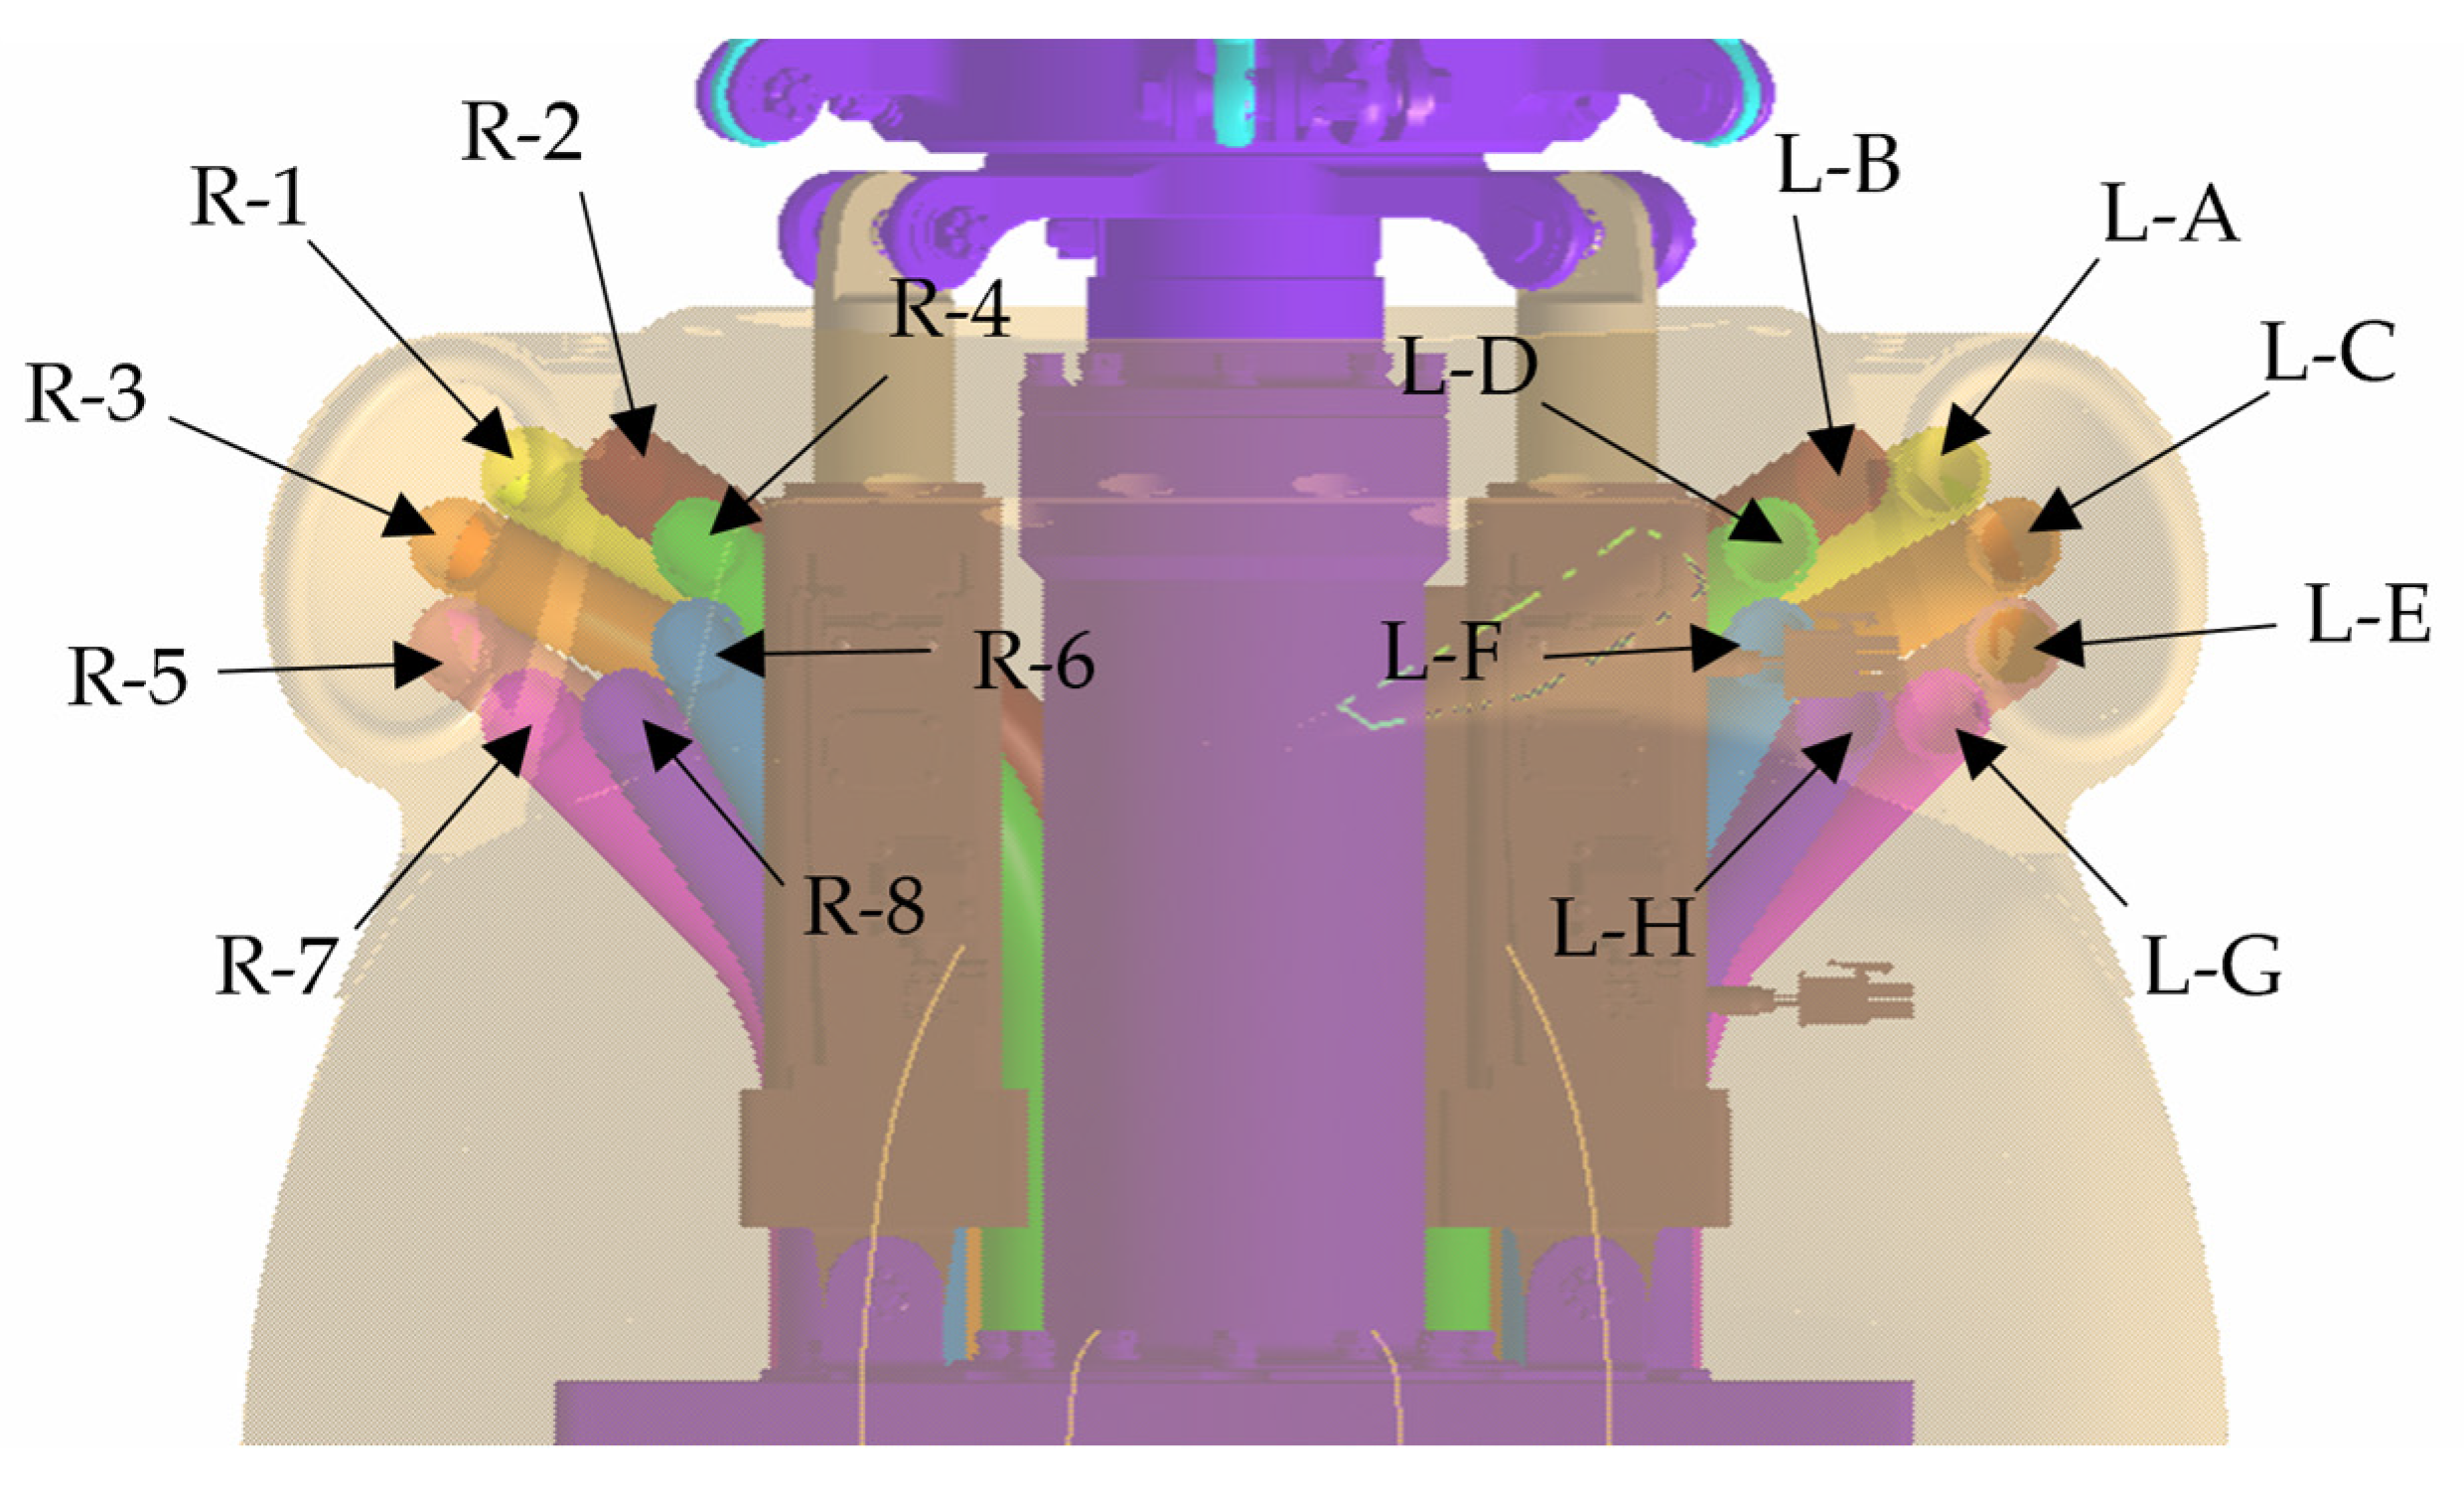
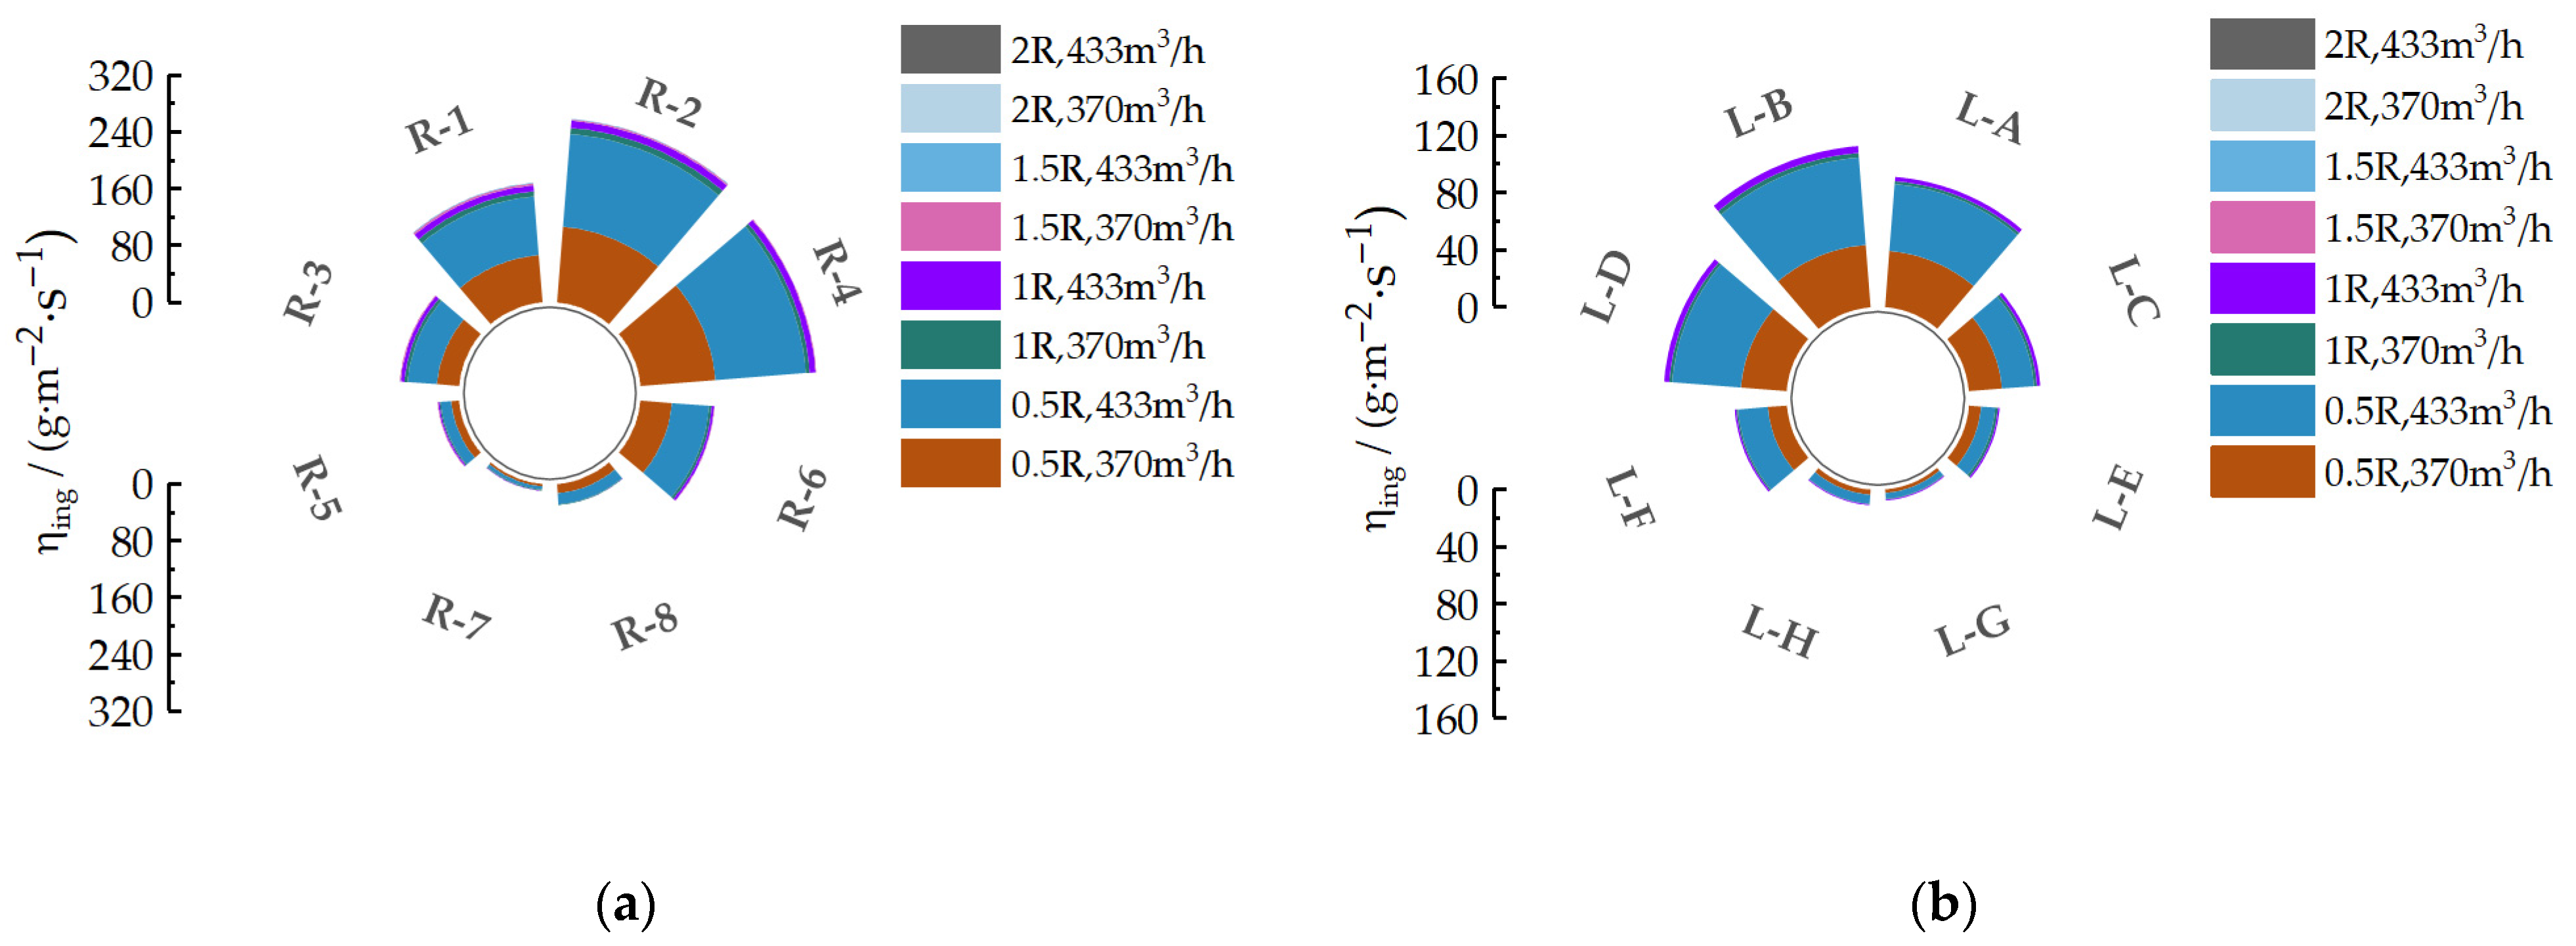
Figure 12a depicts the twin-engine helicopter with a five-bladed rotor used in this experiment. Its parameters are consistent with those of the simulated helicopter described, as presented in Table 5. High-efficiency particulate air filters (HEPA) were utilized to collect the sand particles in regions of the engine intake. Figure 12b illustrates the height-adjustable experimental platform, which used to achieve different GEHs conditions. Additionally, to better simulate the real sand environment, dry fine sand sourced from deserts was used in the experiment. To investigate the distribution of sand ingestion amount across the engine inlet cross-section, both left and right inlets were divided into 8 regions, as shown in Figure 13. Each region has an equal area of 0.0018 m2.
To improve generality, the sand ingestion amount is normalized with the inlet cross-sectional area and sand ingestion time. The normalized sand intake amount is denoted as
η i n g = m i n g A t
where η i n g is defined as the intake mass of sand particles, A denotes the area of the inlet under study, and t represents the sand ingestion time.
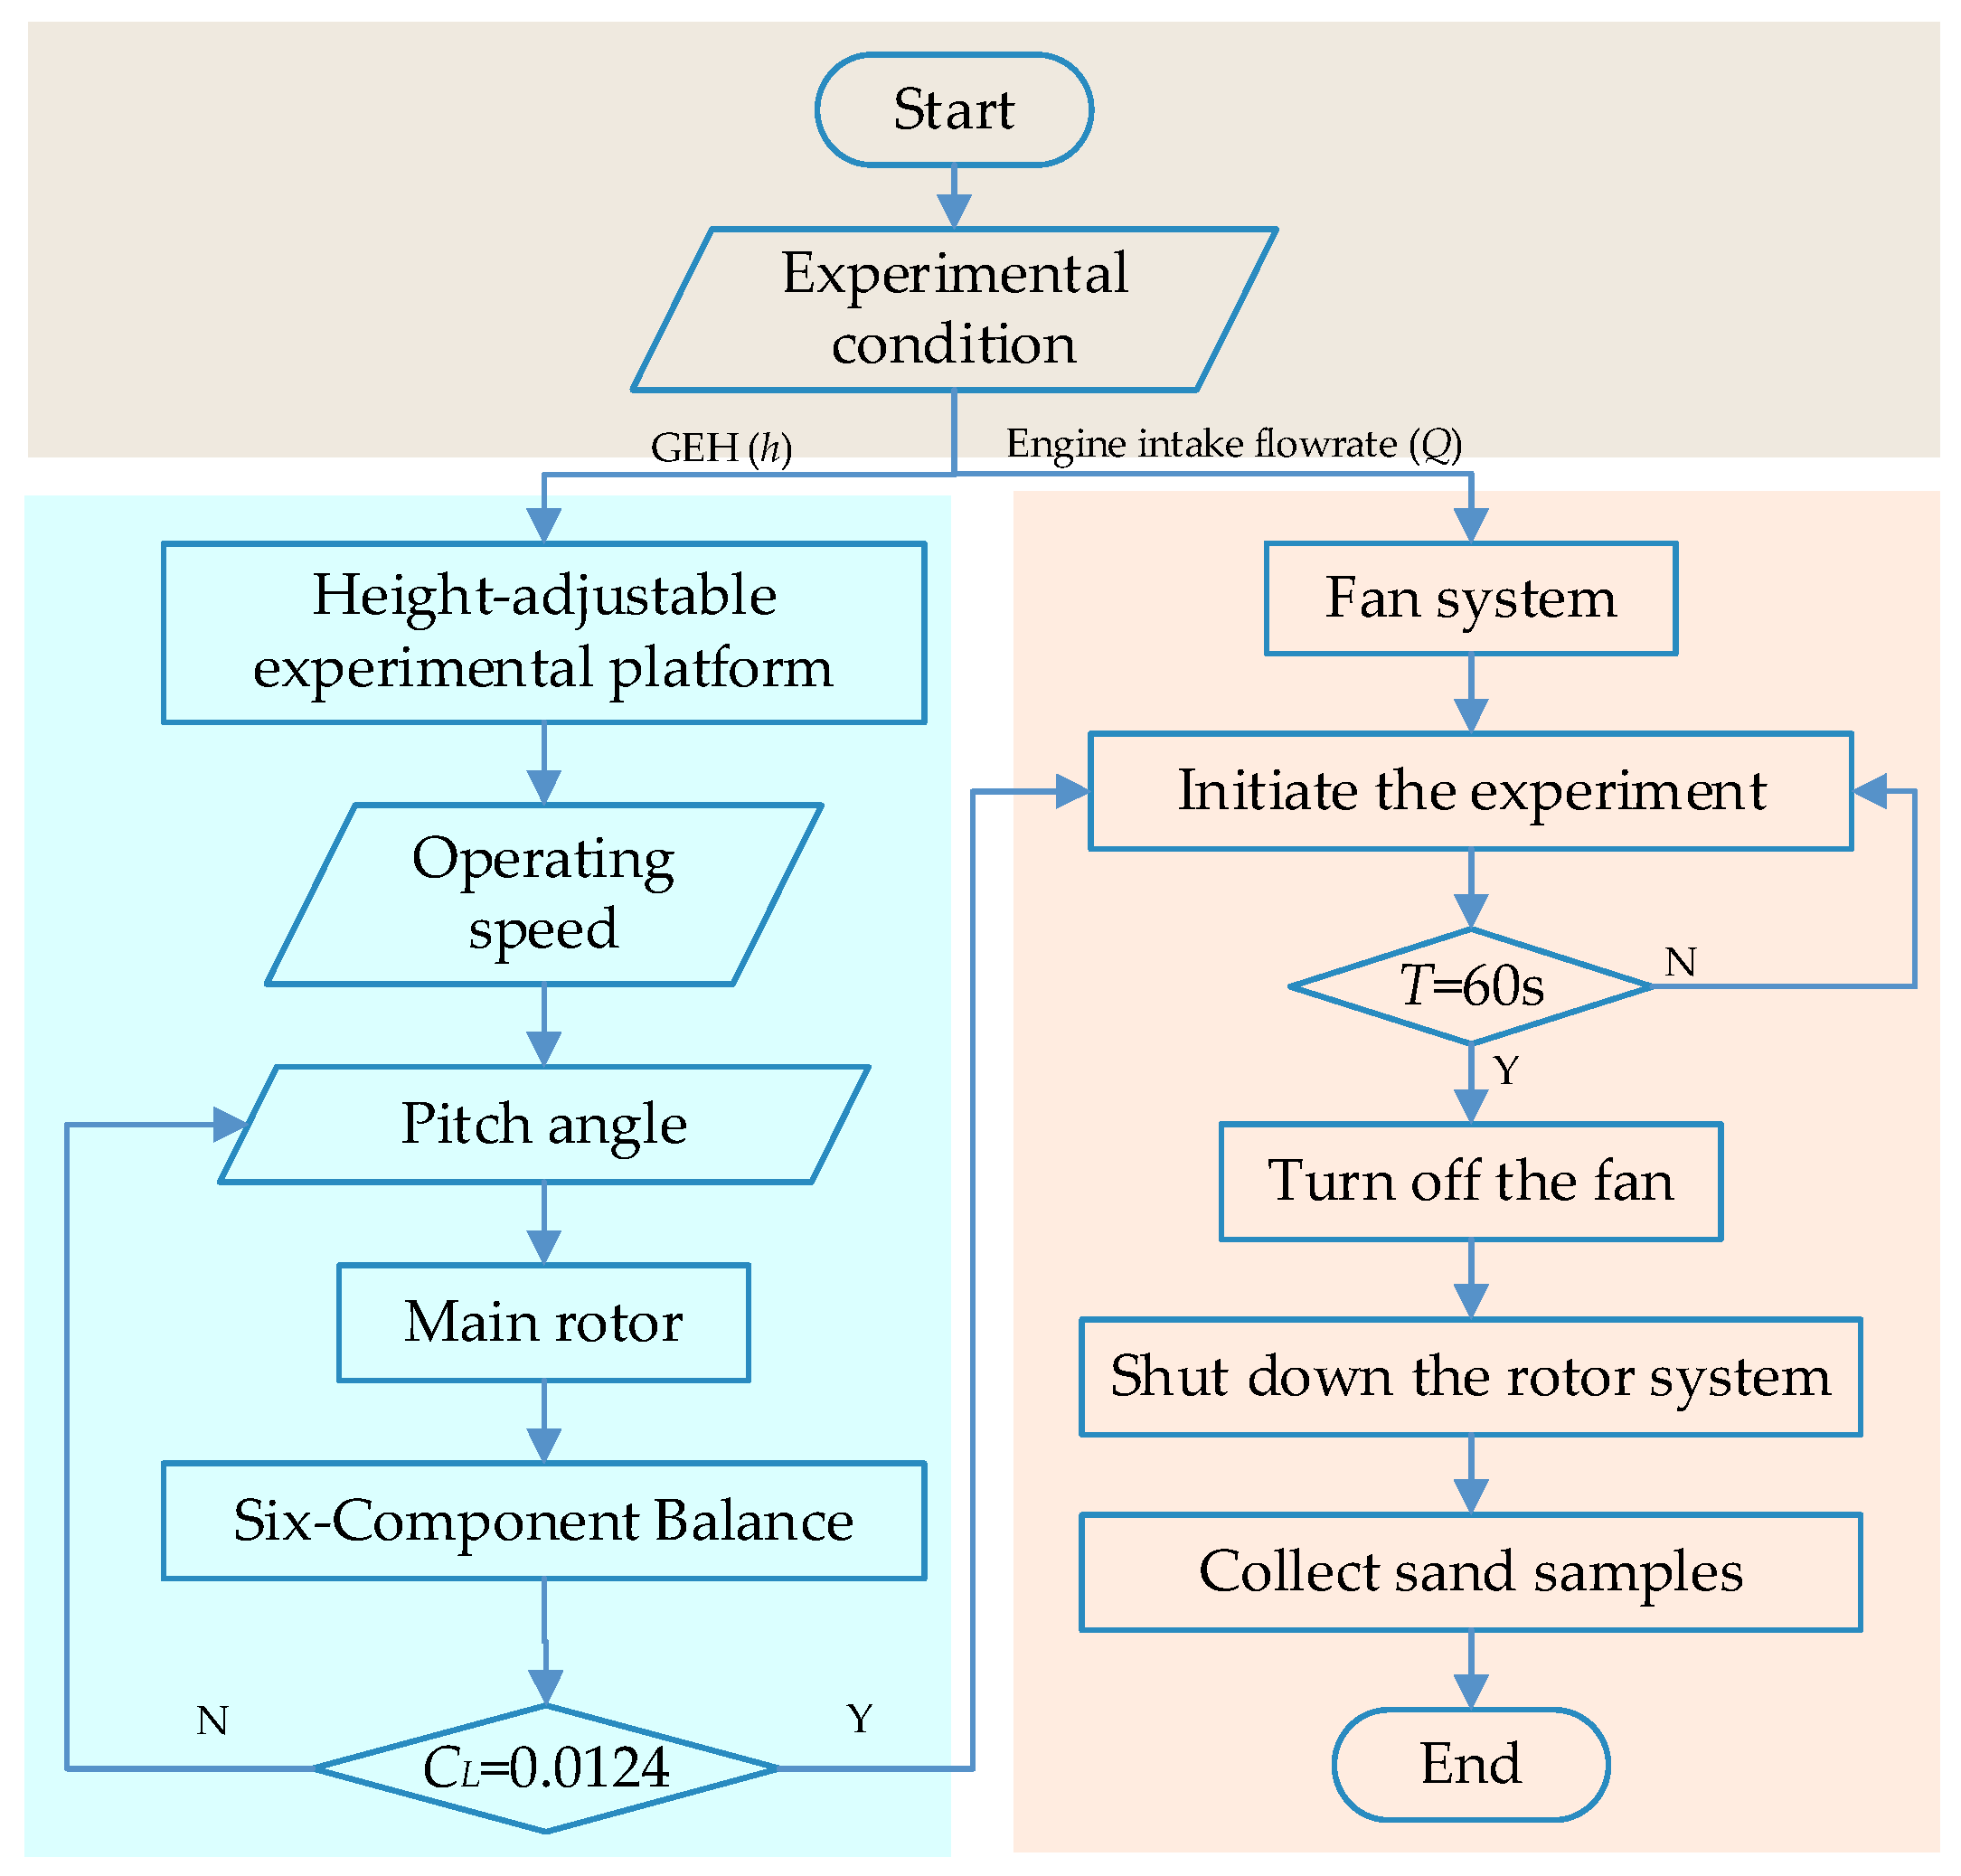
Figure 14 illustrates the experimental procedure for sand ingestion by helicopter engines in ground-effect hover. Firstly, the rotor thrust is monitored using a rotor six-component balance, and the rotor collective pitch is adjusted to regulate the thrust to the preset value. Subsequently, the fan intake flowrate is controlled to ensure the engine inlet intake flowrate reaches the preset value. The experiment is stopped after being timed for 60 s. Then, sand is replenished in the sand field to ensure an adequate supply of sand particles. Finally, the experiment is repeated five times, and the experimental samples are collected and counted.

4.2. Experimental Results

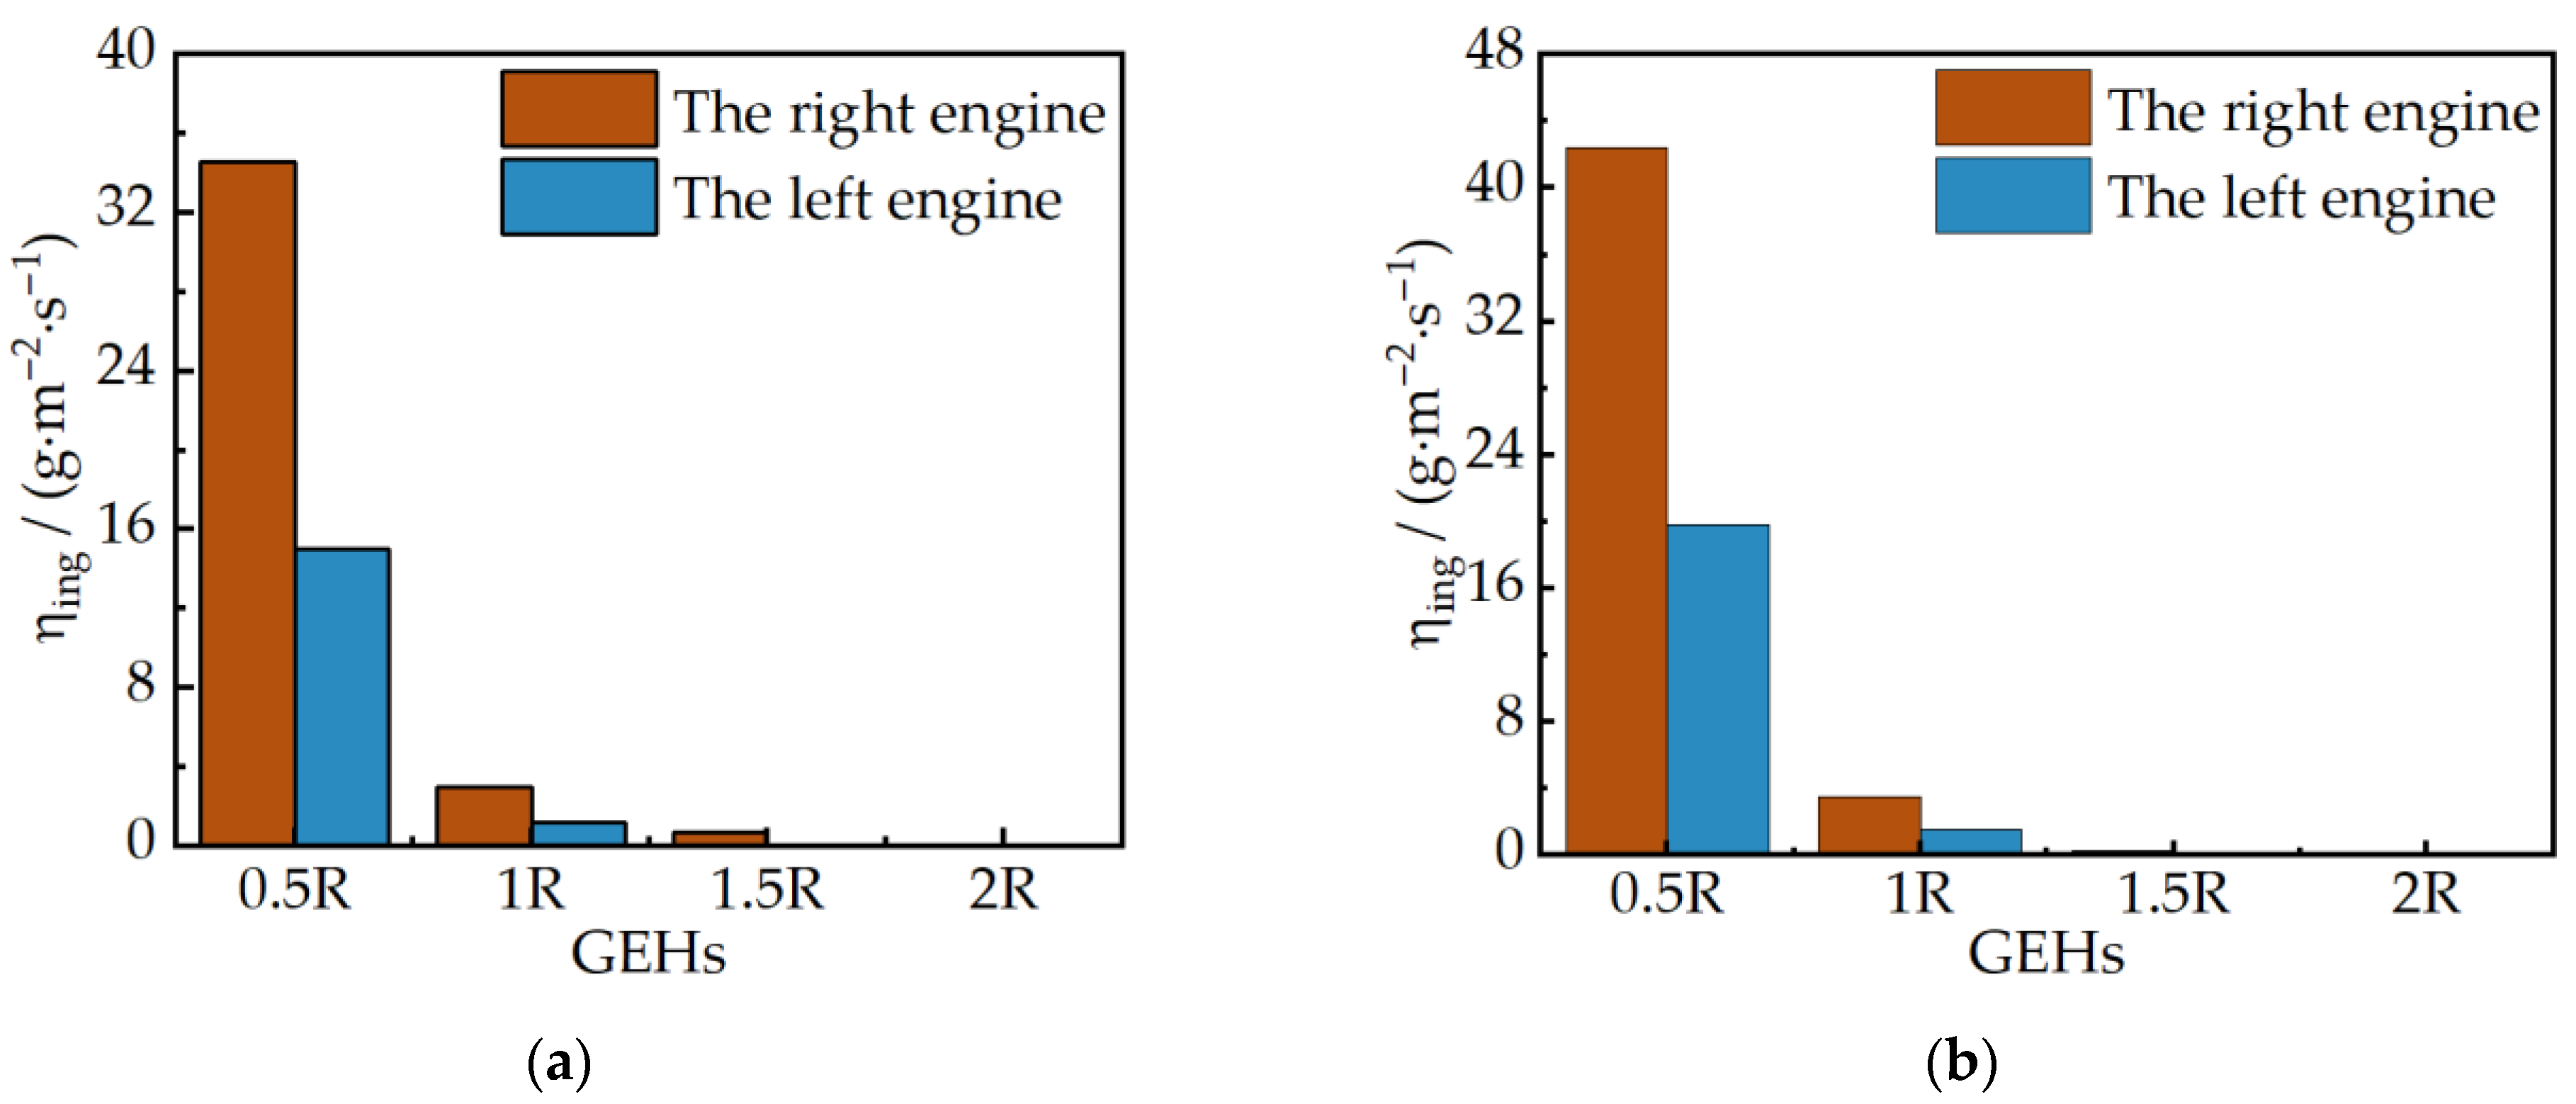
Raw experimental data are presented in Table A1, and the data were normalized using Equation (15). Figure 15 presents the variation trend of engine sand ingestion amount with GEHs and engine intake flowrates for the left and right engines. It is consistent between the left and right engines. The sand ingestion of the engines is observed to decrease nonlinearly as the GEH increases. Specifically, the sand ingestion at h = 0.5R is significantly greater than that at other GEHs, while no sand ingestion occurs in the engines when h > 2R. Combined with analysis of the previous simulation results, the larger sand ingestion amount at h = 0.5R is attributed to the direct inhalation of sand particles from the ground by the engines. When h > 2R, the height of the sand cloud is notably lower than that of the helicopter, resulting in no sand ingestion by the engine. A positive correlation is observed between engine sand ingestion and engine intake flowrate.
Figure 16 illustrates the variation trend of sand ingestion amount by the left and right engines with GEHs for different engine intake flowrates. The trend remains consistent across different engine intake flowrates. The sand ingestion of the right engine is more than twice that of the left engine. This phenomenon is attributed to the flow field asymmetry caused by the right-handed rotation of the helicopter rotor in this study.
Figure 17 illustrates the sand ingestion distribution in the inlet cross-sections of the left and right engines. A high degree of symmetry is exhibited in the distribution of sand ingestion by the two engines across each inlet section. Engine sand ingestion concentrated predominantly in three regions: R-1 (L-A), R-2 (L-B), and R-4 (L-D). As indicated by the statistics in Table 10, the proportion of sand ingestion in these three regions exceeds 60% of total sand ingestion.

5. Conclusions

Aerodynamic field analysis and sand particle motion simulations of ground-effect hovering helicopter were conducted using the CFD-DEM coupled simulation method, and helicopter engine sand ingestion experiments were carried out based on the simulation results. The following conclusions are derived:
1.
The sand ingestion amount of helicopter engines decreases nonlinearly with the increase in GEH. At lower GEHs, the direct ingestion of sand from the ground by the engine is observed, leading to a substantial increase in the sand ingestion amount.
2.
The rotational direction of the rotor exerts an influence on the sand ingestion of helicopter engines. For the right-handed rotating rotor of this study, the sand ingestion amount of the engine on the right side of the fuselage is greater than that of the engine on the left side.
3.
A positive correlation exists between helicopter engine sand ingestion amount and the engine intake flowrate.
4.
A high degree of symmetry is exhibited in the cross-sectional distribution of sand ingestion between the left and right engines. For the cross-sectional position of the engine inlet in this experiment, over 60% of the total sand ingestion is concentrated in the upper region.
Based on the research in this paper, specific guidelines are provided for helicopter engine sand prevention, which offer technical support for the design of particle separators, the preparation and distribution of standard sand for engine sand ingestion tests. Notably, the design of the air intake should possibly prevent the engine directly drawing in sand and dust particles from the ground.
Additionally, future studies can consider the dynamic similarity of dust particles and conduct further research on their particle size distribution. Regarding the asymmetrical characteristics of sand ingestion rates between the left and right air intakes, further research can be conducted on the impact of the engine air inlet direction on sand ingestion rate, so as to reduce the engine’s sand ingestion. With respect to the sand-dust concentration distribution across the air intake cross-sections, future work can focus on studying the distribution of sand-dust particles in different cross-sections of the air intake. And more scientific sand-dust particle separation can be achieved.
Author Contributions

Conceptualization, Q.L. and L.D.; methodology, L.D.; software, Q.L.; validation, Q.L., and C.S.; experimental, Q.L., and L.D.; resources, L.D.; data curation, Q.L.; writing—original draft preparation, Q.L.; writing—review and editing, L.D.; visualization, Q.L.; supervision, W.Y.; project administration, L.D.; funding acquisition, L.D. All authors have read and agreed to the published version of the manuscript.

Funding

This research was funded by National Key Laboratory of Helicopter Aeromechanics Foundation of China (2023-HA-LB-067-03), Key Laboratory of Rotor Aerodynamics Foundation (RAL202302-6) and the Natural Science Foundation of Jiangsu Province (BK20241420).

Data Availability Statement

Data are contained within the article.

Conflicts of Interest

The authors declare no conflicts of interest.

Appendix A

The data in Table A1 shows the sand ingestion mass of each zoning in the engine inlet under different GEHs and engine intake flowrate. Notably, an experimental duration of 60 s. To reduce experimental errors, the average of the sand ingestion quantities from five trials is taken.
Table A1. The sand ingestion mass (unit g) of all experiment conditions.
0.5R0.5R1R1R1.5R1.5R2R2R
370 m3/h433 m3/h370 m3/h433 m3/h370 m3/h433 m3/h370 m3/h433/h
R-17.21058.958960.811240.907120.09470.243800.00042
R-211.5372214.161560.915041.131280.088620.179900.00048
R-33.413784.441680.490560.53890.052740.1521400.00062
R-411.4379813.890.522060.90820.027080.1413800
R-51.214741.57590.243060.181320.014260.0607200.0003
R-64.871065.655380.423960.38530.005120.0084400
R-70.375520.480760.115120.072140.002920.0103400.00002
R-81.392181.697660.096140.0789200.0077600
L-A4.274065.052380.240460.3113400.001200
L-B4.719446.63060.33780.537440000
L-C2.516062.437860.21480.2430800.0027200.00072
L-D3.490565.19740.2330.389460000
L-E0.935641.075380.205240.1161800.0015400
L-F1.426642.270920.128780.12550000
L-G0.250960.46250.05930.07040000
L-H0.400940.681780.048440.050560000

References

  1. NATO Science and Technology Organization. Gas Turbine Engine Environmental Particulate Foreign Object Damage; Technical Report TRAVT-250; NATO STO: La Spezia, Italy, 2019. [Google Scholar]
  2. Liu, W.; Zhang, Y. Sand Ingestion Test and Performance Degradation Evaluation of Turboshaft Engine. J. Aerosp. Power 2023, 38, 127–133. [Google Scholar] [CrossRef]
  3. Tritschler, J. Contributions to the Characterization and Mitigation of Rotorcraft Brownout. Doctoral Dissertation, University of Maryland, College Park, MD, USA, 2012. Available online: http://hdl.handle.net/1903/13061 (accessed on 10 May 2025).
  4. Light, J.S. Tip Vortex Geometry of a Hovering Helicopter Rotor in Ground Effect. J. Am. Helicopter Soc. 1993, 38, 34–42. [Google Scholar] [CrossRef]
  5. Curtiss, H.C.; Sun, M.; Putman, W.F. Rotor Aerodynamics in Ground Effect at Low Advance Ratios. J. Am. Helicopter Soc. 1984, 29, 48–55. [Google Scholar] [CrossRef]
  6. Hu, L.; Cao, Y.; Zhao, M. Numerical Simulation of Helicopter Rotor-Fuselage-Engine Aerodynamic Interactions. J. Aerosp. Power 2008, 23, 1882–1887. [Google Scholar]
  7. Xu, W. Study of Integrated Installation Aerodynamic Characteristics of Helicopter/Turboshaft Engine. Ph.D. Thesis, Nanjing University of Aeronautics and Astronautics, Nanjing, China, 2013. [Google Scholar]
  8. Schweitzer, S. Computational Simulation of Flow Around Helicopter Fuselages. Master’s Thesis, The Pennsylvania State University, University Park, PA, USA, 1999. [Google Scholar]
  9. Tan, J.F.; Ge, Y.Y.; Zhang, W.G.; Cui, Z.; Wang, H.W. Numerical Study on Helicopter Brownout with Crosswind. Aerosp. Sci. Technol. 2022, 123, 107658. [Google Scholar] [CrossRef]
  10. Cao, Y.; Wang, G.; Jiang, C. Study on Influencing Factors of Helicopter Brownout Evolution Based on CFD-DEM. Appl. Sci. 2022, 12, 126. [Google Scholar] [CrossRef]
  11. Govindarajan, B. Contributions Toward Understanding the Effects of Rotor and Airframe Configurations on Brownout Dust Clouds. Doctoral Dissertation, University of Maryland, College Park, MD, USA, 2012. [Google Scholar] [CrossRef]
  12. Ghosh, S.; Mark, W.R.; Rajagopalan, R. Rotor Configurational Effect on Rotorcraft Brownout. In Proceedings of the 28th AIAA Applied Aerodynamics Conference, Chicago, IL, USA, 28 June–1 July 2010. [Google Scholar] [CrossRef]
  13. Syal, M. Development of A Lagrangian-Lagrangian Methodology to Predict Brownout Dust Clouds. Doctoral Dissertation, University of Maryland, College Park, MD, USA, 2012. Available online: http://hdl.handle.net/1903/13095 (accessed on 10 May 2025).
  14. Syal, M.; Govindarajan, B.; Leishman, J.G. Mesoscale Sediment Tracking Methodology to Analyze Brownout Cloud Developments. In Proceedings of the American Helicopter Society International 66th Annual Forum Proceedings, Phoenix, AZ, USA, 11–13 May 2010; Available online: https://www.researchgate.net/publication/287077930_Mesoscale_sediment_tracking_methodology_to_analyze_brownout_cloud_developments (accessed on 10 May 2025).
  15. Syal, M.; Leishman, J.G. Comparisons of Predicted Brownout Dust Clouds with Photogrammetry Measurements. In Proceedings of the American Helicopter Society International 67th Annual Forum Proceedings, Virginia Beach, VA, USA, 3–5 May 2011; Available online: https://www.researchgate.net/publication/267261445_Comparisons_of_Predicted_Brownout_Dust_Clouds_with_Photogrammetry_Measurements (accessed on 10 May 2025).
  16. Tan, J.F.; Yon, T.; He, L.; Yu, L.J.; Wang, C. Accelerated Method of Helicopter Brownout with Particle-Particle Collisions. Aerosp. Sci. Technol. 2022, 123, 107658. [Google Scholar] [CrossRef]
  17. Hu, J.; Xu, G.; Shi, Y.; Wu, L. Formation Mechanism of Brownout in Full-Scale Helicopter Based on CFD-DEM Couplings Numerical Simulation. Acta Aeronaut. Astronaut. Sin. 2020, 41, 123363. Available online: https://hkxb.buaa.edu.cn/CN/Y2020/V41/I3/123363 (accessed on 10 May 2025).
  18. Phillips, C.; Kim, H.W.; Brown, R.E. The Flow Physics of Helicopter Brownout. In Proceedings of the 66th American Helicopter Society Forum: Rising to New Heights in Vertical Lift Technology, Phoenix, AZ, USA, 11–13 May 2010. [Google Scholar]
  19. Bojdo, N.; Filippone, A.; Parkes, B.; Clarkson, R. Aircraft Engine Dust Ingestion Following Sand Storms. Aerosp. Sci. Technol. 2020, 106, 106072. [Google Scholar] [CrossRef]
  20. Simpson, H.G. Advanced Protective Coatings for U.S. Navy Engines. In Proceedings of the NADEP Cherry Point Briefing to Thin Films 2000 Conference, San Diego, CA, USA, 11 April 2000. [Google Scholar]
  21. Cowherd, C. Sandblaster 2 Support of See-Through Technologies for Particulate Brownout; Technical Report 110565; Midwest Research Institute: Kansas City, MO, USA, 2007; Available online: https://www.researchgate.net/publication/235132878_Sandblaster_2_Support_of_See-Through_Technologies_for_Particulate_Brownout (accessed on 10 May 2025).
  22. Padture, N.P. Environmental Degradation of High-temperature Protective Coatings for Ceramic-matrix Composites in Gas-turbine Engines. npj Mater. Degrad. 2019, 3, 11. [Google Scholar] [CrossRef]
  23. Wang, Q.; Zhang, W.; Yuan, X.; Wang, Y.; Shen, Z.; Wang, F. Research on the Impact of the Sand and Dust Ingestion Test on the Overall Performance of Turboshaft Engines. Aerospace 2025, 12, 146. [Google Scholar] [CrossRef]
  24. Vulpio, A.; Suman, A.; Casari, N.; Pinelli, M. Dust Ingestion in a Rotorcraft Engine Compressor: Experimental and Numerical Study of the Fouling Rate. Aerospace 2021, 8, 81. [Google Scholar] [CrossRef]
  25. Przedpelski, Z.J. The T700-GE-700 Engine Experience in Sand Environment. J. Am. Helicopter Soc. 1984, 29, 63–69. [Google Scholar] [CrossRef]
  26. Du, Z.; Ma, Y.; Xu, Q.; Wu, F. Sand Discharge Simulation and Flow Path Optimization of a Particle Separator. Entropy 2023, 25, 147. [Google Scholar] [CrossRef]
  27. Wei, K.K.; Gao, X.P. Resistance Prediction of 5415 Ship Model Based on STAR-CCM+. J. Ordnance Equip. Eng. 2016, 37, 157–161. [Google Scholar]
  28. Du, J. Simulation of Dilute Pneumatic Conveying by CFD-DEM. Ph.D. Thesis, Wuhan University, Wuhan, China, 2015; pp. 20–21. [Google Scholar]
  29. Yu, H.; Cheng, W.; Wu, L.; Wang, H.; Xie, Y. Mechanisms of Dust Diffuse Pollution under Forced-exhaust Ventilation in Fully-mechanized Excavation Faces by CFD-DEM. Powder Technol. 2017, 317, 31–47. [Google Scholar] [CrossRef]
  30. Han, D.; Hu, J.; Liu, H.; Ren, L.; Zhou, M.; Yang, Q.; Li, B.; Chen, X. Parameter Calibration and Experiment of the Discrete Element Contact Model of Water-Containing Sandy Soil Particles. Trans. Chin. Soc. Agric. Eng. (Trans. CSAE) 2025, 41, 70–78. [Google Scholar] [CrossRef]
  31. Fan, L.S.; Zhu, C. Principles of Gas-Solid Flows; Cambridge University Press: Cambridge, UK, 1999; pp. 164–205. [Google Scholar] [CrossRef]
  32. Norouzi, H.R.; Zarghami, R.; Sotudeh-Gharebagh, R. Coupled CFD-DEM Modeling Formulation, Implementation and Application to Multiphase Flows; John Wiley & Sons, Ltd.: Chichester, UK, 2016; pp. 256–265. [Google Scholar] [CrossRef]
  33. Caradonna, F.X.; Tung, C. Experimental and Analytical Studies of a Model Helicopter Rotor in Hover. In Proceedings of the European Rotorcraft and Powered Lift Aircraft Forum, Bristol, UK, 16–19 September 1980. [Google Scholar]
  34. Dilimulati, A.; Stathopoulos, T.; Paraschivoiu, M. Wind turbine designs for urban applications: A case study of shrouded diffuser casing for turbines. J. Wind. Eng. Ind. Aerodyn. 2018, 175, 179–192. [Google Scholar] [CrossRef]
  35. Saeed, F.; Al-Garni, A.Z. An Inverse Design Method for Aircraft Engine Sand Separator System. In Proceedings of the 28th European Rotorcraft Forum, Amsterdam, The Netherlands, 4–7 September 2012; Available online: https://dspace-erf.nlr.nl/server/api/core/bitstreams/10715c38-bab7-4bf9-8d44-7838f7200545/content (accessed on 10 May 2025).
  36. Collins, P.; Moore, C. Solutions to Helicopter Blade Erosion Improving Aircraft Availability and Reducing Costs. In Proceedings of the 40th European Rotorcraft Forum, Southampton, UK, 2–5 September 2014; Available online: https://www.researchgate.net/publication/289631233_Solutions_to_helicopter_blade_erosion_improving_aircraft_availability_and_reducing_costs (accessed on 10 May 2025).
Figure 1. Process of data transferring between flow field and discrete phase through API [32].
Aerospace 12 00927 g001
Figure 2. Comparison between pressure coefficients on blade surface in this study and experimental values in the literature: (a) 0.5R spanwise position; (b) 0.68R spanwise position; (c) 0.8R spanwise position; (d) 0.96R spanwise position.
Aerospace 12 00927 g002
Figure 3. Comparison of measured and predicted tip vortex in ground effect ( C T / σ = 0.090 , h / R = 0.52 ): (a) radial location; (b) axial location.
Aerospace 12 00927 g003
Figure 4. The helicopter configuration.
Aerospace 12 00927 g004
Figure 5. The mesh processing configuration: (a) general mesh; (b) mesh of the helicopter.
Aerospace 12 00927 g005
Figure 6. Sand particles at initial time.
Aerospace 12 00927 g006
Figure 7. Q-criterion vorticity contour colormap: (a) h = 0.5R; (b) h = 1R; (c) h = 2R.
Aerospace 12 00927 g007
Figure 8. Engine inlet and outlet streamlines: (a) h = 0.5R; (b) h = 1R; (c) h = 2R.
Aerospace 12 00927 g008
Figure 9. Macroscopic image of sand at h = 0.5R: (a) Top view; (b) Side view.
Aerospace 12 00927 g009
Figure 10. Macroscopic image of sand at h = 1R: (a) top view; (b) side view.
Aerospace 12 00927 g010
Figure 11. Macroscopic image of sand at h = 2R: (a) top view; (b) side view.
Aerospace 12 00927 g011
Figure 12. Experiment setup: (a) helicopter; (b) experimental platform.
Aerospace 12 00927 g012
Figure 13. Partition numberings of engine inlet ducts.
Aerospace 12 00927 g013
Figure 14. Experimental procedure for sand ingestion by helicopter engines during ground-effect hovering.
Aerospace 12 00927 g014
Figure 15. Normalized sand ingestion mass at different GEHs: (a) the case of the right engine inlet; (b) the case of the left engine inlet.
Aerospace 12 00927 g015
Figure 16. Normalized sand ingestion mass at different GEHs: (a) the engine intake flowrate of 370 m3/h; (b) the engine intake flowrate of 433 m3/h.
Aerospace 12 00927 g016
Figure 17. Normalized sand ingestion mass in different air inlet zones: (a) the right engine; (b) the left engine.
Aerospace 12 00927 g017
Table 1. Parameters of the C-T rotor.
ParametersValues
AirfoilNACA0012
Operating   speed   Ω / ( r / min ) 1500
Rotor   radius   R / m 1.43
Chord   length   c / m 0.1905
Pitch   angle   θ c   ( ° ) 8
Table 2. Computational parameters of the C-T rotor.
ParametersValues
Y+ ranges on blades8~30
Time step/(s) 1.11 × 10 5
Time discretizationSecond-order implicit
Inner iterations per step15
Table 3. Grid independence study.
Domain NameNo of ElementsThrustError %
Domain 018,396,4171474--
Domain 028,821,30814981.63
Domain 039,605,01715171.27
Domain 0410,497,32315180.07
Table 4. Error analysis of the C-T rotor computation.
Spanwise PositionMean Absolute ErrorRoot Mean Square Error
0.5R0.0180.00039
0.68R0.0170.000095
0.8R0.0210.00072
0.96R0.0290.0011
Table 5. Basic parameters of the helicopter.
ParametersValues
Number   of   Blades   N b 5
Operating   Speed   Ω /(rpm) 1675
Rotor   Radius   R / m 1.26
Blade   Chord   c / m 0.081
Pre - twisted   Angle   θ 1 / ( ° ) −13
Blade   Precone   β p / ( ° ) 4
Lift   Coefficient   C L ( T / 0.5 ρ v 2 π R 2 )0.0124
Engine   Inlet   Area   A i n / m 2 0.02
Engine   Outlet   Area   A o u t / m 2 0.04
Engine   Intake   Flowrate   Q / ( Kg / h ) 452
Table 6. Physical parameters in EDEM.
ParametersSand Particlesphysical Surfaces
Density / ( Kg / m 3 )14002700
Poisson’s Ratio0.50.3
Shear   Modulus / Pa 1 × 10 8 7 × 10 10
Restitution Coefficient0.50.5
Static Friction Coefficient0.40.4
Rolling Friction Coefficient0.050.05
Surface Energy/(J/m2)0.030.075
Table 7. Parameters of the simulation.
ParametersValues
Cells Number in CCM+14,103,802
Cells Number in EDEM6,431,682
Time Step in CCM+1 × 10⁻⁵ s
Maximum Inner Iterations15
Rayleigh Time Step2 × 10−7 s
Fixed Time Step in EDEM8 × 10−8 s
Table 8. Engine sand ingestion statistics.
Sand Particle Size0.5R1R2R
10 μm--
50 μm----
100 μm------
500 μm------
Table 9. Experimental conditions.
GEHs/m Engine   Intake   Flowrate / ( m 3 / h )
0.5R370
0.5R433
1R370
1R433
1.5R370
1.5R433
2R370
2R433
Table 10. Zoned normalized sand ingestion ( η i n g ) rate of the air intake.
Experimental
Conditions
Ratio of Sand Ingestion in Area R-1 R-2 R-4Ratio of Sand Ingestion in Area L-A L-B L-D
0.5R, 370 m3/h69.3%72.8%
0.5R, 433 m3/h70.8%72.7%
1R, 370 m3/h55.3%62.1%
1R, 433 m3/h67.2%70.1%
Disclaimer/Publisher’s Note: The statements, opinions and data contained in all publications are solely those of the individual author(s) and contributor(s) and not of MDPI and/or the editor(s). MDPI and/or the editor(s) disclaim responsibility for any injury to people or property resulting from any ideas, methods, instructions or products referred to in the content.