Article

Experimental Validation of a Working Fluid Versatile Supersonic Turbine for Micro Launchers

by
Cleopatra Florentina Cuciumita
*,
Valeriu Alexandru Vilag
,
Cosmin Petru Suciu
and
Emilia Georgiana Prisăcariu
The Romanian Research and Development Institute for Gas Turbines COMOTI, 061126 Bucharest, Romania
*
Author to whom correspondence should be addressed.
Aerospace 2025, 12(10), 887; https://doi.org/10.3390/aerospace12100887
Submission received: 31 July 2025 / Revised: 24 September 2025 / Accepted: 29 September 2025 / Published: 30 September 2025
(This article belongs to the Section Astronautics & Space Science)

Abstract

The growing demand for micro-launchers capable of placing payloads between 1 and 100 kg into low Earth orbit stems from rapid advances in electronics and the resulting increase in nanosatellite capabilities. Simultaneously, space programs are prioritizing the use of alternative propellants, those that are more sustainable, cost-effective, and readily available. As a result, modern launcher development emphasizes versatility, reliability, reusability, and adaptability to various working fluids. This paper presents the experimental validation of a supersonic turbine design methodology tailored for such adaptable systems. The focus is on a turbine class intended for a turbopump in micro-launchers with payload capacities around 100 kg. The experimental campaign employed two working fluids (air and methane) to assess the method’s robustness. The validation was performed on a stator only planar model, and the experimental data was compared with the analytical result obtained through the Mach number similarity criterion. The results confirm that the approach accurately identifies flow similarity through Mach number matching, even when the working fluid changes. Comparative analysis between experimental data and predictions demonstrates the method’s reliability, with measurement uncertainties also addressed. These findings support the methodology’s applicability in practical engine design and adaptation. Future work will explore enhancements to improve predictive capability and flexibility. The method may be extended to other systems where fluid substitution offers design or operational advantages.

1. Introduction

Space propulsion strategies are currently undergoing a significant transformation. Unlike in the past, where overcoming technical challenges was the primary objective, today’s focus increasingly incorporates societal and economic pressures driving the shift toward more sustainable solutions. Reusable launchers, once a distant ambition, have now garnered serious interest from both governmental programs and private enterprises. Another key direction in space programs is the pursuit of alternative propellants, those that are more environmentally friendly, cost-effective, and widely accessible. The overarching goal is to develop more reliable and versatile launchers, capable of multiple uses and adaptable to various working fluids. These aims are clearly outlined in the European Space Agency’s Future Launchers Preparatory Programme (FLPP) [1]. Nevertheless, launchers are highly complex systems, with decades of development needed to reach flight-ready technology readiness levels. Thus, transitioning to greener propellants ideally requires minimal system redesign. Simultaneously, technological advancements in electronics have driven demand for micro launchers, capable of delivering 1–100 kg payloads into Low Earth Orbit (LEO). Over 2500 nano- and microsatellites were projected for launch between 2018 and 2023 [2]. That same year, two 13.5 kg Mars Cube One satellites completed a Mars flyby, marking the first use of CubeSats in interplanetary space [3]. In response, several micro launchers are already operational, with many more in development. Notably, JAXA’s SS-520 launched a 4 kg payload to LEO, making it one of the smallest launchers to achieve orbital success [4]. A detailed inventory of small launch vehicles, both existing and emerging, is provided in [5] and updated in [6]. Despite the global pandemic, this sector continued to evolve, with numerous propulsion systems progressing in maturity. A comparative assessment of small launcher developments between 2018 and 2020 is presented in [7]. Analyzing launcher concepts under 100 kg payload capacity reveals diverse design approaches, including variations in propellant types (liquid, solid, hybrid), launch platforms (ground-based, air-launched), and propulsion mechanisms (traditional turbopumps, electric pumps).
Selecting a rocket propulsion system for a high-cost, multi-year program requires substantial effort in performance evaluation and the development of rational, quantitative comparison methods. Multiple analyses are conducted to assess critical criteria aligned with mission requirements, which directly inform propulsion system specifications.
For instance, solid propellants are typically chosen for tactical and ballistic missiles due to their readiness, compactness, and minimal handling risks. In contrast, liquid propellants dominate space applications, main propulsion stages, upper stages, and attitude control systems, thanks to their higher specific impulse, cleaner exhaust, compatibility with green fuels like hydrogen or methane, and precise thrust control through multiple pulses [8].
A key subsystem in liquid propulsion is the turbopump, responsible for delivering propellants to the combustion chamber under high pressure. While electric pumps are emerging, traditional turbopumps remain the standard. These systems, though sharing features with gas turbine machinery, must be lighter and achieve higher specific work. Consequently, rocket turbopumps often incorporate supersonic turbines, which, despite their high specific load, suffer from efficiency losses due to shockwave-induced flow disturbances at the stator exit [9].
Supersonic turbine interest has re-emerged with novel launcher architectures and innovative gas turbine cycles, such as detonation-based systems [10]. Historically explored for high-pressure steam applications, their potential in rocket propulsion became evident decades ago [11], though public access data later became limited. More recent research focuses on shape optimization [12], partial admission [13], and adjoint-based methods for improving stator vane performance under off-design conditions [14].
Despite this, advancements remain scarce, particularly for micro-scale applications. Compact supersonic turbines remain challenging for their design, manufacturing, and instrumentation. The studies showed that the main disadvantages of supersonic turbines are the high losses associated with supersonic flow and caused by the shock wave phenomenon. These losses are significant in value and can reach up to 30% when a normal shock wave exists [15].
As micro-launcher development progresses, requirements for reliability and adaptability also extend to turbine components. A critical step toward increased adaptability is the ability to change working fluids, reflecting fuel changes, without redesigning the entire system. This necessitates methods that can rapidly and accurately predict turbine performance for alternative fluids based on nominal operating data.
Recent research has increasingly focused on the aerodynamic and thermodynamic challenges of supersonic turbines operating with unconventional working fluids, particularly in Organic Rankine Cycle (ORC) and supercritical CO2 systems.
Mach similarity (sometimes called Mach number similarity or Mach scaling) is a scaling principle used in turbomachinery and fluid dynamics. The idea is that if two geometrically similar machines (e.g., turbines, compressors, pumps, fans) operate at the same Mach number distribution (local velocity/speed of sound ratio) and Reynolds number is sufficiently high, their aerodynamic performance will be similar, even if the working fluids or sizes differ. This principle is widely applied in design, testing, and scaling of turbomachinery, especially when direct experimentation with the real machine or fluid is impractical.
Mach similarity is most actively applied in ORC turbines and sCO2 turbines, but also widely used in aerospace, cryogenic pumps, refrigeration compressors, and scaled aerodynamic testing. Its main advantage is enabling the use of air test rigs to replicate the aerodynamics of machines designed for exotic, hazardous, or expensive fluids. However, it has important limitations, mainly due to Reynolds number mismatch and non-ideal gas effects. Engineers typically combine it with empirical corrections and CFD to ensure reliable performance predictions.
Traditional similarity laws have been shown to lose predictive accuracy when gas properties such as specific heat ratio deviate significantly. Guardone and colleagues have emphasized the role of non-ideal compressible fluid dynamics in turbomachinery [16]. Conti et al. [17] proposed similarity parameters for non-ideal one-dimensional isentropic expansions and showed how the critical pressure ratio in sonic conditions strongly depends on the thermodynamic nonideality of the fluid. Experimental work in linear cascades has provided rare but valuable benchmarks: Conti et al. [18] quantified shock-related losses in organic vapors, and Tosto et al. [19] showed that thermodynamic nonideality of the fluid can affect machine operability, namely critical choking can occur in turbines. Complementing these efforts, high-fidelity simulations (LES and DDES) have examined shock–boundary layer interactions and trailing-edge losses in supersonic blades [20] while data-driven surrogates have begun to accelerate multi-row cascade performance predictions [21]. Despite this progress, most available methods remain tuned to specific fluids or geometries, and open cross-fluid datasets are scarce. Consequently, there remains a research gap in developing rapid, property-aware predictive frameworks capable of transforming existing turbine performance maps when the working fluid is changed, without resorting to full computational or experimental campaigns.
Moreover, Mach similarity assumes that matching Mach numbers is sufficient to achieve aerodynamic similarity. However, the Reynolds number (Re) also governs boundary layer behavior, including transition, separation, and losses. This issue is particularly significant for miniature turbines, where viscous losses dominate. When the turbomachine is very small, surface-to-volume effects such as tip clearances, leakage, and friction become dominant. Small-scale machines are also more sensitive to surface roughness, since boundary layers are thin at high Re but considerably thicker at low Re with other fluids. Consequently, scaling from air tests means that losses, stall margins, and efficiency do not scale perfectly. For these reasons, true full similarity (Re + Mach + geometry) is rarely achievable outside carefully chosen scales, and the extent to which Mach similarity can be achieved at very small scales remains an open question.
The primary objective of this study is the development and experimental validation of a methodology for the rapid prediction of supersonic micro turbine performance under varying working fluid. This paper presents the initial stage of validation: the experimental assessment of a Mach-similarity-based approach for predicting turbine performance across different working fluids, using stator-only experiments.
The case study concerns a supersonic turbine intended for a micro-launcher with a 100 kg payload capacity. Tests were carried out with two working fluids, air and methane, to evaluate the accuracy of the proposed method in estimating performance across fluids at a very small scale. Unlike existing applications of Mach similarity (e.g., in ORC and CO2 turbines), this study focuses on comparing flow similarity within a supersonic turbine vane using air and methane, rather than air and a traditional ORC organic fluid. While an organic fluid, methane’s performance is often contrasted with other hydrocarbons like n-hexane, n-pentane, and cyclopentane, which are frequently chosen based on their thermal stability and performance characteristics for specific ORC applications.
The unique contribution of this work lies in the experimental validation of Mach similarity for the stator of a very small turbine—where full similarity is rarely achievable—using methane as the working fluid. Methane is particularly relevant for green micro-launchers and, in this context, provides the additional benefit of operating at higher Reynolds numbers compared to air.
Beyond validation, the approach shows promise for evaluating new turbine designs under varying working conditions or for enabling multi-fluid optimization without high computational costs.

2. Turbine Design

2.1. Design Point

The turbine design point is defined for a micro-launcher application targeting a payload capacity of approximately 100 kg. Inlet flow parameters were estimated by downscaling data from turbines used in larger launchers, based on open-source literature sources, as summarized in Table 1.

2.2. Design Methodology

The intended application of the turbine defines its performance requirements—such as power output, flow regime, and working fluid—as listed in Table 1. These parameters serve as input data for the design process.
Initial performance estimates are derived from literature and prior experience. Using these estimates, a preliminary design is conducted based on analytical formulations [22] to determine velocity triangles and flow cross-sectional areas. This process is implemented in an in-house code developed to streamline and expedite the preliminary design phase.
One of the main challenges of a turbine driving the pump of a micro launcher is the size. Particular attention is required to address geometrical constraints imposed by the reduced scale of the micro-launcher application, ensuring that the design remains manufacturable. To overcome this challenge, the design algorithm enforces minimum blade thickness, a minimum spacing between adjacent blades in critical regions, and a minimum blade height. It is worth noting that the minimum spacing between adjacent stator blades is only 3 mm for this design, while the stator blades thickness is 2 mm. The design of the stator and rotor blades geometry is depicted in Figure 1a,b. The dimensions given are in millimeters.
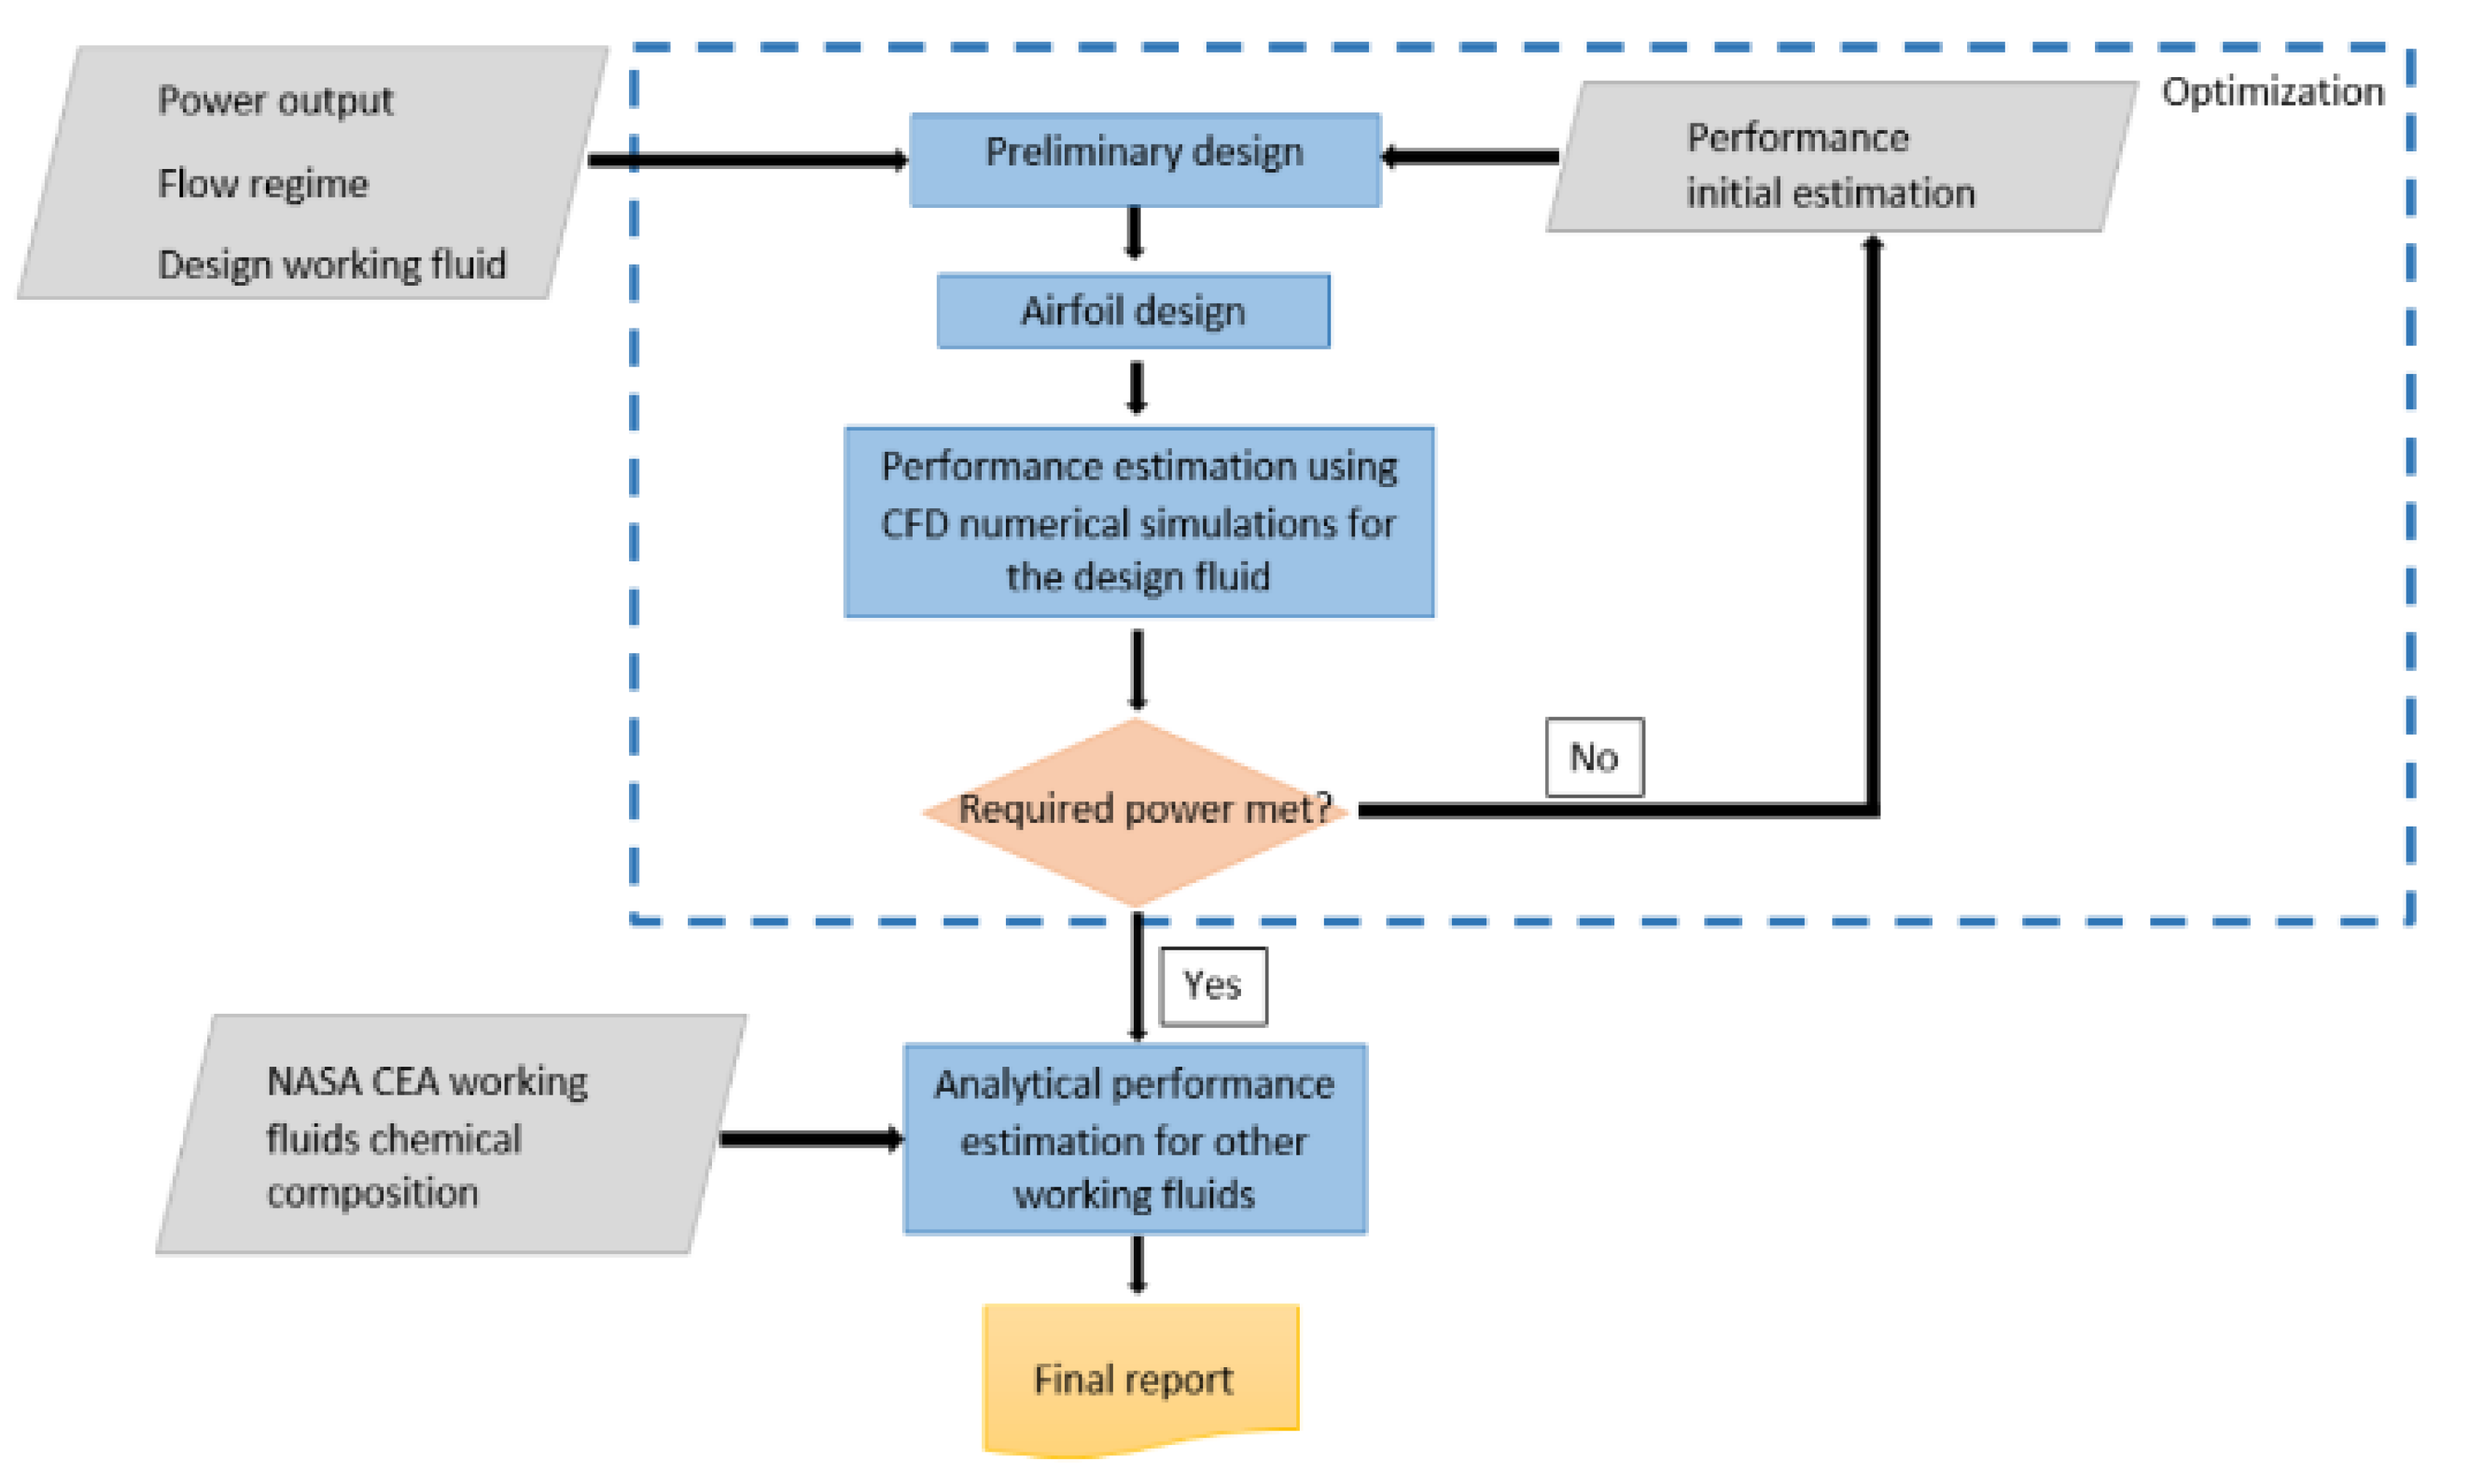
Due to the small size of the blades, aerodynamic stacking is simplified by extruding the mid-span airfoil along the radial direction. This approach neglects radial geometric variations and does not involve a through-flow calculation. Following the preliminary design, the airfoil shape is developed to define the mid-span profile and complete the turbine geometry. This step can be carried out in any CAD software, allowing some design freedom, provided the geometric constraints and computed flow parameters are respected. A method for constructing simple airfoils using line segments and circular arcs is described in [23]. Once the turbine geometry is defined, its performance with the nominal working fluid is evaluated using CFD (Computational Fluid Dynamics) simulations or experimental testing. If the power output meets the target within acceptable margins, the method proceeds to assess performance with alternative working fluids. Otherwise, the design loop is repeated, using the CFD-derived efficiency as the new baseline for the preliminary design. Figure 2 presents a detailed workflow of the methodology. Additional design considerations, geometric outputs, and nominal performance evaluations are discussed in [23,24].

2.3. Performance Estimation of Other Working Fluids

While [24] addresses the turbine’s performance at the design point using air as the working fluid, it does not explore how performance would be affected by a change in working fluid. Once the turbine achieves acceptable performance with the nominal fluid, the methodology advances to evaluate its behavior with alternative fluids, aligned with application-specific requirements. This evaluation is performed using an analytical method demonstrated in the following section. The method relies on the chemical composition of the candidate fluids, on the power output obtained for the design fluid via CFD as input data and on the Mach similarity criterion. The Mach number similarity criterion accounts for all Mach-related invariants, allowing the power output for a new working fluid to be estimated by modifying only its specific gas constant and heat capacity ratio. This enables the performance for the alternative fluid to be expressed as a function of the known performance and thermodynamic properties of the design fluid.
In order for two flows to be similar according to this criterion, all three Mach numbers (absolute, relative, and transport) must be similarity invariants.
M c = c t . M w = c t . M u = c t .
Using these invariants, the similarity parameters for the speed, the mass flow rate, and the power are obtained. By definition, the Mach number for the transport velocity is:
M u = U a = c t .
where a represents the speed of sound. At mean diameter, D, the transport velocity depends on the rotational speed, N, as follows:
U = π D N 60
The speed of sound is a function of the fluid isentropic expansion factor, also known as the heat capacity ratio, k, specific gas constant Rsp and static temperature, T. Using the isentropic flow equations, the static temperature can further be expressed as a function of total temperature, T and absolute Mach number, Mc, thus resulting:
a = k R s p T =   k R s p T 1 + k 1 2 M c 2 .
Combining Equations (2)–(4) results in:
M u = π D N 60 1 + k 1 2 M c 2 k R s p T = c t .
Accounting for the fact that the geometry of the turbine does not change, thus the mean dimeter not changing, the first similarity parameter is obtained:
N 2 · 1 + k 1 2 M c 2 k R s p T = c t .
Based on this equation, noting by a the baseline working fluid for the turbine, and by 2 a different fluid, for a turbine with the same geometry, according to the Mach similarity criterion, it can be concluded that:
N a 2 1 + k a 1 2 M c 2 k a R s p , a T a =   N b 2 1 + k b 1 2 M c 2 k b R s p , b T b
By selecting a value for the rotational speed of the turbine working with the new fluid, b, the equivalent total temperature at the inlet of the turbine can be computed:
T b =   T a N b N a 2 k a R s p , a k b R s p , b 1 + k b 1 2 M c 2 1 + k a 1 2 M c 2
For the mass flow rate similarity parameter, the continuity equation is applied also at the turbine inlet section:
M ˙ g =   A · p T · k R s p M c 1 + k 1 2 M c 2 k + 1 2 ( k 1 )
For the same turbine geometry, the area A will be constant. Under the Mach similarity criterion, the Mach number of the absolute velocity at the turbine inlet will also be invariant. This leads to the formula of the reduced mass flow rate:
M ˙ g · T p · R s p k 1 + k 1 2 M c 2 k + 1 2 k 1 = A · M c = c t .   =   M ˙ g , r e d
Applying Equation (10) for the nominal fluid, a, and the new fluid, b, it follows that:
M ˙ g , a · T a p a · R s p , a k a 1 + k a 1 2 M c 2 k a + 1 2 k a 1 = = M ˙ g , b · T b p b · R s p , b k b 1 + k b 1 2 M c 2 k b + 1 2 k b 1 = c t .
Having previously computed the equivalent turbine inlet total temperature for the new fluid, b, based on the properties of the turbine working on the nominal fluid, a, using Equation (8), the total equivalent pressure at the inlet of the turbine on fluid b can now also be computed by selecting a value for the mass flow rate through the turbine with the new fluid, b:
p b =   p a M ˙ g , b M ˙ g , a k a R s p , b T b k b R s p , a T a 1 + k b 1 2 M c 2 k b + 1 2 k b 1 1 + k a 1 2 M c 2 k a + 1 2 k a 1 .    
For the third similarity parameter, the total enthalpy variation across the rotor is used in order to determine the equivalent power output of the turbine when switching from fluid a to fluid b. Thus, if section i represents the rotor inlet and, respectively, section o represents the rotor outlet, then:
P =   M ˙ g · h = M ˙ g U C u , i C u , o = M ˙ g M U M C u , i M C u , o a 2 .    
where M C u , i is the Mach number of the tangential component of the absolute velocity. Since the Mach numbers are constant under the Mach similarity criterion, it follows that:
P M ˙ g a 2 =   c t .   = P M ˙ g k R s p T = P 1 + k 1 2 M c 2 M ˙ g k R s p T .    
Hence, the equivalent turbine power can be written as:
P b =   P a M g b ˙ M g a k b R s p , b T b k a R s p , a T a 1 + k a 1 2 M c 2 1 + k b 1 2 M c 2
The resulting fast analytical method, based on this criterion, provides a straightforward way to estimate turbine performance for different working fluids and can be readily implemented in any programming language using Equations (8), (12) and (15).

2.4. Equivalent Design Point

As detailed in the following section, experimental measurements were performed using two working fluids: air and methane. However, due to constraints in the experimental setup, such as ambient temperature conditions, the nominal operating regime specified in Table 1 could not be directly replicated. To address this, an equivalent operating regime was calculated for both fluids using the Mach number similarity criterion, taking into account the maximum available inlet total pressure. The equivalent flow parameters were recalculated for a fixed inlet temperature of 300 K and a prescribed total inlet pressure, as shown in Table 2. The corresponding equivalent mass flow rate, defined through Equation (10), was determined to ensure the operating conditions satisfy Equation (16). It is important to note that, for this application, the nominal regime is characterized by a reduced mass flow rate of 9 × 10⁻⁵ and an inlet Mach number (absolute velocity) of 0.058.
M ˙ g , r e d = 9.00 · 10 5 = c t . = M ˙ g a p a k a R s p ,   a T a 1 + k a 1 2 M c 2 k a + 1 2 k a 1 = = M ˙ g b p b k b R s p , b T b 1 + k b 1 2 M c 2 k b + 1 2 k b 1
The results of these calculations are summarized in Table 2, which presents the equivalent nominal flow parameters for both air and methane. The mass flow rate was determined based on four stator flow passages, matching the configuration of the experimental model, in contrast to the full stator ring used in the original design, to allow for direct comparison with the experimental data.

3. Experimental Setup

An experimental campaign was carried out to validate the turbine performance estimation methodology for micro-launcher applications using different working fluids. The experimental model is tailored for a micro-launcher with a 100 kg payload capacity. To simplify the construction of the experimental model and test rig, the following assumptions were applied: a planar (2D) experimental configuration was used, the rotor blade row was omitted (non-rotating setup), measurements focused exclusively on the stator row, where shock-induced losses are most prominent, all tests were conducted at ambient temperature, two working fluids were investigated: air and methane.

3.1. Experimental Model

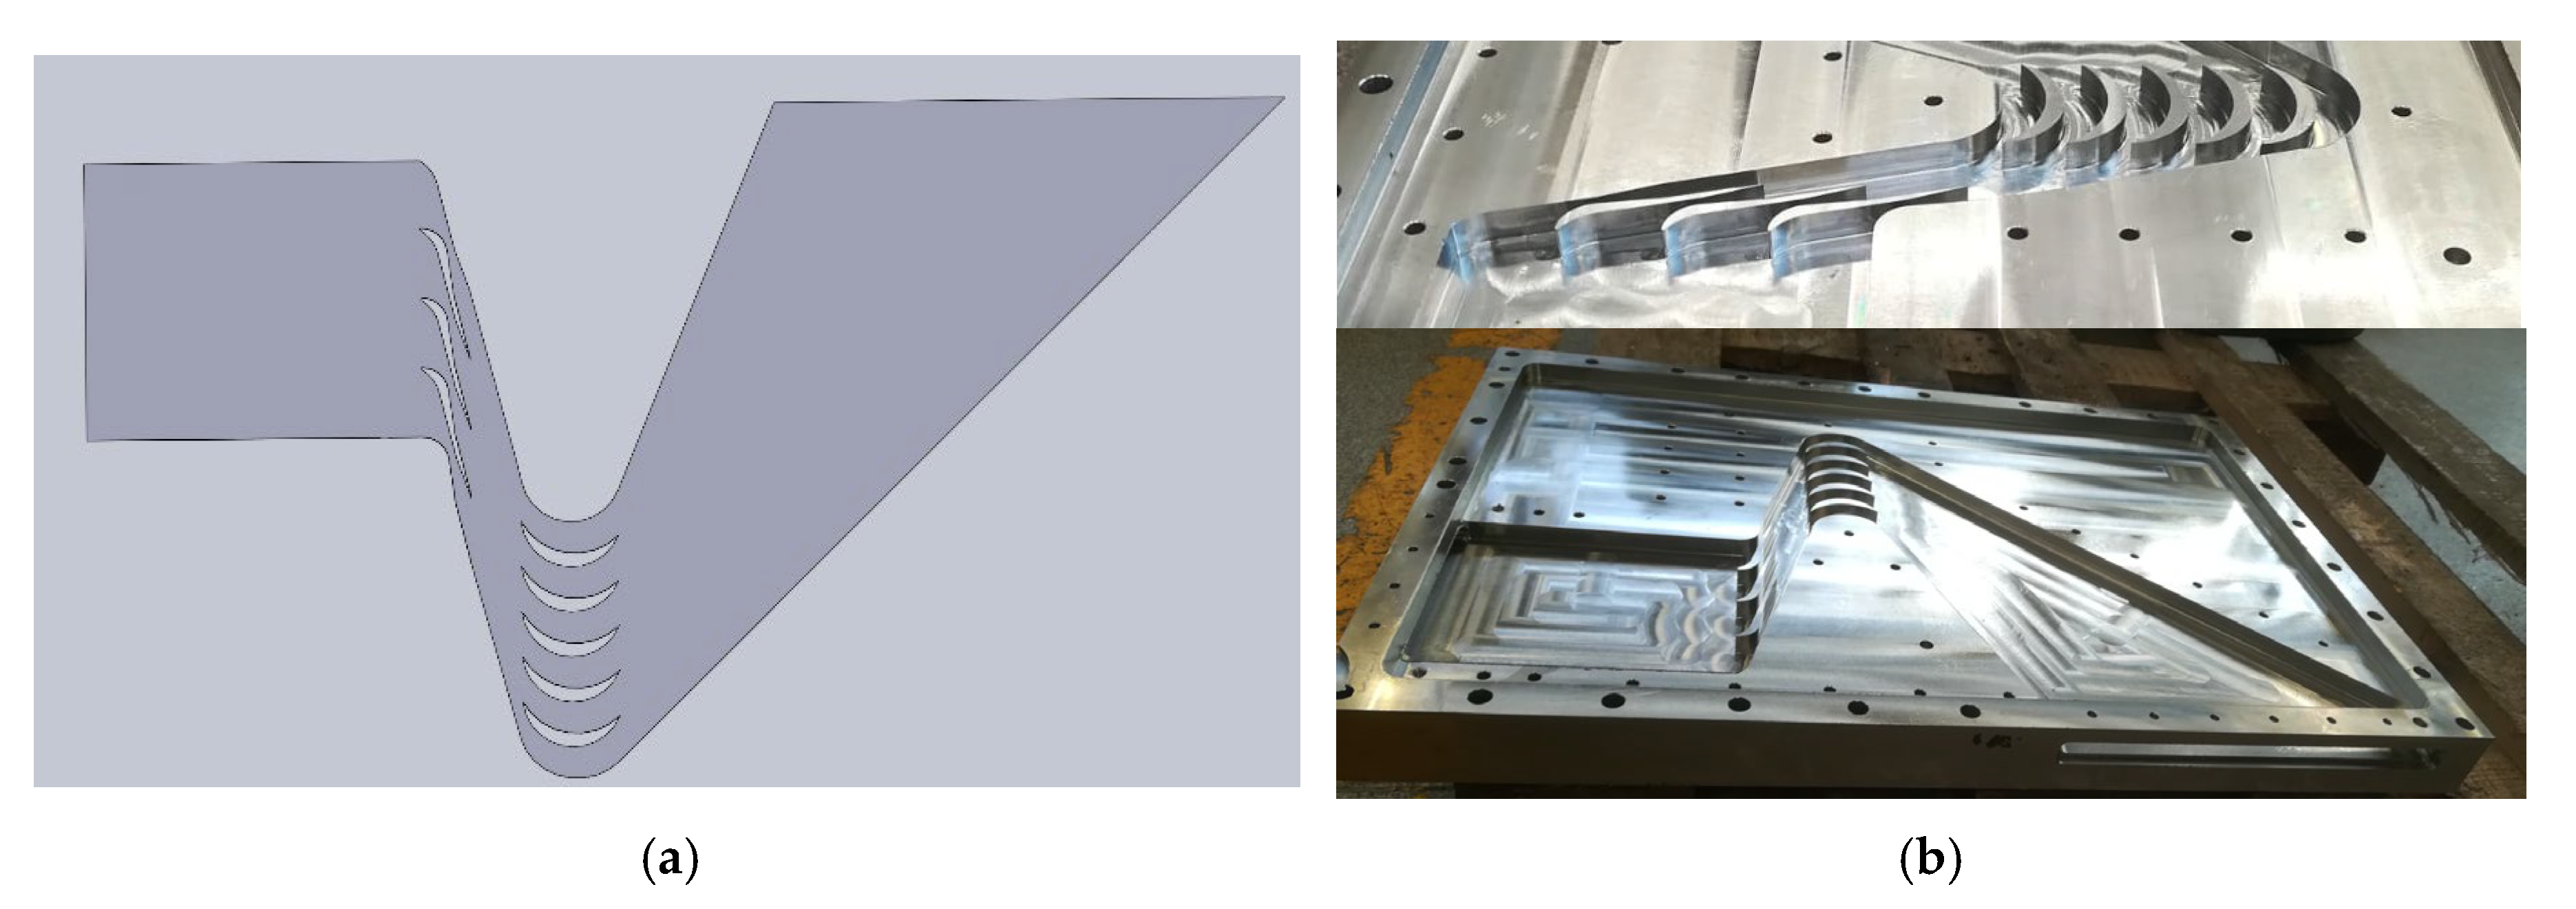
The test assembly was designed with consideration for the nominal operating regime, the simplifications outlined previously, and the need to measure static pressure distribution along the stator channel. Given the compact size of the experimental model, the integration of instrumentation for detailed flow measurements within the stator row—essential for validating turbine performance, which was addressed early in the design phase. Additional details regarding the instrumentation setup are provided in Section 3.2. The first step involved defining the geometry of the planar flow domain. This domain features an axial inlet and a tangential outlet, allowing the flow to expand freely (see Figure 3a). Four stator blade channels, along with a corresponding number of rotor blades, were selected for investigation. The domain height was set to match the original blade height from the turbine design, of 10 mm. The walls adjacent to the stator and rotor were shaped to replicate the pressure and suction sides of the respective blades. Due to the small scale of the stator blades, they were directly machined into the flow domain. The finalized experimental model is illustrated in Figure 3b.

3.2. Instrumentation

To characterize the flow through the turbine stator, the following flow parameters were measured:
-
Inlet flow conditions: total pressure, total temperature, and mass flow rate
-
Wall pressure distribution along the stator vane’s Laval nozzle, where the most significant pressure variation is expected
-
Outlet total pressure downstream of the stator, used to quantify total pressure losses across the stator
-
Wall pressure measurements were carried out in the two inner stator flow channels of the experimental model, as only these two of the four total channels had external walls to support instrumentation.
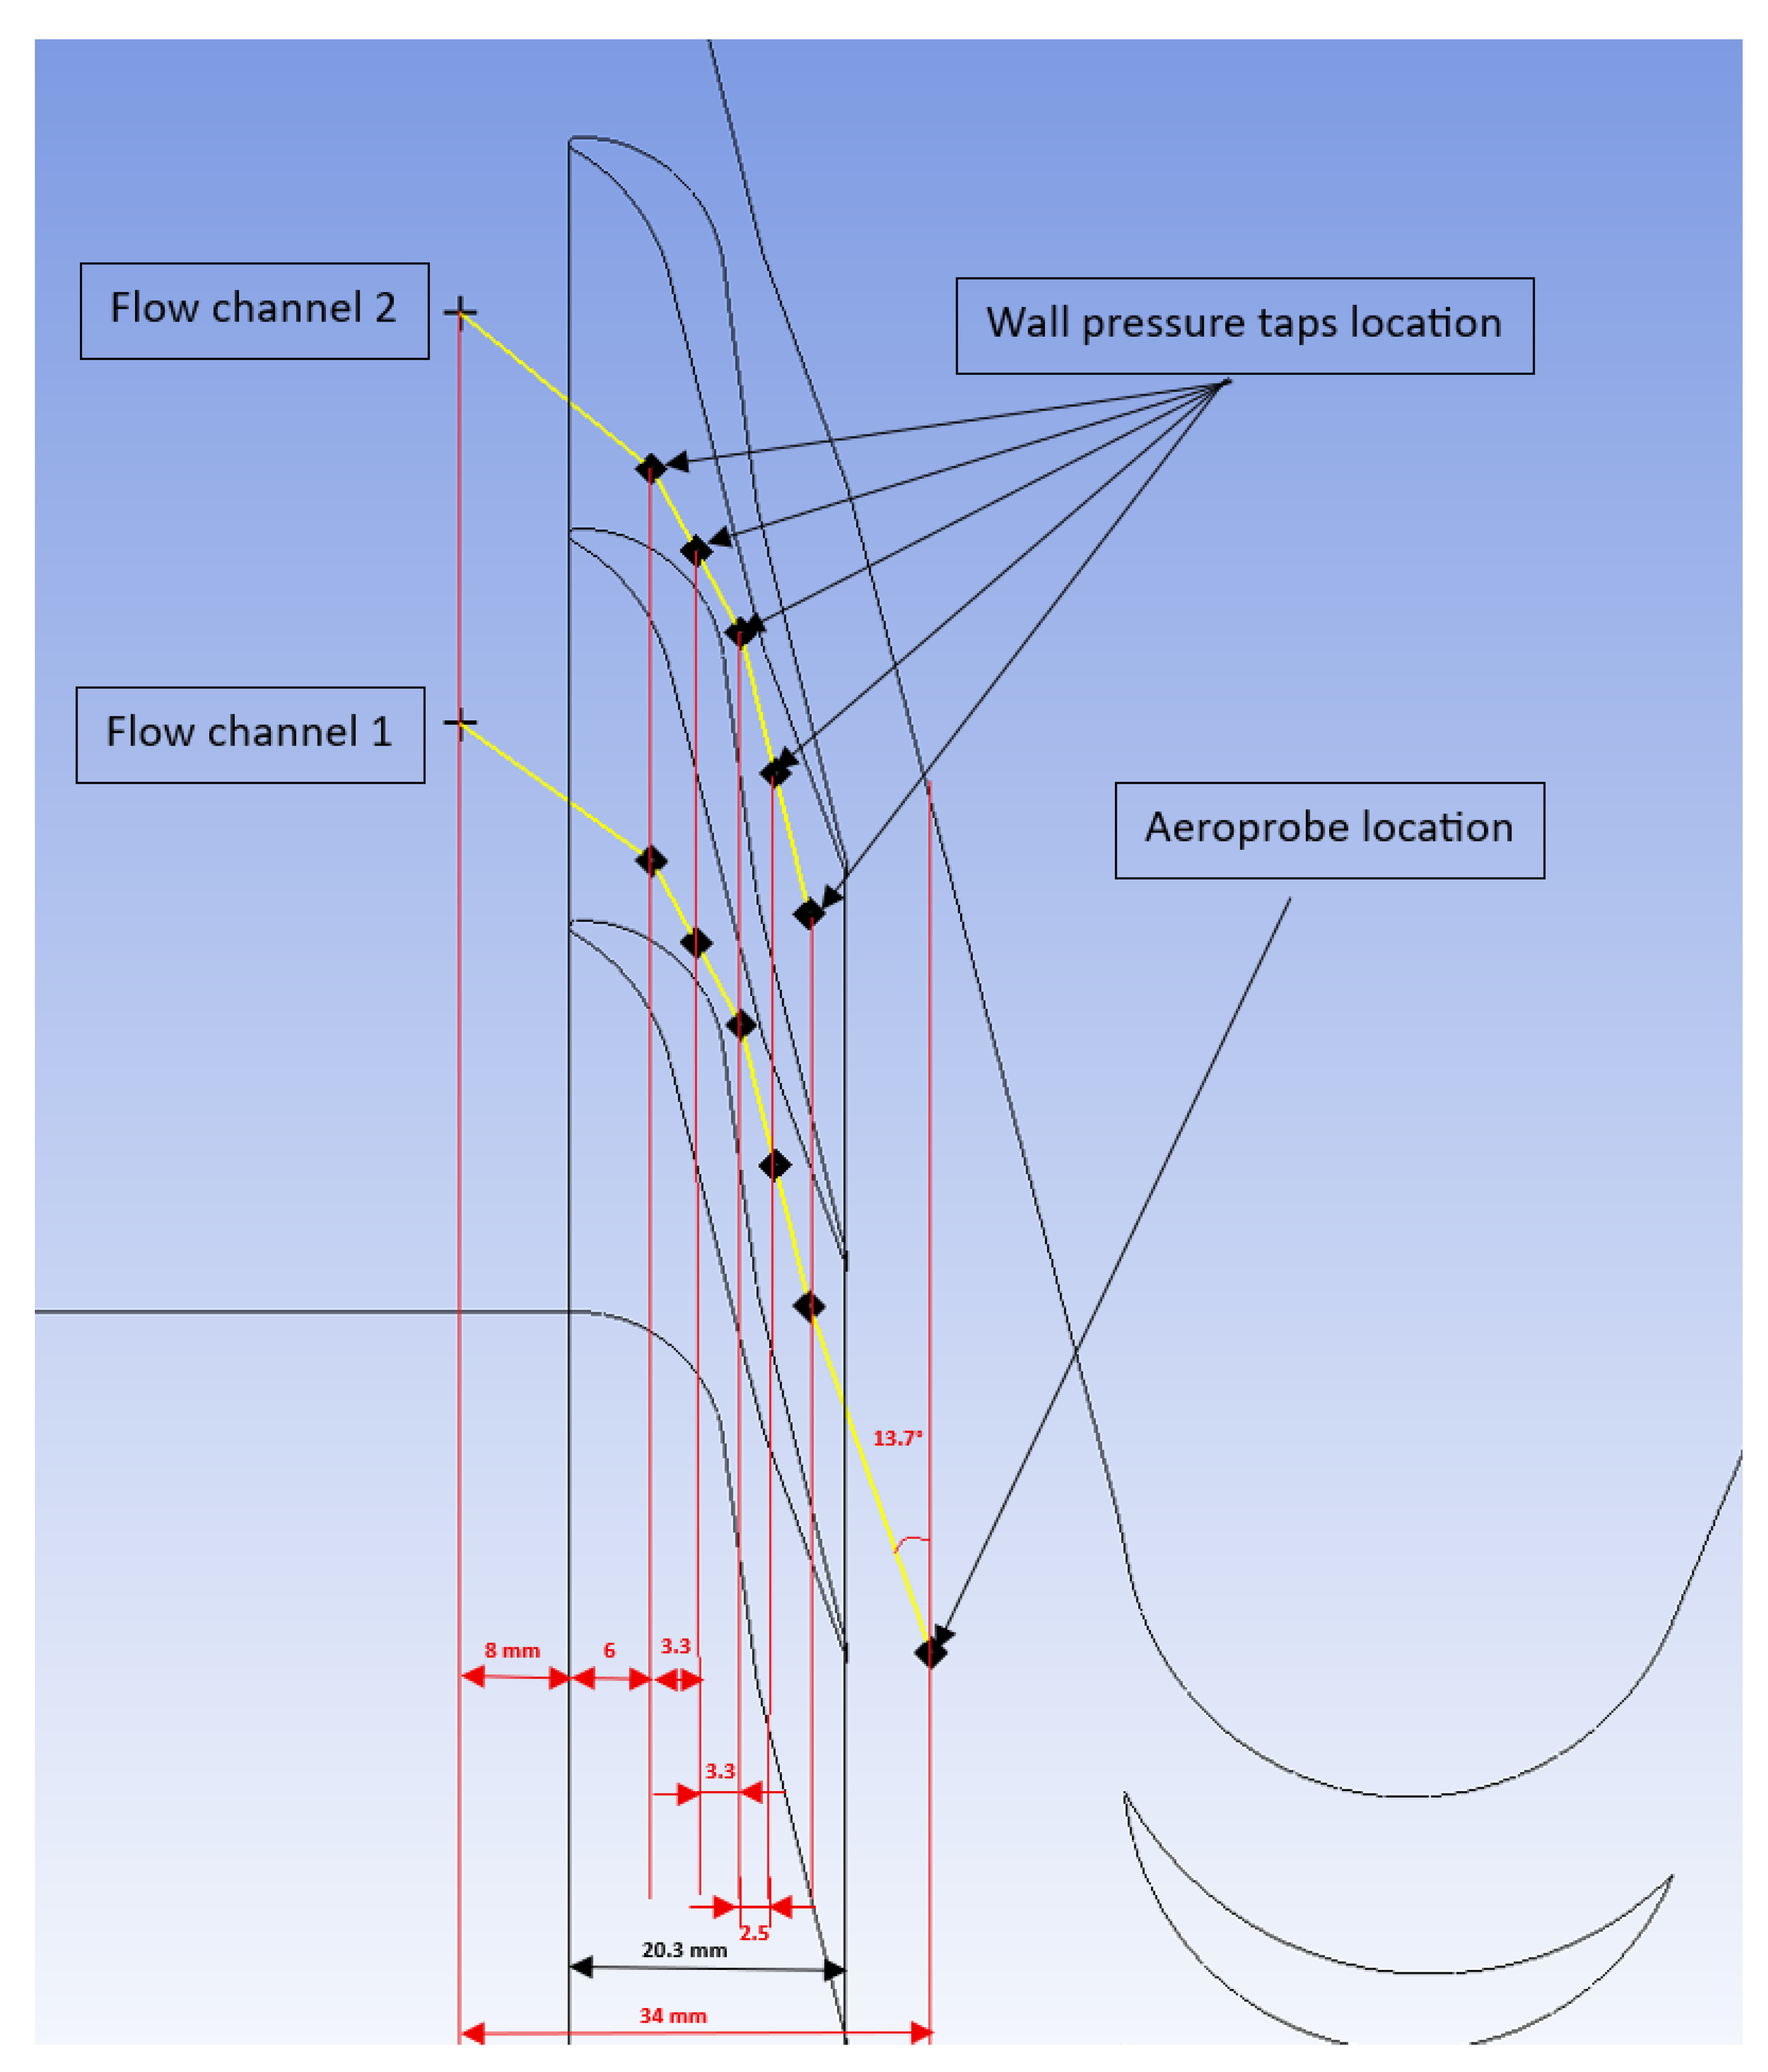
The wall pressure measurements were conducted on both of the two inner stator flow channels included in the experimental model, the two out of four channels not having an external wall. Each instrumented channel was equipped with five wall pressure taps positioned at axial locations along the channel centerline, following a representative streamline, as depicted in Figure 4. Their location included two in the subsonic section, one at the throat (critical area), one mid-way through the divergent section, and one near the stator exit.
The wall pressure taps were installed concentrically through 0.3 mm diameter holes drilled into the instrumentation lid, as shown in Figure 5a.
Total pressure at the stator outlet was measured using a calibrated supersonic five-hole Aeroprobe, mounted between the stator and rotor rows (Figure 5b). The probe has a diameter of 3.2 mm, and the section area where it was mounted was 1120 mm2. This resulted in a blockage of 0.7%. To secure the probe and prevent pressure leakage, a custom sealing device was designed. The device has two symmetrical parts, allowing attachment without sliding along the probe. Inside is a variable-diameter hole: the smaller end ensures a smooth boundary, while Part1 fits tightly into Part2. A conical surface compresses sealing material inward, creating a tight seal. Part2 (unsplit) is mounted by angling the probe through its center hole. Part3, threaded over Part2, controls the sealing material and prevents excess that could weaken the joint. Two sealing zones (in blue in Figure 5b) ensure pressure retention: a simple gasket, and a secondary seal that also supports and stabilizes the probe. Red-marked faces are used for centering the assembly.
The probe could rotate ±15° about its axis to align optimally with the flow direction, and ensure the probe is within its mounting angle limitations for a correct computation of the total pressure based on the 5 measured pressures and the calibration curve.
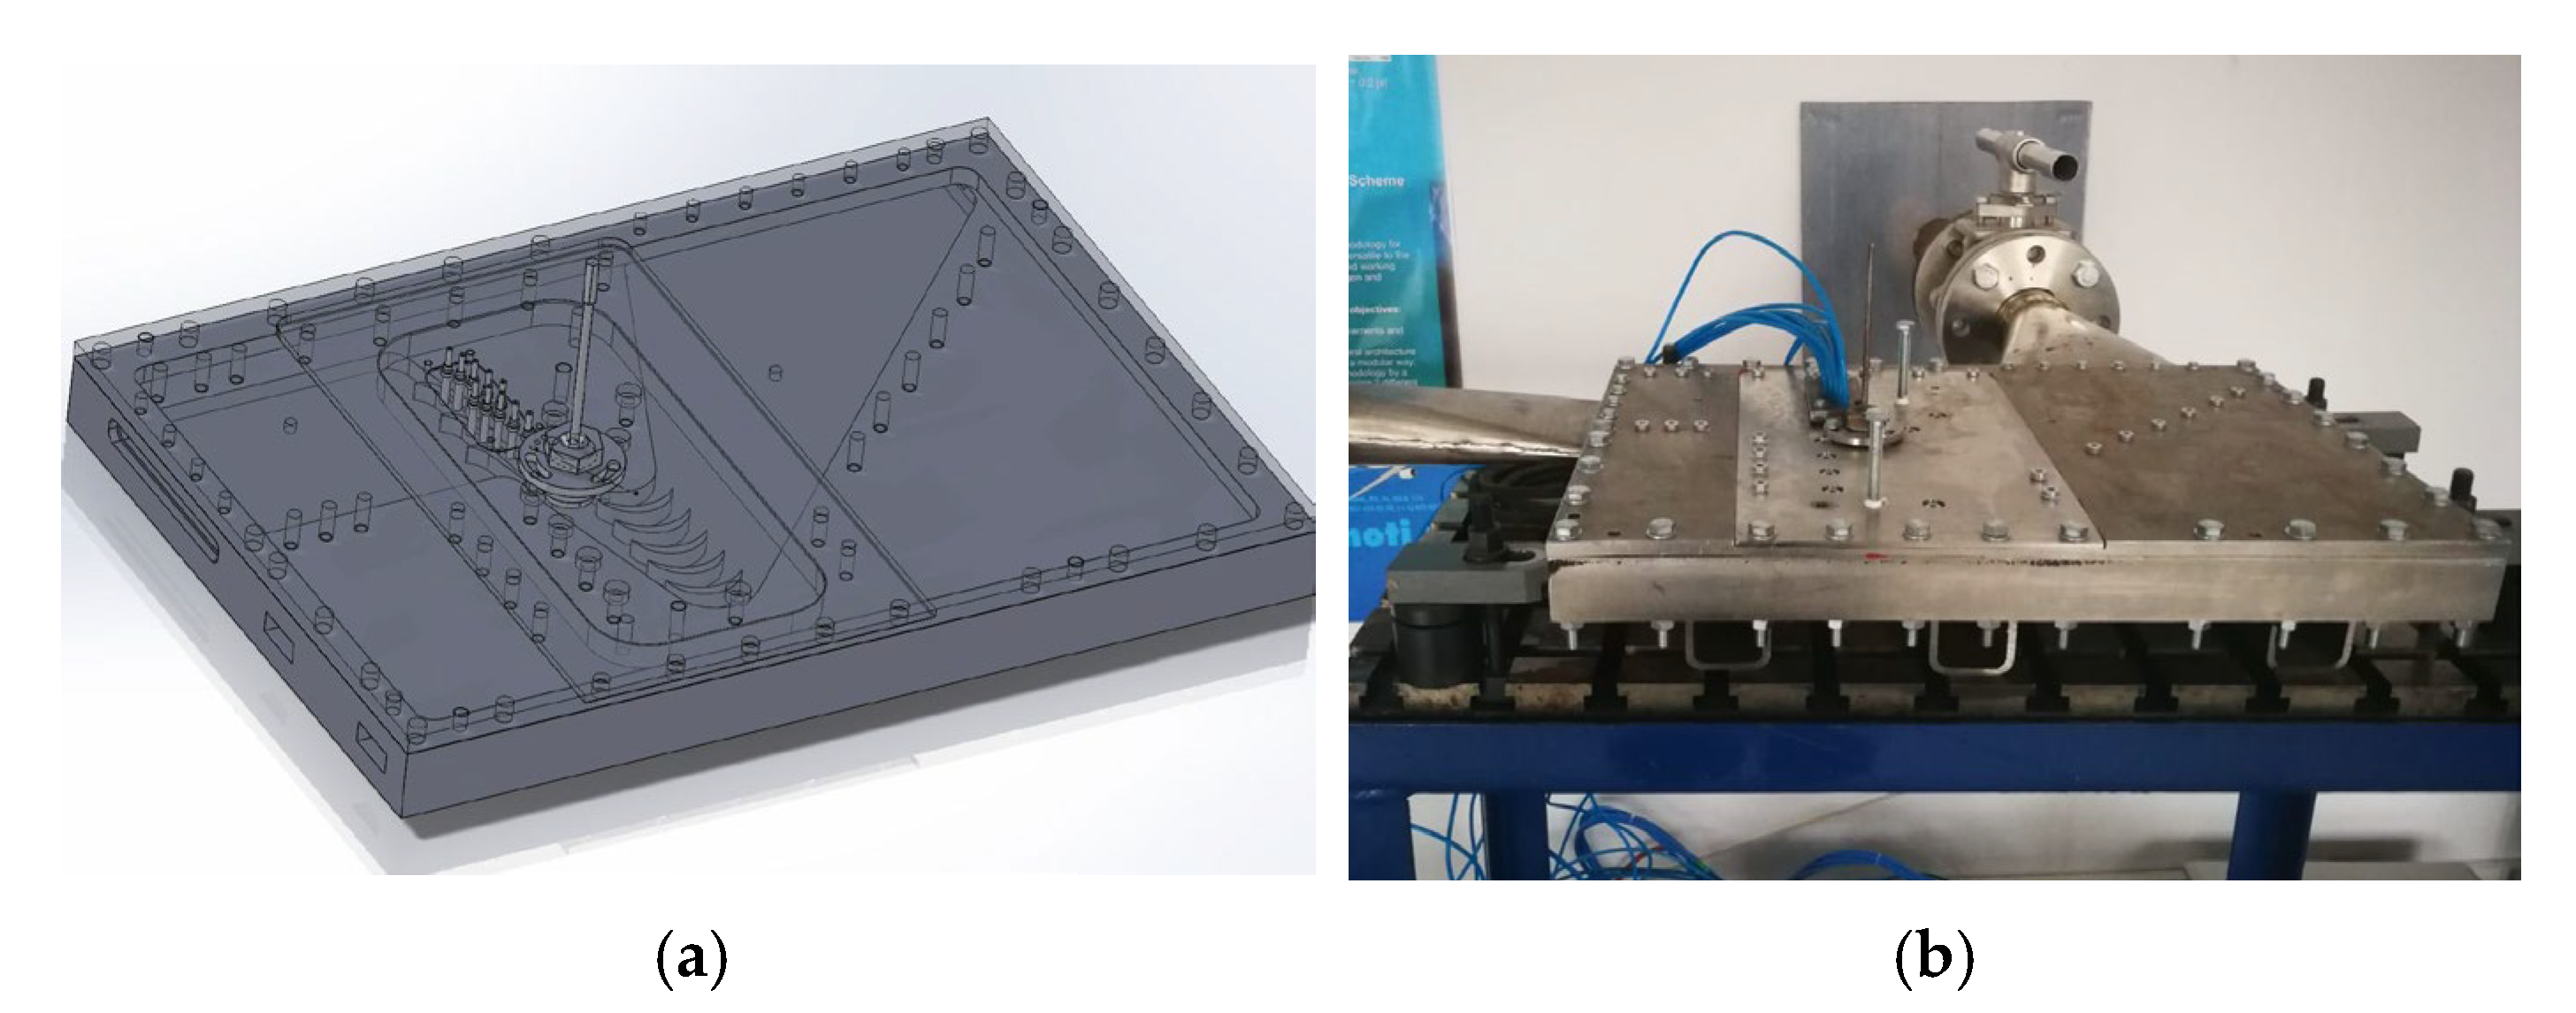
Figure 6 also presents the (Figure 6a) 3D CAD model of the experimental rig and (Figure 6b) physical model of the experimental setup.

3.3. Test Rig Configuration

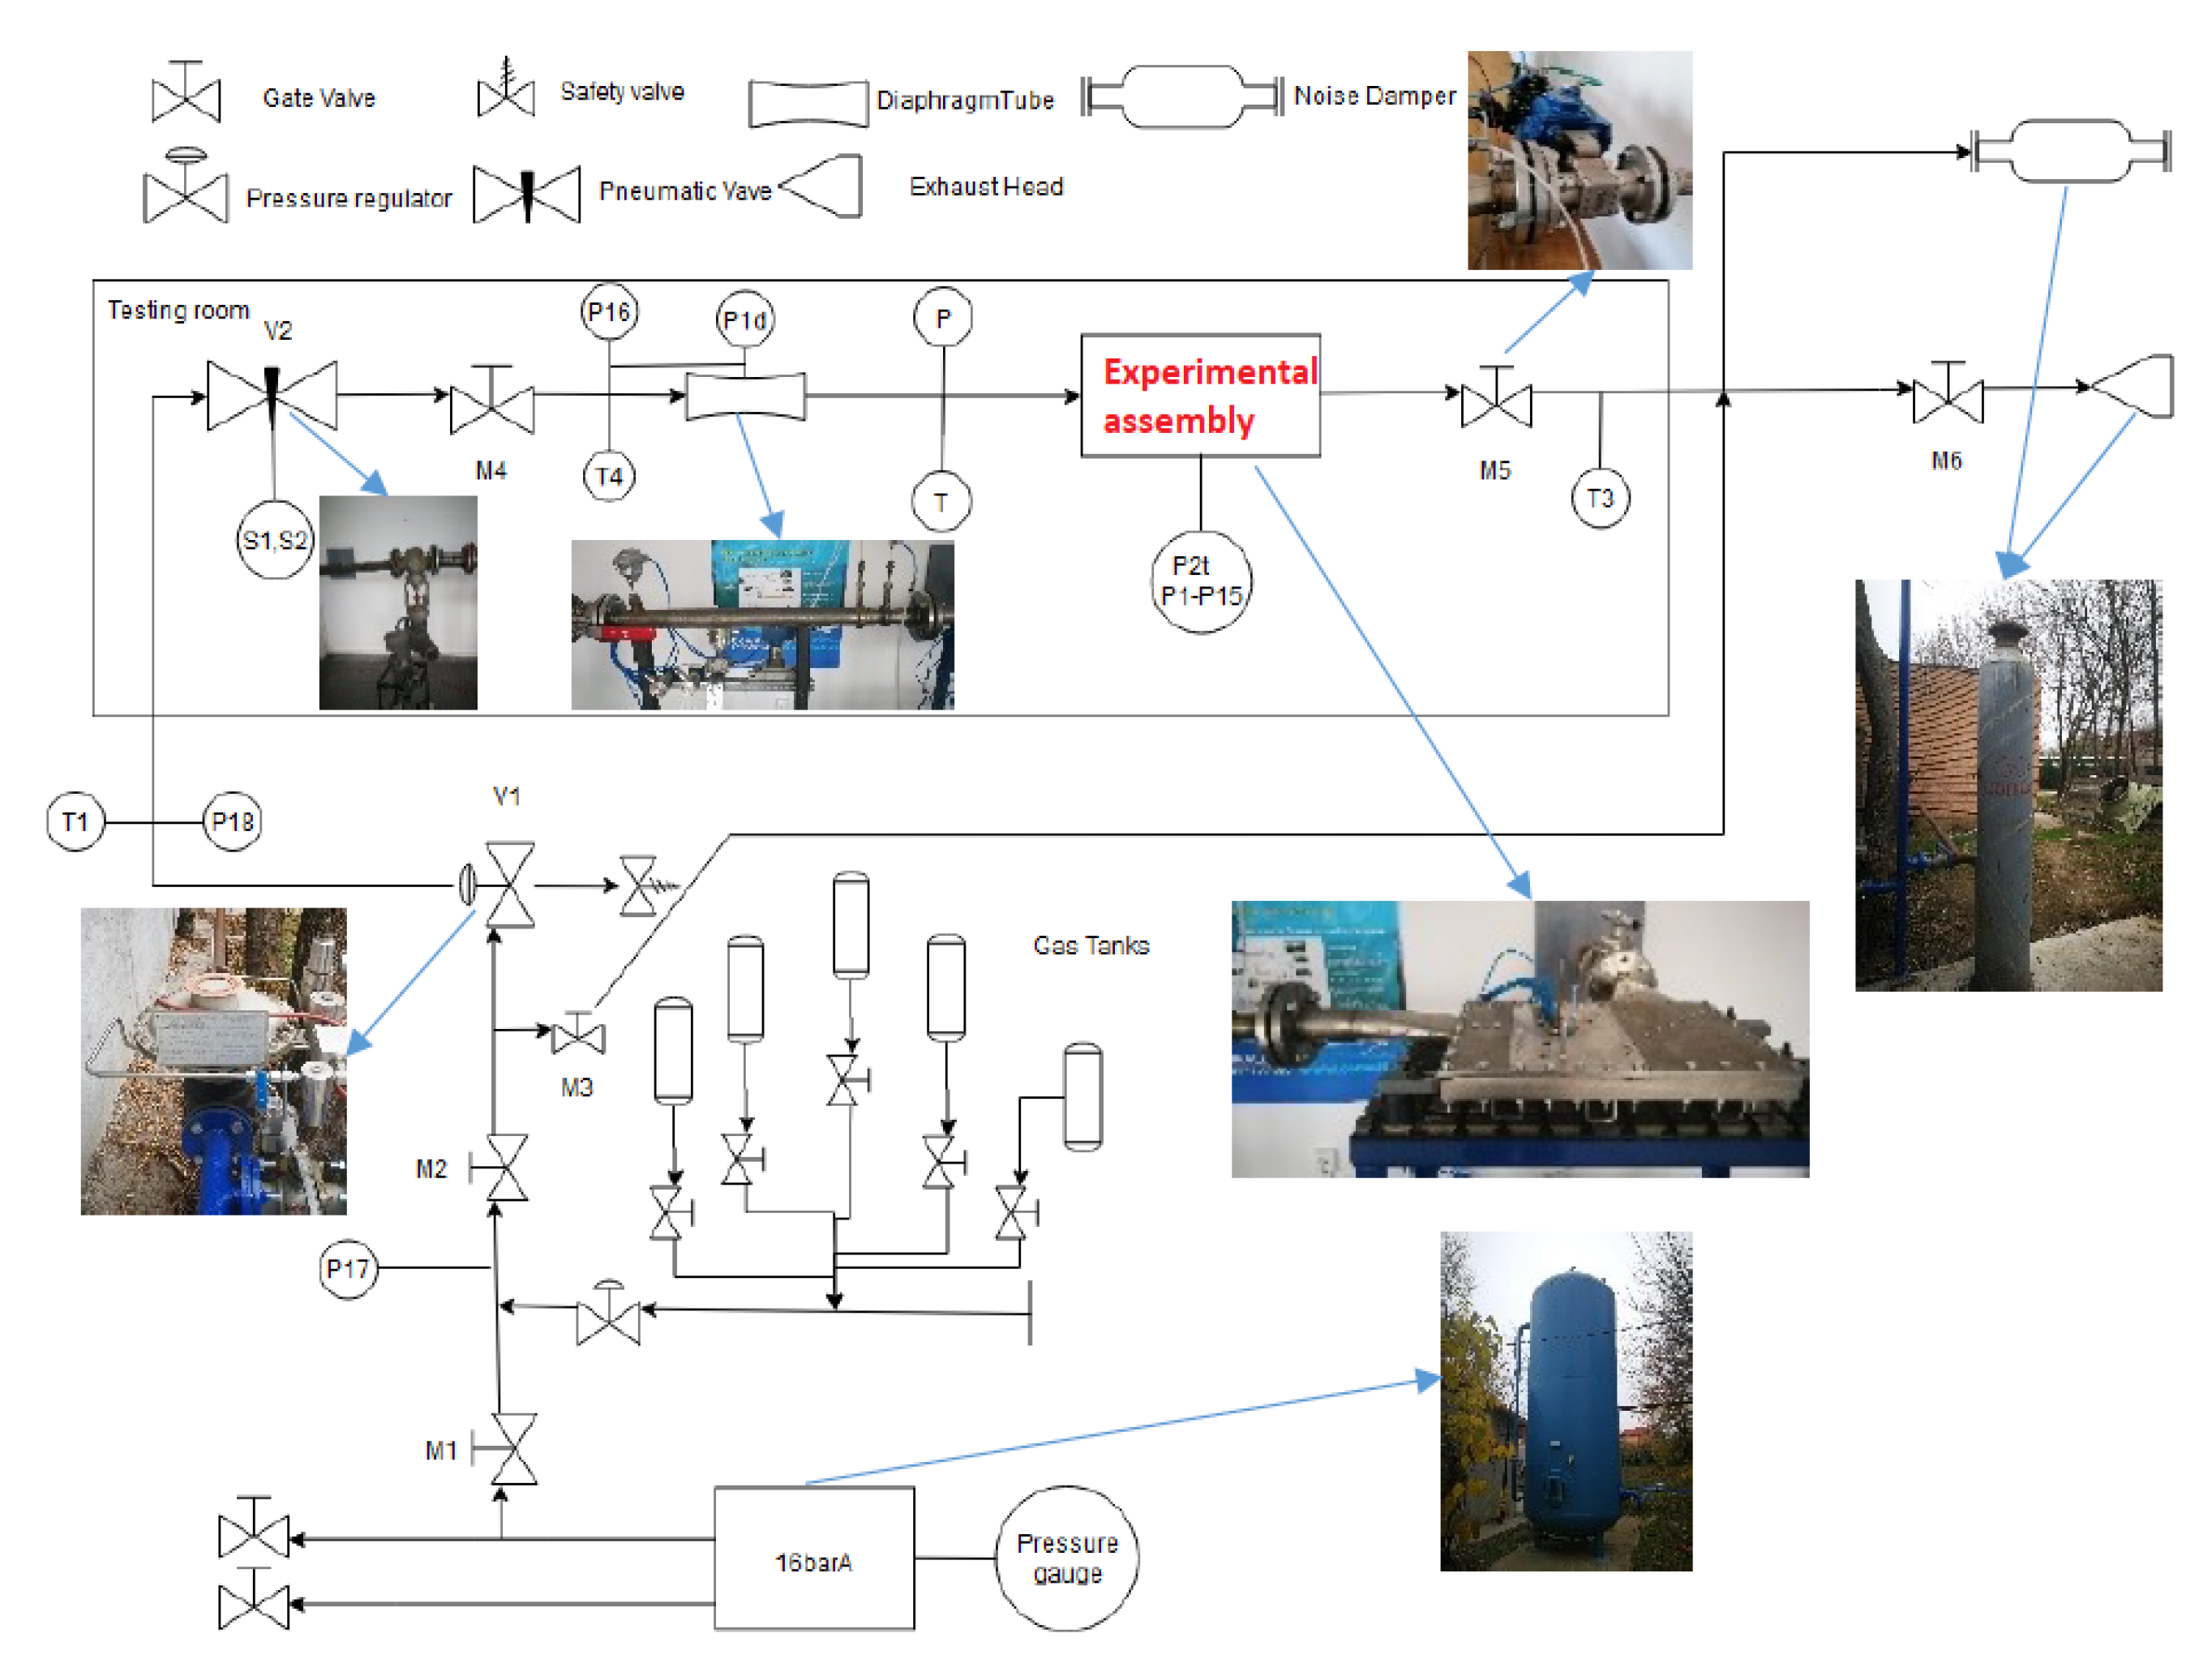
To test with the parameters shown in Table 2, a dedicated test rig was designed and implemented. The corresponding diagram is found in Figure 7.
The main limiting factor is represented by the fluidic feeding system. Though the air reservoir can be filled with air at 16 bar, due to the rapid discharge during experiments compared to the slow adjustment of the vanes in the desired position for obtaining the wanted flow regime, air experiments are limited to an inlet pressure of up to 10 bar. For methane, as this fluid is delivered from the local network, the inlet pressure is limited to 4.5 bar. The mass flow rate is measured using a Venturi tube. In order to minimize the uncertainties of the calculated mass flow rate, a Rosemount 3051SMV MultiVariable Transmitter is used to perform the calculation according to SR EN ISO 5167 [25].

3.4. Pressure Measurement Uncertainty

The measured pressure values are subject to uncertainties arising from both the manufacturing process and the limitations of the measurement system, including sensor accuracy and the overall measurement chain. The wall pressure measurement setup within the vane flow channels is illustrated in Figure 8.
Since the investigated process is steady-state, the length of the pressure tubing does not introduce significant errors. Additionally, data transmission errors via Ethernet from the pressure scanner to the acquisition system are considered negligible, as they are well below the resolution limit of the LabVIEW softwareSP1 used for data acquisition. Therefore, the primary sources of uncertainty in the measurement chain are the accuracy of the pressure scanner (DSA Scanivalve) and the numerical precision of data recording in LabVIEW.
Manufacturing-related uncertainties are mainly associated with the geometry and positioning of the static pressure ports. These include the alignment angle of the holes relative to the flow, the sharpness of the edges, and the hole diameter. A summary of these contributions is provided in Table 3.
Ideally, the pressure hole should be perpendicular to the local flow direction to measure static pressure accurately. A misalignment of up to 30° can introduce an error of approximately 0.3%, due to partial capture of dynamic pressure [26]. In this study, the holes were fabricated using laser cutting, ensuring a maximum angular deviation of 1°, which falls within the acceptable error margin mentioned above.
The sharpness of the edges is also important, as slightly rounded edges allow for inviscid flow streamlines to bend slightly downward into the hole. As long as this radius is kept under 1 quarter of the hole diameter, the error is maintained under 0.2% [26]. Last, but not least, the hole dimension is important as the shear stress of the boundary layer passing over induces recirculating flows in the cavity, which in turn entrains relatively high momentum fluid from the free stream into the static pressure hole [26]. This results in a static pressure in the passage that is higher than the pressure on the surface. Hole diameters below 0.5 mm have minimal errors [27].
Considering all the above, the total error can be computed based on Equation (17):
δ p = ε P S 2 + ε L V 2 + ε H A 2 + ε H E 2 + ε H D 2
However, the measured static pressure is gauge pressure. The results are reported as ratio between the absolute static pressure inside the flow channel and the absolute static pressure at the inlet. For this reason, similar total errors have been computed for the atmospheric pressure measurement and inlet gauge static pressure. The resulting errors for the absolute pressure inside the flow channel and for the inlet absolute static pressure are given in Equations (18) and (19), while the measuring error for the absolute static pressure ratio is described by Equations (20) and (21).
δ p a b s = δ p a t m 2 + δ p 2
δ p a b s ,     i = δ p a t m 2 + δ p i 2
p r a b s = p a b s p a b s , i
δ p r a b s   = ± r a b s ·   δ p a b s p a b s 2 + δ p a b s , i p a b s , i 2

3.5. Post Processing of the Experimental Data

For each experiment, the time intervals corresponding to distinct flow regimes were identified. To accurately determine these intervals, the following guidelines were applied:
In addition to monitoring the inlet pressure, the position of the outlet control vane was used as an indicator of regime stability. This value is recorded in the data file. The first step involved identifying intervals where the control vane position remained stable, fluctuating by no more than ±0.3%. These intervals were marked as specific row ranges in the resulting Excel dataset. The next criterion was the stability of the outlet static pressure. A distinct flow regime was defined as any period exceeding 10 s during which the outlet static pressure varied by less than 0.1 bar. With a data acquisition rate of 10 Hz, each regime was averaged over 100 data points. If the interval identified in the previous step exceeded 10 s, the 100 points were taken from the middle of that interval to ensure representative values. An example of this post-processing approach is shown in Figure 9. The control vane remained stable between time steps 1091 and 1738. Within this interval, two sub-periods of constant outlet pressure were identified: [1091, 1400] and [1609, 1738].
Each of those two intervals corresponds to a different experimented flow regime. 100 values have been chosen from the middle of each interval for data averaging.

4. Results

4.1. Test Matrix

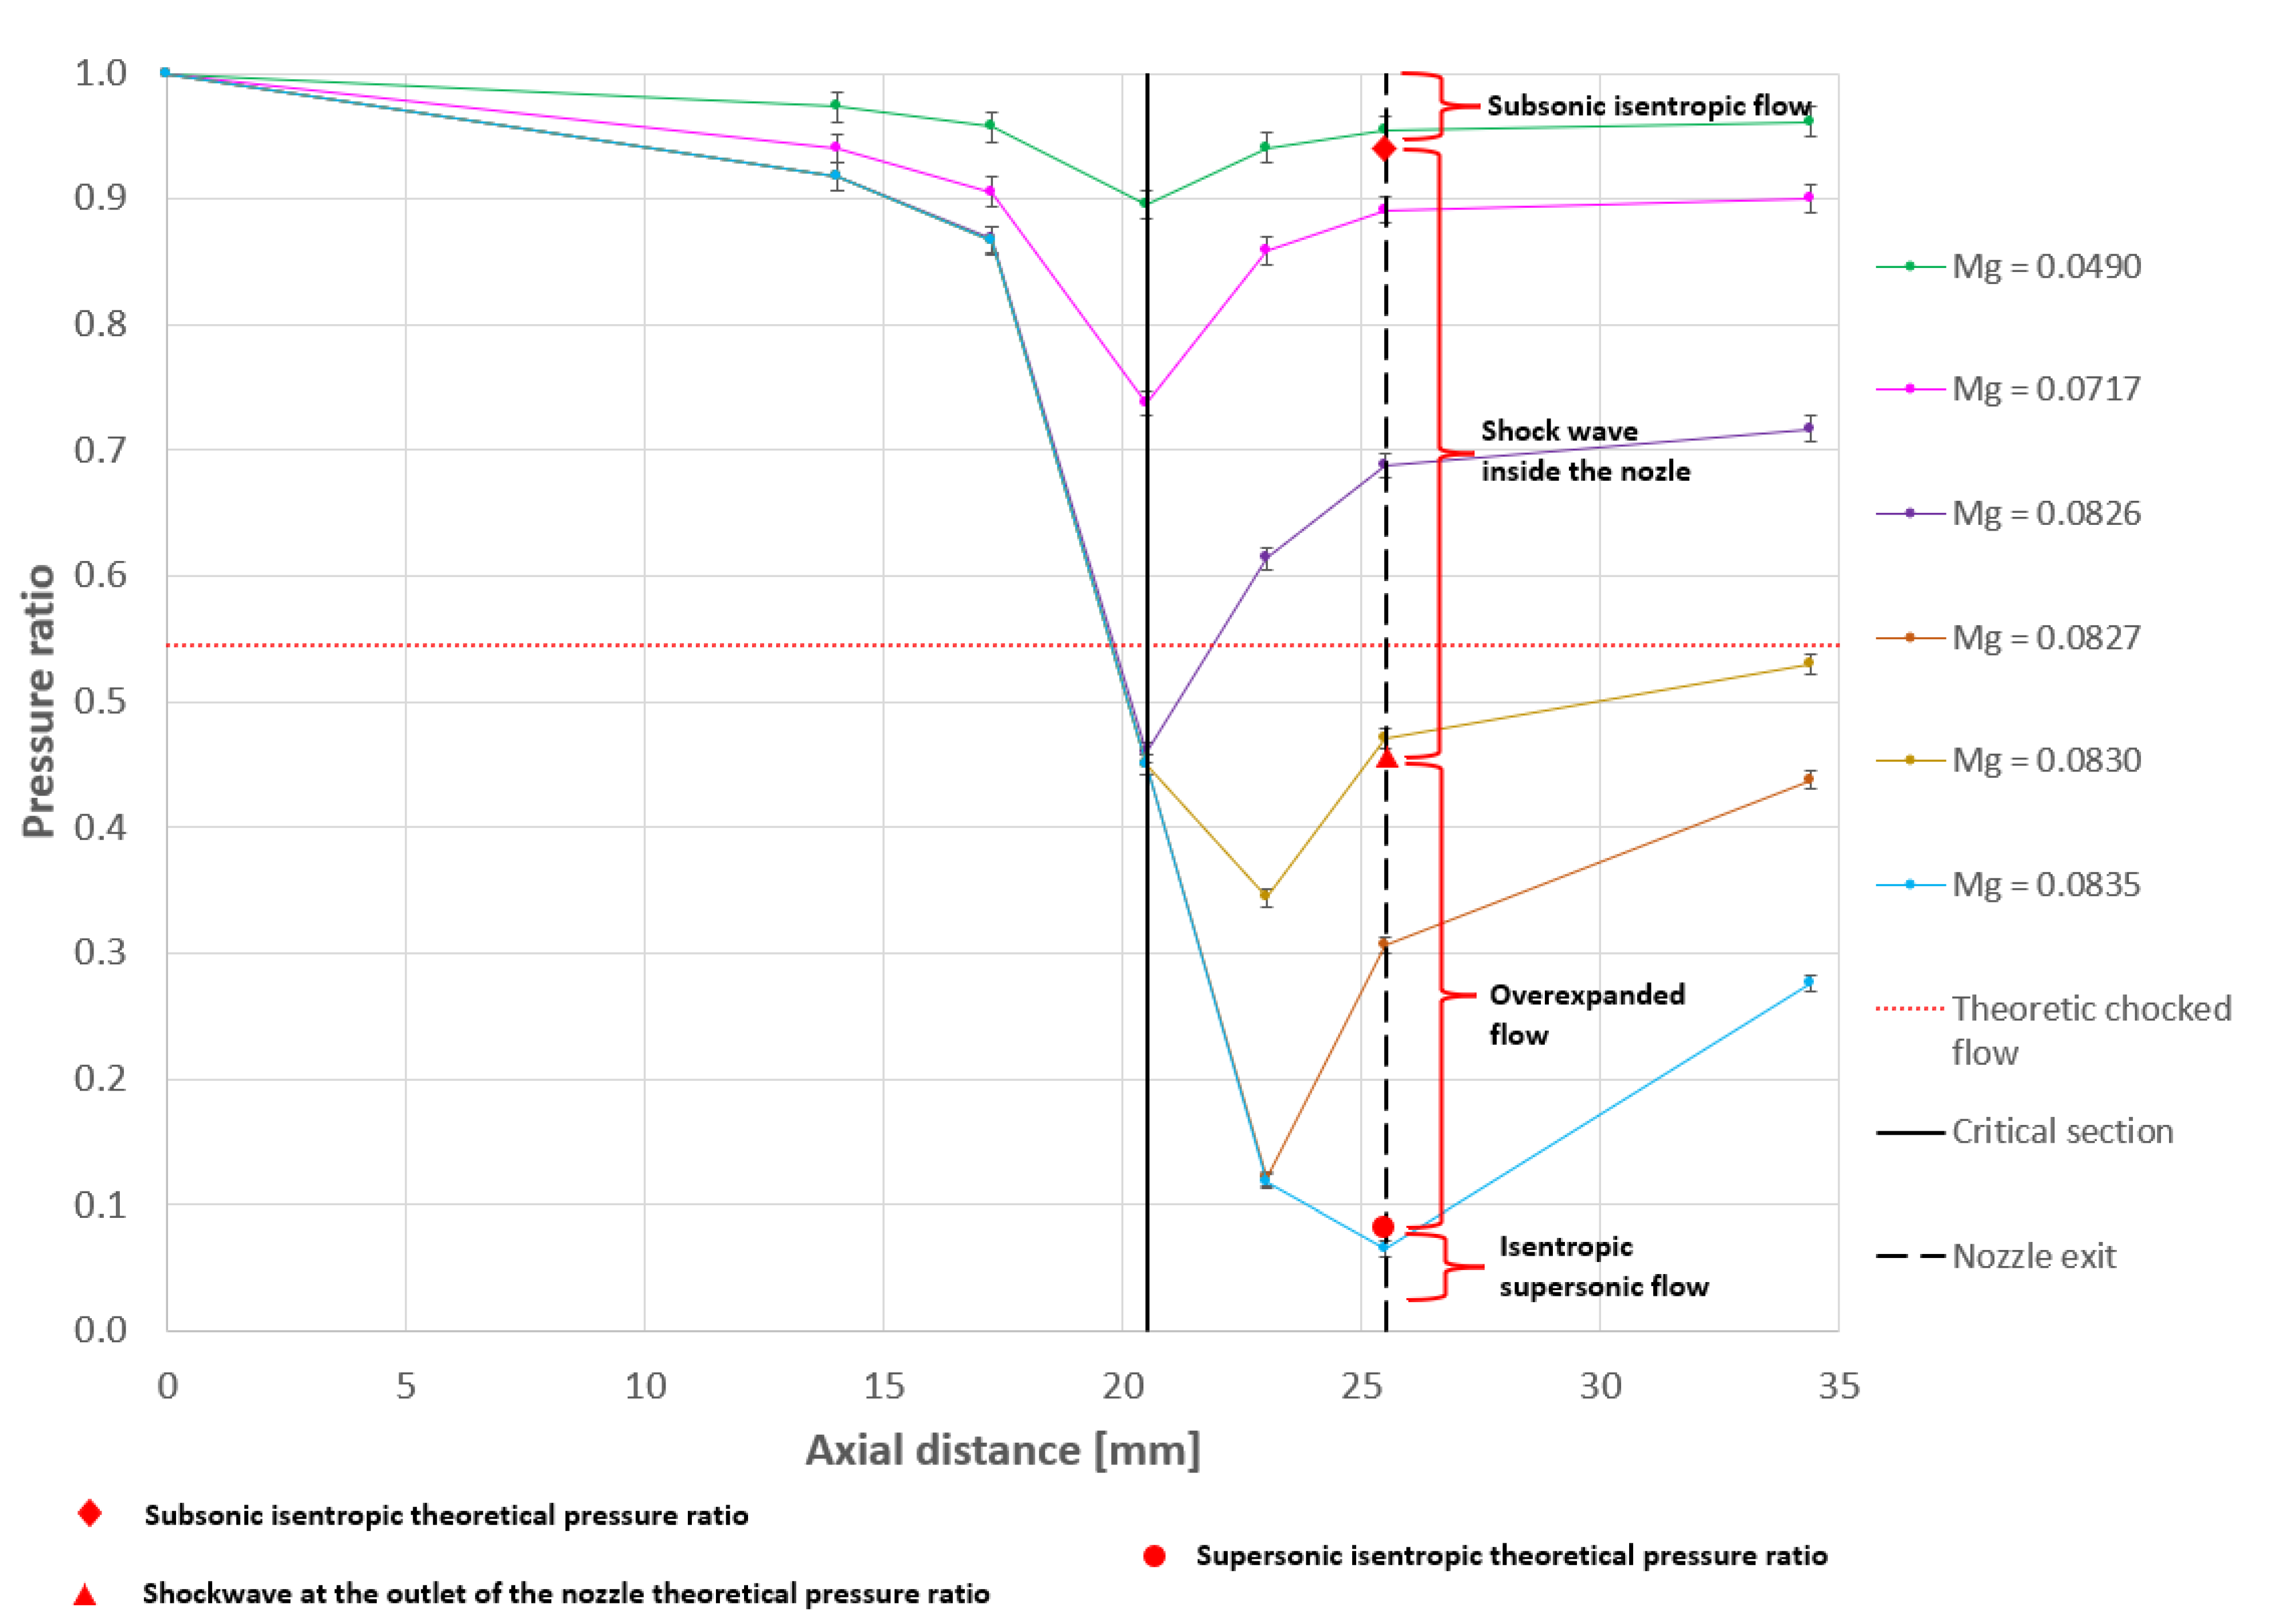
By varying the pressure ratio between the nozzle inlet and the back pressure at the outlet, a full spectrum of flow regimes was experimentally captured for both air and methane. These regimes include subsonic isentropic flow, flow with an internal shock wave within the nozzle, flow with a shock wave located outside the nozzle, and fully isentropic supersonic flow. Figure 10 illustrates this range for tests conducted with methane at a constant inlet pressure of 4.5 bar and varying back pressure at the outlet of the experimental model. This was achieved by using the pressure regulator and the control valves shown in Figure 6. The back pressure was not measured, as it was not a parameter of interest, but rather it was used for controlling the mass flow rate. This is a test rig solution for allowing experiments to take place in a wide range of regimes. In practice, this is useful to determine the turbine stator behavior and understand where the turbine has the best performances and less losses.
The legend in Figure 10 indicates the corresponding mass flow rates measured for each case, in kg/s. Theoretical pressure ratio thresholds, defining the transition between subsonic isentropic flow, a normal shock located at the nozzle exit, and fully isentropic supersonic flow were calculated for both working fluids. These values are presented in Table 4, along with the theoretical critical pressure ratio below which the flow becomes choked at the nozzle throat.
Figure 10 also includes two vertical lines and a horizontal one. The first vertical line is the location of the critical section, corresponding to the minimum area of the nozzle and axial location 20.6 in Figure 4. The second vertical line is the nozzle exit, corresponding to the mean point on the line uniting the trailing edge of a vane with the suction side of the adjacent vane and normal to the flow inside the flow channel, or axial location 25.5, on current Figure 4. The horizontal line corresponds to the theoretical value for the pressure ratio for chocked flow for the existing nozzle.
According to the data presented in Figure 10, along with the nominal regime, a full range of regimes were obtained experimentally, including:
-
Subsonic isentropic flow, for which the theoretical pressure ratio between the back flow at the exit of the nozzle and the inlet pressure in this case needs to be above 0.959
-
Shockwave inside the nozzle, for which the pressure ratio needs to be above the computed theoretic value for shockwave at the outlet of the nozzle, namely 0.463
-
Shockwave outside of the nozzle, for which the pressure ratio needs to be below 0.463
-
Designed isentropic supersonic flow, for which the theoretic pressure ratio needs to be around 0.078, which is the nominal regime intended for this turbine to work at.
A comparative view of the flow regimes tested on methane and air, both in terms of absolute flow parameters as well as reduced mass flow rate, computed according to Equation (10) is given in Table 5. The bolded values are representative of the nominal flow regime.
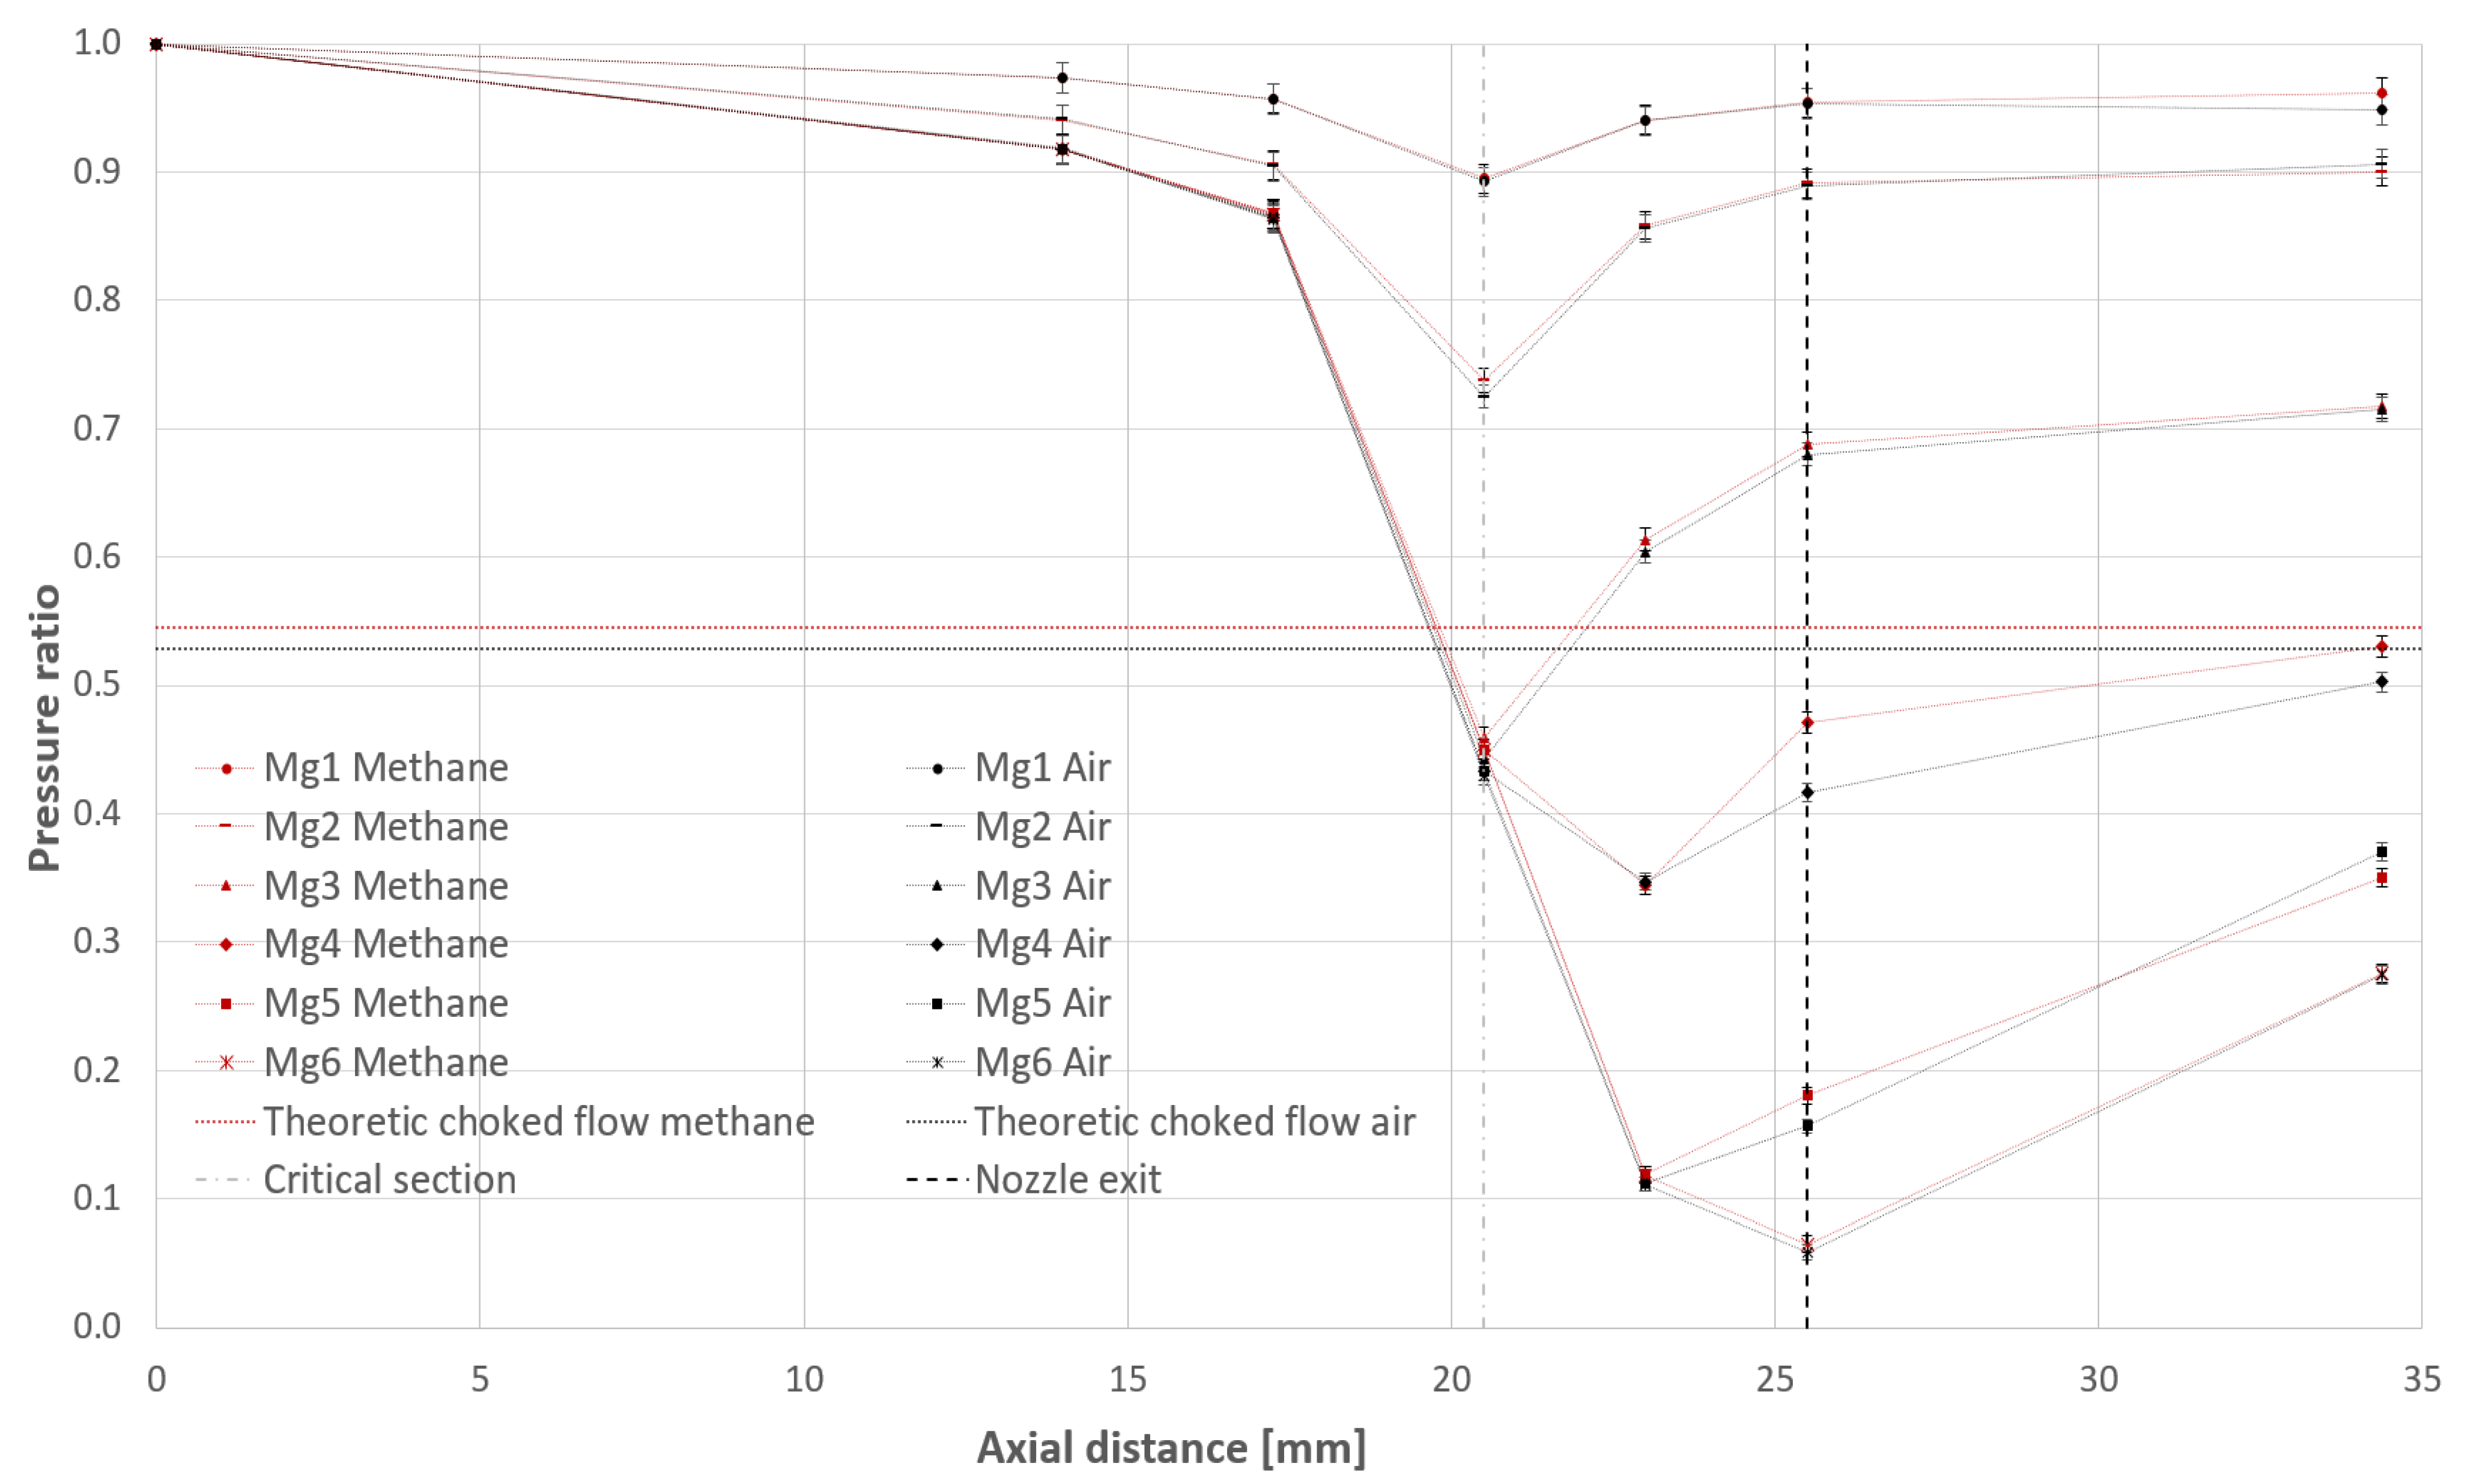
The measured pressure ratios corresponding to the regimes synthesized in Table 5 are represented graphically in Figure 11. Figure 11 gives in red the pressure ratio variation along the flow channel for 6 regimes tested on methane, corresponding to regimes 1 to 6 in Table 5, meaning Mg1 Methane has a mass flow rate of 0.049 kg/s of methane. Similarly, in black, are the pressure ratio variations for the 6 regimes tested on air, for which the flow details are also given in Table 5. Thus, flow regime 6 from Table 5 corresponding to a mass flow rate of 0.1301 kg/s of air, is Mg6 Air in the legend of Figure 11.
The thin dotted line linking the measured values are only for helping with following the corresponding values from a regime and are not representative of true variation between measuring points. For example, for the nominal regime (regime 6), it is expected that the static pressure will remain relatively constant downstream of the nozzle exit and to increase abruptly after the shock wave, right before the last measurement point [24].
The measurement uncertainty for the pressure ratio computed with the method described in Section 3.4 is also reported in Figure 10 and Figure 11. The values are visibly small, with maxim values of +/−0.0135 bar for both air and methane for the pressure ratio corresponding to the location of the 5-hole probe, downstream of the nozzle exit and the shockwave in flow regime 5. The maximum pressure ratio error as percentage of the pressure ratio is registered for the regimes with supersonic flow, in the divergent area of the nozzle, where the absolute pressure ratios are minimum, between the critical section and the nozzle exit.
A first observation is that the experiments on the two fluids cover similar flow regimes, most of them with 7% of each other in terms of reduced mass flow rate.
Another important observation is that the measured critical pressure ratio is smaller than the theoretical values for both fluids, with about 17%.
The difference between the theoretical values and the measured values can be caused by manufacturing variations. For a turbine of this scale, where the blade height is 10 mm, the minimum distance between two consecutive blades is 3 mm and the pressure hole dimeter is only 0.3 mm, even a tight manufacturing tolerance of 0.03 mm represents 1% of the minimum distance and 10% of the hole dimeter, which can affect the distribution of the flow.
Along with the positioning of the probes and manufacturing tolerances, another explanation for the measured critical pressure ratio values being lower than the theoretical values is the fact that the theoretical value does not account for the thickness of the boundary layer. It was proven in the literature that the values of the choking pressure ratio are lower than those of the inviscid theory and monotonically decrease with an increase in the wall boundary layer thickness. The relative difference between the two values for the two fluids remains similar however, with the methane measured pressure ratio being 3.95% higher than the air value, as compared to a theoretical difference of 3.12%. The value considered here for the measured critical pressure ratio is the average of the critical pressure ratio measured for the last four measured regimes in which the critical pressure ratio is reached. All measured critical pressure ratio values are within 2% of the average, for both air and methane. All this data is synthesized in Table 6.

4.2. Nominal Regime Comparisson

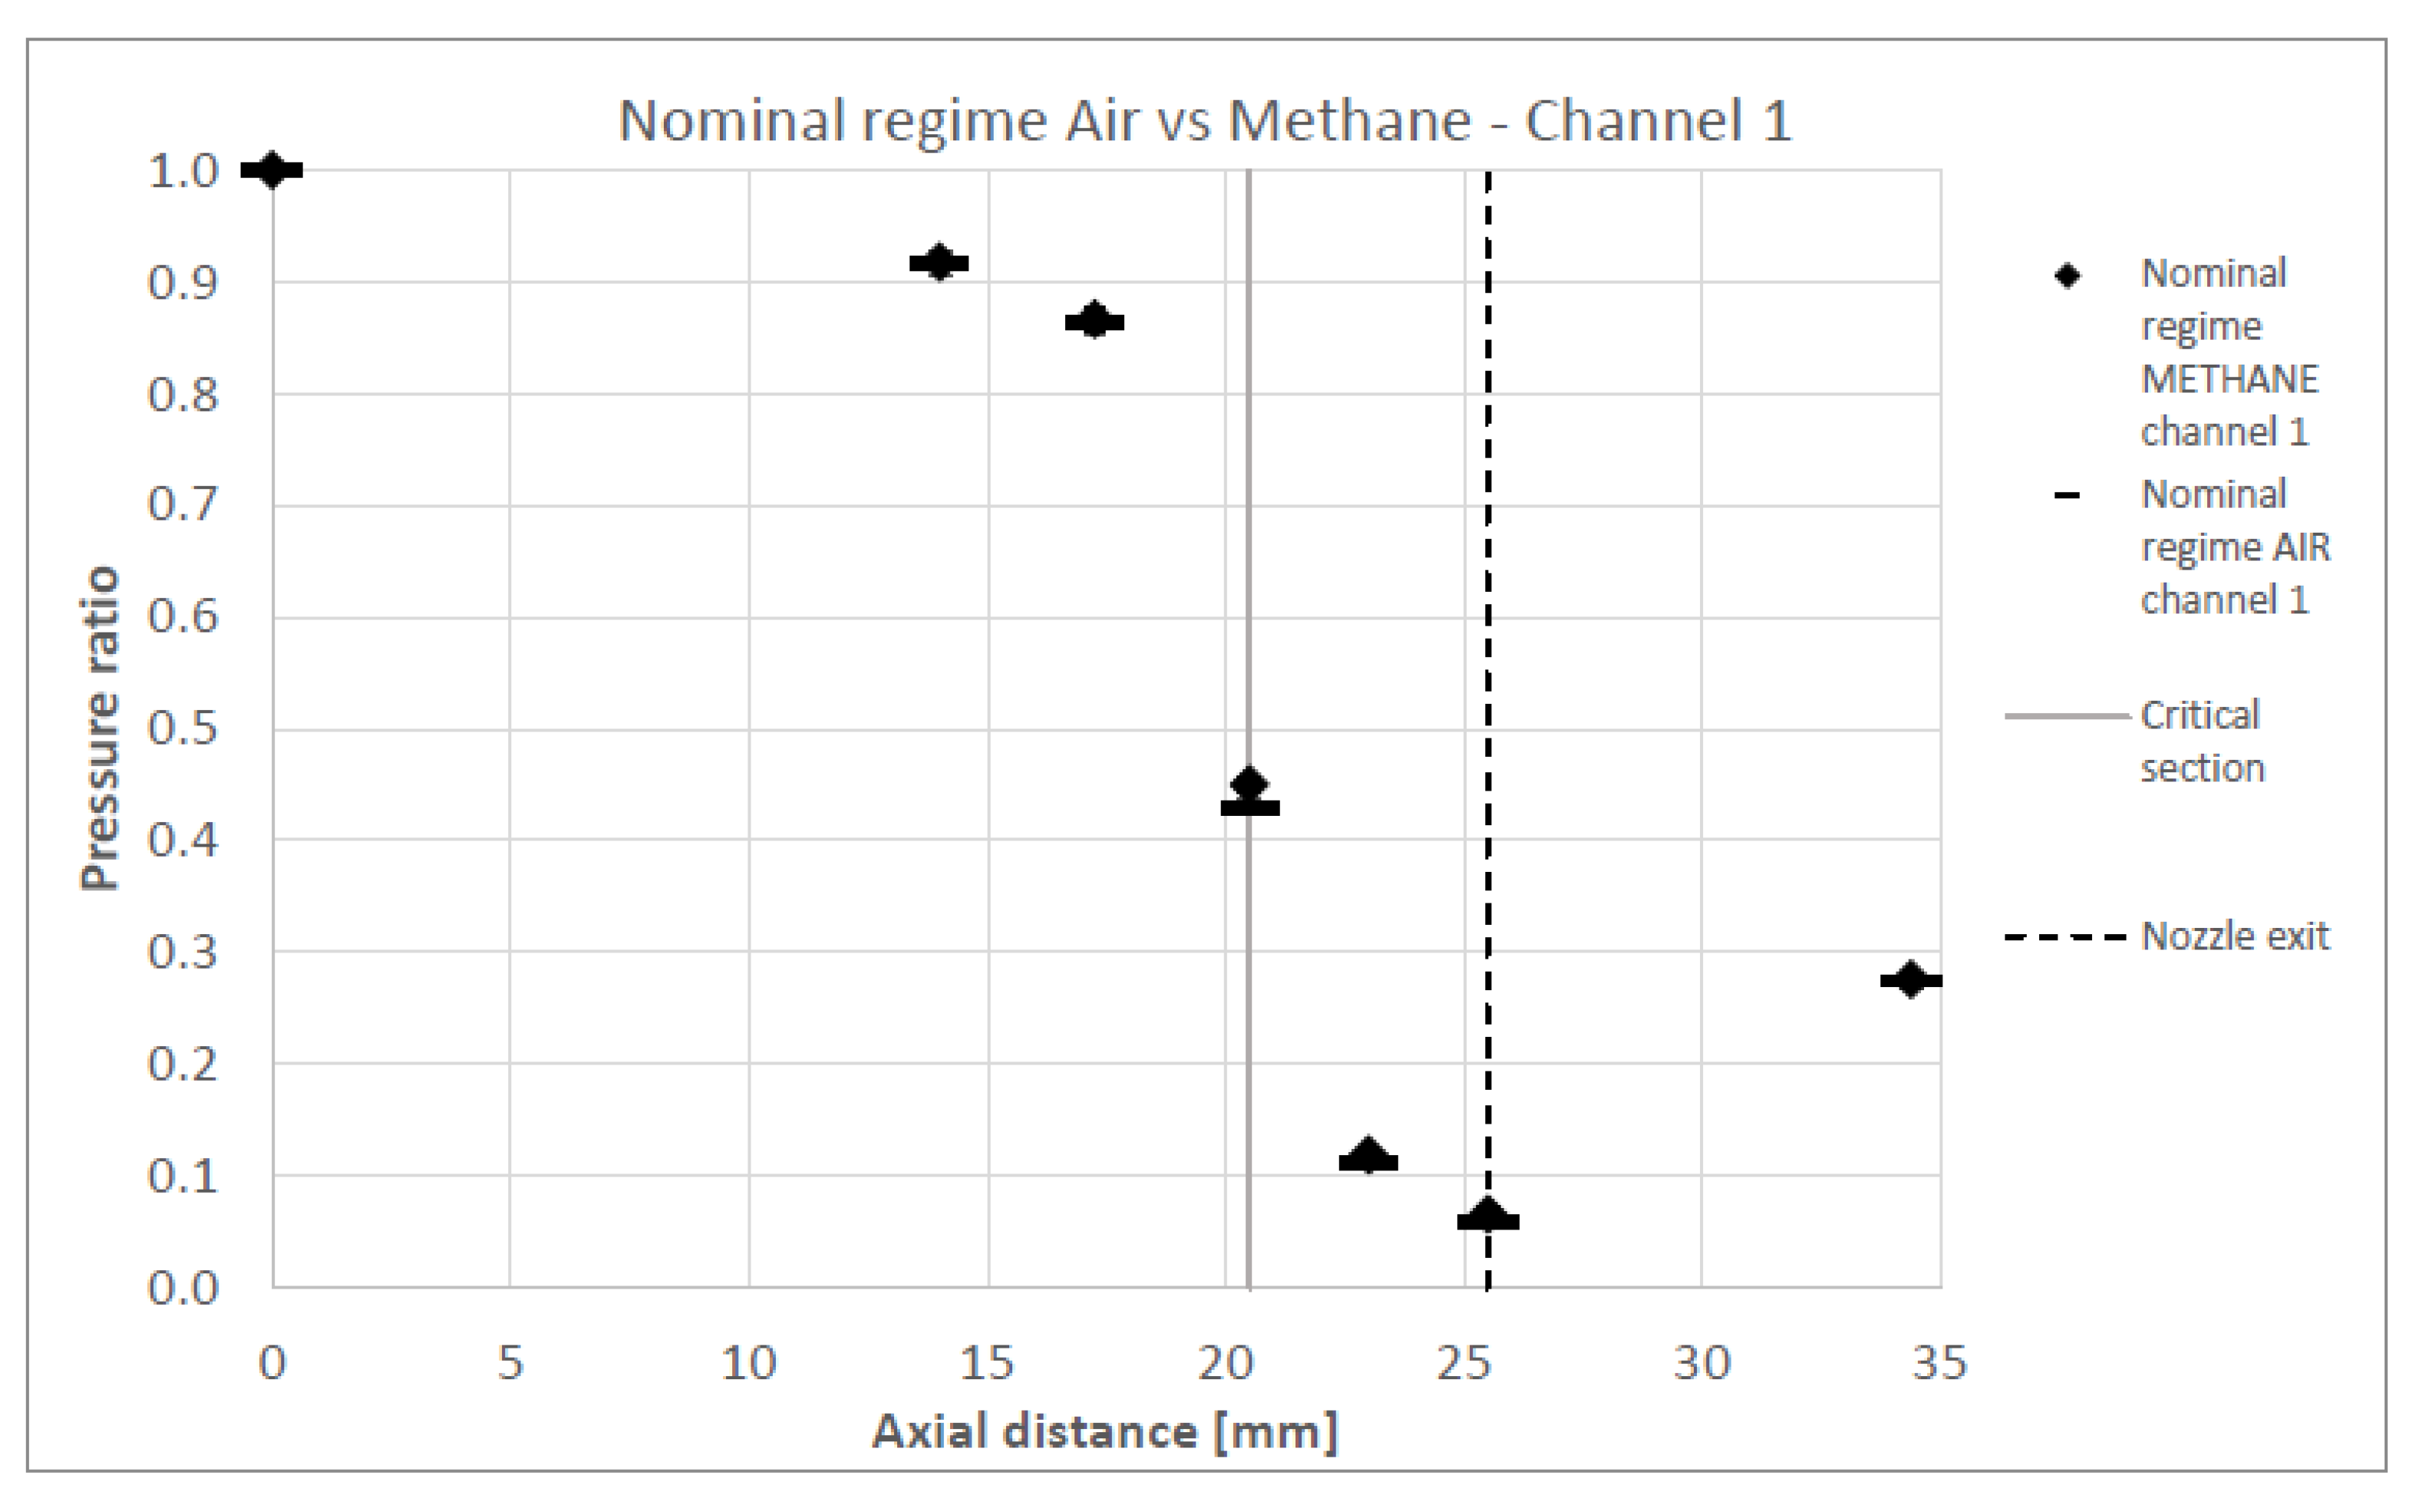
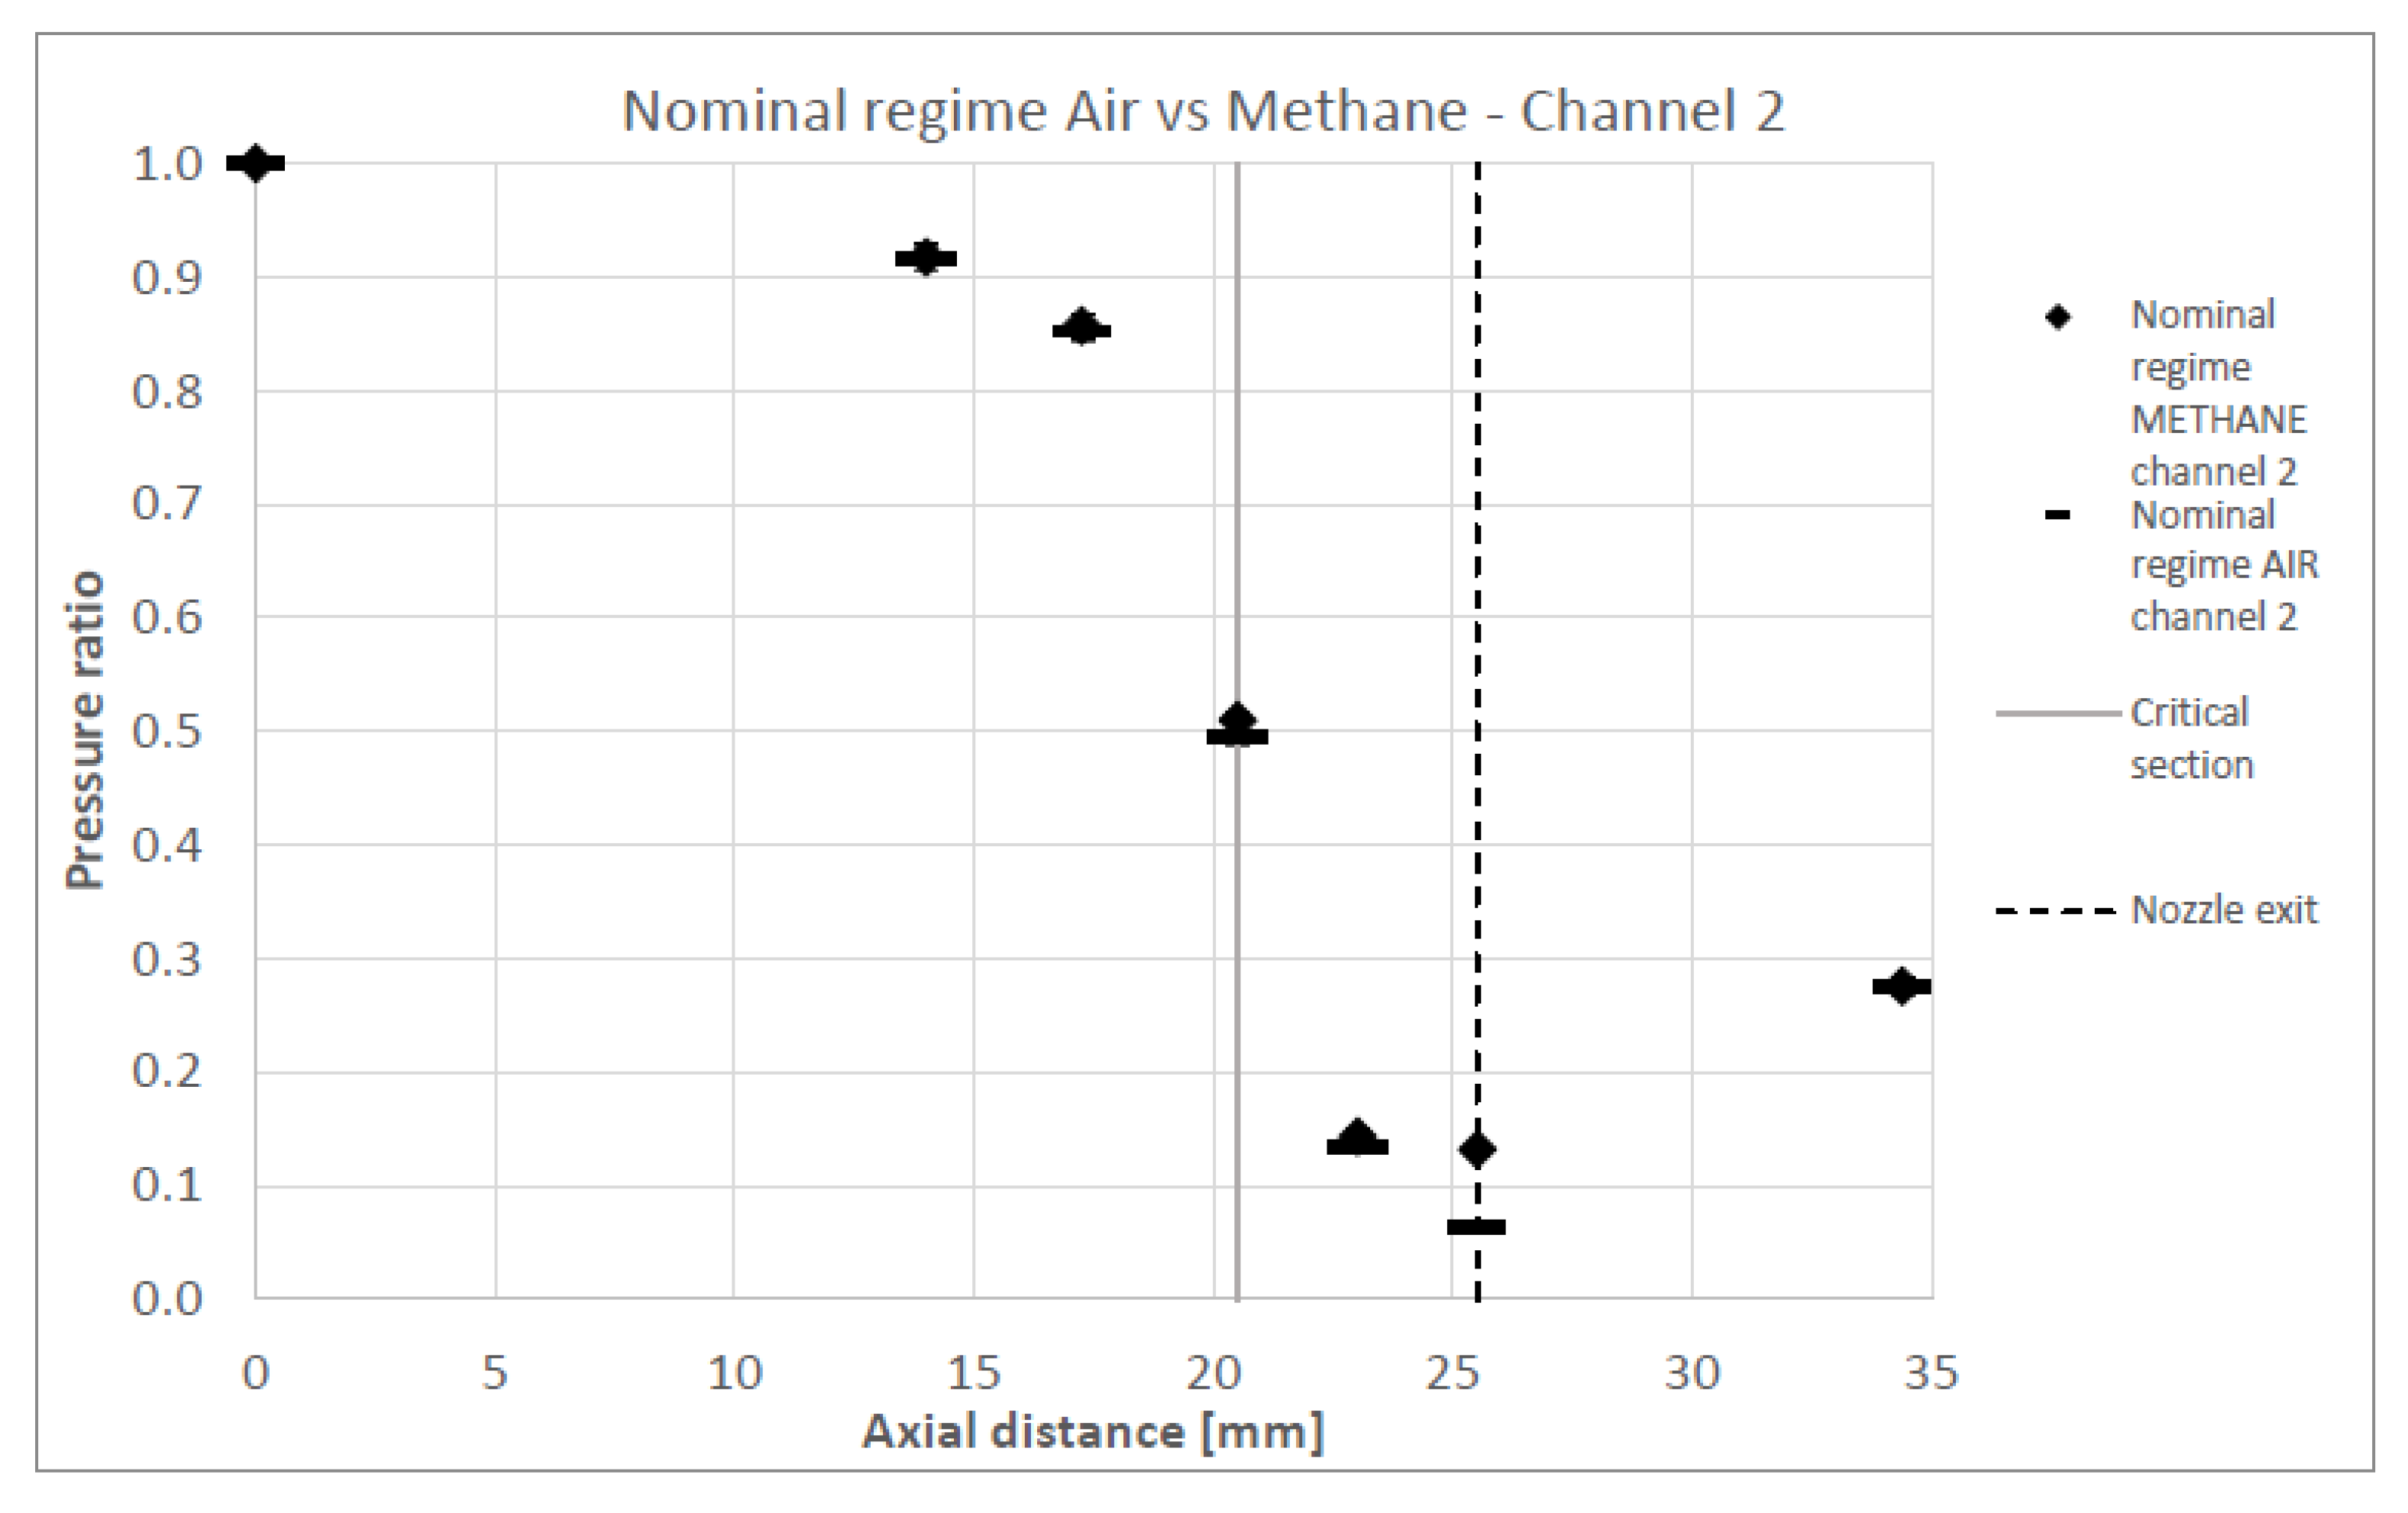
The primary objective is to compare the experimental data obtained at the nominal operating regime using methane with that obtained using air, for both flow channels, in order to validate the turbine performance estimation method and its predicted performance values. This comparison is illustrated in Figure 12 for flow channel 1 and in Figure 13 for flow channel 2.
The results indicate that, for both fluids, the flow accelerates through the convergent section of the stator, reaching sonic conditions at the throat. It then continues to accelerate through the divergent section, extending to the nozzle exit. Downstream of the nozzle, a significant rise in static pressure is observed, indicating the presence of a shock wave beyond the nozzle exit. The experimental data for methane and air show very close agreement, with differences falling within the measurement uncertainty for most data points in both channels, except at the nozzle exit of channel 2.
Discrepancies between the two channels may be attributed to manufacturing tolerances or to variations induced by the influence of adjacent walls, which are not perfectly periodic and could affect local flow conditions.
The experimental results represented in Figure 12 and Figure 13 confirm that the methodology used for preserving the flow characteristics when the working fluid changes gives good results for the assessed inlet parameters.
Comparing the nominal regime flow parameters, the differences between the measured values and the theoretic values for air are negligible (as seen in Table 7).
There is a slight difference in mass flow rate between the theoretic mass flow rate for air and the mass flow rate obtained during the tests, but is under 0.5%. Similarly, there is a difference between the mass flow rate computed using the Mach similarity criterion for methane and the mass flow rate obtained on the test rig. As expected, the error is a bit higher for methane, where the Mach similarity criterion applied for changing the working fluid induces additional approximations. However, this error is below 10%. This difference is seen in the reduced mass flow rate values as well.
By applying the formula demonstrated in Section 2.3, in Equation (11) it is possible to analytically compute the corresponding mass flow rate on methane (fluid b in the formula) based on the air (fluid a in the formula) flow parameters. For the similarity parameter to be invariant, as defined by Equation (11), using the total pressure and temperature at the turbine inlet measured values for methane and air for each of the 6 equivalent tested regimes, the methane mass flow rate can be analytically computed. The turbine inlet Mach number of the absolute velocity is estimated to a value of 0.3. This leads to
M ˙ g , b = M ˙ g , a p b p a k a R s p , a T a k b R s p , b T b 1 + k a 1 2 M c 2 k a + 1 2 k a 1 1 + k b 1 2 M c 2 k b + 1 2 k b 1
Considering the air properties, Rsp,a = 287 J/kg·K and ka = 1.4 and methane, Rsp,b = 518 J/kg·K and kb = 1.32, this leads to an equivalent mass flow rate for methane based on the air values. Table 8 compares the experimental values of the methane mass flow rate to the values computed based on the method described in Section 2.3 starting from air flow parameters. Here, for validation purposes, and comparing the measured values of the mass flow rate with the analytically computed ones, the measured values for the pressure on methane are used. When using the method in practice, without experimental data, the pressure and temperature values can be chosen and the rotational speed and mass flow rate computed or the other way around.
The results show that the developed analytical equations can quickly estimate the mass flow rate of a known turbine when using a new fluid (methane), with completely different properties, such as gas constant, based on the known values for a base fluid (air). For all measured regimes, the values are below 7%.

4.3. Total Pressure Losses

Good agreement between experimental results and numerical results for air at a subsonic and at nominal regime has been shown in [24]. CFD data was obtained using Ansys CFX for the nominal regime for air ideal gas. The k-ε turbulence model was used and the total pressure and total temperature at the inlet and the mass flow rate at the outlet were used as boundary conditions. The computations were conducted on a 2D theoretic model and, therefore, it does not account for manufacturing tolerances and endwall losses. The mesh has approximately 250,000 elements, including a boundary layer around the blade’s walls through inflation settings.
It was also shown there that the total pressure probe at the outlet of the stator was positioned immediately downstream of the shock wave. This shows that the total pressure measurement at that location includes the shock wave losses. This is visible in Figure 14, where the Mach number distribution from the numerical results for the nominal regime on air is given. The measurement points equivalent to the one represented in Figure 4 are represented by black dots in Figure 14.
To estimate the performances of the vane row, a comparison of the measured pressure losses is given in Table 9. The initial estimation of the losses was used in the preliminary design of the nozzle and was based on literature data and experience. The pressure losses measured for air are larger with 2.9% and for methane are with 8.9% lower than the initial estimation. The difference between the measured pressure losses between the methane and air test cases is 6%.
Although these results show a good initial estimation and a difference below 10% for the expected value of the pressure losses when changing the working fluid, some observations must be made. Firstly, these values cannot be used as a comparison metric on their own because the nominal regime was measured for slightly different inlet pressures for methane as compared to air. Secondly, the total pressure at the outlet of the nozzle is measured in a single point, immediately downstream of the shockwave, in a region where there are considerable variations in the flow parameters for very small distances. For a better estimation of the losses, rather than a punctual measurement, more measurement points should be included in the experimental setup in future work. At the same time, increasing the data acquisition frequency for the total pressure measurement is required to capture the shock wave fluctuations.
Since the method heavily relies on ideal gas assumptions, real gas effects are neglected and the regime needs to be assessed accordingly. Furthermore the impact of the higher temperature and potentially the impact of combustion is neglected here as well.

5. Conclusions

This study presents the experimental validation of an analytical methodology for estimating supersonic turbine performance under variations in working fluid. A Mach-similarity-based approach was successfully applied to a stationary two-dimensional stator rig, demonstrating the feasibility of predicting turbine performance across fluids. The test campaign, conducted with both air and methane, covered the nominal operating regime of a 100 kg payload micro-launcher turbopump as well as a broad range of flow conditions, from subsonic to fully supersonic.
The results confirm that measured total pressure losses for air and methane align well with preliminary design estimates, differing by less than 10%. Pressure distributions along the nozzle also showed excellent agreement, within measurement uncertainty, thereby validating the Mach similarity criterion for fluids with comparable thermodynamic properties. Furthermore, the analytical equations developed in this work provide rapid estimates of mass flow rate: methane values could be predicted from air data within 7% of experimental results across all tested regimes.
These findings establish a practical tool for rapidly predicting turbine performance under fluid substitution. Unlike most prior studies, which have relied primarily on numerical data or limited turbine data at larger scales, this work provides experimental evidence at the micro-launcher turbopump scale on air and methane, thereby establishing a novel and application-oriented validation of Mach-similarity principles.
Such a method is particularly relevant in the transition toward environmentally sustainable propulsion systems, offering applications in hardware repurposing, digital twin development, and mission flexibility. By enabling fast screening of alternative working fluids without hardware redesign, the methodology reduces costs, accelerates development, and supports safe and efficient operation of future green launchers. A concrete example of potential applications is the need to transition to reusable, green launchers, for which a predictive model can quickly assess turbine feasibility with different propellants or fuel-rich mixtures. It is also important in mission flexibility, where fuel composition or mixture ratio may vary.

6. Limitations and Future Work

The present study was limited to stator-only experiments, without a rotor stage or direct power measurements. While this configuration enabled controlled validation of Mach similarity in the nozzle flow, it cannot capture full turbine performance under rotating conditions.
Tests were also performed at ambient temperature, which does not replicate the thermal environment of actual turbopump operation. In addition, methane tests were conducted at slightly reduced inlet pressure, which complicates direct comparison with air. The total pressure losses analysis relied on a single-point pressure measurement downstream of the shockwave, restricting spatial resolution.
Beyond the validation results, the novelty of this work lies in providing the first experimental evidence of Mach-similarity applicability for supersonic turbine stators at the micro-launcher scale. Unlike most prior studies, which are limited either to numerical assessments or to larger-scale turbomachinery, this study demonstrates experimentally that accurate performance predictions can be achieved when switching between fluids as different as air and methane. The choice of methane is particularly significant in the context of emerging green micro-launchers, where propellant flexibility and environmental considerations are becoming central to launcher design.
A second novel contribution is the demonstration that Mach-similarity principles remain valid even at very small scales, where manufacturing tolerances, viscous effects, and boundary layer thickness typically challenge similarity assumptions. By combining detailed stator measurements with a fast analytical framework, the study shows that multi-fluid adaptability can be assessed without the need for extensive CFD or repeated experimental campaigns. This creates a practical pathway for future turbopump development, enabling rapid evaluation of alternative working fluids and increasing the sustainability and flexibility of next-generation launch systems.
Future research should extend this validation to full rotating turbines under representative operating conditions to confirm overall efficiency and power predictions. Semi-empirical models could be developed using the current experimental data to further refine the analytical framework. Moreover, applying the methodology to additional fluids and to other internal flow components would broaden its utility, particularly in contexts where Mach similarity and fluid substitution can deliver both performance and sustainability benefits.

Author Contributions

Conceptualization, C.F.C. and V.A.V.; methodology, C.F.C. and C.P.S.; software, C.F.C.; validation, C.F.C., C.P.S. and E.G.P.; formal analysis, C.F.C. and E.G.P.; investigation, C.P.S.; resources, V.A.V.; data curation, C.F.C. and E.G.P.; writing—original draft preparation, C.F.C.; writing—review and editing, E.G.P.; visualization, C.F.C.; supervision, V.A.V.; project administration, C.F.C.; funding acquisition, C.F.C. All authors have read and agreed to the published version of the manuscript.

Funding

This research was funded by the European Space Agency (ESA), under the VERT—Working fluid versatile turbine design methodology project, contract No. 4000121305/17/NL/CBi.

Data Availability Statement

Data is contained within the article.

Conflicts of Interest

The authors declare no conflicts of interest. The funders had no role in the design of the study; in the collection, analyses, or interpretation of data; in the writing of the manuscript; or in the decision to publish the results.

Abbreviations

The following abbreviations are used in this manuscript:
Uppercase
AArea (constant for same turbine geometry)
CAbsolute velocity
CFDComputational Fluid Dynamics
DDiameter
HARelated to hole angle
HERelated to hole edge sharpness
HDRelated to hole dimension
LVRelated to LabView data saving precision
MMach number
M ˙ g Mass flow rate
NRotational speed
ORCOrganic Rankine Cycle
PPower
PSRelated to the pressure scanner accuracy
PXPosition of the static pressure measurement
RGas constant
ReReynolds number
TTemperature
UTransport velocity
Lowercase
aSpeed of sound
atmatmospheric
hSpecific enthalpy
kHeat capacity ratio
pPressure
prpressure ratio
redreduced
sCO2supercritical carbon dioxide
Greek
ΔVariation
δVariation
εError
Subscripts
1–10Corresponding location of the wall pressure taps or flow regime
aNominal fluid
absAbsolute
bSecond, different fluid
cOf the absolute velocity
iInlet
oOutlet
redReduced
spSpecific
uOf the transport velocity/tangential component
wOf the relative velocity
Superscripts
Total

References

  1. European Space Agency. Unveiling Technologies for Future Launch Vehicles. Available online: https://www.esa.int/Enabling_Support/Space_Transportation/New_Technologies/FLPP_preparing_for_Europe_s_next-generation_launcher (accessed on 1 September 2021).
  2. SpaceWorks Commercial. 2018 Nano/Microsatellite Market Forecast, 8th ed.; SpaceWorks: Atlanta, GA, USA, 2018. [Google Scholar]
  3. NASA. The MarCO Mission Comes to an End. Jet Propulsion Laboratory. Available online: https://www.jpl.nasa.gov/news/the-marco-mission-comes-to-an-end/ (accessed on 4 September 2025).
  4. Inatani, Y.; Ohtsuka, H. SS-520 Nano Satellite Launcher and Its Flight Result. In Proceedings of the 32nd Annual AIAA/USU Conference on Small Satellites, Logan, UT, USA, 4–9 August 2018. [Google Scholar]
  5. Niederstrasser, C. Small Launch Vehicles—A 2018 State of the Industry Survey. In Proceedings of the 32nd Annual AIAA/USU Conference on Small Satellites, Logan, UT, USA, 4–9 August 2018; Available online: https://digitalcommons.usu.edu/smallsat/2018/all2018/306/ (accessed on 1 September 2025).
  6. Niederstrasser, C. Small Launchers in a Pandemic World—2021 Edition of the Annual Industry Survey. In Proceedings of the 35th Annual AIAA/USU Conference on Small Satellites, Logan, UT, USA, 7–12 August 2021; Available online: https://digitalcommons.usu.edu/smallsat/2021/all2021/162/ (accessed on 1 September 2025).
  7. Niederstrasser, C. A Comparison of the Technological Maturation of SmallSat Propulsion Systems from 2018 to 2020. In Proceedings of the 35th Annual AIAA/USU Conference on Small Satellites, Logan, UT, USA, 7–12 August 2021; Available online: https://digitalcommons.usu.edu/smallsat/2021/all2021/211/ (accessed on 1 September 2025).
  8. Sutton, G.P.; Biblarz, O. Rocket Propulsion Elements, 7th ed.; John Wiley & Sons: New York, NY, USA, 2001. [Google Scholar]
  9. Çakır, B.; Saracoglu, B. Mitigation of Turbine Vane Shock Waves Through Trailing Edge Cooling. In Proceedings of the 5th International Conference of Engineering Against Failure (ICEAF-V 2018), Chios, Greece, 20–22 June 2018; MATEC Web of Conferences. Volume 188, p. 04014. [Google Scholar] [CrossRef]
  10. Cuciumita, C.; Paschereit, C.O. Numerical Performance Assessment of a Turbine Blade Row Operating under Pulsed Detonation Combustion Inlet Conditions. In Proceedings of the ASME Turbo Expo 2019: Turbomachinery Technical Conference and Exposition, Phoenix, AZ, USA, 17–21 June 2019. [Google Scholar] [CrossRef]
  11. Doyle, S. History of Liquid Rocket Engine Development in the United States 1955–1980; AAS History Series; American Astronautical Society: San Diego, CA, USA, 1992; Volume 13, ISBN 0-97703-349-8. [Google Scholar]
  12. Kawatsu, K.; Tani, N.; Shimagaki, M.; Uchiumi, M.; Yamanishi, N. Multi-Objective Optimization of a Supersonic Axial Turbine Blade Row Shape for a Rocket Engine Turbopump. In Proceedings of the 47th AIAA/ASME/SAE/ASEE Joint Propulsion Conference & Exhibit, San Diego, CA, USA, 31 July–3 August 2011. [Google Scholar]
  13. Aghaeitog, R.; Tousi, A. Experimental and Numerical Investigation of Design Optimization of a Partial Admitted Supersonic Turbine. Propuls. Power Res. 2013, 2, 70–83. [Google Scholar] [CrossRef]
  14. Sanghera, B.; Anand, N.; Souverein, L.; Penin, L.; Pini, M. Adjoint-Based Optimisation of Rocket Engine Turbine Blades. In Proceedings of the ASME Turbo Expo 2021: Turbomachinery Technical Conference and Exposition, Virtual, 7–11 June 2021. [Google Scholar] [CrossRef]
  15. Mårtensson, H.; Andersson, S.; Trollheden, S.; Brodin, S. Rocket Engines: Turbomachinery; RTO-EN-AVT-150; VOLVO Aero Corporation: Trollhättan, Sweden, 2008. [Google Scholar]
  16. Guardone, A.; Colonna, P.; Pini, M.; Spinelli, A. Nonideal Compressible Fluid Dynamics of Dense Vapors and Supercritical Fluids. Annu. Rev. Fluid Mech. 2024, 56, 241–269. [Google Scholar] [CrossRef]
  17. Conti, C.C.; Spinelli, A.; Guardone, A. Similarity Parameters for Non-Ideal One-Dimensional Isentropic Expansions. In Proceedings of the 3rd International Seminar on Non-Ideal Compressible Fluid Dynamics for Propulsion and Power, Delft, The Netherlands, 29–30 October 2020; De Servi, C., Pini, M., Spinelli, A., di Mare, F., Guardone, A., Eds.; Springer: Cham, Switzerland, 2021; pp. 26–35. [Google Scholar]
  18. Conti, C.C.; Fusetti, A.; Spinelli, A.; Guardone, A. Shock Loss Measurements in Non-Ideal Supersonic Flows of Organic Vapors. Exp. Fluids 2022, 63, 11711. [Google Scholar] [CrossRef] [PubMed]
  19. Tosto, F.; Giuffré, A.; Colonna, P.; Pini, M. Flow Deviation and Critical Choking in Transonic Turbine Cascades Operating with Non-Ideal Compressible Flows. J. Glob. Propul. Power Soc. 2022, 6, 181–199. [Google Scholar] [CrossRef]
  20. Lui, H.F.S.; Ricciardi, T.R.; Wolf, W.R.; Braun, J.; Rahbari, I.; Paniagua, G. Unsteadiness of Shock–Boundary Layer Interactions in a Mach 2.0 Supersonic Turbine Cascade. Phys. Rev. Fluids 2022, 7, 094602. [Google Scholar] [CrossRef]
  21. McNichols, E.O.; Juangphanich, P.; Hawke, M.S.; Shoemaker, E.J.; Poulson, M.J.; Brandt, M.E.; Bons, J.P. Flow Reconstruction in a Transonic Turbine Cascade Using Physics-Informed Neural Networks (PINNs). In Proceedings of the ASME Turbo Expo 2024: Turbomachinery Technical Conference and Exposition (GT2024-128885), London, UK, 24–28 June 2024. [Google Scholar]
  22. Moustapha, H.; Zelesky, M.F.; Baines, N.C.; Japikse, D. Axial and Radial Turbines; Concepts ETI, Inc.: White River Junction, VT, USA, 2003; ISBN 0-933283-12-0. [Google Scholar]
  23. Cuciumita, C.; Vilag, V. Design of a Working Fluid Versatile Supersonic Turbine for Micro Launchers. In Proceedings of the ASME Turbo Expo 2019: Turbomachinery Technical Conference and Exposition, Phoenix, AZ, USA, 17–21 June 2019. [Google Scholar] [CrossRef]
  24. Suciu, C.; Cuciumita, C.; Vilag, V.; Nicoara, R.; Gernoth, A. Experimental Validation of Supersonic Turbines for Launcher Applications. In Proceedings of the Space Propulsion SP2020+1 Conference, 7th ed., Virtual, 17–19 March 2021. [Google Scholar]
  25. ASRO (Asociația de Standardizare din România). SR EN ISO 5167-1:2022; Measurement of Fluid Flow by Means of Pressure Differential Devices Inserted in Circular Cross-Section Conduits Running Full—Part 1: General Principles and Requirements; ASRO: Bucharest, Romania, 2022; Available online: https://magazin.asro.ro/en/standard/278841 (accessed on 28 September 2025).
  26. Rayle, R.E., Jr. An Investigation of the Influence of Orifice Geometry on Static Pressure Measurements. Master’s Thesis, Massachusetts Institute of Technology, Cambridge, MA, USA, 1949. [Google Scholar]
  27. Arts, T.; Boerrigter, H.L.; Buchlin, J.M.; Carbonaro, M.; Degrez, G.; Dénos, R.; Fletcher, D.; Olivari, D.; Riethmuller, M.L.; Van den Braembussche, R.A. Measurement Techniques in Fluid Dynamics: An Introduction, 3rd ed.; von Karman Institute for Fluid Dynamics: Rhode-Saint-Genèse, Belgium, 2009. [Google Scholar]
Figure 1. Geometry design and dimensions for the (a) stator blade, (b) rotor blade.
Aerospace 12 00887 g001
Figure 2. Flowchart of the turbine design methodology showcasing the steps and iteration loops.
Aerospace 12 00887 g002
Figure 3. (a) Fluid domain 2D model, (b) planar experimental model.
Aerospace 12 00887 g003
Figure 4. Static pressure and 5-hole probe measurement points location inside the two flow channels.
Aerospace 12 00887 g004
Figure 5. (a) Wall pressure holes and pressure taps mounted on the instrumentation lid (b) montage system for the 5-hole probe to ensure no pressure leakage.
Aerospace 12 00887 g005
Figure 6. Experimental model with instrumentation lid, pressure taps and 5-hole probe mounted: (a) 3D CAD model and (b) physical model picture.
Aerospace 12 00887 g006
Figure 7. Test rig diagram showcasing the positioning of the experimental model, the air/methane gas supply, and the pressure regulator and vanes used for controlling the flow regime.
Aerospace 12 00887 g007
Figure 8. Static pressure measurement line, from the experimental model pressure hole to the data aquisition.
Aerospace 12 00887 g008
Figure 9. Post-processing example showing the selection of representative flow regimes, defined as intervals >10 s with outlet pressure variation <0.1 bar, averaged over 100 mid-interval data points.
Aerospace 12 00887 g009
Figure 10. Pressure variation experimental data along the vane flow channel 1 for methane for a full range of regimes, including: Subsonic isentropic flow, Shockwave inside the nozzle, Shockwave outside of the nozzle, Supersonic isentropic flow.
Aerospace 12 00887 g010
Figure 11. Pressure variation along the vane flow channel 1 for methane and air for a full range of regimes, including: Subsonic isentropic flow, Shockwave inside the nozzle, Shockwave outside of the nozzle, Supersonic isentropic flow.
Aerospace 12 00887 g011
Figure 12. Pressure variation along the vane flow channel 1 for methane and air at nominal regime, showing good similarity match.
Aerospace 12 00887 g012
Figure 13. Pressure variation along the vane flow channel 2 for methane and air at nominal regime, showing good similarity match.
Aerospace 12 00887 g013
Figure 14. CFD Mach number distribution for nominal regime on air, with the location of the pressure measuring points over imposed.
Aerospace 12 00887 g014
Table 1. Turbine nominal regime parameters.
ParameterValueUnit of Measure
Power output24kW
Mass flow rate0.195kg/s
Total inlet pressure5bar
Total inlet temperature1000K
Table 2. Flow parameters for the equivalent operating regime.
Parameter and Unit of MeasureAirMethane
pin, [bar]54.5
Tin, [K]300300
Mg [kg/s]0.12950.0898
k [-]1.41.3042
Rsp [J/(kgK)]286.7518.4
Table 3. Static pressure measurement errors.
CauseObservationsValueSymbol
Pressure scannerAccuracy provided by the manufacturer±0.05% Full Scale
Full Scale = 51.71 bar
εps
LabVIEWData saving precision±0.001 barεLV
Hole angleProbe hole angle under 30°±0.3%εHA
Hole edgesProbe hole radius under ¼ ر0.2%εHE
Hole dimensionØ = 0.3 mm±0.05%εHD
Table 4. Theoretical pressure ratios value.
ParameterMethaneAir
Critical pressure ratio0.5450.528
Subsonic isentropic flow pressure ratio0.9590.958
Normal shock wave at the exit pressure ratio0.4630.449
Supersonic isentropic flow pressure ratio0.0780.069
Table 5. Test matrix flow parameters.
Flow RegimeMethaneAir M g , r e d  Relative
Diff. [%]
M g  [kg/s] p i n  [bar] T i n
[K]
M g , r e d
× 10−5
M g [kg/s] p i n [bar] T i n [K] M g , r e d
× 10−5
10.04904.495303.24.950.07575299.25.265.9
20.07174.522303.47.190.11055.002299.87.686.3
30.08264.497303.68.340.12624.913299.78.936.6
40.08304.498303.68.380.12784.958299.68.966.5
50.08224.460303.98.370.13005.035273.38.572.3
60.08354.487300.68.400.13014.999299.89.057.1
Table 6. Comparison of critical pressure ratios values.
Critical Pressure Ratio/FluidMethaneAirRelative Difference Methane-Air [%]
Theoretic0.5450.5283.12
Measured average0.45240.43463.95
Theoretic—measured average16.9917.69-
Regime 30.45970.4429-
Regime 40.44990.4328-
Regime 50.45000.4327-
Regime 60.45010.4299-
Max. relative difference average-regimes [%]−1.61−1.92-
Table 7. Comparison of the nominal regime flow parameters.
ParameterMethaneAir
TheoreticExp.Rel. Diff.TheoreticExpRel. Diff.
p i n [bar]4.54.4870.2954.9990.02
T i n [K]300300.6−0.20300299.80.07
M g [kg/s]0.08980.08357.020.12950.1301−0.46
M g , r e d × 10−598.406.6799.05−0.56
Table 8. Comparison of the experimental and analytical methane mass flow rate.
RegimeExperimental Mass Flow Rate
[kg/s]
Analytical Mass Flow Rate
[kg/s]
Relative Difference
[%]
10.08350.0891−6.7
20.08220.0879−6.9
30.08270.0886−7.0
40.08300.0884−6.6
50.08260.0881−6.7
60.07170.0762−6.3
Table 9. Pressure losses for methane vs. air at nominal regime.
Parameter Pressure   Losses   ( p i n     p ) / p i n   ×   100
Initial estimation28.8%
Methane experimental22.8%
Air Experimental31.7%
Methane—Air−6.0%
Methane—Estimated−8.9%
Air—Estimated2.9%
Disclaimer/Publisher’s Note: The statements, opinions and data contained in all publications are solely those of the individual author(s) and contributor(s) and not of MDPI and/or the editor(s). MDPI and/or the editor(s) disclaim responsibility for any injury to people or property resulting from any ideas, methods, instructions or products referred to in the content.