Article

Research on Quasi-One-Dimensional Ejector Model

Aerospace Technology Institute, China Aerodynamics Research and Development Center, Mianyang 621000, China
*
Author to whom correspondence should be addressed.
Aerospace 2025, 12(10), 882; https://doi.org/10.3390/aerospace12100882
Submission received: 8 July 2025 / Revised: 19 August 2025 / Accepted: 27 August 2025 / Published: 29 September 2025
(This article belongs to the Special Issue High Speed Aircraft and Engine Design)

Abstract

A new quasi-one-dimensional ejector model for the prediction of ejector performance is carried out, which is based on the theory of ideal gas expansion and free layer development. The model is proposed for calculation of the variable area bypass injector (VABI) and ejector nozzle in the variable cycle engine (VCE), both at the design point and off-design point. The internal structure of ejector nozzle is determined based on an analysis of the flow field of the 2D ejector nozzle Computational Fluid Dynamics (CFD) result. The flow during the expansion section is divided into three parts: primary flow, secondary flow, and mixed layer flow. Combined with the growth rate of mixing layer thickness, the calculation methods of ejector nozzle exit parameters under critical working conditions and blocking working conditions are given, and the calculated results demonstrate a strong consistency with CFD results, maintaining relative errors below 3%. This method is used to evaluate the ejector nozzle capacity quickly in the overall design stage, which provides theoretical support for the design of the main bypass system of a variable cycle engine.

1. Introduction

Wide-speed-range hypersonic flight represents a pivotal advancement direction for next-generation aerospace vehicles. To realize large-altitude-speed-domain operations spanning subsonic/transonic/supersonic regimes, aircraft propulsion systems are evolving toward an integrated hybrid propulsion architecture. Among these, high-Mach-number hybrid propulsion systems [1] incorporating variable-cycle turbine-based engines [2] demonstrate exceptional technical potential for overcoming velocity–thermal coupling challenges across divergent flight conditions.
The variable cycle engine (VCE) fundamentally differs from conventional jets in the utilization of variable geometry mechanisms to adjust overall cycle work points dynamically, enabling adaptation to diverse operational conditions while simultaneously accommodating both turbojet and turbofan cycle characteristics. As a representative adjustable geometric component in VCE, the ejector nozzle [3] significantly enhances wide-speed-range aerodynamic capability, with design variations critically influencing the overall operational efficiency of the engine.
Ejector nozzle refers to a component attached externally to the main nozzle of a jet engine, utilizing the ejector effect of the primary flow to induce bypass flow through an auxiliary annular sleeve of bleed openings. The operational principle of the ejector nozzle relies on the primary flow’s ejector capability during its ejection from the exit of the main nozzle, thereby driving the bypass secondary flow. At the throat section and divergent section, the secondary flow converges with the primary flow and then jointly expands downstream.
The ejector nozzle plays an important role in a jet engine. By regulating bypass flow parameters, the ejector nozzle can control the expansion of primary and secondary flows dynamically in the divergent section, ensuring near-complete expansion to enhance thrust while improving the propulsion system and matching performance across wide speed ranges. The exhaust flow temperature can be decreased through thermal dilution by the mixture of the primary flow and the flow induced by the ejector nozzle, which can enhance infrared stealth capability.
As early as the 1960s, the J-58 engine (Pratt & Whitney Group, Hartford, IN, USA) (Figure 1) loaded on the Lockheed SR-71 Blackbird aircraft (Lockheed Corporation, Bethesda, MD, USA) represented an early successful exploration of the VCE. Its terminal third valve was integrated with the exhaust nozzle to form an ejector system, enabling flow augmentation for exhaust matching during low-speed operation [4]. In the contemporary adaptive cycle engine (ACE) (Figure 2), the ejector nozzle utilizes a third bypass flow merged with a primary flow, effectively reducing exhaust noise and suppressing infrared signatures [5,6]. For the VCE, the terminal ejector nozzles employ cooler bypass flow to reduce the primary flow temperature, mitigating thermal loading on turbine blades and the afterburner while diminishing infrared radiation from engine nacelles and enhancing aircraft stealth capability.
The research on the ejector nozzle mainly focuses on three methodological domains: theoretical analysis based on a one-dimensional model [9,10,11,12,13,14,15], multi-dimensional coupled simulations [8,13], and numerical simulation and experimental validation [16,17,18,19,20,21,22,23]. Each of these approaches is specifically developed to address different hierarchical requirements within the design process. As a critical component for inlet–exhaust flow matching, the ejector nozzle’s performance directly impacts the accuracy of iterative design evaluations during the design phase of engine development. Ejector nozzle models are predominantly established based on inviscid isentropic flow assumptions, with tailored adjustments made to accommodate specific research objectives. The Lewis Research Center [24] developed a two-dimensional model combining method of characteristics with mixing region effects to quantify performance degradation caused by improper mixing region development. Francois Toulmay [9] compared three analytical methods, including a global one-dimensional method, a momentum integral method, and a two-dimensional finite difference scheme, for low-speed incompressible flow conditions. B. J. Huang [10] put forward a one-dimensional model based on the assumption of constant-pressure mixing in the constant-area section for predicting the performance of the ejector nozzle. He also claimed that with empirical coefficients, this one-dimensional model can predict performance reliably. S. K. Chou [11] developed a one-dimensional choked boundary analysis method for ejector nozzles with the constant-pressure mixing assumption above. Shan [12] established a semi-empirical one-dimensional incompressible ejector model, validating its reliability in predicting lobed forced mixer performance. Chen [13] proposed a one-dimensional method based on the assumption of sonic secondary flow at the nozzle exit, incorporating it into overall engine performance analysis methodologies. Luo [15] provided a one-dimensional ejector method for the performance perdition of a rocket-based combined cycle (RBCC) engine.
The aforementioned one-dimensional ejector nozzle model shares a common feature in treating the nozzle inner wall as adiabatic and frictionless walls, where friction losses and mixing losses in the real world are accounted for through correction coefficients. Nevertheless, their methods of modeling the mixing process between the main flow and the secondary flow vary. Constrained by computational limitations, these models primarily rely on mass, momentum, and energy conservation principles, which struggle to accurately describe the complex mixing-expansion process. There are two methods being adopted: The first method presumes that the primary and secondary flows completely mix at a constant-pressure process in a constant-area section prior to entering the divergent section. In the constant-area section, the equation for momentum conservation is set up, which divides the flow into the mixing stage, followed by the expansion stage. The second method ignores the dynamics of the mixing region, presuming that the shear layer thickness between the primary and secondary flow is zero. In this case, the mixing is modeled as the transfer of momentum and energy from the primary to the secondary flow, along with the mass being drawn from the secondary to the primary flow. The nozzle control volume’s coupled conservation equations (including mass, momentum, and energy) are solved numerically. Both methodologies exhibit inherent limitations. The first method mandates complete expansion prior to the divergent section. While this simplifies computational implementation, it requires either sufficient nozzle length to achieve uniform mixing or the incorporation of additional devices such as a lobe for forced mixing, both of which result in increasing structural weight requirements for engine integration. The second method oversimplifies mixing physics by ignoring shear layer dynamics, failing to capture the essential coupling between mixing and the expansion process.
To simultaneously account for the mixing and expansion process within the one-dimensional ejector nozzle model, additional parameters must be incorporated to characterize flow-field dynamics within the mixing region. The momentum integral method [9] provides a viable approach by integrating flow parameters across the mixing region, enabling two-dimensional flow representation without increasing model dimensionality. The mixing layer [25] formed between the primary and secondary flow constitutes a compressible shear flow (Figure 3), exhibiting both complex spatiotemporal evolution and inherent self-similarity. This self-similarity manifests as tangential parameter distributions at different development stages of the shear layer, providing a foundation for integral modeling. The thickness of the mixing region is determined by both the nozzle profile and the mixing layer growth rate, which is further influenced by the velocity contrast [25,26] and density ratio [27,28] across the mixing region, while also being affected by asymmetric entrainment effects [29] and compressibility-driven flow phenomena [30]. By incorporating these mixing layer characteristics into the three nozzle control volume conservation equations, one-dimensional models can effectively integrate the mixing and expansion process.
Building upon the aforementioned methodologies, this paper proposed an analytical framework integrating mixing and expansion processes to re-characterize the flow-field structure within ejector nozzles. Employing numerical simulation techniques, the investigation focuses on elucidating the flow mechanisms under off-design conditions. By incorporating mixing layer development theory, a novel quasi-one-dimensional ejector nozzle model is developed to enable rapid performance evaluation. Comparative analysis with numerical simulation results validates the model’s computational efficacy and reliability. Section 2 presents a comparison between the numerical calculation methods and experimental results; Section 3 introduces the thermodynamic calculation methods of the quasi-one-dimensional model and analyzes the flow-field mechanisms under off-design operating conditions; Section 4 validates the effectiveness and accuracy of the model using new ejector nozzle simulation results; and Section 5 concludes the study.

2. Numerical Method

2.1. Numerical Model and Method

To establish a quasi-one-dimensional ejector nozzle model and conduct effective validation of its computational results, a numerically simulated methodology that has been experimentally validated is used to compute the internal flow field of the ejector nozzle.
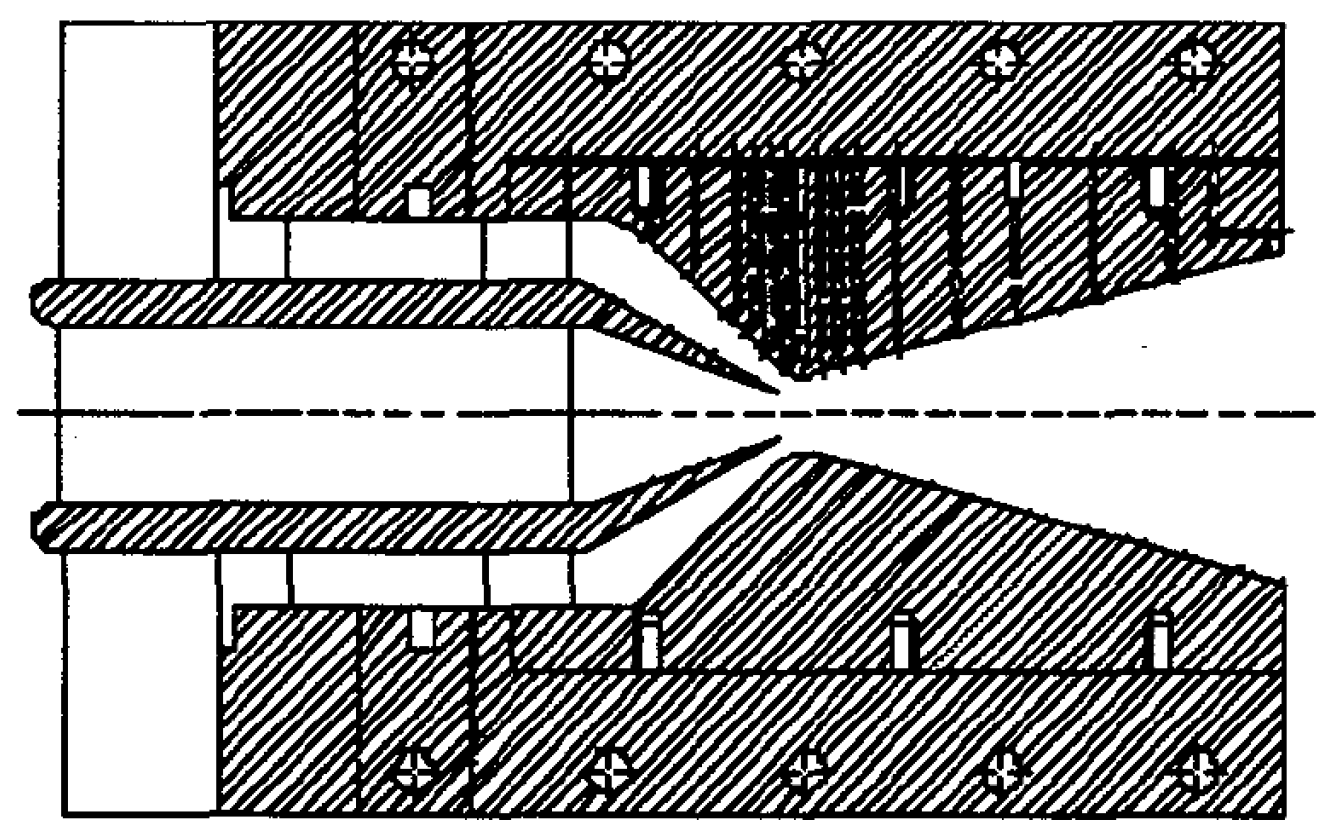
Figure 4 shows the cross-section of the test model of a two-dimensional convergent–divergent (2DCD) ejector nozzle [16]. The primary nozzle and the secondary nozzle were both convergent nozzles. The control valves in the bypass could be adjusted to change the mass flow ratio between the secondary flow mass and the primary flow mass. Based on the test model, a two-dimensional computational model was developed and meshed. Figure 5 shows the grid mesh of the computational model.
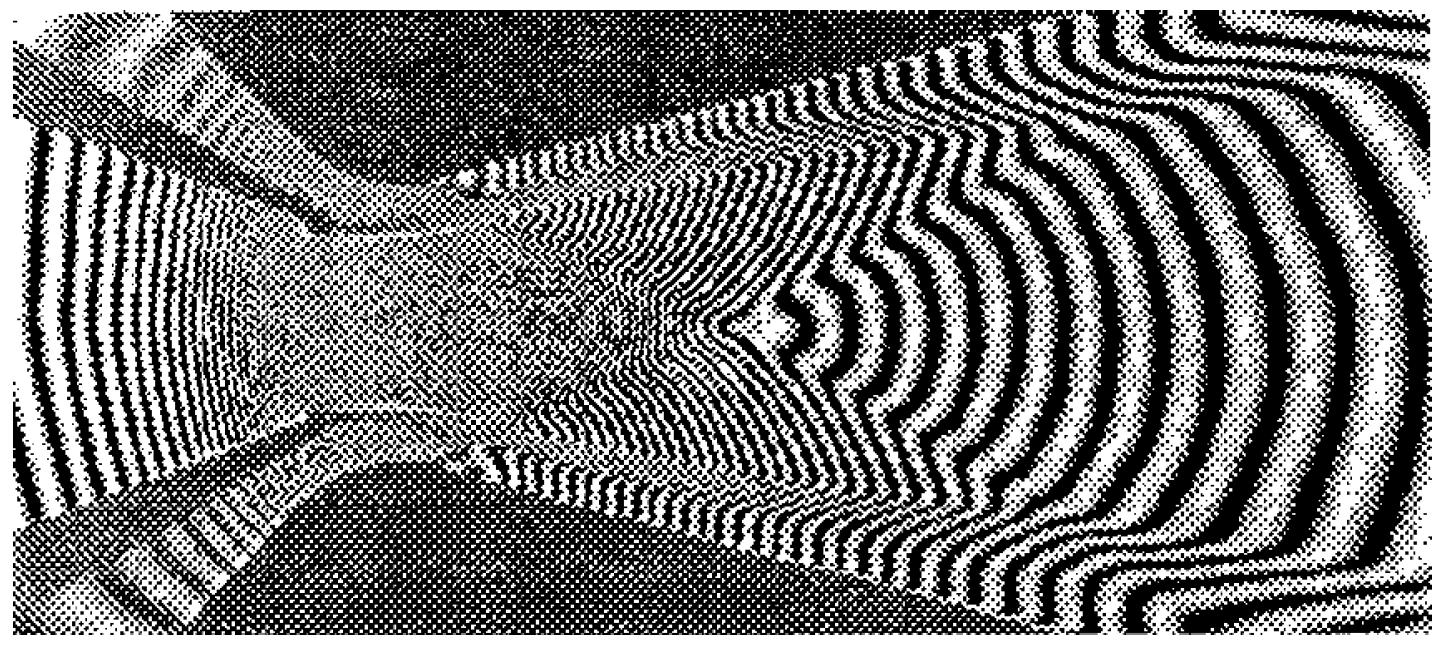
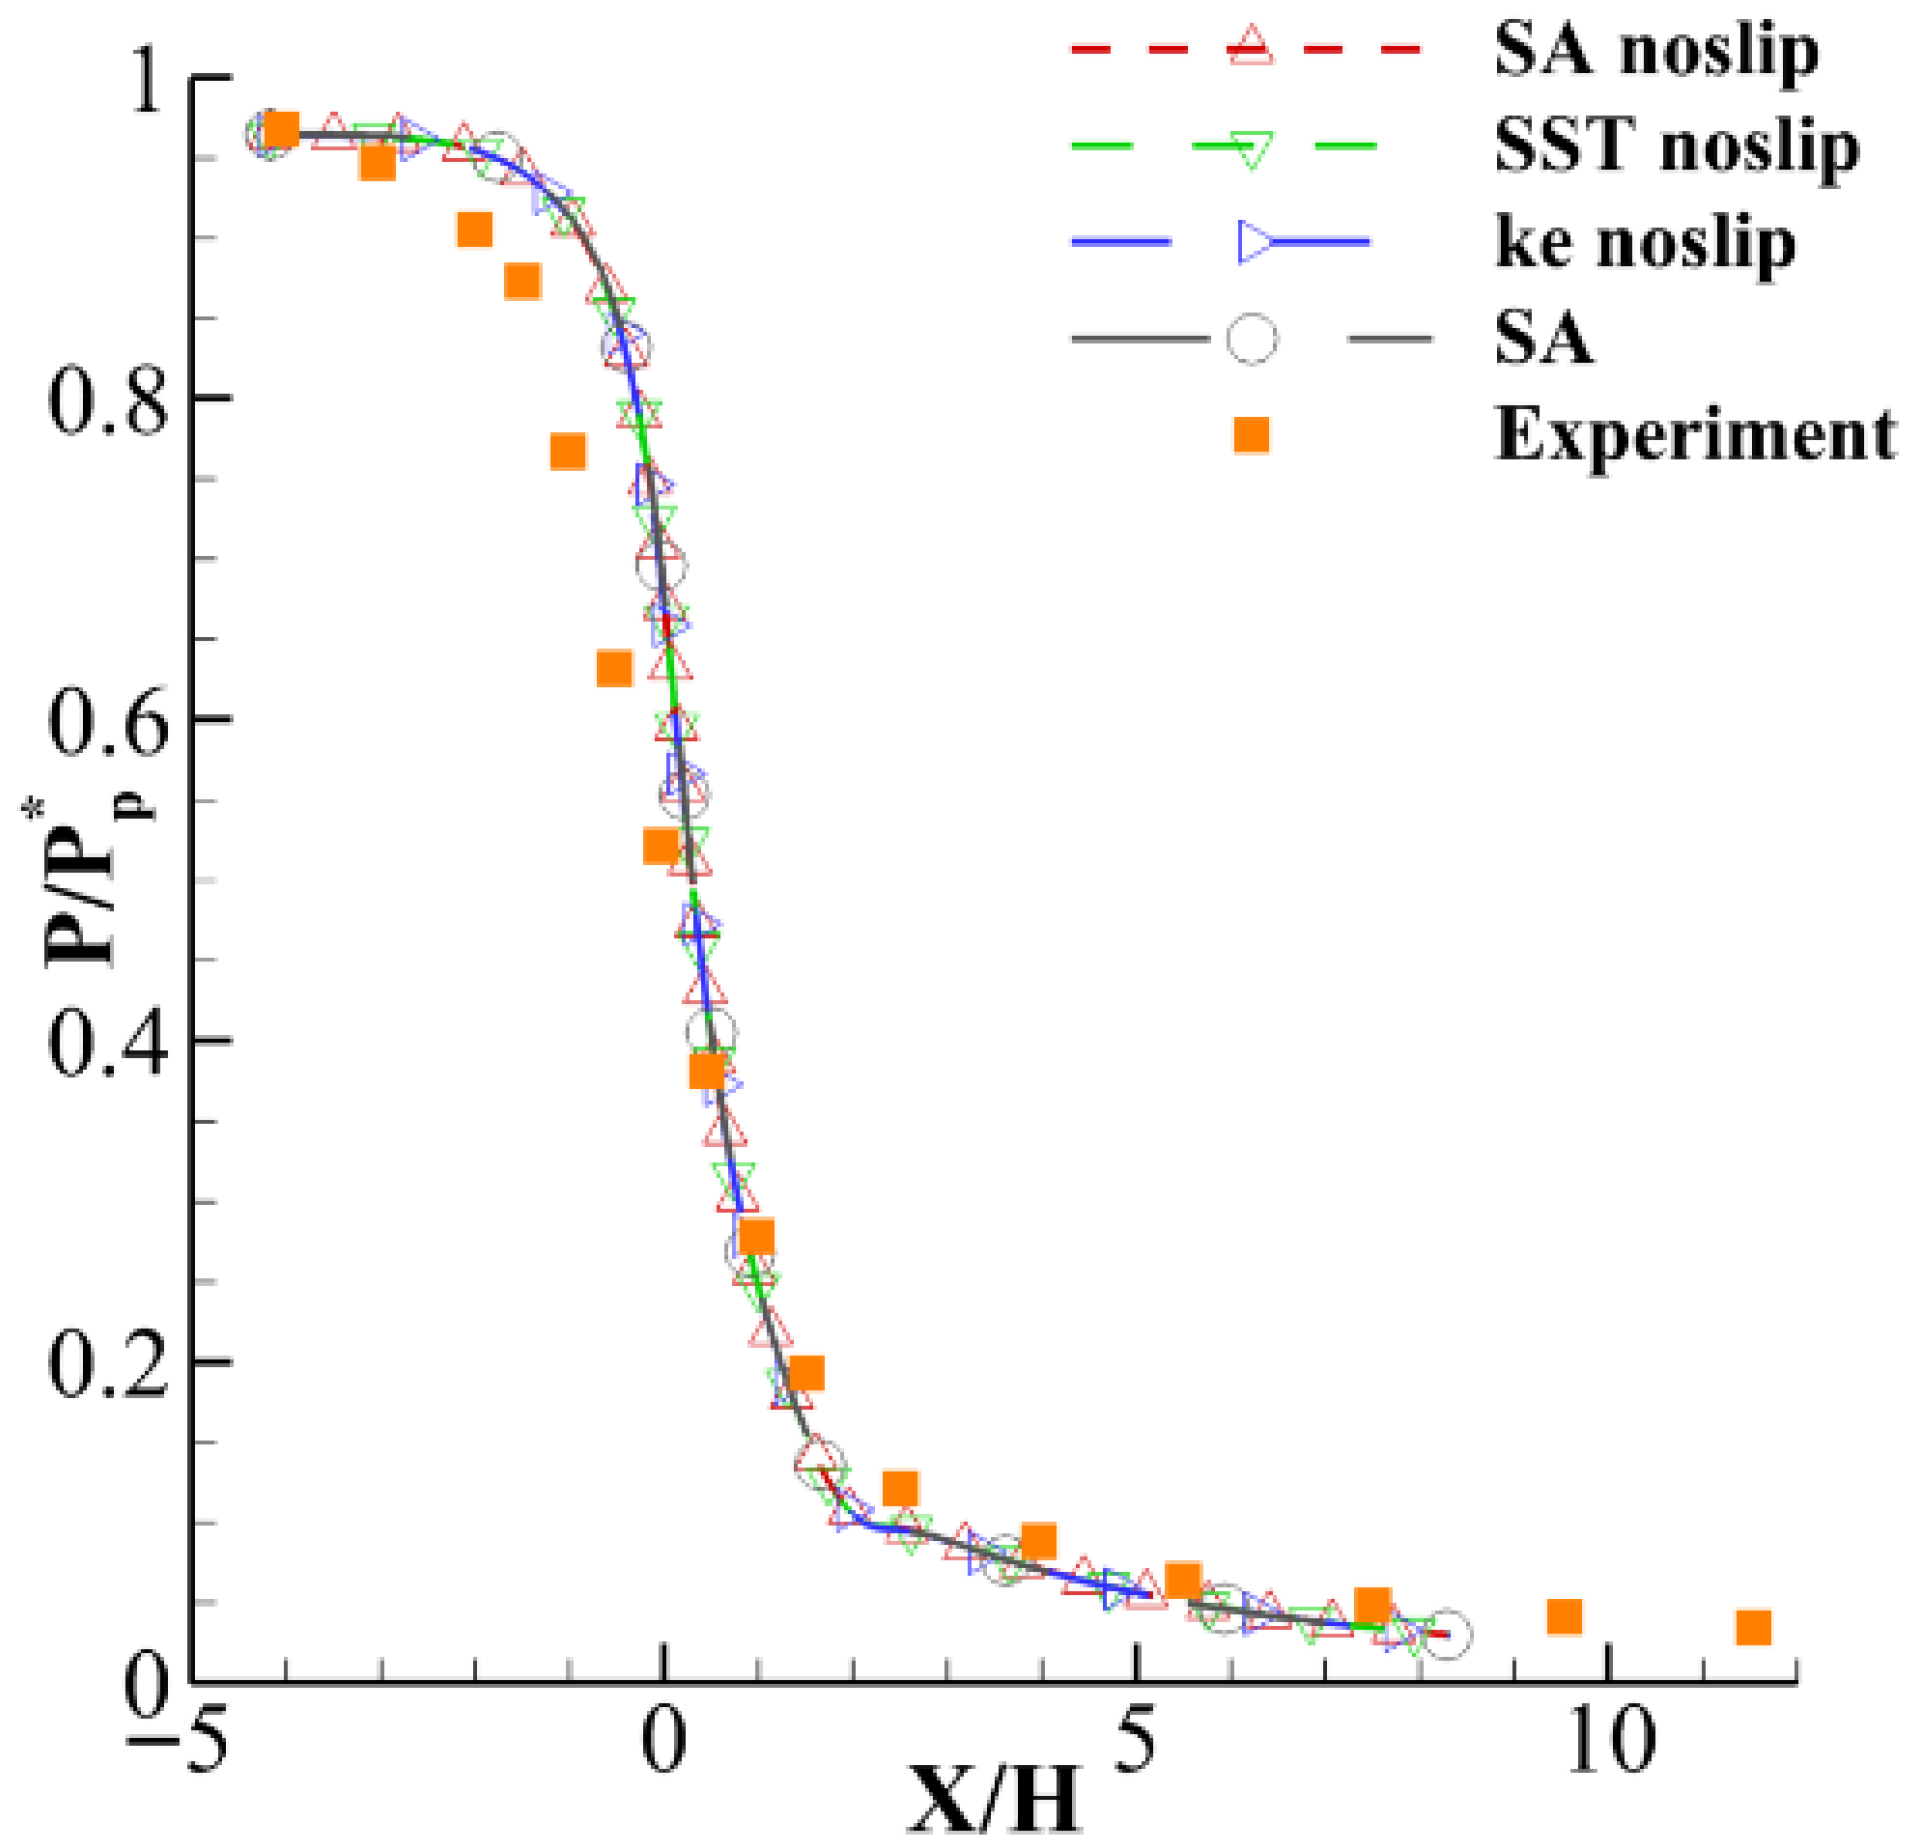
The computational model was simulated with NUMECA FINE v17.1 software and meshed with an IGG module with 150,430 nodes, where mesh encryption was applied in near-wall regions. The fluid was modeled as a real gas, and the Reynolds-Averaged Navier–Stokes (RANS) equations were solved. The discretization scheme was second-order upwind, and the global residual convergence was less than 10 6 . The test case with the total pressure ratio between the secondary flow and the primary flow of P s * / P p * = 0.55 was selected for numerical simulation and compared with the experiment results. Three turbulence models, Spalart–Allmaras (S-A), Shear Stress Transport (SST), and k ϵ , were implemented. The wall boundary conditions adopted no-slip constraints, with an additional slip wall condition under the SA model in contrast. Figure 6 shows the Mach–Zehnder interferometry test result, compared with the density contour distribution of numerical simulation results (Figure 7), which reveals that the computed flow structure aligns closely with experimental results. And there is negligible divergence among the three turbulence models. Wall boundary effects primarily manifested in the boundary layer regions. All computational cases in this section employed the S-A model with the unslip wall boundary.
Figure 8 shows the comparisons of the numerical and experimental results of the static pressure distribution on the centerline of the side wall of the ejector nozzle. The horizontal axis X / H is the ratio of horizontal coordinate x to throat height H (10 mm) [16], and the vertical axis P / P p * is the ratio of static pressure on the side wall to the total pressure of the primary flow. The computational outcomes of three turbulence models demonstrate strong agreement with the experimental measurements, while the wall boundary conditions exhibited negligible influence on the static pressure distribution within the main flow region.

2.2. Ejector Nozzle Flow Field

The conventional convergent–divergent nozzle exhibits four conditions under varying downstream backpressures: fully-expanded, over-expanded, under-expanded, and subcritical conditions. When an ejector structure is incorporated, the flow characteristics remain governed by backpressure effects, demonstrating analogous flow mode classifications. The design configuration of ejector nozzles typically adopts the critical flow condition with full expansion, where the exit static pressure equilibrates with ambient pressure while maintaining sonic velocity at the throat.

2.2.1. Flow-Field Structure

Figure 9 illustrates the fundamental flow structure under critical flow conditions in the ejector nozzle. The primary and secondary flow accelerate to sonic velocity near the throat and expand to supersonic speeds in the divergent section, exhibiting flow characteristics analogous to conventional convergent–divergent nozzles. After merging at the intersection region, the primary and secondary flows initiate a mixing process. Downstream, the flow field evolves into a coexisting three-region structure: primary flow region, mixing flow region, and secondary flow region. The black solid lines show the velocity profiles across flow section (excluding the boundary layer—displaying the primary, secondary, and mixing regions only) by using a dimensionless velocity V V s V p V s , where V means local velocity in the x section, while V p and V s mean denote velocities in the primary and secondary region. The tangential velocity distribution demonstrates uniformity in both the primary and secondary flows. The red dashed lines show the mixing region where primary–secondary flow interaction occurs.

2.2.2. Influence of Upstream Flow

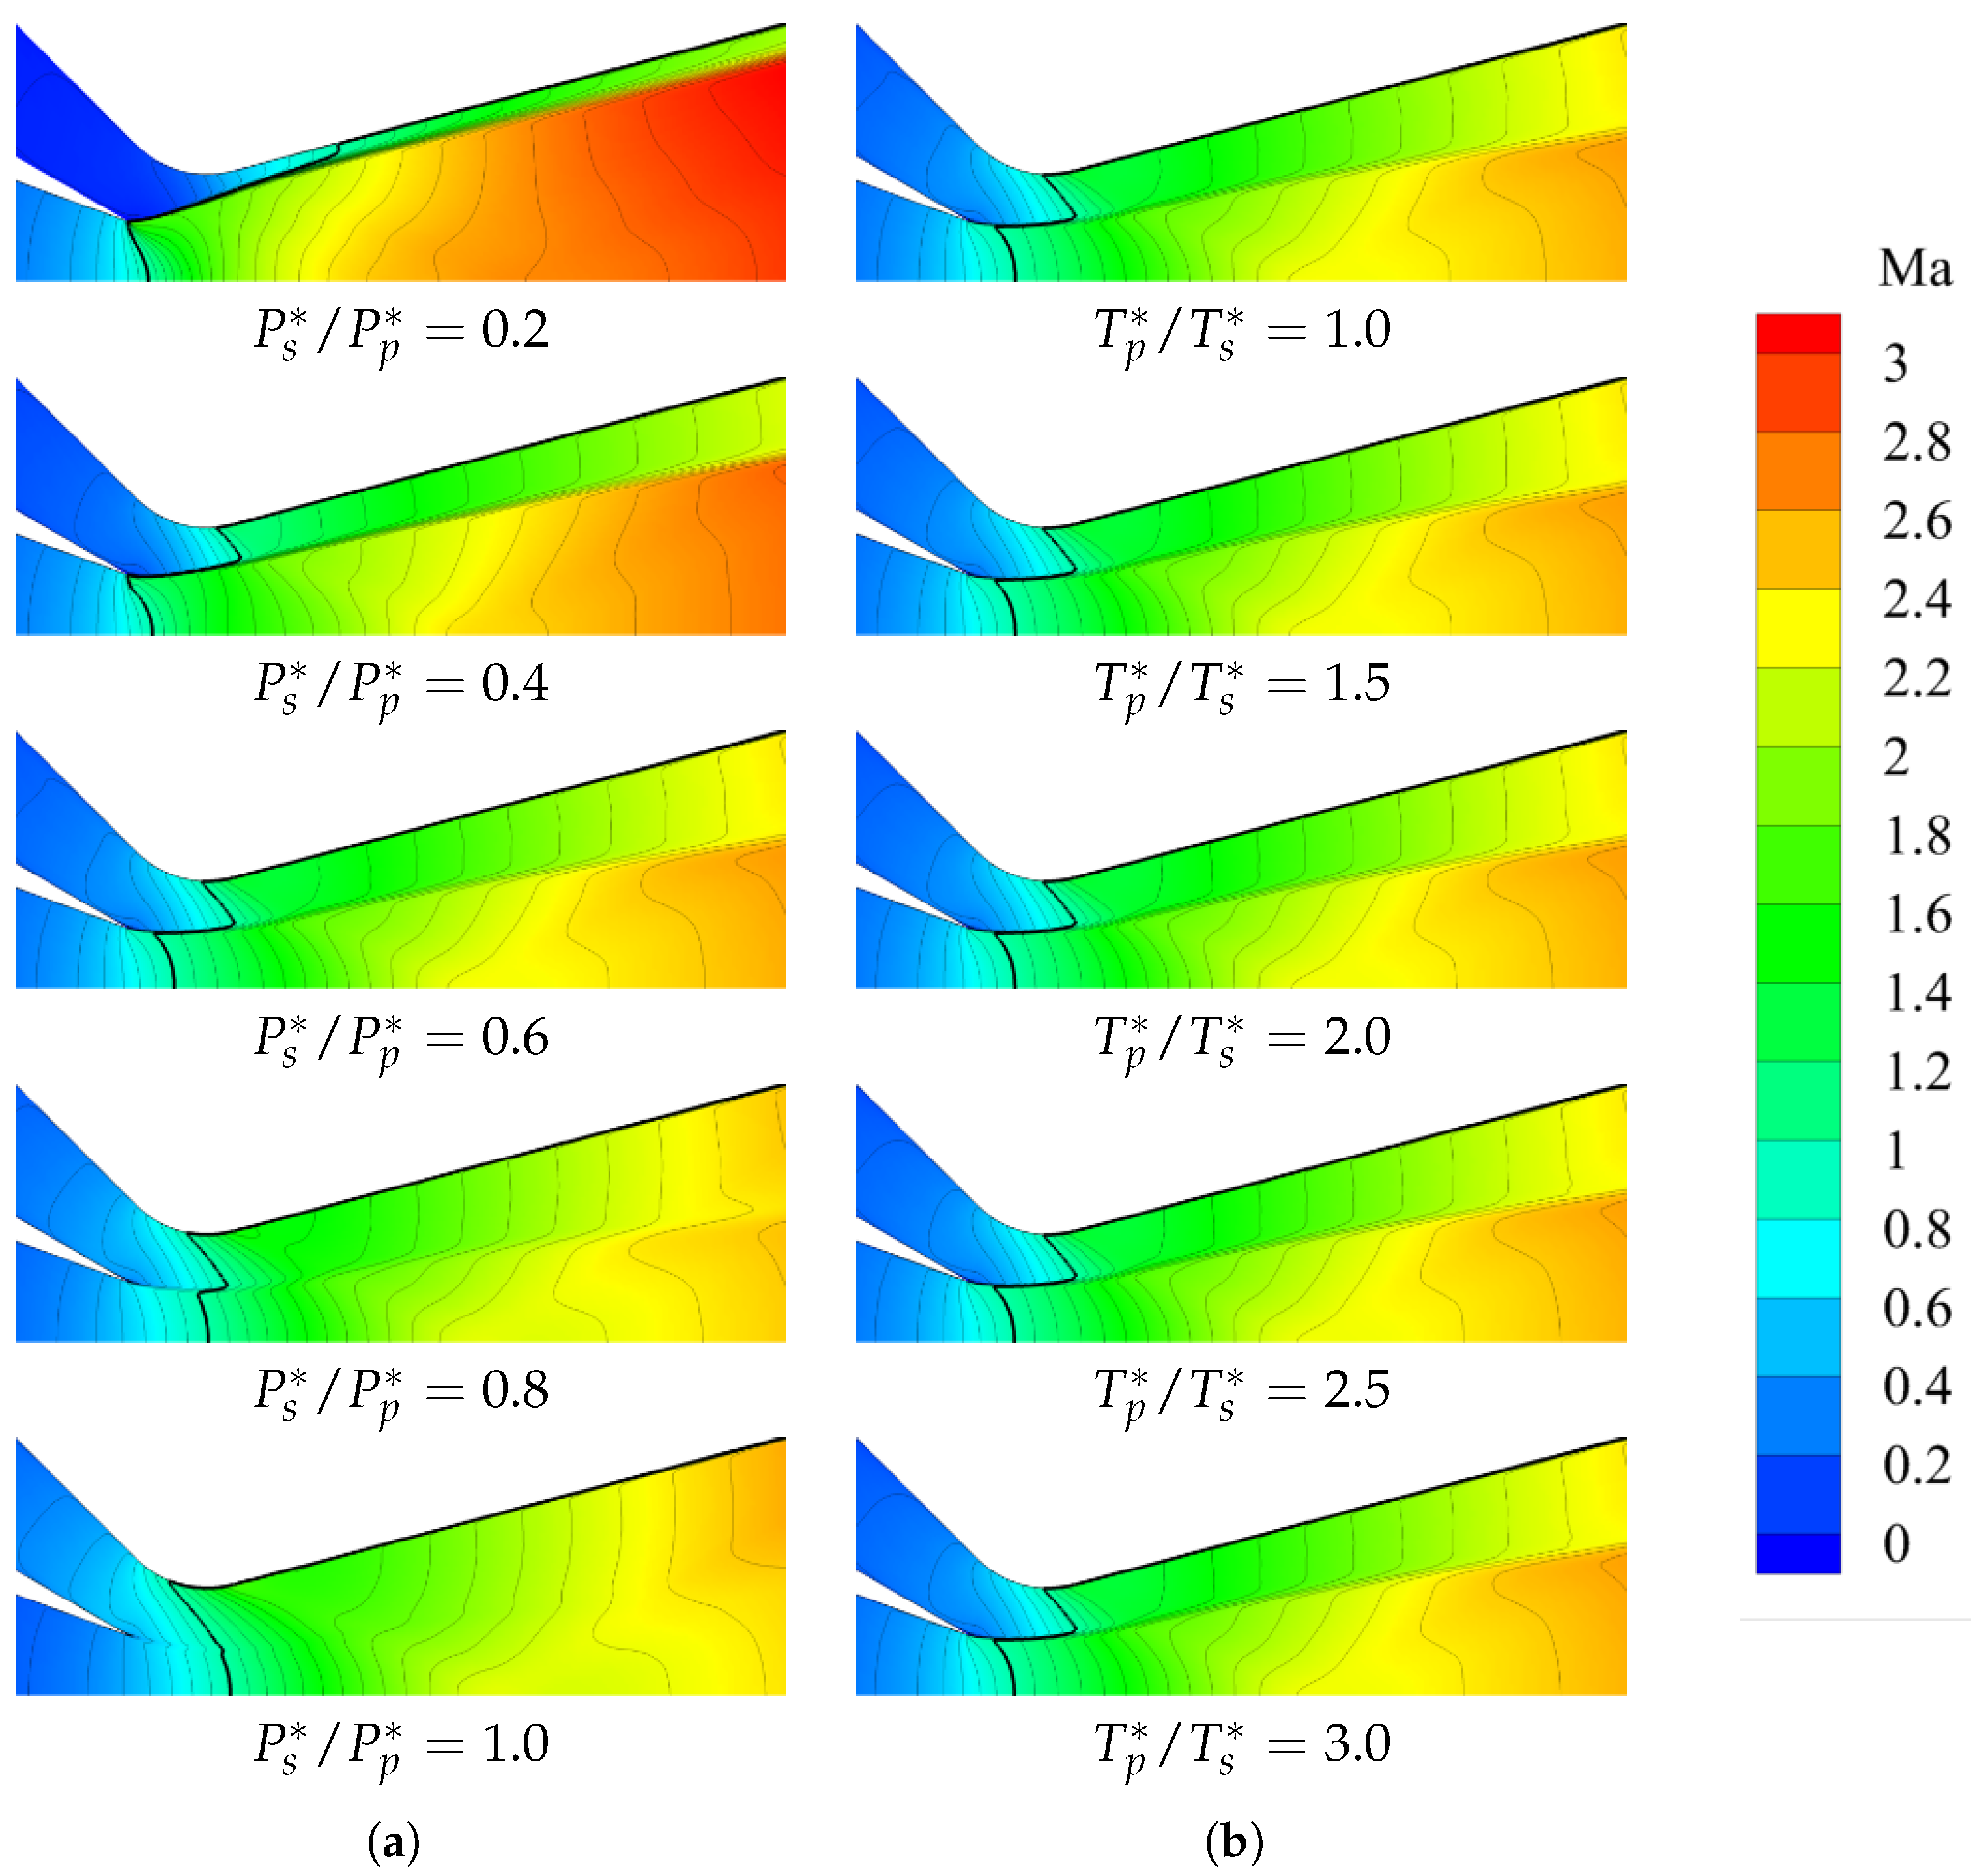
The critical flow structure primarily depends on upstream parameters of the primary and secondary flow when the ejector nozzle geometry is fixed. Figure 10 shows the Mach number contour of the critical flow in the ejector nozzle, and the sonic velocity line is marked with black lines. Figure 10a shows the fixed total temperature ratio of the primary and secondary flow ( T p * / T s * = 1 ) with varying total pressure ratios between the secondary and primary flow. When the primary and secondary total pressures are equal, there is no obvious boundary of the primary and secondary flow in the divergent section, with gradual parameter transitions across the flow direction. As the secondary total pressure decreases, a distinct mixing layer forms between the flows. Concurrently, the aerodynamic throat position diverges: the primary flow throat moves upstream, increasing the throat area and critical mass flow; the secondary flow throat moves downstream, reducing the throat area and critical mass flow. Figure 10b shows the fixed total pressure ratio between the secondary and primary flow ( P s * / P p * = 0.6 ) with varying total temperature ratios. When P s * / P p * remains constant, variations in the total temperature ratio exhibit a negligible impact on the flow field structures, as evidenced by the nearly identical Mach number contour distributions across different total temperature ratios.
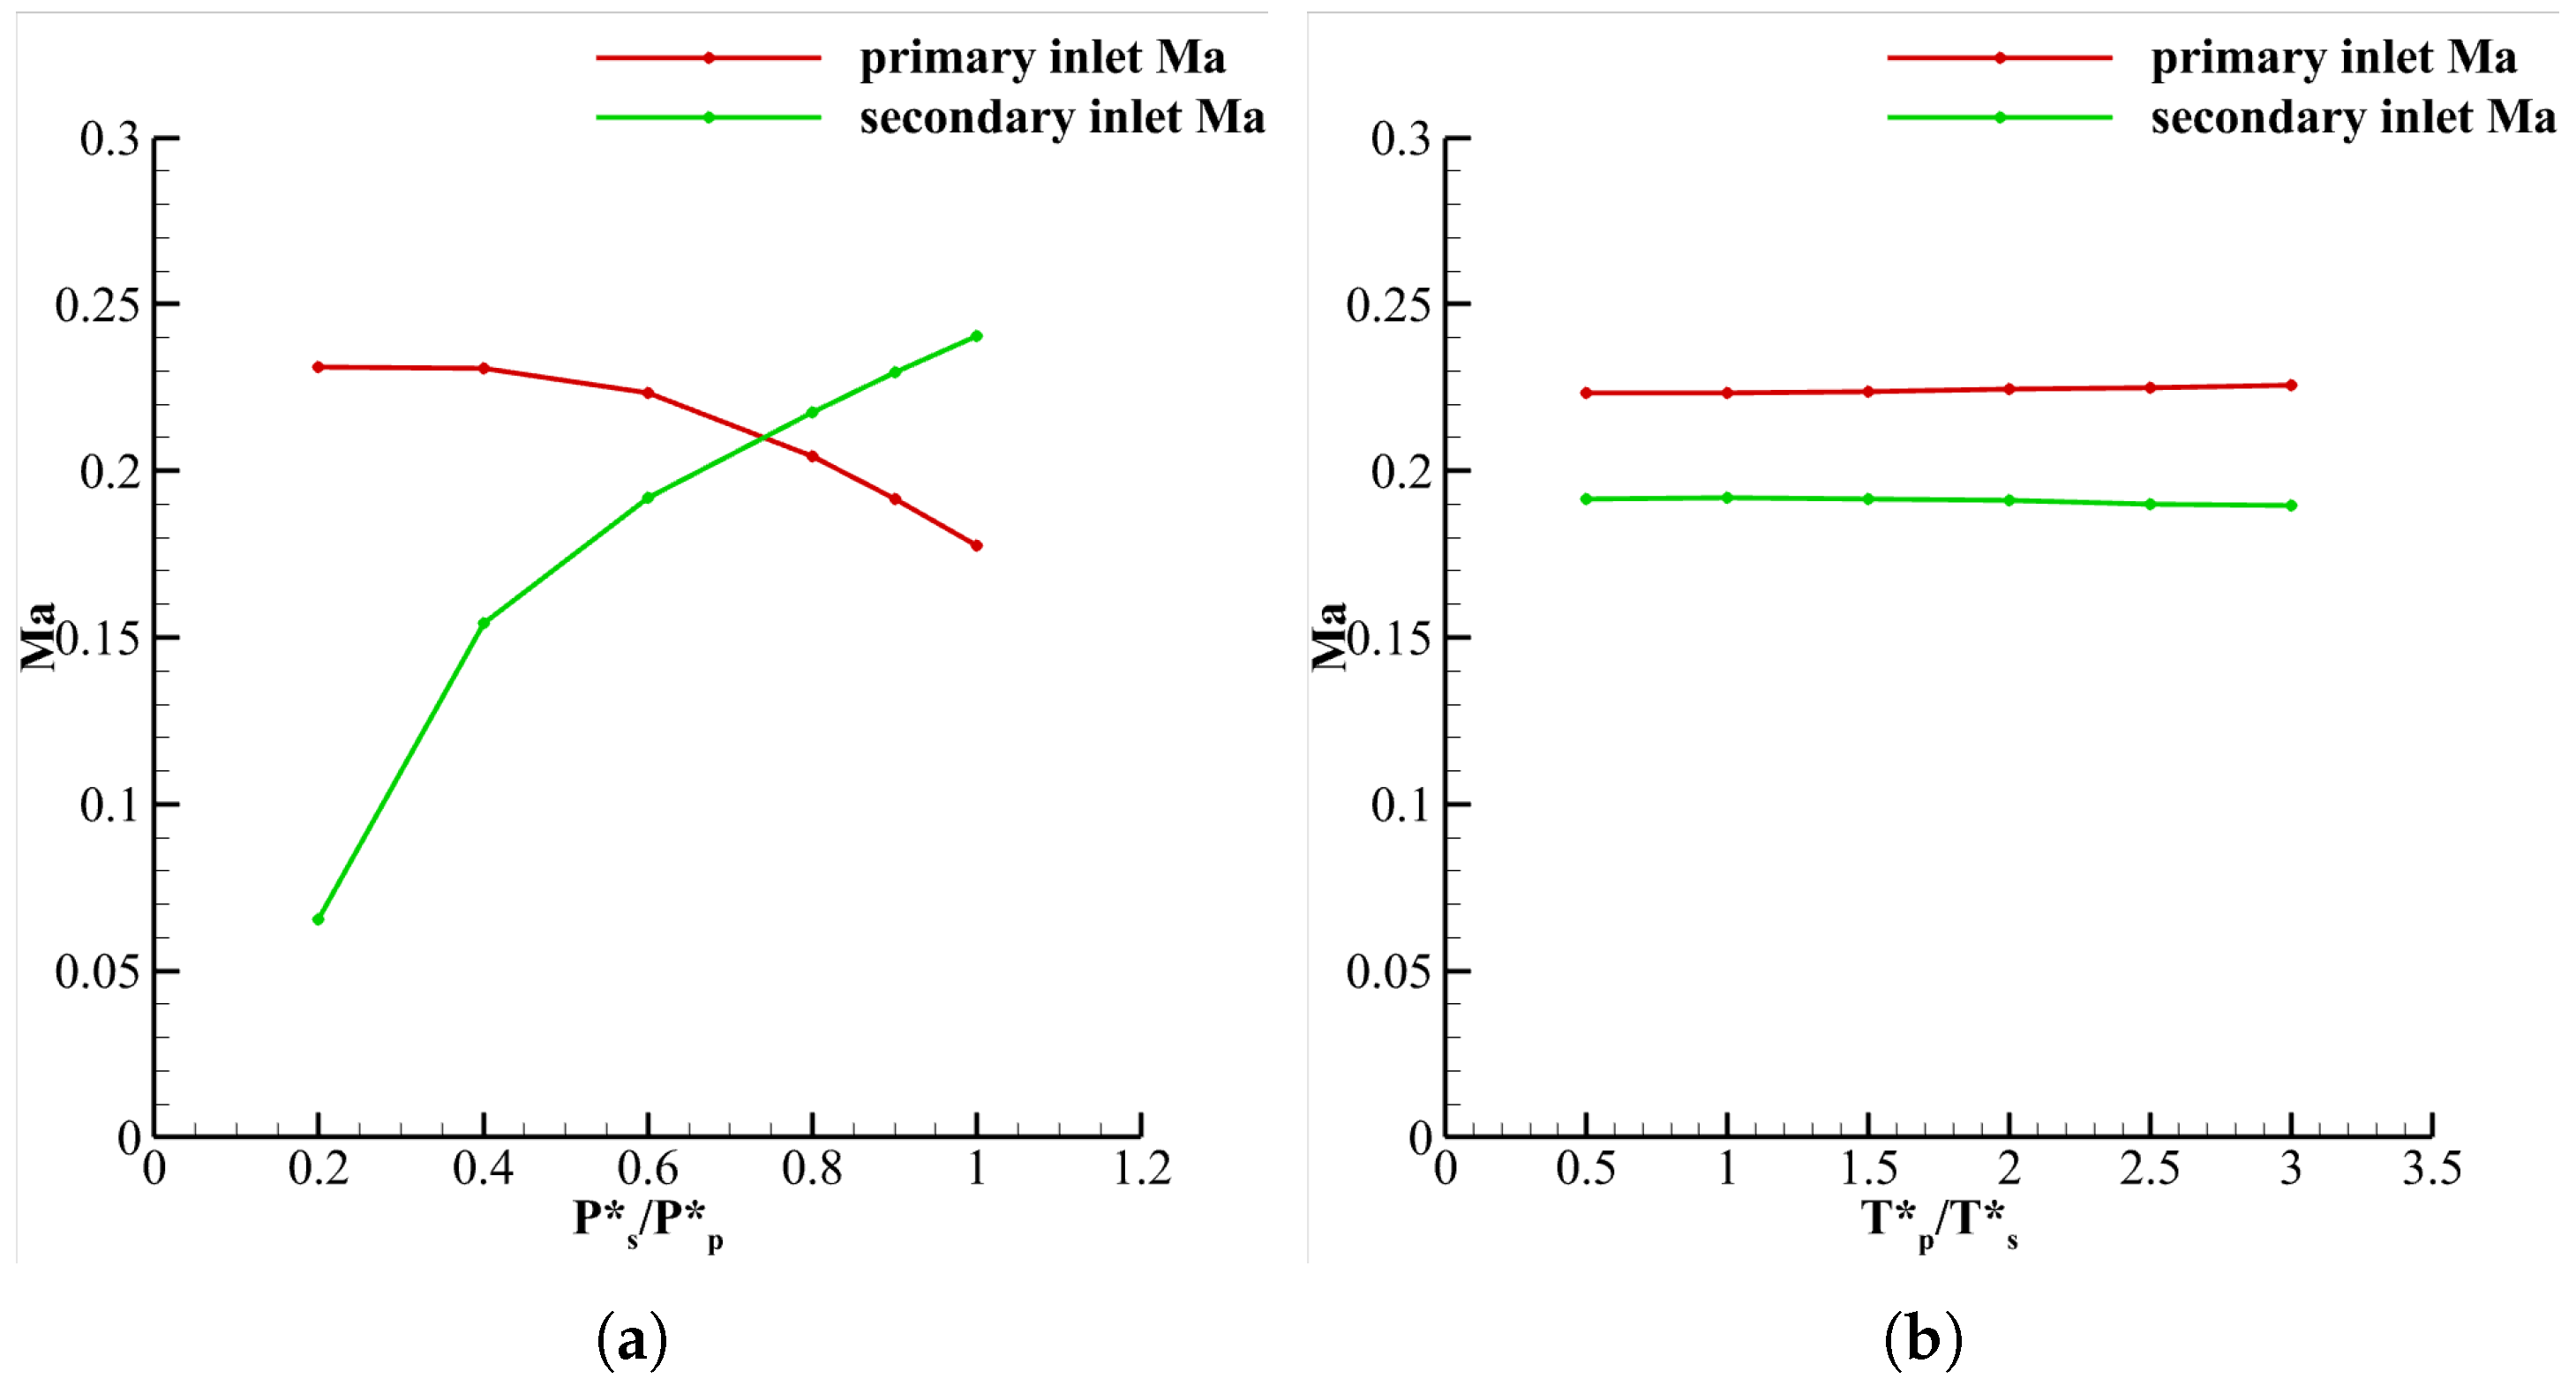
Figure 11 illustrates the inlet Mach number under different situations corresponding to Figure 10, while Figure 11a shows the upstream parameters with a fixed total temperature ratio but different total pressure ratios, and Figure 11b shows a fixed total pressure ratio but different total temperature ratios. The variation in the inlet Mach number trend exhibits consistency with the aerodynamic throat position changes, as indicated in Figure 10.

2.2.3. Parameter Distribution in Flow Field

Figure 12 shows the static pressure and temperature contour with P s * / P p * = 0.6 and T p * / T s * = 2 . The comparison shows that the static pressure distribution in the divergent section exhibits a more gradual and continuous variation, where the pressure contour (Figure 12a) becomes indistinguishable for identifying the mixing flow region. Conversely, distinct static temperature variations can be observed between the primary and secondary flow areas, enabling precise localization of the mixing layer interface.
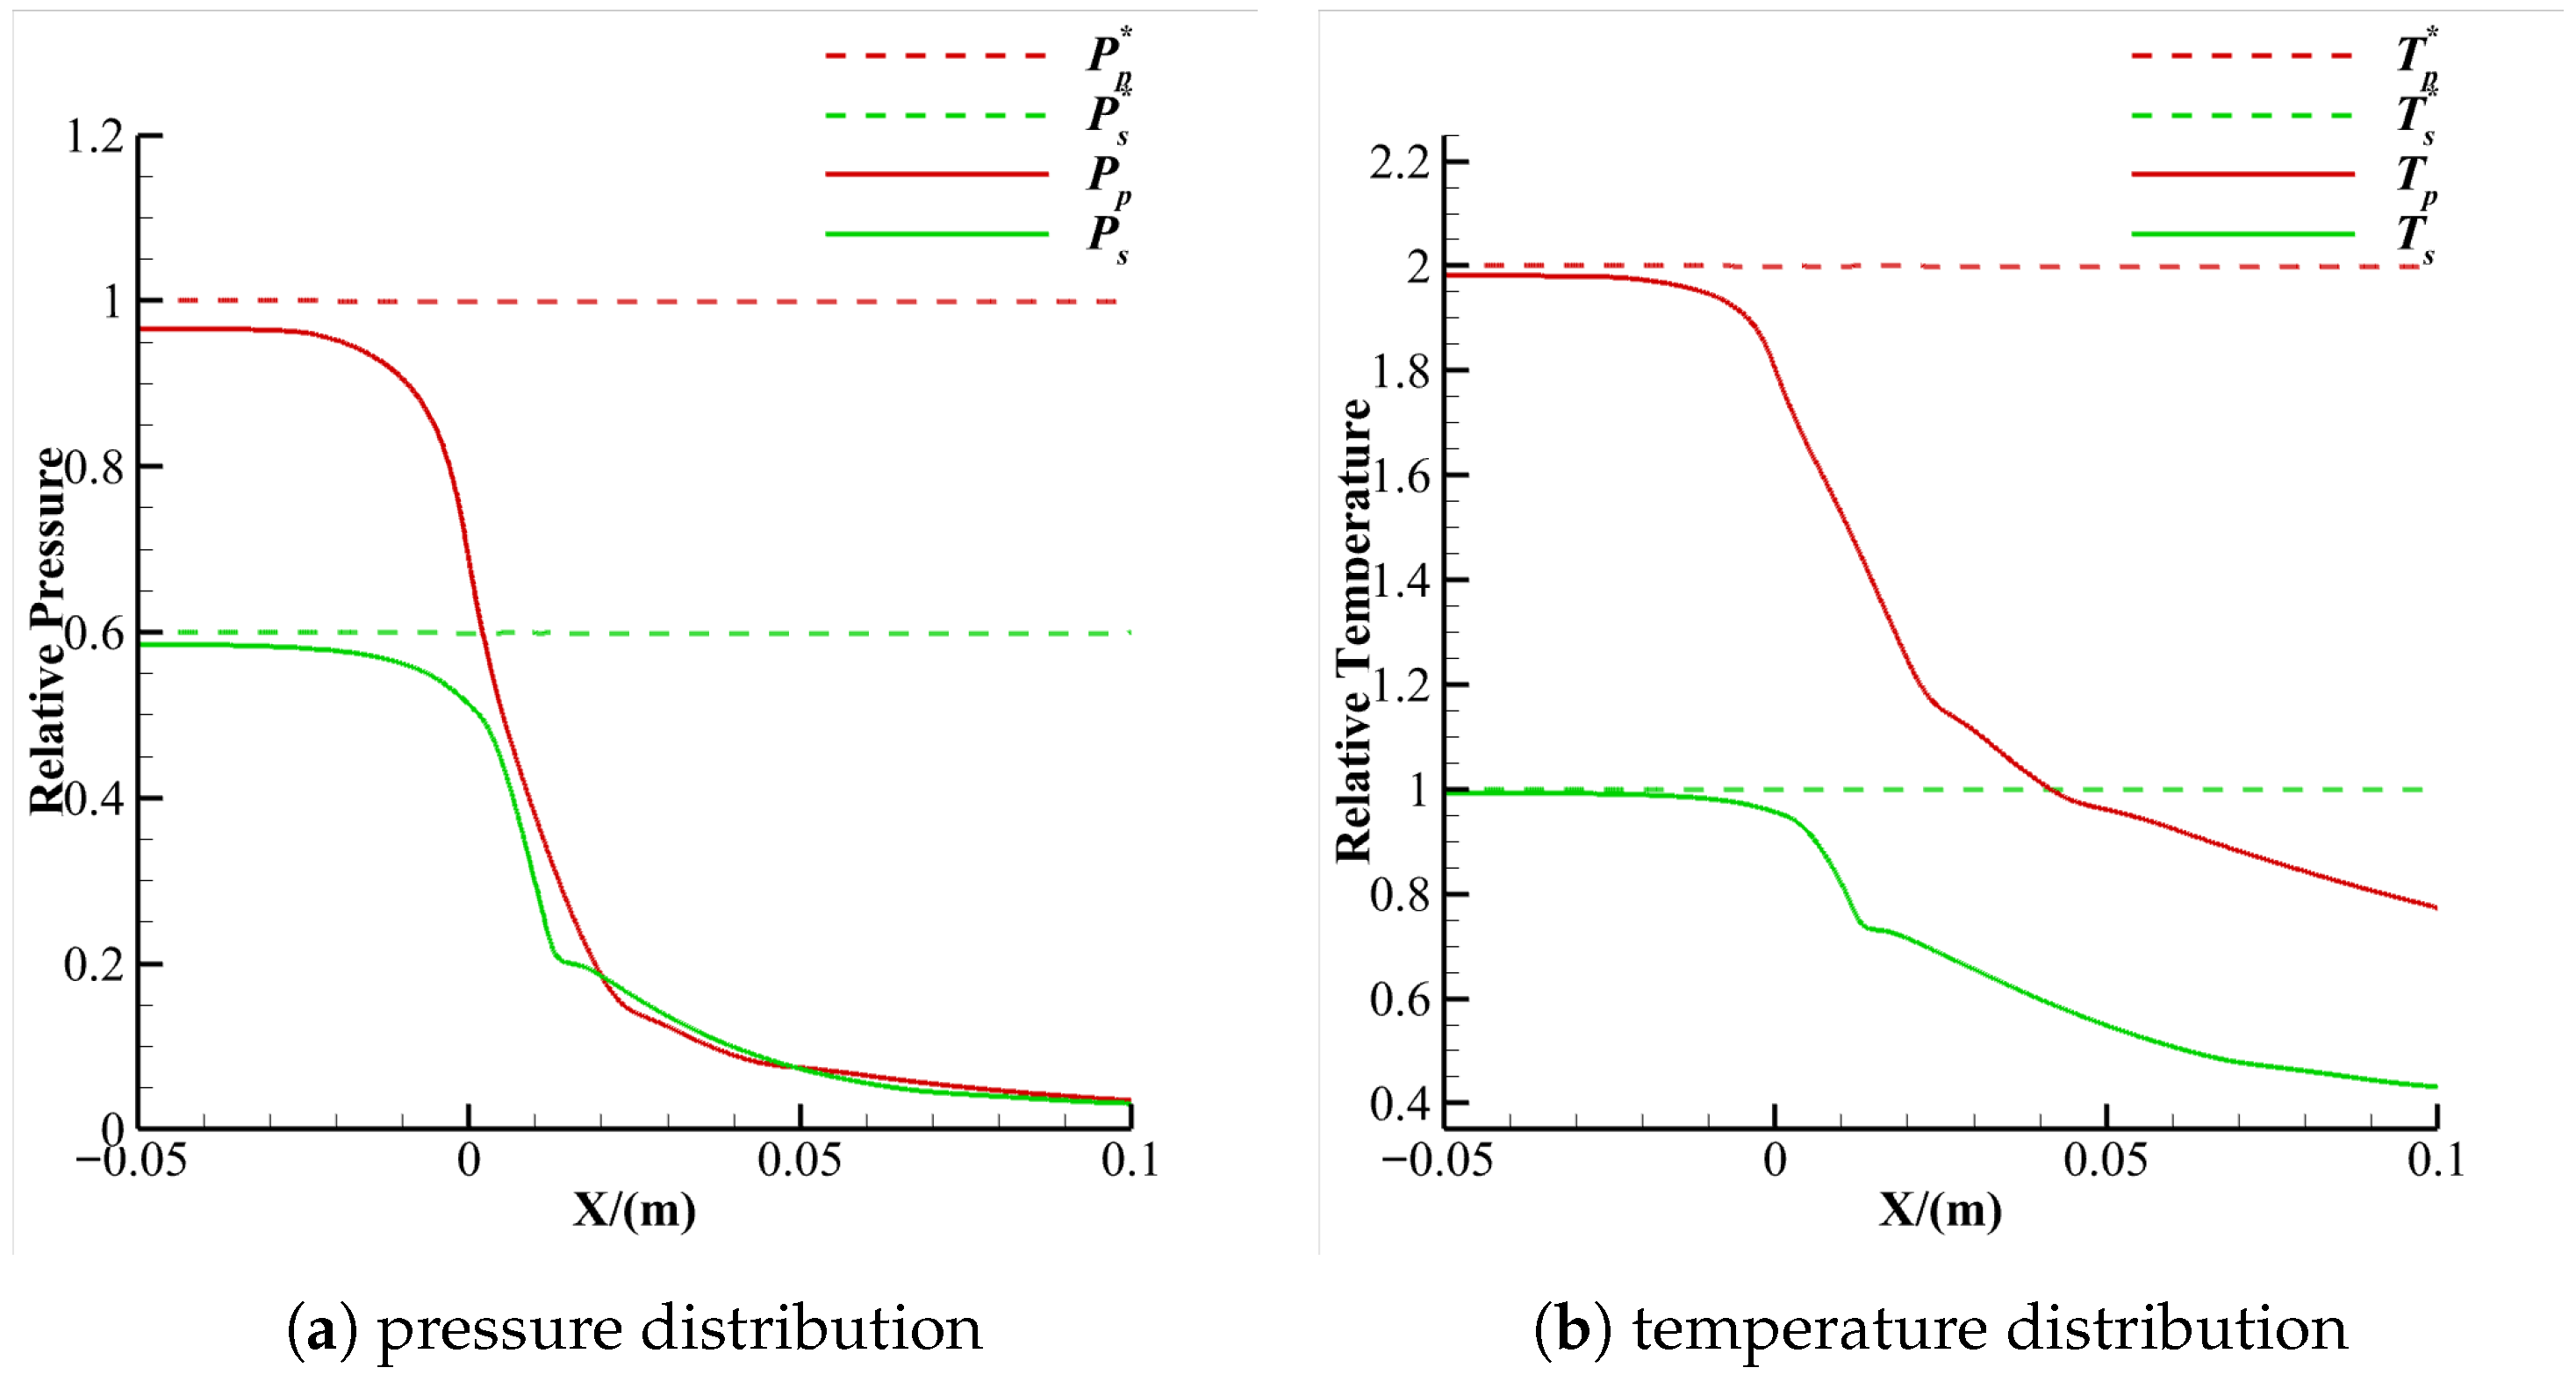
Parameter distributions are extracted along streamlines from inlet to outlet in primary and secondary flow regions, as shown in Figure 13. The total pressure and temperature (dashed line) within both flows remain nearly constant, while the static pressure and temperature (solid line) exhibit rapid decrease in the divergent section. Notably, after the onset of mixing between the primary and secondary flow, their static pressures converge rapidly, achieving numerical proximity in the interfacial region.
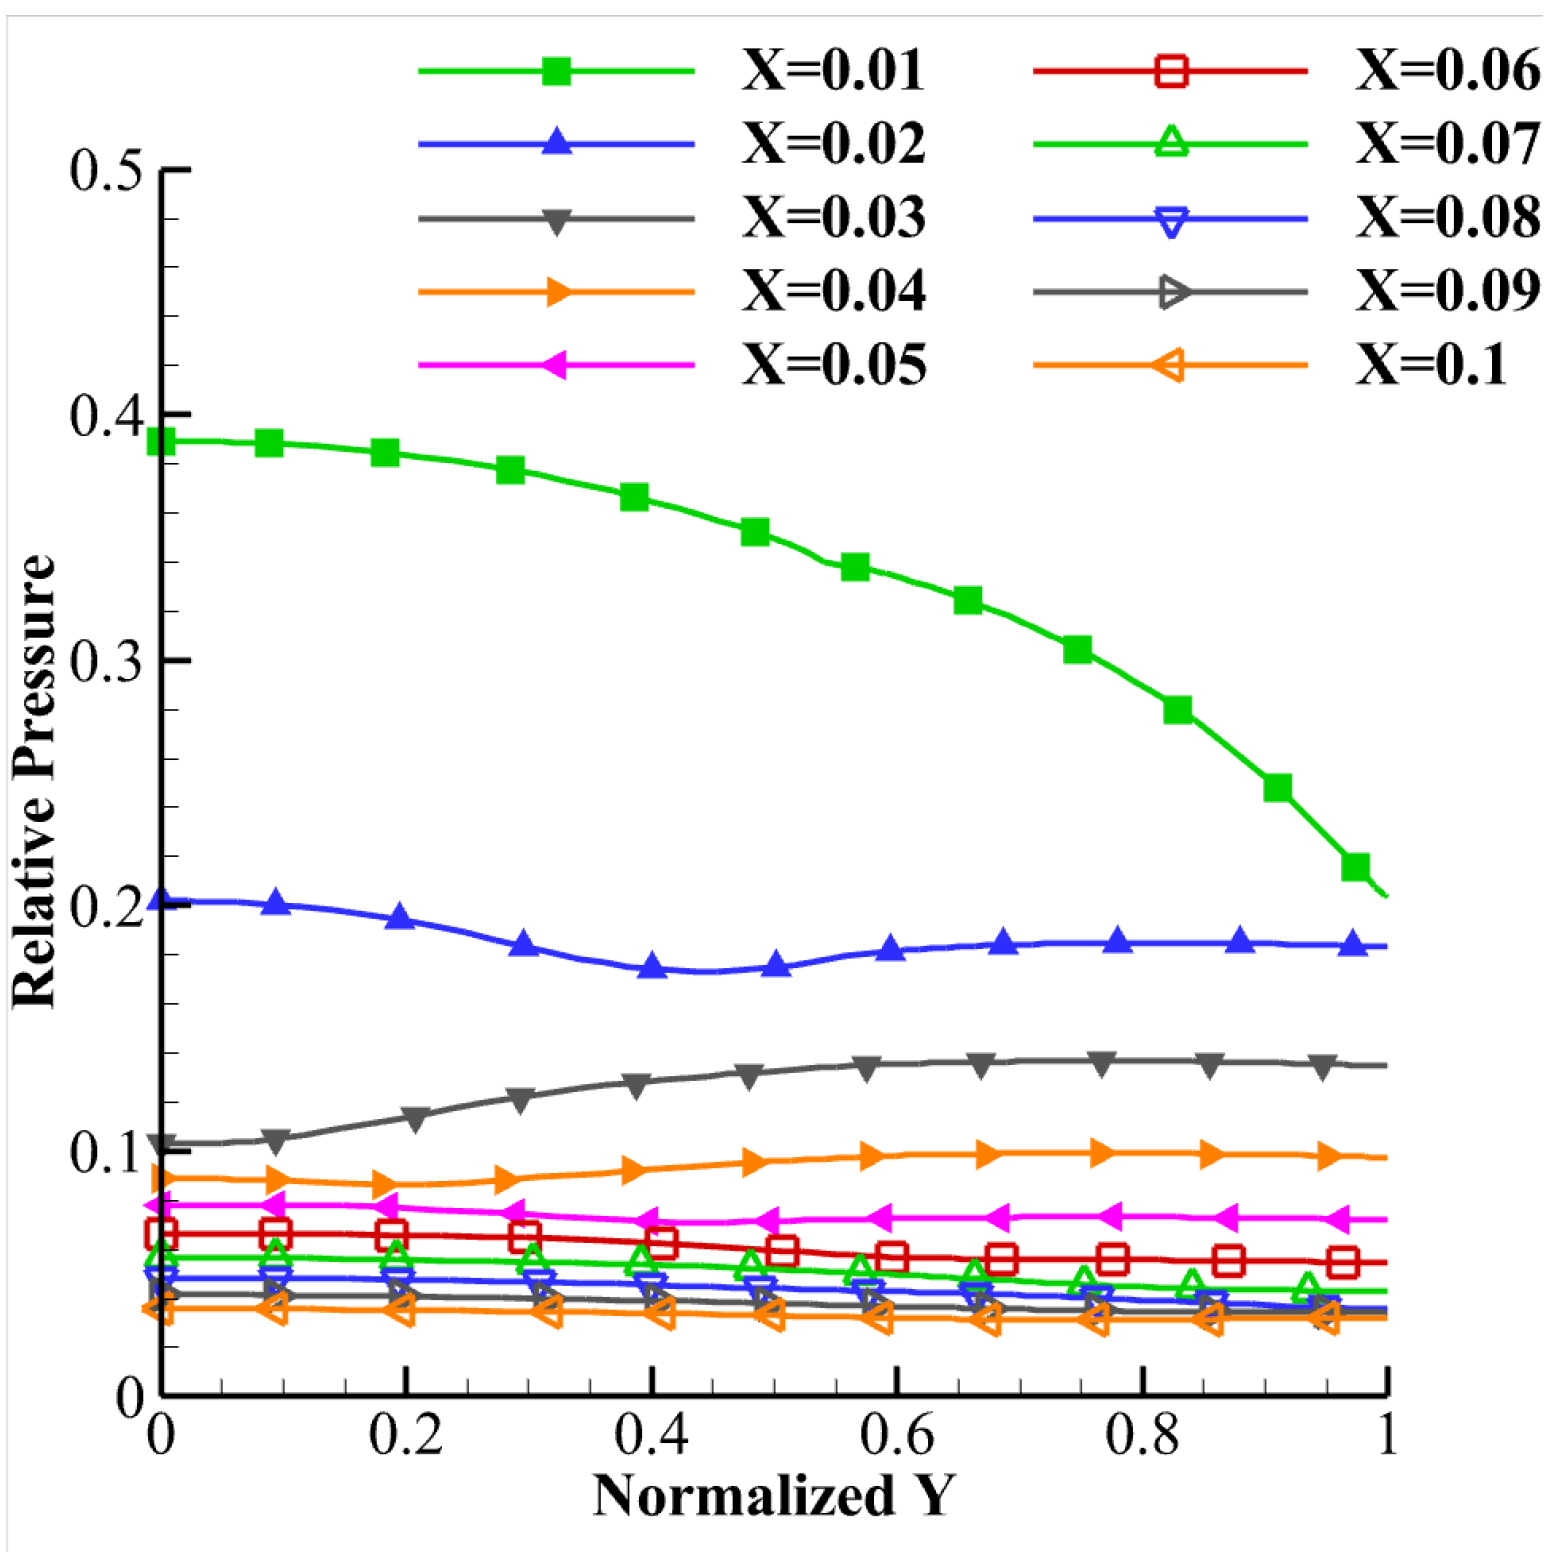
Figure 14 presents static pressure distributions in the y direction (defined in Figure 9) at various streamwise positions (x = 0.01∼0.1 m) within the flow field. The coordinate y is normalized by the local divergent section width. The results indicate that at the onset of mixing of primary and secondary flow (x = 0.01 m), the static pressure exhibits non-uniform distribution.
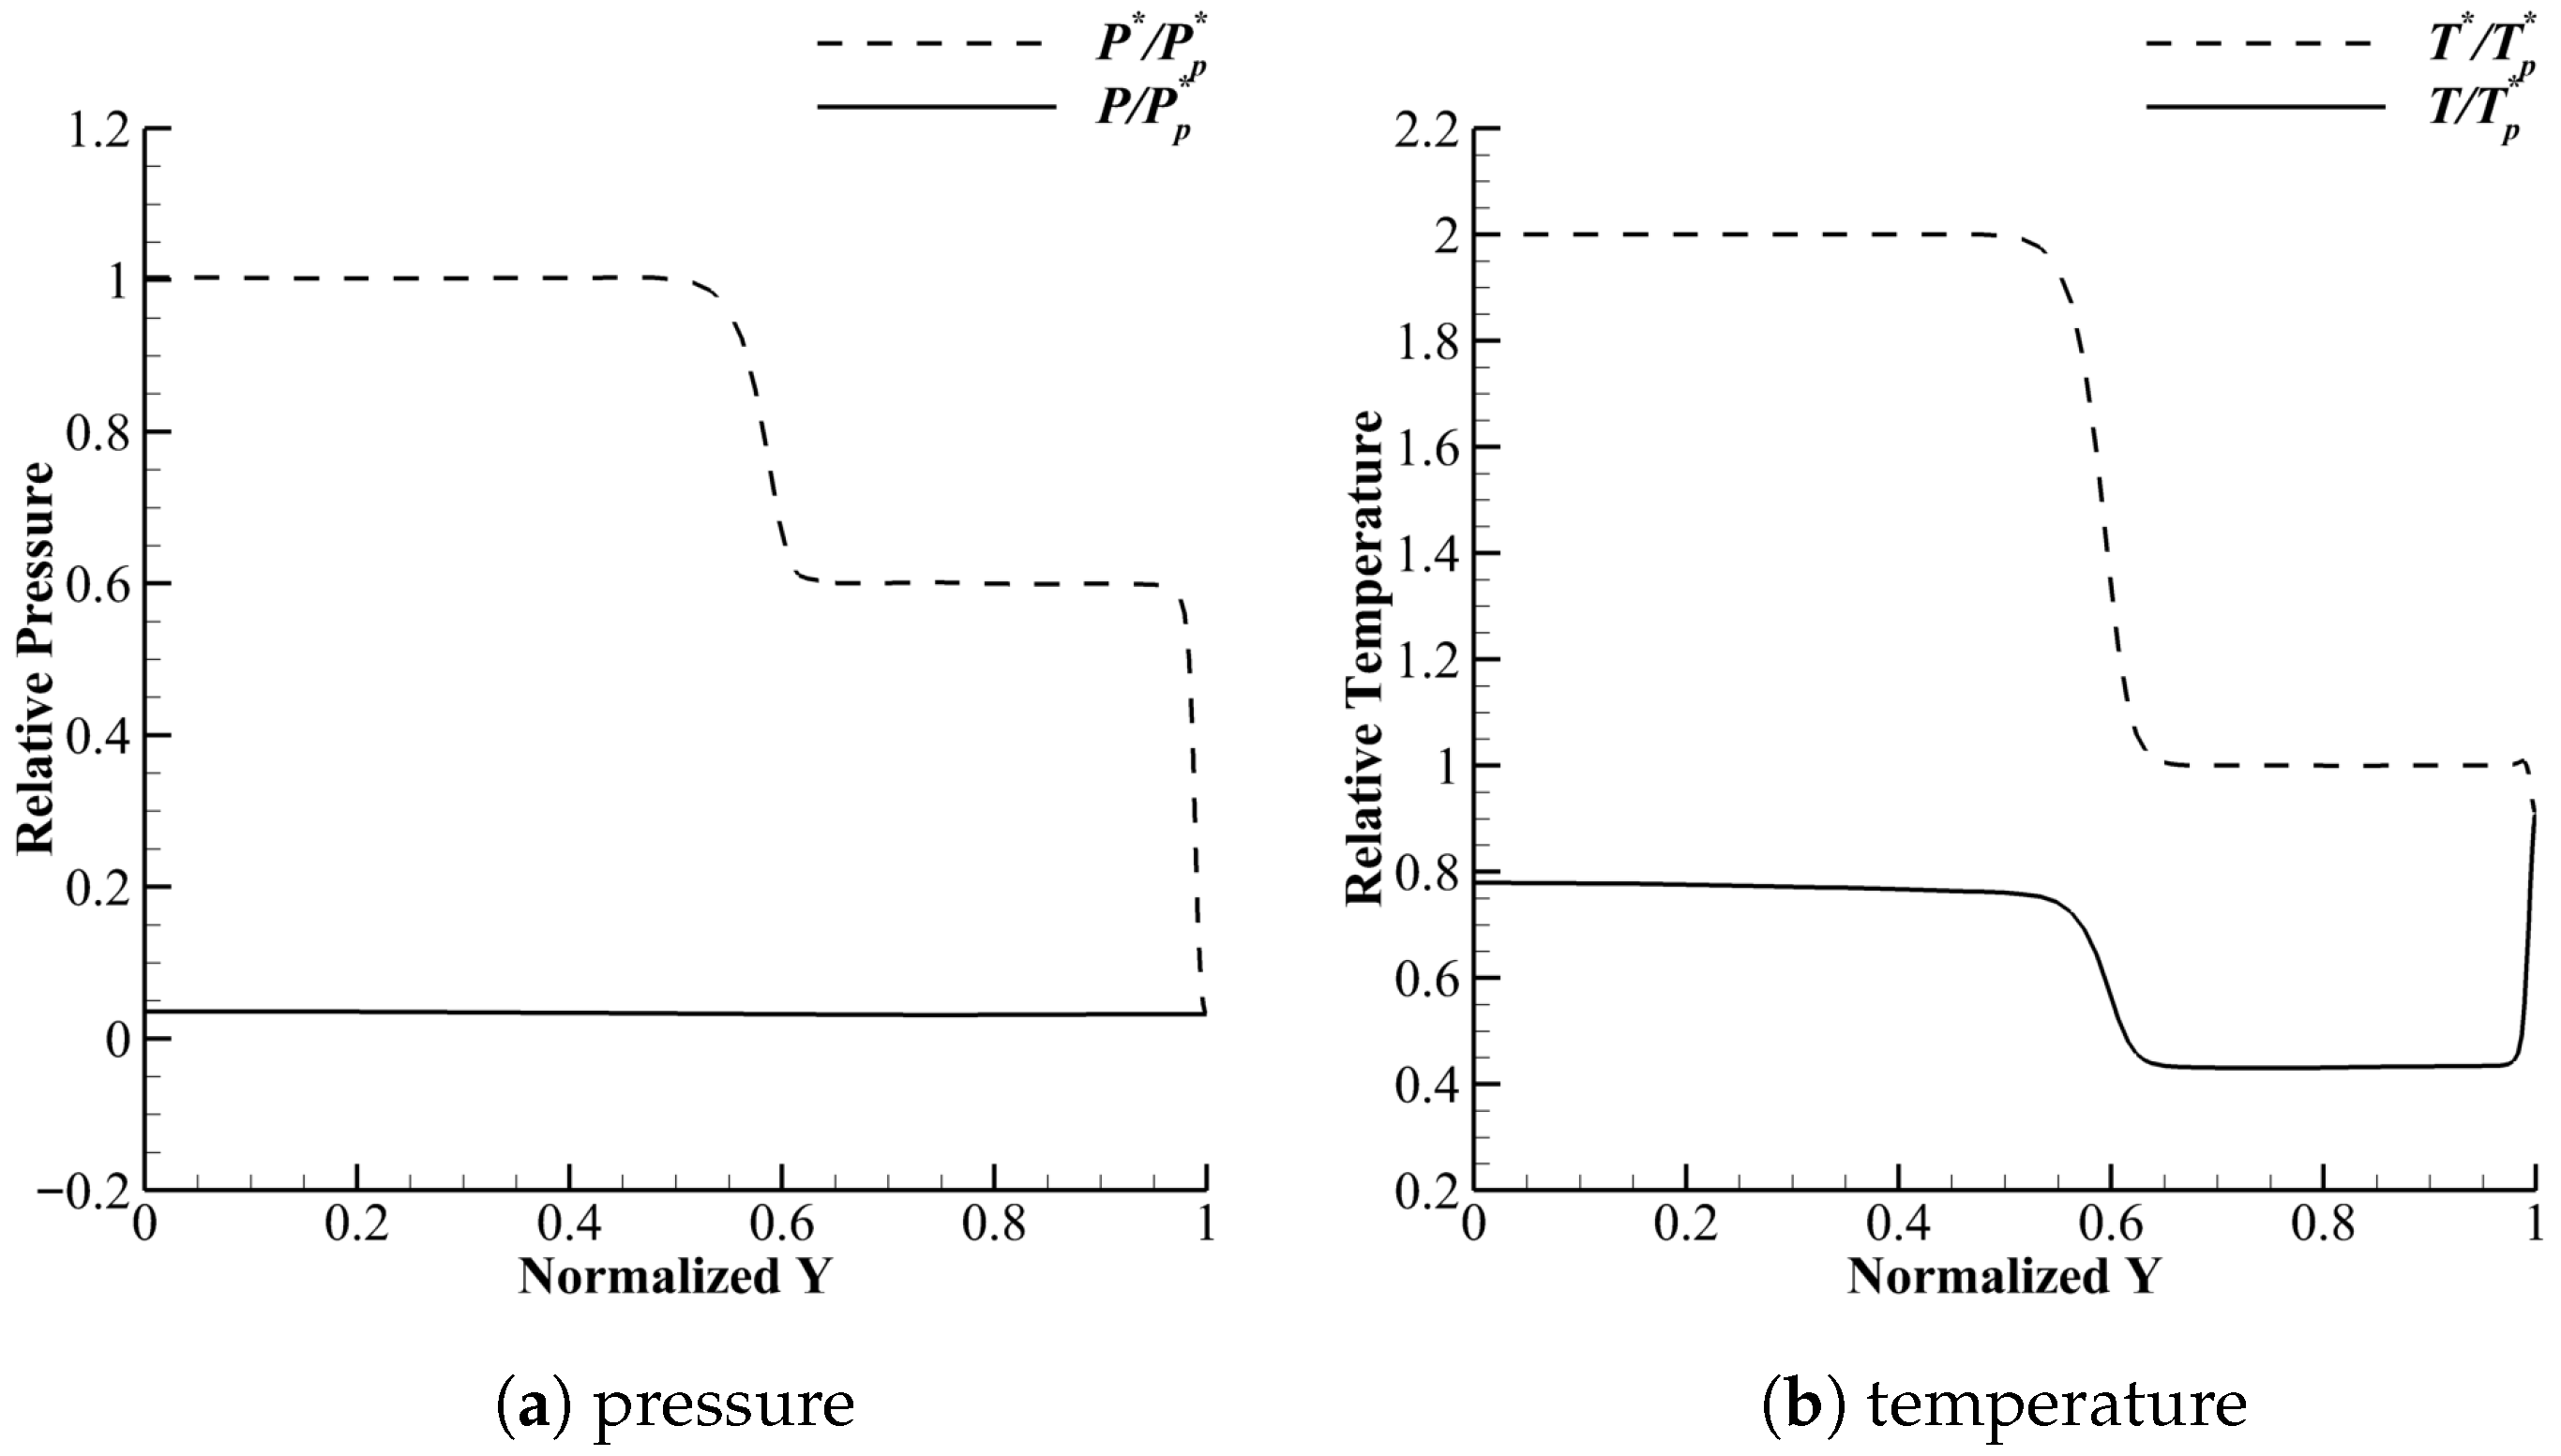
As mixing progresses downstream, the static pressure gradients in the y direction diminish, achieving near-uniformity in the divergent section. Near the nozzle exit (x > 0.08 m), the static pressure distributions converge to identical profiles across the y direction. Figure 15 shows the pressure and temperature distribution across the y direction at the outlet, corroborating the observed pressure equilibrium across the y direction, which is the most important assumption in the ejector established below.

3. Ejector Model

The one-dimensional ejector nozzle model usually employs an adiabatic and frictionless wall assumption. When applied, these models correct computational results to account for boundary layer losses and other effects. Numerical simulations under no-slip wall boundary conditions (Figure 16) demonstrate that the flow-field structures (primary/secondary flow interactions and mixing region development) remain fundamentally consistent with results from no-slip boundary simulations (Figure 9). Consequently, the introduction of this assumption has a negligible impact on the model’s validity.

3.1. Design Condition

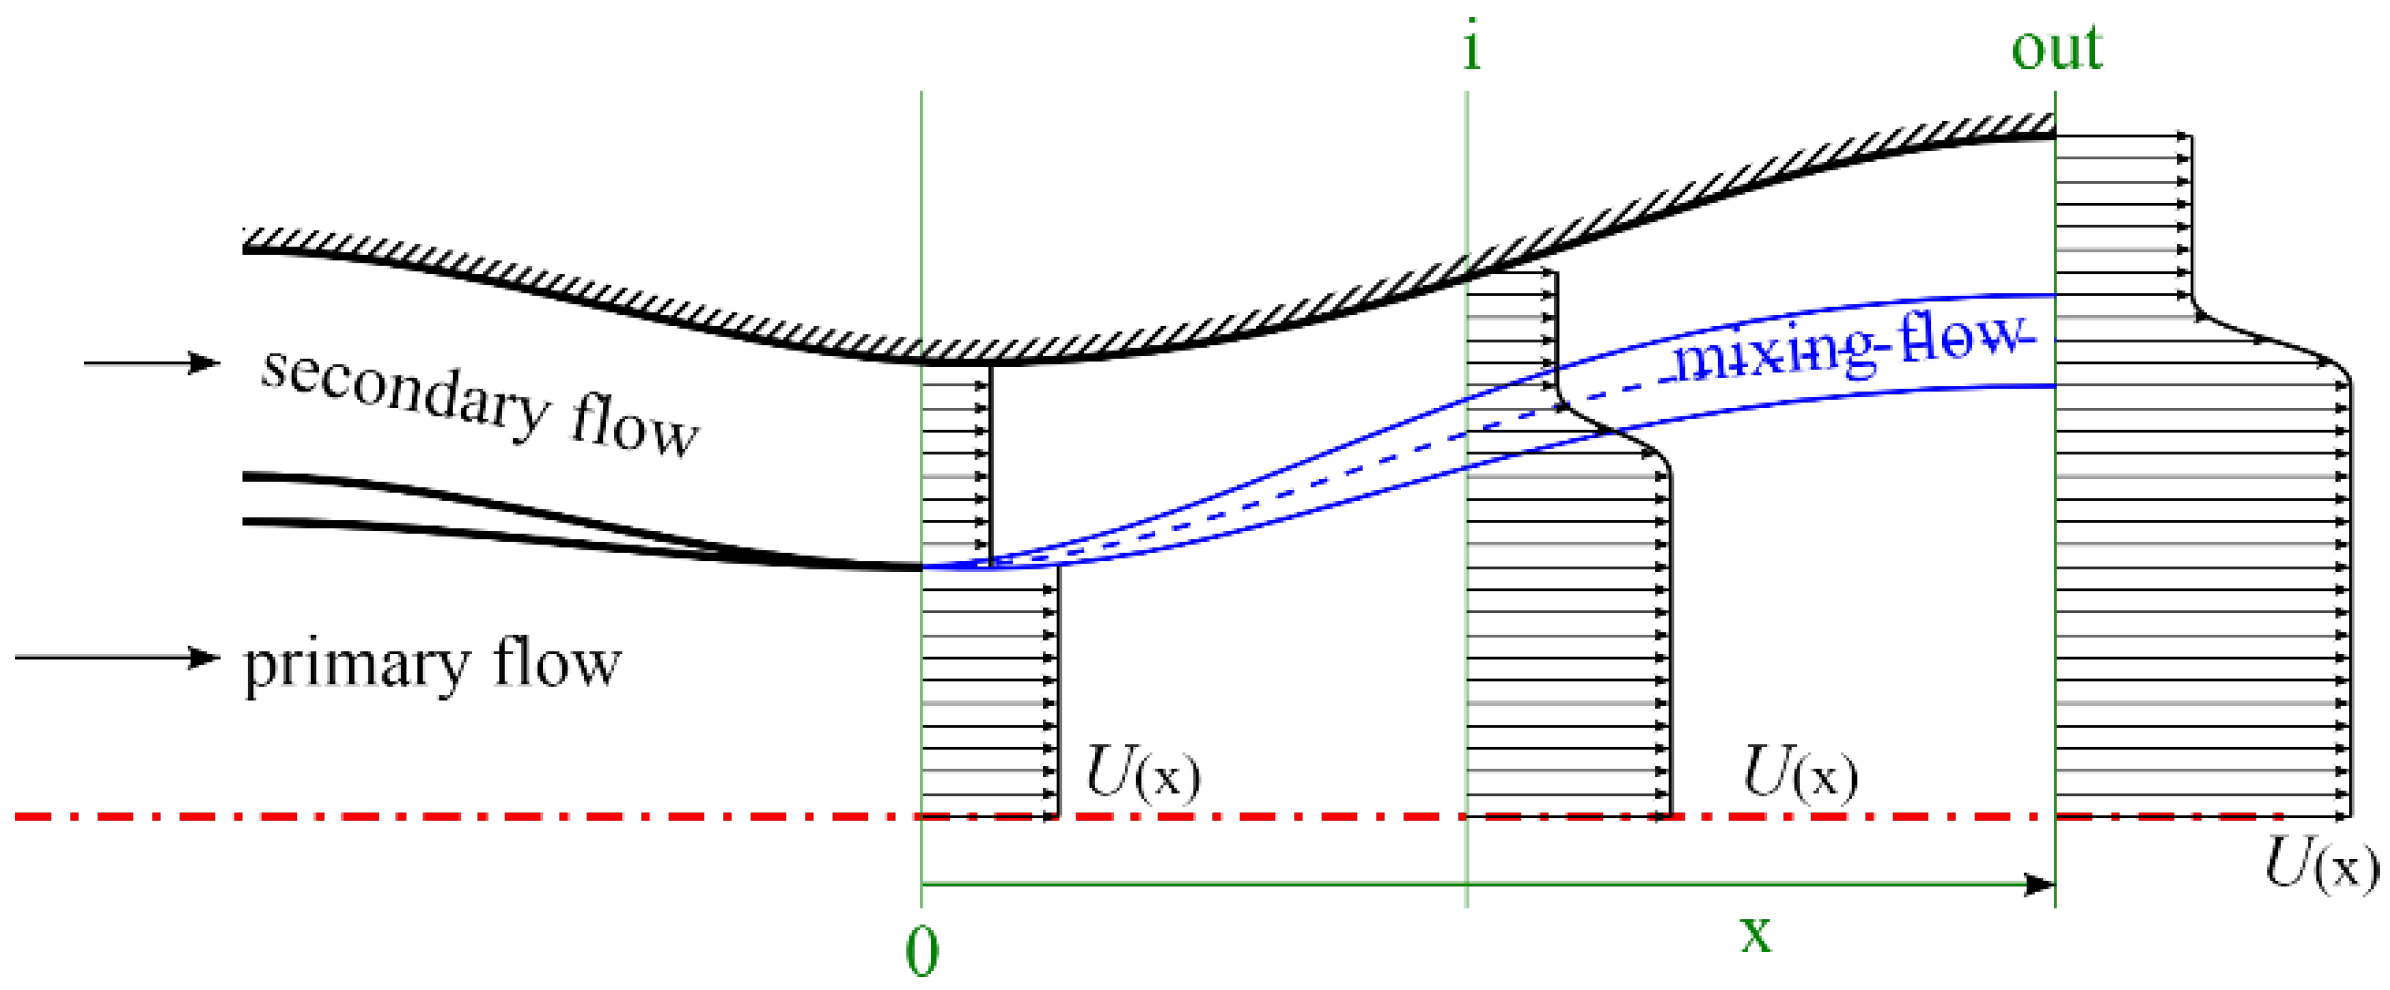
The one-dimensional theoretical analysis diagram of the ejector nozzle is simplified in Figure 17. To simplify the flow-field structure in the divergent section, the secondary flow is injected at the cross-section of the primary nozzle throat. The primary and secondary flows enter from upstream and begin converging near the nozzle throat. With the flow direction defined as x, the intersection point of the two streams is designed as section x = 0 . From section 0 onward, the primary and secondary flow mix at their contact point, forming a mixing region (depicted by blue lines in the figure). The solid blue lines show the boundary, and the dashed blue line shows the midline. Under low backpressure conditions downstream, the flow achieves full expansion within the divergent section. The primary flow will accelerate to supersonic speed at the outlet, as well as the secondary flow, if the divergent section length allows. The primary and secondary flow aerodynamic throat positions are defined as x = 0 and x = i , with M p , 0 = 1 and M s , i = 1 .
The primary flow originates from turbine exhaust or afterburner outlets, possessing higher total pressure and total temperature. The secondary flow generally derives from bypass or other locations and is characterized by lower total pressure and total temperature. The secondary flow is primarily driven by static pressure differentials and ejector action, ensuring that its static pressure at section x = 0 remains equal to or higher than the primary flow static pressure. However, as the secondary flow total pressure is lower than the primary flow, its Mach number at section x = 0 satisfies M s , 0 < M p , 0 = 1 . During concurrent mixing and expansion, the static pressure of both streams rapidly equilibrates and progressively decreases, while their Mach numbers gradually increase.
According to reference [13], when the secondary flow expands to sonic conditions, static pressure equilibrium between the primary and secondary streams is achieved, yielding a model-predicted mass flow ratio that is in strong agreement with the experimental data. Consequently, static pressure equilibrium is assumed valid at section x = i , with P p , i = P s , i = P m , i . As the flow continues mixing and expanding through the divergent section, the mixing region expands until both streams attain supersonic speeds at the outlet. Figure 17 illustrates the velocity profiles at different x sections. This fully expanded flow regime in the divergent section is conventionally adopted as the design-point condition.
The following assumptions were made in order to analyze and model the aerodynamic performance of the ejector nozzle at the design point:
  • Wall friction and gravity’s effects on the fluid are ignored.
  • The primary flow total pressure is higher than that of the secondary flow.
  • In the ejector, the primary and secondary flows are ideal-gas steady adiabatic flows, without considering the transition, separation, vortex, and other flow-field structures.
  • The flow between different sections of primary and secondary flow is isentropic.
  • The flow parameters in the primary and secondary flows regions are uniform at the same section.
  • The static pressure in the mixing region is uniform at the same section, whereas other parameters are transitional.
  • The primary flow is critical at section 0, and the secondary flow is critical at section i, which means M p , 0 = 1 , and M s , i = 1 .
According to the above assumption, the ejector nozzle model can be set up in line with the mass and energy conservation laws. Because the profile of the nozzle is unknown, the conservation law of momentum cannot be used. The equations are shown as follows:
m ˙ p , 0 + m ˙ s , 0 = m ˙ p , x + m ˙ s , x + m ˙ m , x
m ˙ p , 0 H p , 0 * + m ˙ s , 0 H s , 0 * = m ˙ p , x H p , x * + m ˙ s , x H s , x * + m ˙ m , x H m , x *
where x = 0, out, which represents the section i and outlet.
The assumption provides the Mach number and static pressure equation as follows:
M p , 0 = 1
M s , i = 1
P p , x = P s , x = P m , x
The calculations of the primary and secondary flow are shown as follows:
m ˙ p = ρ p V p A p
m ˙ s = ρ s V s A s
While the velocity profile in the mixing region is unknown, calculating the parameters of the mixing region is a formidable task in the most general three-dimensional case. The calculation of the mixing flow can be formulated as follows:
m ˙ m = ρ m V m d A
m ˙ m H m * = ρ m V m H m * d A
In the momentum integral method [9], the velocity profile was assumed as a cubic polynomial curve for integral solutions. In one-dimensional method calculations addressing more general scenarios, it is logical to directly assume the interpolation of primary and secondary flow parameters, as presented in the following formula:
P m * = ( 1 k P ) P p * + k P P s * H m * = ( 1 k H ) H p * + k H H s *
where k P and k H are constant on different sections of the same flow field, which are related to the ejector nozzle shape and flow state. According to the interpolation method, the integration in Equations (8) and (9) can be reduced as follows:
m ˙ m = ρ m V m A m
m ˙ m H m * = m m [ ( 1 k H ) H p * + k H H s * ]
where ρ m and V m can be calculated by the ideal gas equation of state and isentropic relations from P m * , H m * , and backpressure P out .
Additionally, to achieve closure of the equations, the following relationships must be incorporated: (a) nozzle geometric relations and (b) mixing layer thickness relations.
The nozzle geometric relations include the section i and outlet as follows:
A p , i + A s , i + A m , i = A i
A p , out + A s , out + A m , out = A out
The area A i means the area of section i and can be given with an estimate value from the nozzle geometry and flow state.
The mixing layer thickness can be estimated using the local coordinate x (representing the length to the start of mixing) and the mixing layer growth rate λ . For two-dimensional flow, the area of the mixing region simplifies to A m = x λ . For axisymmetric flow, it is defined as b = x λ , where b means the half thickness of the layer. A m can be calculated by geometry Equations (13) and (14) with b.
The mixing layer growth rate λ can be estimated by [29,30]
λ = C δ ( 0.8 e 3 M c 2 + 0.2 ) ( 1 r ) ( 1 + s ) 2 ( 1 + r s ) 1 1 s 1 + s 1 + 2.9 1 + r 1 r
where C δ is a non-dimensional constant, r and s are the velocity ratio and the density ratio on both sides of the mixed layer, and M c is the convective Mach number defined as follows:
r = V s V p s = ρ s ρ p M c = V p V s a p + a s
Based on the above equations and assumptions, the relevant parameters of the ejector nozzle could be calculated if the shape of the ejector nozzle is considered, with A i , A out , and x out .
As a one-dimensional model for ejector nozzle calculations, total pressure ratio and flow parameters are required as inputs for engine calculations. Due to the impact of the total temperature on the mass flow, the performance parameters are used to correct the mass flow ratio Φ and total pressure recovery coefficient σ as follows:
Φ = m ˙ s , 0 m ˙ p , 0 T s * T p *
σ = m ˙ p , out P p , out * + m ˙ s , out P s , out * + m ˙ m , out P m , out * m ˙ p , 0 P p , 0 * + m ˙ s , 0 P s , 0 *
It is important to mention that the primary and secondary streams in calculations are influenced by the total temperature and gas composition, leading to potential variations in the thermodynamic properties. Variable specific heat calculations should be performed, incorporating gas composition effects. The specific heat capacity calculation formula [31] is given by
C p ( T ) = ( a 1 T 2 + a 2 T 1 + a 3 + a 4 T + a 5 T 2 + a 6 T 3 + a 7 T 4 ) R g
where the coefficients a 1 , a 2 , , a 7 are determined through the weighted average of measured values for each gas component, as present in Table 1, under a composition that contains 78.084% of nitrogen, 20.9476% of oxygen, 0.9365% of argon, and 0.0319% of carbon dioxide.
For the gas in the mixing region, the gas components are determined through the weighted average of the primary and secondary flow components based on the mass flow rate of the primary and secondary flows entering the mixing region.

3.2. Choke State

Even under fully expanded flow regimes with extremely low backpressure, the ejector nozzle max exhibits failure to entrain the secondary flow, resulting in bypass duct blockage, where the state is called “choke state” in this paper. This phenomenon does not stem from excessive backpressure, but rather results from insufficient total pressure within the secondary flow.
By reducing the secondary flow total pressure while adjusting the backpressure to maintain fully expanded flow conditions within the ejector nozzle, the secondary flow region proportion in the divergent section continuously diminishes. Consequently, the aerodynamic throat area of the secondary flow gradually narrows, and its throat position shifts downstream, as illustrated in Figure 10a. When the secondary flow total pressure decreases to the critical value P s , choke * , the aerodynamic throat area of the secondary flow shrinks to zero, and the secondary mass flow approaches negligible values (only minimal entrained flow penetrates into the mixing region), as shown in Figure 18. The flow regime induces distinct structural evolution in the flow field: At section i, the cross-section exclusively comprises the primary and mixing flow region, with complete absence of the secondary flow region; upstream of section i, the secondary flow region persists, dominated by recirculatory vortices generated by the primary flow entrainment, whereas downstream of section i, the primary flow becomes preponderant, and the mixing region diminishes through progressive turbulent diffusion until its complete dissipation.
In Figure 18, when the ejector nozzle’s divergent section length is sufficiently long, the free expansion surface of the primary flow intersects the divergent section wall at section i. If the divergent section length is insufficient, the free expansion surface fails to intersect the wall, indicating that the system has not reached the choking condition. By further reducing the secondary flow total pressure, the intersection point shifts to the nozzle outlet, establishing a new choking condition where the outlet becomes the critical section i. This demonstrates that the choking state is intrinsically linked to the divergent section geometry. During design optimization, modifying the divergent section contour can expand the stable operational range of the ejector nozzle. Under choking conditions, the shape of the primary flow’s free expansion surface is governed by the flow parameters of both the primary and secondary flows. In two-dimensional flow fields, this surface’s geometry and position can be calculated by the method of characteristics. For one-dimensional models, the section i position must either be specified as a geometry parameter or defined through empirical relationships.

3.3. Subcritical Flow

Under high downstream backpressure conditions, the flow within the ejector nozzle remains subcritical (Figure 19), which is similar to the operation of a conventional Laval nozzle. The nozzle is dominated by a complete subsonic flow. The maximum Mach number occurs at the primary flow location x = 0 , where M p , 0 1 . In this regime, P p * > P s * > P out . The y-direction pressure balance assumption remains valid, extending to the primary–secondary flow interface at x = 0 .

3.4. Over-Expanded Flow

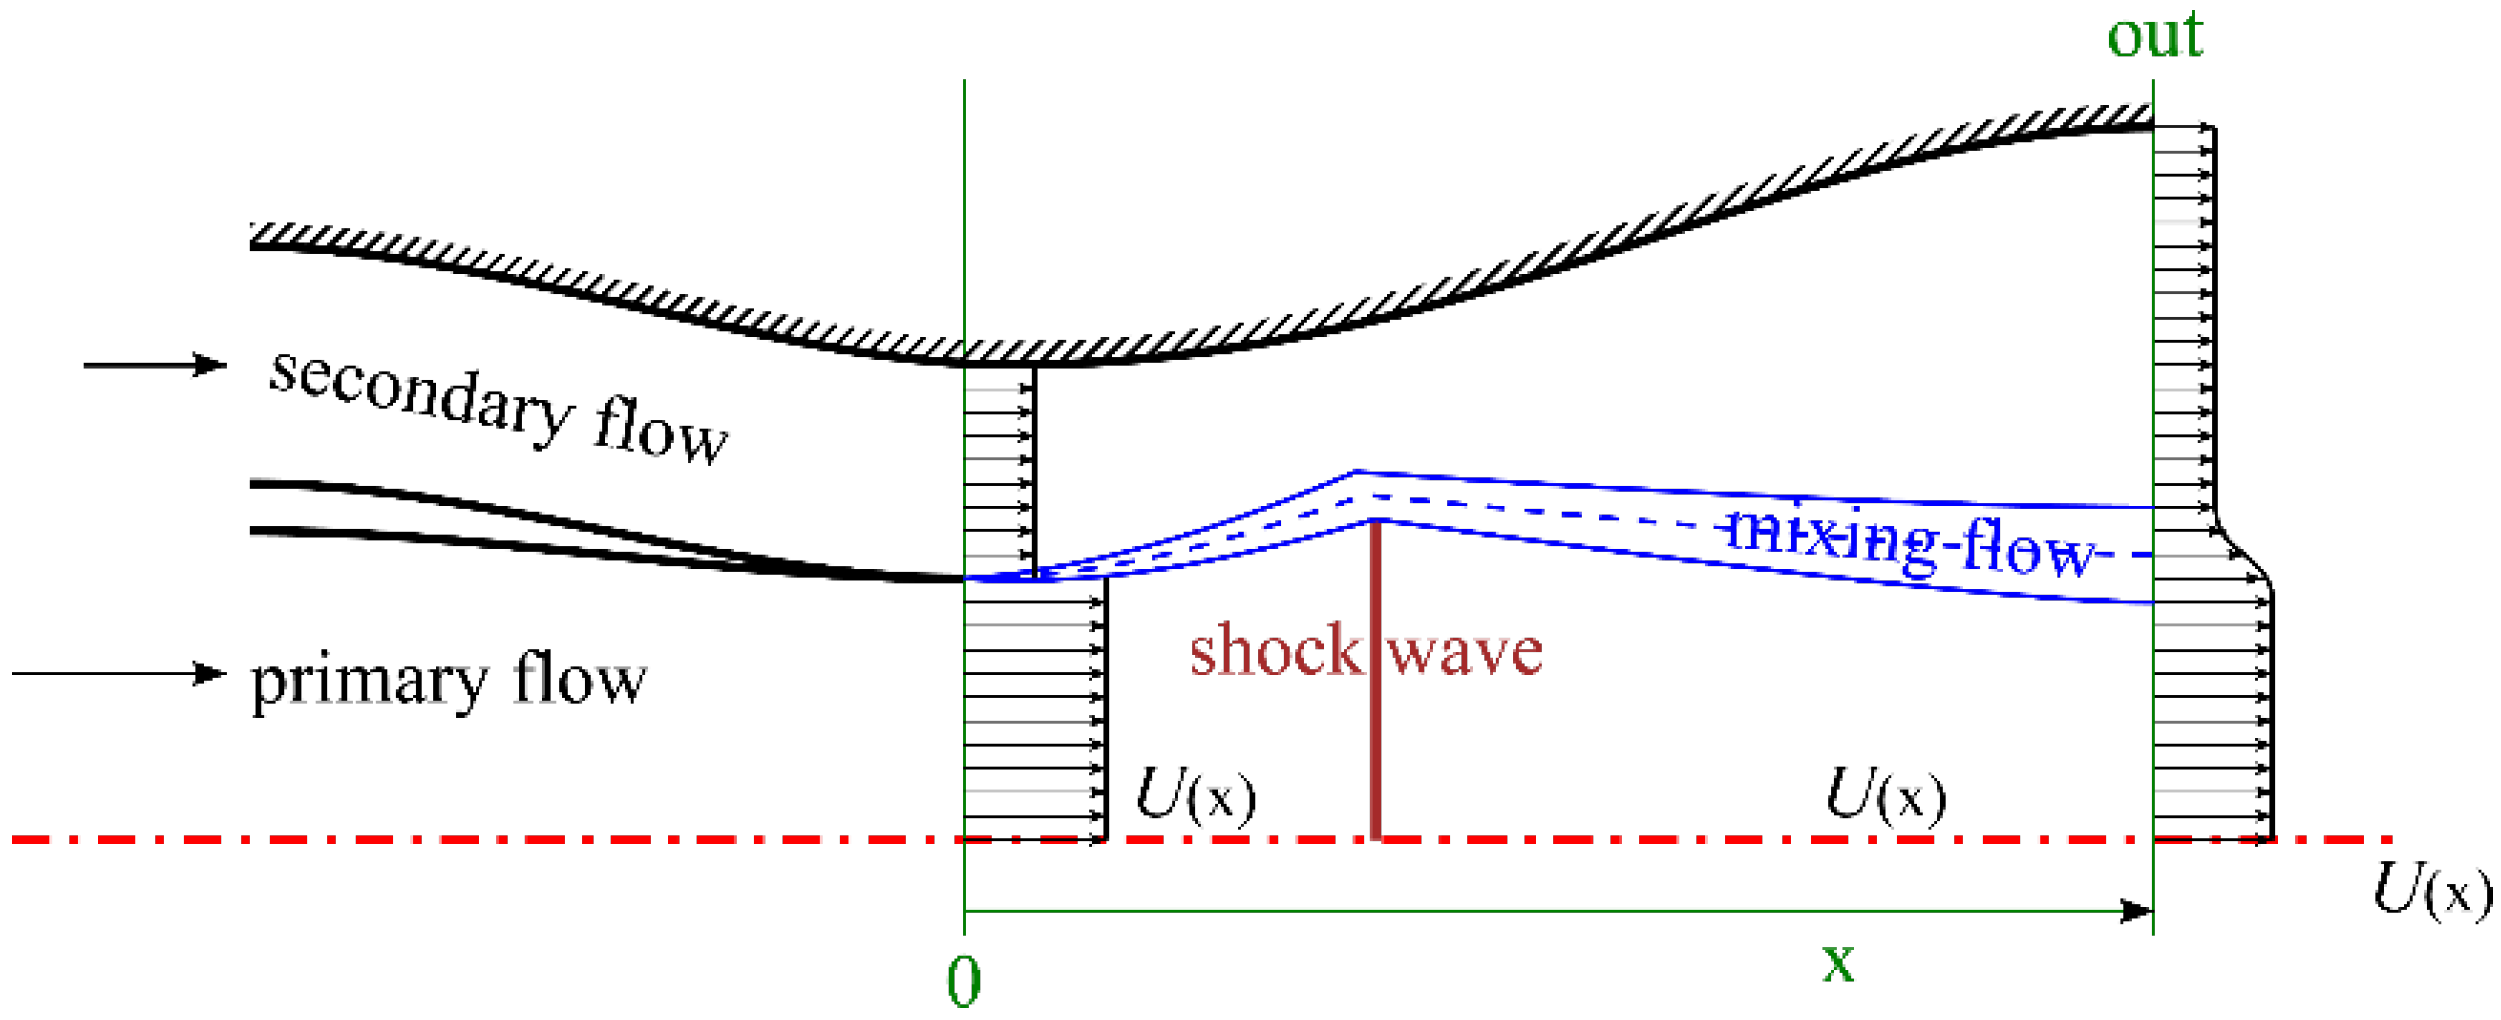
When the outlet back pressure lies between the subcritical condition and the design condition outlet pressure, the flow within the ejector nozzle exhibits over-expanded characteristics. However, unlike the over-expanded flow in Laval nozzle, the dual-flow configuration (primary and secondary flows) in the ejector generates one or two normal shockwaves within the nozzle due to pressure mismatch. In a low backpressure regime, discrete normal shockwaves form independently in the primary and secondary flow regions, connected via the mixing layer transition region, as illustrated in Figure 20 with the red solid line. In a moderate backpressure regime, the secondary flow region remains entirely subsonic, with only a weak normal shockwave developing in the primary flow region, as shown in Figure 21.
The flow-field parameters exhibit heightened complexity due to shock-induced distortion when shockwaves develop within the divergent section. The assumption of pressure balance along the y direction becomes invalid under sun conditions, making parametric calculations across the primary, secondary, and mixing flow regions at the outlet particularly challenging. Consequently, characteristics in this regime are typically approximated through interpolation between subcritical and design condition data. Advanced computational methodologies for precise prediction in such scenarios remain an active area of research.

4. Validation

After discussing the quasi-one-dimensional model, this paper develops a simplified two-dimensional validation model (Figure 22). The nozzle comprises two flow channels separated by a baffle plate before the geometry throat, where the primary and secondary flows converge. The primary stream channel employs B-spline curves to generate convergent and divergent section walls, while the secondary stream wall profile y s is derived via linear scaling of the primary stream wall profile y p as y s = k y p . The design ensures a constant area ratio between the nozzle outlet and throat and is defined as A out / A cr = 1.5 . By varying the scaling factor k = 0.2 , 0.5 , 0.8 , 1 , the study systematically investigates the influence of the merging plane area ratio on the flow characteristics.

4.1. Different Conditions

Figure 23 shows the Mach number contour of the design, choke, subcritical, and over-expanded conditions in the ejector nozzle when k = 1 . The flow-field structures depicted exhibit complete agreement with the comprehensive analysis conducted in the last chapter.
The comparative analysis between the model predictions and CFD results under design and choke state conditions is shown in Table 2. The corrected mass flow ratio Φ and total pressure recovery coefficient σ exhibit minimal discrepancies. The predicted total pressure of the secondary flow shows negligible deviations from the CFD results under choke state conditions.
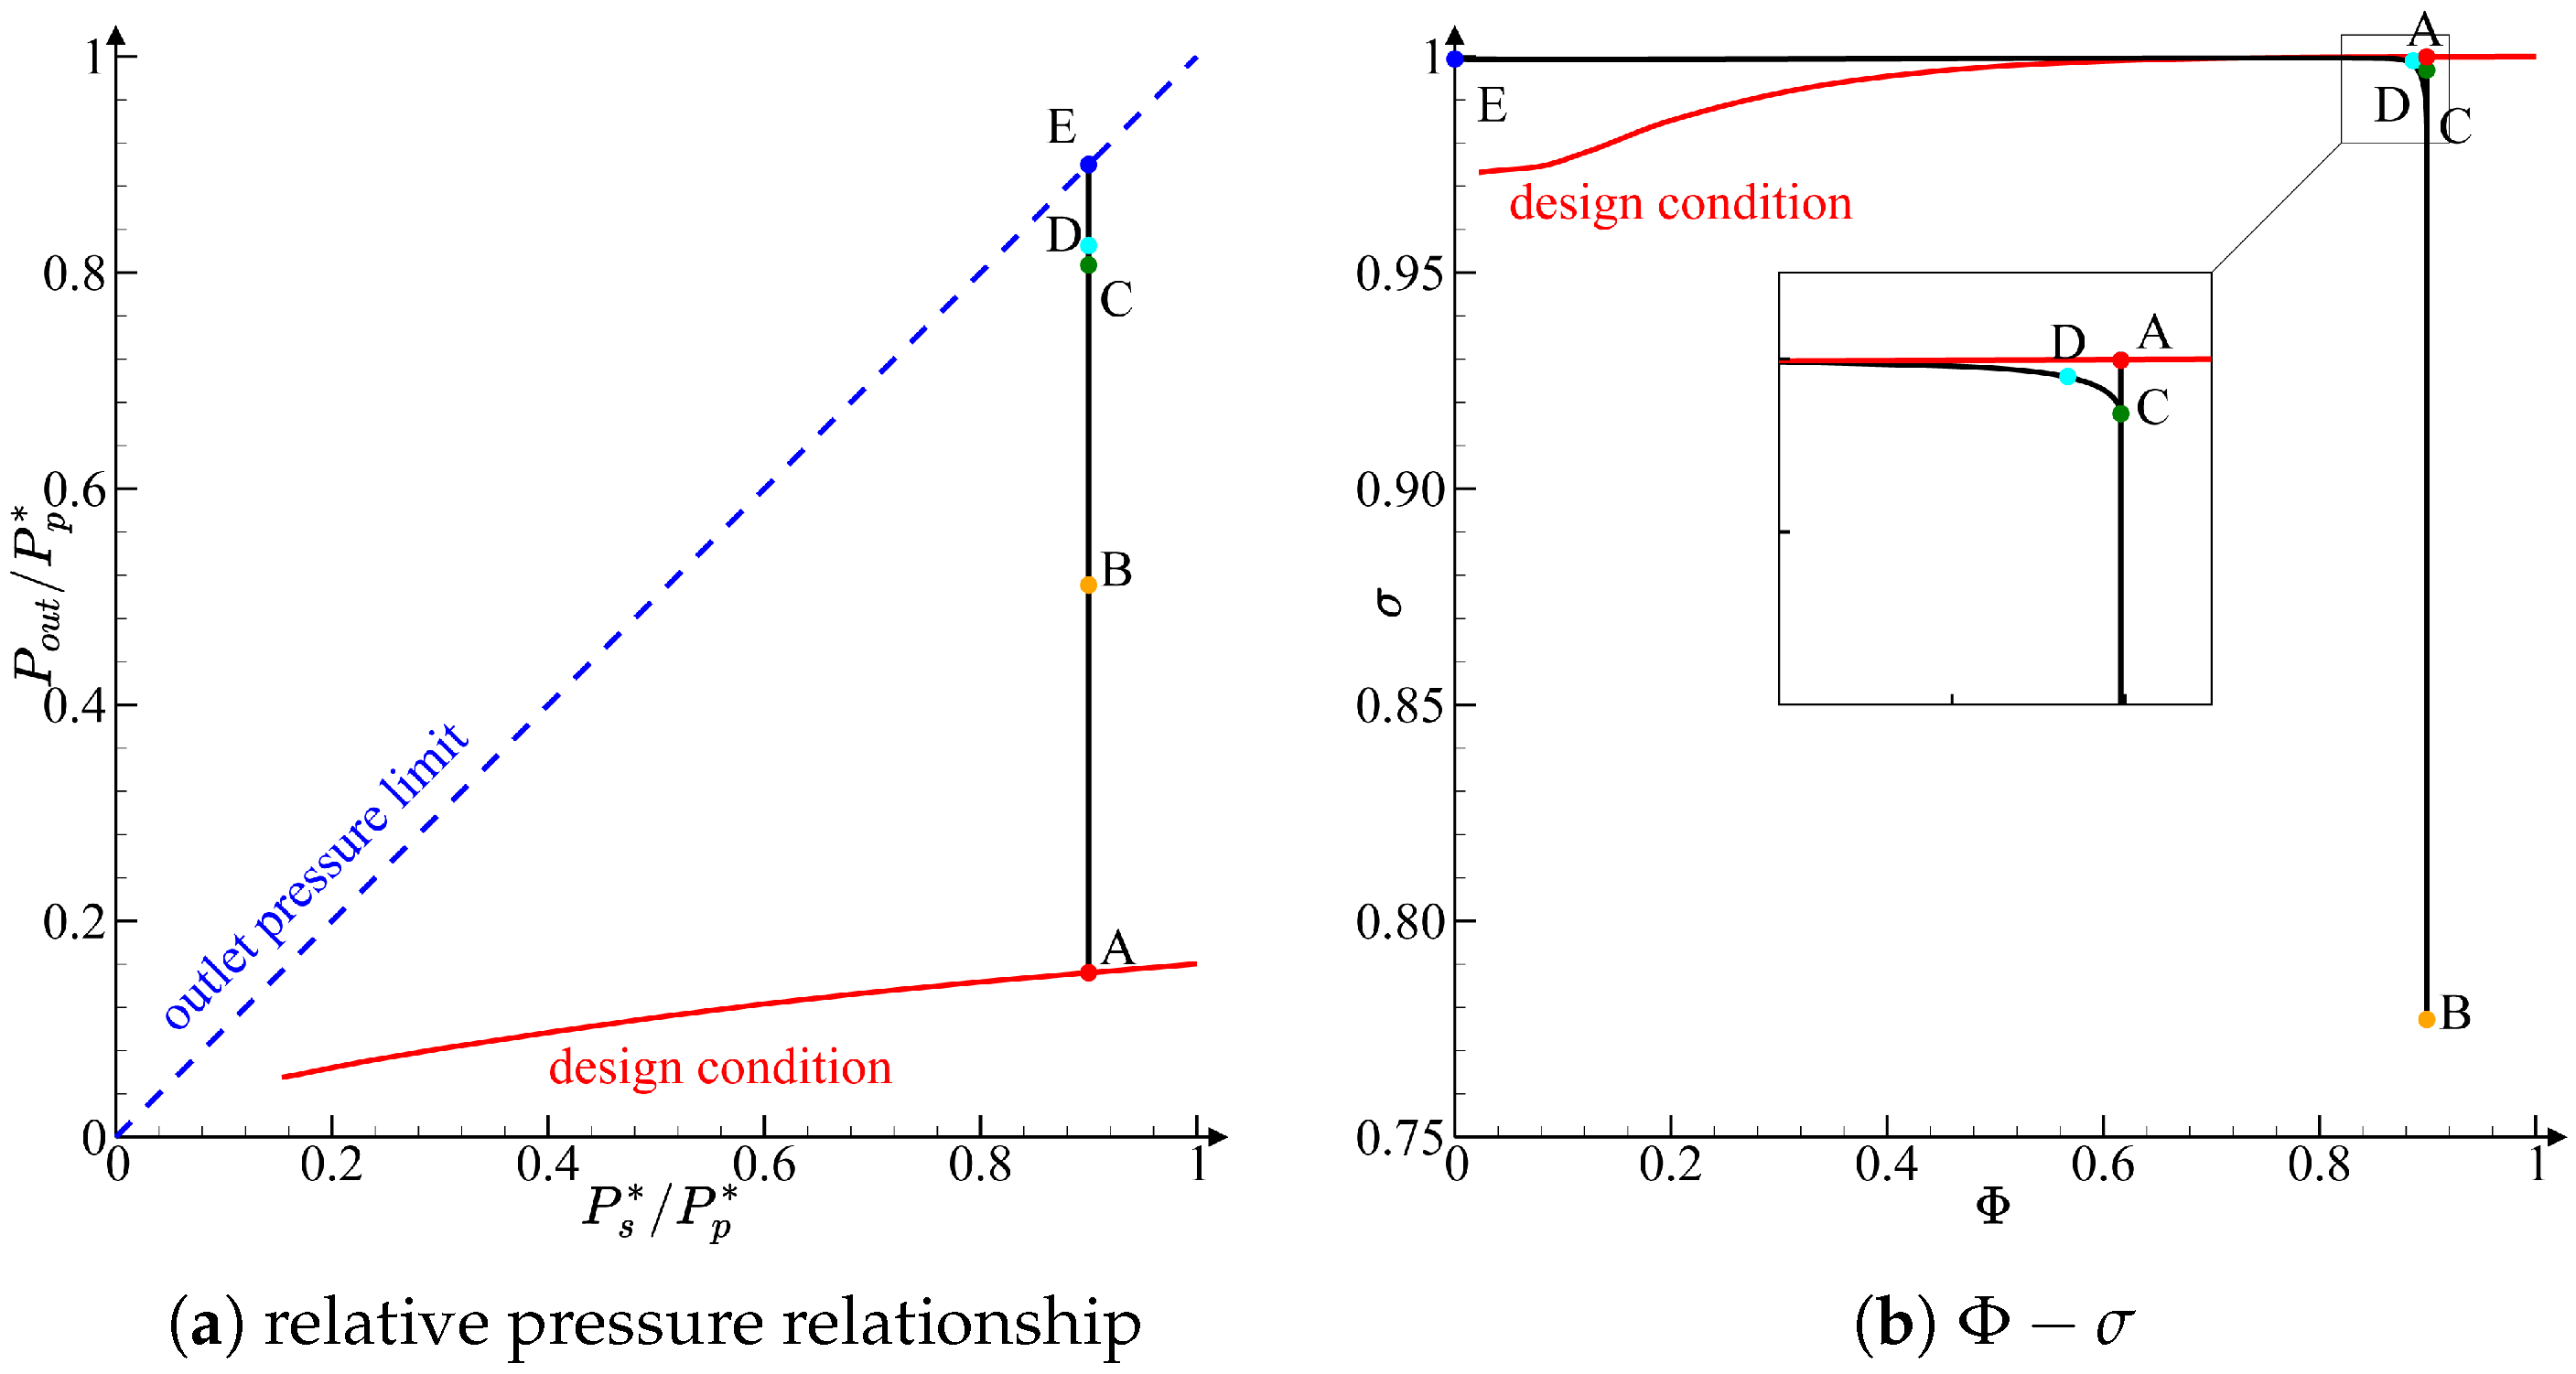
Figure 24 shows the four work points A, B, C, D, and E of the ejector, with a fixed geometry of k = 1 . Point A represents the fully expanded condition. Point B represents the workpoint with two normal shockwaves located at outlet. Point C represents the critical transition point in over-expanded conditions where two normal shockwaves coalesce into a single normal shockwave. Point D represents the critical transition from the over-expanded condition to the subcritical flow condition; Point E represents the limit critical operational limit, where the backpressure equals the secondary flow total pressure.
Figure 24a illustrates the relationship between the backpressure and inlet total pressure for specified points, where the abscissa denotes relative secondary flow total pressure P s * / P p * , and the ordinate represents relative backpressure P out / P p * . Figure 24b presents the correlation between the corrected mass flow ratio Φ and total pressure recovery coefficient σ for the same points. Under over-expanded conditions, the σ value reaches its minimum value due to the loss of normal shockwaves in the divergent section. Conversely, in subcritical and fully expanded (including slightly under-expanded conditions), natural mixing losses are comparatively minimal, resulting in σ approaching unity. Operation of the ejector nozzle in over-expanded conditions should be strictly avoided.

4.2. Features of Design Condition

During the VCE design phase, the selection of design point parameters for the ejector nozzle must account for operational constraints. Figure 25 demonstrates the relative pressure relationships along the fully expanded conditions line and the Φ σ correlations with different A s , 0 / A p , 0 ratios.
Figure 25a,b demonstrates that when the secondary flow total pressure equals the primary flow total pressure ( P s * / P p * = 1 ), the corrected mass flow ratio Φ corresponds to the merging plane area ratio A s , 0 / A p , 0 ( A s , 0 / A p , 0 = k = 1 in Figure 25), and the total pressure recovery coefficient σ approaches unity. As the secondary flow total pressure decreases and the ejector nozzle approaches the choke state condition, Φ trends toward zero, while σ initially decreases and then increases. This behavior arises because the model only accounts for mixing region losses and neglects viscous effects such as friction. At complete choking, secondary flow ceases ( Φ = 0 ), and the mixing region vanishes, leading to σ = 1 in the model. However, actual flow fields exhibit residual losses due to secondary flow recirculation and boundary layer effects. For VCE performance calculations, the near-choked point (marked by the σ minimum) should replace the theoretical choked point to avoid overestimating losses.
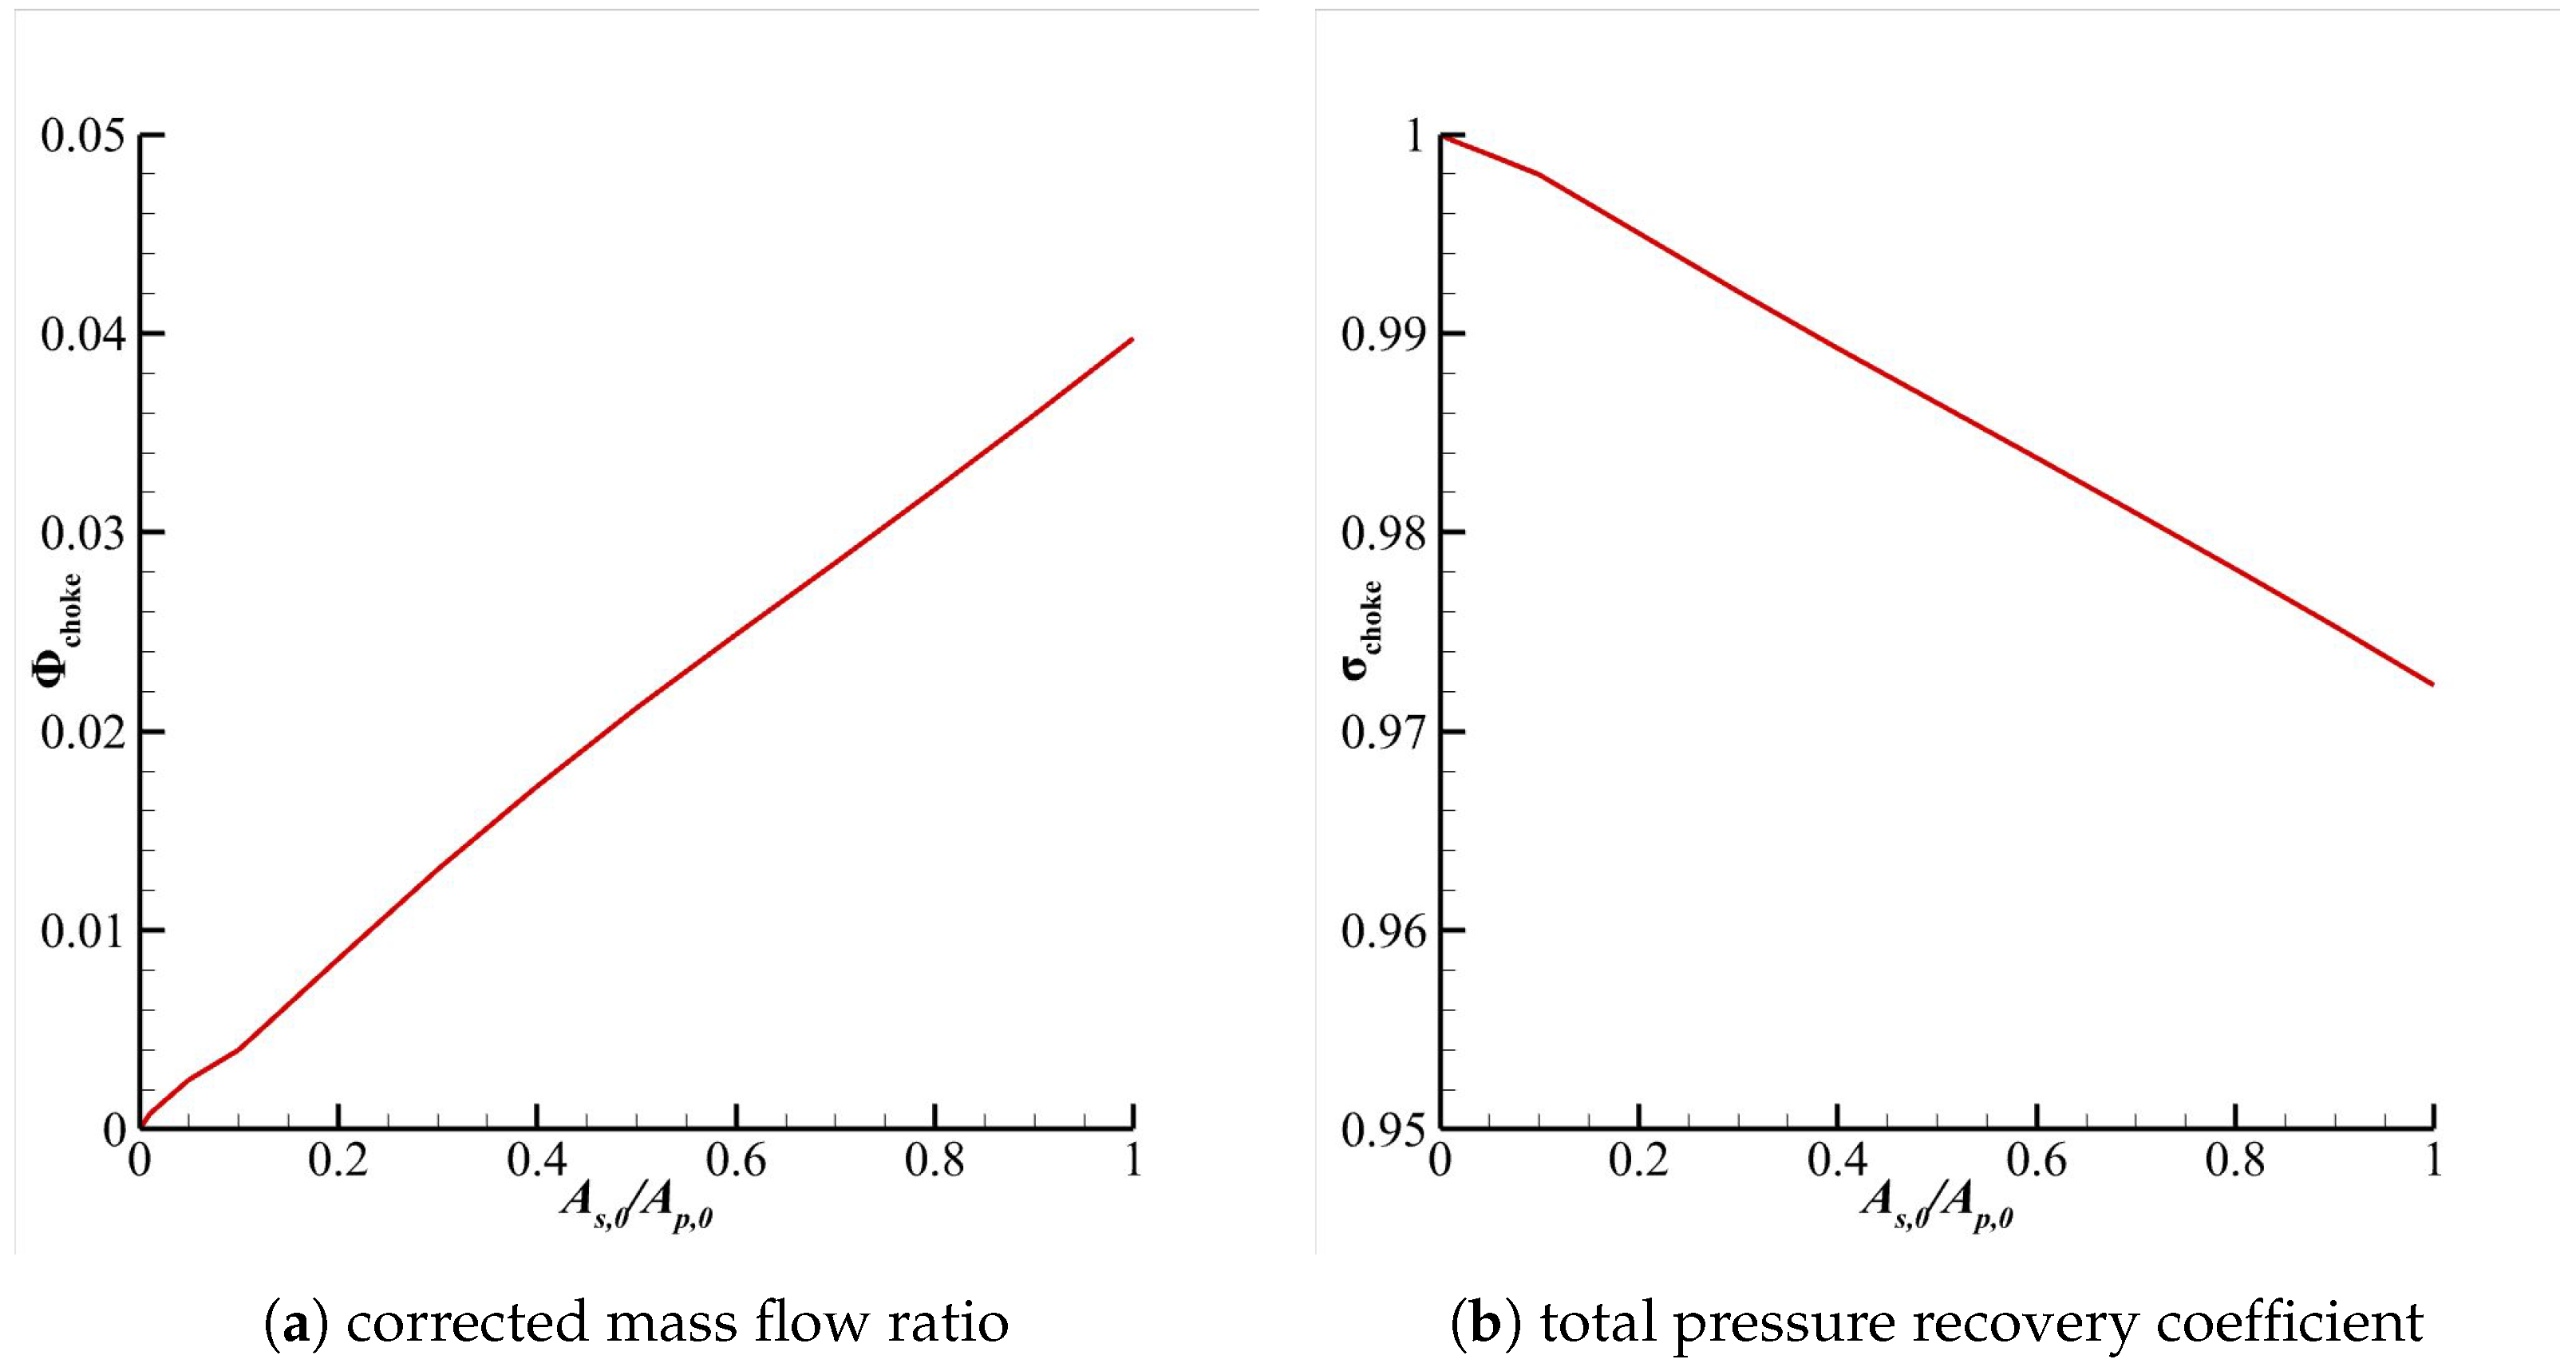
By selecting parameters near the near-choked condition, the relationships between A s , 0 / A p , 0 and normalized Φ (Figure 26a), as well as merging A s , 0 / A p , 0 and σ (Figure 26b), were obtained. Both correlations exhibit approximately linear trends.

5. Consultation

This study systematically investigated the flow field structure within ejector nozzles, yielding the following key conclusions through integrated analytical and numerical analyses:
  • The flow field in the divergent section of the ejector nozzle has been categorized into three distinct regions: the primary flow region, the secondary flow region, and the mixing region. A quasi-one-dimensional ejector nozzle model was developed based on this zonal framework, incorporating computational algorithms for parametric analysis. Comparative validation with CFD simulations demonstrates the model’s robustness, achieving relative errors below 3% in predicting pressure recovery and mass flow characteristics. This agreement corroborates the model’s reliability for engineering applications.
  • Four distinct flow regimes have been identified: under-expanded, fully expanded, over-expanded (characterized by single or dual normal shockwaves), and subcritical state. Notably, the over-expanded regime in ejector nozzles exhibits unique shockwave interactions, specifically configurations with one or two normal shockwaves, which amplify total pressure losses compared to conventional convergent–divergent nozzles. These findings establish a refined classification scheme for ejector nozzle flow dynamics.
  • Based on the quasi-one-dimensional model, the flow and loss characteristics of the ejector nozzle under design conditions have been analyzed. Decreasing the total pressure of secondary flow will increase the mixing loss, and the total pressure recovery coefficient may decrease to 97.1% when A s , 0 / A p , 0 = 1 . Additionally, the relationship between the merging plane area ratio A s , 0 / A p , 0 and corrected mass flow ratio Φ was examined. Increasing the secondary flow area at the merging plane reduces mixing losses.
In the quasi-one-dimensional ejector nozzle model, the utilization of the mixing layer growth rate for calculating the mixing region thickness demonstrates validity, primarily for axisymmetric or two-dimensional flow channels. However, this approach may exhibit limitations when applied to forced mixing mechanisms such as lobed mixer-induced flow regimes. To address this, future research could incorporate geometric modifiers like shape factors to enhance predictive accuracy.
To further verify the validity of the quasi-one-dimensional ejector model, two-dimensional ejector nozzle and axisymmetric ejector nozzle experiments will be conducted in the follow-up study. The velocity and pressure distributions at the ejector nozzle exit will be measured, and the areas of the main flow region, secondary flow region, and mixing layer region on the exit surface will be identified under different conditions. The total pressure recovery coefficient and the corrected mass flow ratio will be calculated using pressure and temperature probes placed at the inlet and outlet of the test section. Additionally, the deviation between the theoretical and actual values can be analyzed to improve the model.

Author Contributions

Conceptualization, J.C. and K.H.; methodology, J.C. and K.H.; software, J.C.; validation, J.C. and J.Z.; formal analysis, J.C. and G.W.; investigation, J.C. and G.W.; resources, K.H.; data curation, J.C.; writing—original draft preparation, J.C.; writing—review and editing, J.C. and J.Z.; visualization, J.C.; supervision, K.H.; project administration, K.H.; funding acquisition, J.Z. All authors have read and agreed to the published version of the manuscript.

Funding

This research received no external funding.

Data Availability Statement

The raw data supporting the conclusions of this article will be made available by the authors upon request.

Conflicts of Interest

The authors declare no conflicts of interest.

Nomenclature and Abbreviations

Nomenclature
avelocity of sound, m/s
rvelocity ratio on both sides of the mixed layer
sdensity ratio on both sides of the mixed layer
Athrough flow area, m 2
Henthalpy, J/kg
MMach number
Ppressure, Pa
Ttemperature, K
Uvelocity, m/s
Vvelocity, m/s
m ˙ mass flow rate, kg/s
γ specific heat capacity ratio
ρ density, m 3 / kg
λ mixing layer growth rate
σ total pressure recovery coefficient
Φ corrected mass flow ratio
M c convective Mach number
C δ non-dimensional constant for calculation of λ
C p specific heat capacity
R g gas state constant
Subscripts
0merging plane
iposition where secondary flow is critical
xmain flow direction
pprimary flow
ssecondary flow
mmixing flow
o u t outlet
Superscripts
stagnation parameter
Abbreviations
2DCDTwo-Dimensional Convergent–Divergent
ACEAdaptive Cycle Engine
CDFSCore Drive Fan Stage
CFDComputational Fluid Dynamics
FFanFront Fan
FVABIFront Variable Area Bypass Injector
HPCHigh-Pressure Compressor
HPTHigh-Pressure Turbine
LPTLow-Pressure Turbine
MSVMode Select Valve
RANSReynolds-Averaged Navier–Stokes
RBCCRocket-Based Combined Cycle
RFanRear Fan
RVABIRear Variable Area Bypass Injector
S-ASpalart–Allmaras
SSTShear Stress Transport
VCEVariable Cycle Engine

References

  1. Yin, Z.; Yu, D.; Xu, X. Development trend and technical challenge of high Mach number turbine based propulsion system. Aeroengine 2021, 47, 1–7. [Google Scholar]
  2. Fang, C. Variable Cycle Engine. Gas Turbine Exp. Res. 2004, 3, 1–5. [Google Scholar]
  3. Joachim, K.; Ian, H. Propulsion and Power: An Exploration of Gas Turbine Performance Modeling, 1st ed.; Springer: Cham, Switzerland, 2018. [Google Scholar]
  4. Merlin, P.W. Design and Development of the Blackbird: Challenges and Lessons Learned. In Proceedings of the 47th AIAA Aerospace Sciences Meeting Including the New Horizons Forum and Aerospace Exposition, Orlando, FL, USA, 5–8 January 2009. [Google Scholar]
  5. Murthy, S.N.B.; Curran, E.T. Developments in High-Speed Vehicle Propulsion Systems, 1st ed.; American Institute of Aeronautics and Astronautics, Inc.: Washington, DC, USA, 1996. [Google Scholar]
  6. Simmons, R.J. Design and Control of a Variable Geometry Turbofan with an Independently Modulated Third Stream. Ph.D. Thesis, The Ohio State University, Columbus, OH, USA, 2009. [Google Scholar]
  7. Zhang, S.; Zheng, X.; Lv, Y.; Qiao, X.; Zhang, Y. Research progress of oversea combined cycle propulsion technology. Sci. Technol. Rev. 2020, 38, 33–53. [Google Scholar]
  8. Xu, Z.; Tang, H.; Chen, M.; Zhang, J. Installed Performance of Adaptive Cycle Engine Ejector Nozzle Based on Multi-Fidelity Simulation. J. Propuls. Technol. 2023, 44, 2207083. [Google Scholar]
  9. Toulmay, F. Internal Aerodynamics of Infrared Suppressors for Helicopter Engines. J. Am. Helicopter Soc. 1988, 33, 4–14. [Google Scholar] [CrossRef]
  10. Huang, B.J.; Chang, J.M.; Wang, C.P.; Petrenko, V.A. A 1-D Analysis of Ejector Performance. Int. J. Refrig. 1999, 22, 354–364. [Google Scholar] [CrossRef]
  11. Chou, S.K.; Yang, P.R.; Yap, C. Maximum Mass Flow Ratio Due to Secondary Flow Choking in an Ejector Refrigeration System. Int. J. Refrig. 2001, 24, 486–499. [Google Scholar] [CrossRef]
  12. Shan, Y.; Pan, C.-X.; Zhang, J.-Z. Investigation on Incompressible Lobed Mixer-Ejector Performance. J. Propuls. Power 2015, 31, 265–277. [Google Scholar] [CrossRef]
  13. Chen, H.; Cai, C.; Jiang, S.; Zhang, H. Numerical Modeling on Installed Performance of Turbofan Engine with Inlet Ejector. Aerosp. Sci. Technol. 2021, 112, 106590. [Google Scholar] [CrossRef]
  14. Hatim, S.R.; Donald, R.W. Simulation of a Low-Bypass Turbofan Engine with an Ejector Nozzle Using NPSS. In Proceedings of the 53rd AIAA/SAE/ASEE Joint Propulsion Conference, Atlanta, GA, USA, 10–12 July 2017. [Google Scholar]
  15. Luo, F.; Qu, Z.; Long, Y.; Chen, W.; Hou, J.; Wei, B. Thermodynamic Performance Modeling, Optimization and Numerical Simulation of Rbcc Ejector Mode. Propuls. Power Res. 2024, 13, 207–232. [Google Scholar] [CrossRef]
  16. Enomoto, S.; Yanagi, R.; Sasaki, M. Internal Flow Field and Mass Flow Rate of 2DCD Ejector Nozzles. In Proceedings of the 34th AIAA/ASME/SAE/ASEE Joint Propulsion Conference and Exhibit, Cleveland, OH, USA, 13–15 July 1998. AIAA-98-3106. [Google Scholar]
  17. Presz, W.M., Jr.; Werle, M. Multi-Stage Mixer/Ejector Systems. In Proceedings of the 38th AIAA/ASME/SAE/ASEE Joint Propulsion Conference & Exhibit, Indianapolis, IN, USA, 7–10 July 2002; AIAA: Indianapolis, IN, USA, 2002; p. 11. [Google Scholar]
  18. Chen, Q.; Birk, A.M. Experimental Study of Oblong Exhaust Ejectors with Multi-Ring Oblong Entraining Diffusers. J. Eng. Gas Turbines Power 2009, 131, 9. [Google Scholar] [CrossRef]
  19. Shan, Y.; Zhang, J.-Z. Numerical Investigation of Flow Mixture Enhancement and Infrared Radiation Shield by Lobed Forced Mixer. Appl. Therm. Eng. 2009, 29, 3687–3695. [Google Scholar] [CrossRef]
  20. Li, Z.; Xu, W.; Liang, T.; Ye, W.; Zhang, Z. Experimental and Numerical Studies on the Performance of Supersonic Multi-Nozzle Ejector. Appl. Therm. Eng. Des. Processes Equip. Econ. 2024, 242, 122409. [Google Scholar] [CrossRef]
  21. Li, Z.; Wang, H.; Huang, H. Analysis of flow field of three-dimensional ejector nozzle with open-close alternate intake valve at transonic velocity. J. Aerosp. Power 2023, 38, 2937–2947. [Google Scholar]
  22. Han, J.; Pang, Z.; Feng, J.; Besagni, G.; Mereu, R.; Inzoli, F.; Peng, X. Experimental and Numerical Study on the Ejector Containing Condensable Species in the Secondary Flow for Pem Fuel Cell Applications. Appl. Therm. Eng. 2023, 232, 121091. [Google Scholar] [CrossRef]
  23. Abbady, K.; Al-Mutawa, N.; Almutairi, A. The Performance Analysis of a Variable Geometry Ejector Utilizing CFD and Artificial Neural Network. Energy Convers. Manag. 2023, 9, 291. [Google Scholar] [CrossRef]
  24. Anderson, B.H. Assessment of an Analytical Procedure for Predicting Supersonic Ejector Nozzle Performance; NASA-TN-D-7601; NASA Lewis Research Center: Cleveland, OH, USA, 1974. [Google Scholar]
  25. Abramowich, G.N. The Theory of Turbulent Jets; MIT Press: Cambridge, MA, USA, 1963. [Google Scholar]
  26. Sabin, C.M. An Analytical and Experimental Study of the Plane, Incompressible, Turbulent Free-Shear Layer with Arbitrary Velocity Ratio and Pressure Gradient. J. Basic Eng. 1965, 8, 421–428. [Google Scholar] [CrossRef]
  27. Papamoschou, D.; Roshko, A. Observations of supersonic free shear layers. In Proceedings of the 24th Aerospace Sciences Meeting, Reno, NV, USA, 6–9 January 1986. [Google Scholar]
  28. Papamoschou, D.; Roshko, A. The compressible turbulent shear layer: An experimental study. J. Fluid Mech. 1988, 197, 453–477. [Google Scholar] [CrossRef]
  29. Dimotakis, P.E. Turbulent Free Shear Layer Mixing and Combustion. High-Speed Flight Propulsion Systems. 1991, pp. 265–340. Available online: https://arc.aiaa.org/doi/10.2514/5.9781600866104.0265.0340 (accessed on 18 August 2025).
  30. Slessor, M.D.; Zhuang, M.; Dimotakis, P.E. Turbulent shear-layer mixing: Growth-rate compressibility scaling. J. Fluid Mech. 2000, 414, 35–45. [Google Scholar] [CrossRef]
  31. McBride, B.J.; Zehe, M.J.; Gordon, S. Nasa Glenn Coefficients for Calculating Thermodynamic Properties of Individual Species. NASA. 2002. Available online: https://ntrs.nasa.gov/citations/20020085330 (accessed on 18 August 2025).
Figure 1. Scheme of J-58 engine [7].
Aerospace 12 00882 g001
Figure 2. Scheme of ACE (explanations of abbreviations are provided in Abbreviations section) [8].
Aerospace 12 00882 g002
Figure 3. Flow scheme of mixing flow (where γ is specific heat capacity ratio, ρ is density, a is velocity of local sound, and P is static pressure).
Aerospace 12 00882 g003
Figure 4. Cross-section of test model for 2DCD ejector nozzle.
Aerospace 12 00882 g004
Figure 5. Computational model grid mesh.
Aerospace 12 00882 g005
Figure 6. Mach–Zehnder interferogram of experiment.
Aerospace 12 00882 g006
Figure 7. Density contour.
Aerospace 12 00882 g007
Figure 8. Side wall pressure distribution.
Aerospace 12 00882 g008
Figure 9. Critical flow field of ejector nozzle.
Aerospace 12 00882 g009
Figure 10. Mach number contour: (a) variation in Ma with pressure ratio at constant temperature ratio; (b) variation in Ma with temperature ratio at constant pressure ratio.
Aerospace 12 00882 g010
Figure 11. Inlet Mach number: (a) total temperature ratio remains constant; (b) total pressure ratio remains constant.
Aerospace 12 00882 g011
Figure 12. Static pressure and temperature contour: (a) total temperature ratio remains constant; (b) total pressure ratio remains constant.
Aerospace 12 00882 g012
Figure 13. Pressure and temperature distribution along streamlines.
Aerospace 12 00882 g013
Figure 14. Static pressure distribution at different x stations.
Aerospace 12 00882 g014
Figure 15. Pressure and temperature distribution at the outlet.
Aerospace 12 00882 g015
Figure 16. Critical flow field of ejector nozzle (slip wall boundary).
Aerospace 12 00882 g016
Figure 17. Ejector nozzle internal flow (fully expanded).
Aerospace 12 00882 g017
Figure 18. Ejector nozzle internal flow (choke state).
Aerospace 12 00882 g018
Figure 19. Ejector nozzle internal flow (subcritical).
Aerospace 12 00882 g019
Figure 20. Ejector nozzle internal flow (over-expanded with two shockwaves).
Aerospace 12 00882 g020
Figure 21. Ejector nozzle internal flow (over-expanded with one shockwave).
Aerospace 12 00882 g021
Figure 22. Ejector models for validation.
Aerospace 12 00882 g022
Figure 23. Mach number contour maps under different conditions.
Aerospace 12 00882 g023
Figure 24. Different work points with fixed geometry.
Aerospace 12 00882 g024
Figure 25. Feature map of design conditions with different A s , 0 / A p , 0 .
Aerospace 12 00882 g025
Figure 26. Relations under near-choked conditions.
Aerospace 12 00882 g026
Table 1. Coefficients for calculating specific heat capacity.
CoefValue ( T < 1000 K)Value ( T 1000 K)
a 1 9.602141 × 10 3 2.404676 × 10 5
a 2 1.883145 × 10 2 1.265608 × 10 3
a 3 4.963670 × 10 0 5.192477 × 10 0
a 4 5.554567 × 10 3 2.157294 × 10 4
a 5 1.043346 × 10 5 7.118266 × 10 8
a 6 7.804852 × 10 9 1.076601 × 10 11
a 7 2.153681 × 10 12 6.605179 × 10 16
Table 2. Performance of model calculations and CFD results.
CFD Model
Case P s * / P p * P out / P p * Φ σ P s * / P p * P out / P p * Φ σ
design0.90.1520.89999.99%0.90.1520.897100.00%
choke0.1530.0550.02297.32%0.1600.0550.03497.14%
Disclaimer/Publisher’s Note: The statements, opinions and data contained in all publications are solely those of the individual author(s) and contributor(s) and not of MDPI and/or the editor(s). MDPI and/or the editor(s) disclaim responsibility for any injury to people or property resulting from any ideas, methods, instructions or products referred to in the content.