Article

Numerical Analyses of Surge Process in a Small-Scale Turbojet Engine by Three-Dimensional Full-Engine Simulation

by
Mengyang Wen
1,
Heli Yang
1,
Xuedong Zheng
1,
Weihan Kong
1,
Zechen Ding
1,
Rusheng Li
2,
Lei Jin
2,3,
Baotong Wang
1,* and
Xinqian Zheng
3
1
Institute for Aero Engine, Tsinghua University, Beijing 100084, China
2
Hawk Power Technology Co., Ltd., Neijiang 641005, China
3
School of Vehicle and Mobility, Tsinghua University, Beijing 100084, China
*
Author to whom correspondence should be addressed.
Aerospace 2025, 12(10), 878; https://doi.org/10.3390/aerospace12100878
Submission received: 12 August 2025 / Revised: 17 September 2025 / Accepted: 23 September 2025 / Published: 29 September 2025
(This article belongs to the Special Issue Numerical Modelling of Aerospace Propulsion)

Abstract

Surge is a typical aerodynamic instability phenomenon in the compressors of aeroengines. The surge can lead to severe performance degradation and even structural damage to the engine and the air vehicle, making it a longstanding critical concern in the industry. Analyzing and understanding the surge process contributes to enhancing the aerodynamic stability of designed compressors. Previous research in this field often focuses solely on the compressor itself while neglecting the mutual interaction between the compressor and other components in the entire engine system. This study investigates the compressor surge process within an integrated engine environment using a full-engine three-dimensional Unsteady Reynolds-averaged Navier–Stokes (URANS) simulation method for the entire engine system, validated through variable geometry turbine experiments on a small turbojet engine. The result demonstrates that the integrated three-dimensional simulation approach can capture the primary flow characteristics of the compression system during surge within an integrated engine environment. Under the influence of the variable geometry turbine, the studied small turbojet engine enters a state of mild surge. This paper also investigates the changes in aerodynamic forces during surge and reveals the two-regime surge phenomenon that exists during the engine surge.

1. Introduction

Driven by the demands for high thrust and low fuel consumption, design specifications for modern aero-engine compression systems are continuously raised. Enhanced compressor performance imposes stricter requirements on engine stability [1,2]. Under these circumstances, it has become increasingly important to accurately predict aerodynamic instability characteristics of compression systems in full-engine environments. Existing research on aerodynamic stability of compression systems in full-engine environments is mostly limited to low-dimensional simulation analyses. Fully coupled three-dimensional simulation studies considering interactions among multiple components are relatively scarce.
Researchers in the field have continued to study aerodynamic instabilities in compression systems. Emmons et al. [3] first proposed the fundamental theory describing the mechanisms of rotating stall and surge observed in experiments, along with their dynamic characteristics, thereby laying the groundwork for subsequent research in this domain. Through further experimental measurements and theoretical analyses, McDougall et al. [4] and Day [5] expanded the understanding of aerodynamic instability phenomena and developed theories describing the formation and progression of stall in axial compressors. Moore and Greitzer [6,7] advanced the lumped-parameter model, enabling theoretical predictions of aerodynamic instabilities in axial compressors. Due to the complex three-dimensional design and high aerodynamic loading, the aerodynamic instability processes in centrifugal compressors are more complicated. Fink [8] incorporated rotational inertia into the Greitzer model. Zheng [9] revealed rotational-speed-dependent instability mode variations based on the B-parameter. Sun [10,11] elaborated on the typical instability processes of centrifugal compressors across various spool speeds and incorporated the asymmetric characteristics of volutes into the discussion. Lin and Zheng [12,13] revealed the mechanism of the two-regime surge.
Compressor aerodynamic instability phenomena are often closely related to their upstream and downstream system environments. Studying compressor aerodynamic instability in a full-engine environment is crucial. Burwell [14] conducted surge inception tests research on a turbojet engine under full-engine conditions, using high-frequency dynamic pressure probes to record aerodynamic processes before and after surge occurrence. Lorenzo [15], Höss [16], Wilson [17], and Bae [18] employed fuel-spiking method, variable nozzle method, and water injection method to obtain aerodynamic instability characteristics of compressor components during full-engine testing. In simulation studies, the Greitzer lumped-parameter model [6,7,19] first considered the significant influence of system parameters on compression systems, and subsequent research has simulated compressor aerodynamic instability processes in full-engine environments using 0-dimensional and 1-dimensional methods [20,21]. Additionally, Andrew [22] developed an instability prediction method based on eigenvalue problems from the perspective of numerical stability. This method determines system instability by solving the eigenvalues of the linearized system and judging the sign of the imaginary part of the eigenvalues. On this basis, Sun et al. [23] developed a general theoretical model for turbomachinery flow stability based on immersed boundary conditions and the concept of global stability analysis.
The full-engine three-dimensional simulation method is an approach that integrates three-dimensional modeling of all mainstream engine components for integrated simulation. Both PW [24] and GE [25,26] companies have used this method for performance evaluation of their product engines. In the academic field, Teixeira et al. [27] and Romagnosi et al. [28] conducted three-dimensional modeling simulations of steady-state and non-steady-state processes for small turbojet engines, Xu [29] performed simulations on a small turbojet engine and detailed the differences between full-engine fully coupled simulation results and independent component simulation results, Wei [30] conducted full-engine three-dimensional fluid-solid-thermal coupling simulations on a small turbojet engine, providing computational results of multi-physical fields in the full-engine environment. The advantage of the full-engine three-dimensional simulation method used in the entire engine lies in its ability to simultaneously solve the flow fields throughout the entire engine flow path while fully accounting for the interactions between components.
From the previous studies, it is concluded that the reduced-order model is generally employed to analyze the instability in the engine system. Even though the three-dimensional simulations have recently been adopted for engine steady performance evaluation, few studies have focused on the instability analysis by three-dimensional simulation at the engine level. This study will employ the full-engine three-dimensional simulation method into the engine to conduct the surge simulations on a small turbojet engine, validate against experimental results, analyze the main characteristics of its surge process, and further discuss the axial force based on the simulation.

2. Numerical and Experimental Methods

2.1. Case Description

This paper focuses on a modified small turbojet engine featuring a variable-geometry turbine. This small turbojet engine consists of a single-stage centrifugal compressor, an annular evaporation tube combustor, and a single-stage axial-flow turbine. The single-stage centrifugal compressor is equipped with a centrifugal impeller and a diffuser. The combustor component comprises 12 evaporation tubes, each containing individual fuel pipes controlled by a unified fuel supply system. The turbine component consists of one stage of variable-geometry adjustable turbine stator blades and one row of rotor blades; the variable-geometry turbine stators (VGTS) can change their geometric angle based on test control commands independent of the engine control unit (ECU), thereby achieving surge inception. Its specific structure is introduced in the following section. This small turbojet engine is also equipped with an inlet and an exhaust nozzle. The main geometry parameters of this small engine are shown in Table 1.
The specific structure of this small engine is illustrated in Figure 1. In the figure, red blocks indicate the rotor blades, and blue blocks indicate the stator blades. The figure marks the numbers of key aerodynamic sections, and these labels will designate these specific sectional positions in subsequent sections.

2.2. Experimental Methods

The engine surge test in this study was conducted on a small engine test bench. The fuel supply, power supply, and control of the engine were all implemented through the test bench. During the test, the measurement of aerodynamic parameters was achieved by 20 high-frequency dynamic pressure sensors. Based on the experience from existing research [31], two types of Kulite dynamic pressure sensors were selected for this test. The XTEH-10L-190 (Kulite Semiconductor Products, Inc., Leonia, NJ, USA) can withstand higher temperatures and was placed at the combustion chamber inlet to prevent damage to the probe from high-temperature gas backflow during surge. The XTE-190(M)-40A (Kulite Semiconductor Products, Inc., Leonia, NJ, USA) was placed in other locations. The voltage signals were collected by a data acquisition system. In this experiment, three SIRIUS-STGM+ acquisition devices produced by Dewesoft (Trbovlje, Slovenia) were used, and the acquisition devices were time-synchronized. This paper mainly focuses on the surge phenomena of the small turbojet engine; the surge frequency is about 100 Hz, and the frequencies of the probes and acquisition devices are 20 kHz and 200 kHz, respectively, meeting the requirements for measuring the surge phenomenon. The main performance parameters of the dynamic pressure sensors used in this study are shown in Table 2 below, where FSO stands for full-scale output.
Figure 2 shows a schematic diagram of the whole engine test bench for the variable geometry turbine engine. The engine was fixed to the thrust measurement arm of the test bench via a fixed ring and fixed fins connected to the engine casing position. The high-temperature, high-speed exhaust gas from the engine was discharged into the atmosphere through the exhaust treatment system. The engine intake conditions were local atmospheric conditions. During the test, the engine’s fuel rates at different working points were handled by a specially configured ECU. The angle control of the engine’s variable geometry turbine was undertaken by an additional control system. Such control systems are widely used in whole engine performance tests of engines with similar sizes [32].
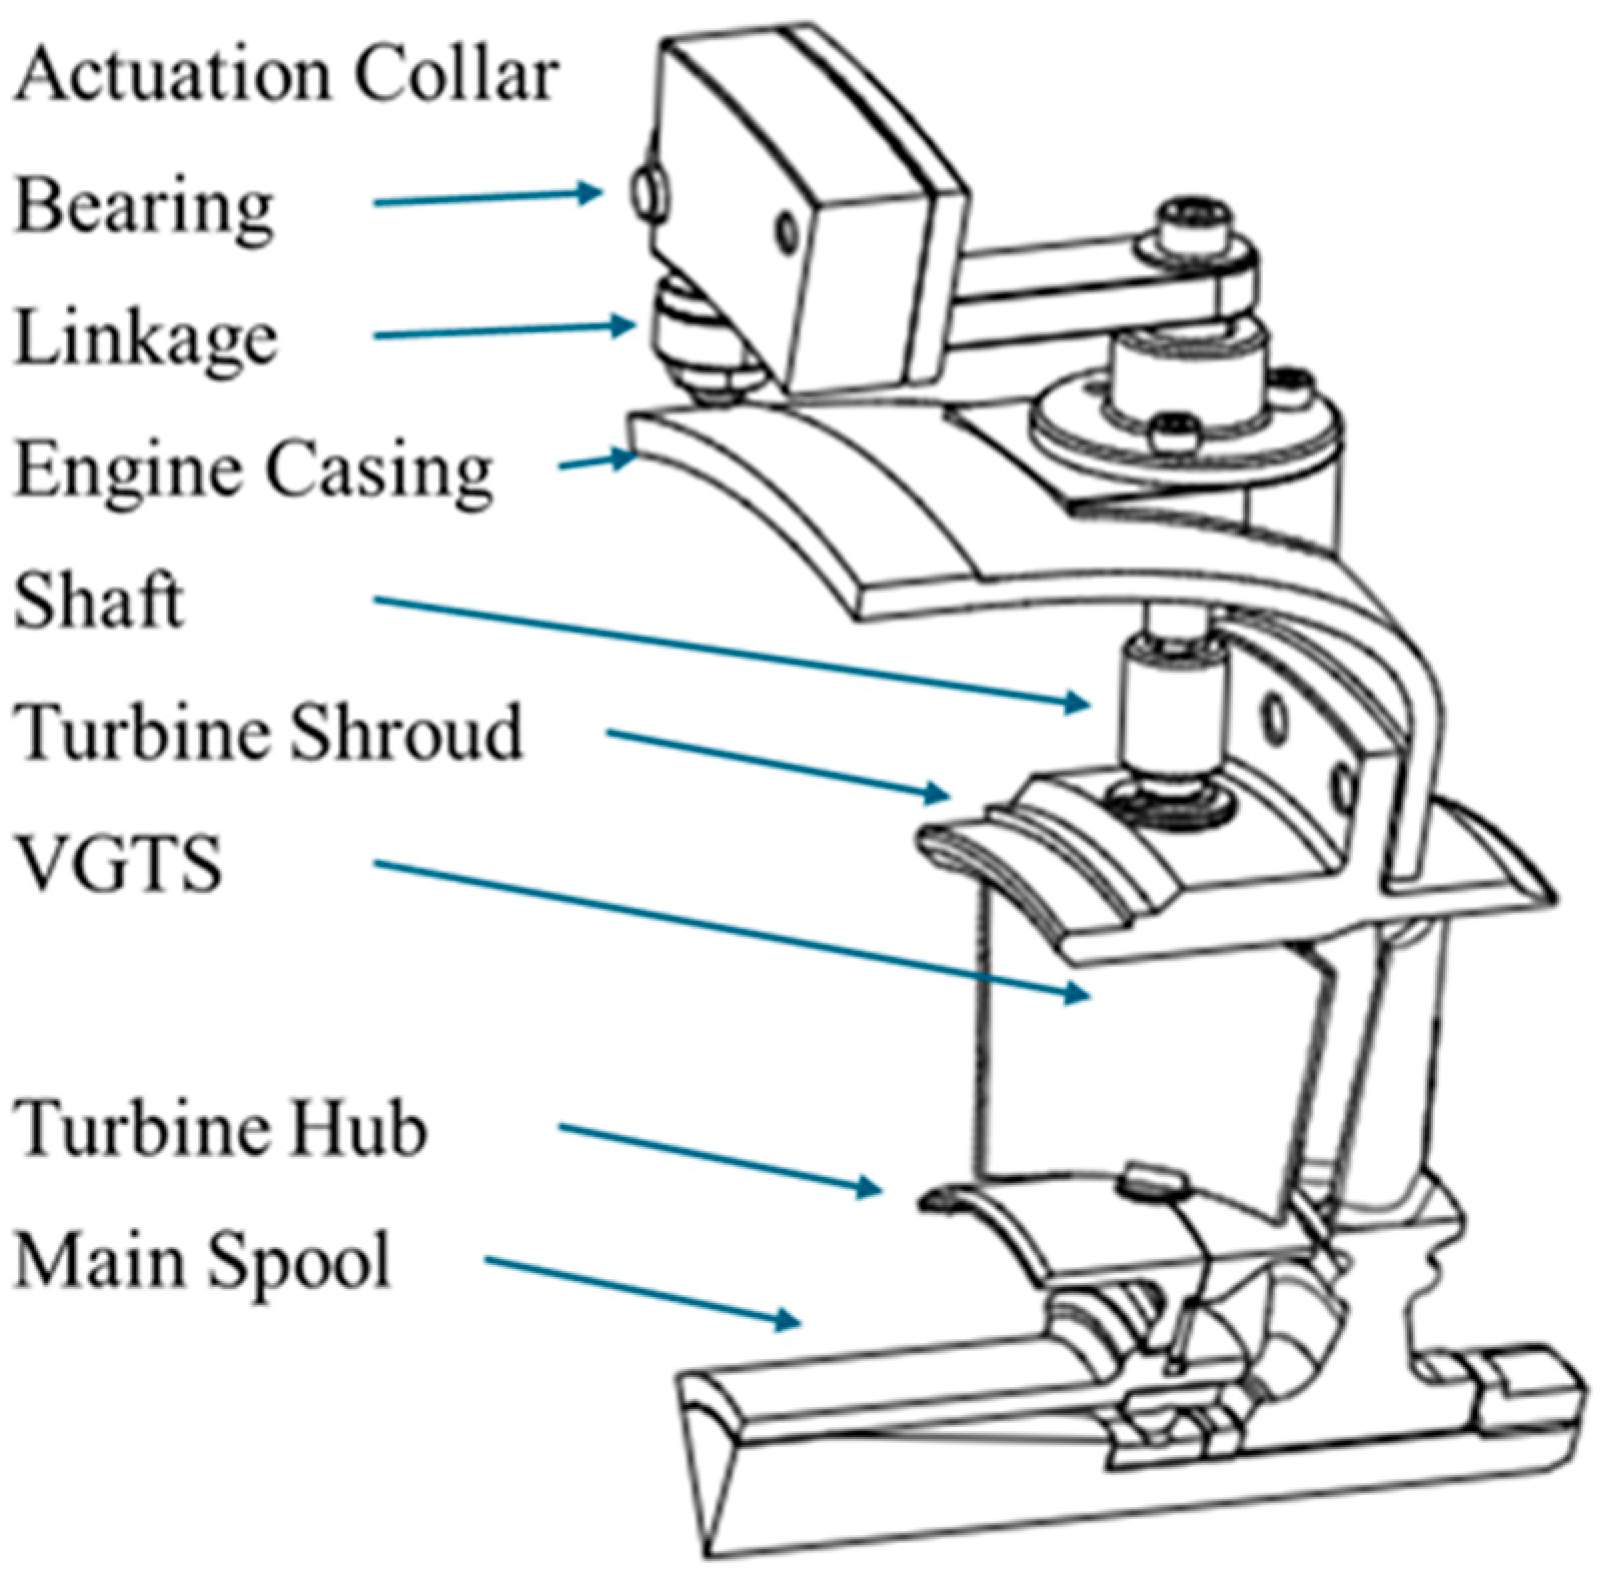
In the test, a variable geometry turbine method was used to induce surge in the engine. The variable geometry turbine component was modified from the original turbine component of the engine, and its general structure is shown in Figure 3. Rotating shafts were added to the turbine stator blades, led out through sealing structures to the outside of the engine casing, and connected to an actuator ring via a series of linkages. During the test, driven by a stepper motor, the actuator ring could rotate clockwise and counterclockwise, thereby driving each VGTS vane to synchronously rotate at the same angle. This system was verified under static and transient loads to maintain reliability during surge. Before assembling the test rig, the variable geometry device was precisely calibrated to ensure consistent actuation angles of all vanes. The actuation range of VGTS is −7 degrees to +14 degrees. After calibration, the accuracy of the actuator mechanism is within 1 degree. During the test, after reaching the test’s target spool speed, the VGTS was slowly closed to throttle the engine. Due to engine matching effects, fluctuations occurred in the main aerodynamic parameters and spool speed. After each actuation, several seconds were waited for the aerodynamic parameters to stabilize before further closing the VGTS until the engine entered an aerodynamic instability state.

2.3. Numerical Methods

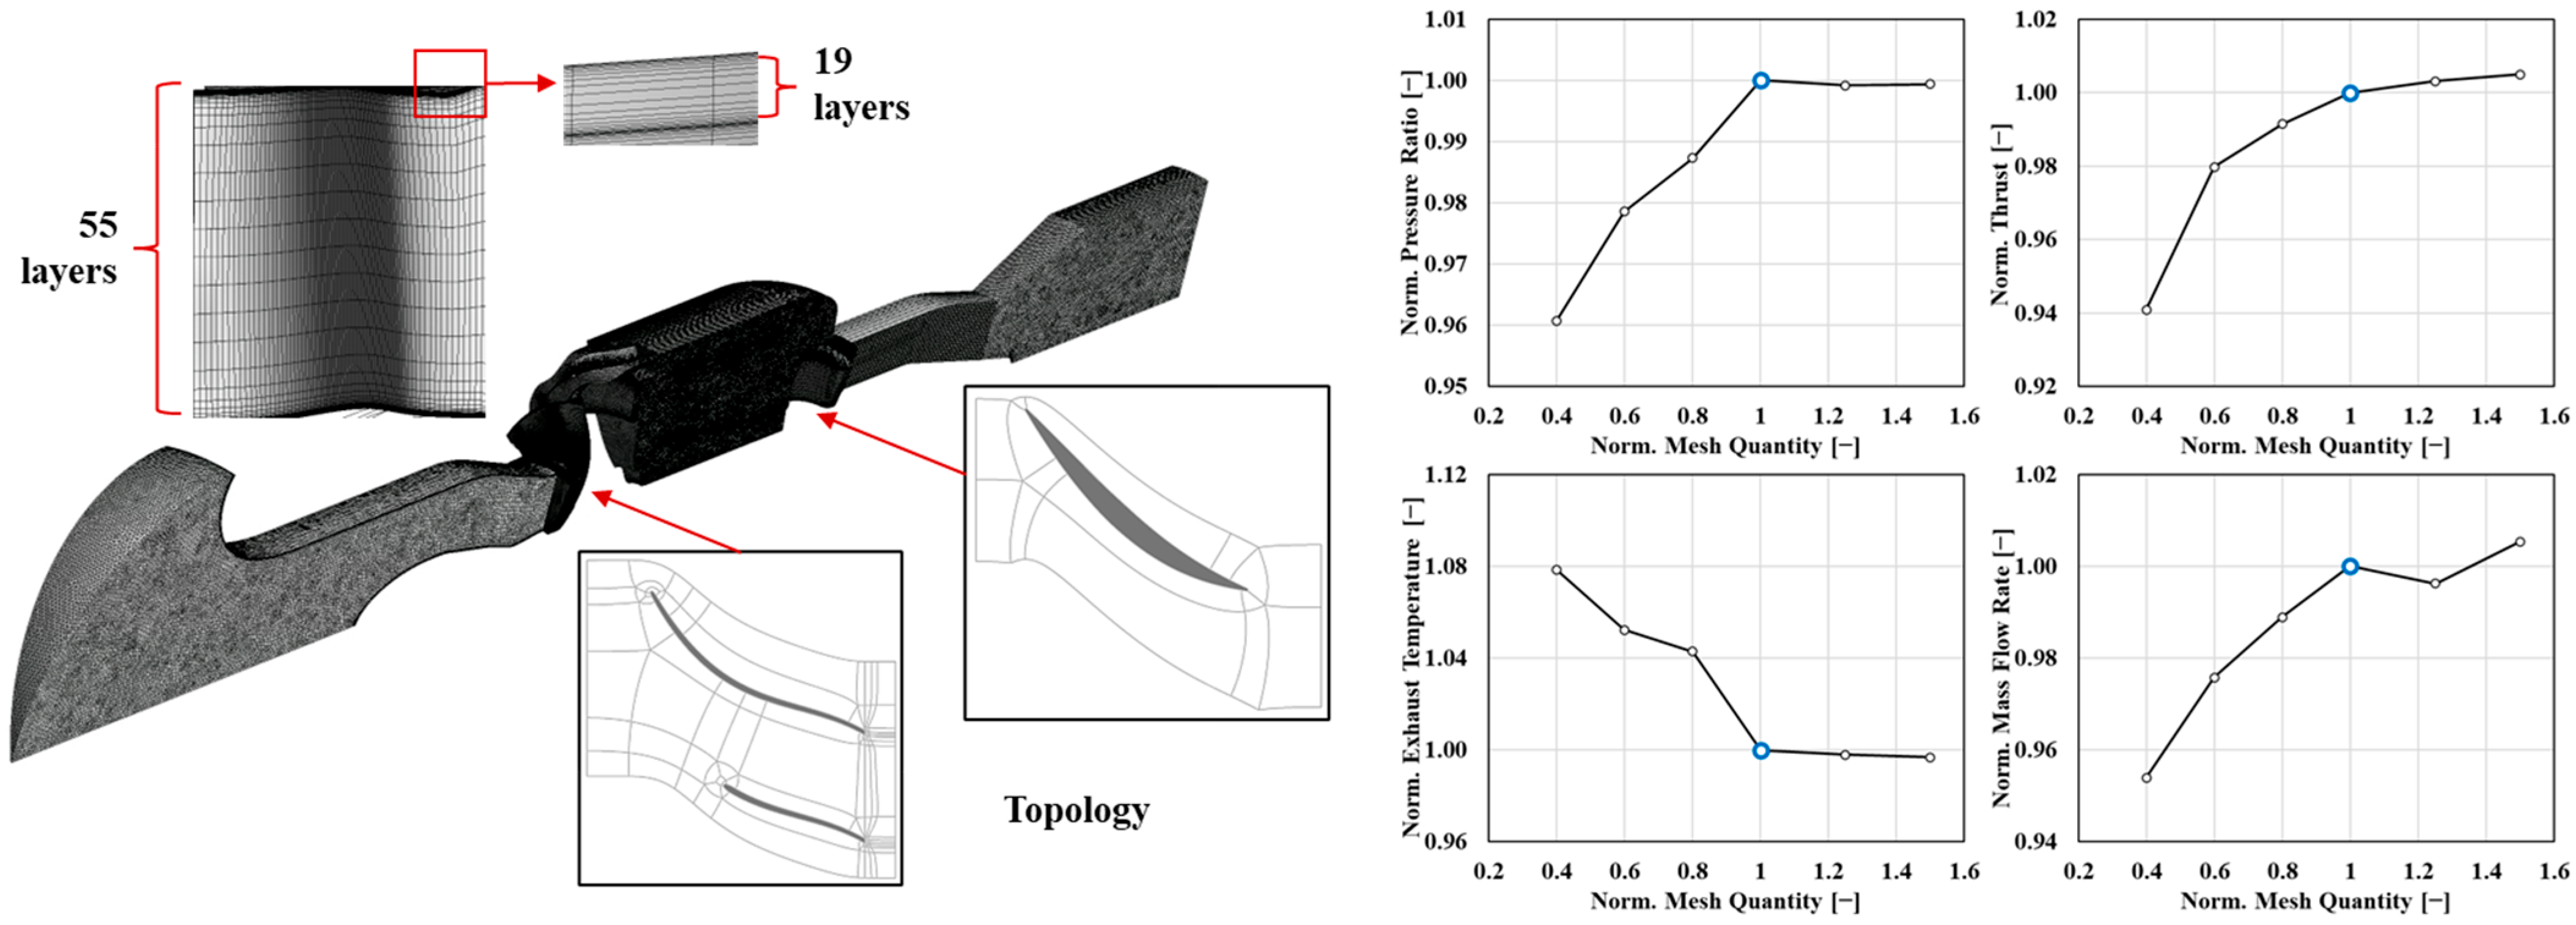
This study adopted the URANS method to establish a full-engine single-passage simulation model for the small-scale turbojet engine. In this model, the URANS equations were solved in the compressor fluid domain using the ANSYS CFX 2023 solver. Figure 4 shows the fluid domain mesh used in this study. For turbomachinery components, hexahedral meshes generated by Ansys TurboGrid were employed. The mesh utilized 19 layers of inflation mesh at the tip clearance location and 55 layers along the blade spanwise direction. A first-layer thickness of 0.003 mm was applied on blade surfaces to keep y+ values for most grids next to compressor blades below 3 at the near surge points. Non-turbomachinery components of the engine used Tetrahedral meshes generated by Ansys Meshing, with first-layer thickness consistent with that of turbomachinery components. During URANS simulations, the physical time step is set at 5 × 10⁻⁶ s, approximately 19 steps per impeller passage.
To verify grid independence, six sets of meshes were used to calculate steady-state convergence solutions at the 100% speed design point. Figure 4 shows variations in the engine’s main performance parameters and the compressor’s key aerodynamic parameters with the number of mesh nodes. Considering computational reliability and time cost, the mesh configuration marked in blue was adopted. The total mesh count of the selected configuration is approximately 8 million.
The Shear Stress Transport (SST) turbulence model was used to better capture flow separation before compressor surge. Rotor-stator interfaces utilized the sliding mesh model (transient rotor-stator model). Stator-stator interfaces adopted the frozen rotor model to enhance flow field information transfer across interfaces. Both inlet and outlet boundaries were set to sea-level atmospheric conditions. Boundary type of opening was applied at the inlet/outlet to maintain validity during potential flow reversal in the surge process. According to prior surge studies [33,34], surge constitutes a one-dimensional flow variation in the streamwise direction; the single-passage modeling is sufficient to capture primary flow characteristics during surge.
The research team validated the established simulation model using data obtained from full-engine surge tests. Figure 5 shows the variation in dynamic static pressure at the compressor inlet and outlet positions over one surge cycle. In the figure, experimental dynamic pressure was measured by dynamic pressure sensors mounted on the wall at the compressor’s inlet/outlet sections, while simulation results were extracted from numerical probes at identical positions. The raw measured pressure signals underwent filtering, with the grey line representing pre-filtered pressure signals and the black line denoting post-filtered pressure signals. The blue line indicates dynamic pressure signals derived from full-engine URANS simulations. The horizontal axis represents the time normalized by the surge cycle obtained from simulation results, and the vertical axis represents the pressure normalized by the pressure at the start of the surge cycle.
It can be observed from Figure 5 that the full-engine simulation successfully captures the primary trends of pressure variations at the compressor’s inlet/outlet sections during surge and exhibits maximum pressure prediction errors on the order of 5%. The surge cycle predicted by simulation is slightly longer than the experimentally measured cycle, with the prediction deviation of cycle duration also within 5%. The model predictions meet the accuracy requirements of this study. It should also be noted that, during the surge process, experimental measurements captured significantly high-frequency dynamic pressure signals. Some of these signals were not captured by the full-engine 3D simulation. According to previous studies [8,10,31,35], most of these signals are high-frequency components induced by complex flow phenomena such as rotating stall, rotating instability, vortex shedding, and acoustic resonance. The single-period URANS simulation method adopted in this study primarily aims to capture aerodynamic streamwise variations during surge, while the complex flow phenomena exhibit distinct high-periodicity or circumferential variation features. These phenomena fall outside the scope of this research.
In this study, the combustion treatment of the simulation model adopted the Eddy Dissipation Model (EDM) [36], with combustion simulations employing multi-step reactions to accurately simulate fuel evaporation phase change and combustion processes in the combustion chamber. In full-engine simulations, the use of full three-dimensional modeling ensures automatic satisfaction of engine mass flow balance and pressure balance. Power balance was achieved through CFX’s User routine. These routines take input parameters such as compressor and turbine power, along with engine constants such as mechanical efficiency, and output fuel injection mass flow rate or rotor spool speed. During steady-state operating point simulations, to enhance convergence speed, the User-routine control logic maintains constant spool speed and computes fuel flow rate via the Proportional Integral Derivative (PID) method until power balance between compressor and turbine components is achieved. In surge transient simulations, to model spool speed fluctuations during surge, a fixed fuel flow rate is applied, while spool speed is computed in real time based on the power difference and rotational inertia of the rotor. It is noteworthy that actual full-engine surge testing employs constant-speed control logic. However, this control method operates by the ECU adjusting fuel flow to stabilize speed after detecting speed changes, with typical ECU control cycle durations lasting several seconds, which is significantly longer than the 0.01 s surge cycle period of interest in this study. Therefore, the simulation of surge processes does not consider the ECU’s speed regulation through fuel injection adjustments after speed changes caused by surge. Spool speed variations generate angular acceleration, producing additional inertial forces. The solver used in this study can handle the angular acceleration in simulation.

3. Results

3.1. Engine Performance

Figure 6 shows the performance of the small turbojet engine studied in this paper. The engine operating line is obtained by connecting steady-state operating points at different spool speeds. In the figure, the black line represents the full-engine operating parameters measured in full-engine tests, and the blue line indicates the engine operating line predicted using the full-engine URANS model. The horizontal coordinate is the normalized spool speed of the engine, and the vertical coordinate is the normalized key performance parameter of the engine, with both spool speed and performance parameter normalized based on relevant parameters at the design operating point of the engine. It can be seen from the figure that the key performance parameters of the engine obtained from simulation agree well with the experimental results.
For exit gas temperature (EGT), the simulation effectively captures the primary trend of exhaust temperature variation with an error of 10% level. The temperature predicted by the simulation model is higher than that measured in tests. This difference is partly because precise temperature measurement at the hot sections is inherently challenging during testing, resulting in measurement errors. Additionally, the simulation does not account for heat transfer between the engine and the environment in the hot sections. These factors contribute to the temperature prediction error. There is also an error in fuel flow, especially at low speeds. This is mainly because the combustion model used in this study is relatively simple, and it is relatively optimistic for predicting combustion that deviates significantly from the design point, thus leading to simulated fuel flow being lower than the test.
However, since this study primarily focuses on aerodynamic instability in compressor components, high precision in temperature prediction in hot sections is not essential. Thus, the error here does not affect the conclusions of this research.
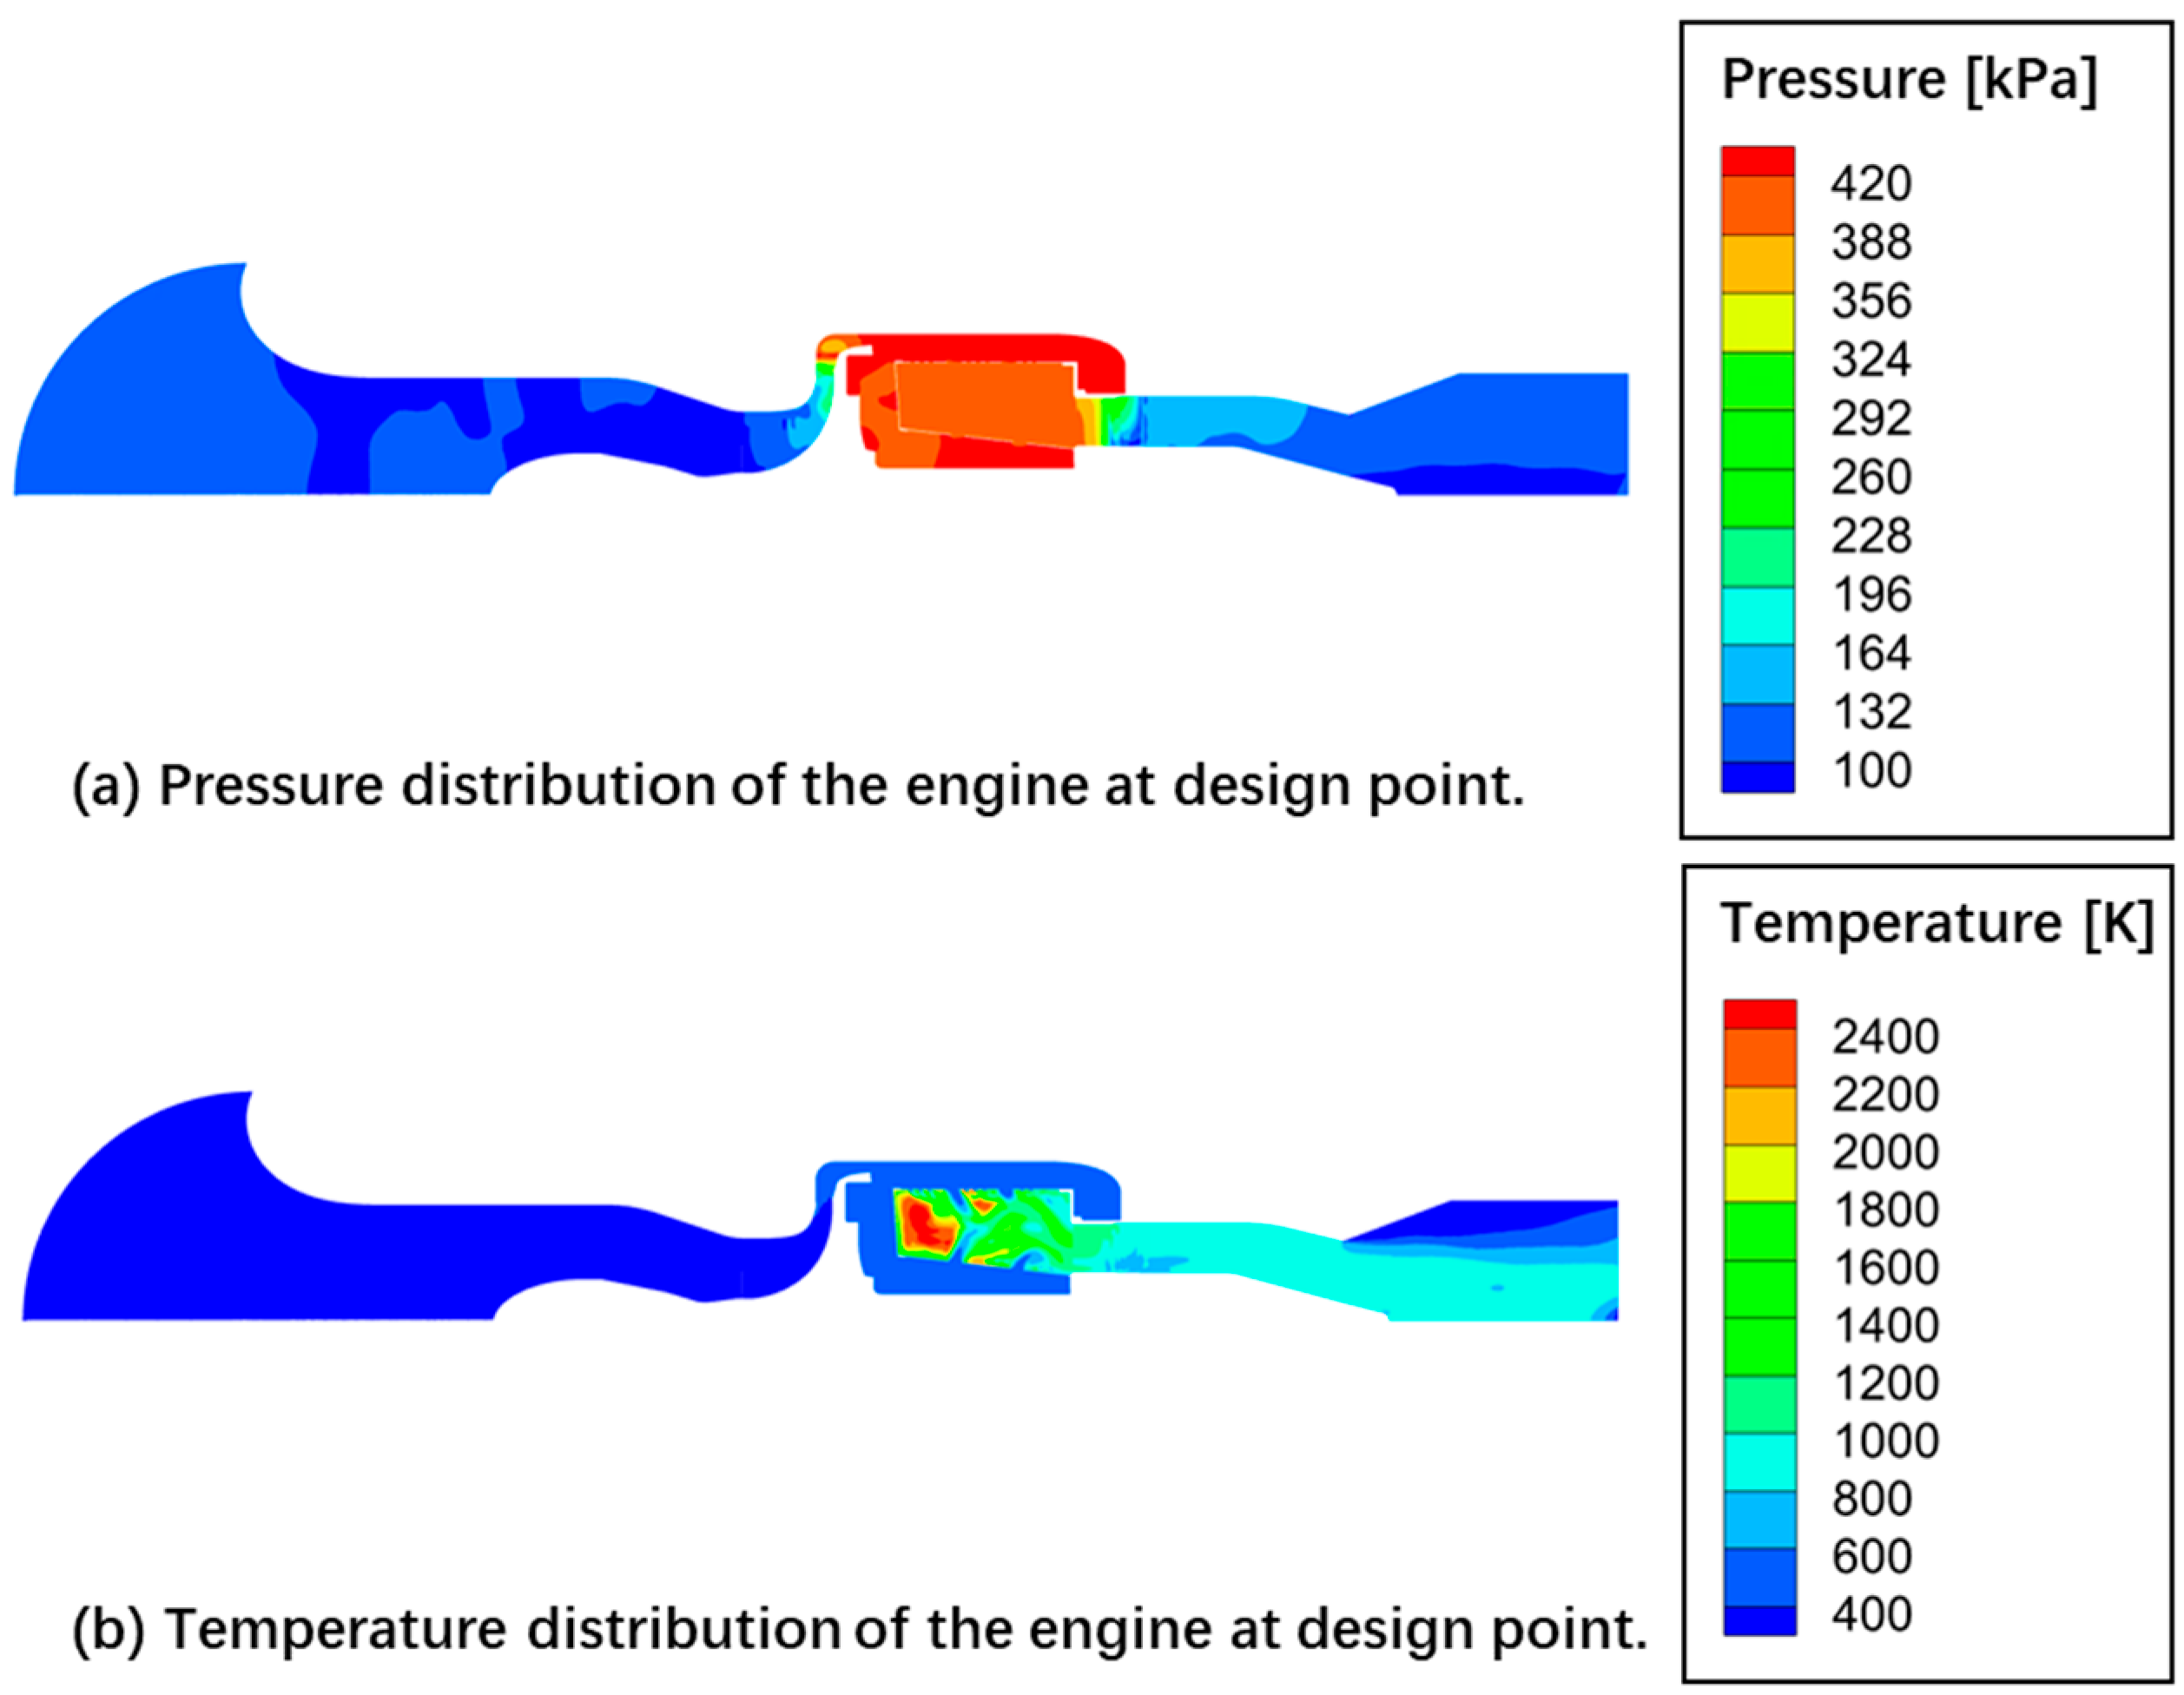
Figure 7 shows the contour plot of aerodynamic parameter distribution for the engine at the design point. The cross-section in the figure is obtained from the projection of the periodic surfaces of all engine components. The general process of the engine in the normal operating state can be seen in the figure.

3.2. Surge Boundary in Full-Engine Environment

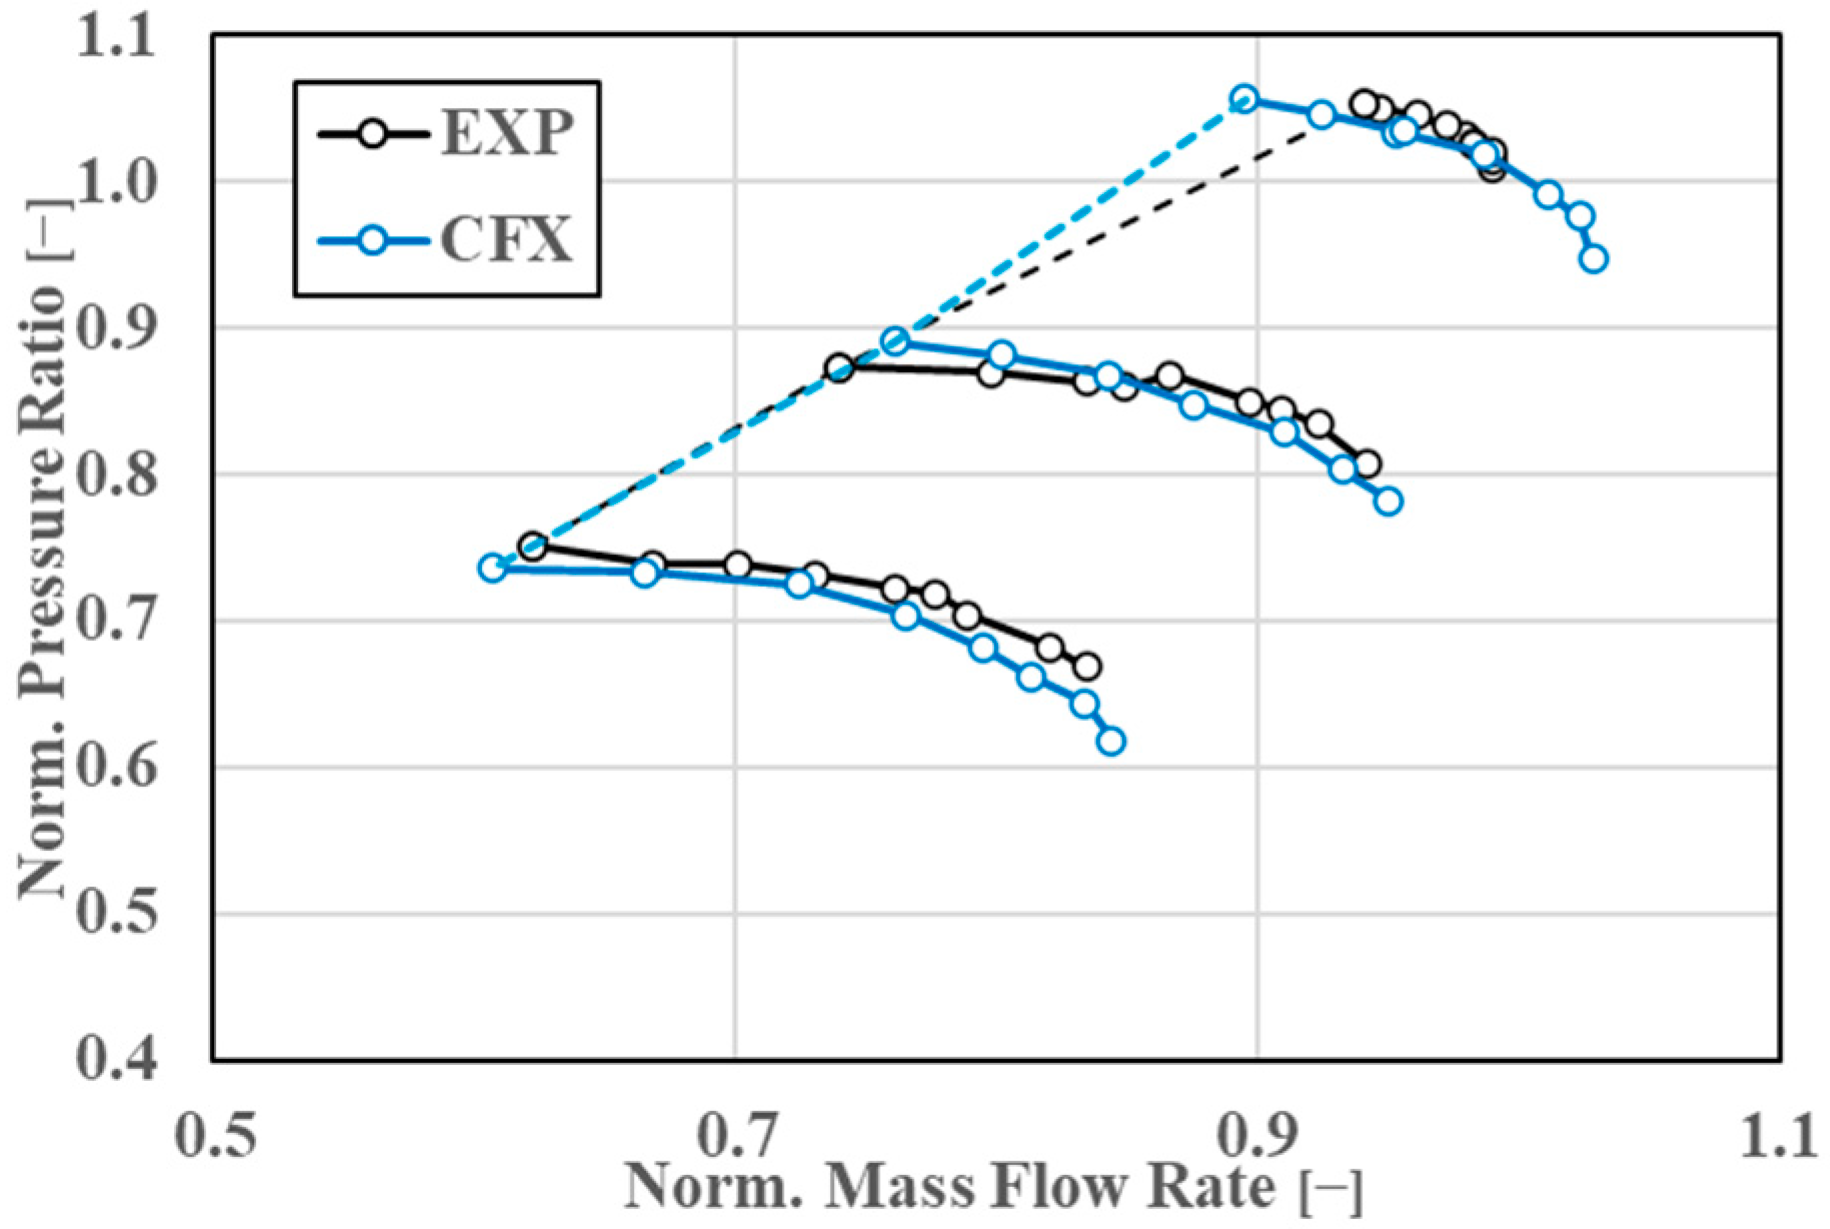
Figure 8 shows the surge boundary of the small turbojet engine studied in this paper, obtained through a variable geometry surge-inducing process in the full-engine environment. The horizontal coordinate represents engine inlet flow rate, and the vertical coordinate represents compressor pressure ratio, both normalized based on the corresponding values at the 100% spool speed design operating point. The black line in the figure represents the characteristic line measured during full-engine tests by adjusting the variable geometry turbine, and the blue line indicates the characteristic line calculated using simulations. The characteristic line was formed by gradually adjusting the variable geometry turbine angle, sequentially computing steady-state solutions, and then connecting these steady-state compressor operating points. Since the VGTS actuator moves slowly during testing, this process can be considered quasi-steady. Therefore, continuous steady-state calculations were used in the simulation to simulate the gradual movement of the engine operating point along the characteristic line toward the surge boundary. URANS calculations were employed near the boundary to confirm engine surge onset. The figure displays the compressor outlet pressure variation at the instant of engine surge onset. It can be observed that the full-engine test results and simulation results show good agreement, with the simulation accurately capturing the main trend of operating point movement as the variable geometry turbine angle closes, and the surge boundaries across different spool speeds. The right half of the compressor characteristic lines is missing. This is because, in actual experiments, the engine requires a certain overall pressure ratio to sustain the thermodynamic cycle, so, using the VGT method, the right half of the characteristic line cannot be obtained.
The prediction accuracy of surge boundary is defined by the formula commonly used in compressor surge research:
ε = π 1 m ˙ 1 / π 2 m ˙ 2 1
where ε is the relative error of the surge boundary, π 1 represents the pressure ratio of experiment results, π 2 represents the pressure ratio of CFD results, m ˙ 1 represents the flow rate of experiment results, and m ˙ 2 represents the flow rate of CFD results. The maximum error of the boundary prediction is calculated to be 5.6%.

3.3. Surge Cycle

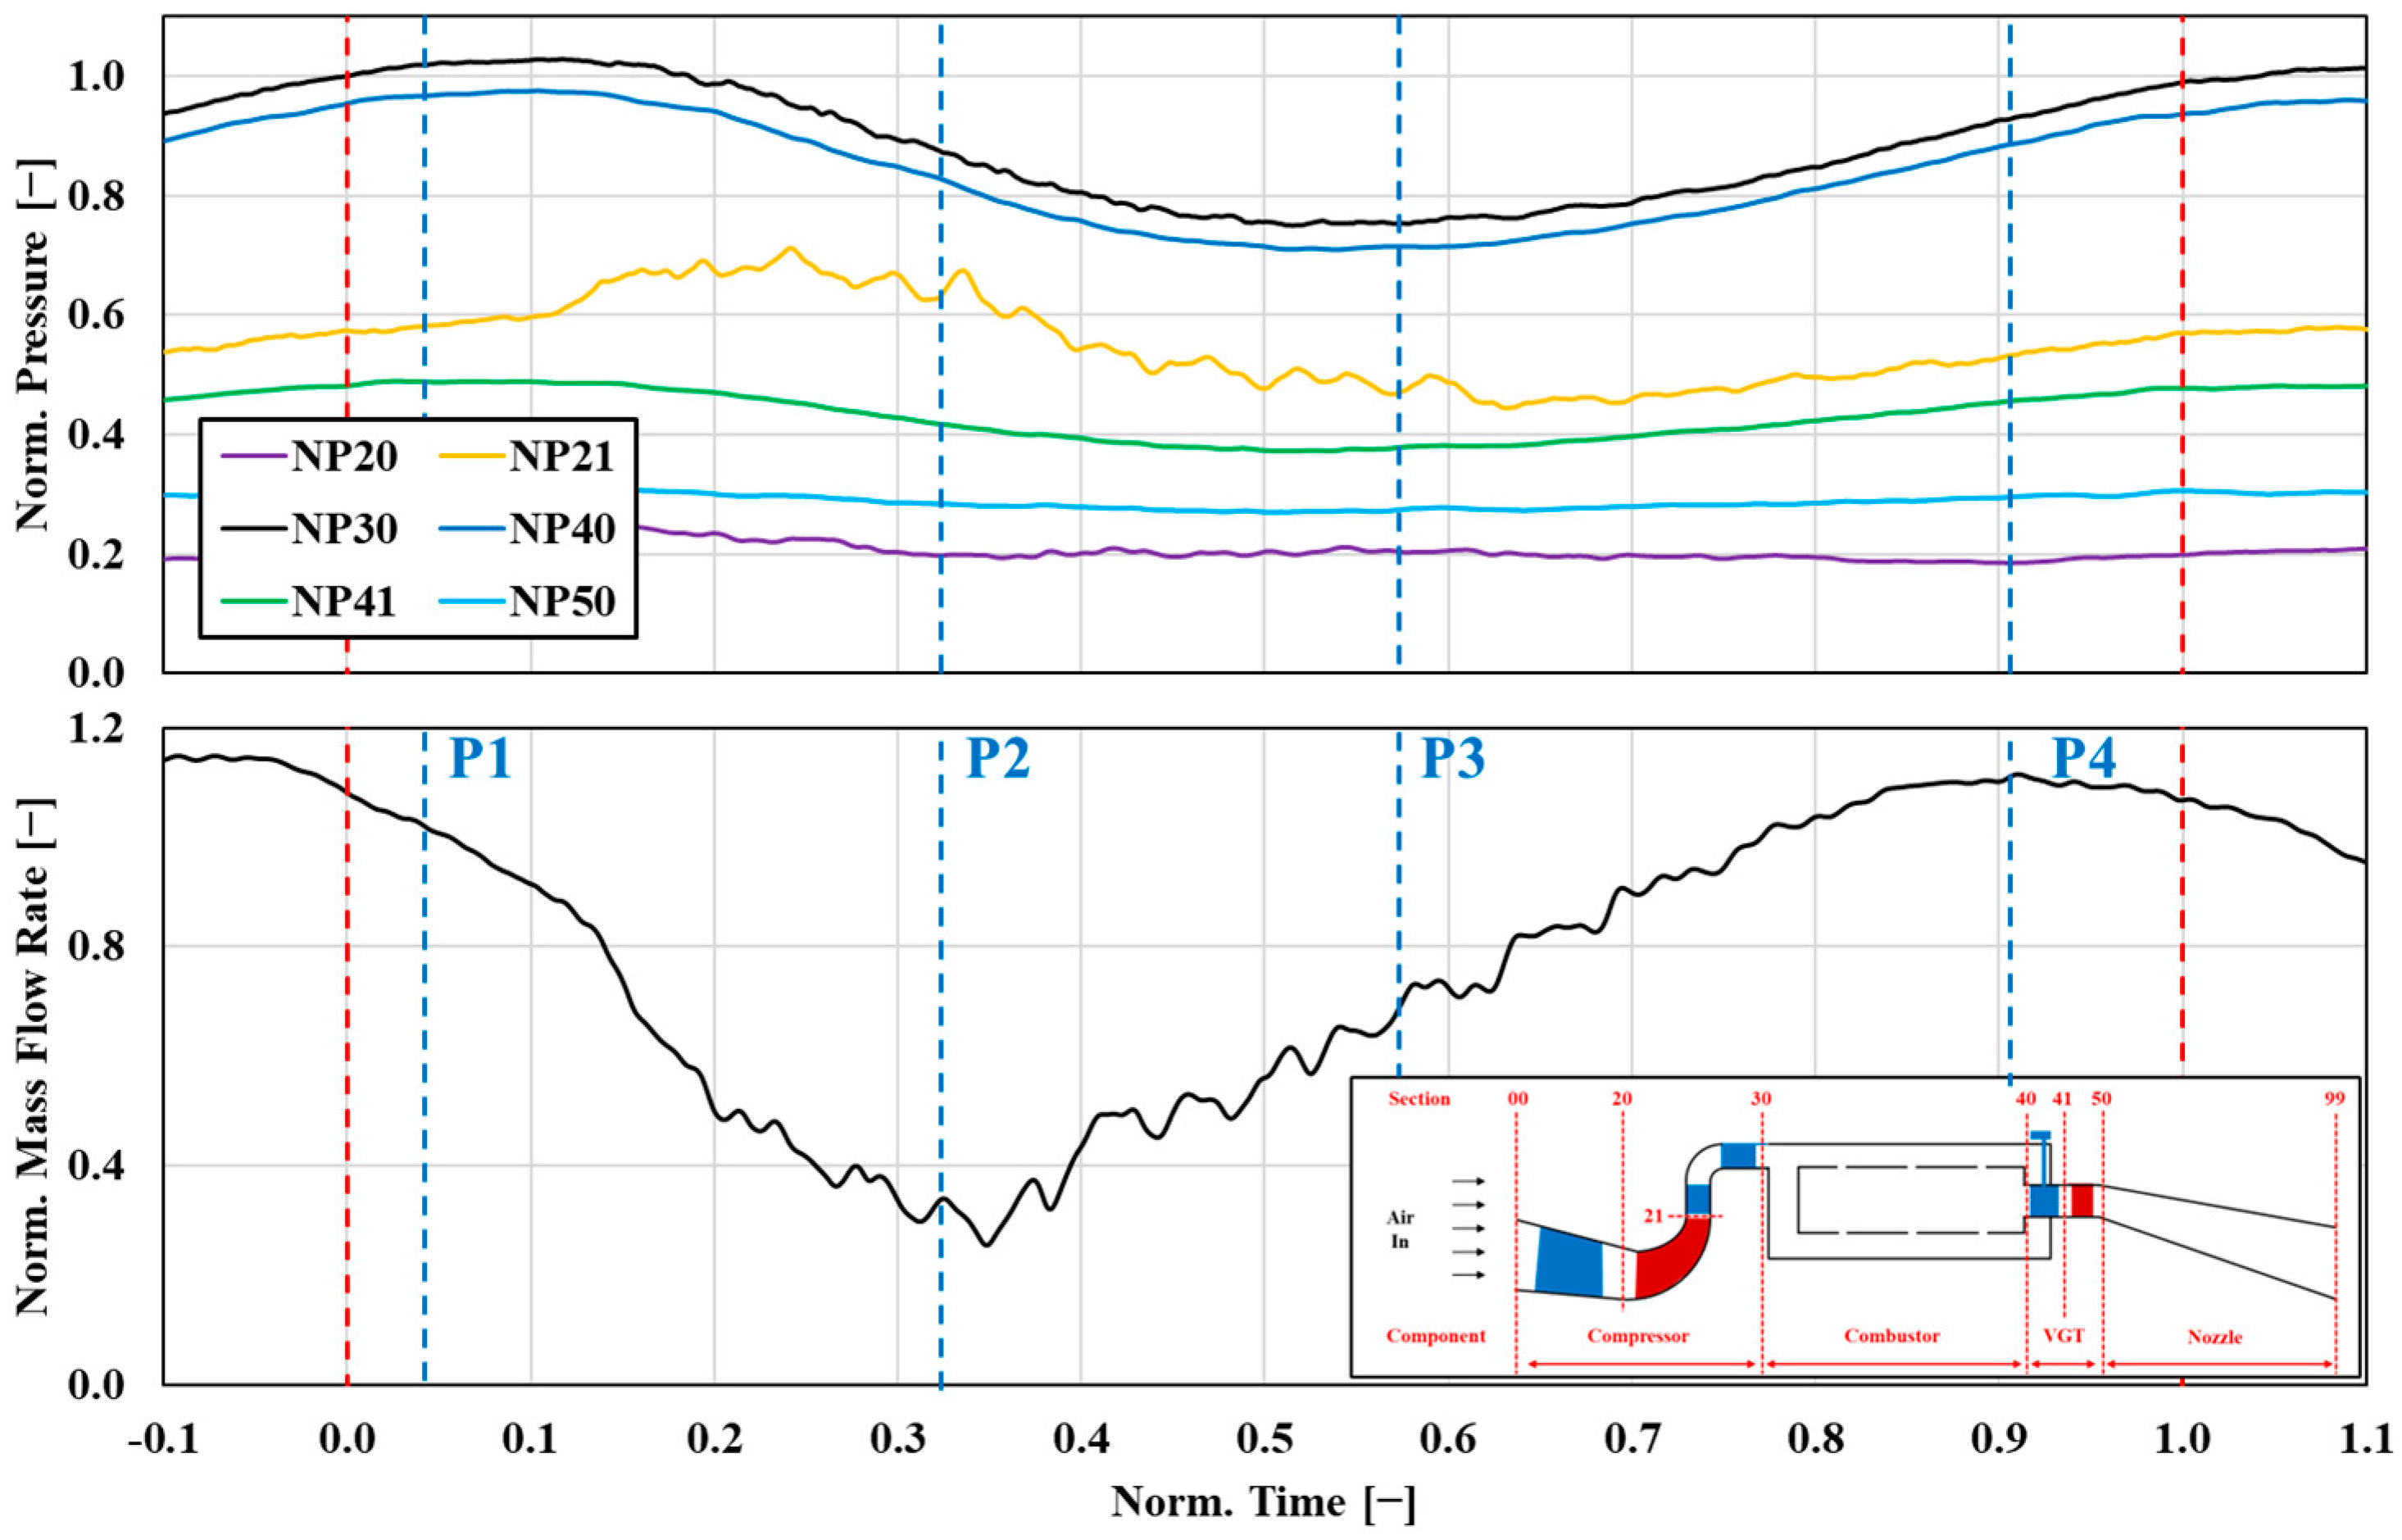
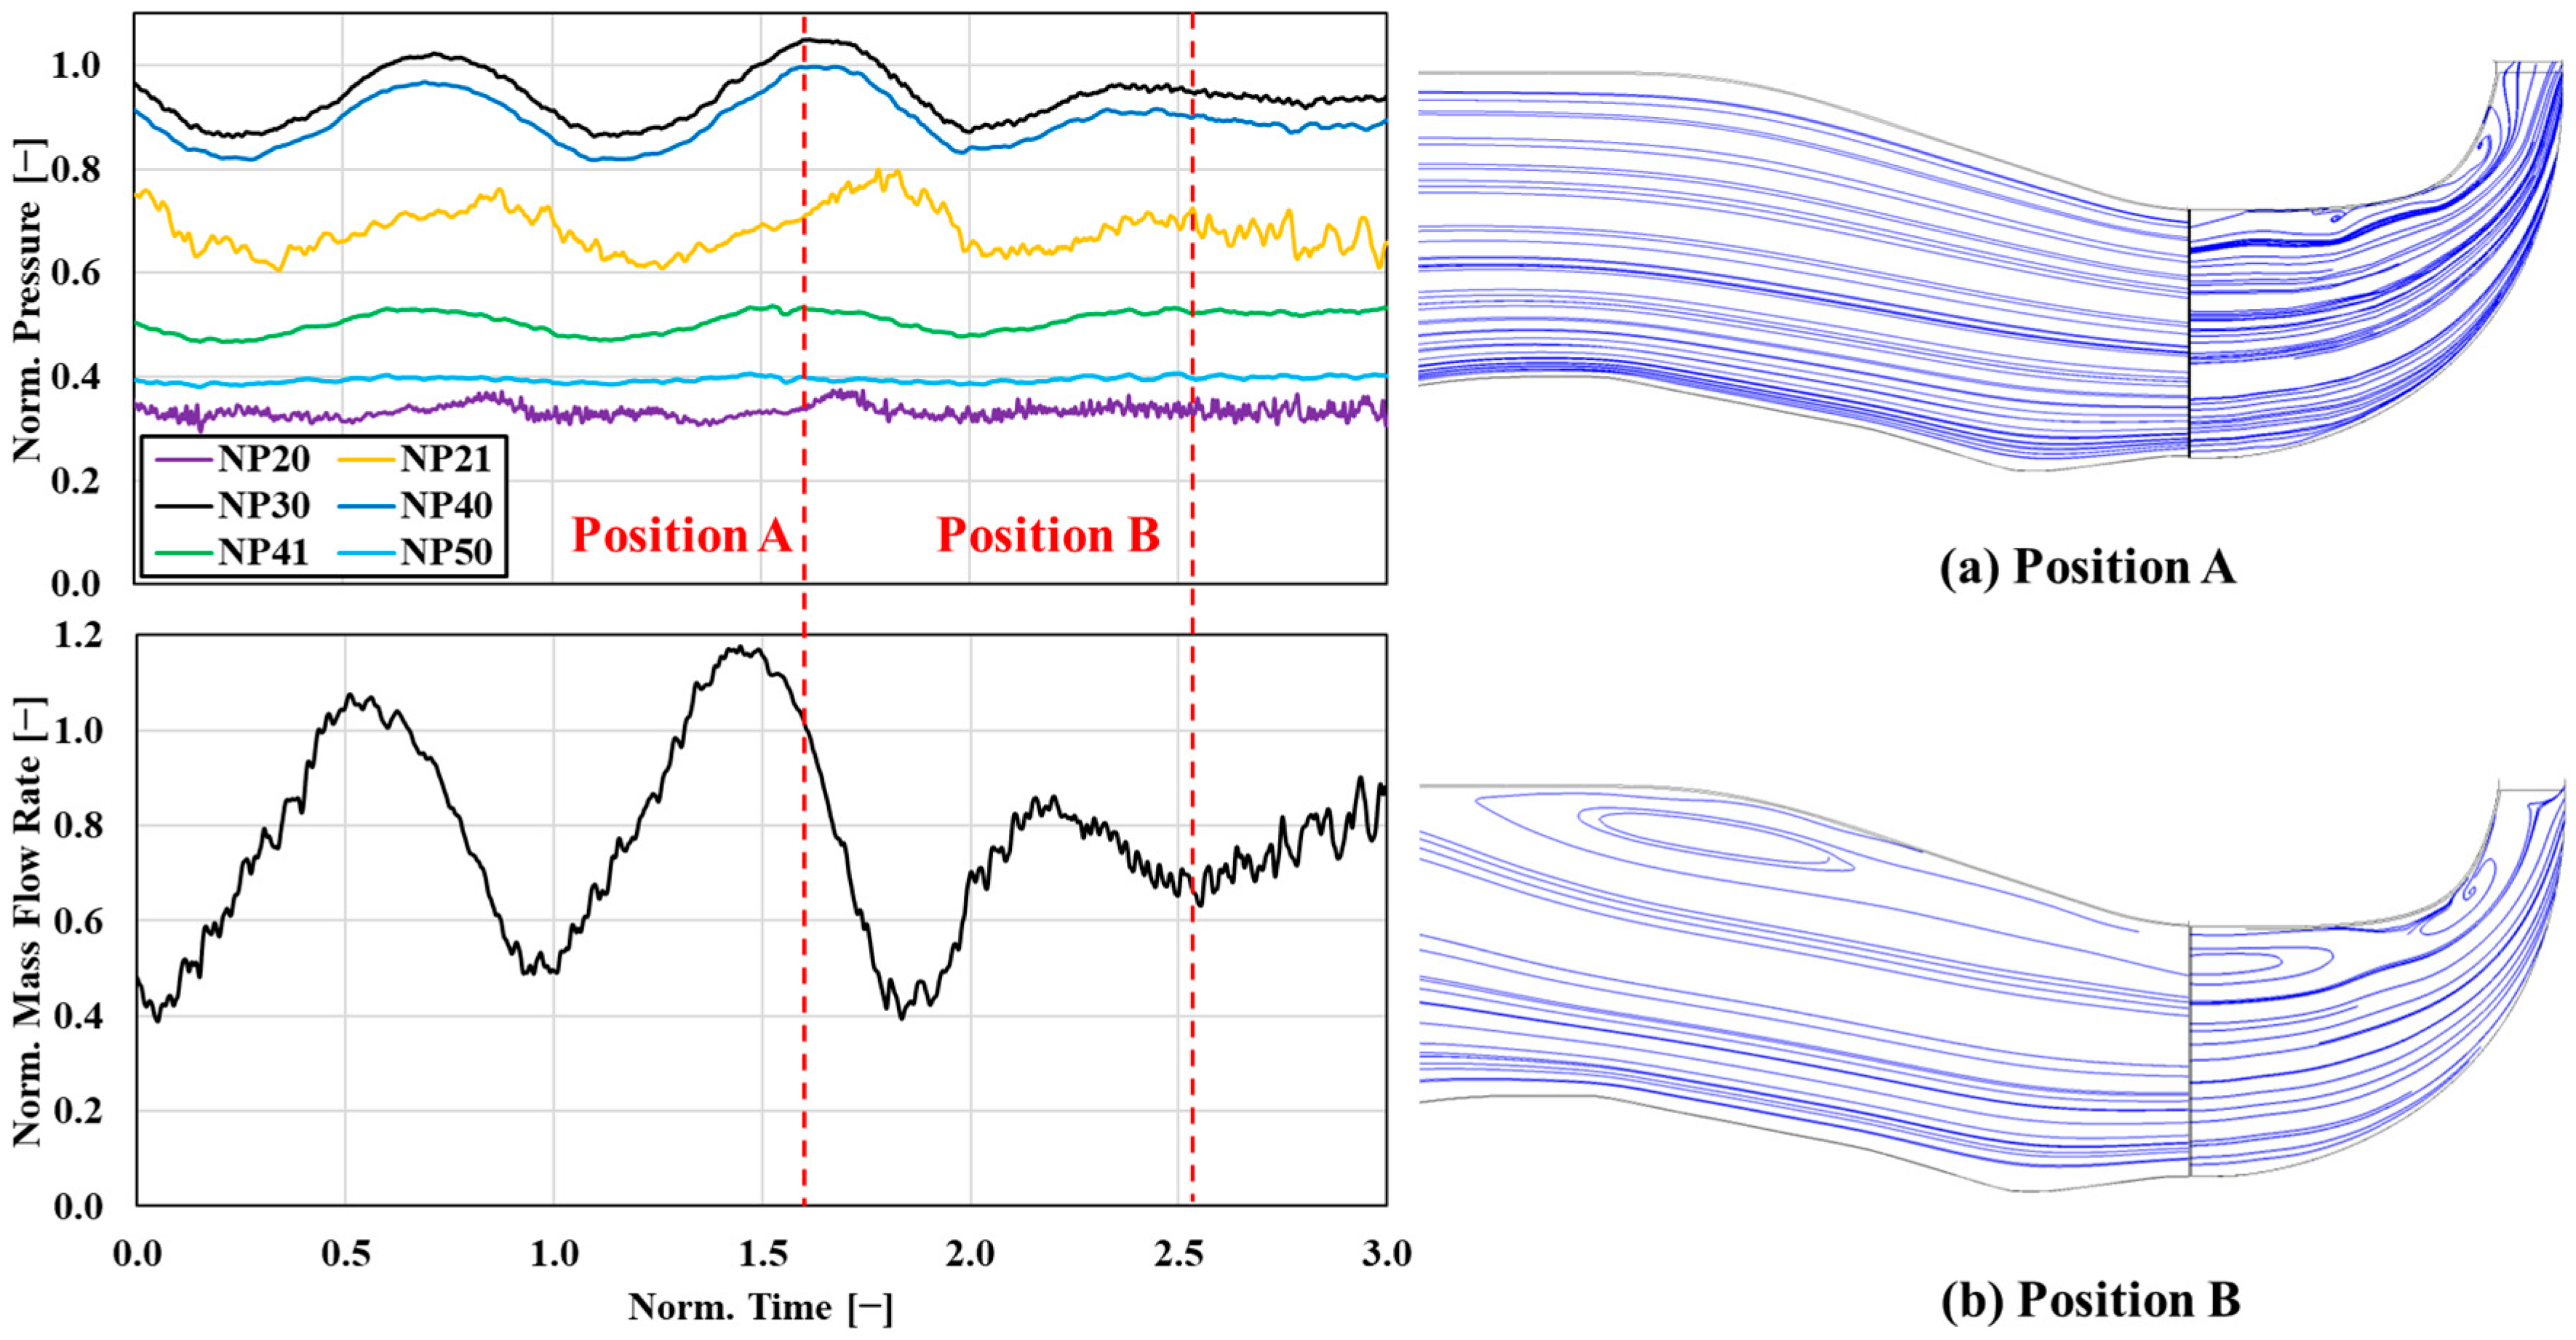
When the variable geometry turbine angle closes to a certain extent, flow collapse occurs in the engine compression system, leading to aerodynamic instability. During this instability, the compressor’s pressure ratio and flow rate exhibit consistent periodic fluctuations, but the lowest point of flow fluctuation does not reach negative flow. Consequently, the engine enters a mild surge state. After the engine enters surge, following several surge cycles and upon stabilization of key aerodynamic parameters into consistent periodic variations, a complete surge cycle of primary aerodynamic parameters is recorded and presented in Figure 9 below. In the figure, the horizontal axis represents relative time within a surge cycle, while the vertical axis indicates normalized static pressure and mass flow rate at various compressor sections, all the parameters normalized based on their value at the start of the surge. The numbers following “NP” denote identification numbers of critical engine sections.
At the beginning of each surge cycle, the throttling effect caused by closing the VGTS leads to an increase in compressor pressure ratio until the surge boundary is reached. Subsequently, compressor flow collapses, resulting in a temporary loss of capability. The compressor flow decreases slightly, while the turbine flow remains unchanged, reducing pressure in the combustion chamber and thereby lowering the compressor load. Finally, normal compressor operation is reestablished, and pressure buildup resumes until the compressor operating point again reaches the surge boundary, initiating a new surge cycle. At this specific VGT angle setting, the engine compression system enters only a mild surge state, with no significant backflow observed at the compressor inlet. Consequently, the compressor’s pressure buildup capability recovers relatively rapidly, immediately commencing repressurization after reaching the lowest pressure point.
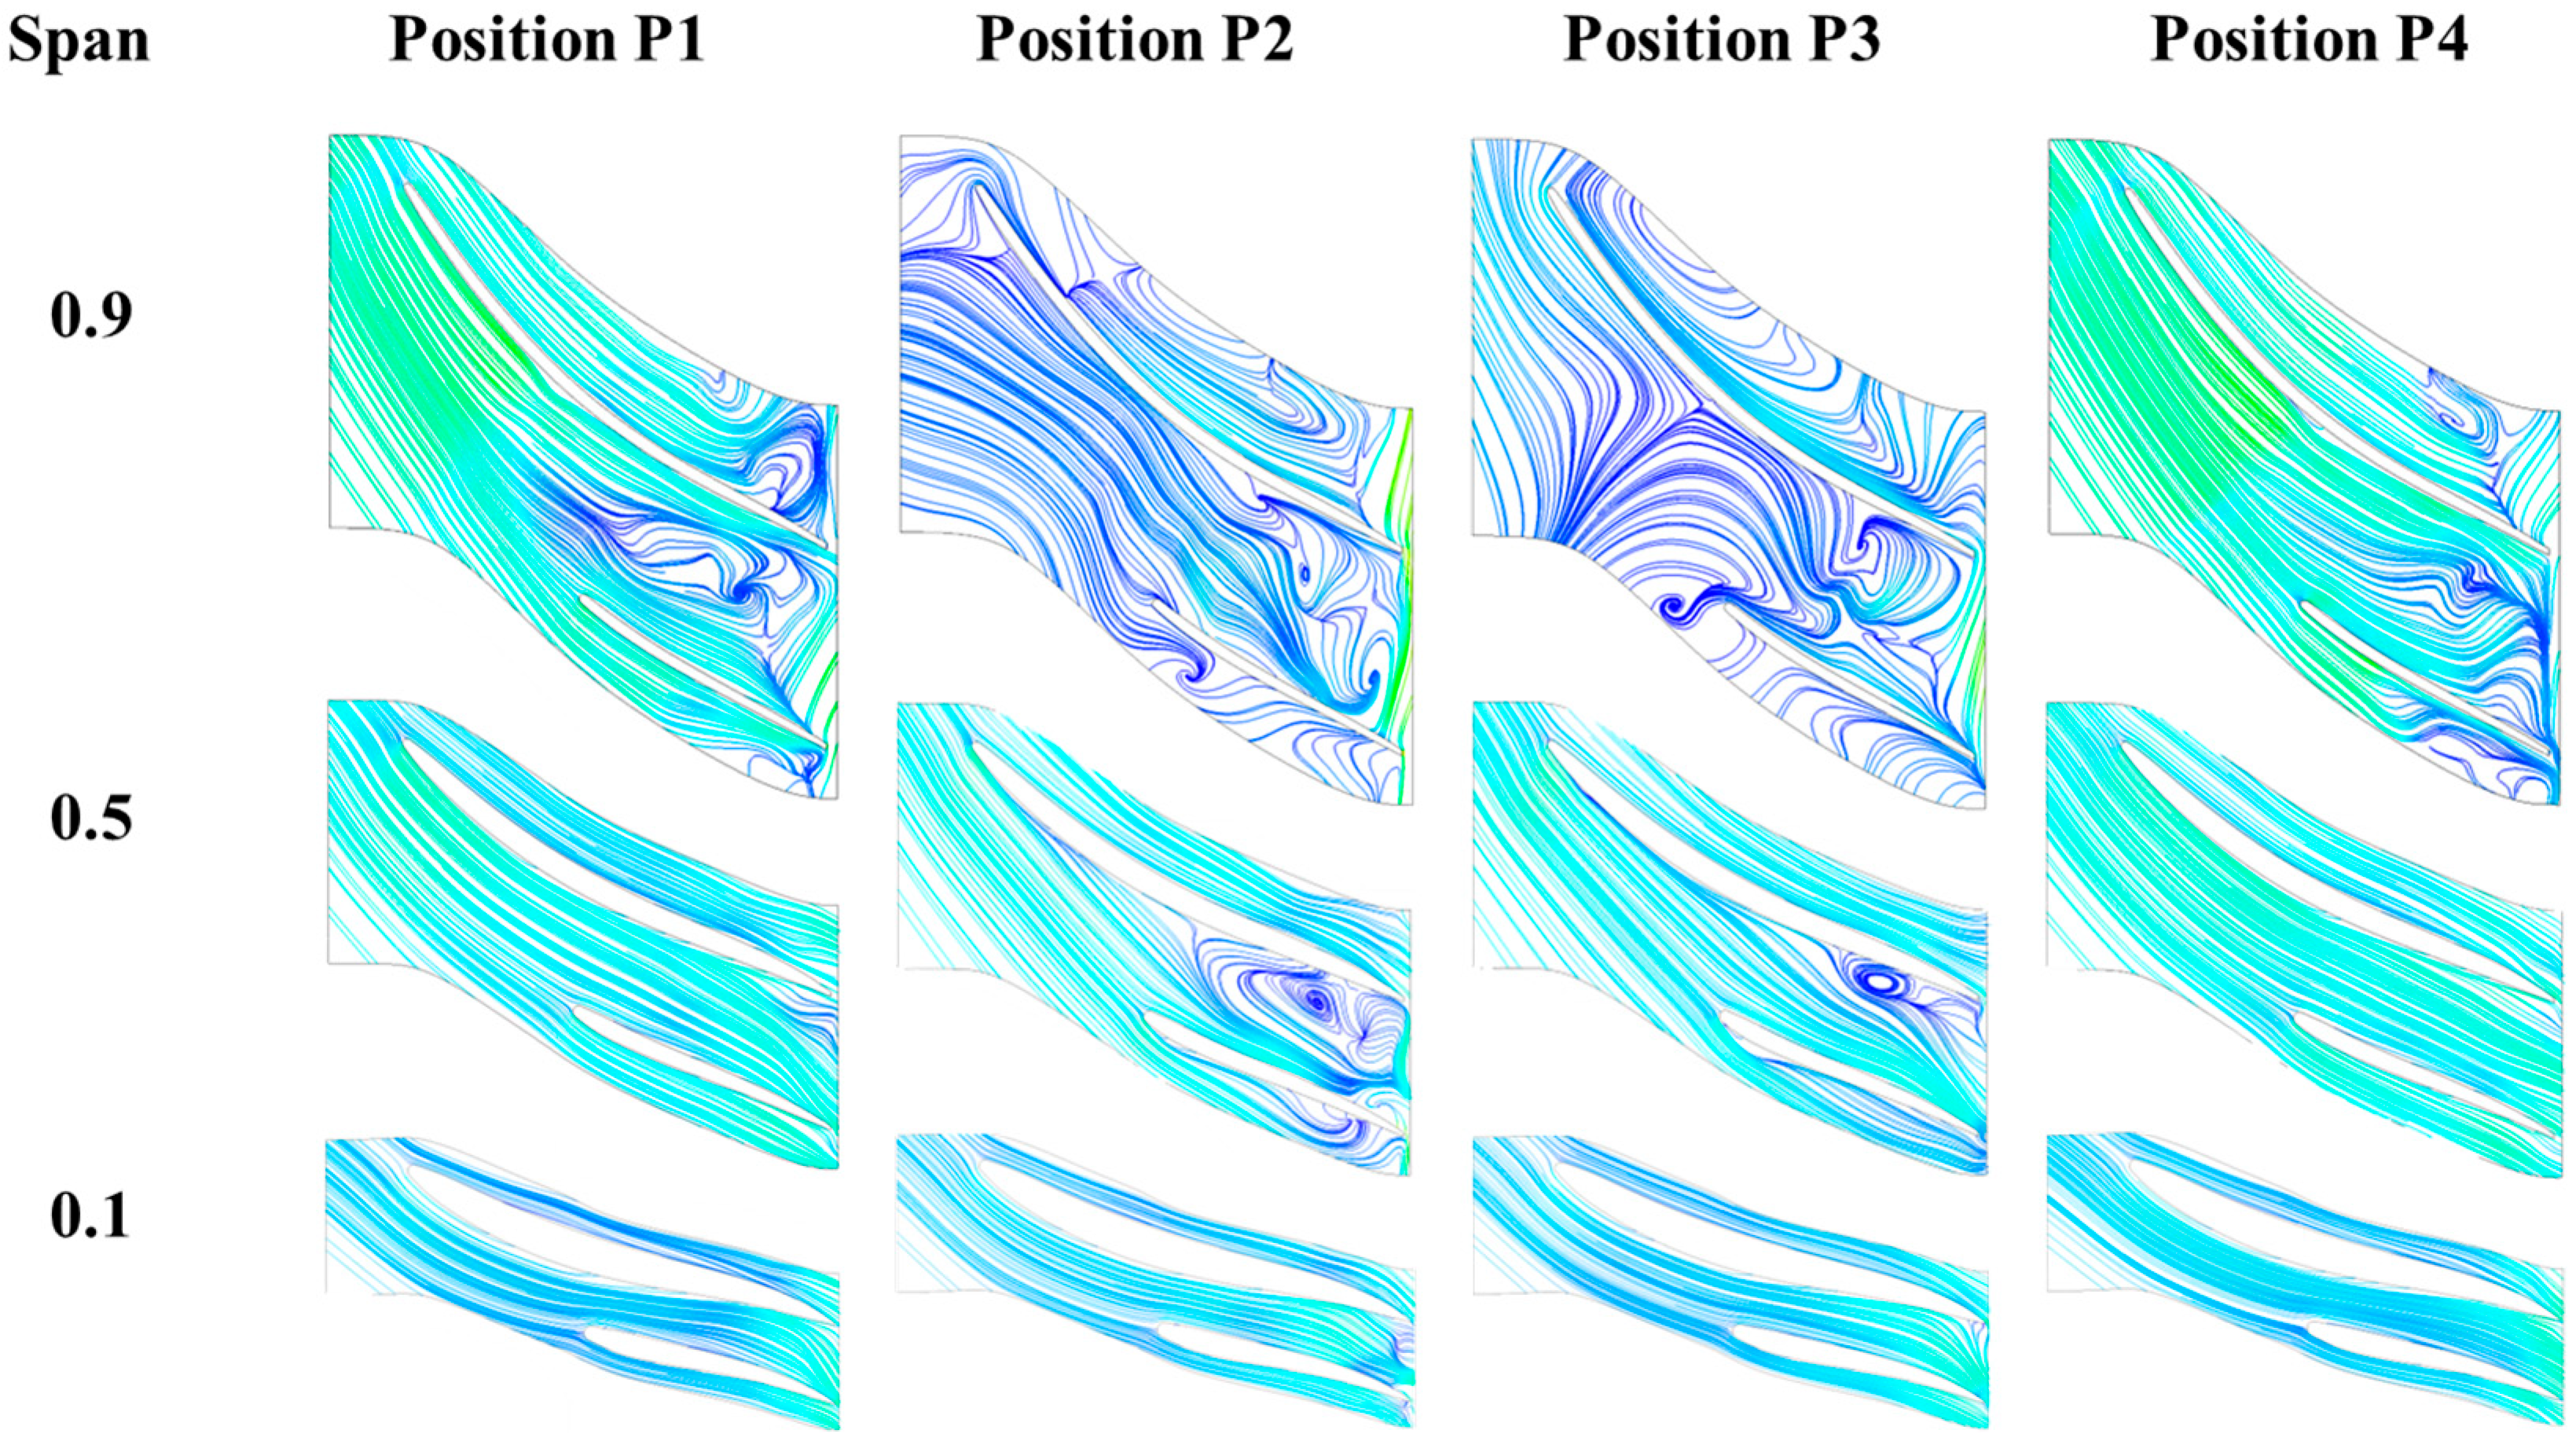
Figure 10 shows the streamlines at three sections of the compressor rotor at different time points during the surge process. From the figure, at position P1, before the start of a new surge cycle, the internal flow of the compressor is generally stable, with only some separation at the blade tip. At position P2, the flow collapses, and large-scale flow separation occurs inside the compressor. At position P3, the compressor reaches near the minimum pressure point, and the internal flow begins to recover. At position P4, it enters the re-pressurization stage, and the internal flow of the compressor is relatively stable.
Figure 11 shows the surge cycle data obtained from the simulation of this small turbojet engine during surge. In the surge cycle diagram, the horizontal axis represents normalized flow at corresponding engine positions, and the vertical axis represents normalized static-to-total pressure ratio at the same section. In the figure, the black line represents the unsteady surge cycle trajectory calculated during one surge cycle. The blue line represents the characteristic line of the compressor at the corresponding spool speed calculated in an isolated compressor component condition. The method used to calculate the compressor characteristic line is a one-dimensional/three-dimensional coupling method [20]. During a single surge cycle, the compressor operating point moves approximately along its characteristic line toward the surge boundary until surge inception. After aerodynamic instability is induced, pressure and flow decrease; then, as the compressor operating flow recovers, its operating point returns to the characteristic line and moves along the characteristic line again until entering the next surge cycle. From the pressure-flow trajectory during a surge cycle at the turbine inlet section, during the surge cycle, the turbine does not operate in a strictly choked condition, with its mass flow fluctuating by up to 20% throughout the surge process. This demonstrates that turbine characteristics continue to exert a significant influence on upstream components, and the traditional method of throttling-induced surge using constant-flow valves downstream of the compressor may lead to erroneous assessment of surge characteristics.

3.4. Axial Force Evaluation

In addition to causing significant degradation in engine performance, aerodynamic instability can further lead to severe structural damage in the engine. Therefore, when analyzing engine surge processes, evaluation of the aerodynamic forces on blades and rotor systems is critical. The full-engine URANS simulation method can assess the axial forces borne by engine blades and rotor systems during surge.
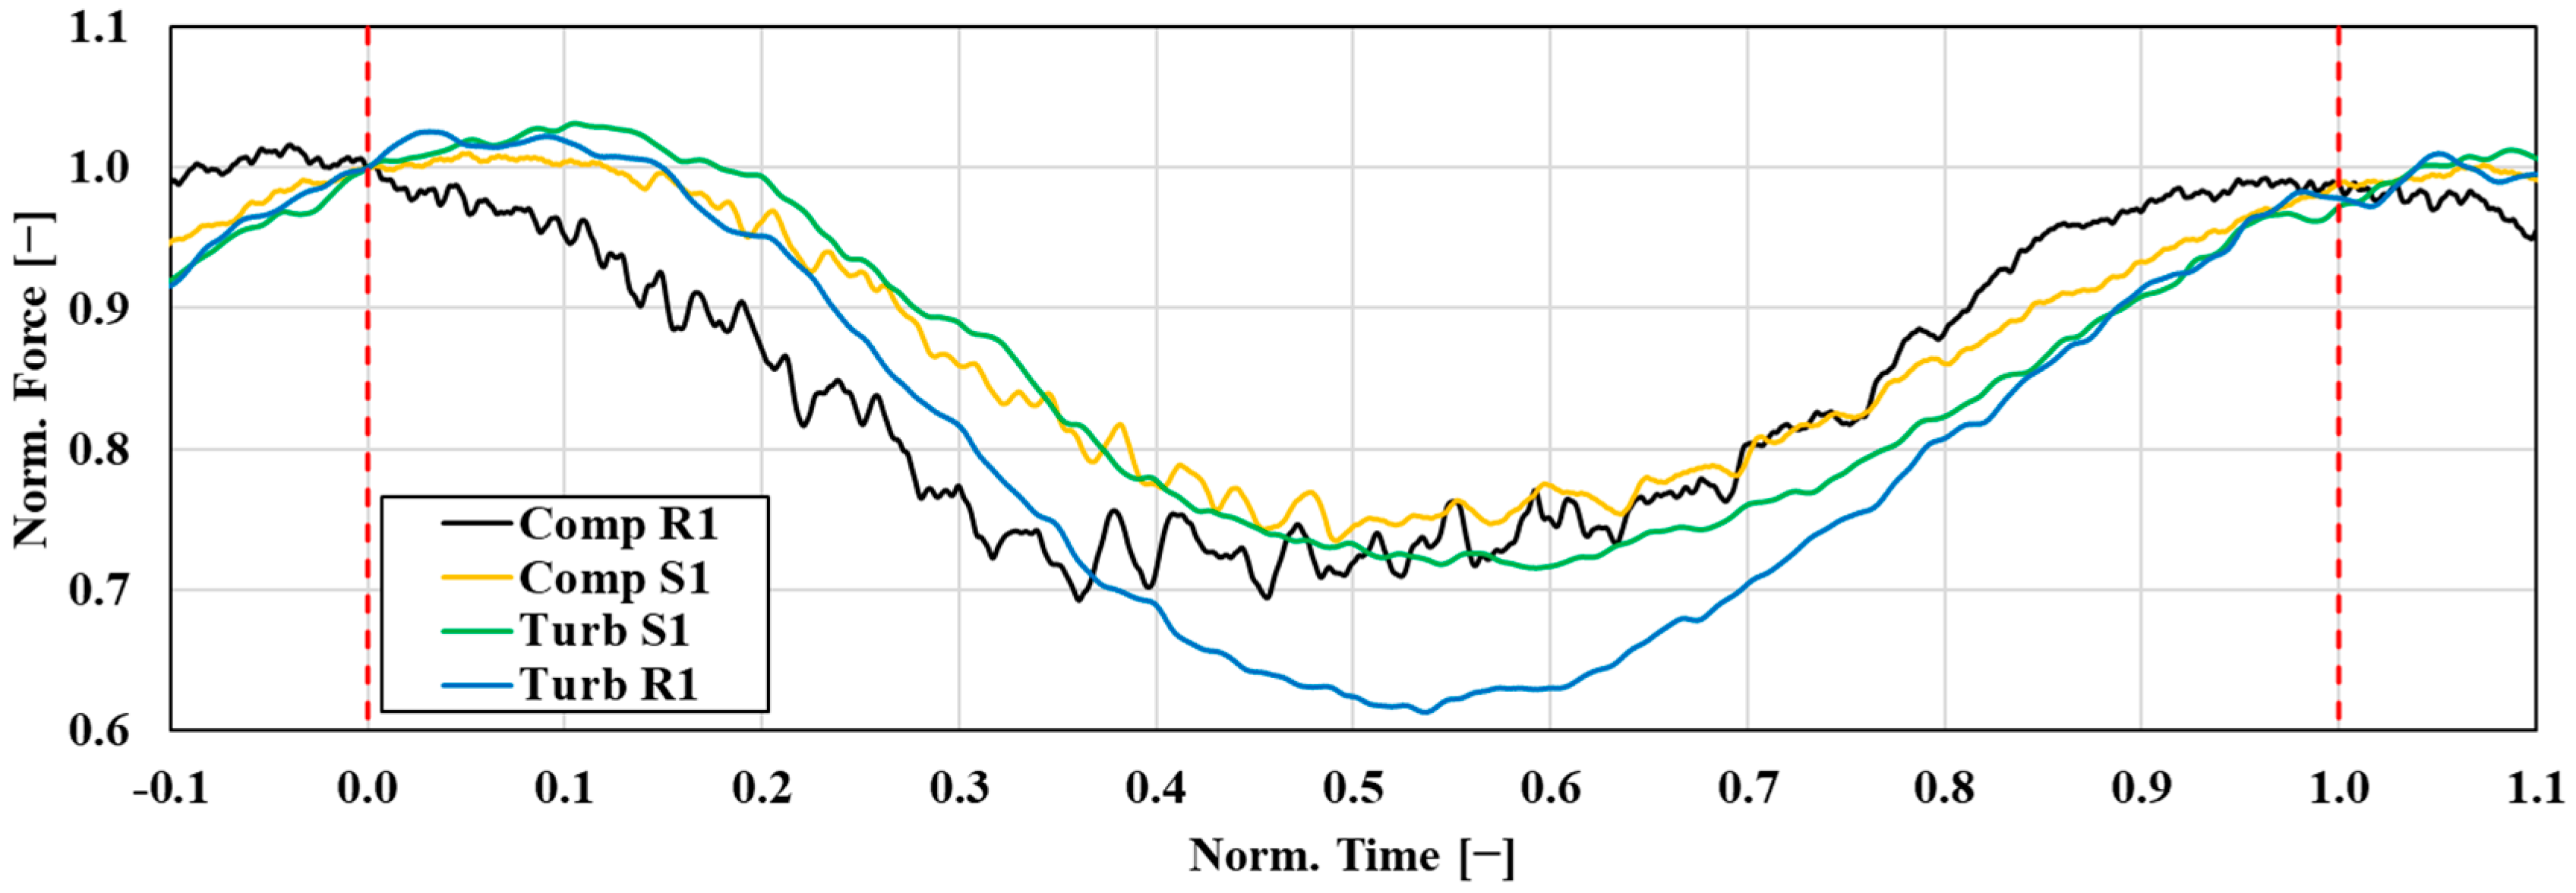
Figure 12 shows the aerodynamic loads on engine blades from the simulation during one surge cycle. The horizontal axis in the figure uses normalized time, and the vertical axis shows the normalized aerodynamic load, which is defined as the current aerodynamic load divided by the aerodynamic load on each blade at surge initiation. It can be observed that, during the surge cycle, the blade forces on the rotor undergo significant variations. However, the maximum blade force occurs at the initial stage of surge onset, where the increase in blade aerodynamic load is not substantial.
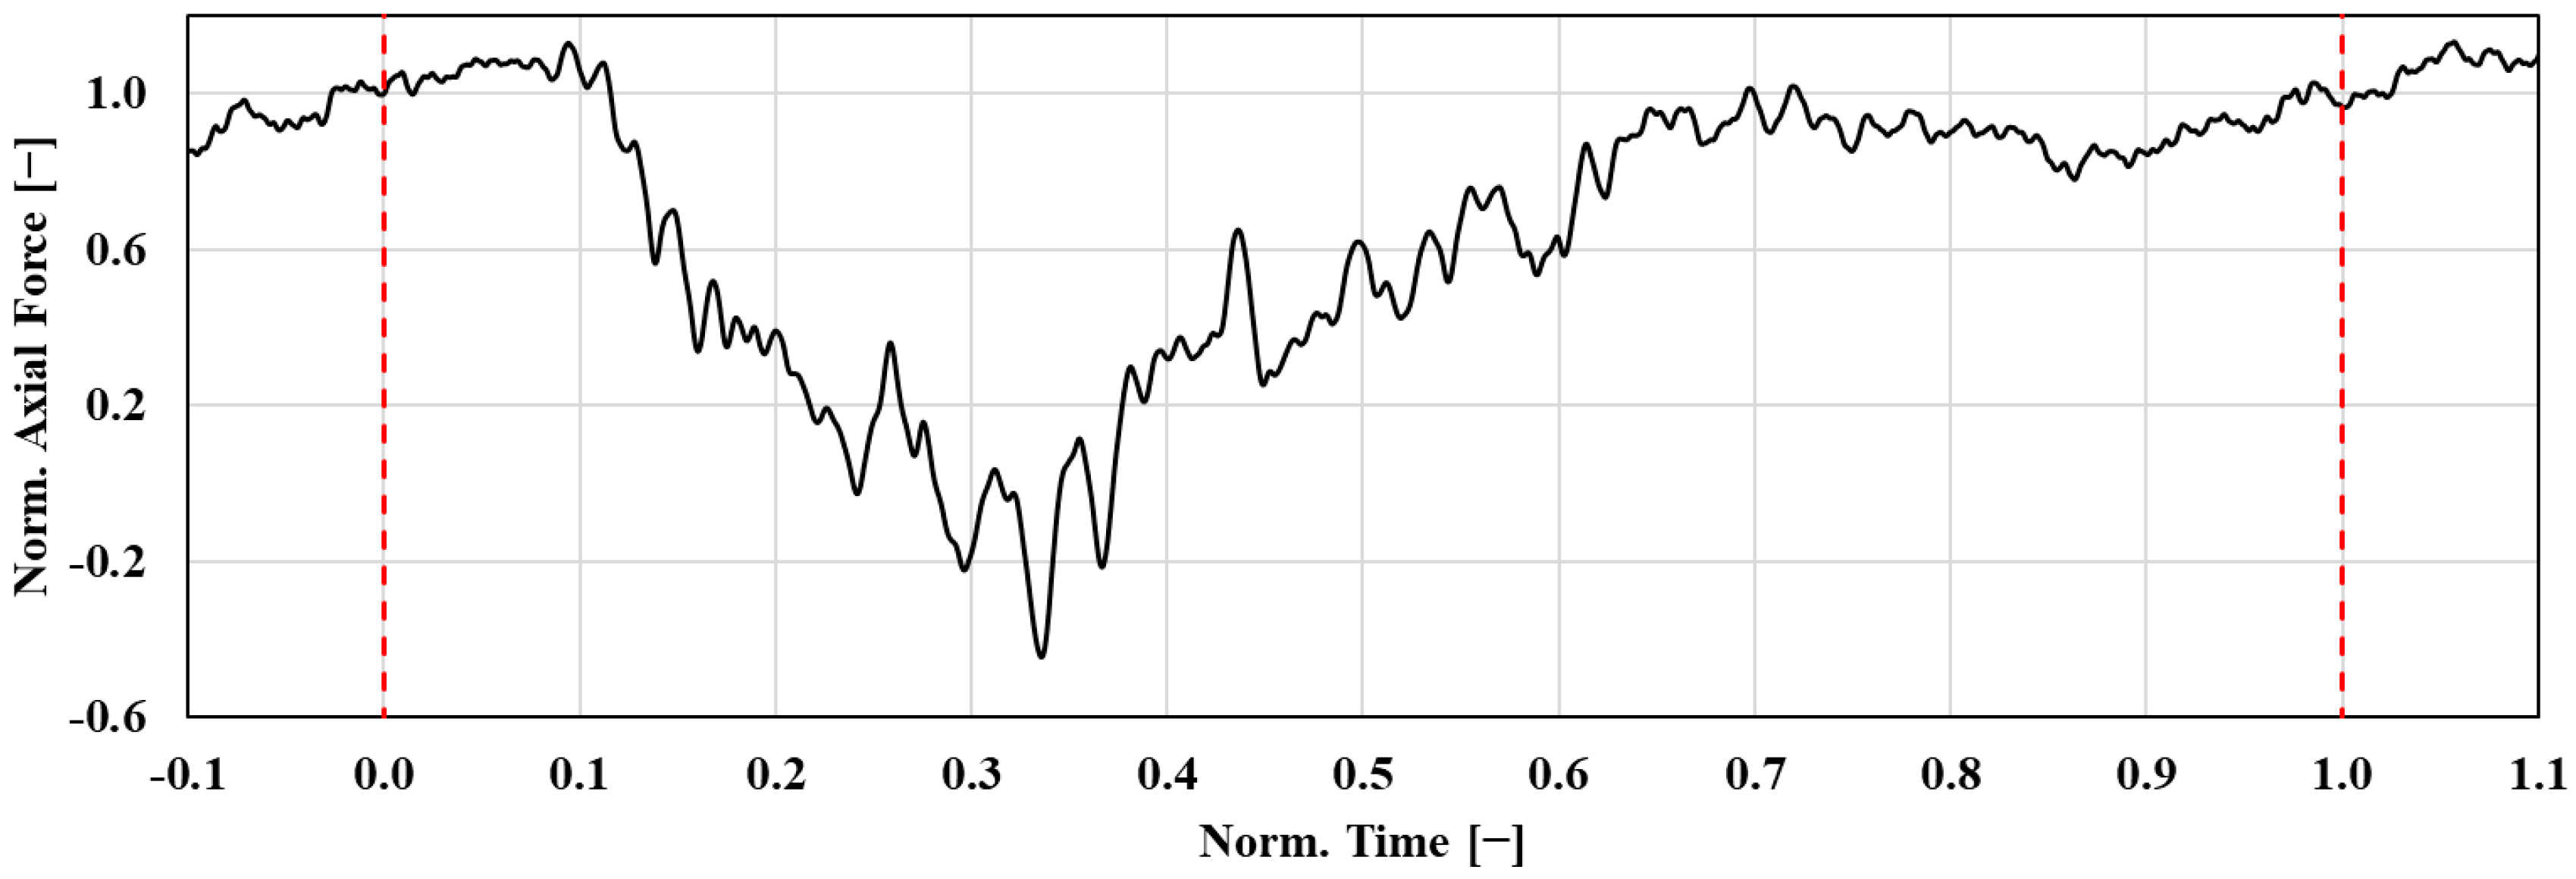
The conclusion differs for axial force analysis on the rotor system. Figure 13 displays the axial force on the rotor during one surge cycle. The axial force on blades is directly from full-engine simulation results, while the axial forces on the rotor disks are approximated using the pressure at corresponding cross-sectional positions and disk cavity areas. The horizontal axis in the figure uses normalized time, and the vertical axis shows axial force normalized relative to its value at surge initiation. It is evident that, during surge, the axial aerodynamic force on the rotor system reverses direction. Based on this, a redundant design for reverse axial forces on rotors should be emphasized in engines of such configurations to prevent irreversible damage to the rotor bearing system caused by engine aerodynamic instability. The magnitude of the reverse axial force is approximately 0.6 times the forward axial force under stable operating conditions.

3.5. Two-Regime Surge

From the mild surge state, further closing the VGTS to throttle the compressor will cause the compressor to recover from surge. In this state, the periodic oscillations of aerodynamic parameters cease, replaced by a quasi-steady operating condition characterized by a relatively low pressure ratio and low flow rate. In standalone compressor tests, further throttling causes the compressor to re-enter surge and progress into deep surge. This progression—mild surge to surge recovery to deep surge—is a typical two-regime surge phenomenon [12,13].
In the small turbojet engine studied in this paper, experiments observed that further closing VGTS vanes triggered surge recovery from mild surge. Simulations also captured this recovery process when closing VGTS vanes beyond the stable mild surge case, as shown in Figure 14. Analysis of the flow field at this stage, illustrated by the periodic surface projection plane streamline plot, clearly reveals a stable reverse-flow region near the compressor inlet tip. Please note that, since the periodic surfaces of the inlet and the compressor rotor are not at the same circumferential position, the streamlines here are discontinuous. While this reverse-flow stabilizes the compressor, it severely limits performance. During testing, the compressor in this “surge recovery” state could hardly sustain speed while further closing VGTS. This is primarily due to the reversed flow at the tip region, drastically reducing compressor efficiency. Excessively large VGTS angles also degrade turbine efficiency. Combined, the ECU must increase fuel flow rate to maintain engine power balance, causing EGT limits to be exceeded and triggering automatic speed reduction.
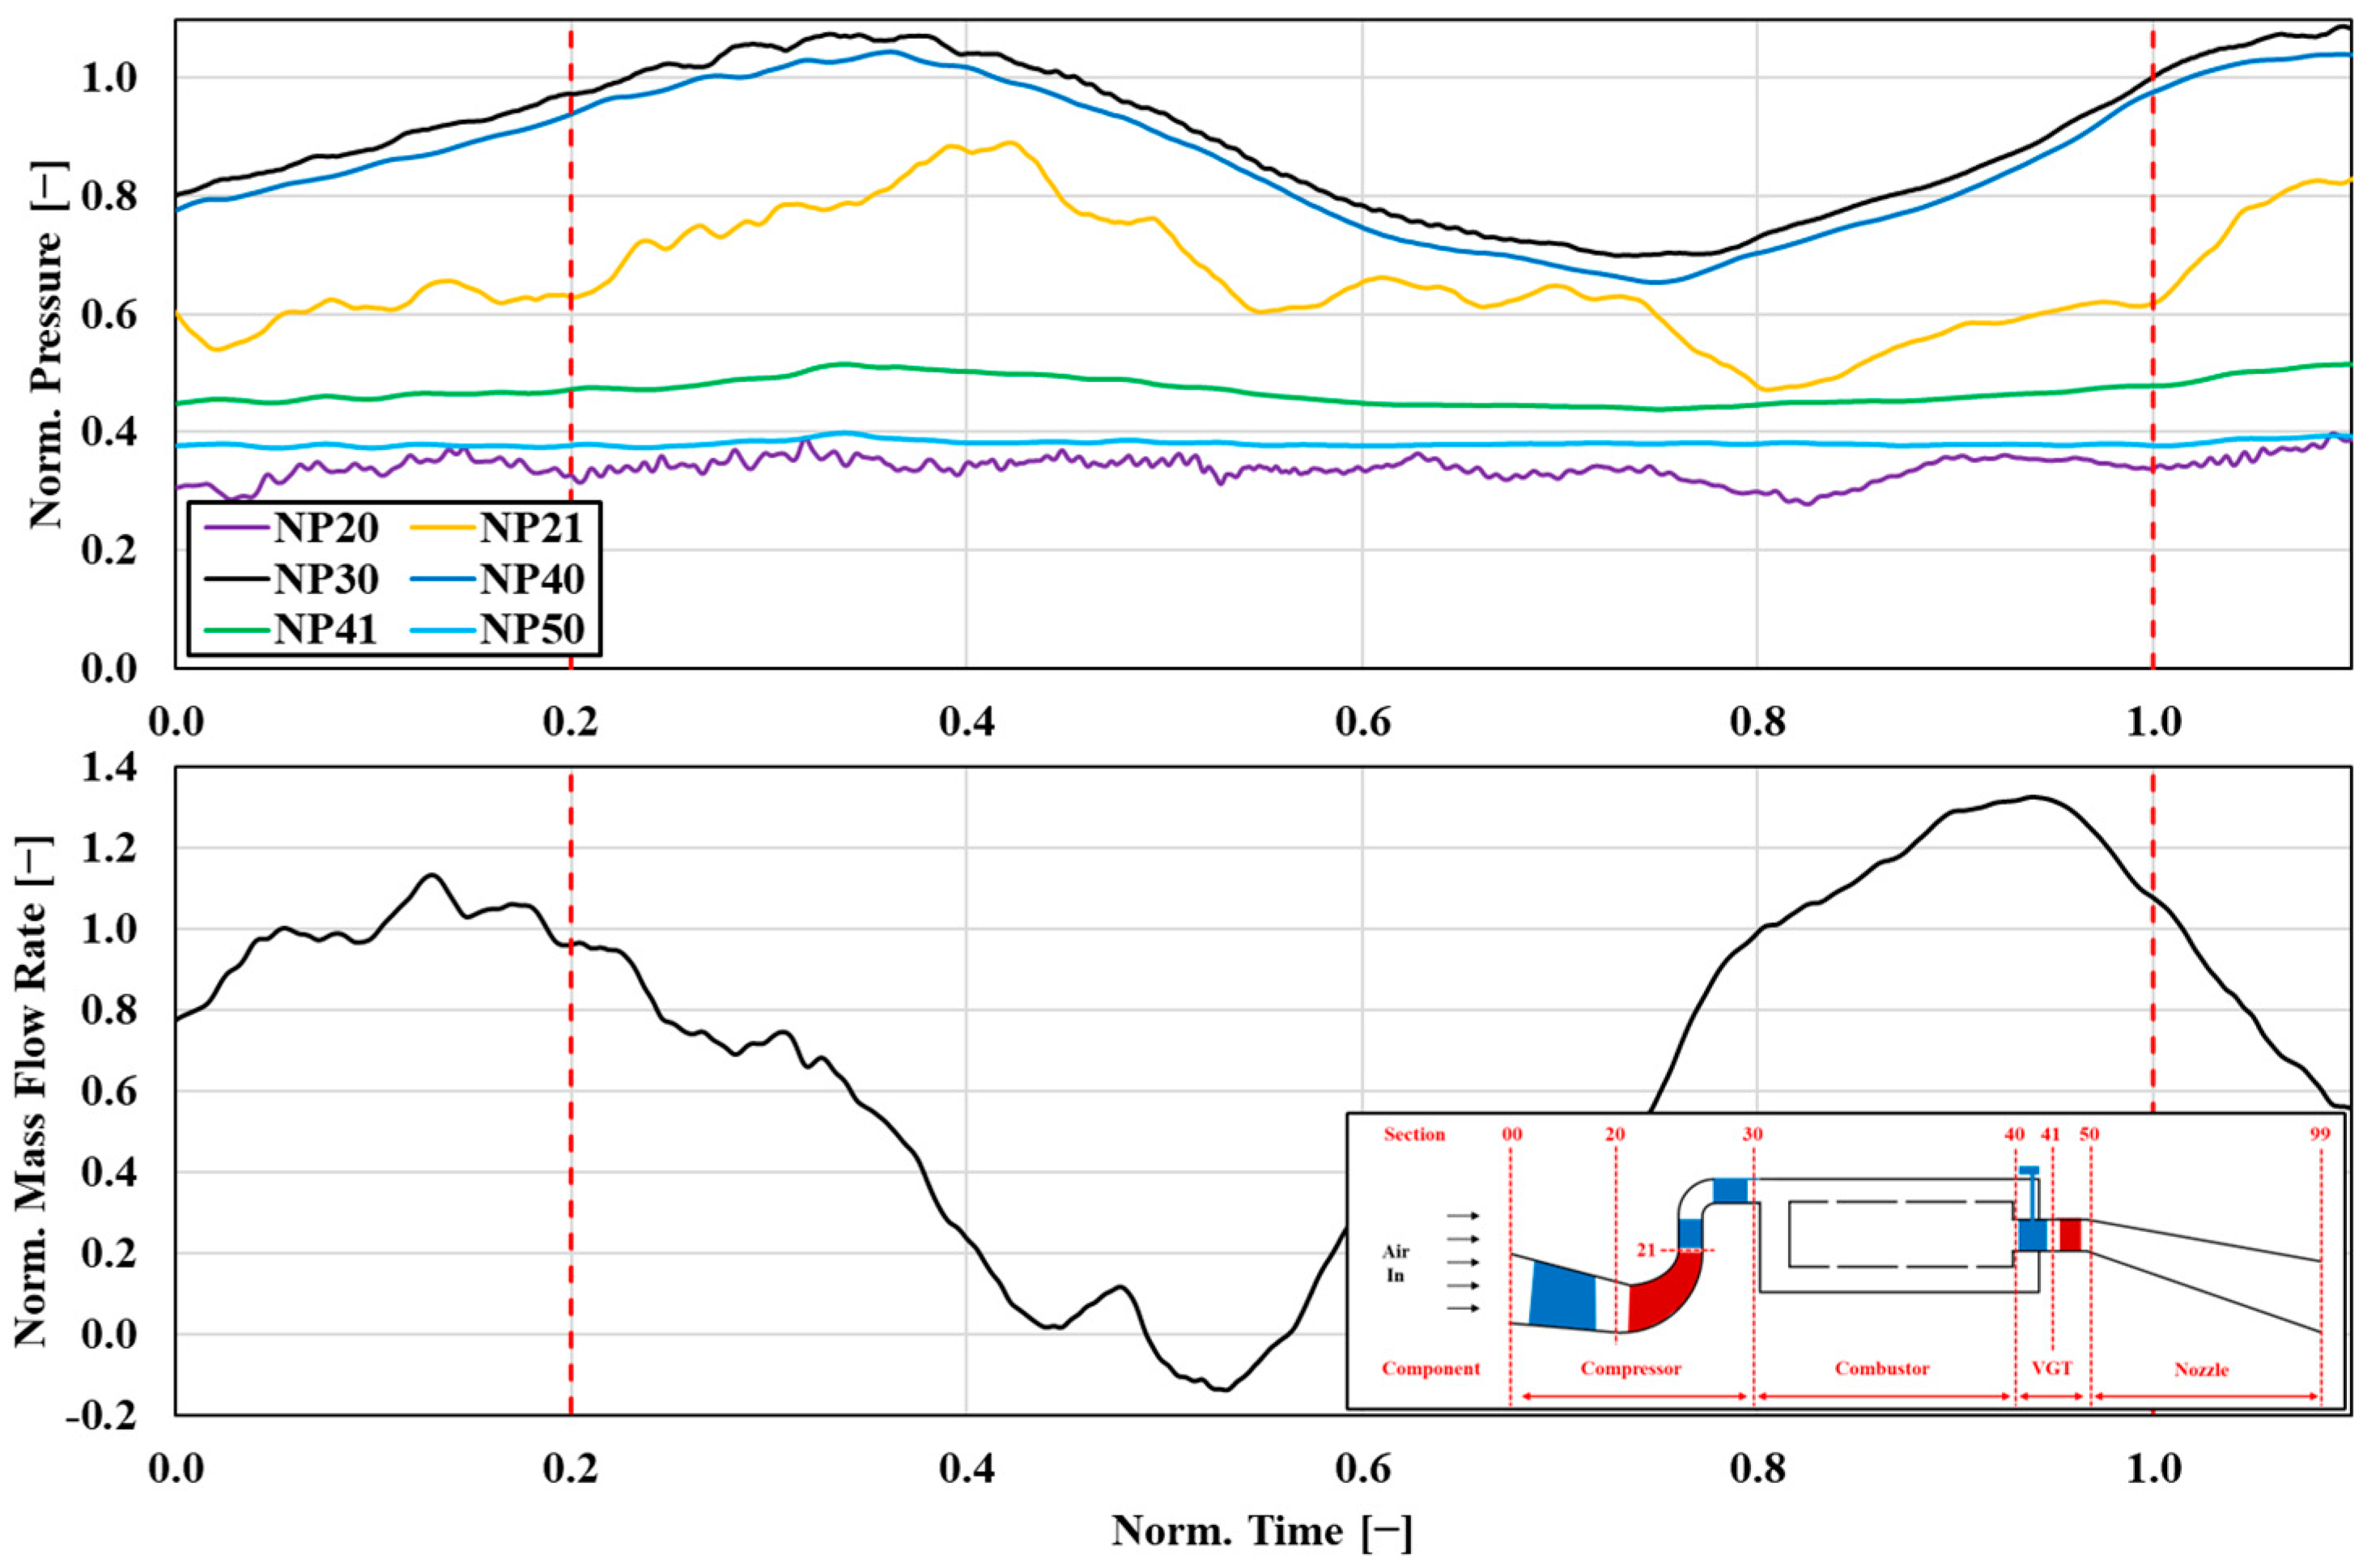
In simulations, ignoring EGT limits and further throttling VGTS vanes can also drive the compressor into deep surge. The pressure and mass flow rate evolution during deep surge is shown in Figure 15, where the horizontal axis is normalized time, and the vertical axis is normalized pressure, both processed using the same criteria as Figure 9. The plot shows significantly more violent pressure ratio oscillations compared to the mild surge. The mass flow rate minimum drops below zero, indicating strong reverse flow, which confirms the deep surge.
These phenomena demonstrate that centrifugal compressors in real engines can exhibit the two-regime surge evolution. However, in real engines, performance is already severely degraded after mild surge onset, making the intermediate surge recovery state unusable in practical engineering. Therefore, when defining compressor aerodynamic stability boundaries for real engines of the same size class as the engine studied in this paper, the first mild surge inception point should remain the criterion.

4. Conclusions

In this study, a three-dimensional URANS full-engine simulation model in a small turbojet engine is established and validated using engine surge test data. Based on this model, through the variable geometry turbine method, the compressor instability boundary and post-surge dynamic characteristics in the engine environment are obtained. Subsequently, this paper also investigates the changes in aerodynamic forces during surge and the two-regime surge phenomenon in the engine. The following conclusions are obtained:
(1)
Through analysis of experimental and simulation results, it is concluded that the full-engine three-dimensional URANS method used in this study can capture the performance changes, surge boundaries, and main flow parameters during surge across the whole engine speed range. For engines with size configurations similar to the engine studied in this paper, the prediction accuracy of this method for surge frequency, pressure fluctuation amplitude, and surge boundary is on the order of 6%. This method can be used to obtain engine surge characteristics in the early design stage accurately, does not rely on additional empirical parameter calibration, and can replace part of the engine surge tests, reducing research costs.
(2)
The engine surge characteristics are obtained through the adjustment of the variable geometry turbine in the simulation results. During the surge, compressor inlet and outlet pressures exhibit periodic changes, but the minimum flow rate does not reach a negative value in the inlet passage. The engine studied in this paper enters a mild surge state. During the surge, the changes in aerodynamic forces on all blade rows are not significant. However, the axial aerodynamic forces on the engine rotor system reverse their directions. The maximum reverse axial force exerted on the rotor system is 0.6 times the axial force before the surge inception.
(3)
In the engine environment, the centrifugal compressor still exhibits the evolution trend of two-regime surge previously reported in component-level studies. In the small turbojet engine studied in this paper, when gradually closing VGTS vanes, the compressor sequentially enters mild surge and then recovers from it. If the exhaust temperature limits are lifted in simulations, the engine then progresses into a deep surge. In the practical applications, the engine becomes inoperable beyond the mild surge state; thus, the mild surge inception point should be defined as the engine’s stability boundary.

Author Contributions

Conceptualization, M.W. and H.Y.; methodology, M.W., H.Y. and W.K.; software, M.W. and Z.D.; validation, M.W., X.Z. (Xuedong Zheng) and L.J.; investigation, M.W., X.Z. (Xuedong Zheng) and R.L.; data curation, R.L. and L.J.; writing—original draft preparation, M.W.; writing—review and editing, B.W.; supervision, X.Z. (Xinqian Zheng). All authors have read and agreed to the published version of the manuscript.

Funding

This research was supported by the National Major Science and Technology Project of China (Grant Nos. J2019-I-0021-0020 and J2019-II-0020-0041).

Data Availability Statement

The original contributions presented in this study are included in the article. Further inquiries can be directed to the corresponding author(s).

Conflicts of Interest

Authors Rusheng Li and Lei Jin were employed by the company Hawk Power Technology Co., Ltd., Neijiang, China. The remaining authors declare that the research was conducted in the absence of any commercial or financial relationships that could be construed as a potential conflict of interest.

Abbreviations

ECUEngine Control Unit
EGTExit Gas Temperature
FFTFast Fourier Transform
FSOFull-Scale Output
Norm.Normalized
NPNormalized Pressure
PRPressure Ratio
PIDProportional Integral Derivative
RANSReynolds-averaged Navier–Stokes
SSTShear Stress Transport
URANSUnsteady Reynolds-averaged Navier–Stokes
VGTVariable Geometry Turbine
VGTSVariable Geometry Turbine Stator
πPressure Ratio
Mass Flow Rate

References

  1. Day, I.J. Stall, Surge, and 75 Years of Research. J. Turbomach. 2016, 138, 011001. [Google Scholar] [CrossRef]
  2. Cumpsty, N.A. Compressor Aerodynamics; Longman Scientific & Technical: Harlow, UK; J. Wiley: New York, NY, USA, 1989; p. 509. [Google Scholar]
  3. Emmons, H.W.; Pearson, C.E.; Grant, H.P. Compressor Surge and Stall Propagation. Trans. ASME 1955, 77, 455–467. [Google Scholar] [CrossRef]
  4. McDougall, N.M.; Cumpsty, N.A.; Hynes, T.P. Stall Inception in Axial Compressors. J. Turbomach. 1990, 112, 116–123. [Google Scholar] [CrossRef]
  5. Day, I.J. Stall Inception in Axial Flow Compressors. J. Turbomach. 1993, 115, 1–9. [Google Scholar] [CrossRef]
  6. Greitzer, E.M. Surge and Rotating Stall in Axial Flow Compressors—Part I: Theoretical Compression System Model. J. Eng. Power 1976, 98, 190–198. [Google Scholar] [CrossRef]
  7. Moore, F.K. A Theory of Rotating Stall of Multistage Axial Compressors: Part I—Small Disturbances. J. Eng. Gas Turbines Power 1984, 106, 313–320. [Google Scholar] [CrossRef]
  8. Fink, D.A.; Cumpsty, N.A.; Greitzer, E.M. Surge Dynamics in a Free-Spool Centrifugal Compressor System. J. Turbomach. 1992, 114, 321–332. [Google Scholar] [CrossRef]
  9. Zheng, X.; Liu, A. Experimental Investigation of Surge and Stall in a High-Speed Centrifugal Compressor. J. Propuls. Power 2015, 31, 815–825. [Google Scholar] [CrossRef]
  10. Sun, Z.; Zheng, X.; Kawakubo, T. Experimental investigation of instability inducement and mechanism of centrifugal compressors with vaned diffuser. Appl. Therm. Eng. 2018, 133, 464–471. [Google Scholar] [CrossRef]
  11. Zheng, X.; Sun, Z.; Kawakubo, T.; Tamaki, H. Experimental investigation of surge and stall in a turbocharger centrifugal compressor with a vaned diffuser. Exp. Therm. Fluid Sci. 2017, 82, 493–506. [Google Scholar] [CrossRef]
  12. Lin, Y.; Niu, Z.; Zheng, X. Two-Regime Surge Mechanism in Centrifugal Compressors. J. Propuls. Power 2023, 39, 190–201. [Google Scholar] [CrossRef]
  13. Zheng, X.; Liu, A. Phenomenon and Mechanism of Two-Regime-Surge in a Centrifugal Compressor. J. Turbomach. 2015, 137, 081007. [Google Scholar] [CrossRef]
  14. Burwell, A.; Patterson, G. Dynamic engine behavior during post surge operation of a turbofan engine. In Proceedings of the 21st Joint Propulsion Conference, Monterey, CA, USA, 8–10 July 1985. Paper AIAA-1985-1288. [Google Scholar]
  15. Lorenzo, C.F.; Chiaramonte, F.P.; Mehalic, C.M. Determination of compressor stall characteristics from engine surge transients. J. Propuls. Power 1988, 4, 133–143. [Google Scholar] [CrossRef]
  16. Höss, B.; Leinhos, D.; Fottner, L. Stall Inception in the Compressor System of a Turbofan Engine. J. Turbomach. 2000, 122, 32–44. [Google Scholar] [CrossRef]
  17. Wilson, A.G.; Freeman, C. Stall Inception and Development in an Axial Flow Aeroengine. J. Turbomach. 1994, 116, 216–225. [Google Scholar] [CrossRef]
  18. Bae, J.W. An Experimental Study of Surge Control in a Helicopter Gas Turbine Engine. Ph.D. Thesis, Massachusetts Institute of Technology, Cambridge, MA, USA, 2010. [Google Scholar]
  19. Greitzer, E.M. Surge and Rotating Stall in Axial Flow Compressors—Part II: Experimental Results and Comparison with Theory. J. Eng. Power 1976, 98, 199–211. [Google Scholar] [CrossRef]
  20. Huang, Q.; Zhang, M.; Zheng, X. Compressor surge based on a 1D-3D coupled method—Part 1: Method establishment. Aerosp. Sci. Technol. 2019, 90, 342–356. [Google Scholar] [CrossRef]
  21. Huang, Q.; Zhang, M.; Zheng, X. Compressor surge based on a 1D-3D coupled method—Part 2: Surge investigation. Aerosp. Sci. Technol. 2019, 90, 289–298. [Google Scholar] [CrossRef]
  22. Andrew, G. Three-Dimensional Rotating Stall Inception and Effects of Rotating Tip Clearance Asymmetry in Axial Compressors. Ph.D. Thesis, Massachusetts Institute of Technology, Department of Aeronautics and Astronautics, Cambridge, MA, USA, 1999. [Google Scholar]
  23. Sun, X.; Liu, X.; Hou, R.; Sun, D. A General Theory of Flow-Instability Inception in Turbomachinery. AIAA J. 2013, 51, 1675–1687. [Google Scholar] [CrossRef]
  24. You, D.; Kalitzin, G.; Herrmann, M.; Ham, F.; Pitsch, H.; van der Weide, E.; Alonso, J. Integrated Computations of an Entire Jet Engine. In Proceedings of the ASME Turbo Expo 2007: Power for Land, Sea, and Air, Montreal, QC, Canada, 14–17 May 2007; Volume 6: Turbo Expo 2007, Parts A and B, Paper GT2007-27094. pp. 299–308. [Google Scholar] [CrossRef]
  25. Turner, M.; Ryder, R.; Celestina, M.; Moder, J.; Liu, N.-S.; Adamczyk, J.; Veres, J. High Fidelity 3D Turbofan Engine Simulation with Emphasis on Turbomachinery-Combustor Coupling. In Proceedings of the 38th AIAA/ASME/SAE/ASEE Joint Propulsion Conference & Exhibit, Indianapolis, IN, USA, 7–10 July 2002. Paper AIAA 2002-4067. [Google Scholar]
  26. Turner, M. Lessons Learned from the GE90 3-D Full Engine Simulations. In Proceedings of the 48th AIAA Aerospace Sciences Meeting Including the New Horizons Forum and Aerospace Exposition, Orlando, FL, USA, 4–7 January 2010. Paper AIAA 2010-962. [Google Scholar]
  27. Romagnosi, L.; Mezine, M.; Baux, Y.; Anker, J.; Claramunt, K.; Hirsch, C. A Methodology for Fully-Coupled CFD Engine Simulations, Applied to a Micro Gas Turbine Engine. In Proceedings of the ASME Turbo Expo 2018: Turbomachinery Technical Conference and Exposition, Oslo, Norway, 11–15 June 2018; Volume 2C: Turbomachinery, Paper V02CT42A047. [Google Scholar] [CrossRef]
  28. Li, Y.; Mezine, M.; Teixeira, M.; Vilmin, S.; Anker, J.E.; Claramunt, K.; Baux, Y.; Hirsch, C. A Methodology for Steady and Unsteady Full-Engine Simulations. In Proceedings of the ASME Turbo Expo 2019: Turbomachinery Technical Conference and Exposition, Phoenix, AZ, USA, 17–21 June 2019; Volume 2C: Turbomachinery, Paper V02CT41A002. [Google Scholar] [CrossRef]
  29. Xu, Y.; Yan, C.; Piao, Y. Analysis of discrepancies between 3-D coupled and uncoupled schemes based on CFD in full engine simulation. Aerosp. Sci. Technol. 2022, 131, 107978. [Google Scholar] [CrossRef]
  30. Wei, J.; Wen, M.; Yang, H.; Wang, X.; Zheng, X. Full Three-Dimensional Fluid-Thermal-Structural Coupling Modeling Method for Turbojet Engines. J. Aerosp. Power 2025, 40, 79–87. [Google Scholar] [CrossRef]
  31. Li, J.; Wang, B.; Zheng, X.; Wang, Z.; Zheng, X. Experimental Investigation on the Aerodynamic Instability Process of a High-Speed Axial-Centrifugal Compressor. J. Eng. Gas Turbines Power 2024, 146, 081018. [Google Scholar] [CrossRef]
  32. Erario, M.L.; De Giorgi, M.G.; Przysowa, R. Model-Based Dynamic Performance Simulation of a Microturbine Using Flight Test Data. Aerospace 2022, 9, 60. [Google Scholar] [CrossRef]
  33. Akhlaghi, M.; Azizi, Y. Investigation of Vaned-Recessed Casing Treatment in a Low-Speed Axial-Flow Compressor, Part II: Unsteady Results. Aerospace 2023, 10, 763. [Google Scholar] [CrossRef]
  34. Li, J.; Wang, B.; Zeng, H.; Zheng, X. Investigation of the mild surge in an axial–centrifugal compressor. Phys. Fluids 2024, 36, 066113. [Google Scholar] [CrossRef]
  35. Zhao, B.; Huang, C.; Zhang, Z.; Cui, W.; Zhou, T. Experimental study on the effects of compressor rotational speed on surge characteristics: Spatial and temporal frequencies. Aerosp. Sci. Technol. 2025, 157, 109854. [Google Scholar] [CrossRef]
  36. Magnussen, B.F.; Hjertager, B.H. On mathematical modeling of turbulent combustion with special emphasis on soot formation and combustion. Symp. (Int.) Combust. 1977, 16, 719–729. [Google Scholar] [CrossRef]
Figure 1. Structure and sections of the engine. Red blocks indicate the rotor blades and blue blocks indicate the stator blades.
Aerospace 12 00878 g001
Figure 2. Configuration of the engine.
Aerospace 12 00878 g002
Figure 3. Structure of the variable geometry turbine.
Aerospace 12 00878 g003
Figure 4. Mesh structure and independence analysis of the engine model.
Aerospace 12 00878 g004
Figure 5. Comparison of simulation and experiment at different positions.
Aerospace 12 00878 g005
Figure 6. Key performance parameters of the engine.
Aerospace 12 00878 g006
Figure 7. Contour plot of aerodynamic parameters distribution for the engine at the design point.
Aerospace 12 00878 g007
Figure 8. Surge boundary of the engine.
Aerospace 12 00878 g008
Figure 9. Variation in the main aerodynamic parameters of the engine during mild surge.
Aerospace 12 00878 g009
Figure 10. Streamlines of the compressor rotor at different time points during the surge process.
Aerospace 12 00878 g010
Figure 11. Surge cycle at different engine sections. Black lines represent surge cycles, blue line represents characteristic line, red point represent the engine design point on the characteristic line.
Aerospace 12 00878 g011
Figure 12. Aerodynamic loads on blades during surge.
Aerospace 12 00878 g012
Figure 13. Axial force on rotor during surge.
Aerospace 12 00878 g013
Figure 14. Mild surge recovery of the compressor.
Aerospace 12 00878 g014
Figure 15. Variation in the main aerodynamic parameters of the engine during deep surge.
Aerospace 12 00878 g015
Table 1. Key parameters of the small engine.
ParameterValue
Diameter of the impeller0.12 m
Diameter of the engine0.18 m
Design spool speed90,000 rpm
Design rotor tip speed565 m/s
Number of impeller blades7
Number of diffuser blades15
Number of vaporizer tubes in the combustor12
Number of turbine stator blades15
Number of turbine rotor blades23
Max thrust of the engine539 N
Design Turbine Inlet Temperature1200 K
Max pressure ratio of the engine4.5
Table 2. Parameters of probes used in the test.
CharacteristicsXTE-190(M)-40AXTEH-10L-190
Range of Pressure275 kPa ± 0.1% FSO1379 kPa ± 0.1% FSO
Natural Frequency300 kHz500 kHz
Range of Temperature25–232 °C25–454 °C
Disclaimer/Publisher’s Note: The statements, opinions and data contained in all publications are solely those of the individual author(s) and contributor(s) and not of MDPI and/or the editor(s). MDPI and/or the editor(s) disclaim responsibility for any injury to people or property resulting from any ideas, methods, instructions or products referred to in the content.