Abstract
To accurately analyze the influence of similar weather scenes in the terminal area, a framework is proposed for identifying such scenarios based on the Multiresolution Spatiotemporal Window (MRSTW). The goal is to analyze the impact of similar weather patterns. This paper introduces a simple and effective method called the rasterized weather severity index (WSI) to reduce the dimensionality of data used for extracting air transport weather features, which can cause the loss of spatial information in an image. Additionally, the paper uses Dynamic Time Warping (DTW) and the Fuzzy C-mean (FCM) clustering algorithm to cluster time-series scenes influenced by convective weather in an unsupervised manner on a daily basis. The most similar weather scenes are then identified by searching for the same cluster within a multiresolution spatiotemporal window, using 4 h weather scenes as typical examples. Finally, the framework analyzes the impact of weather scenes on the operation of terminal area approach traffic flow by combining trajectory data. The findings demonstrate that this framework can effectively identify similar weather scenes and provide a more accurate reflection of their impact on the operation of terminal area approach traffic flow.
1. Introduction
Convective weather is a significant factor in the airspace system. The convective weather season mostly occurs between spring and early fall, causing 60% of all weather delays throughout the year [1]. Weather conditions have a notable impact on aircraft operations. Particularly, intense convective weather results in the implementation of various traffic management measures such as rerouting, cancellations, and ground stops, which are major contributors to delays. Therefore, analyzing traffic flow based on similar weather scenes helps in identifying patterns from past operations and improving terminal area management.
In previous studies, researchers have used clustering and classification algorithms to analyze historical weather, capacity, demand, and other related data in the National Airspace System [2,3,4,5,6]. These algorithms help identify similar operating environments and evaluate historical operating strategies. However, existing clustering algorithms for spatiotemporal data mainly focus on events, geo-referenced data, and mobile data, which are different from weather impact scenario data. Convective weather propagation follows specific spatiotemporal patterns due to physical meteorological processes, leading to changes in shape, size, location, and intensity. Current convective weather studies primarily focus on quantifying convective weather and its spatial impacts, without describing the trajectories of weather and weather impacts. This paper focuses on the Guangzhou terminal area, examining the spatiotemporal distribution of convective weather from the perspective of weather impact. It introduces rasterized weather severity index (WSI) to downscale convective weather and construct a time-series scenario with convective weather impact. The Dynamic Time Warping (DTW) and the Fuzzy C-mean (FCM) clustering algorithm is used for similarity metrics and unsupervised clustering. A 4 h typical weather scene is then selected and identified using the Multiresolution Spatiotemporal Window (MRSTW) metric method in the same cluster, to determine the most similar sets of scenes. Finally, the paper analyzes the operation of the approach traffic flow in the terminal area under meteorological influence from the spatiotemporal perspective.
This paper presents the main contributions as follows:
- (1)
- A framework has been developed for extracting features and identifying similar weather scenes in terminal areas. This aims to analyze the spatiotemporal movement patterns of meteorological scenes in terminal areas.
- (2)
- An identification method that combines clustering and search has been proposed to identify similar weather scenes from a scene library.
- (3)
- A distance metric based on multiresolution spatiotemporal distance has been proposed and its effectiveness and superiority have been demonstrated using the historical meteorological dataset of the Guangzhou terminal area.
2. Related Works
In this section, we first review feature selection and feature extraction for similar weather scenes, and further explore the existing research on similarity metrics in similar weather scenes, as well as classification methods for similar weather scenes. These are important steps in similar weather scene identification.
Feature selection and feature extraction are crucial in distinguishing between similar weather scenes. High-quality features can simplify algorithm complexity, improve efficiency, and achieve optimal clustering effects, especially for high-dimensional or complex data types such as text and image datasets. Therefore, feature selection and extraction strategies are particularly important in such cases. Several researchers have introduced different weather severity indices. For instance, Krozel J et al. [7] defined the Weather Severity Index (WSI), which measures the degree of weather severity by calculating the percentage of the area with severity greater than 3 in convective weather. This reduces the dimensionality of convective weather data and enhances computational efficiency. Arneson H et al. [8] processed a large amount of weather and traffic data to create the Weather Impacted Traffic Index (WITI), which measures the similarity of similar scenes and studies the impact of convective weather on traffic. KLEIN et al. [9] proposed a capacity prediction method based on WITI, introducing the concept of maximum WITI and using it to measure the impact of weather on airspace. The WITI concept gained significant usage in subsequent related studies. It has led to the development of WITI-based weather impact classification in similar day-related studies, weather impact traffic index based on meteorology and transportation (WITI-FA) [10], and so on. Furthermore, Shiyu Huang et al. [11] introduced a new assessment approach utilizing an enhanced WITI model for computing the WITI during various severe weather conditions. The method combines a deep neural network algorithm and a linear regression algorithm to calculate the sector capacity under different severe weather conditions.
In the context of evaluating similarity metrics for similar weather scenes, the primary objective of recognizing similar weather scenes is to group similar data objects or pattern vectors together. Therefore, measuring the distance or similarity between data objects is crucial in similarity metrics. It is important to note that different distance metrics yield different recognition results. Liu Yi et al. [12] introduced a semi-supervised learning approach to assess the similarity of weather forecasts. This approach involves supervising and automatically learning pre-defined similarities and dissimilarities. They applied this method in a case study at the Newark Liberty International airport and found that similar weather forecasts can result in varying acceptance rates and runway configuration outcomes, particularly for capacity profiles and runway configuration choices at airports. Chen Haiyan et al. [13] proposed an active support vector machine metric learning algorithm (Active SVM metric learning algorithm, ASVM2L) for measuring and identifying similar traffic scenarios. They verified the effectiveness and accuracy of the algorithm using a historical air traffic dataset from the south-central sector of China. Additionally, Vargo [14] proposed a probabilistic random field model for comparing similar days. This model involves supervising the learning of similarity scores with user inputs. Vargo’s approach considers the high dimensionality of traffic flow management data, as well as the presence of continuous and categorical variables. Sreeta Gorripaty et al. [15] transformed input airport demand and weather variables into a similarity measure between dates. They achieved this by identifying similar historical dates, TMIs used on those dates, and the resulting runs. Their method involved utilizing a stochastic survival forest model to learn a random variable for airport capacity. They also constructed a capacity–demand similarity matrix using capacity distribution and queuing delay data and validated it for EWR airport.
In terms of classifying similar weather scenes, Hoffman [16] identified similar days by using cluster analysis on data describing the performance of air transportation systems, such as the number of flights canceled each day. Zeng Yang et al. [17] and colleagues focused on describing and classifying scenes in terminal areas. They developed multivariate features encompassing meteorology, traffic, and traffic strategy in terminal areas, and utilized fuzzy C-mean clustering (FCM) to cluster similar scenes based on these features. Stefan Reitmann et al. [18] utilized the ATMAP weather algorithm to assess weather conditions at airports. They linked weather data and airport operational data, including flight plan data, with expected and actual operations and delays. They then employed unsupervised learning to cluster the performance impacts at airports and used recurrent and convolutional neural networks to classify the respective weather data. The results of their study demonstrated that the machine learning approach effectively correlates airport performance degradation with local weather events. Xie Lei [19] et al. enhanced the existing WITI model, based on fuzzy theory, by smoothing the transitions between good and bad weather and factoring in the weather impact in the airspace near the center of the weather system. The results indicated that the improved model can more comprehensively and accurately characterize the impact of weather on air traffic. Kong Derui et al. [20] proposed a clustering model based on HI-K-means for identifying similar traffic days. This approach combines hierarchical clustering and K-means clustering and applies it to analyze traffic at Tianjin Binhai Airport. The study concludes that this model can better match daily traffic under different strategies by identifying three types of similar day traffic patterns.
Despite the rich literature on the identification of similar weather scenes, existing identification algorithms for spatiotemporal data focus on events, georeferenced data, and moving data, which are very different from weather-impact-scenario data. In particular, as convective weather spread is governed by physical meteorology processes, it shows spatiotemporal spread patterns of continuously varying shapes, sizes, locations, and intensities. Such spatiotemporal spread features must be captured by the identification algorithms. Drawing inspiration from previous studies, we aim to explore similar weather scenes by taking into account both spatial and temporal dimensions. By investigating the motion patterns of weather scenes, we have developed a framework for identifying similar weather scenes in terminal areas, which integrates clustering and searching methods.
3. Methodology
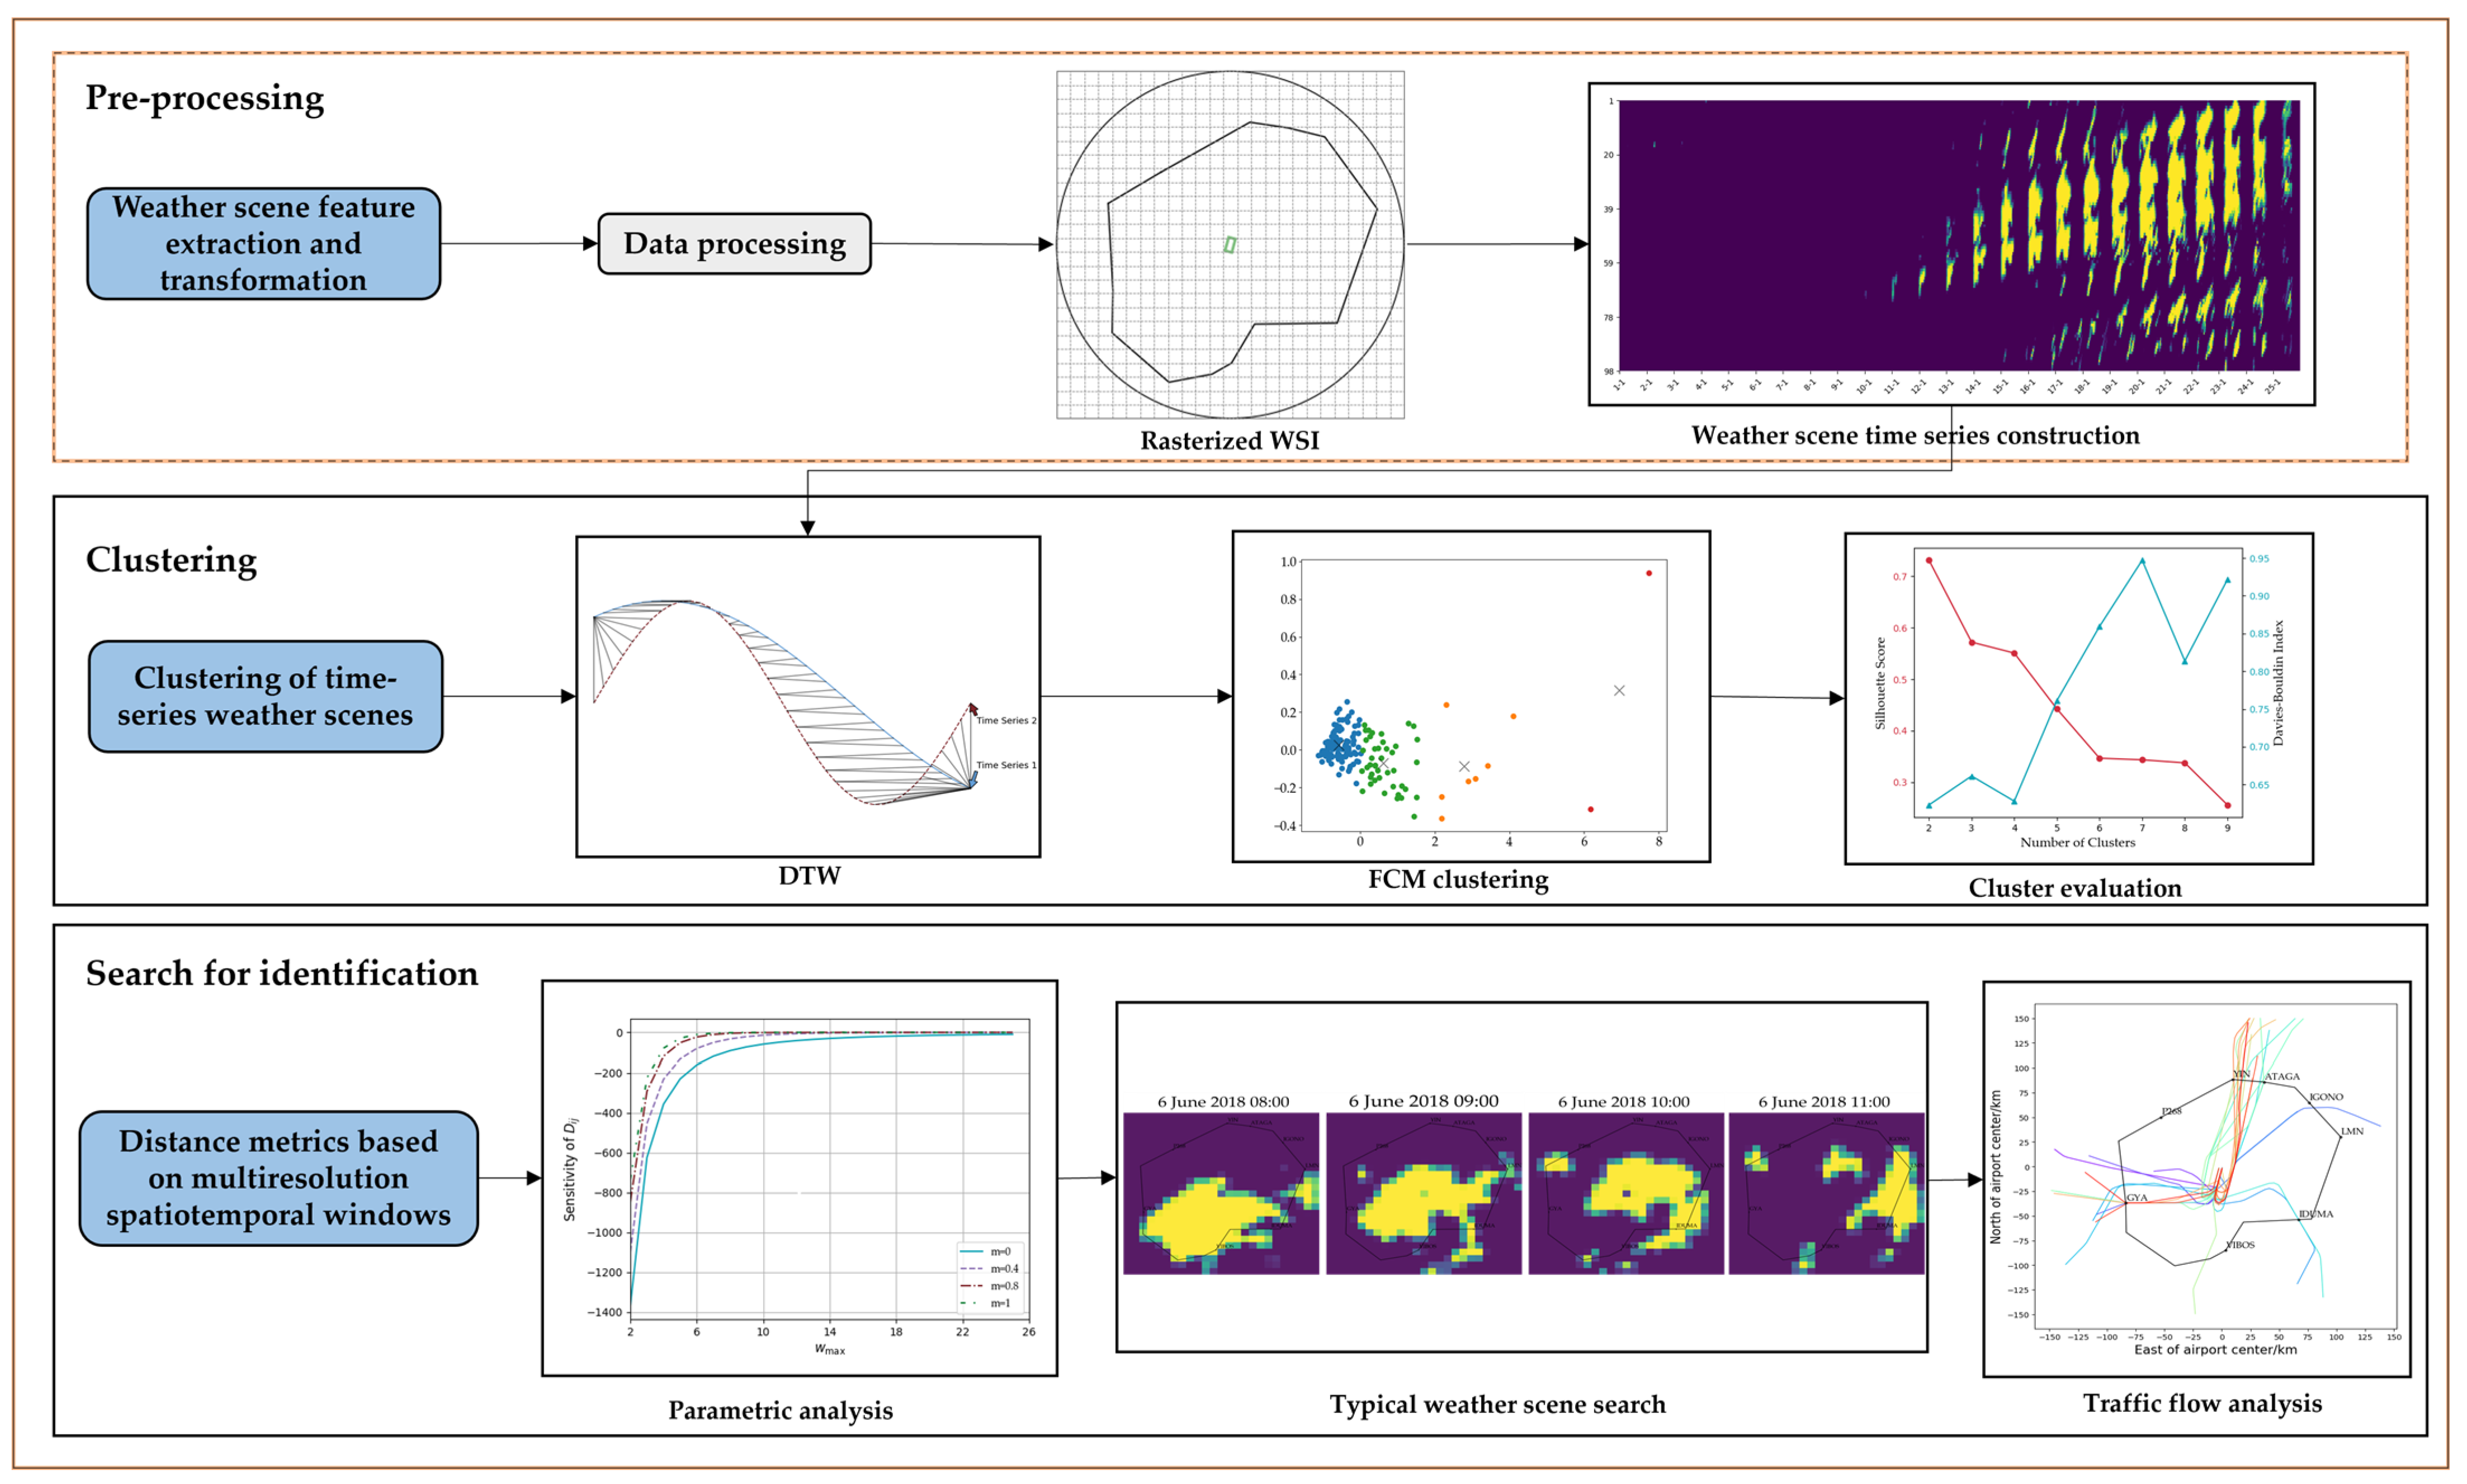
To effectively capture the spatiotemporal motion patterns of weather scenes, we have developed a framework for feature extraction and identification of similar weather scenes in terminal areas. This framework, illustrated in Figure 1, encompasses the following steps: Pre-processing, clustering, search for identification.
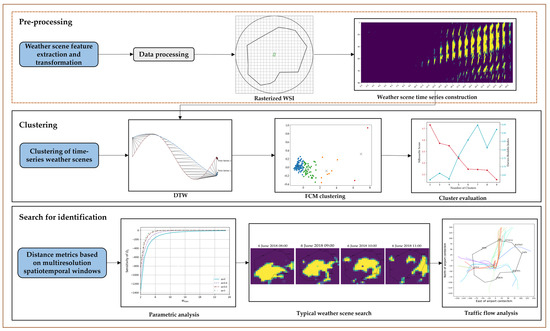
Figure 1.
A framework for feature extraction and identification of similar weather scenes in terminal areas.
3.1. Weather Scene Feature Extraction and Transformation
3.1.1. Data Processing
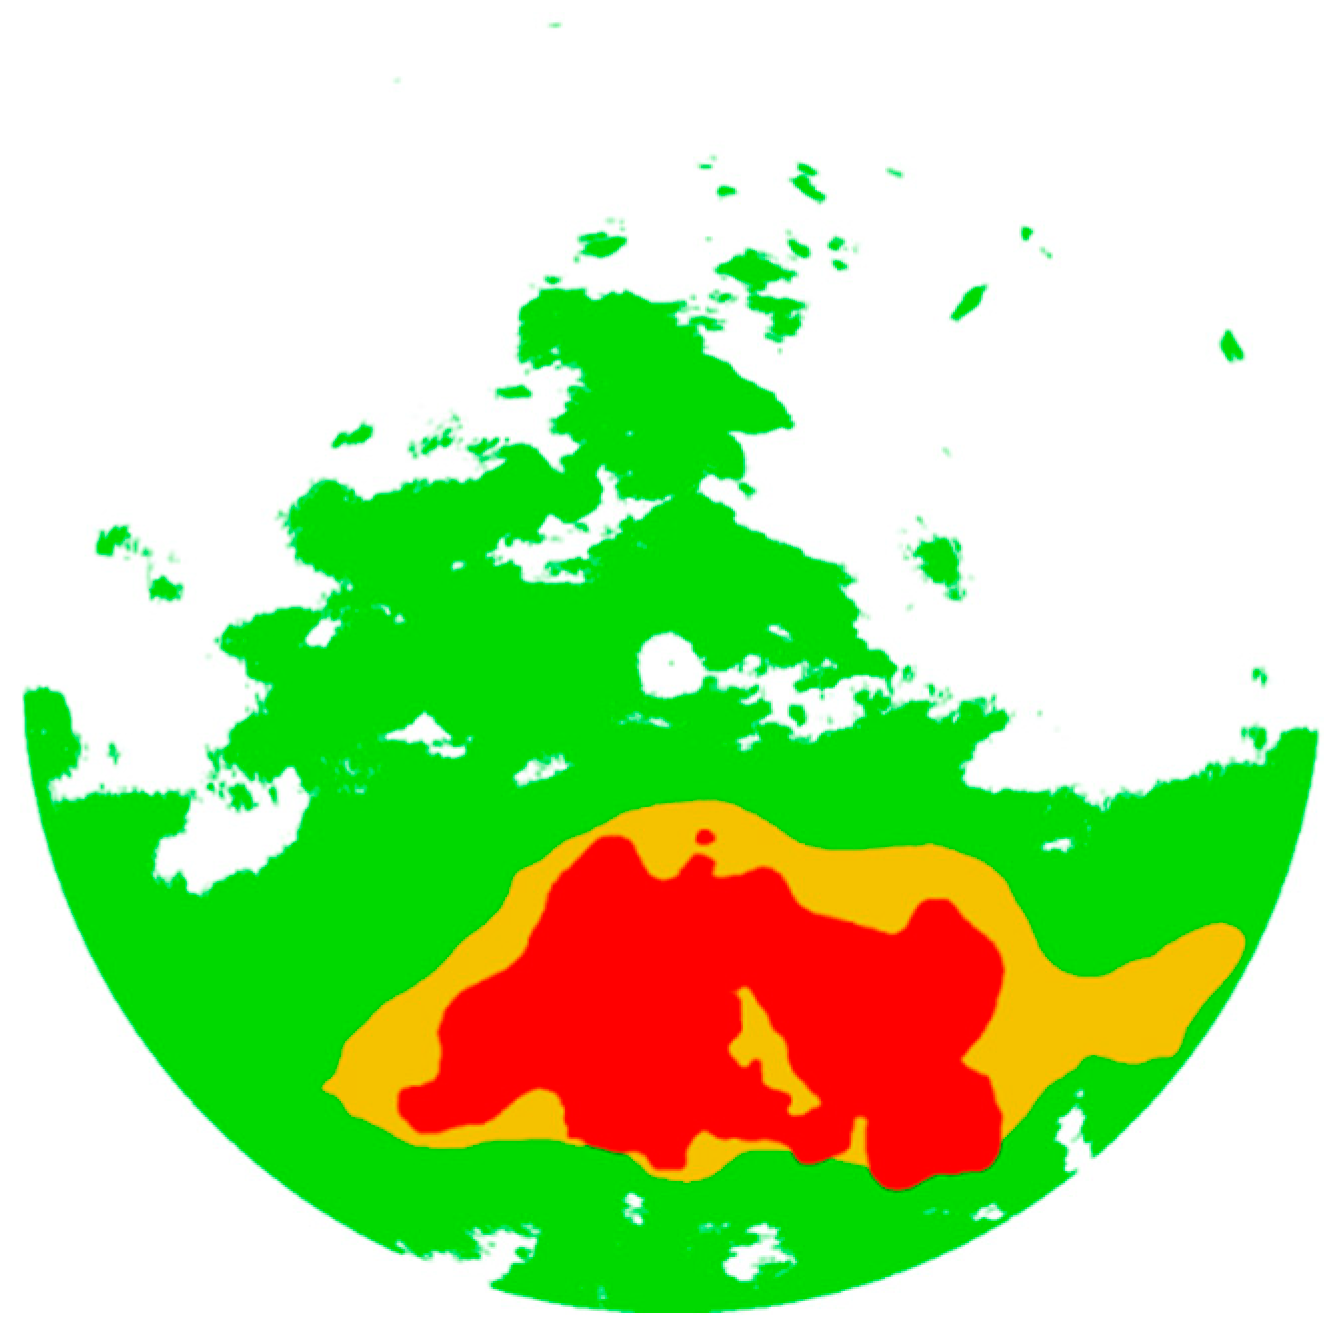
The study used convective weather data from the convective weather avoidance area (WAF) products provided by the Central South Air Traffic Control (CSAT). The WAF product data contain two types of data: graphical and numerical, and each type has a one-to-one relationship. The coverage area of each WAF data is 250 km × 250 km, which is divided into 1250 × 1250 data points covering 200 m × 200 m. Each data point represents the convective weather intensity in the corresponding area. As shown in Figure 2 and Table 1, each data point is marked with a value of 0, 1, 2, or 3, which corresponds to four colors representing different convective weather intensities and flight recommendations. The WAF product data are updated in 10 min intervals, providing real-time convective weather conditions, and the numerical data are mainly utilized in this paper.
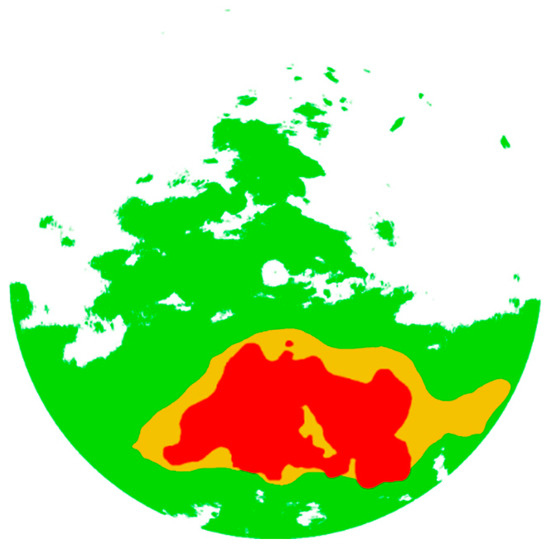
Figure 2.
The diagram of WAF.

Table 1.
WAF data color mapping table.
To account for subsequent clustering, the convective weather data underwent pre-processing. Initially, the WAF data were divided by day, and time slices with no obvious convective weather influence were removed (each WAF value = 0 or 1). In cases where no significant convective weather impact occurred between two time slices with significant impact, and the duration was less than 4 h, the entire impact process was considered a single convective weather impact.
3.1.2. Rasterized WSI
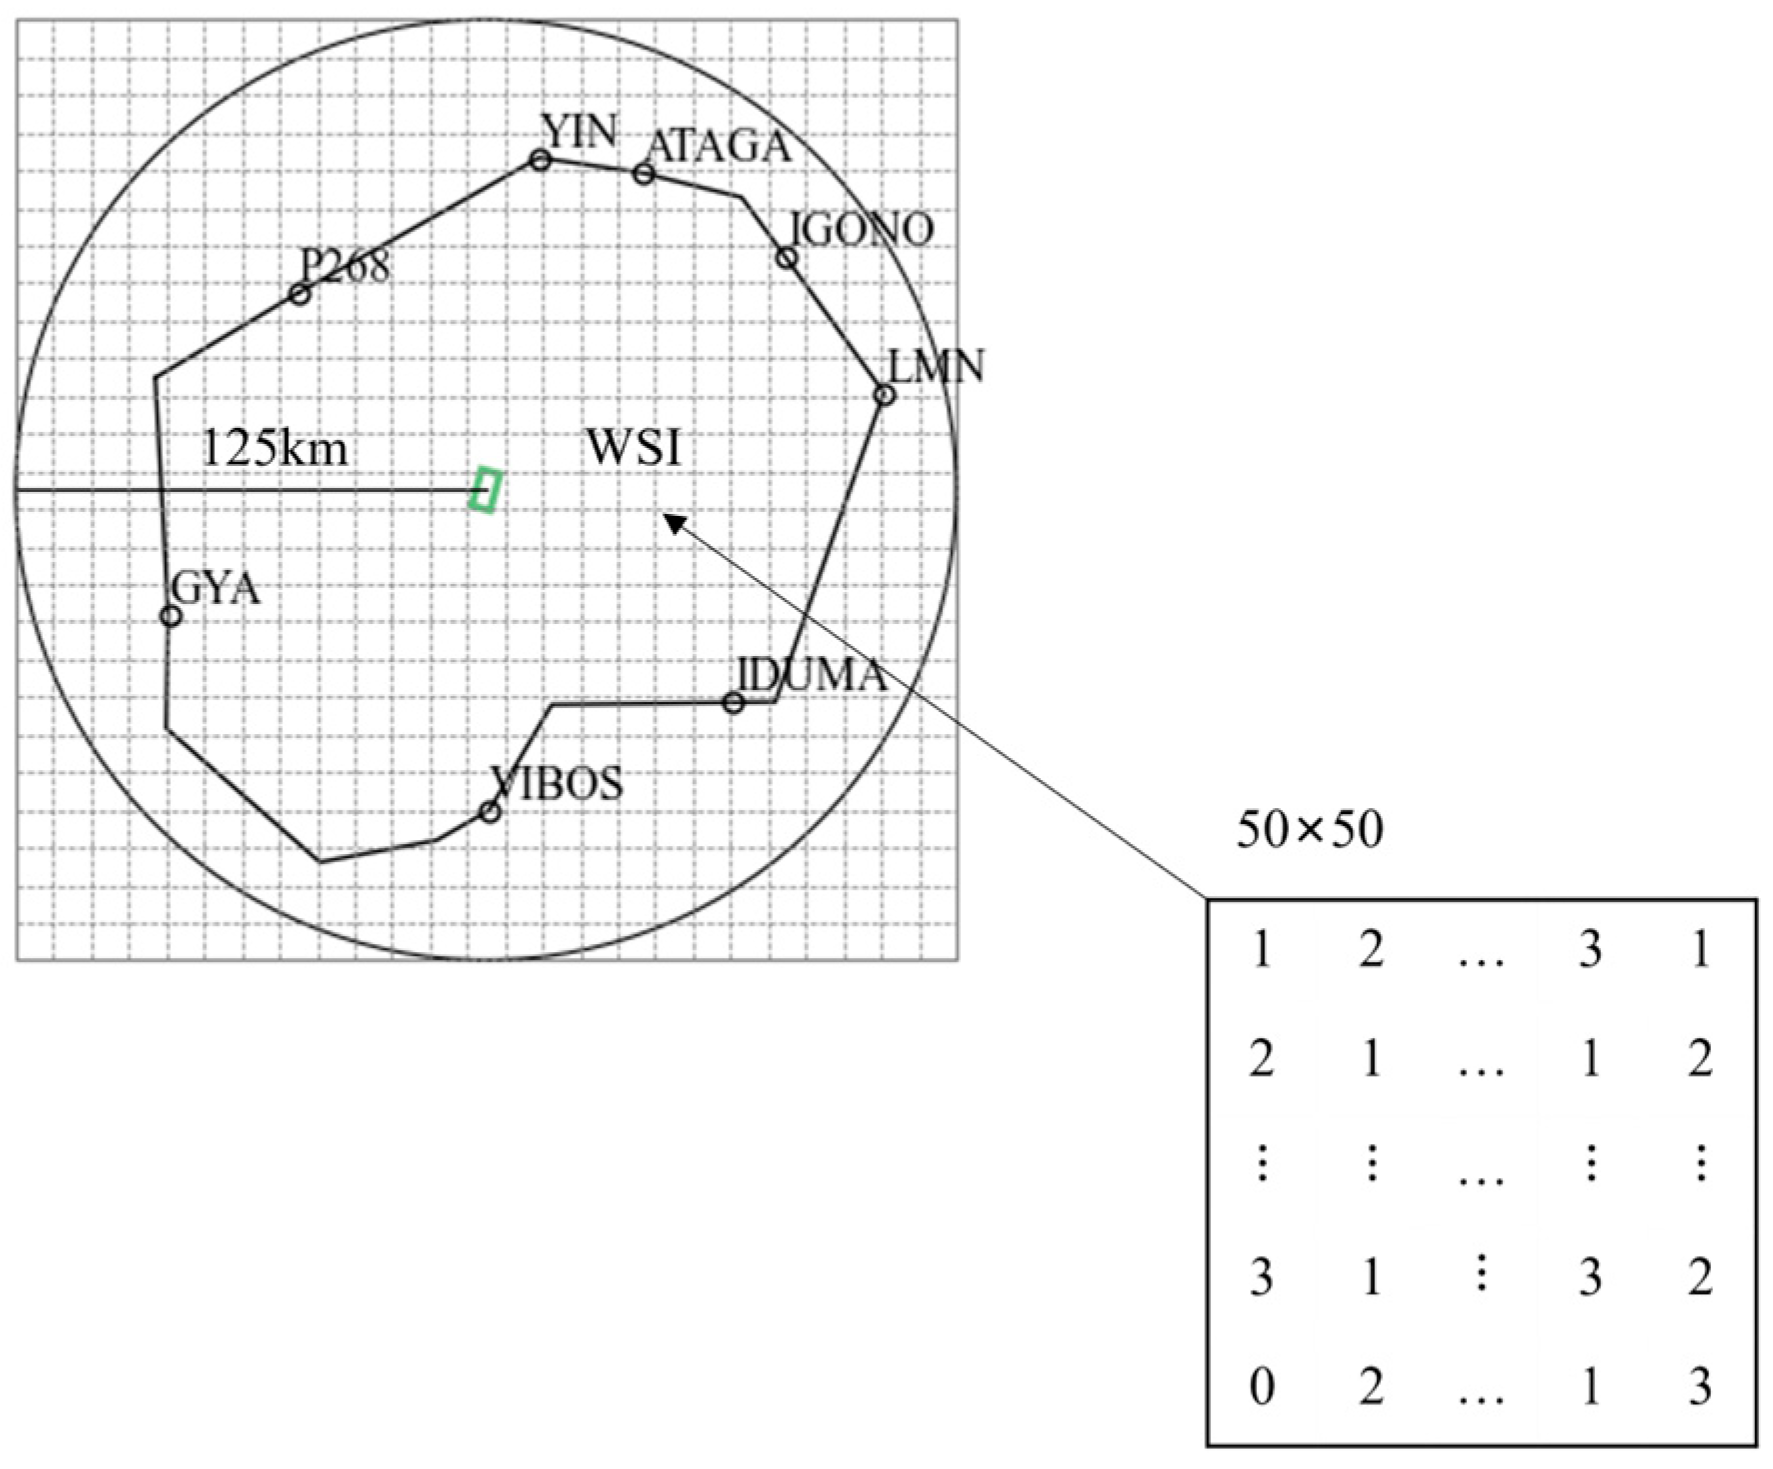
To address the challenge of transforming the key spatiotemporal features of meteorological impacts and extracting typical spatiotemporal impact patterns, this paper uses a spatial rasterization method to downscale the meteorological data. The method focuses on the distribution location of airports for spatial rasterization to compress the data. As depicted in Figure 3, the green square represents the location of the airport, and multiple fine-grained data points within each coarse-grained space are reduced to one point in the form of the weather severity index (WSI) [7], which represents the proportion of non-zero weather points in each small space. The original ATC meteorological data are compressed while retaining the spatial distribution and numerical information as much as possible, resulting in a coarse-grained matrix containing spatial distribution information. This reduces the data size effectively from 1250 × 1250 to 25 × 25.
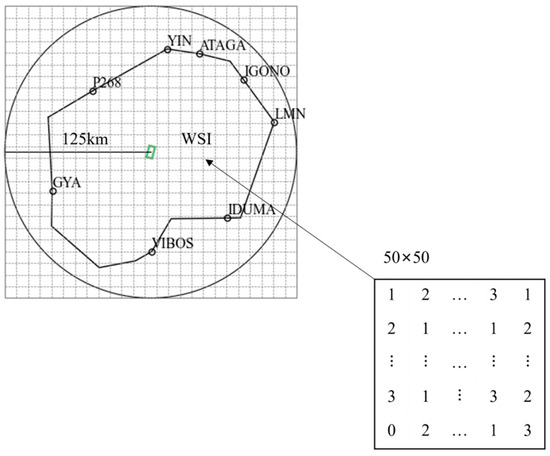
Figure 3.
Rasterized WSI in terminal area.
3.1.3. Time-Series Weather Scene Construction
After completing the WSI rasterization of the terminal area, it is necessary to cluster and classify the meteorological scenes. This requires the construction of time-series meteorological scenes, and this paper provides a way of constructing this scene. The airspace of the terminal area is divided into 25 × 25 rasters based on its geographic location. Each raster contains weather information for a 25 km2 area. The rasters are numbered from to b, with ‘a’ ranging from 1 to 25 representing locations from south to north, and ‘b’ ranging from 1 to 25 representing locations from west to east.
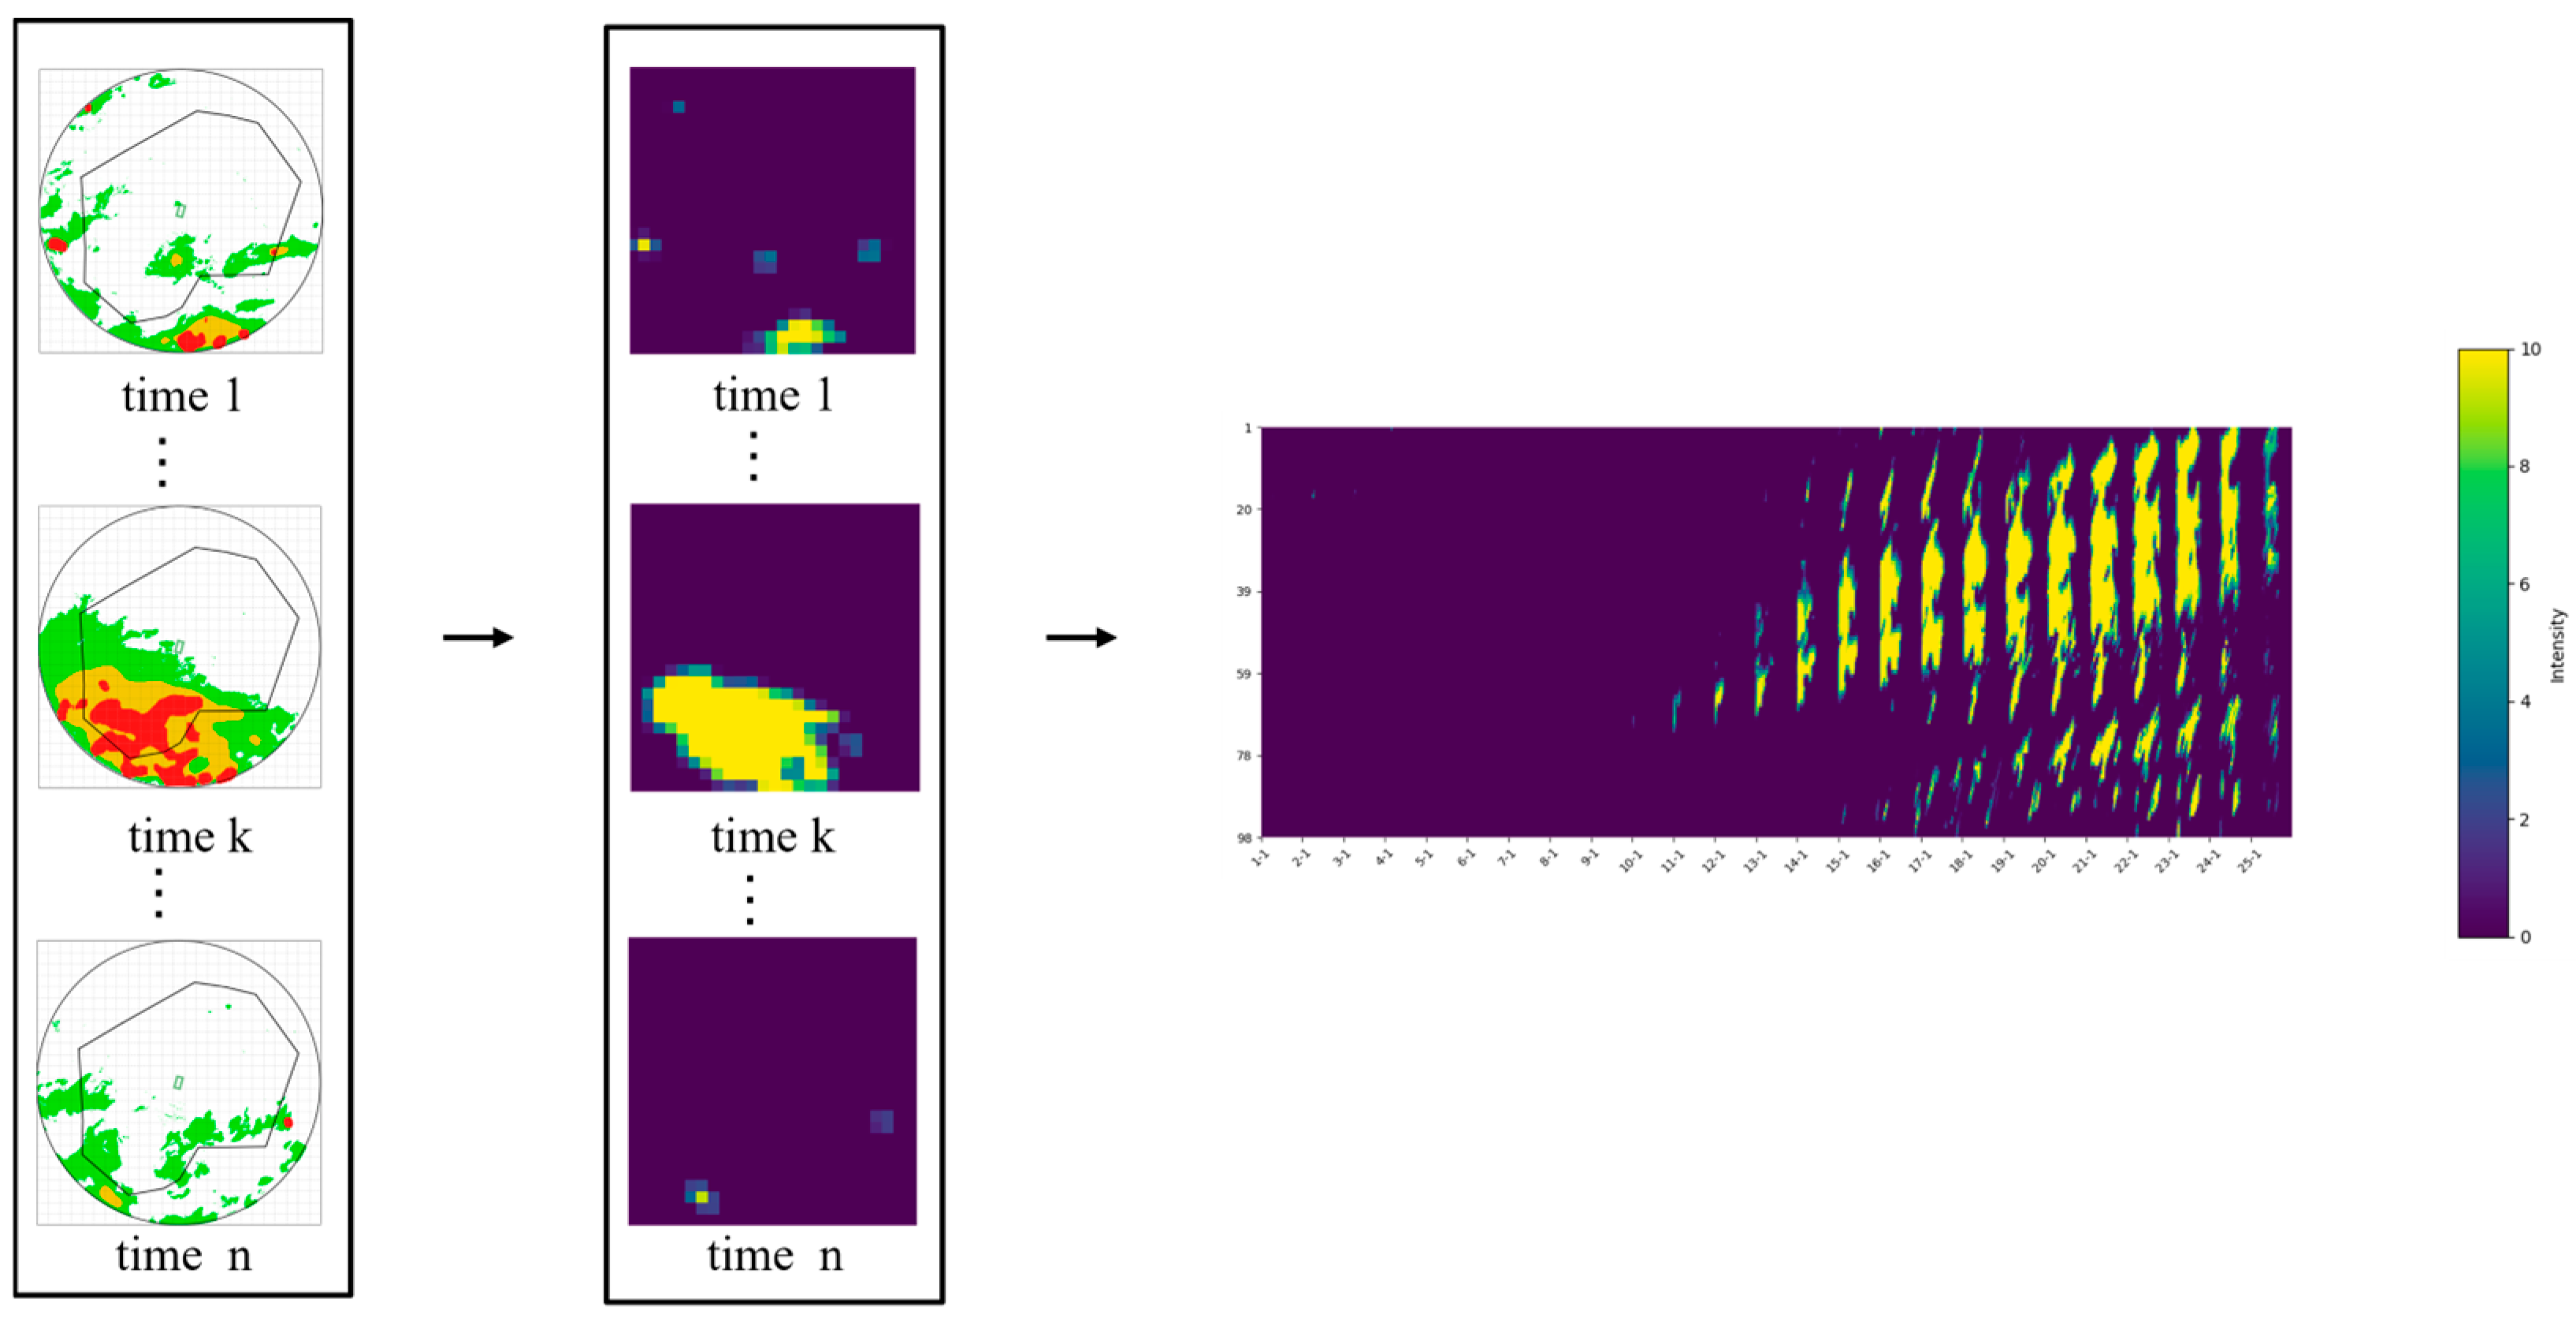
The raster above represents a time-ordered weather scene, with the x-axis showing expansion according to time and the y-axis presenting sequential changes in time. In this study, we constructed the time-ordered weather scene based on daylight filtering out data without weather influence. Figure 4 depicts the construction process map for the time-ordered weather scene on 12 August 2018. The map illustrates the movement of convective weather from the southeast to the southwest of the terminal area, showing that the weather influence range gradually increases during the movement. From an overall perspective, we observe that convective weather is mainly concentrated in the southern part of the terminal area, with the intensity of the convective weather indicated by color intensity, which gradually ranges from dark blue to bright yellow.
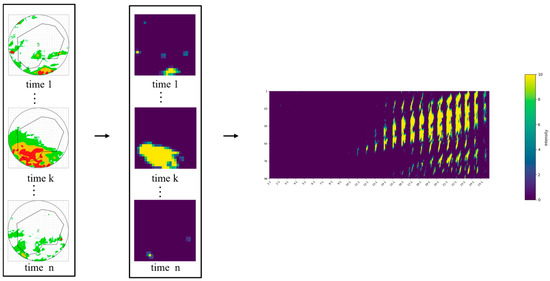
Figure 4.
Weather scene time series construction.
3.2. Clustering of Time-Series Weather Scenes
In this section, we will focus on unsupervised clustering of the time-series weather data to label the different weather scenes. This will help us identify similar weather scenes in different categories and reduce the computational workload during the search process.
The time-series weather scenes mentioned earlier are time-shifted and have unequal lengths, which poses a problem when using distance measures like Euclidean distance or Manhattan distance. To address this, we can use Dynamic Time Warping (DTW) [21] to measure the distance between pairs of time series. DTW allows us to find the best match between two time series by stretching or compressing the temporal data segments. In this technique, each point of the first time series is matched with the second time series, allowing for a comparison of similar patterns occurring at different time periods. Based on DTW, we utilize the FCM algorithm for unsupervised clustering to assign labels to time-series data. The objective function of the FCM algorithm with DTW distance [22] for a given time series dataset is:
where each element denotes the degree of affiliation of scene belonging to the cluster, and is the DTW distance between the sequence in and the clustering center . Let the partial derivative of the loss function with respect to and be 0.
The necessary condition to achieve minimization of Equation (1) is
The specific steps are Algorithm 1. The DTW-FCM algorithm, as designed in this paper, divides the terminal area time-series weather scenes into multiple clusters on a day-by-day basis. Each category exhibits similar time-series patterns.
| Algorithm 1: DTW-FCM based clustering of time-series weather scenes |
| Input: Time-series scenes dataset
; the number of clusters c; the fuzzy weighting index m Output: Each time series label yi 1.for each scenes si in S do: 2. for to n: 3. Calculate the DTW distance matrix D between si and sj 4. end 5.end 6. Calculate the DTW distance matrix D using 7. Randomly initialize the fuzzy affiliation matrix 8. Calculate the center of clustering vj by weighted average as (2) 9. Update the affiliation matrix U as (3) 10. Repeat 8 and 9 until the maximum number of iterations is met 11. Assign each time series si to the cluster: |
3.3. Distance Metrics Based on Multiresolution Spatiotemporal Windows
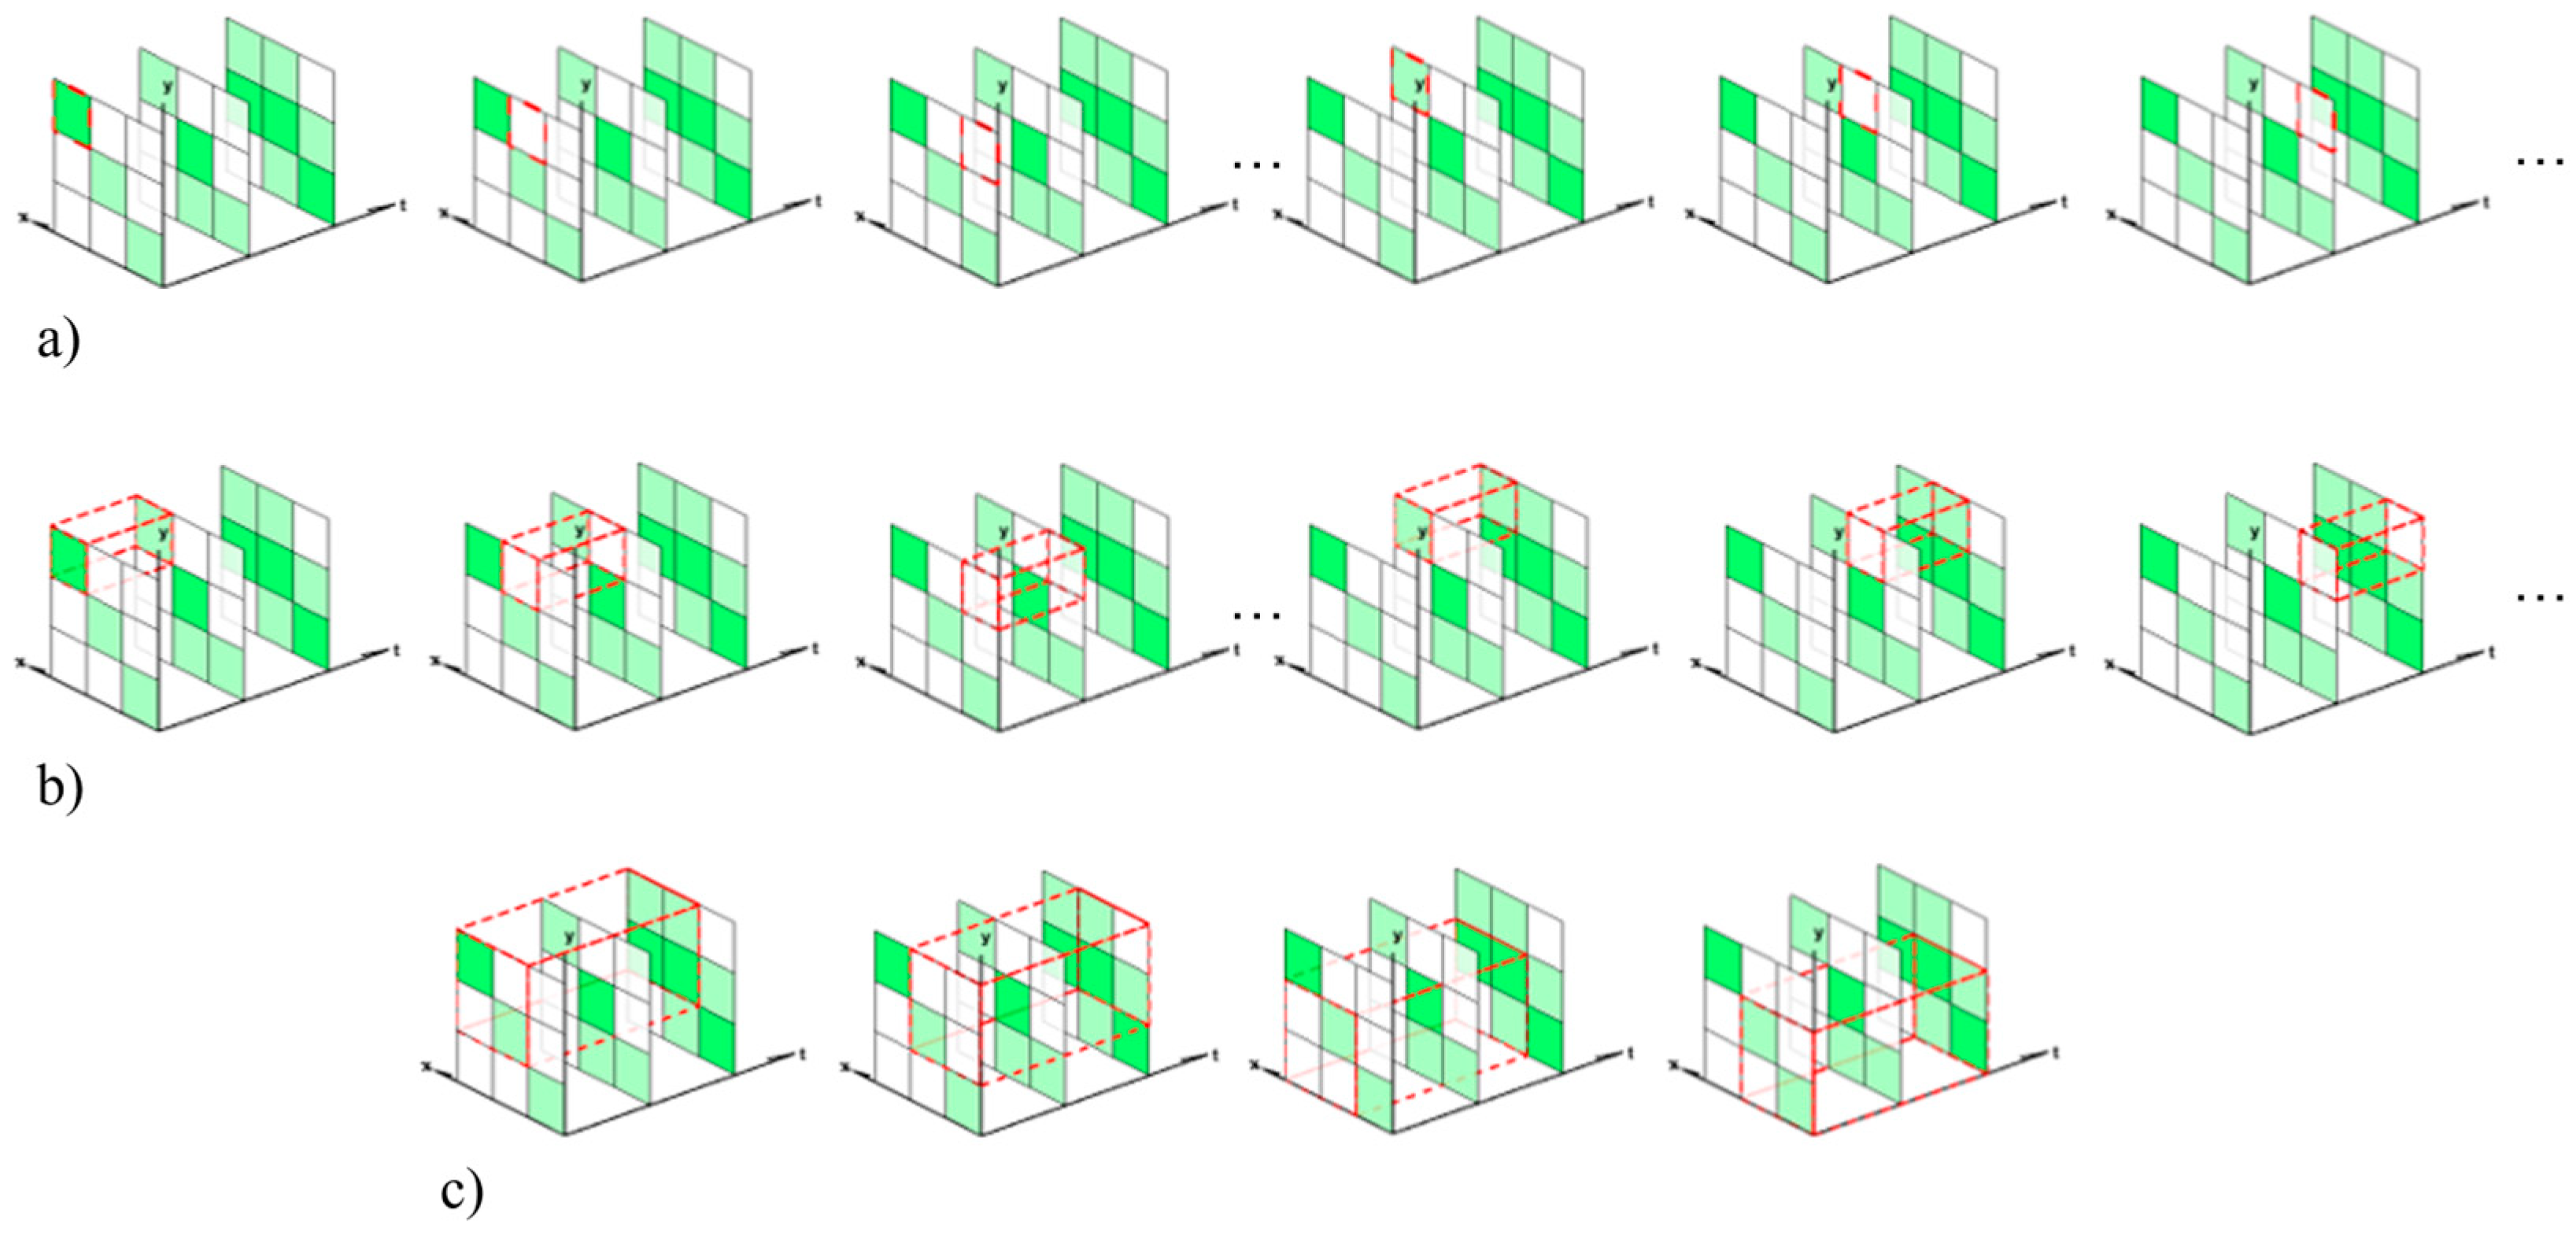
To compare two spatiotemporal scenes, and , each containing the same number of spatial units and time points, a 3-dimensional spatiotemporal moving window of increasing size is utilized to scan the two scenes and calculate their distance. In Figure 5, you can see the scanning process, with the spatiotemporal window highlighted in red. The definition of the spatiotemporal window takes into account spatial cells of arbitrary shape.
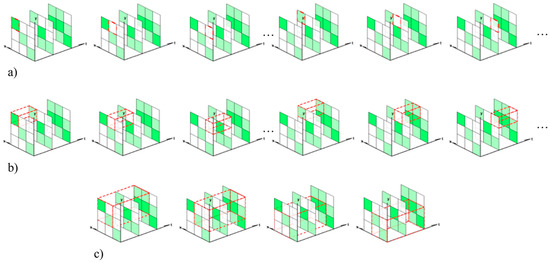
Figure 5.
Schematic diagram of the scanning process with different temporal window sizes (a) , ; (b) , ; (c) , .
In the spatial dimension, a window, , of size is centered on cell . This window contains all cells within a distance of from . In the temporal dimension, a time window, , of size starts at time point and contains consecutive time points. Larger windows represent a coarser resolution. According to this definition, after each scan using a temporal window of size and , the intensity of a cell is determined by comparing the summed intensity within the window, the formula is as follows:
where is the weighted intensity of the scene in cell and time point , and is the weighted constant of the significant cell and time point. We set in this study to ensure that all cells and time points have an equal contribution. However, in some cases, different spatial cells or time points may be assigned different values to represent their weighted contributions. For instance, in strategic air traffic management (ATM), cells representing airports may be assigned a larger weight than usual airspace cells due to their crucial role in ATM strategic decisions. We use to represent the set of spatial windows of size , and to represent the set of temporal windows of size . Furthermore, and stand for the spatial contribution factor for the cell and the temporal contribution factor for the time point , respectively. These contribution factors help in correcting boundary effects [23] to ensure that each spatial cell or time point has an equal contribution to the distance calculation. The formulas used to calculate and are as follows:
The total distance between scenes and is the weighted sum of the obtained at different spatiotemporal resolutions, Specifically:
where and represent the lowest spatial and temporal resolution of the computation, respectively. and are weighting factors, which typically decrease as the window and increases, indicating that smaller contributions are associated with coarser resolutions. In this study, we set , , where . The computational complexity of this distance metric is between and .
The main flow of the proposed MRSTW model is shown in Algorithm 2:
| Algorithm 2: MRSTW |
| Input: Target scene si and scene library sall; Output: Distance Dij 1.Initialize maximum spatial and temporal resolution: , 2.Initialize spatial and temporal resolution weights: , 3.for each si in sall do 4. for each pair of spatial resolution and temporal resolution do 5. for each pair of spatial cell and time point do 6. Calculate the distance for windows and as 7. end 8. Calculate the distance for resolution w and h as (4) 9. end 10. Calculate the overall distance as (7) 11.end |
4. Experiments and Analysis
The experiments were conducted using the terminal area dataset of Guangzhou Baiyun Airport. The data covered the period from 1 January to 15 October 2018, and 2019 in the Guangzhou terminal area. Following the screening, a total of 163 days with significant convective weather influence processes were identified. The experiment uses the Python programming language, and the computer is configured with Windows 10 system, 16-core i7 CPU, and 32 GB RAM.
4.1. Evaluation Index
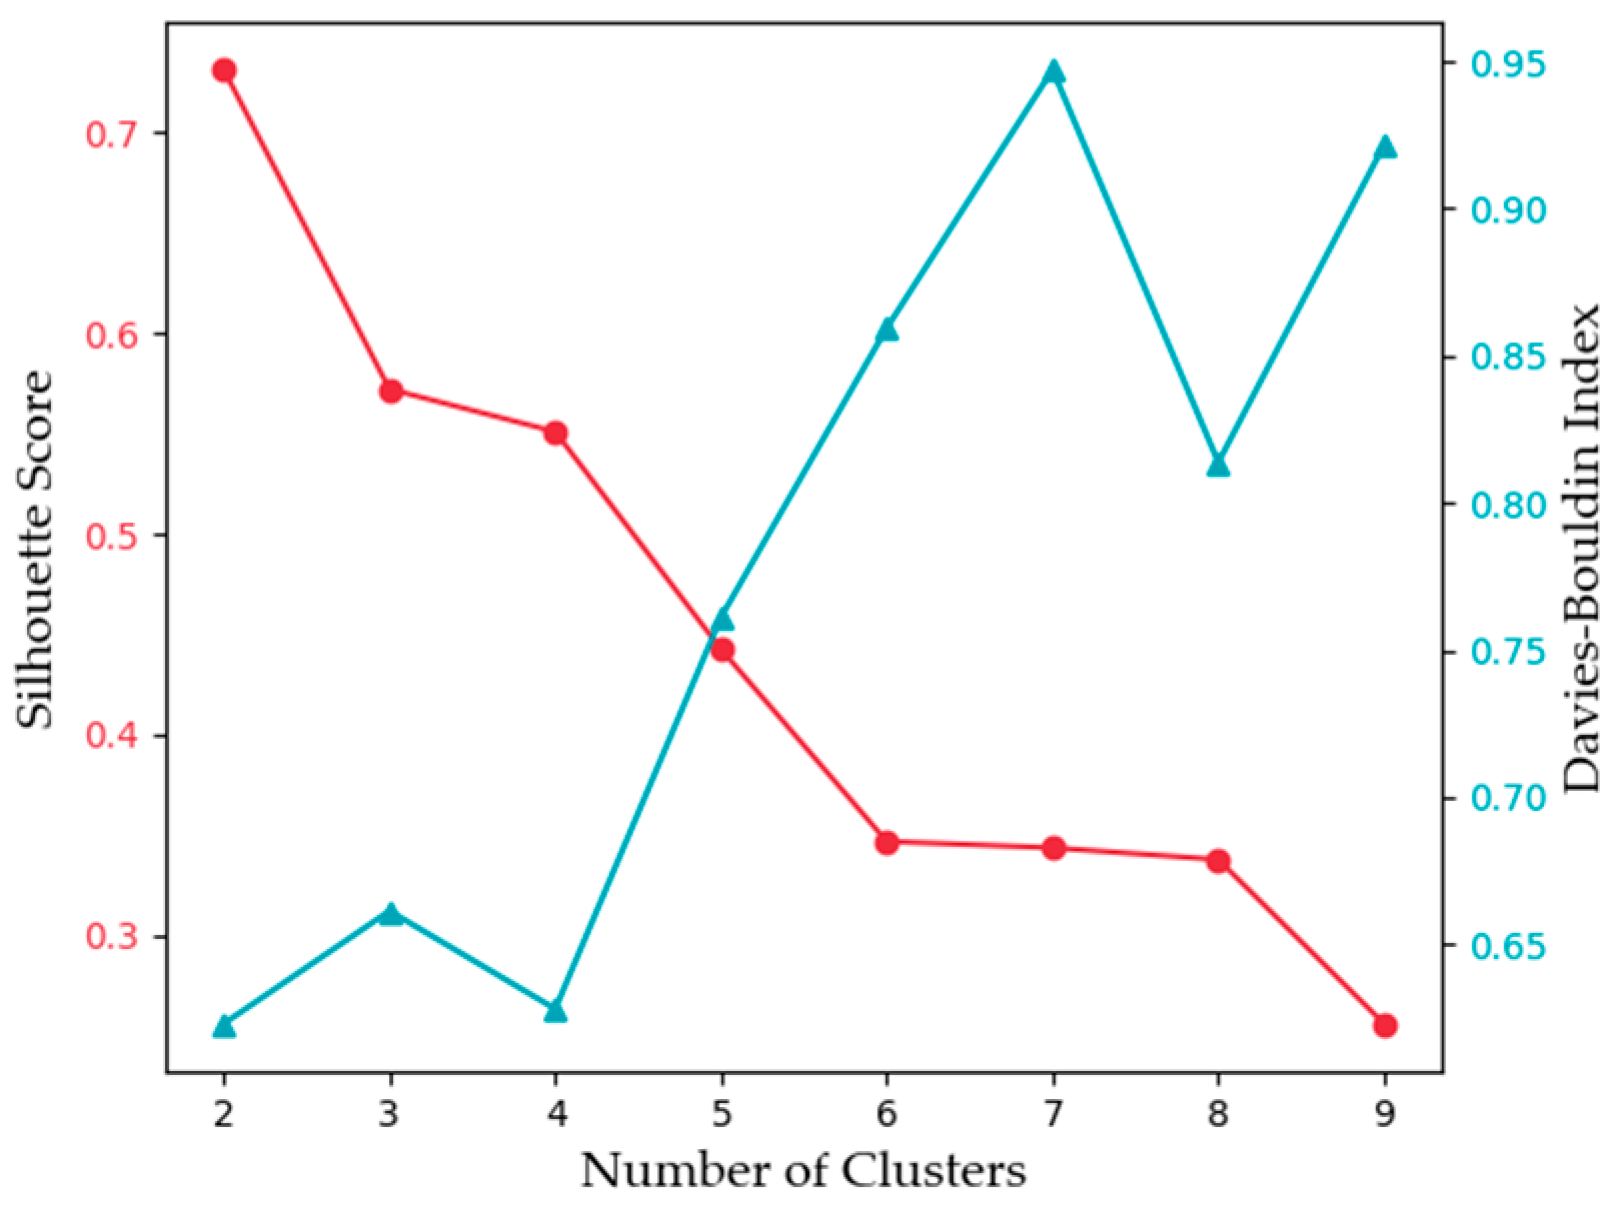
The final setting of the number of clusters is guided by two widely used validity indices, the Silhouette Coefficient (SC) and the Davies–Bouldin Index (DBI), which quantitatively measure the compactness and separability of clusters [24], and they are defined as follows:
In Equation (8), is the average distance between sample and other sample points in the same cluster, is the average distance between sample , and all the sample point in the nearest cluster, is the silhouette coefficient of the sample , and is the total number of samples. is the average silhouette coefficient of all sample points, which is called the silhouette coefficient of clustering result: the larger the better. In Equation (9), is the average distance between the samples in cluster and the center of the cluster. The smaller the , the smaller the distance within the cluster, and the larger the distance between the clusters.
4.2. Clustering Results
Regarding the input parameters of the FCM algorithm, we set them as follows: degree of fuzzy , error tolerance , maximum number of iterations . The clustering results were evaluated using the SC, as shown in Figure 6, and the coefficient was highest when the number of clusters was set to 2.
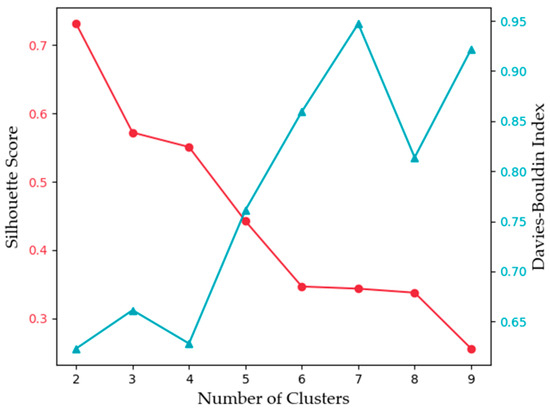
Figure 6.
Evaluation of clustering results.
The study initially focuses on analyzing the two types of weather scenes with the highest average silhouette coefficients. It was found that one category included strong convective weather scenes and the other category included weak convective weather scenes. Although the separation of these two categories is more obvious, their practical application is limited by the small number of scenes. This limitation hinders the practical application of subsequent typical weather scene searches.
Based on the DBI for clustering assessment (from Figure 6), it is evident that the DBI reaches its minimum value when k = 4. Additionally, the SC also attains a higher value at k = 4. Therefore, k = 4 is chosen as the number of clusters. Table 2 shows the number of samples in each category.

Table 2.
Clustering results for time-series weather scenes.
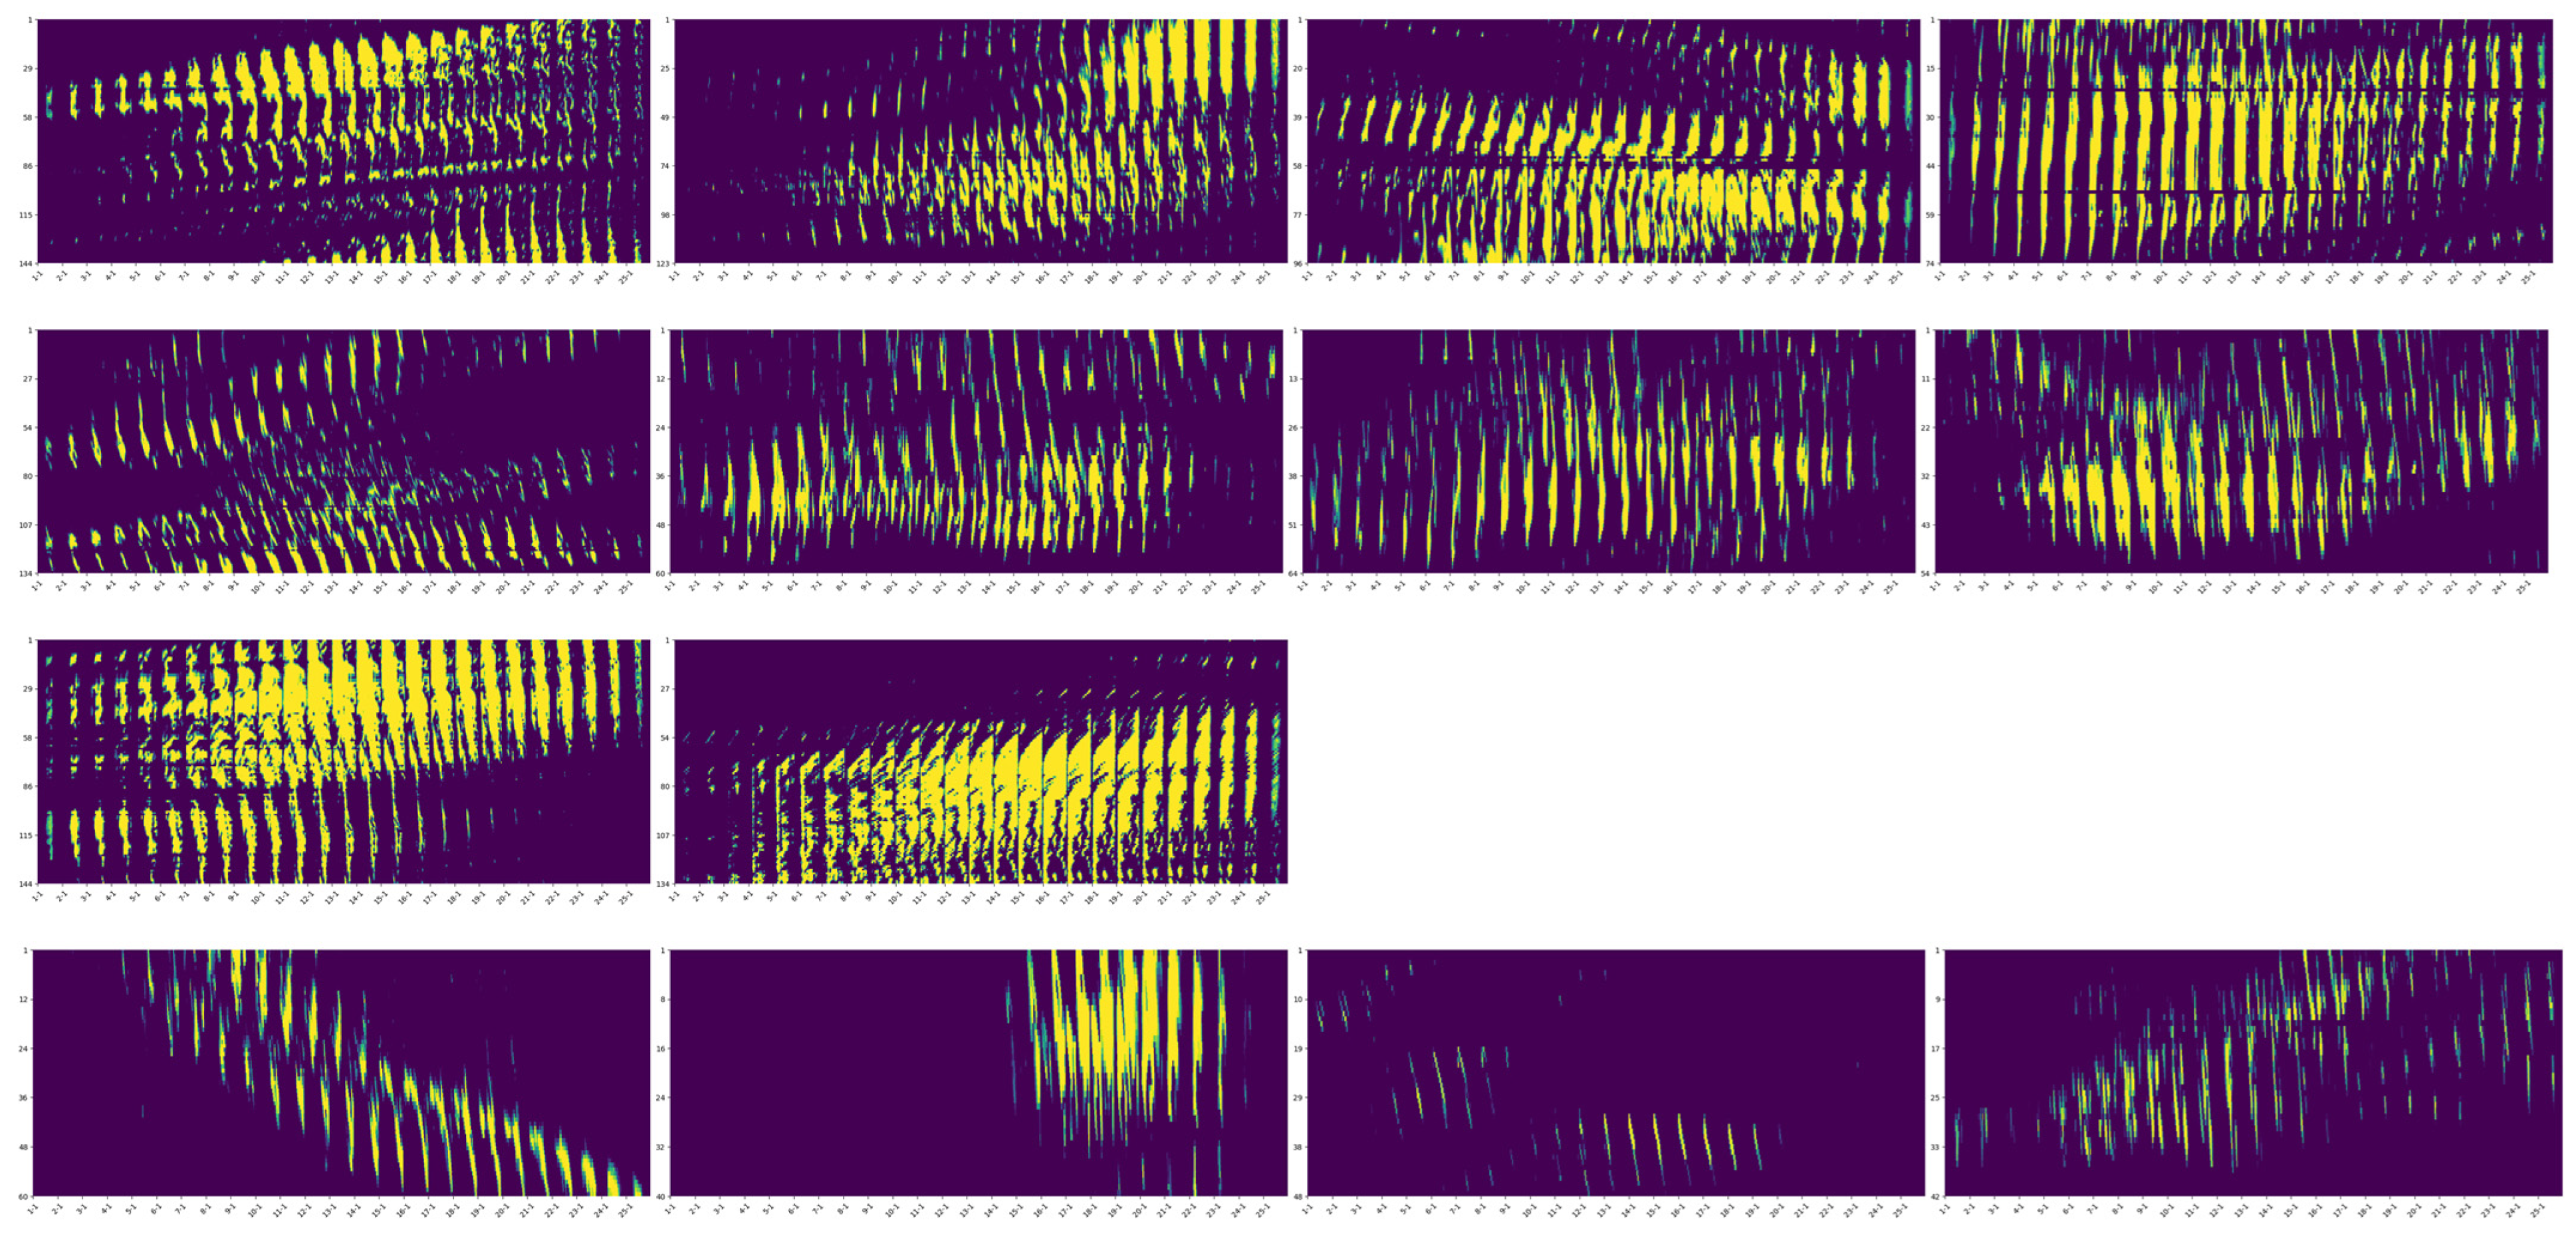
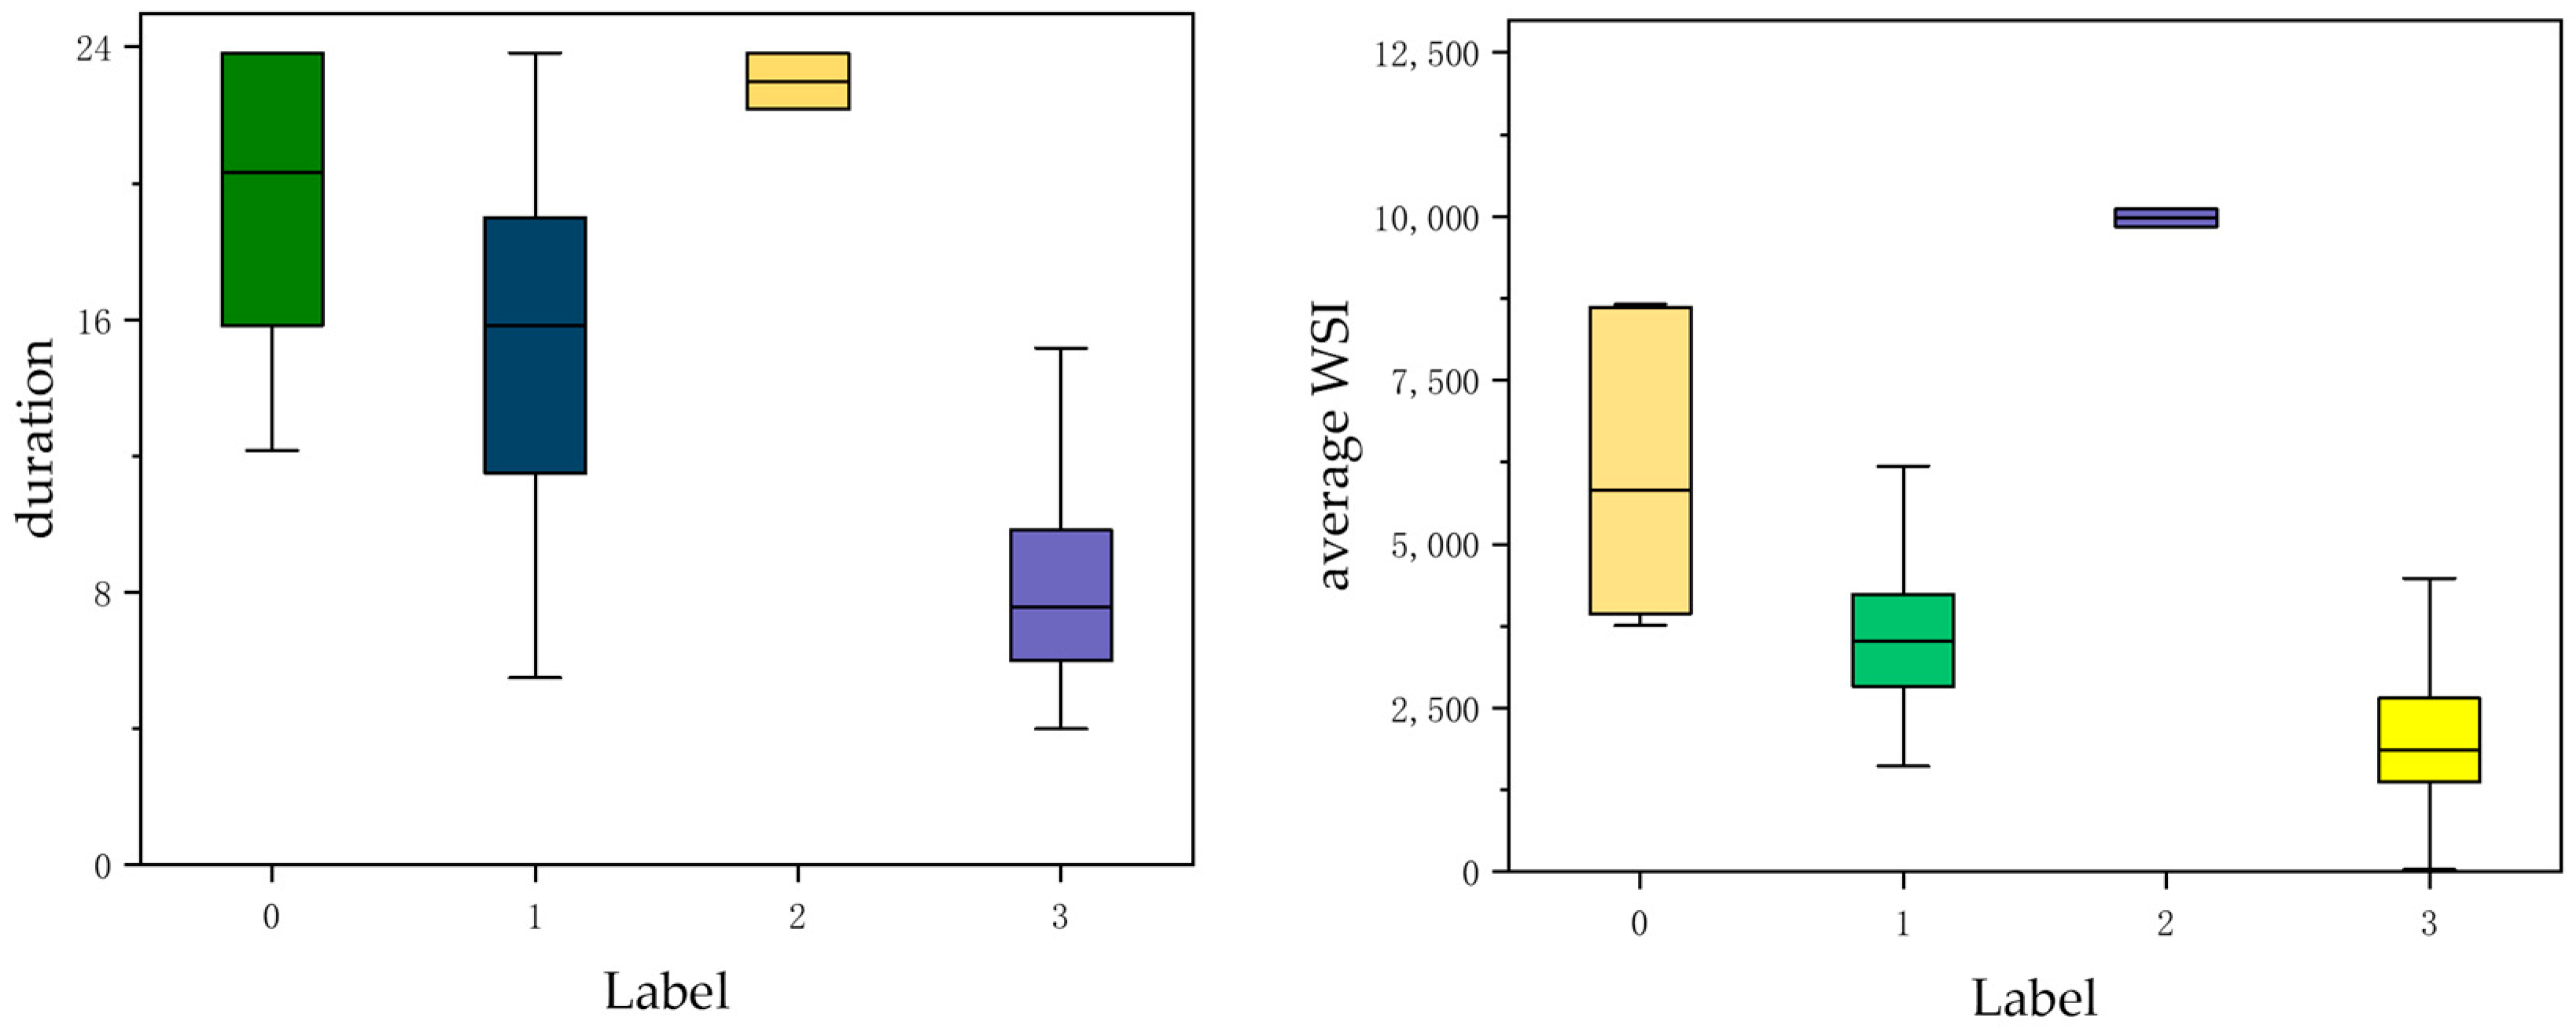
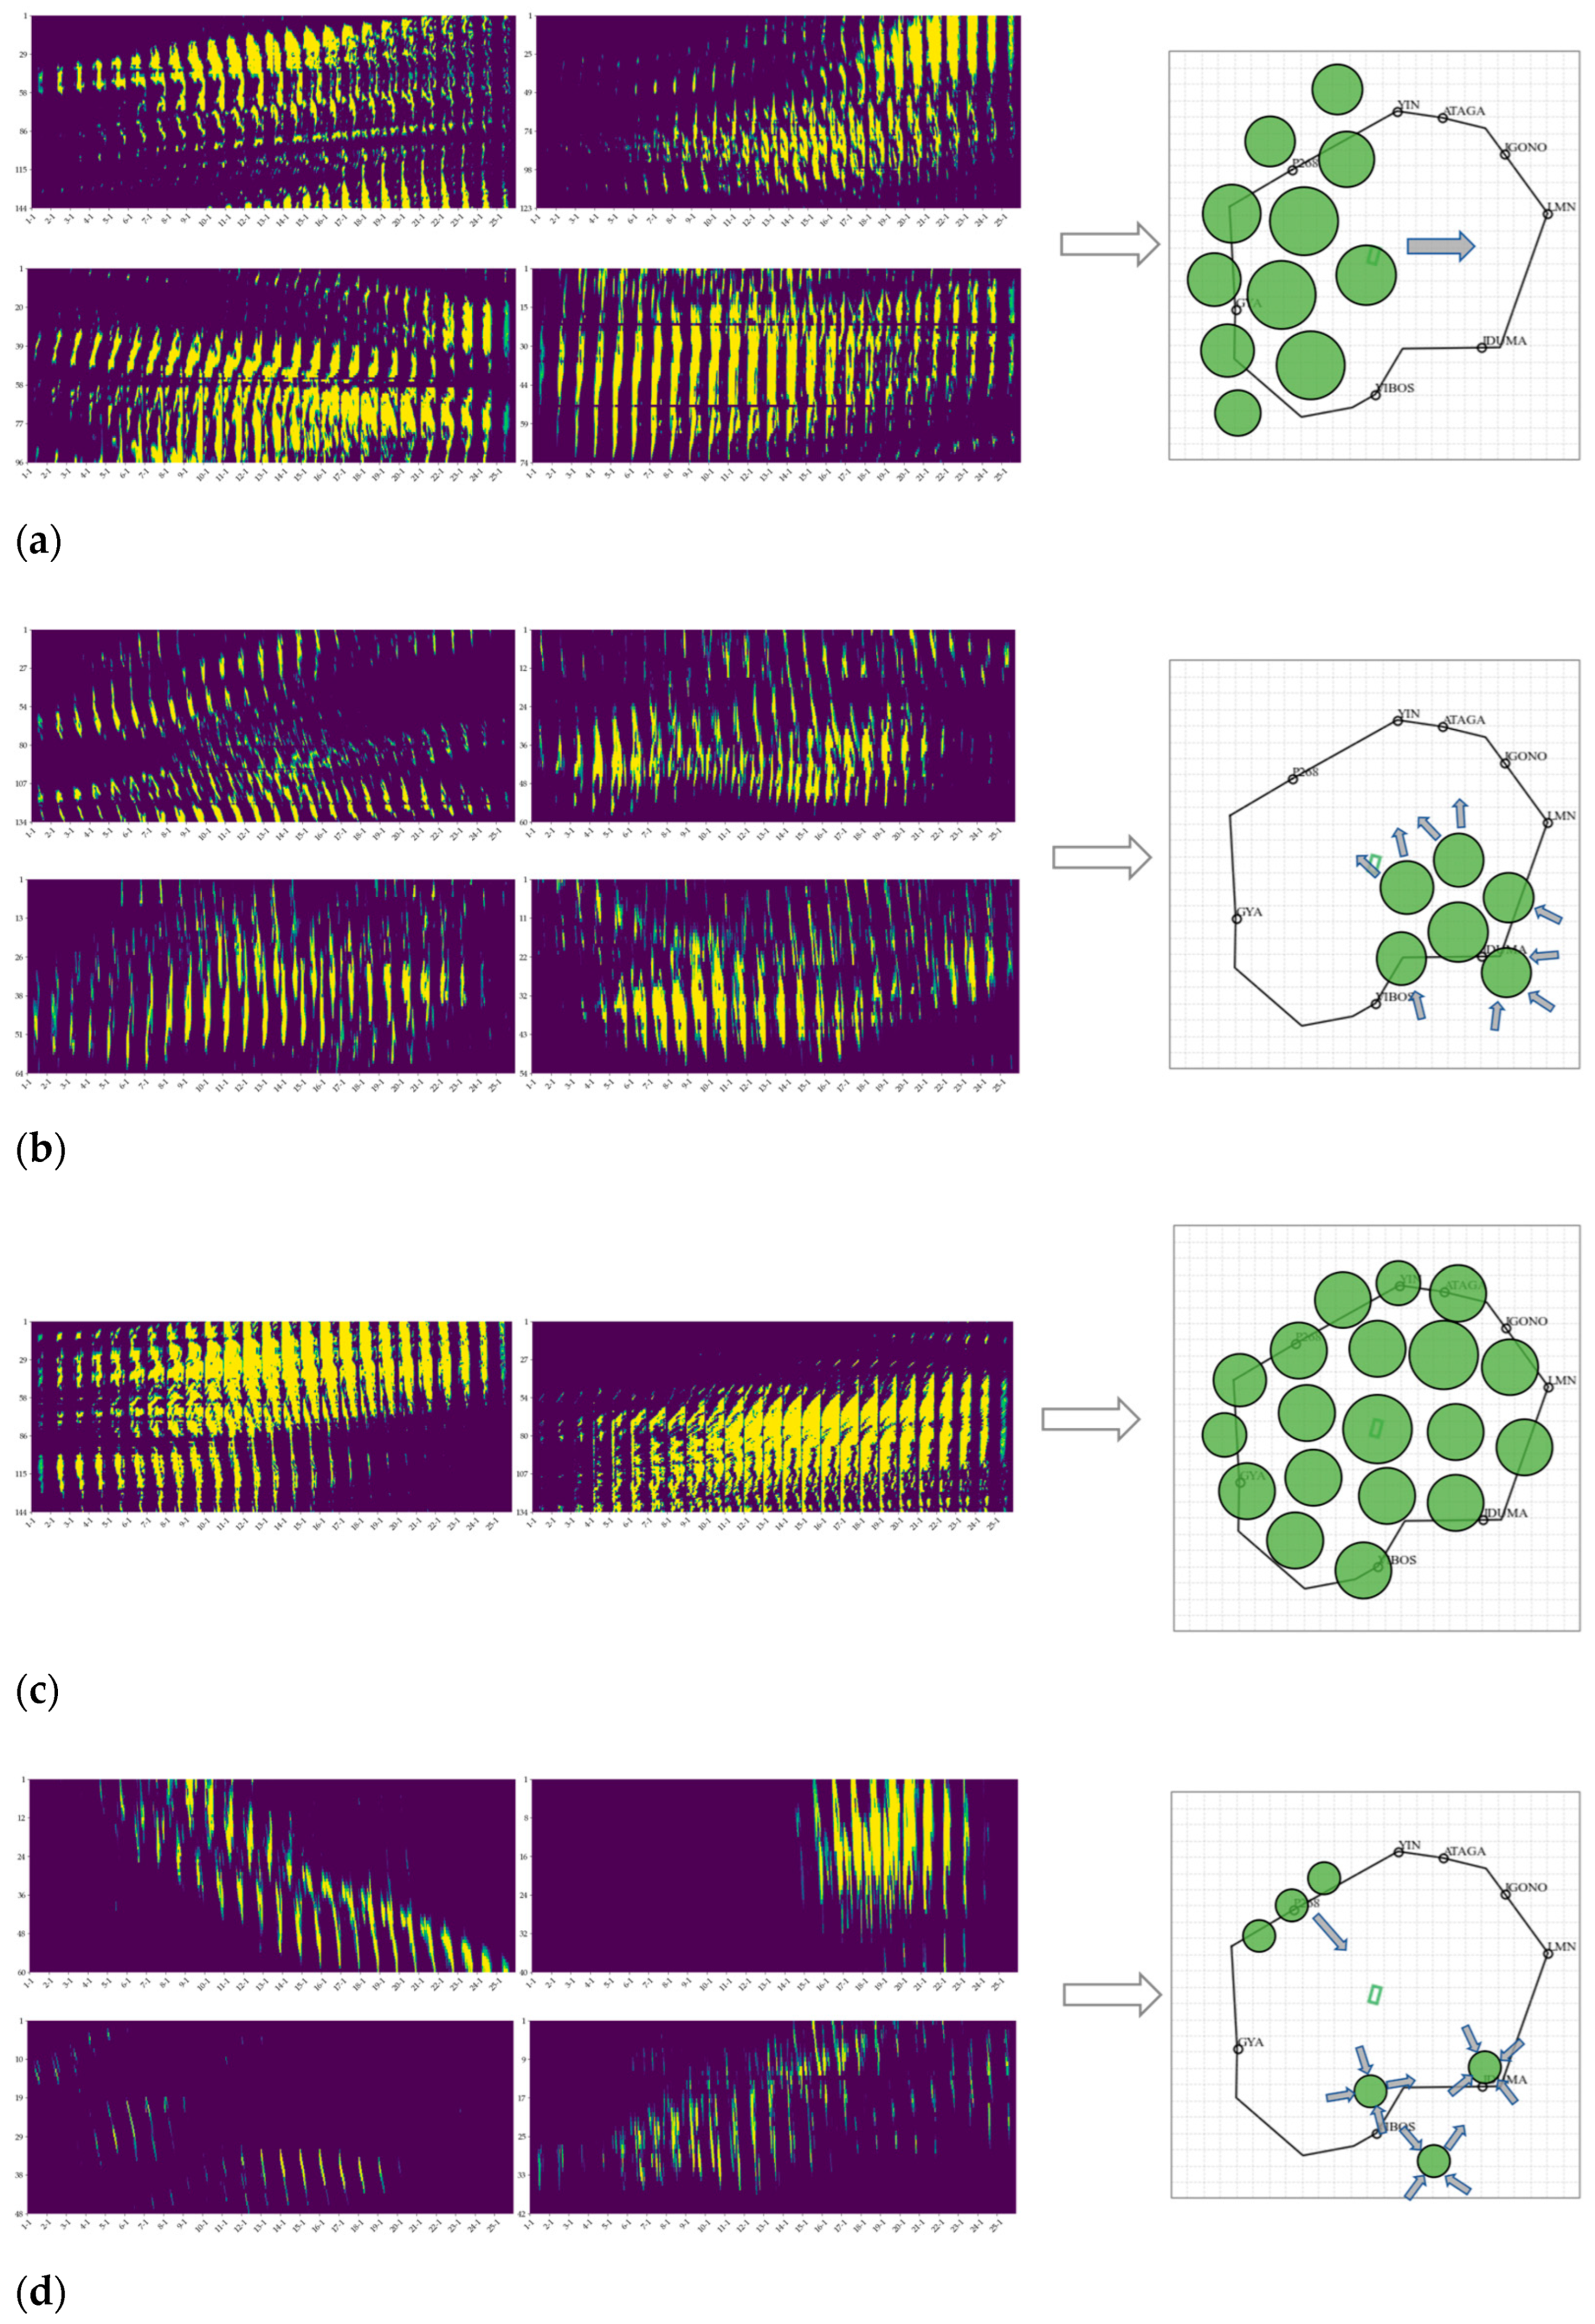
When the number of clusters is set to 4, the similar weather scene recognition results are illustrated schematically in Figure 7. Each type of scene exhibits distinct characteristics, which are analyzed by examining the duration and average WSI values of each type of weather scene, as shown in Figure 8.
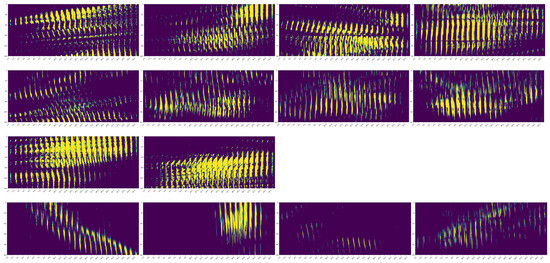
Figure 7.
Identification results of similar weather scenes.
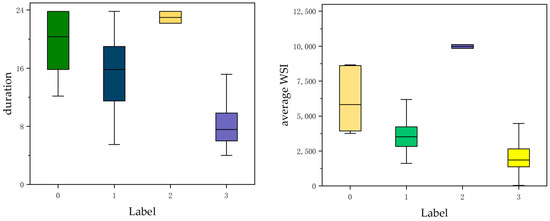
Figure 8.
Duration and average WSI values for different classes of scenes.
In the data presented in Figure 8, the median duration and average WSI values for the Class 0 scene are 19.9 and 6051.1. In Figure 9a, the Class 0 scene is mainly defined by the process of strong convective weather impacts, which involve the rapid formation of strong convective weather over a large area and the long duration of the impacts. This weather pattern moves slowly toward the airport, affecting the central airport and various waypoints before eventually dissipating.
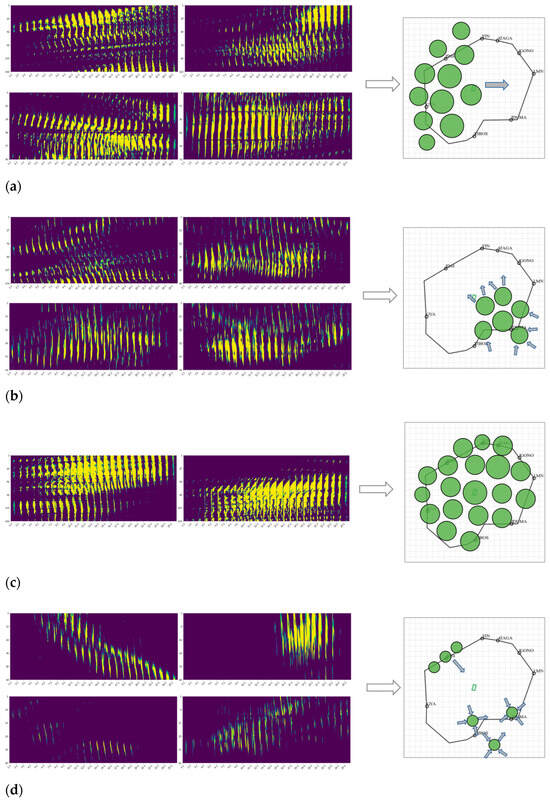
Figure 9.
Typical weather scenarios for (a) class 0; (b) class 1; (c) class 2; (d) class 3.
The data in Figure 8 shows that the median duration and mean WSI values of the Class 1 scene are 15.39 and 3659.94. From Figure 9b, it is evident that the Class 1 scene represents a moderate convective weather impact process. It shares similarities with the movement patterns of Class 0 scenes, but its stronger convective weather is shorter in duration, slower to form, and dissipates more quickly. This has a greater impact on the terminal area approach and departure waypoints.
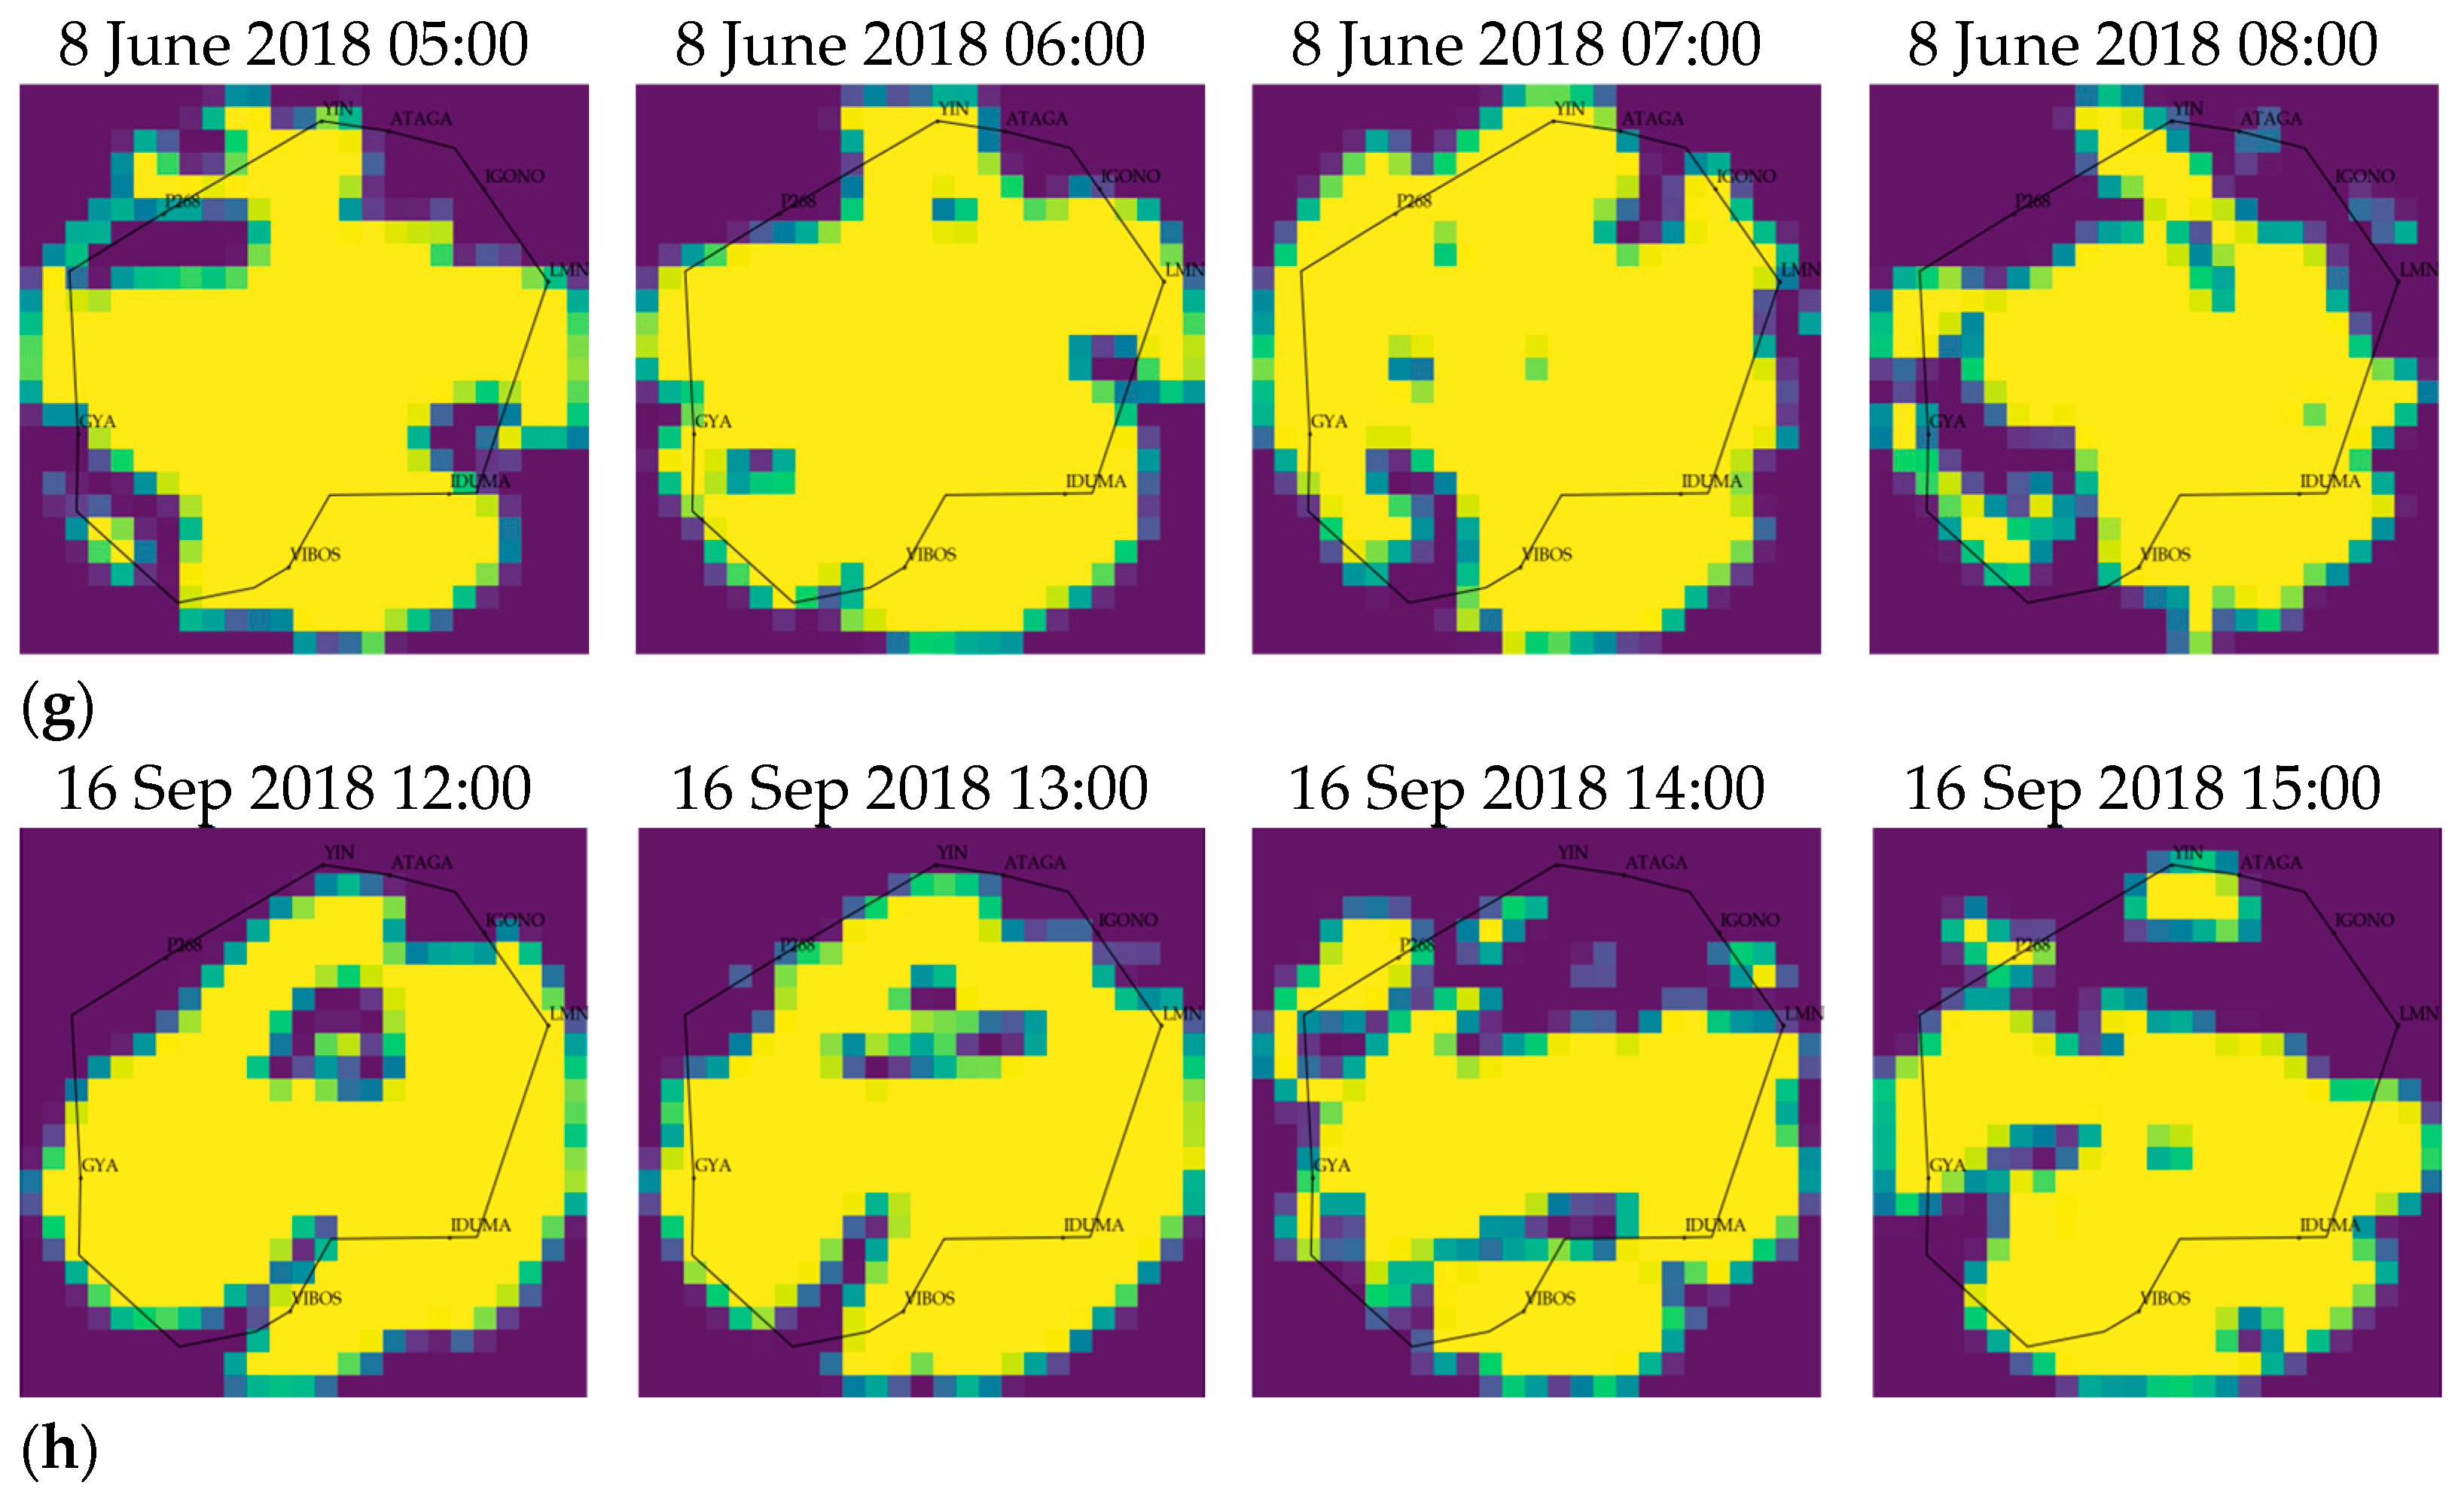
In Figure 8, the median duration and average WSI value of the Class 2 scene are 23 and 9977.20. Figure 9c illustrates that the impact process of convective weather in the Class 2 scene lasts almost the entire day, covering the entire terminal area. Upon review, it was found that the typhoons ‘Ai Yuni’ on 8 June 2018, and ‘Mangosteen’ on 16 September 2019 caused severe meteorological impacts on the Guangzhou area.
The data in Figure 8 shows that the median duration and average WSI values of the Class 3 scene are 8.35 and 2203.32. From Figure 9d, it can be observed that the Class 3 scene corresponds to the influence process of mild convective weather. The sample size is 112 days, which aligns with the regional climate characteristics. Class 3 scenes are characterized by convective weather moving in a linear pattern or in a scattered distribution, forming and dissipating extremely fast.
4.3. Search for Weather Scenes for Identification
4.3.1. Parametric Analysis
After conducting a clustering analysis of similar weather scenes, we performed a similarity search to accurately analyze the impact trajectories of typical weather scenes. To do this, we used the proposed multiresolution spatiotemporal window metric. The similarity search algorithm has the following parameters: (1) maximum spatiotemporal window size and ; (2) spatiotemporal window size weight factor size and .
- (1)
- Spatiotemporal window size and
The parameters and have a direct impact on the accuracy of distance measurements in the multiresolution spatiotemporal window. This, in turn, affects the accuracy of query results. When and are larger, the spatial and temporal resolution for capturing motion patterns is increased, resulting in more accurate metric results. However, larger values for and also mean more scene distance calculations, which leads to higher computational costs. Therefore, it’s important to find a balance between accuracy and efficiency when selecting values for and . We can achieve this balance by illustrating the effect of changes in and on the pairwise scene-to-scene distance through a local sensitivity analysis. The relationship between the change of and the change in is calculated by the following equation when :
When all other factors remain constant, , . signifies the distance between scenes and measured at . A similar relationship can also apply to the change in when equals . Each sensitivity value is calculated by averaging the results of the 42 selected scene pairs in class 1. As depicted in Figure 10, with increased and , the change in becomes less pronounced, suggesting that a relatively small spatiotemporal window size is sufficient to capture scene variances. Additionally, the pairwise distance is more responsive to changes in spatial resolution size than to changes in temporal resolution size.

Figure 10.
Changes in sensitivity of at different and .
- (2)
- Spatiotemporal window size weight factor size and
The size weighting factors and control the contribution of for different window sizes, with larger windows typically having a smaller impact. To study the impact of the weighting factors and on the distance measurements, we examined how changes with increasing and . Each sensitivity value was calculated by averaging the results of 42 selected pairs of scenes, while keeping the other parameters constant when studying the weighting factor , and similarly for the weighting factor . The overall pairwise distance variation is illustrated in Figure 11, and notably, the overall pairwise distance does not converge when the study time weighting factor and n are set to zero. This study indicates that the selection of and should consider the spatiotemporal weighting factors and : specifically, if smaller and are used, larger and should be selected to capture more variance between the scenes and improve accuracy.

Figure 11.
Changes in sensitivity of with different and for different values of and .
Based on the analysis of the parameters, we observed that is more sensitive to the distance factor compared to . This is evident from the steeper curve of in the figure compared to that of . Therefore, we tend to set to a value larger than . In the upcoming study, we will choose , , and .
4.3.2. Typical Weather Scene Search
To accurately identify similar weather scenes in the terminal area and analyze the motion pattern changes of each scene, we select weather scenes with a four-hour time granularity as typical influence processes. We then use multiresolution spatiotemporal window distances and corresponding parameter settings to conduct search metrics in various scene libraries. This helps us identify, analyze, and evaluate the most similar weather scenes.
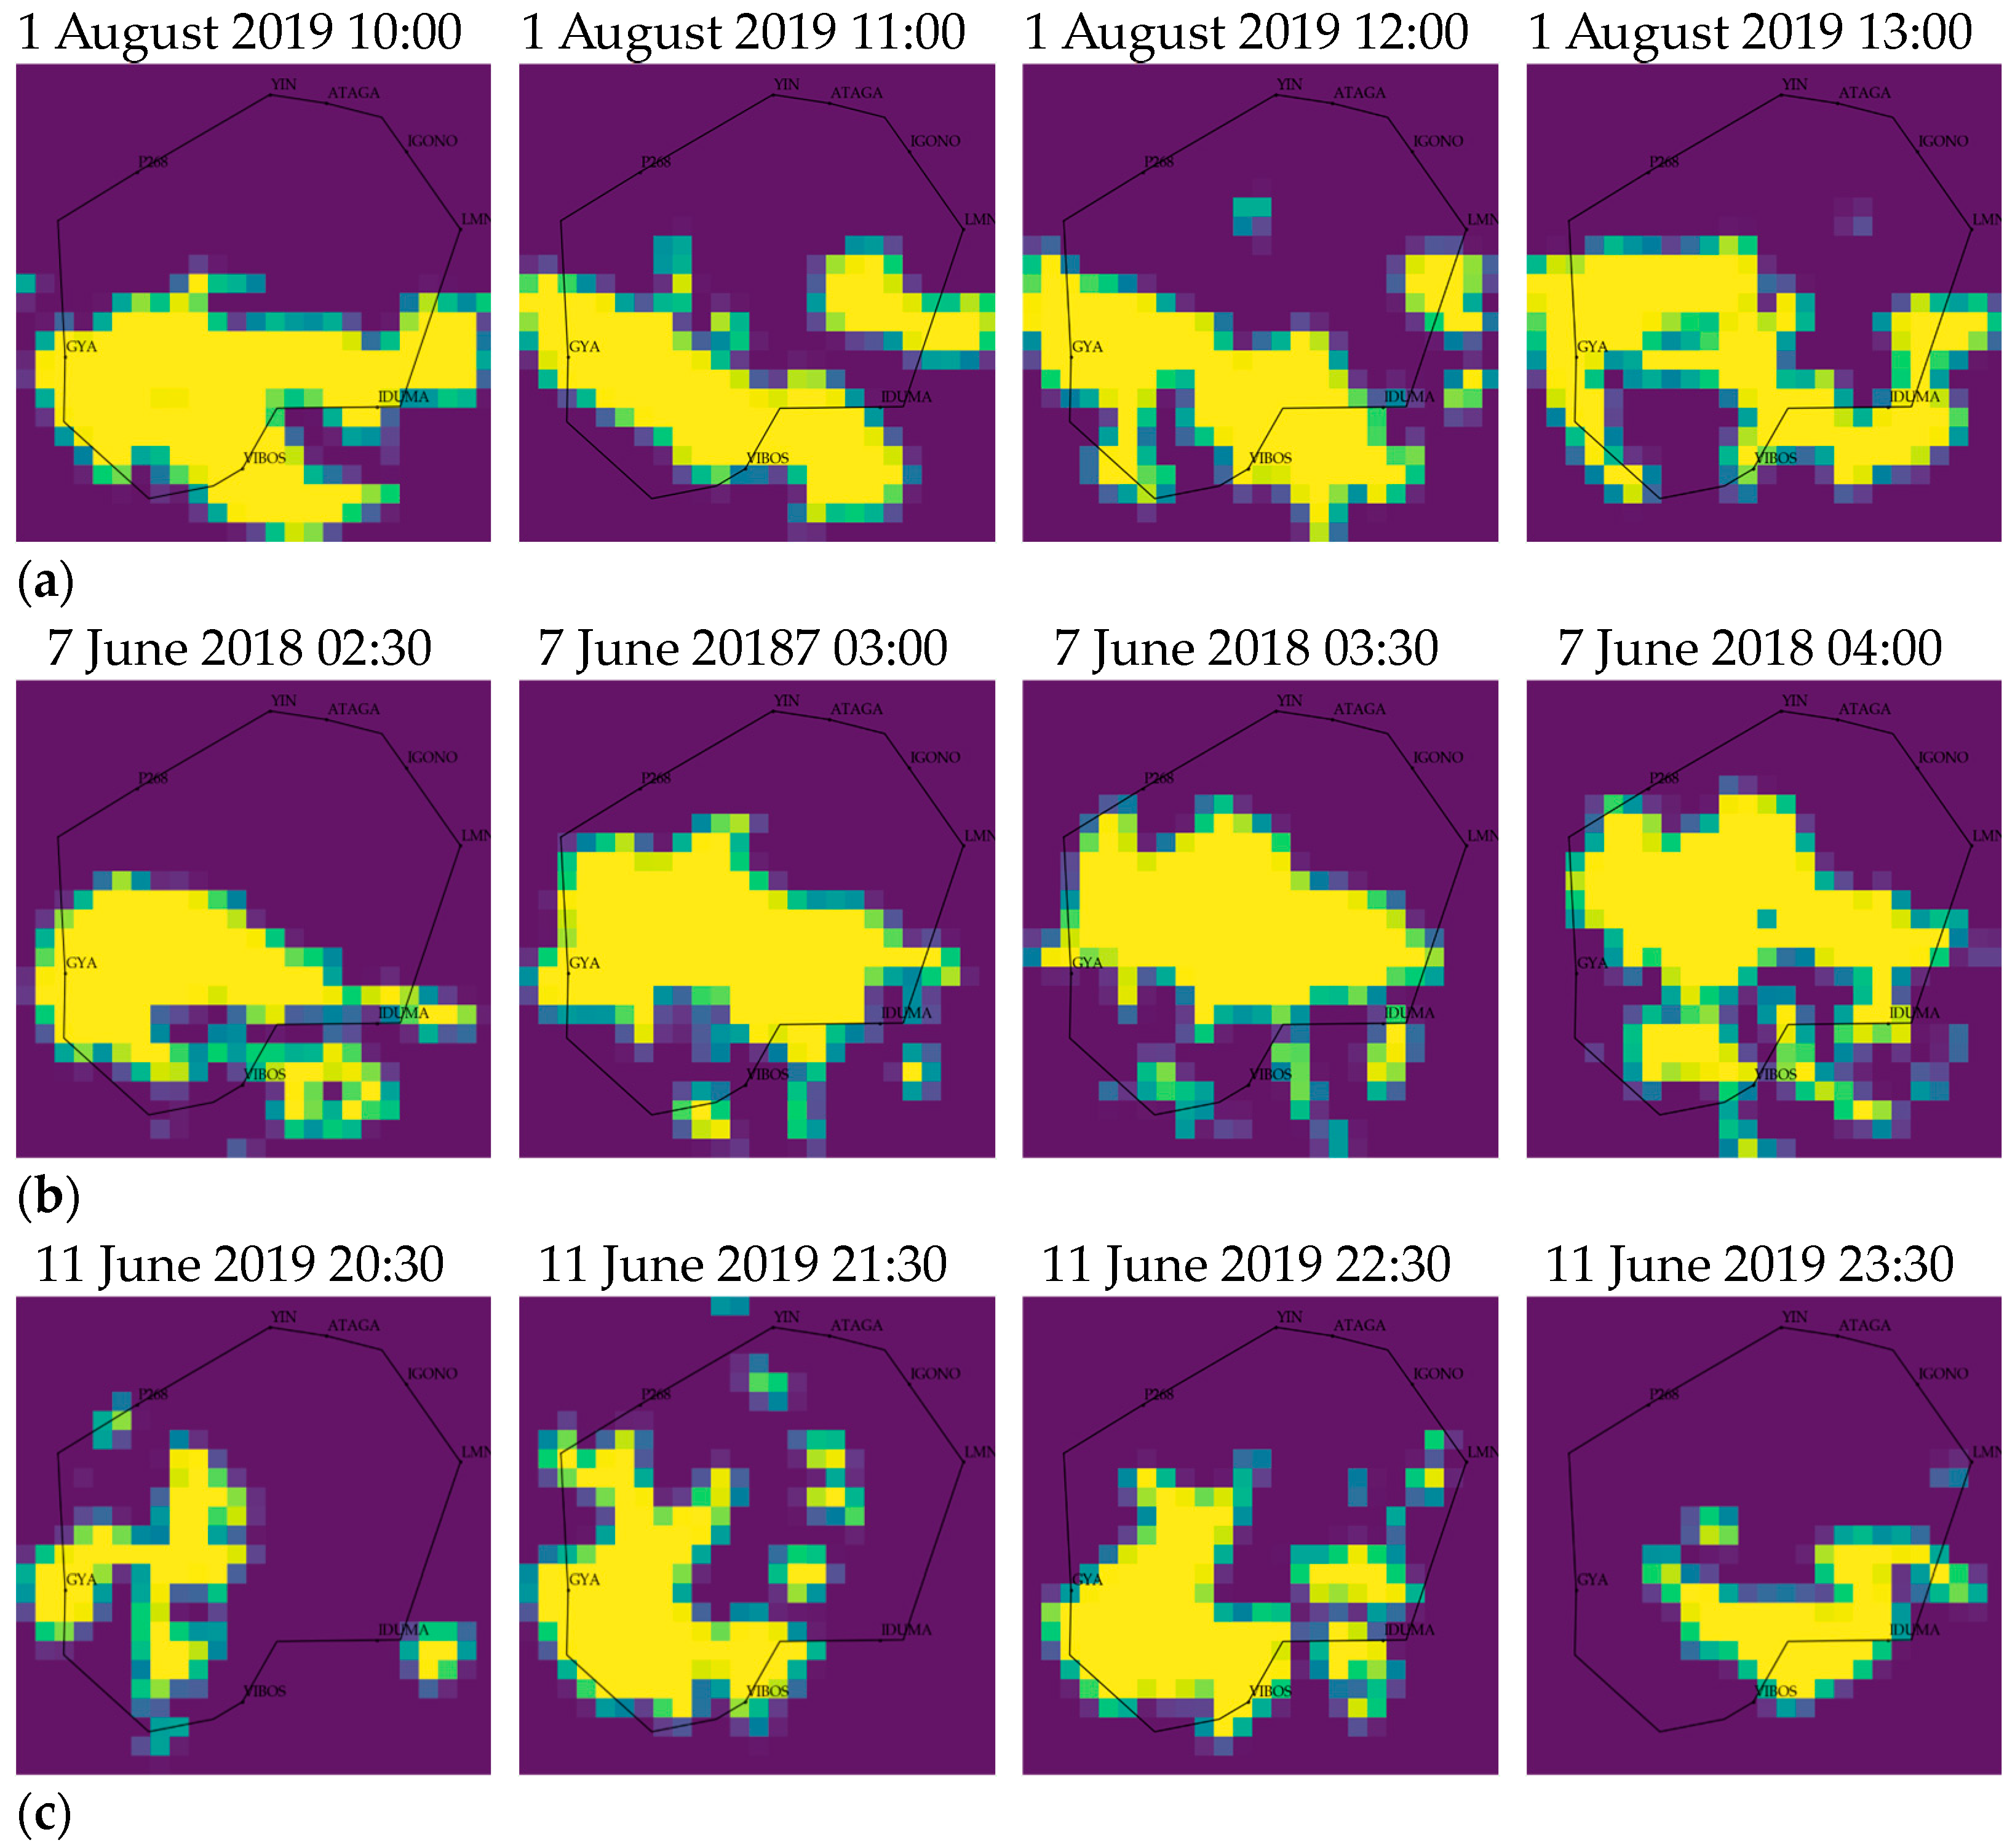
Figure 12a represents a typical weather scene impact process from class 0 scenes. This scene is characterized by convective weather impacts concentrated in the southwest part of the terminal area, which mainly affects the approach waypoint Gaoyao(GYA) and the stand-waypoint VIBOS. The convective weather does not dissipate quickly. By comparing different dates, similar weather impact processes, Figure 12b,c, were identified. Both (b) and (c) affect the waypoint GYA, but (c)has a relatively weaker intensity and the convective weather does not cover the center of the airport. In particular, (b) indicates an impact process lasting 2 h, demonstrating that the MRSTW metric identified two similar meteorological scenarios of different durations but with the same impact pattern during the search.
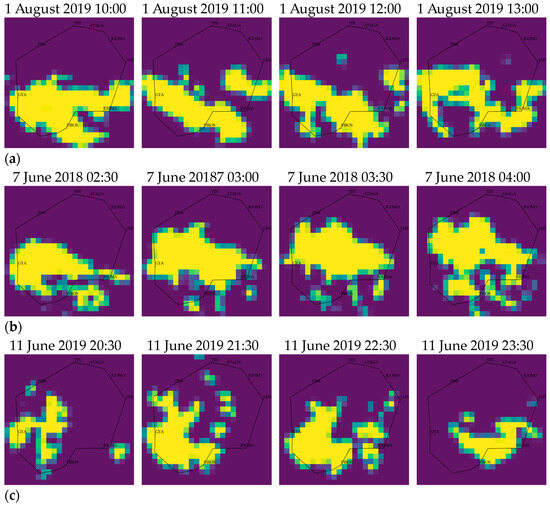
Figure 12.
Typical weather scenes impact processes for category 0: (a) 1 August 2019 10:00–14:00; (b) 7 June 2018 00:10–04:10; (c) 11 June 2019 20:00–24:00.
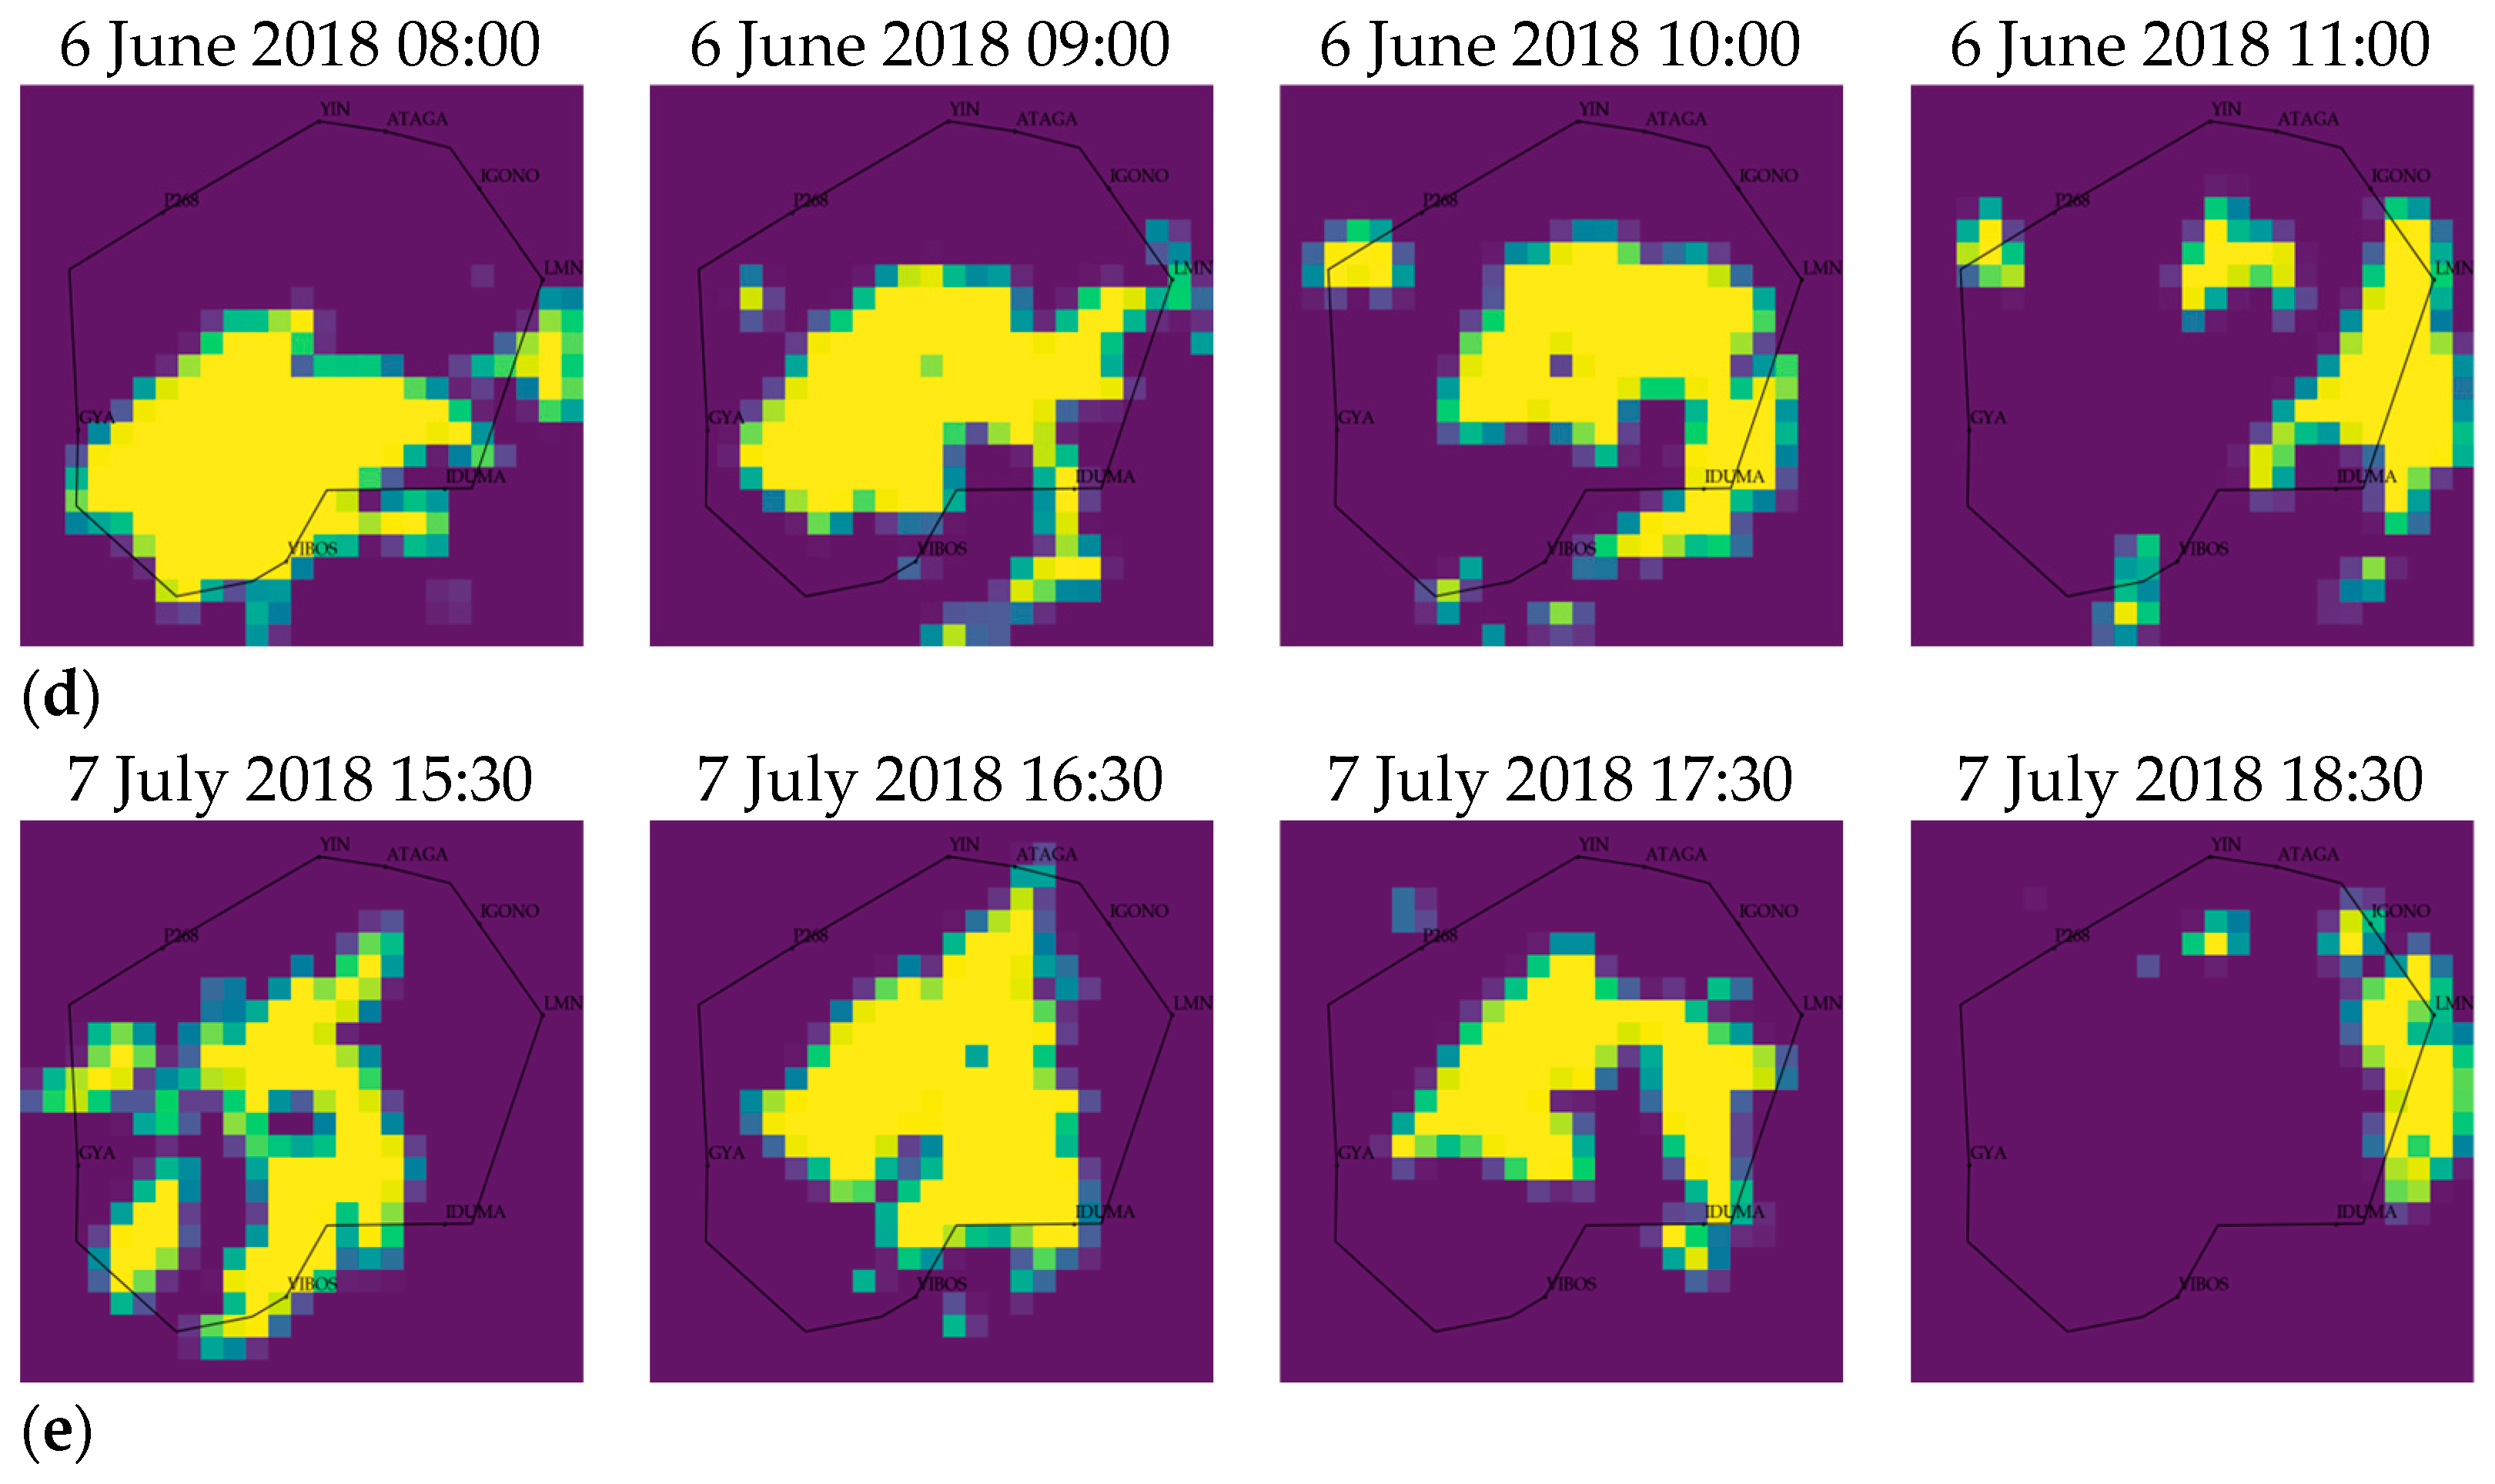
Figure 13d represents a typical weather scene impact process selected from class 1 scenes. This scene is characterized by convective weather converging in the western part of the terminal area in the initial stage, affecting the approach waypoint GYA, moving toward the eastern part of the terminal area with time, covering the center of the airport in the intermediate stage, and finally dissipating at the eastern boundary of the terminal area. The results of the search and identification show that both weather scenes, on 7 July 2018 from 15:20 to 19:20 and on 10 June 2019 from 17:30 to 21:30, exhibit the same movement pattern.
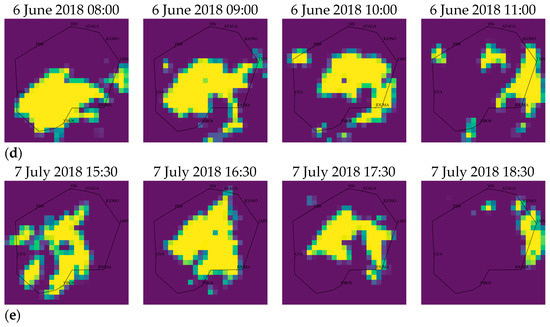

Figure 13.
Typical weather scenes impact processes for category 1: (d) 6 June 2018 08:00–12:00; (e) 7 July 2018 15:20–19:20; (f) 10 June 2019 17:30–21:30.
Figure 14g represents a typical weather scene impact process selected from class 2 scenes. Another extreme weather day, represented by 2 h, was identified. Both scenes indicate severe convective weather impact processes covering almost the entire terminal area without dissipating for a long time.
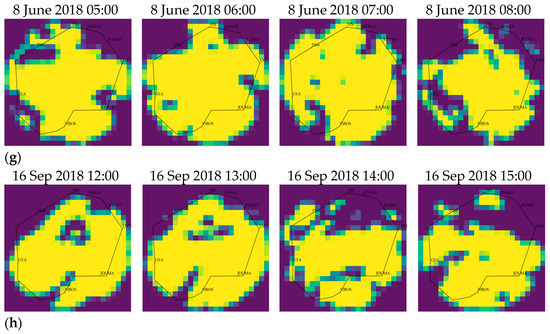
Figure 14.
Typical weather scenes impact processes for category 2: (g) 8 June 2018 05:00–09:00; (h) 16 September 2018 12:00–16:00.
4.4. Traffic Flow Analysis
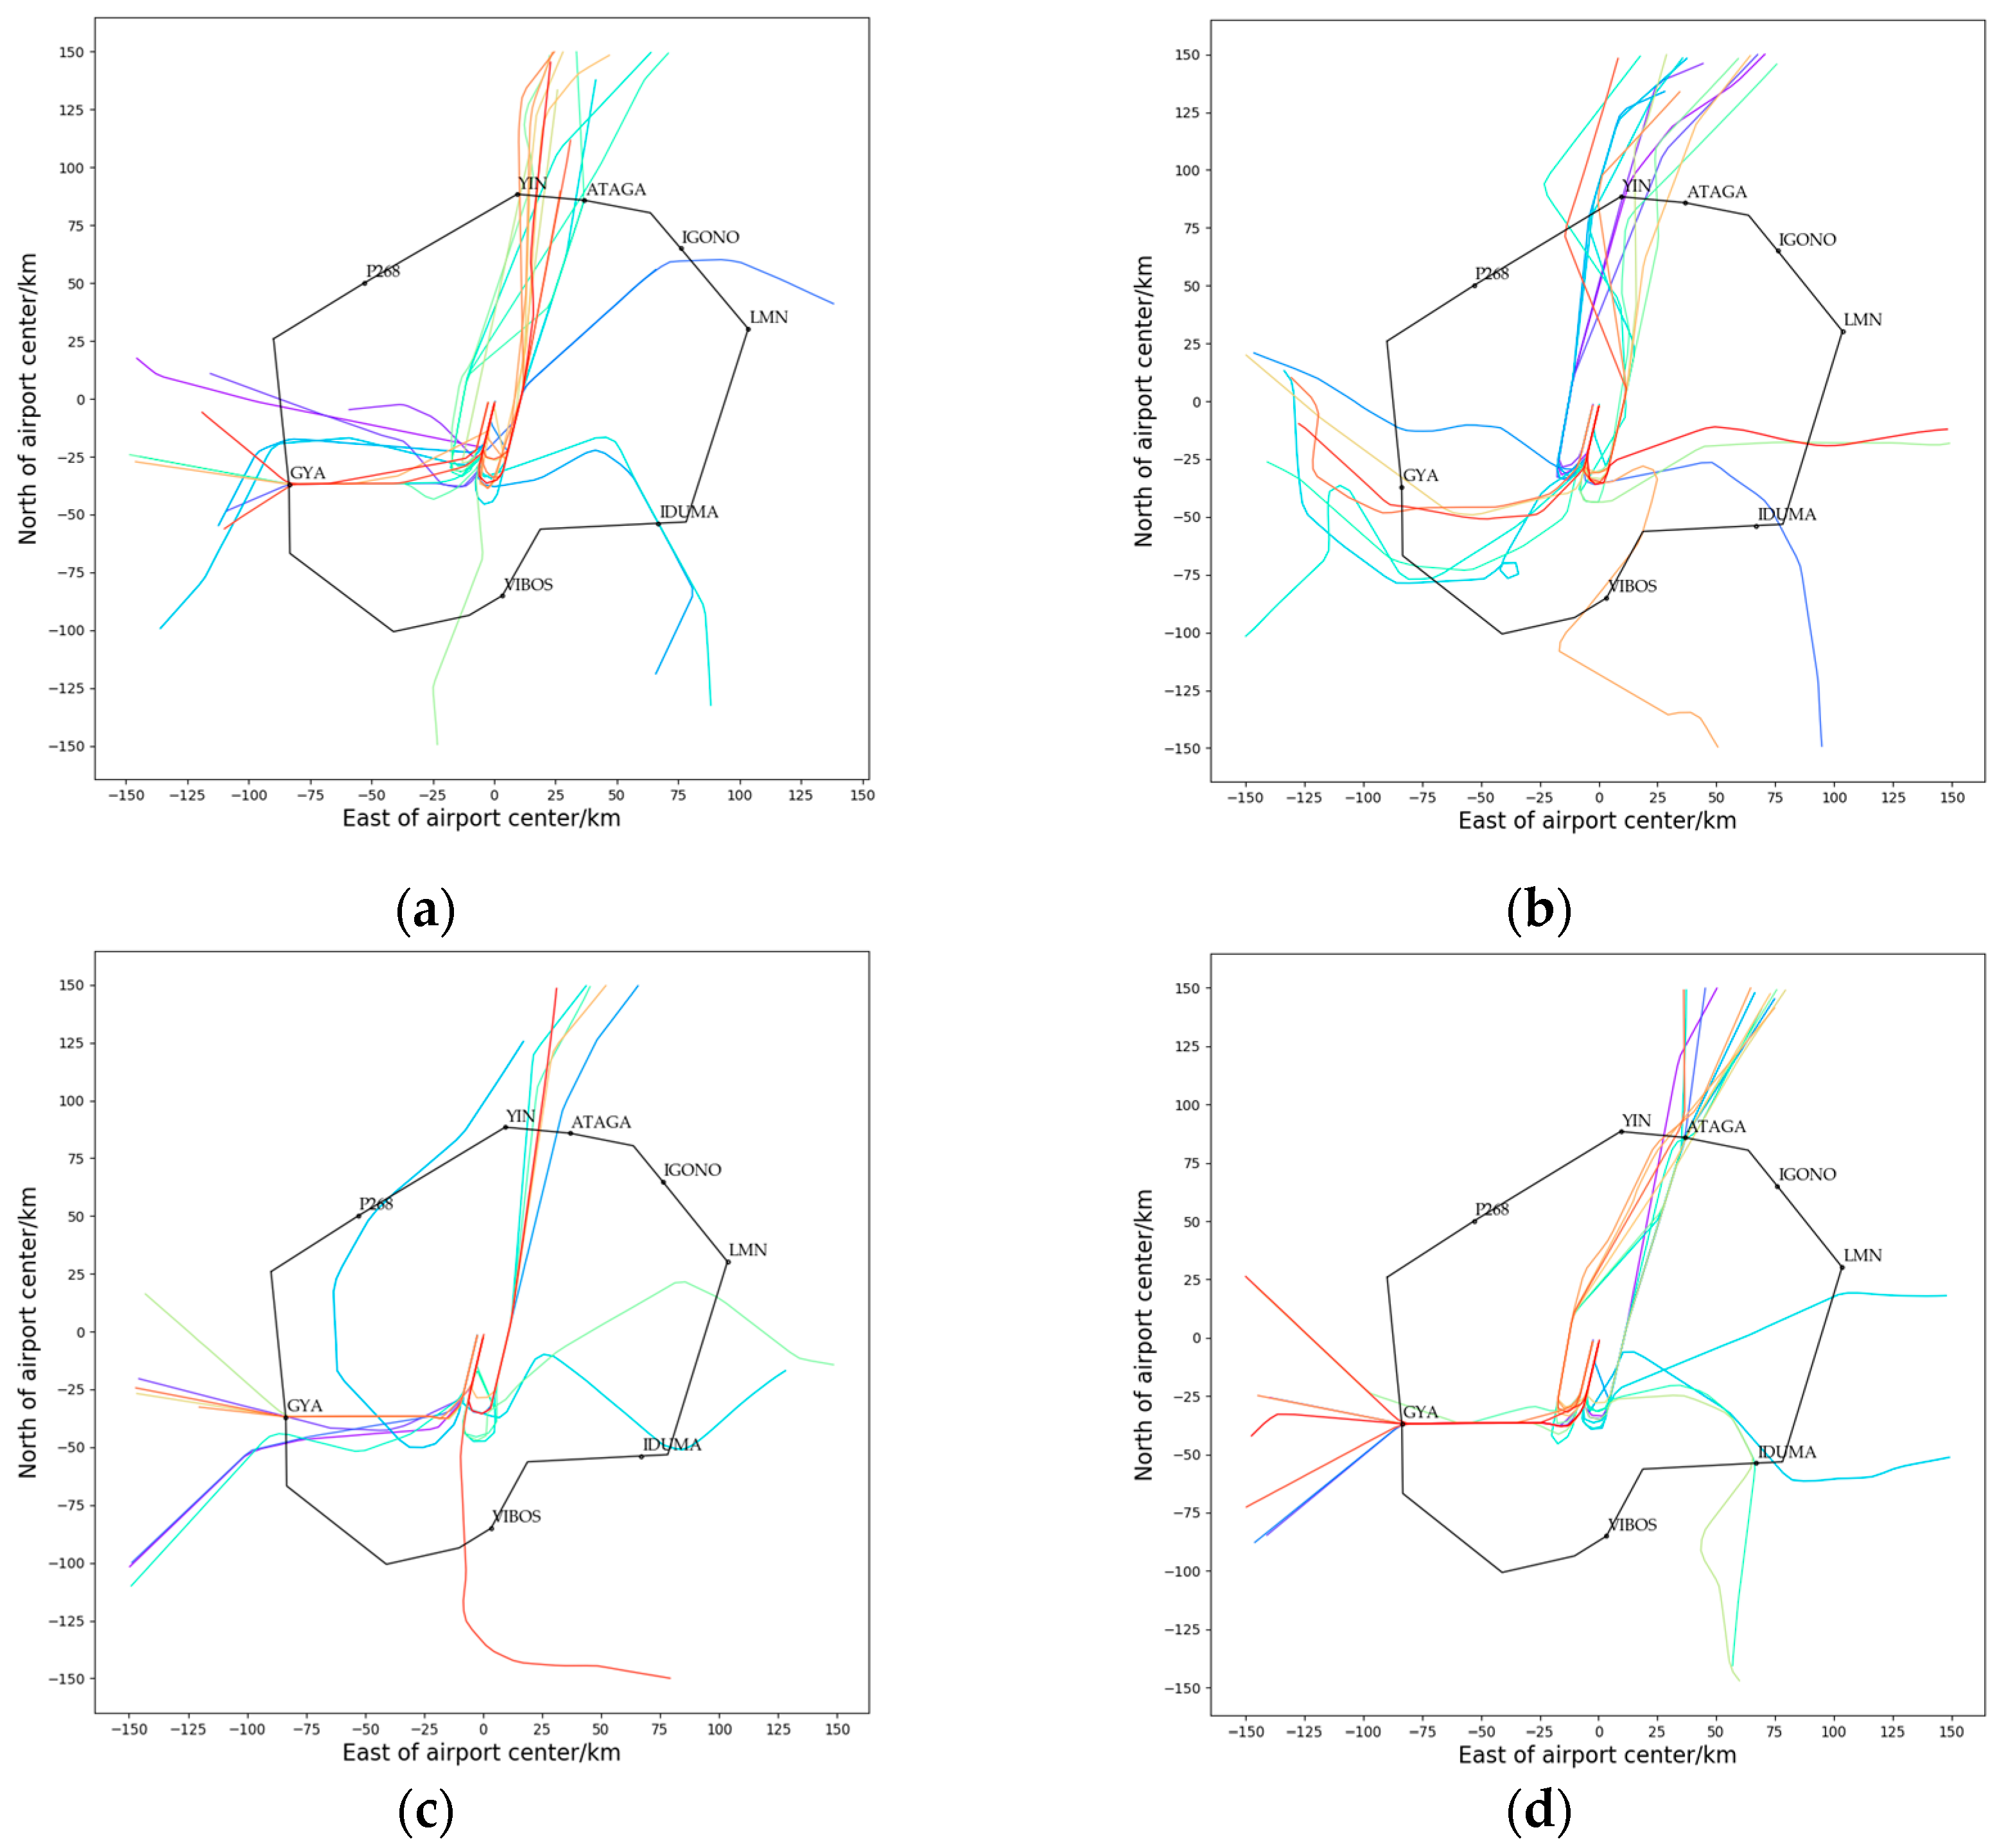
After completing the identification of similar weather scenes in the terminal area, in order to accurately analyze the movement pattern of convective weather, now combined with Automatic Dependent Surveillance-Broadcast (ADS-B) trajectory data, we study and analyze the operation of the approach traffic flow in the terminal area under the influence of weather scenes, and select the above typical weather scenes influencing the process of Figure 13d as the object of the study. In order to embody the influence of the weather movement process on the approach traffic flow, we will cut and divide the approach traffic flow according to the hour.
Figure 15 shows the terminal area approach traffic flow for the time period corresponding to the above-selected typical weather influence process Figure 13d. As can be seen from Figure 15a, the convective weather gradually formed during 8:00–9:00, and the traffic flow in the vicinity of the GYA could be divided into two clusters. The trajectory of one cluster conforms to the standard flight procedure, and the other cluster may be seriously affecting flight safety due to the GYA being under the influence of the strong convective weather. The Approach Control unit notified the regional control unit in advance of the weather information in the vicinity of GYA and therefore chose to fly around. Figure 15b clearly shows that as the weather moved toward the center of the airport, the aircraft all chose to avoid the area connecting GYA to the airport and flew roundabout or circuitous flights. By 10:00–12:00, the weather had moved to the east of the airport center and the aircraft near GYA resumed their flights according to the approach procedures. At this time, the meteorology mainly affected the Longmen(LMN) departure point area, and since Figure 15 represents the approach traffic flow trajectory in the terminal area, the affected flight trajectories could not be observed from the figure.
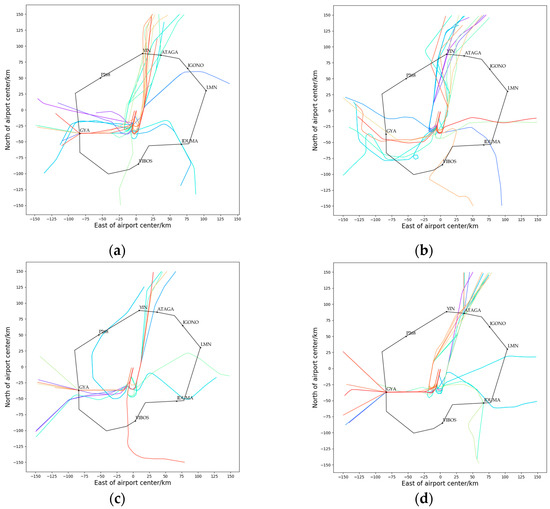
Figure 15.
6 June 2018 08:00–12:00 Terminal Area Approach Traffic Flow Trajectory: (a) 6 June 2018 08:00–09:00; (b) 6 June 2018 10:00–11:00; (c) 6 June 2018 10:00–11:00; (d) 6 June 2018 11:00–12:00.
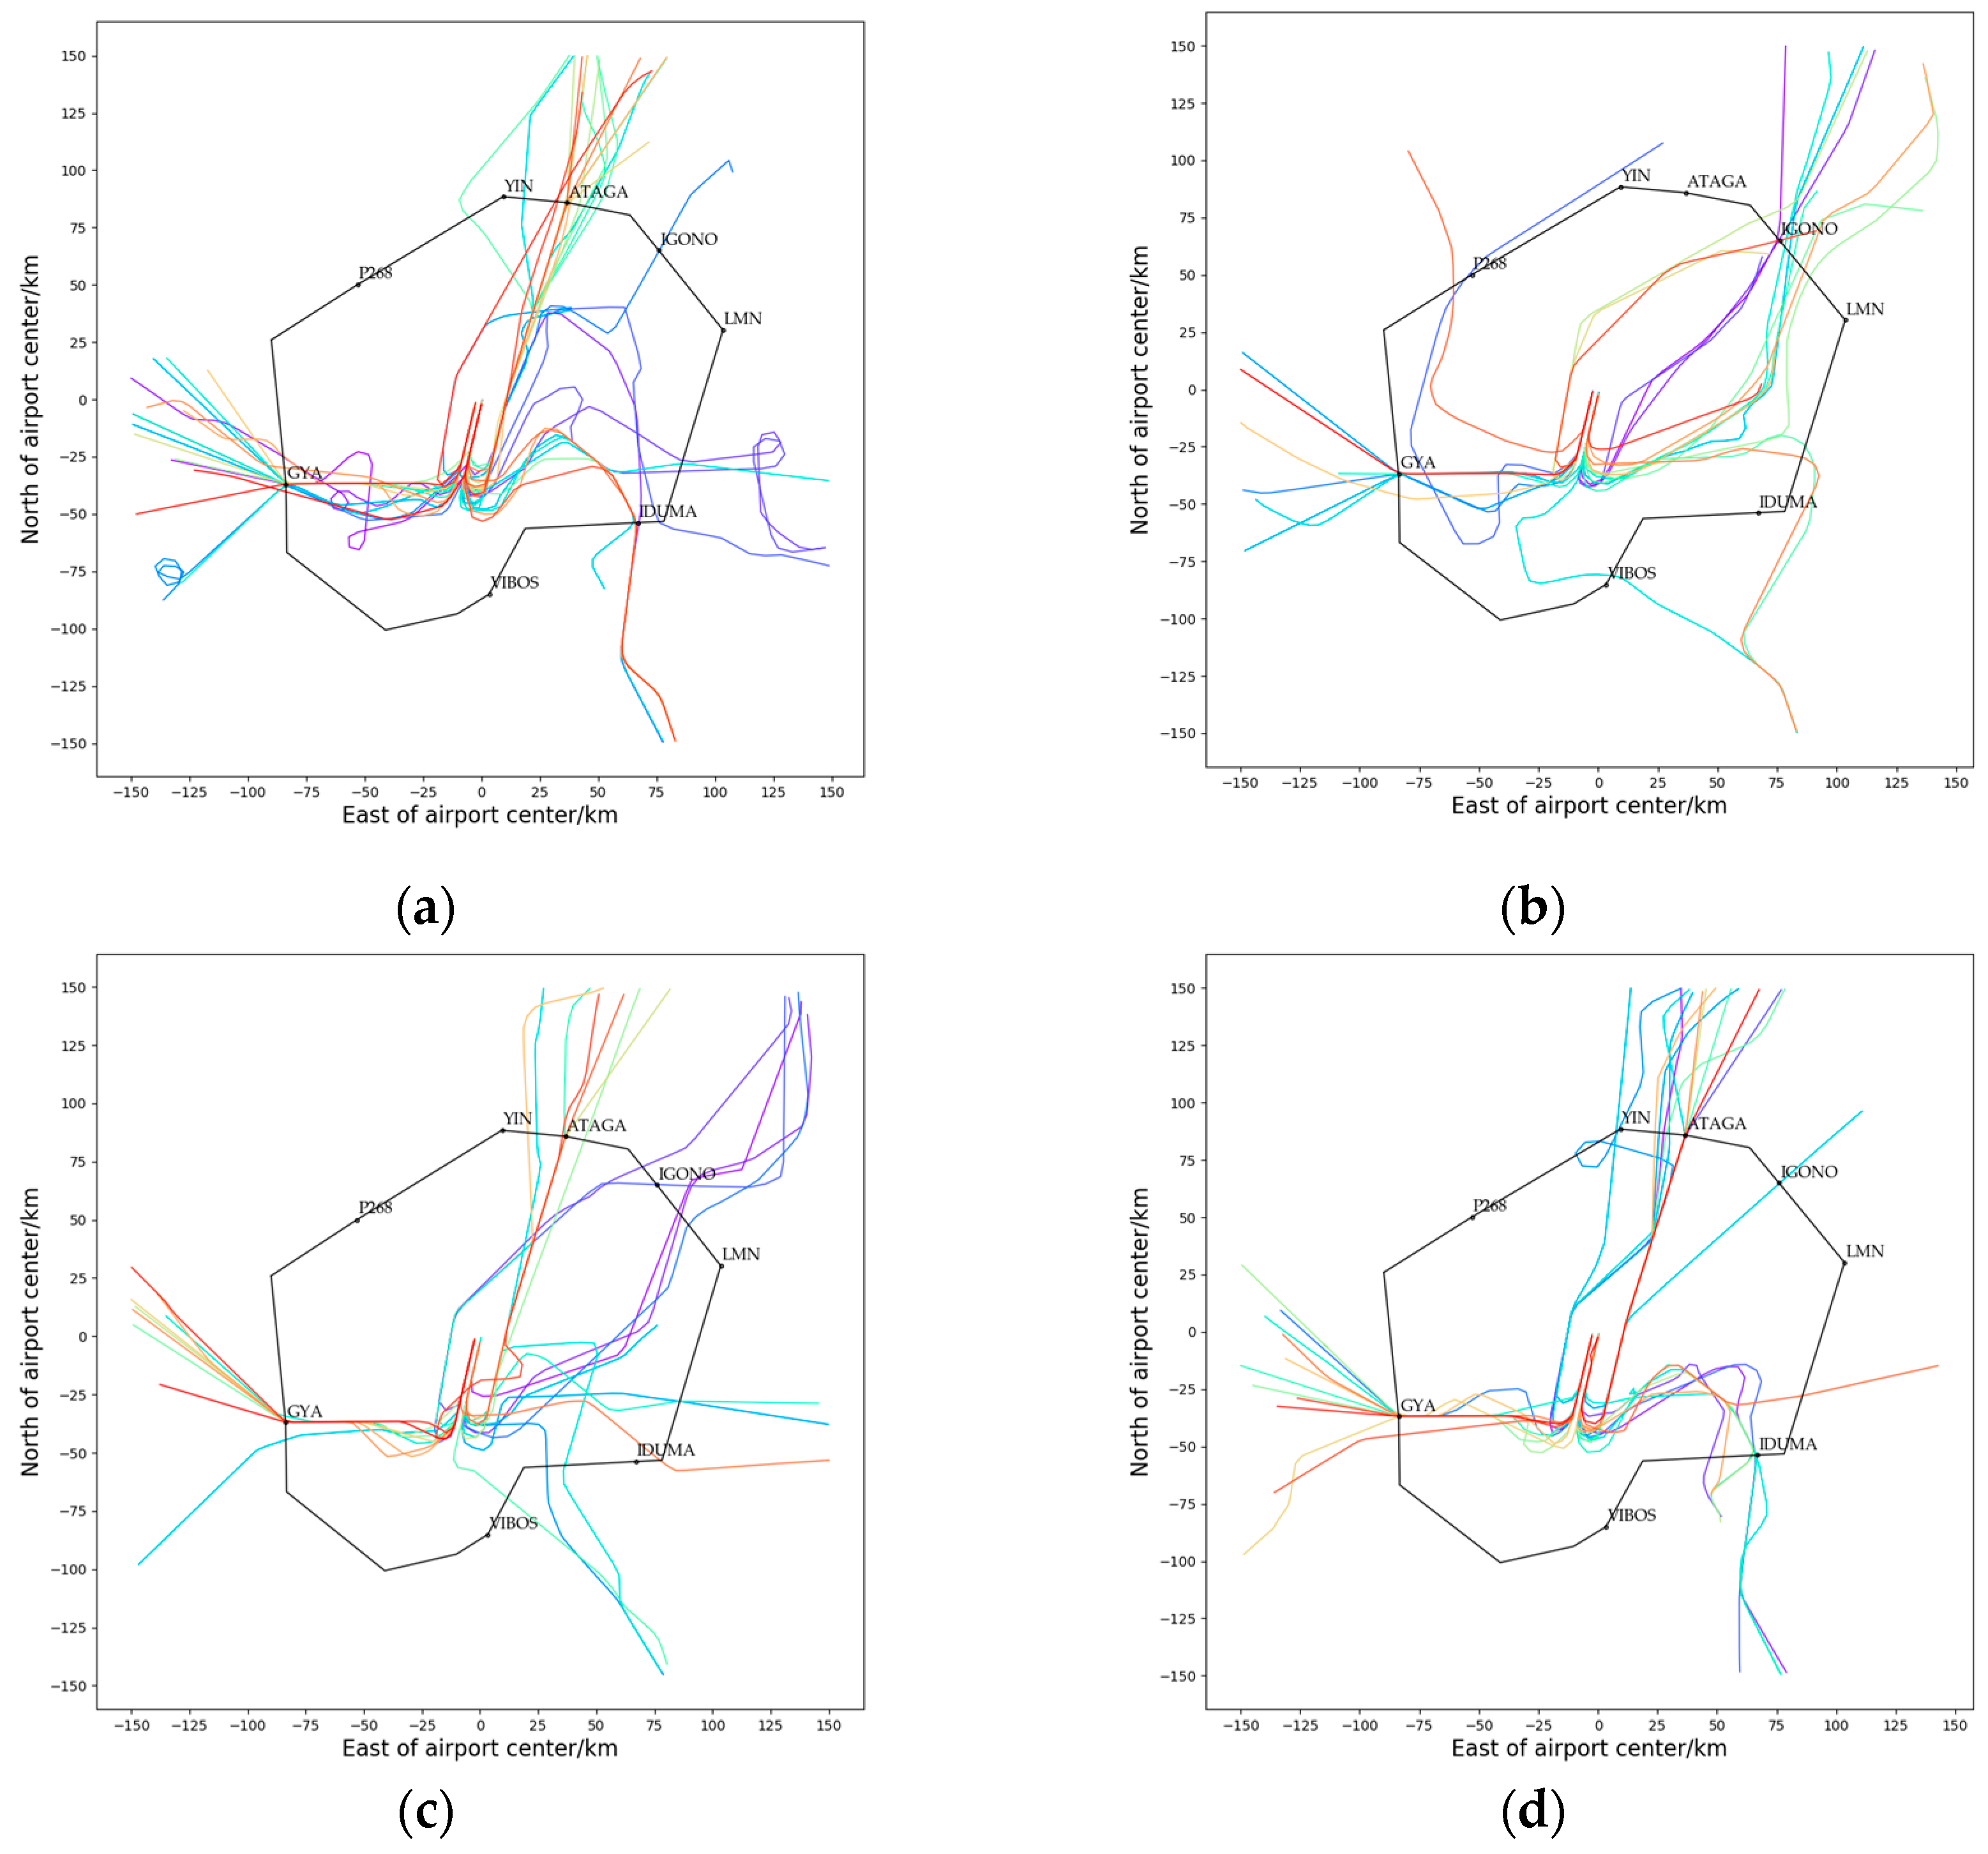
In order to compare the meteorological scenarios and their corresponding influencing processes, we also segmented the terminal area approach traffic flow by hour for the time period depicted in Figure 13e and presented the results in Figure 16 for easy reference. At 15:20–17:20, aircraft in the vicinity of the GYA remain at specific positions to perform waiting procedures or are guided to maintain safe intervals by extending flight distances to ensure a safe and orderly approach. At 17:20–19:20, as in Figure 13d, the aircraft in the vicinity of the GYA resumed flying according to the approach procedure. Meanwhile, from Figure 16c, it can be found that the aircraft near the approach point Xiaozhen(IGONO) were similarly affected by the weather as it moved from west to east, with some flights choosing to approach from the vicinity of the approach point ATAGA, and others circling around from below the meteorologically affected area.
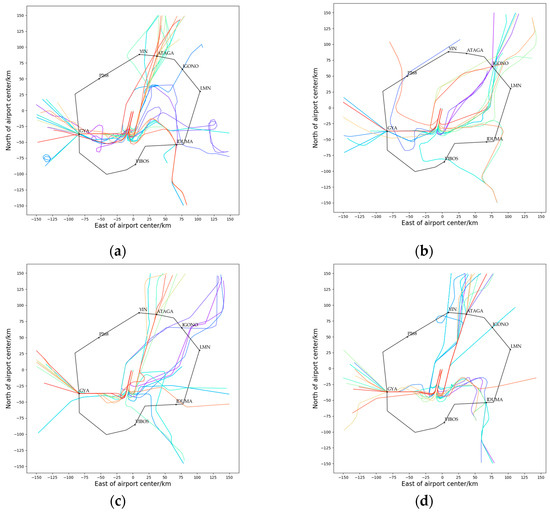
Figure 16.
7 July 2018 15:20–19:20 Terminal Area Approach Traffic Flow Trajectory: (a) 7 July 2018 15:20–16:20; (b) 7 July 2018 16:20–17:20; (c) 7 July 2018 17:20–18:20; (d) 7 July 2018 18:20–19:20.
5. Conclusions
To better support air traffic management decision-making and meet the intuitive cognition needs of air traffic controllers regarding changing weather conditions, this paper proposes a framework for identifying similar weather scenes in the terminal area. The framework involves rasterized WSI, scene construction, scene classification, and a search for identification. To improve scene search efficiency, a clustering-based scene classification module is added, utilizing unsupervised clustering of weather scenes with DTW-FCM. Furthermore, a time-series scene distance metric based on multiresolution temporal windows is proposed to capture the similarity between weather scenes of varying sizes, locations, and intensities. The framework is validated using a historical weather dataset of a typical busy airport—the Guangzhou Baiyun Airport terminal area—successfully identifying four types of weather scenes. Meanwhile, for the typical weather scenes with four-hour granularity, we constructed a collection of similar weather scenes of different categories by searching and identifying them and analyzed the macroscopic traffic flow in the terminal area. The results show that the traffic flows under similar weather scenes exhibit distinct similarities, and the proposed MRSTW-based similar weather scene identification framework for terminal areas can accurately capture the temporal and spatial change patterns of weather scenes, which can satisfy the needs of scene-based decision input.
In the future, we will analyze the characteristics of traffic flow under similar weather scenes from a microscopic perspective, study the features of intelligent decision-making for traffic deployment under different scenarios, and integrate key decision-making elements such as the degree of similarity matching between weather-impacted spatiotemporal scenes, the validity of strategies, and probabilistic frequency. This will enable us to design an intelligent traffic deployment strategy recommendation model based on historical strategies and configurable preferences.
Author Contributions
Conceptualization, L.Y.; methodology, L.Y., J.Z., and L.L.; software, W.C.; formal analysis, J.Z. and W.C.; investigation, L.Y. and Y.Z.; resources, L.Y. and Y.Z.; data curation, W.C.; writing—original draft preparation, J.Z. and W.C.; writing—review and editing, L.Y., J.Z., and Y.Z.; supervision, L.Y. and Y.Z.; project administration, L.Y.; funding acquisition, L.Y. All authors have read and agreed to the published version of the manuscript.
Funding
There is no funding for this work.
Data Availability Statement
Data are contained within the article.
Acknowledgments
We would like to thank the State Key Laboratory of Air Traffic Management System for providing the data used in the model tests described in this paper.
Conflicts of Interest
The authors declare no conflicts of interest.
References
- Campbell, S.E.; DeLaura, R. Convective Weather Impact Forecasting in the Terminal Area. In Proceedings of the 14th AIAA Aviation Technology, Integration, and Operations Conference, Atlanta, GA, USA, 16–20 June 2014; p. 2715. [Google Scholar]
- Grabbe, S.R.; Sridhar, B.; Mukherjee, A. Clustering Days and Hours with Similar Airport Traffic and Weather Conditions. J. Aerosp. Inf. Syst. 2014, 11, 751–763. [Google Scholar] [CrossRef]
- Cook, L.S.; Wood, B. A model for determining ground delay program parameters using a probabilistic forecast of stratus clearing. Air Traffic Control. Q. 2010, 18, 85–108. [Google Scholar] [CrossRef][Green Version]
- Flicker, R.; Fricke, M. Improvement on the acceptance of a conflict resolution system by air traffic controllers. In Proceedings of the Sixth USA/Europe Air Traffic Management R&D Seminar (ATM-2005), Baltimore, MD, USA, 27–30 June 2005. [Google Scholar]
- Mukherjee, A.; Grabbe, S.R.; Sridhar, B. Classification of Days Using Weather Impacted Traffic in the National Airspace System. In Proceedings of the Aviation Technology, Integration, & Operations Conference, Los Angeles, CA, USA, 12–14 August 2013. [Google Scholar]
- Hu, M.; Zhang, X.; Yuan, L.; Chen, H.; Ge, J. Identifying similar operation scenes for busy area sector dynamic management. Trans. Nanjing Univ. Aeronaut. Astronaut. 2020, 37, 615–629. [Google Scholar] [CrossRef]
- Krozel, J.; Mitchell, J.; Polishchuk, V.; Prete, J. Capacity estimation for airspaces with convective weather constraints. In Proceedings of the AIAA Guidance, Navigation and Control Conference and Exhibit, Hilton Head, SC, USA, 20–23 August 2007; p. 6451. [Google Scholar]
- Arneson, H.; Bombelli, A.; Segarra-Torné, A.; Tse, E. Analysis of convective weather impact on predeparture routing of flights from Fort Worth Center to New York Center. In Proceedings of the AIAA Aviation 2017, Denver, CO, USA, 5–9 June 2017. [Google Scholar]
- Klein, A.; Cook, L.; Wood, B.; Simenauer, D. Airspace Capacity Estimation using Flows and Weather-Impacted Traffic Index. In Proceedings of the Integrated Communications, Navigation and Surveillance Conference, Bethesda, MD, USA, 5–7 May 2008; pp. 1–12. [Google Scholar]
- Klein, A.; Craun, C.; Lee, R.S. Airport delay prediction using Weather-Impacted Traffic Index (WITI) model. In Proceedings of the AIAA/IEEE Digital Avionics Systems Conference, Salt Lake City, UT, USA, 3–7 October 2010; pp. 1–13. [Google Scholar]
- Huang, S.; Xu, L.; Zhou, Y.; Qiao, Y.; Shen, Z. A High-Precision Method for Evaluating Sector Capacity in Bad Weather Based on an Improved WITI Model. Appl. Sci. 2022, 12, 10114. [Google Scholar] [CrossRef]
- Liu, Y.; Seelhorst, M.; Pozdnukhov, A.; Hansen, M.; Ball, M.O. Assessing terminal weather forecast similarity for strategic air traffic management. In Proceedings of the International Conference on Research in Air Transportation, Istanbul, Turkey, 26–30 May 2014. [Google Scholar]
- Chen, H.; Hou, X.; Yuan, L.; Zhang, B. Identification of similar air scenes with active metric learning. Trans. Nanjing Univ. Aeronaut. Astronaut. 2021, 38, 625–633. [Google Scholar] [CrossRef]
- Vargo, E.; Taylor, C.P. Similarity Scoring with Random Field Models for Traffic Flow Management Applications. In Proceedings of the 2018 Aviation Technology, Integration, and Operations Conference, Atlanta, GA, USA, 25–29 June 2018; p. 3671. [Google Scholar]
- Gorripaty, S.; Hansen, M.; Pozdnukhov, A. Decision support framework to assist air traffic management. In Proceedings of the 2016 IEEE/AIAA 35th Digital Avionics Systems Conference (DASC), Sacramento, CA, USA, 25–29 September 2016; pp. 1–6. [Google Scholar]
- Hoffman, B.; Krozel, J.; Penny, S.; Roy, A.; Roth, K. A Cluster Analysis to Classify Days in the National Airspace System. In Proceedings of the AIAA Guidance, Navigation, & Control Conference & Exhibit, Austin, TX, USA, 11–14 August 2003; p. 203. [Google Scholar]
- Zeng, Y.; Yuan, L.; Chen, H.; Lv, X.; Hou, X. Classification of operating scenarios in terminal areas incorporating traffic and strategy features. In Proceedings of the Fifth International Conference on Traffic Engineering and Transportation System (ICTETS 2021), Chongqing, China, 24–26 September 2021; Volume 12058, pp. 1375–1380. [Google Scholar]
- Reitmann, S.; Alam, S.; Schultz, M. Advanced quantification of weather impact on air traffic management. In Proceedings of the Thirteenth USA/Europe Air Traffic Management Research and Development Seminar (ATM2019), Vienna, Austria, 17–21 June 2019; Volume 44, pp. 554–567. [Google Scholar]
- Xie, L.; Zou, X.; Wang, Y.; Su, G. An improved weather impacted traffic index model based on fuzzy theory. In Proceedings of the 3rd Asia-Pacific Conference on Image Processing, Electronics and Computers, Dalian, China, 14–16 April 2022; pp. 30–33. [Google Scholar]
- Kong, D.; Duan, M.; Shang, R.; Li, Y. Clustering Analysis of Airport Traffic Similar Days Affected by Epidemic Based on HI-K-means. Acad. J. Sci. Technol. 2022, 4, 155–161. [Google Scholar] [CrossRef]
- Izakian, H.; Pedrycz, W.; Jamal, I. Fuzzy clustering of time series data using dynamic time warping distance. Eng. Appl. Artif. Intell. 2015, 39, 235–244. [Google Scholar] [CrossRef]
- Guo, H.; Wang, L.; Liu, X.; Pedrycz, W. Information granulation-based fuzzy clustering of time series. IEEE Trans. Cybern. 2020, 51, 6253–6261. [Google Scholar] [CrossRef] [PubMed]
- Xie, J.; Wan, Y.; Zhou, Y.; Tien, S.L.; Vargo, E.P.; Taylor, C.; Wanke, C. Distance measure to cluster spatiotemporal scenarios for strategic air traffic management. J. Aerosp. Inf. Syst. 2015, 12, 545–563. [Google Scholar] [CrossRef]
- Ashari, I.F.; Nugroho, E.D.; Baraku, R.; Yanda, I.N.; Liwardana, R.; Ashari, I.F.; Nugroho, E.D.; Baraku, R.; Yanda, I.N.; Liwardana, R. Analysis of elbow, silhouette, Davies-Bouldin, Calinski-Harabasz, and rand-index evaluation on k-means algorithm for classifying flood-affected areas in Jakarta. J. Appl. Inform. Comput. 2023, 7, 95–103. [Google Scholar] [CrossRef]
Disclaimer/Publisher’s Note: The statements, opinions and data contained in all publications are solely those of the individual author(s) and contributor(s) and not of MDPI and/or the editor(s). MDPI and/or the editor(s) disclaim responsibility for any injury to people or property resulting from any ideas, methods, instructions or products referred to in the content. |
© 2024 by the authors. Licensee MDPI, Basel, Switzerland. This article is an open access article distributed under the terms and conditions of the Creative Commons Attribution (CC BY) license (https://creativecommons.org/licenses/by/4.0/).

