1. Introduction
The aerospace industry has a high fly-to-buy ratio, which is typically around 12:1 or 25:1 [
1]. This means that for every unit of aerospace component produced, 12 to 25 units of expensive material (such as titanium in aircraft carriers) are wasted. Weight is also a critical factor in the aerospace industry, as the cost of sending a kilogram of payload to a low Earth orbit can range from 1500
$/kg to 73,100
$/kg depending on the launch vehicle [
2].
As space travel activity continues to increase, cost reduction has become a top priority for aerospace manufacturers. One way to achieve this cost reduction is by reducing the weight of components through changes in design, materials, or manufacturing methods. Additive manufacturing (AM) is one of the most effective methods to achieve both weight and cost reduction [
3,
4,
5,
6].
However, it is also fair to mention that additive manufacturing (AM) has certain drawbacks. Despite the significant advancements and efforts in the field, particularly from the aerospace industry, the rate of integration into mainstream processes remains surprisingly low, according to Joshi and Sheikh [
7]. One of the primary reasons for this slow adoption is the stringent certification requirements prevalent in the aerospace industry. These requirements are designed to ensure the safety and reliability of aerospace components, which are often subjected to extreme operating conditions. However, the lack of specific testing and safety standards for AM technologies makes it challenging to certify AM-produced parts, therefore limiting their use in the industry. Another critical factor highlighted by the aforementioned authors is the high energy demand of AM processes. AM, while offering numerous advantages such as complex geometries and reduced material waste, is an energy-intensive process [
7].
Despite its obstacles, the ability to make design changes quickly in a computer-aided environment significantly accelerates the manufacturing process. A survey by Jabil found that 3D printing has helped to speed up production times by allowing for quick design changes on the computer without the need for mold or tool changes [
8]. Three-dimensional printing is an additive manufacturing method that creates components by depositing material layer by layer. This is particularly beneficial for aerospace components that require internal cooling and have intricate interior designs. Such components would typically require a lengthy manufacturing process using traditional methods; however, AM makes the process shorter and simpler, resulting in lower weight and less material waste [
9].
Some authors compare the unit manufacturing cost of a component using traditional processes with that using AM, as the complexity of the components increases [
10,
11]. These results showed that as the complexity of the components increased, so did the unit manufacturing cost when traditional processes were used. On the contrary, the unit manufacturing cost remained relatively constant when AM was used. This highlights the potential cost savings that can be achieved using AM in the aerospace industry [
12].
Due to the aforementioned reasons, the aerospace industry has been at the forefront of incorporating 3D printing technologies and is widely regarded as one of the main promoters of additive manufacturing, along with the defense industry [
13], ever since its inception in the 1980s [
14]. Three-dimensional printing presents many opportunities for aerospace, adjusting the way components are designed and how testing and validation, preproduction, and production activities are carried out [
15].
Concerning materials that could be suitable for aerospace applications, much research has been done in the past decade [
16]. Ceramic materials, composites, metallic materials (aluminum alloys, steel, and titanium), and polymers can be printed depending on the physical state of the material and the AM technique used [
17].
Regarding polymers, high-strength materials have arisen in recent years. ULTEM™ is a high-performance polymer that is widely used in aerospace applications due to its superior strength, durability, and heat resistance. There are two ULTEM™ materials that are particularly well suited for aerospace applications (and are certified for its use [
18,
19]): ULTEM™ 9085 and ULTEM™ 1010. The latter has the highest tensile strength of all FDM filaments, resulting in strong and durable components [
19]. It is commonly used in semi-structural and out-of-cabin components, such as twinjets [
20]. ULTEM™ 9085, on the other hand, is typically used in components where weight reduction is important, but strength is still required. It is often found in inside-of-cabin components [
21].
Both ULTEM™ 9085 and ULTEM™ 1010 offer a range of benefits for aerospace applications. Some authors have already studied the properties of these two materials individually, ULTEM™ 9085 and ULTEM™ 1010, producing very interesting results. Padovano et al. studies the same orientations and properties as in this work, but only on the tensile properties of ULTEM™ 9085 [
22]. In the same way, Zaldivar et al. and Kaplun et al. test only the ultimate tensile strength and modulus of ULTEM™ 9085 [
23,
24], while Byberg et al. looked into the tensile, flexural and compressive strength [
25]. Less literature can be found on ULTEM™ 1010. Pandelidi et al. measure the strength and modulus in tensile and flexural tests in three of the four orientations presented in this article [
26], while Taylor et al. look into the modulus and yield strength in the same orientations [
27]. ULTEM™ 9085 and ULTEM™ 1010 provide dimensional stability, long-term heat resistance, high strength and stiffness, broad chemical resistance, low smoke generation, excellent fatigue and stress crack resistance, and hydrolysis resistance [
28]. These properties make them ideal materials for use in demanding aerospace environments with critical performance and reliability.
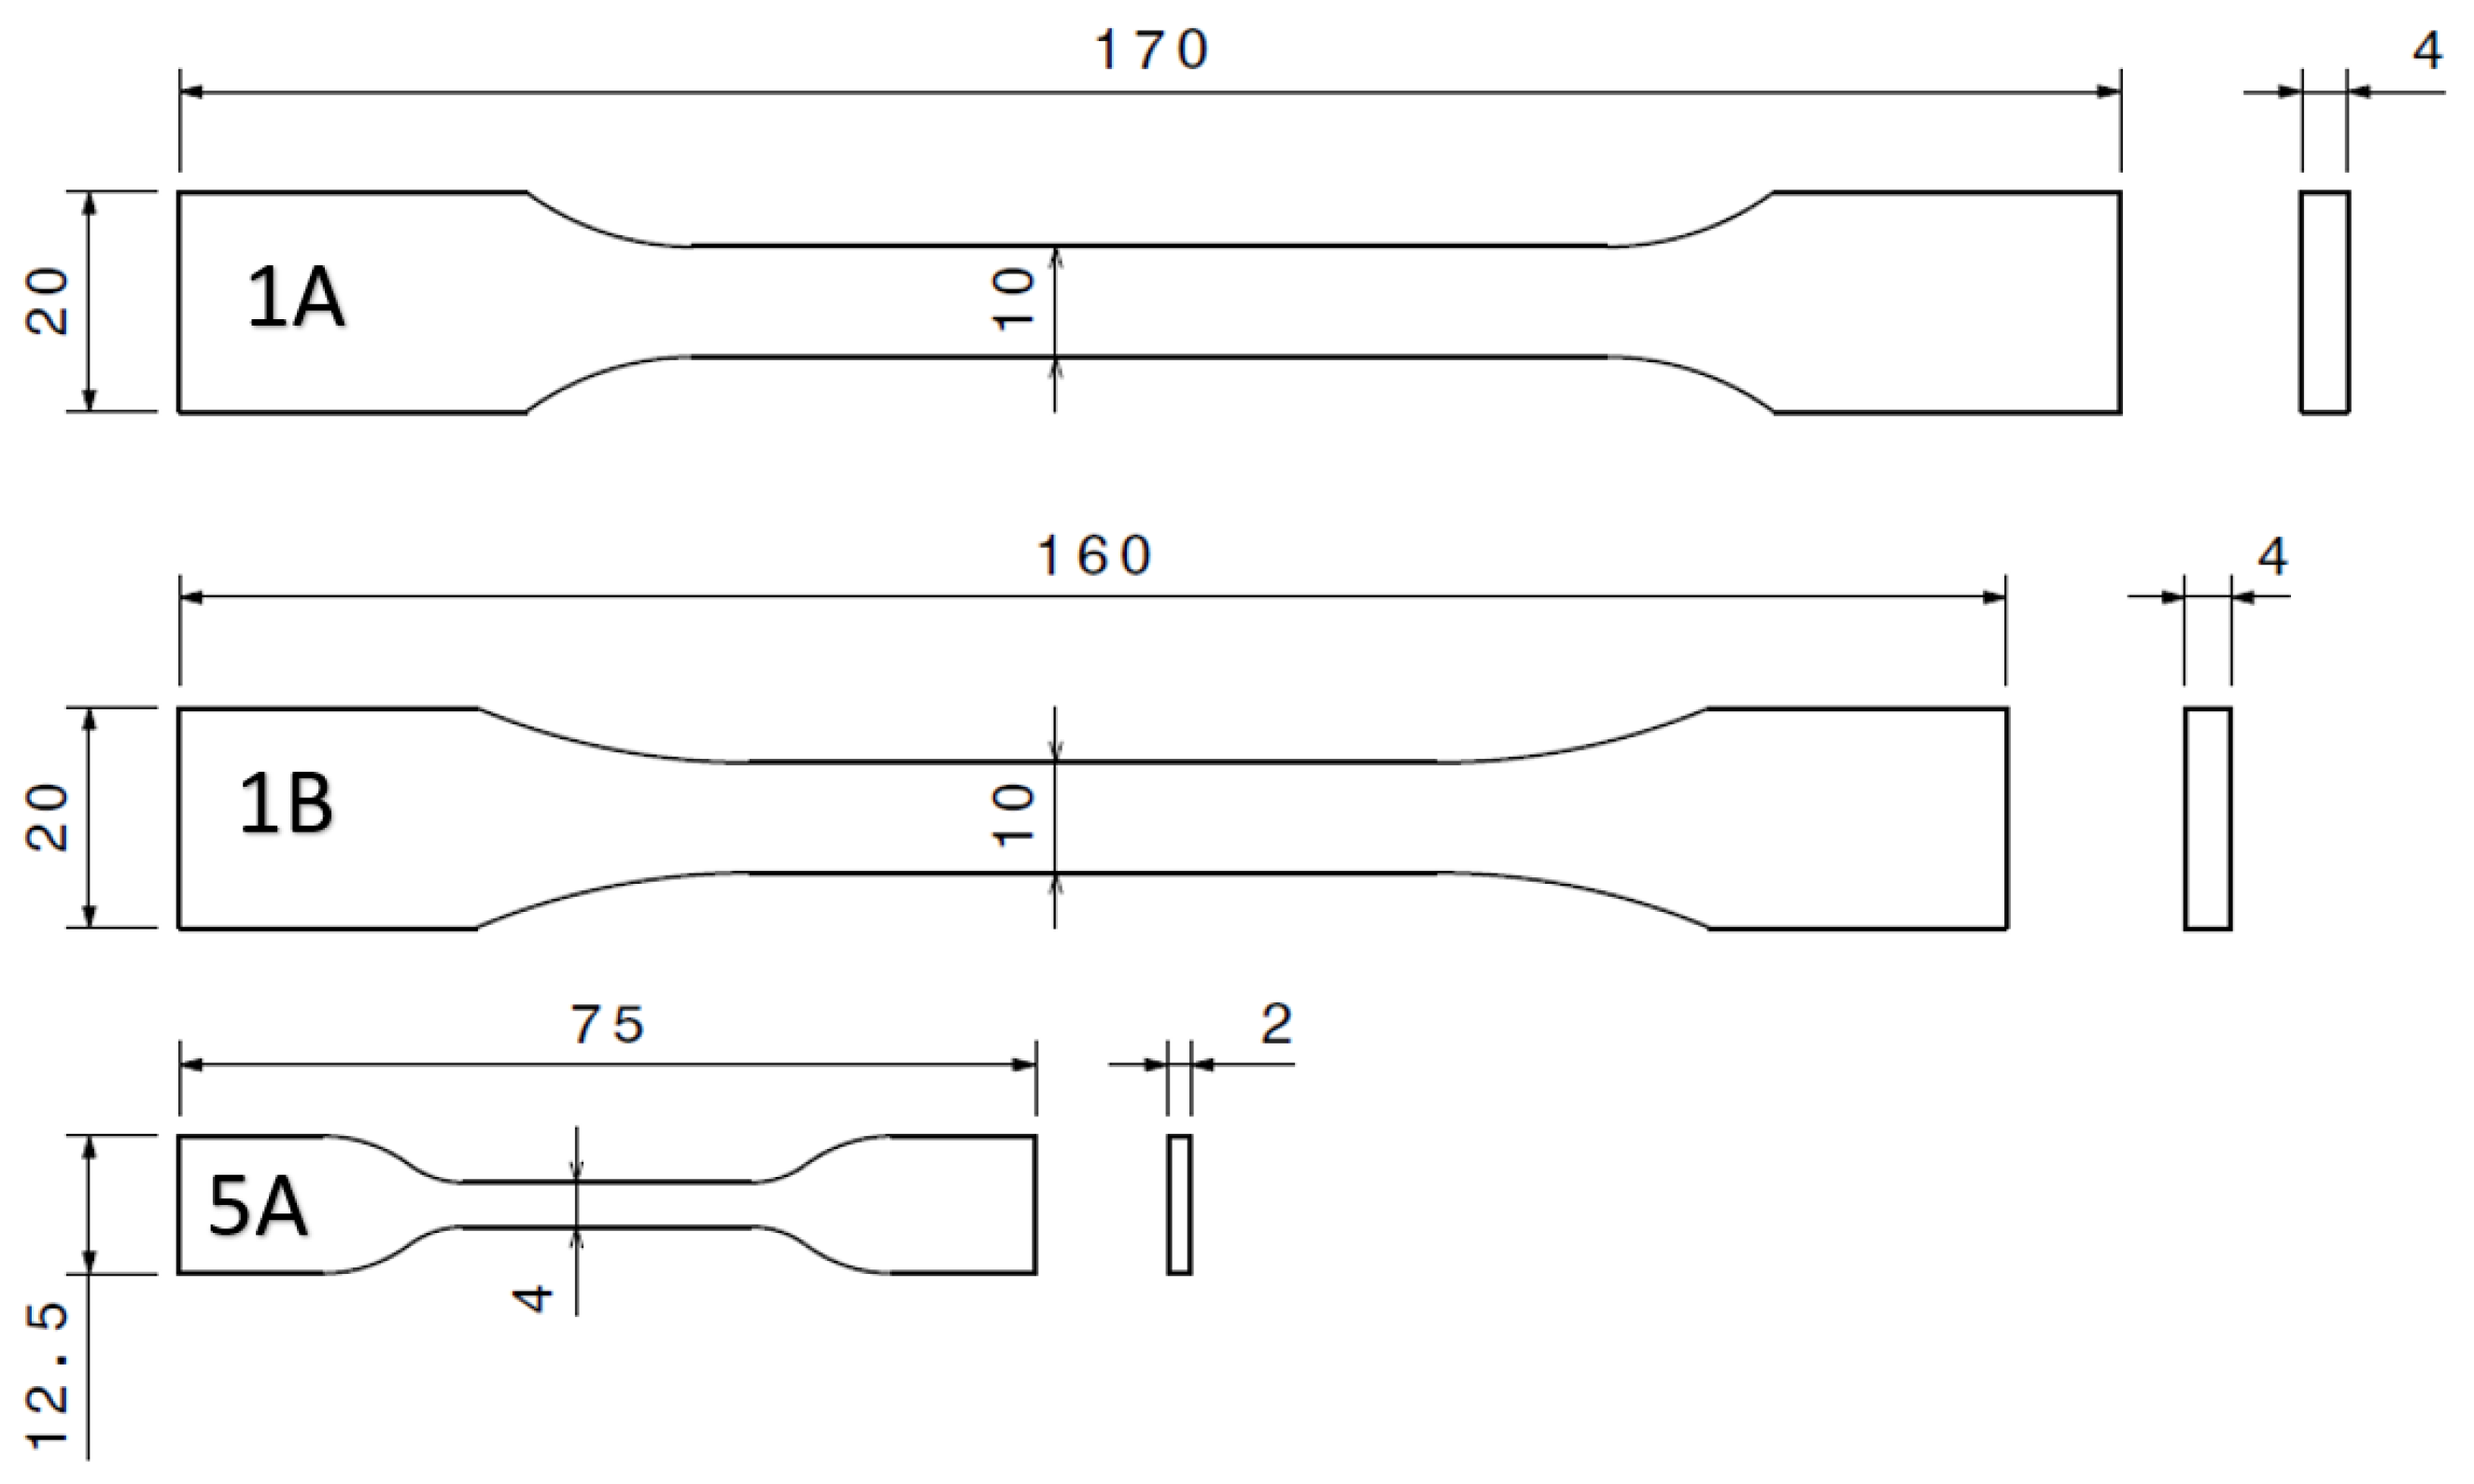
The mentioned research done on these two materials also used the ASTM standard for testing, while this article decided to use the ISO standard. The main reason for this is that its shape can significantly influence the mechanical properties of a sample. This is a crucial aspect that was discussed in detail by Laureto and Pierce. In their study, they compared two types of samples as defined by the ASTM D638 standard: Type I and Type IV. The ASTM D638 standard is a globally recognized testing method used to measure the tensile properties of plastics. Type I and Type IV differ in their dimensions, with Type I being larger and Type IV being smaller. They observed that the Type IV samples tended to overestimate the ultimate strength when compared to the Type I samples. This overestimation could lead to inaccurate predictions of the material’s performance in real-world applications [
29]. Therefore, their findings underscore the importance of considering the shape of the sample when evaluating the mechanical properties of materials [
30]. It also highlights the need for standard testing procedures to account for these shape-dependent variations in properties.
Furthermore, it should be mentioned that choosing between ULTEM™ 9085 and ULTEM™ 1010 often comes down to the specific application, as their mechanical properties can overlap. Testing is crucial in determining the slight differences between the two materials and ensuring that they meet the strict safety standards required in the aerospace industry. Components used in this sector are regularly subjected to high stress levels and stress concentrations, where their strength and durability are critical [
31]. By testing the materials, researchers and engineers can ensure that they perform as expected under extreme temperatures, pressures, and loads.
Studies have shown that the mechanical properties of specimens made from the same material can vary due to the anisotropy of the material, depending on the layer direction and printer used [
32,
33]. This is also true for high-performance polymers, where factors such as layer orientation can affect tensile strength, fracture toughness, and fatigue resistance [
34]. Therefore, when testing and selecting materials for specific applications, it is important to consider not only the material itself but also the layer orientation and printer type. According to the research conducted by Goh [
35], there is a notable difference in the tensile strength of the samples based on their printing orientation. Specifically, the tensile strength of the samples printed vertically is found to be only 40–50% of the tensile strength of the samples printed flat or on-edge. This is a substantial reduction and can significantly impact the suitability of the printed parts for certain applications.
The main objective of the work described in this paper is to apply a standard mechanical testing procedure to characterize materials for additive manufacturing (AM) in the aerospace industry. Two already known materials, ULTEM™ 9085 and ULTEM™ 1010, have been used as case studies. Nevertheless, the methodology described in this paper can be easily applied to new materials/polymers that might be developed in the coming years.
Additionally, the present work is part of a more ambitious program to include the results obtained from this testing procedure (tensile, bending, compression and Charpy impact) into the CAD design of aerospace parts and mechanical systems. This is particularly interesting in the present design of aerospace systems that are carried out by concurrent design (CD) in a Concurrent Design Facility (CDF) [
36]. The Concurrent Design Facility (CDF) is an advanced design facility equipped with a network of computers and other devices, with multiple software tools, that uses a methodology based on a continuous flow of information [
37]. This methodology links all subsystems in a mission together, spreading information, results, and data very quickly between the teams in charge of the different subsystems [
38,
39]. It is also an iterative process, optimizing the results with each new iteration after meeting a specific requirement and producing a much quicker final design of the whole aerospace system when compared to the classical approach [
40,
41].
The aim of the aforementioned research is to introduce the information about the polymers in this CD process, to run a fast and precise structural analysis with new iterations of the design, choose materials, and change the design accordingly to the mechanical properties of these materials. For example, choosing a lighter material, like a polymer, will have an upside (lower weight reduces costs) and a downside (a lower weight could also lead to vibration issues), and the iterative process of the CDF methodology would use the knowledge of said material to improve the design of the component as to meet the structural requirement while still being lighter than if metal had been chosen. A type of topology optimization for the concurrent design of structures has already been proposed in cellular solids, with examples showing that it could improve performance with an affordable computation and manufacturing cost [
42]. It should also be pointed out that to the best of the authors’ knowledge, no similar research to the one described in the present paper has been found in the available literature.
As mentioned above, this paper aims to present a new procedure for a practical, precise, and fast analysis that, with the knowledge obtained from the mechanical tests presented in this paper, can be implemented into CDF activities for topological optimization. First, the methodology followed, the testing methods, procedure, and instrumentation used in this paper are explained in
Section 2. The results obtained in the tests are described in
Section 3. Finally, the conclusions are included in
Section 4.
3. Results
This section presents the key outcomes of the mechanical tests conducted. Expanding upon previous work [
43], a comparison with more traditional materials and manufacturing methods is also included to analyze the capabilities of these materials in aerospace applications.
3.1. Tensile Test
The tensile test results for ULTEM™ 9085, as shown in
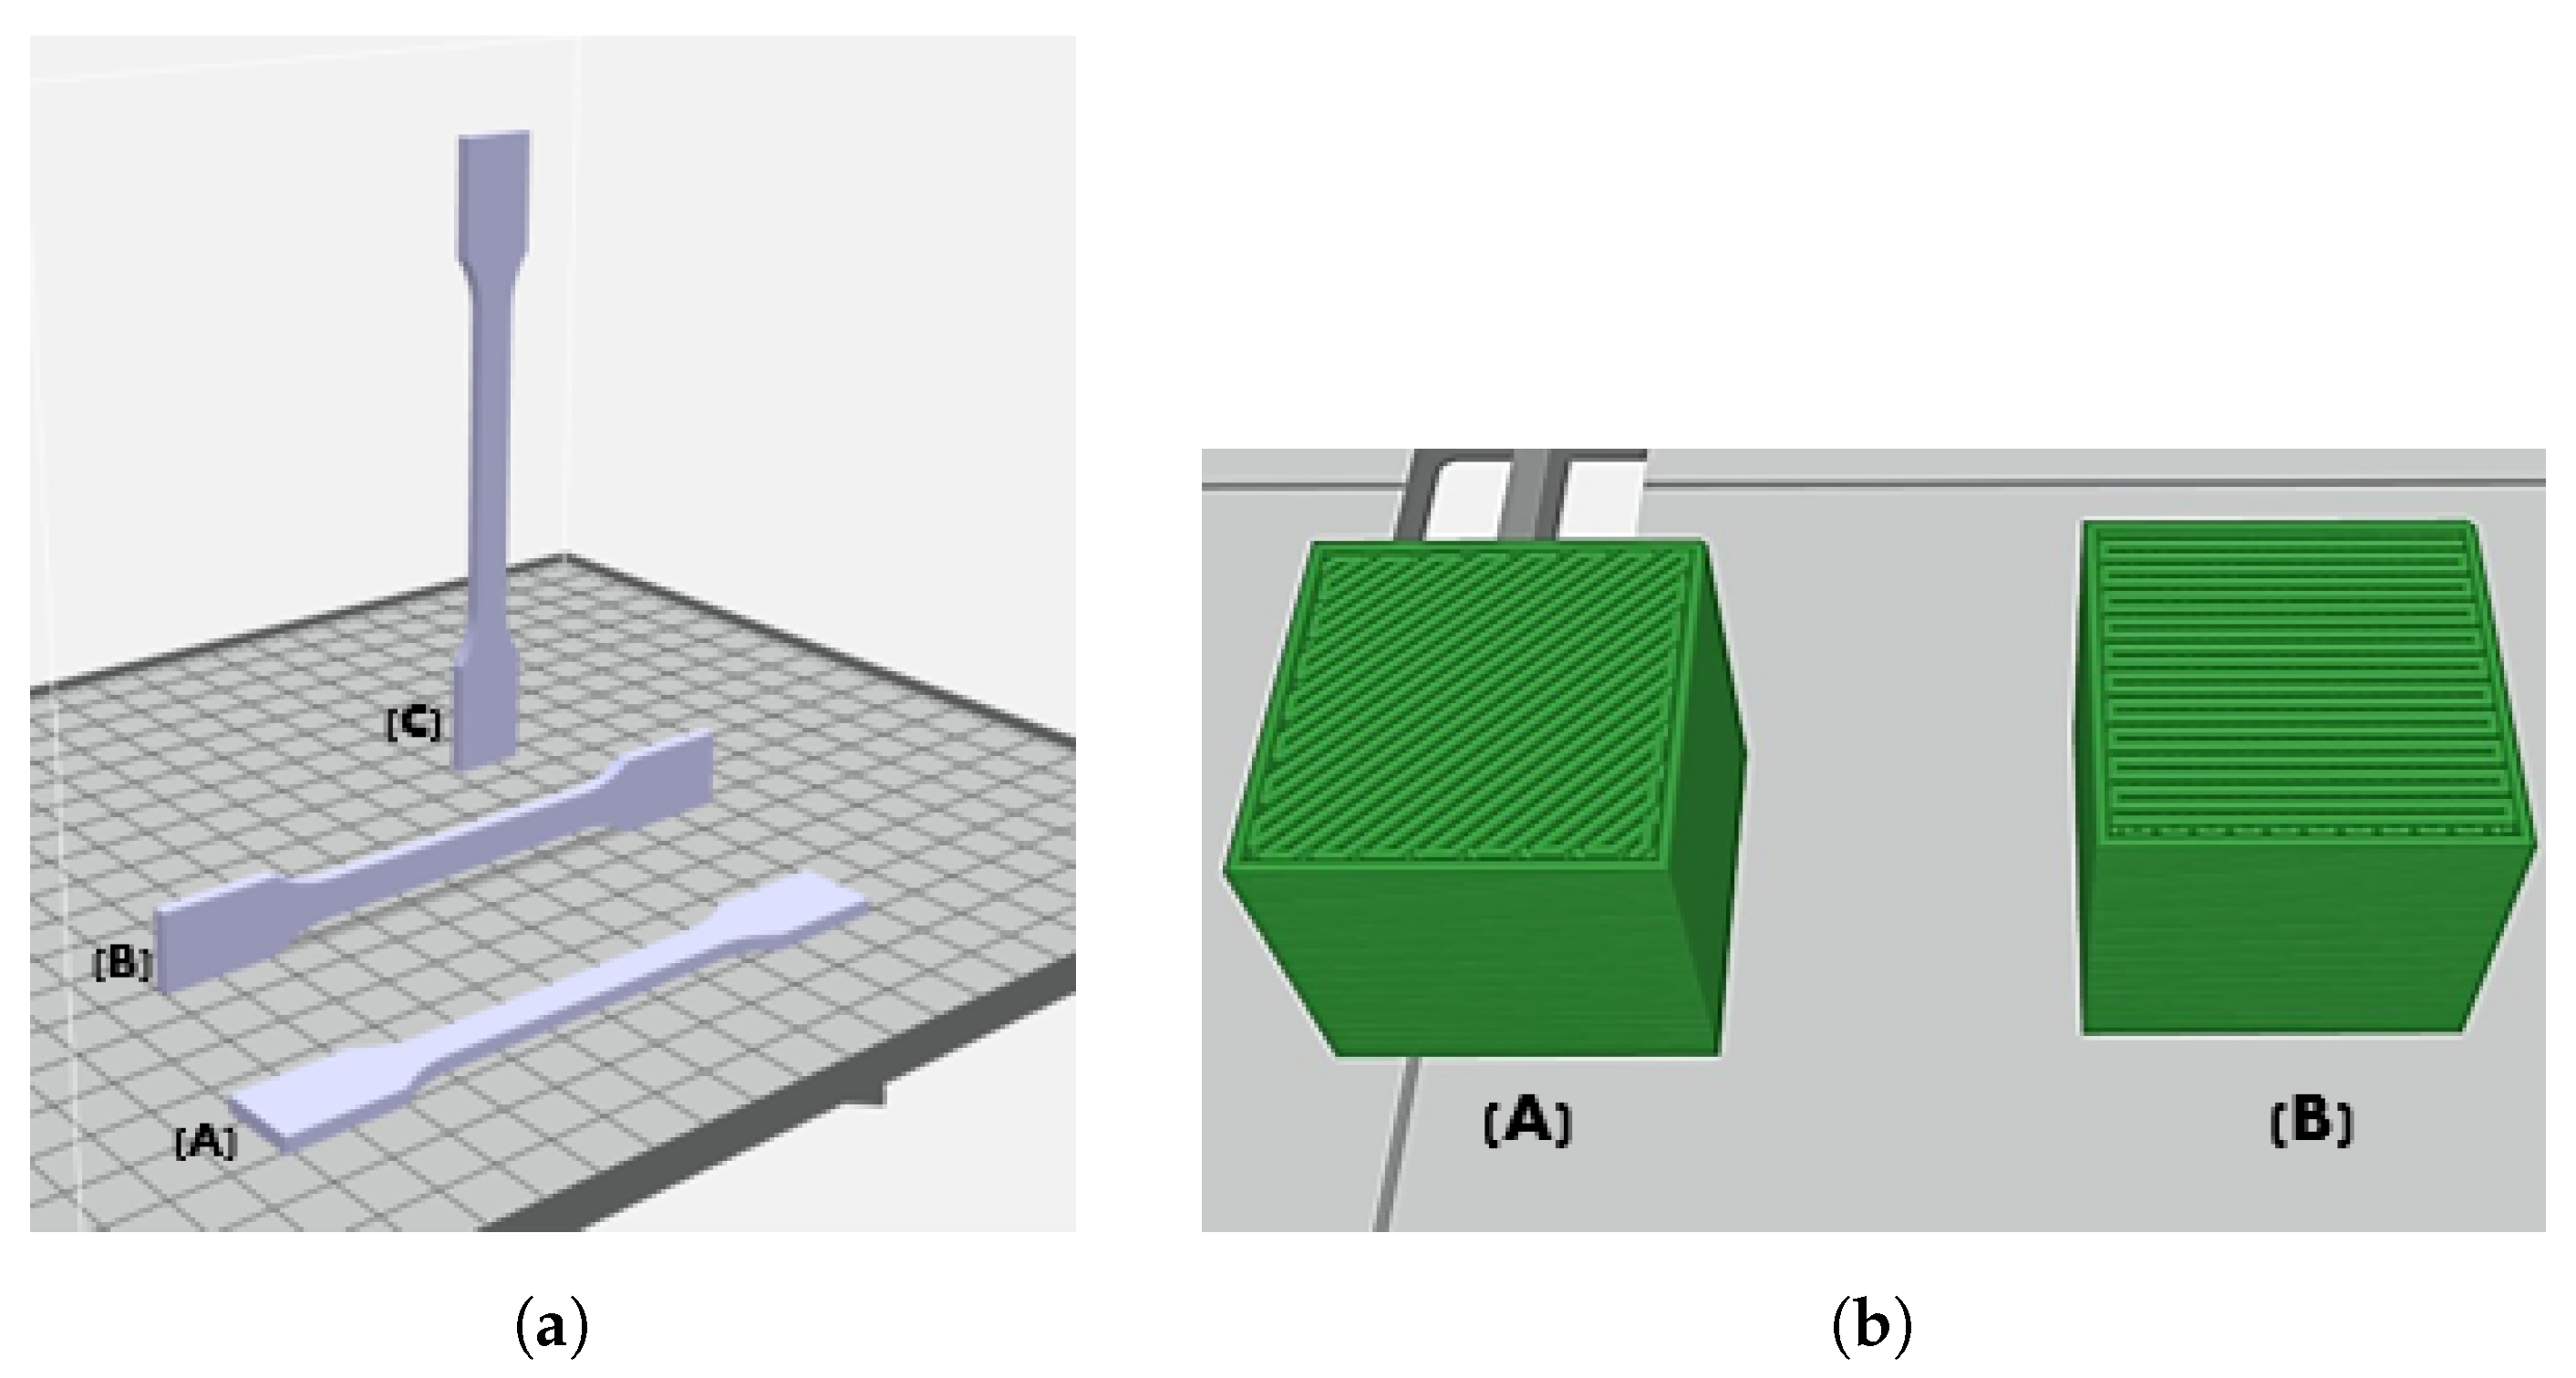
Table 3, indicate that the upright specimens (printed at a 90° angle) had lower elastic modulus and ultimate strength compared to other samples. The best overall performance was observed in the 1A on-edge 45° samples.
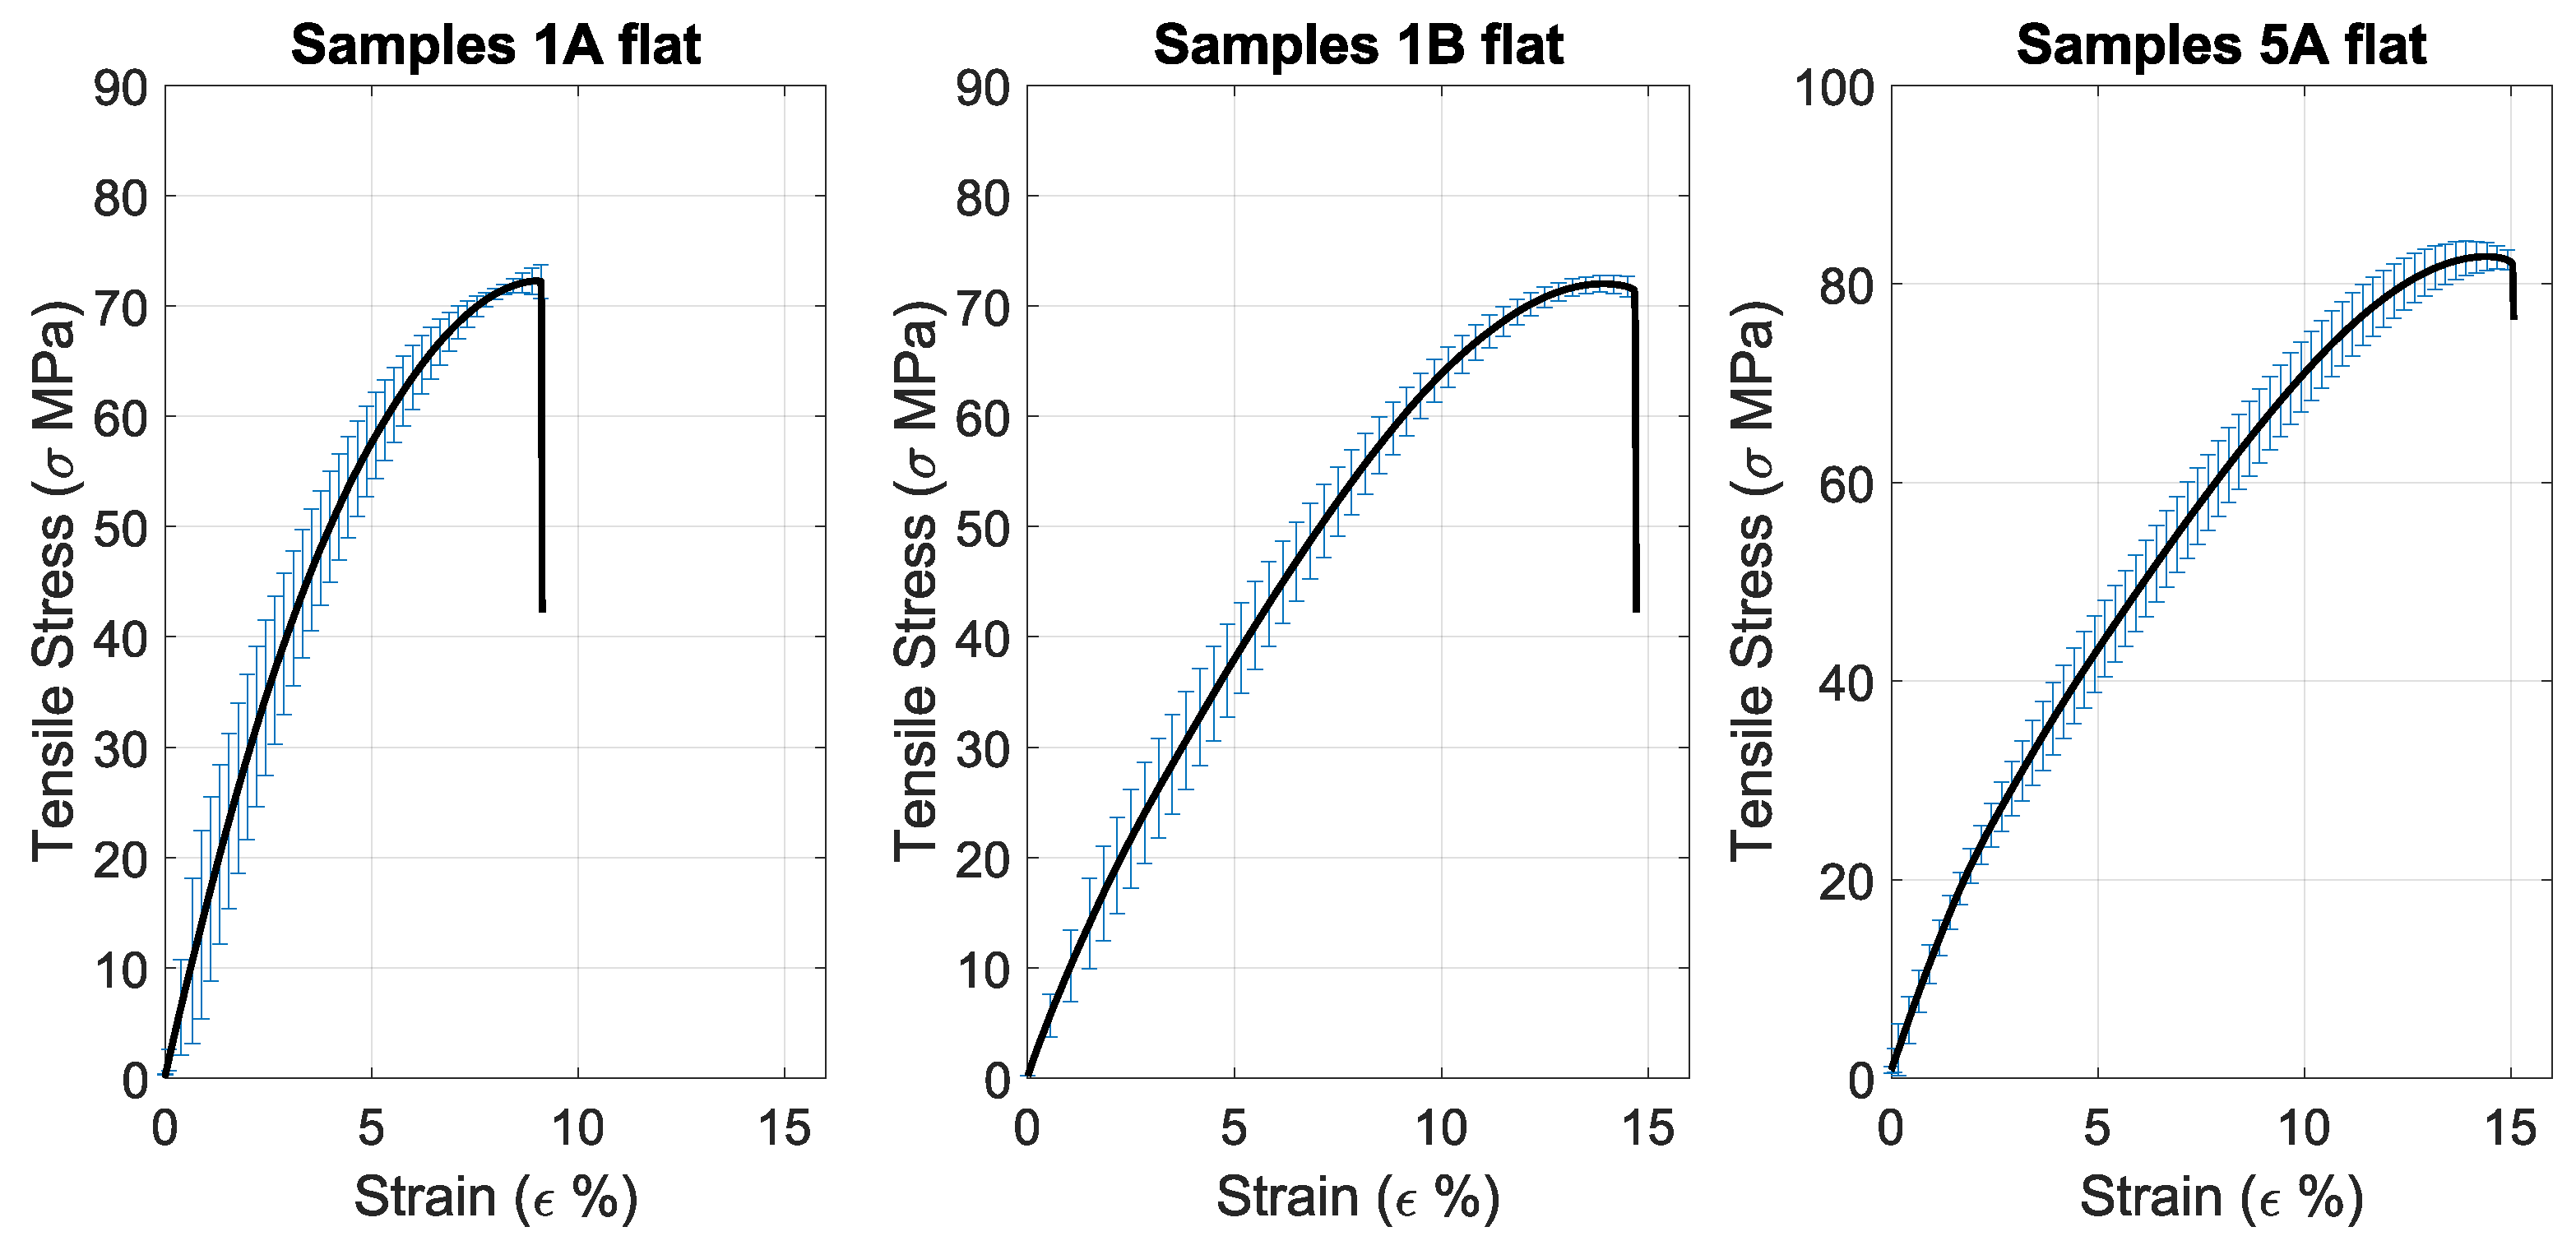
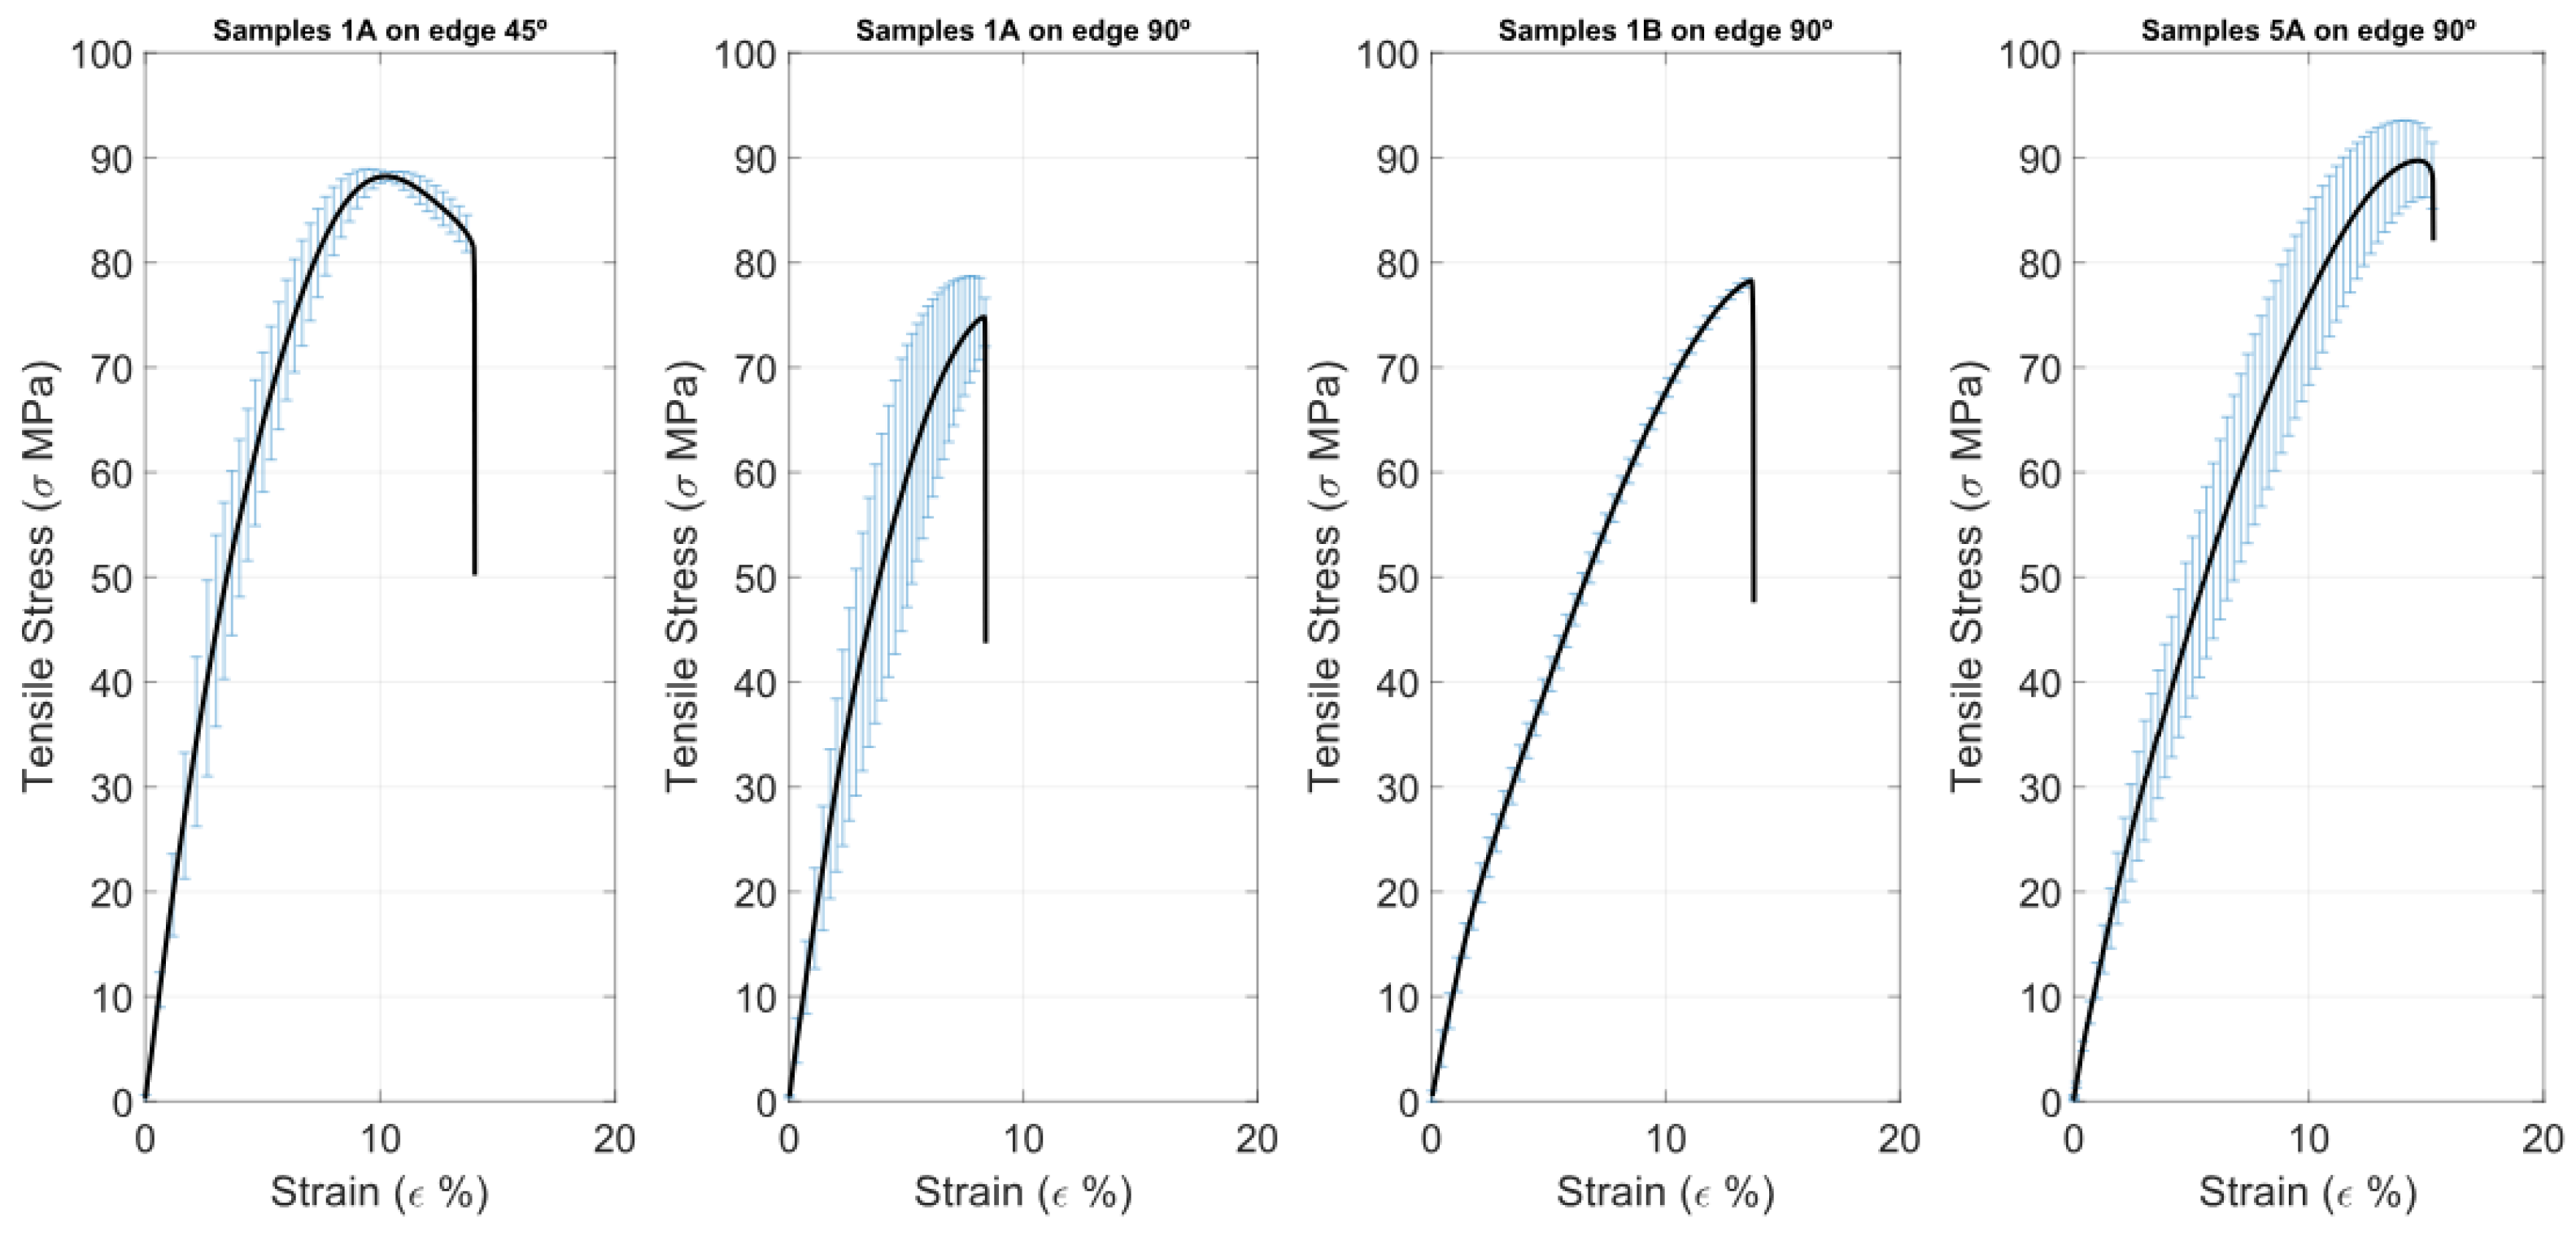
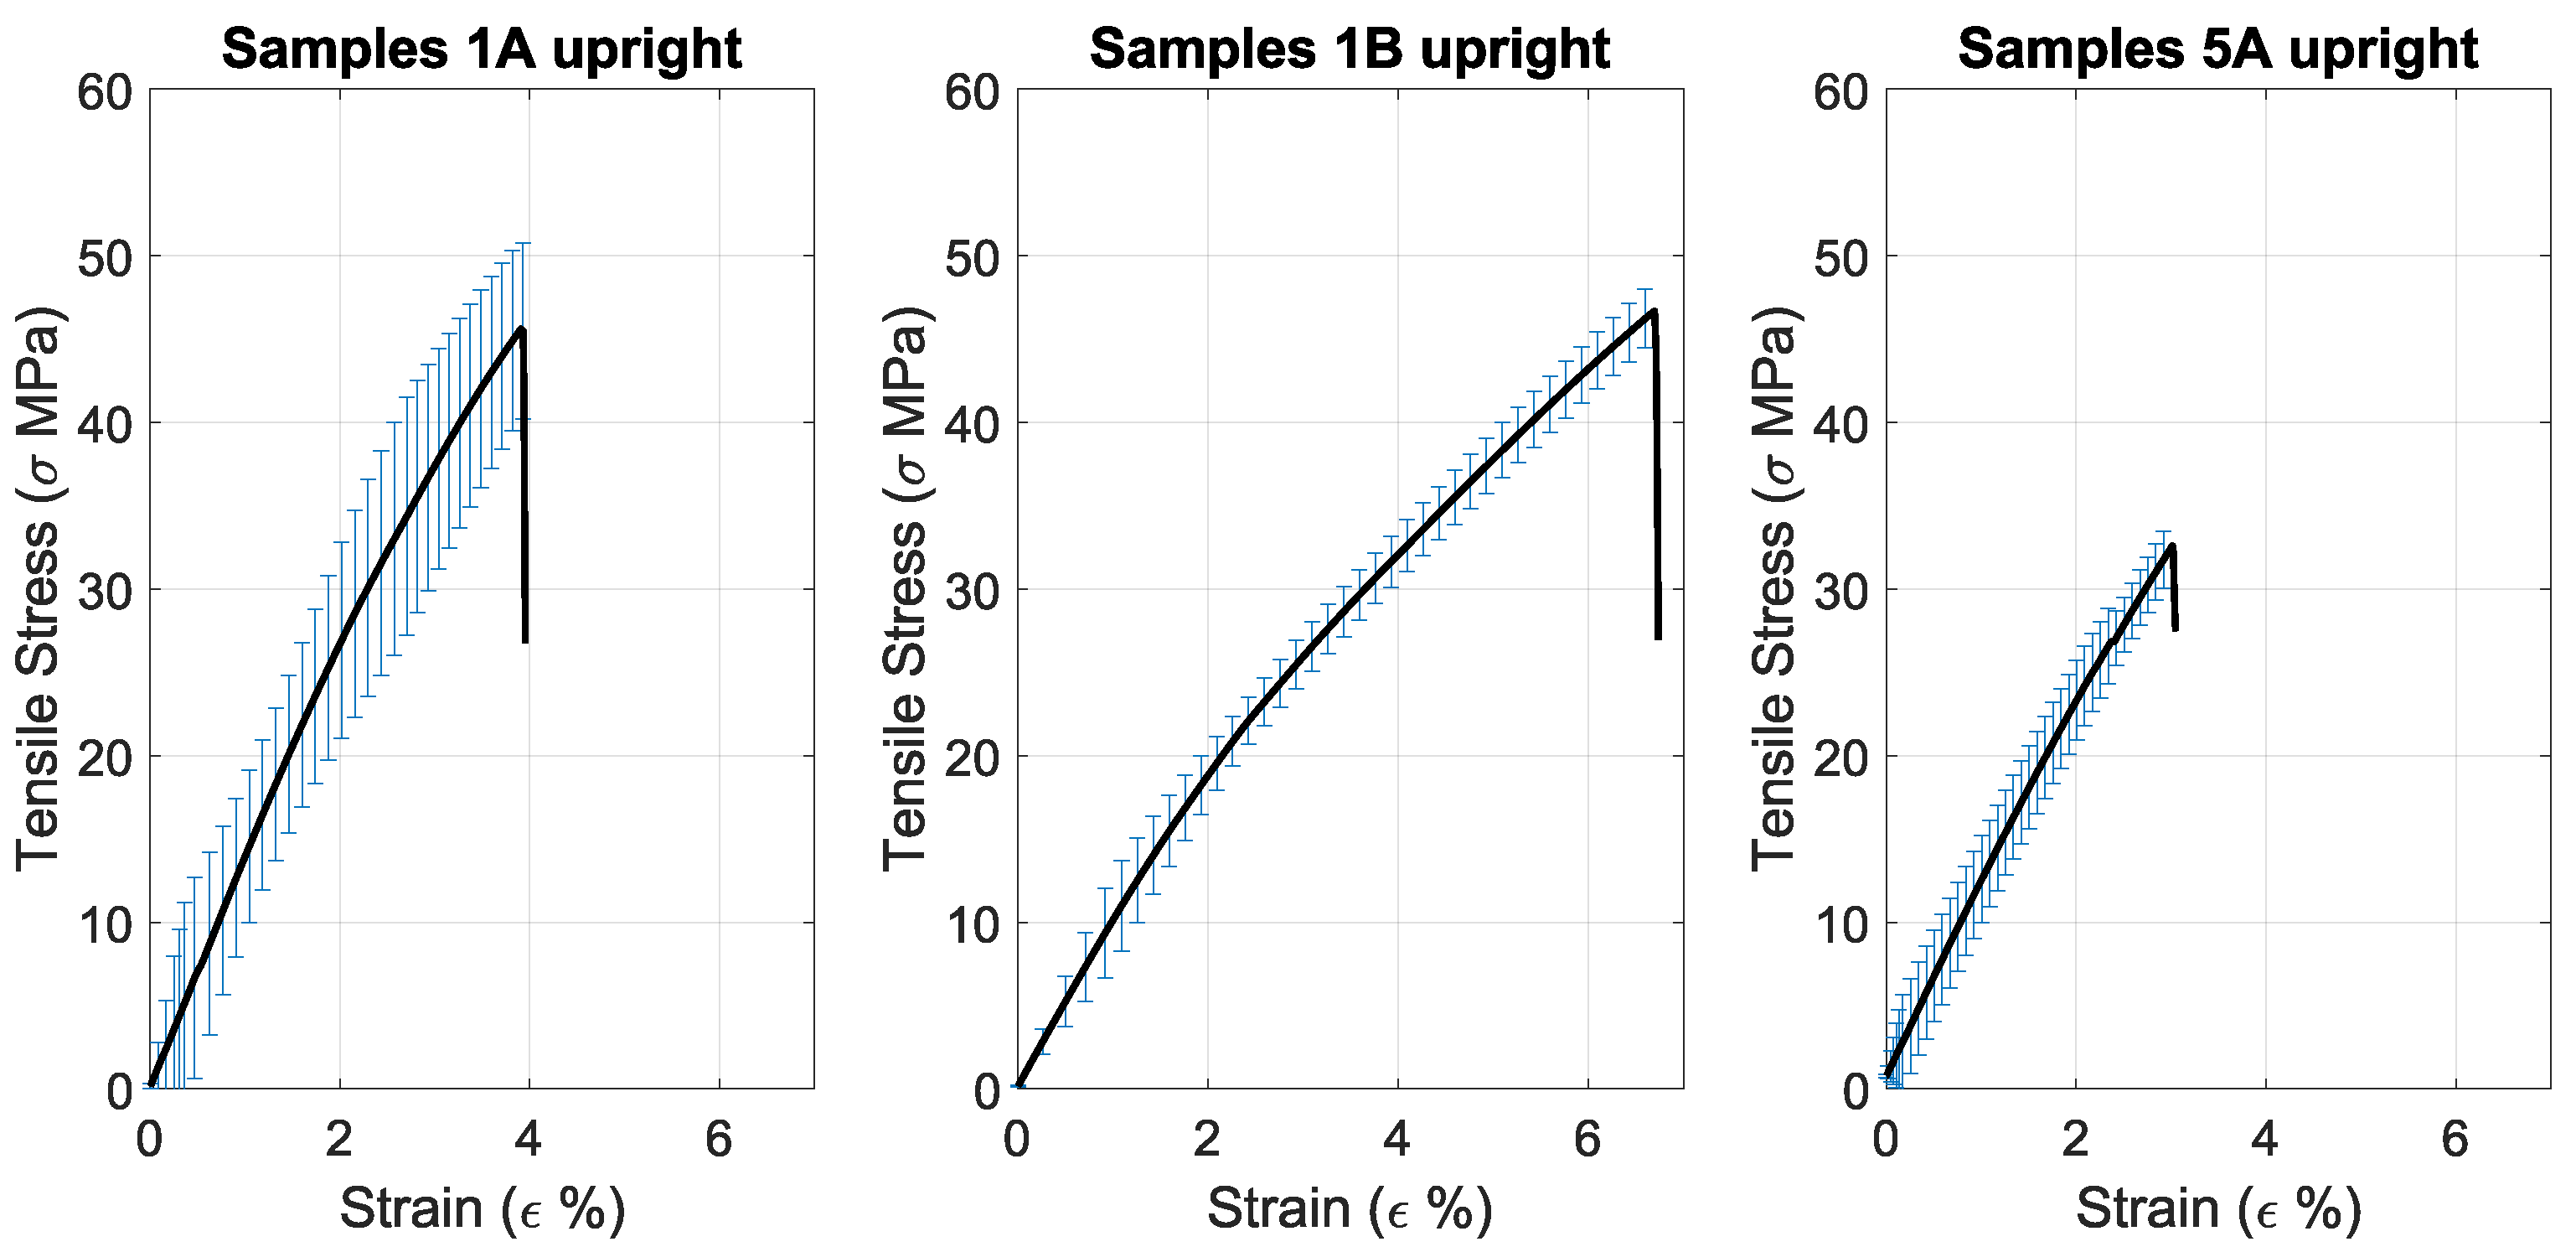
Figure 3,
Figure 4 and
Figure 5 show the average curves for each orientation of the three types of samples. The curves on samples 1B and 5A have a more similar trend among themselves (with different failure points) than the curves on the 1A samples.
The elastic modulus of the 1A flat and on-edge samples is higher compared to the 1B and 5A samples. However, the upright sample had the same result as the 5A sample despite having a higher yield and ultimate stress but smaller deformation at the break. The yield stress was larger in the 1A samples, but the maximum ultimate strength at break was recorded in the 5A samples. Overall, better tensile mechanical properties were observed when samples were printed on-edge.
Among the different types of orientations, in the 1A sample tests, the on-edge 90° obtain the highest elastic modulus, while the on-edge 45° had better ultimate strength and yield strength. In the 1B samples, the highest elastic modulus and ultimate strength are obtained by the on-edge samples, and the highest yield strength by the flat samples. For sample 5A, the on-edge specimens obtain the best elastic and ultimate tensile strength, while the upright samples have the highest yield strength. In this material, the on-edge samples consistently obtain better results.
According to the datasheet provided by STRATASYS [
50], the ultimate tensile strength of the on-edge 45° samples was higher than the reference values, while the yield strength and modulus were lower. In comparison with other authors, Padovano et al. [
22] obtain a nearly identical value for yield strength on the on-edge 45° specimens (100% infill), while their ultimate strength is slightly lower, and Young’s modulus is 0.9 GPa higher. Both Kaplun [
24] and Zaldivar [
23] study the properties of ULTEM™ 9085 samples in flat (0°), on-edge (45°) and upright (0°) specimens (using ASTM Type 1 samples). In both articles, the tensile strength obtained is lower than the results presented, while Young’s modulus is higher, closer to the datasheet value. Zaldivar presents a low value for Young’s modulus on on-edge 45° samples, 1770 MPa, closer to the 1488 MPa obtained than the datasheet value of 2520 MPa. Their results for the UTS in the flat and on-edge samples are considerably lower (46.83 MPa and 47.52 MPa, respectively).
During tensile testing of the 5A on-edge samples for ULTEM™ 9085, some issues were encountered where the layers of the specimen began to separate instead of breaking. This resulted in a different appearance of the testing figure compared to others. The test was not stopped completely once the layers began to separate to see if the sample would eventually break, so the exact strain at break is only an estimate.
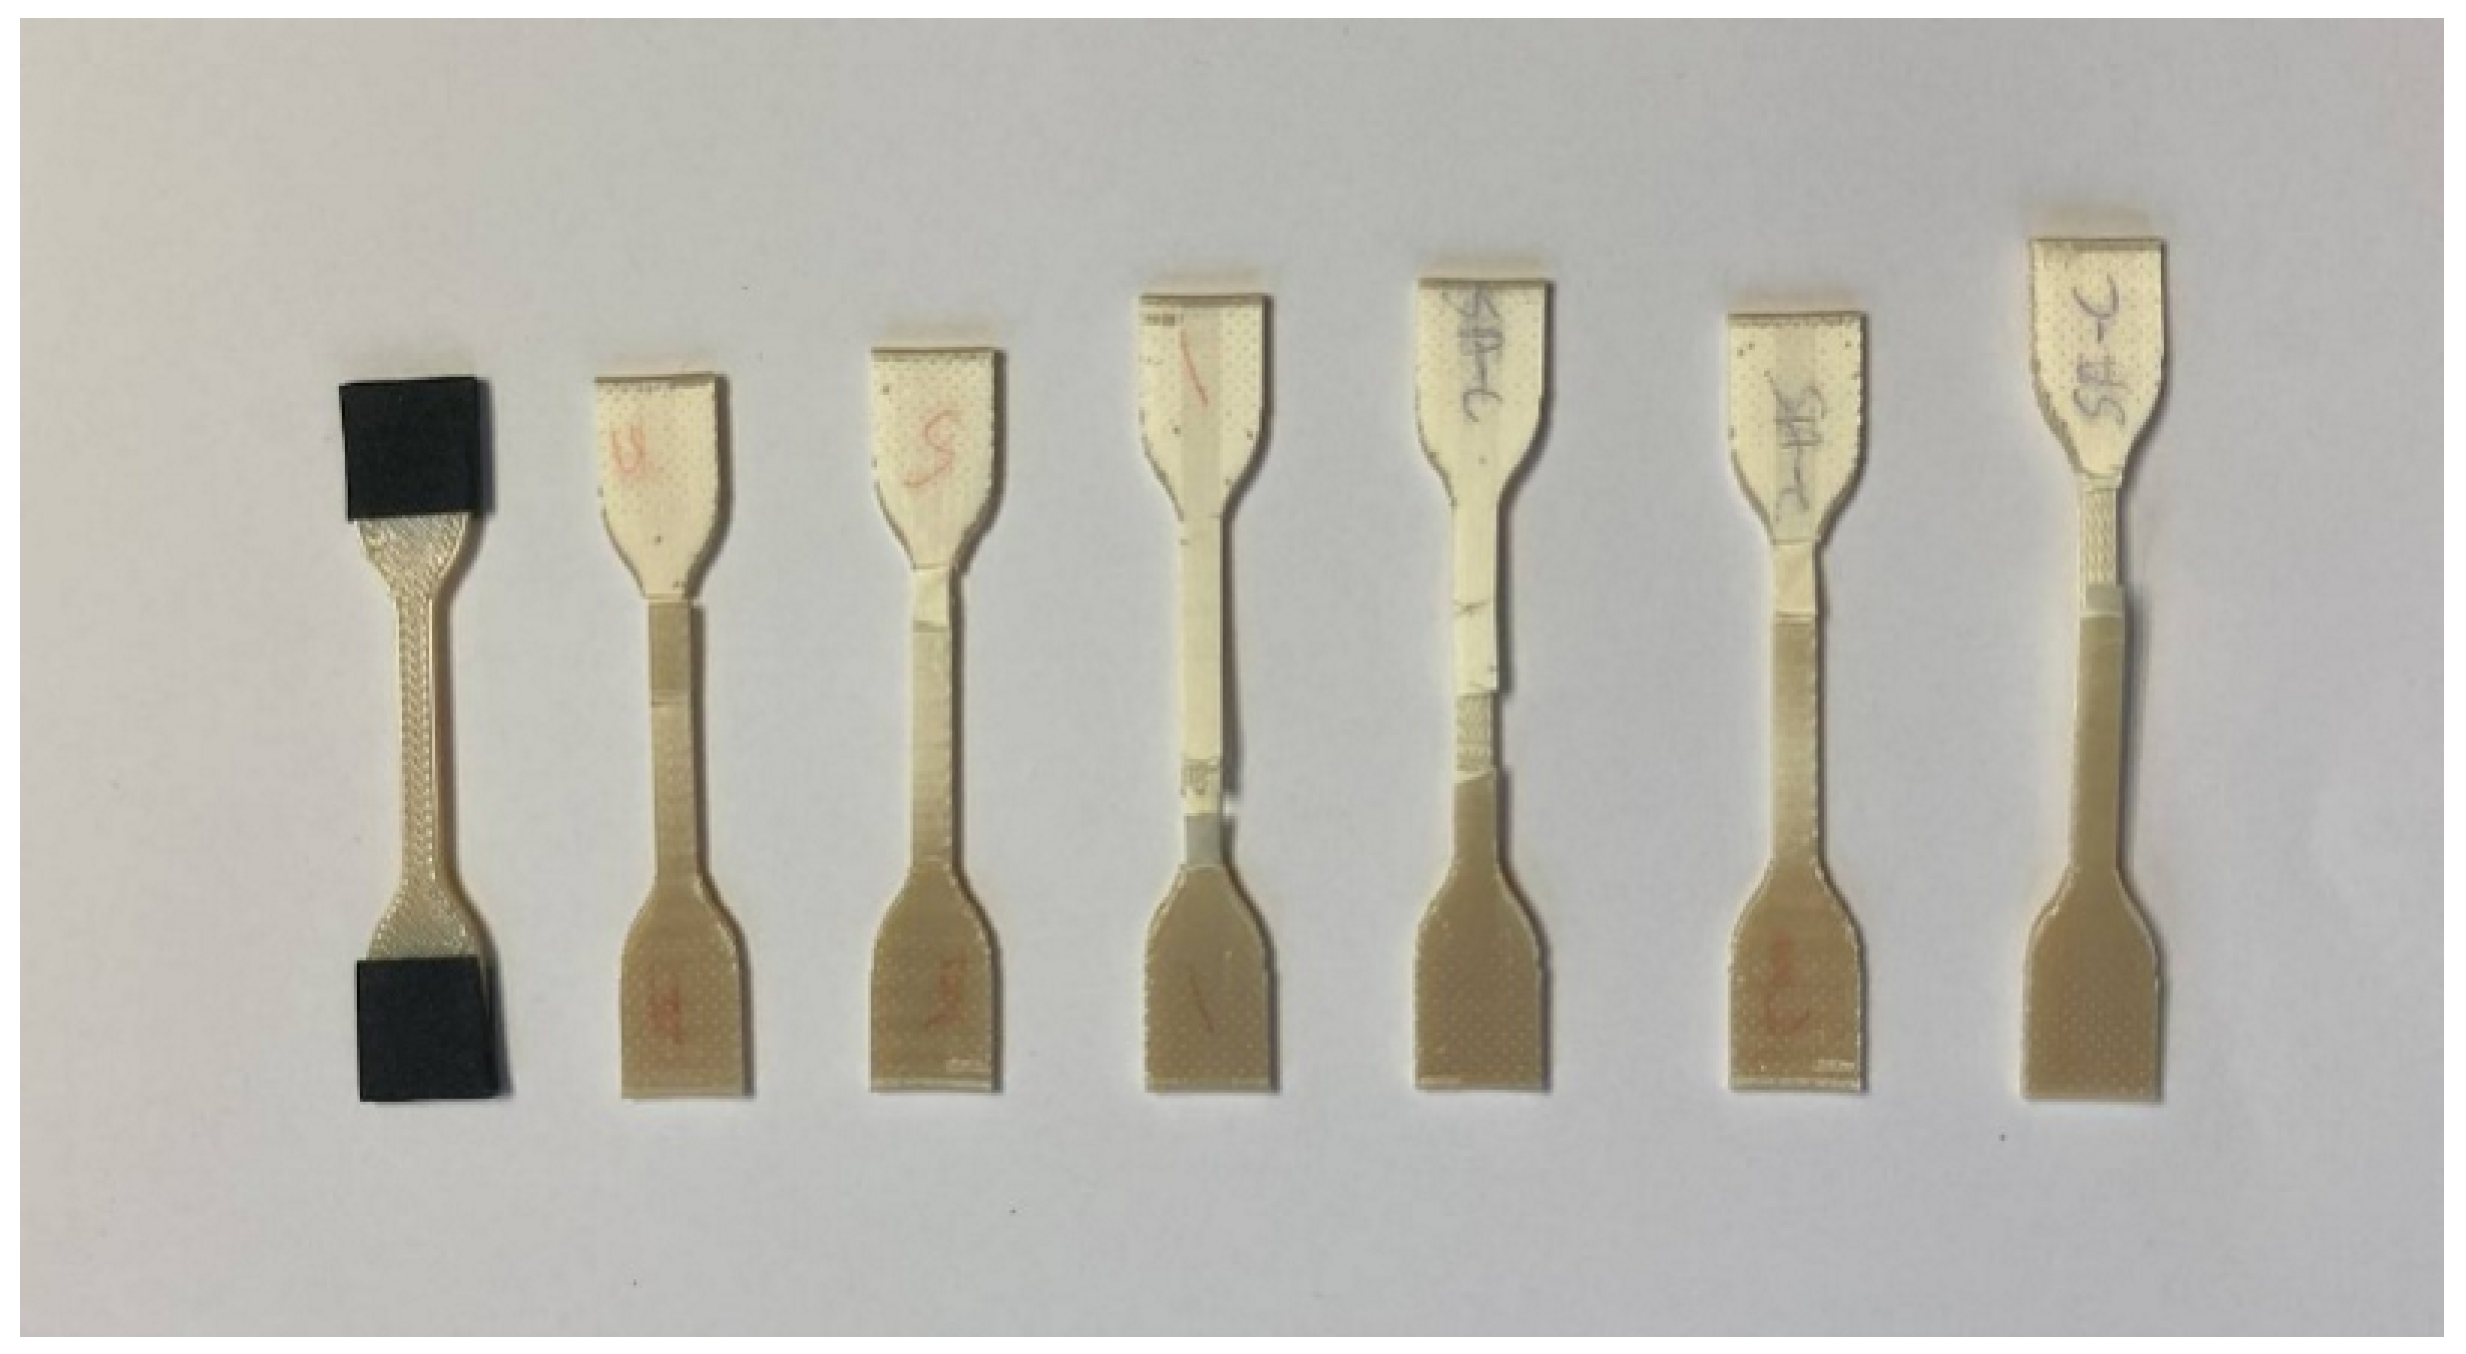
A picture of the 5A samples is shown in
Figure 6. The wall layer was separated, not the filling, and the sample broke perpendicular to the layer deposition after being stretched too far. In some cases, the total length of the sample stretched from 75 mm to nearly 90 mm.
The tensile test results for ULTEM™ 1010, as shown in
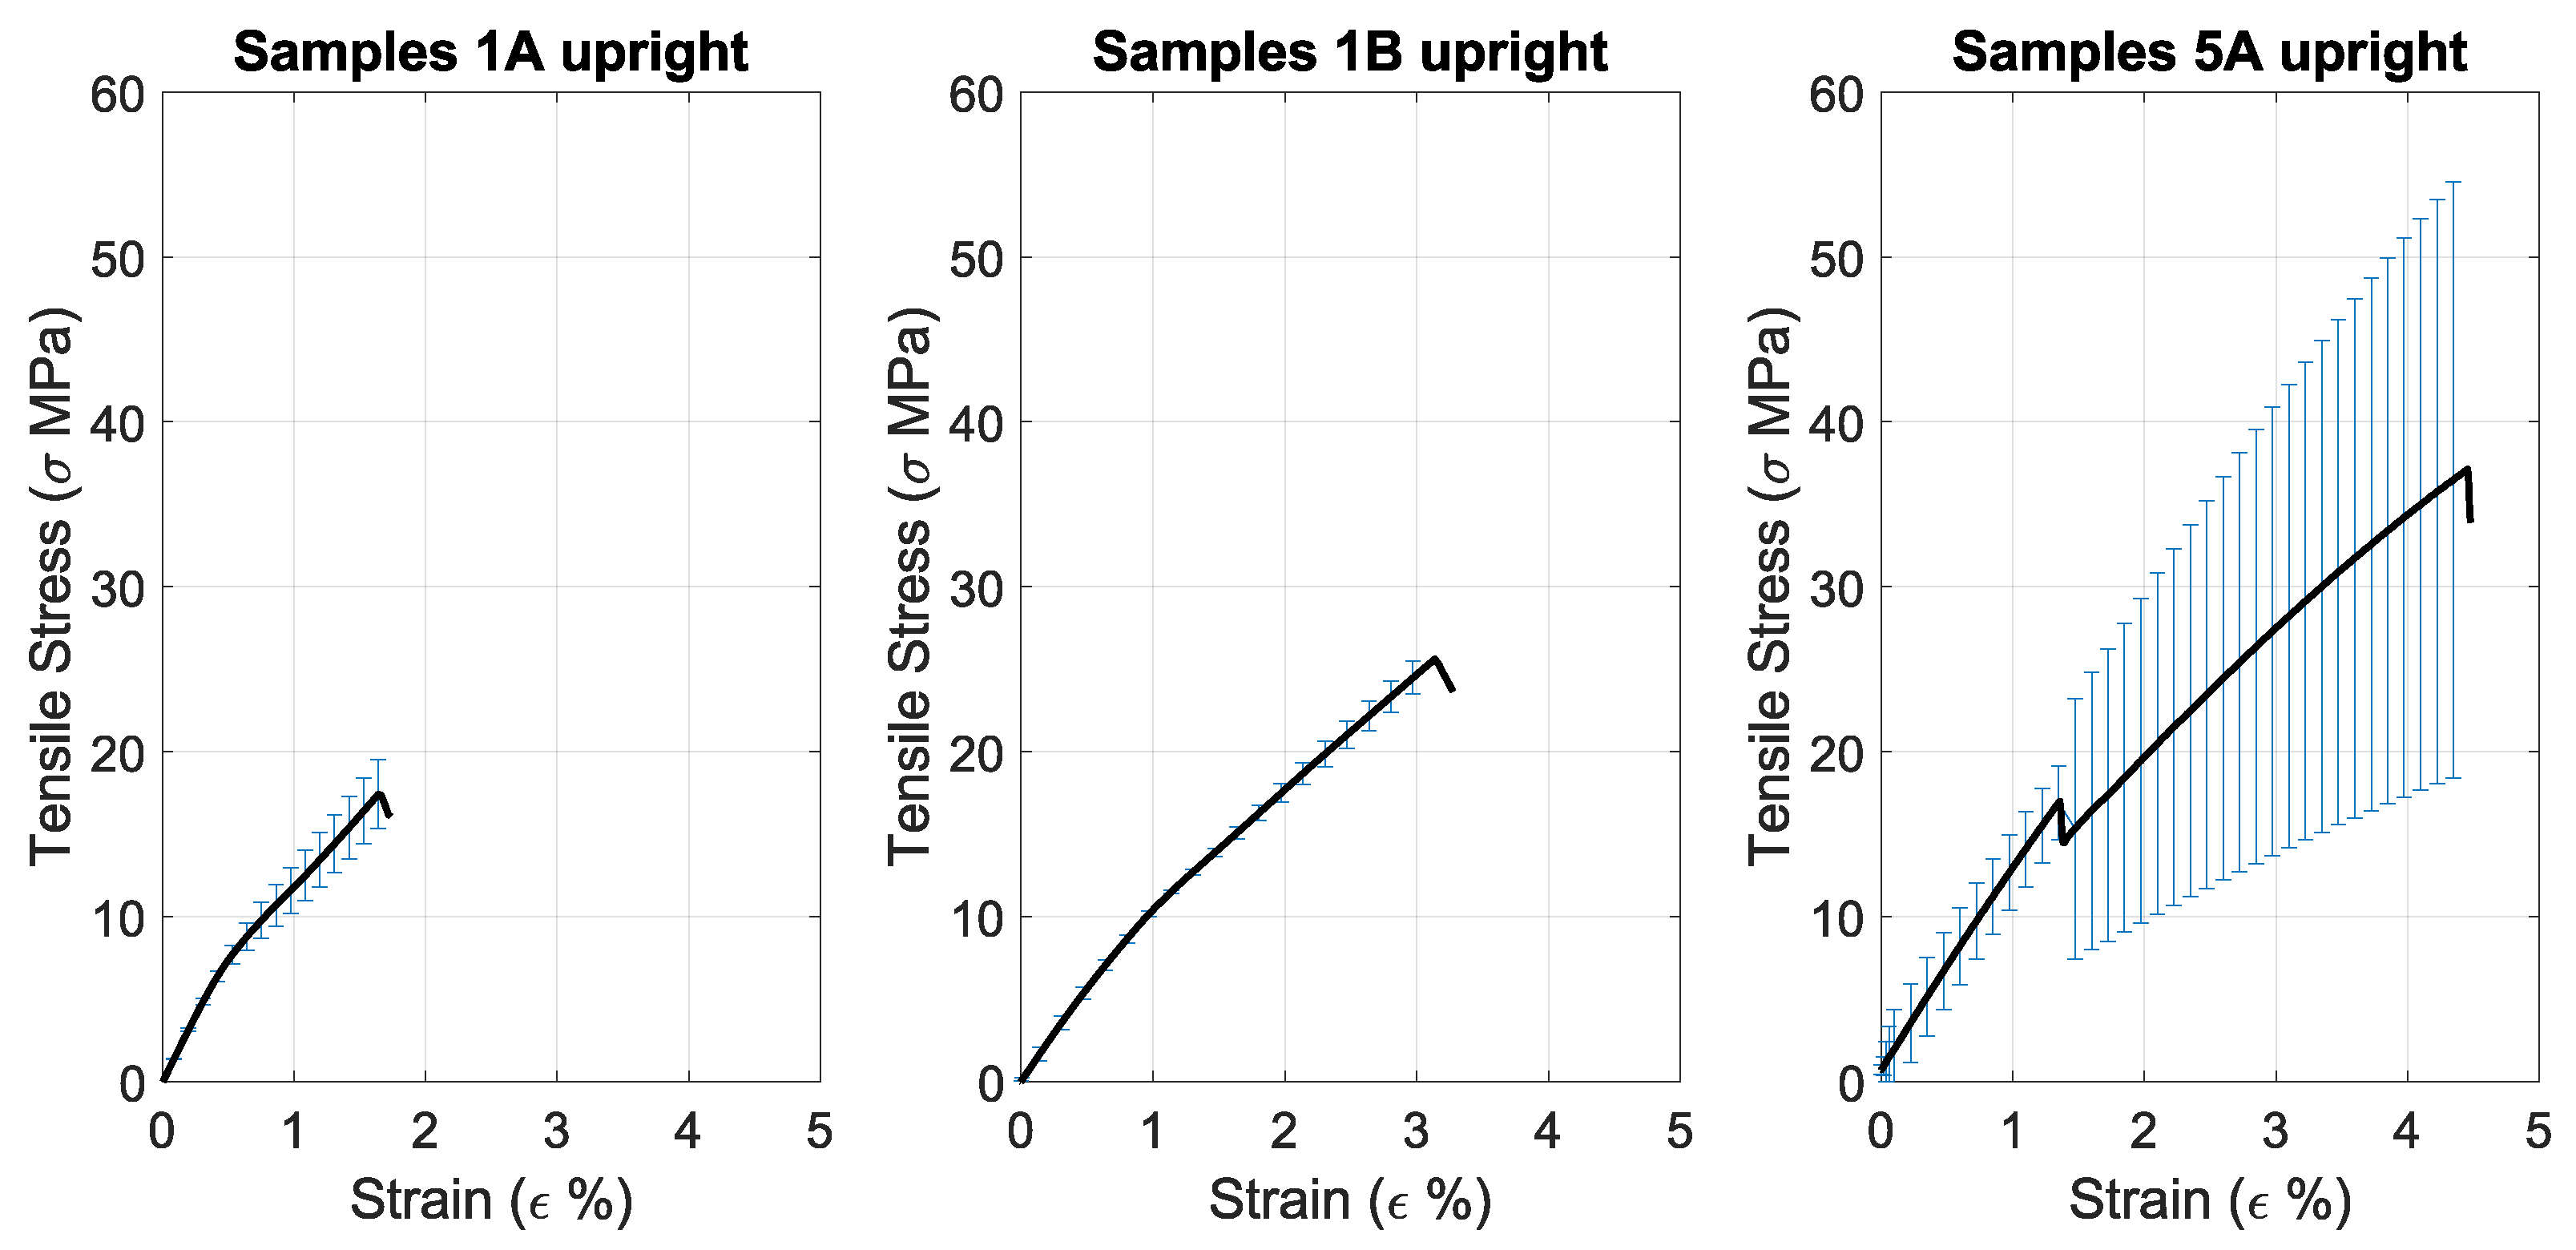
Table 4, indicate that the elastic modulus was similar for the 1A and 5A samples but lower for the 1B samples. The yield strength was similar for the 1A and 1B samples but higher for the 5A samples, while the ultimate strength was also similar for the 1A and 1B samples. The modulus results remained quite constant among the same type of specimen.
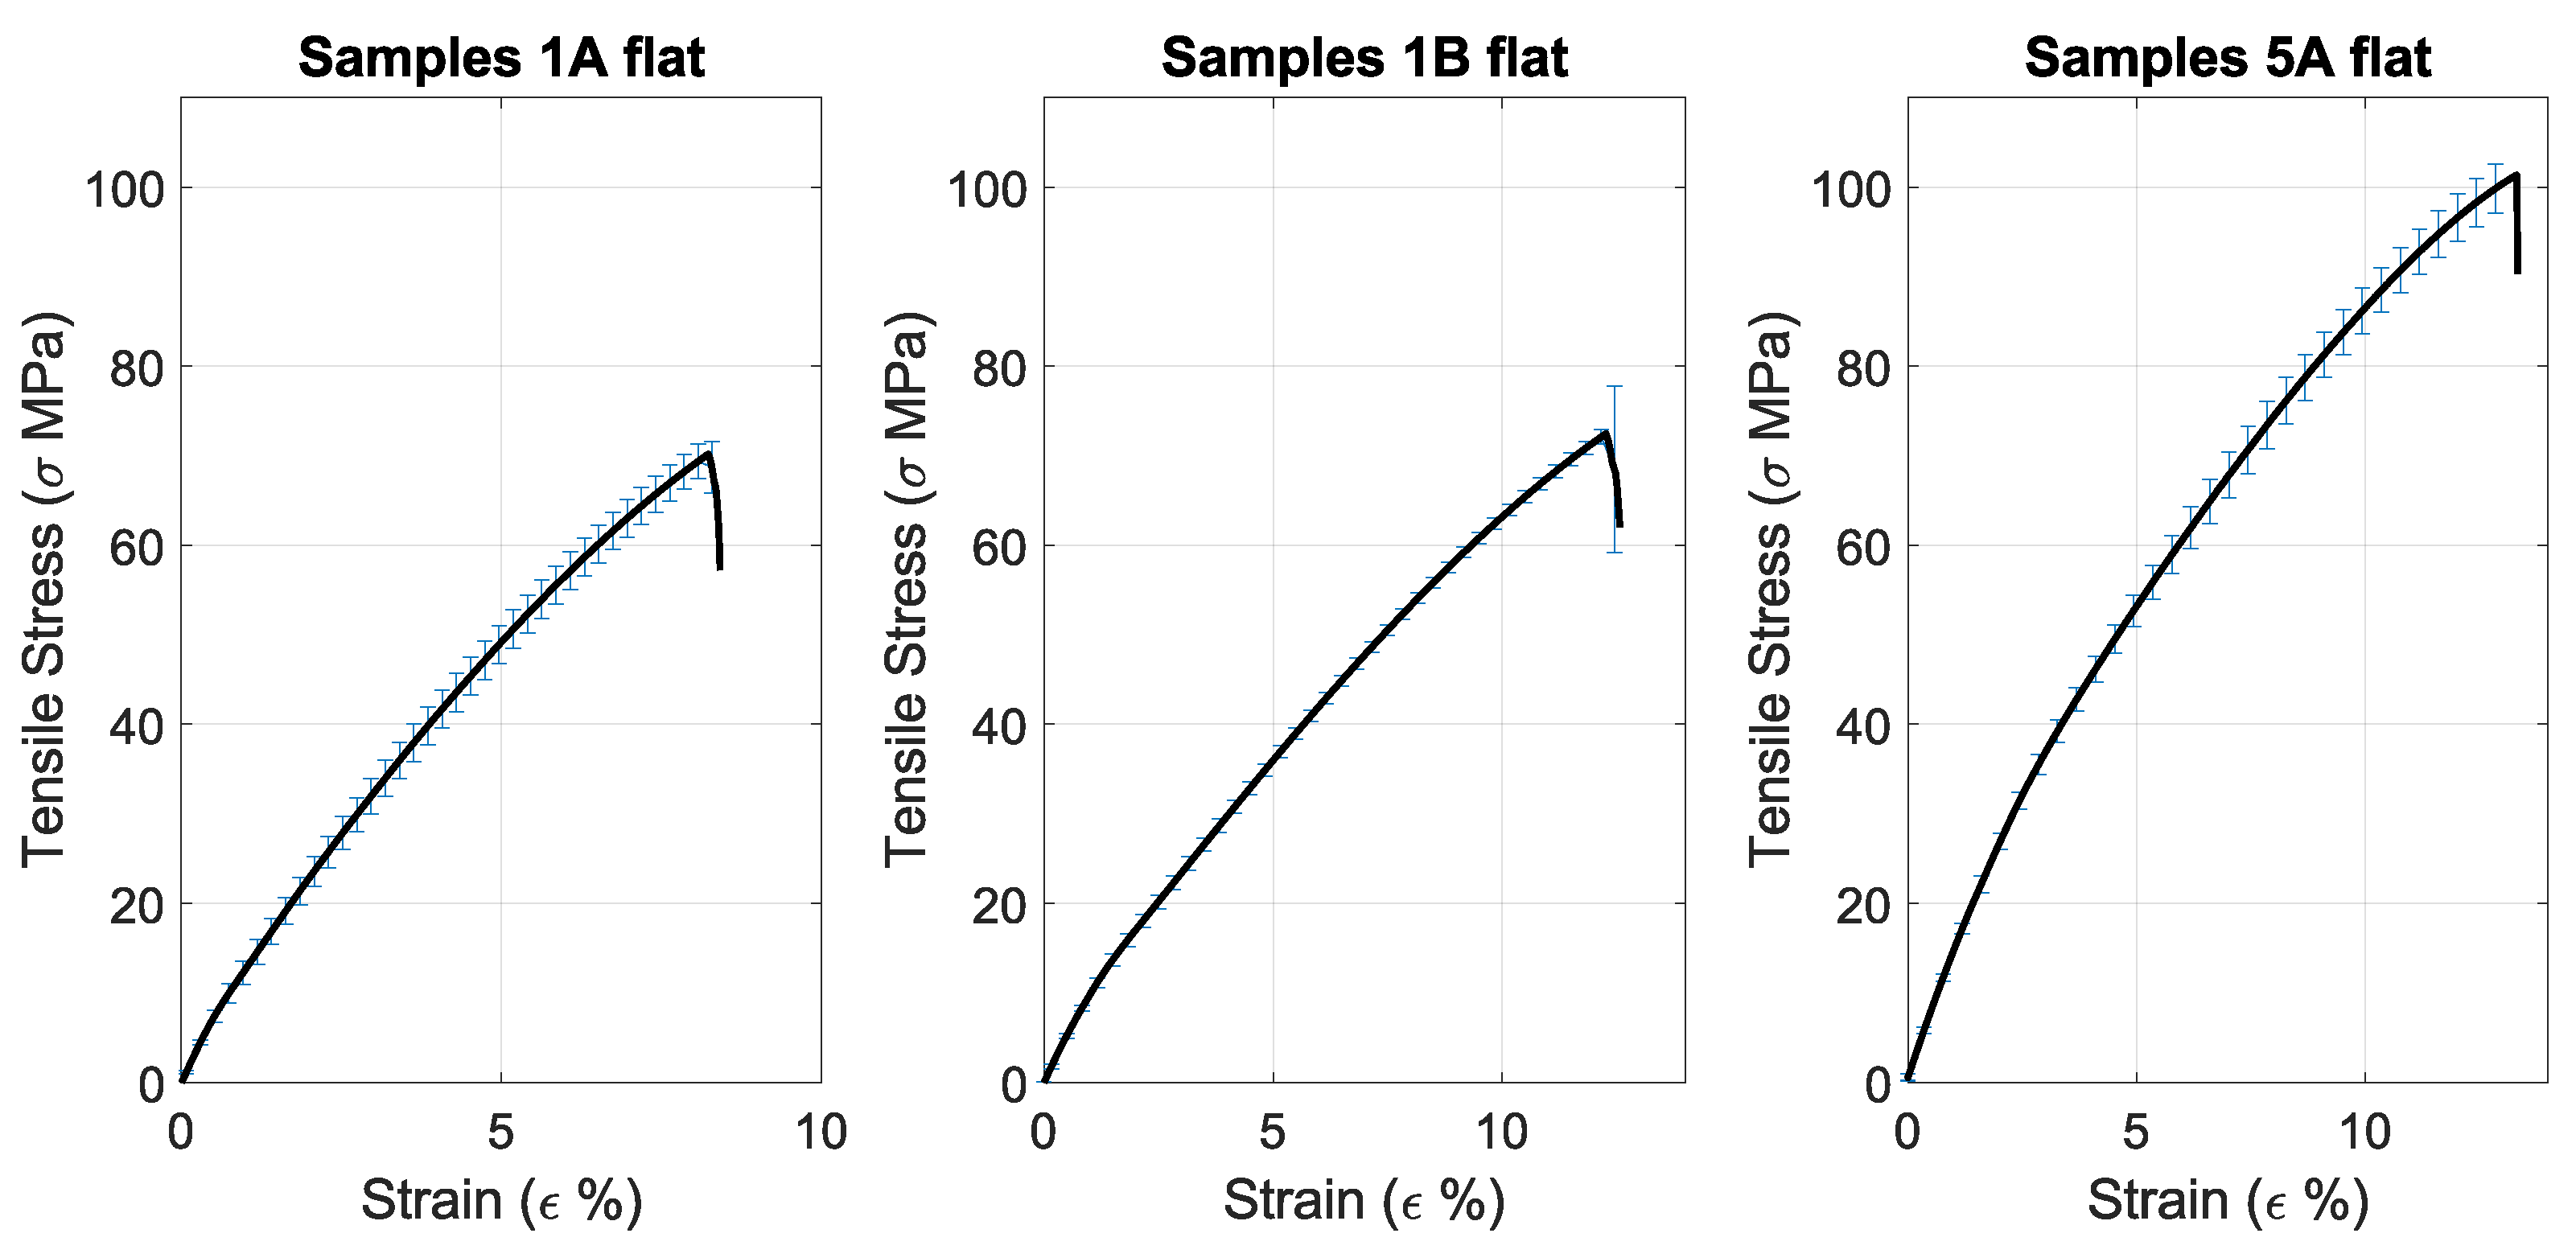
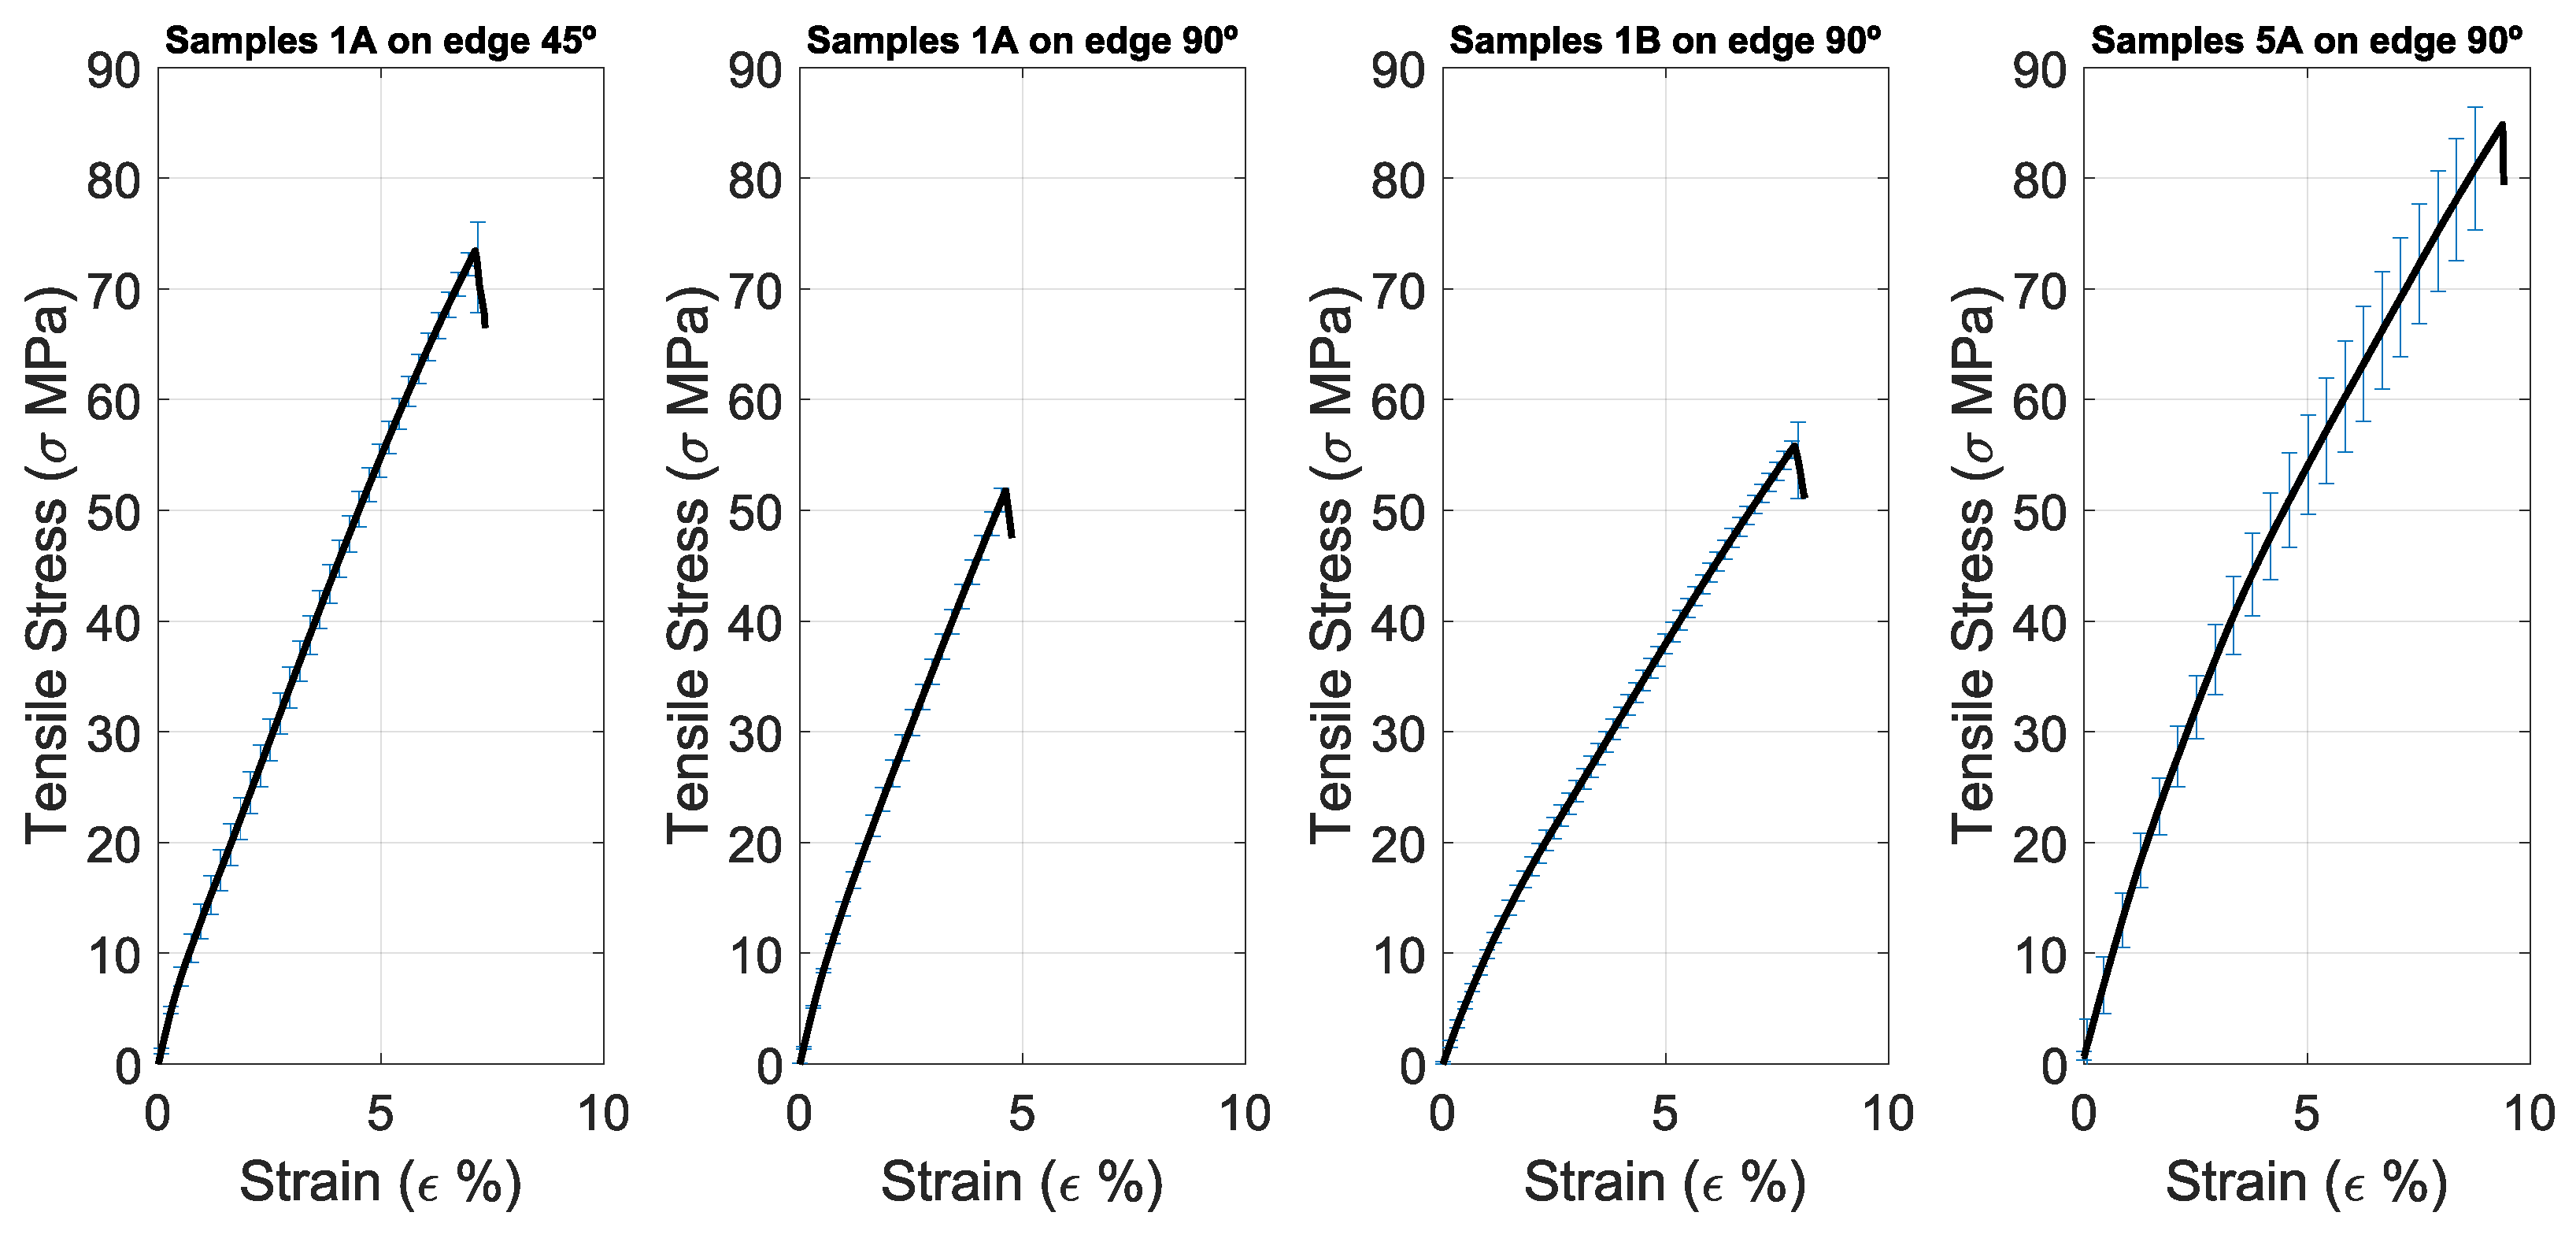
Examining each type of sample (see
Figure 7,
Figure 8 and
Figure 9), it can be observed that the 1B and 5A samples have similar curves for the three types of orientations, except for the upright 5A sample. In the 5A samples, only the flat and on-edge curves are nearly identical, with the on-edge sample failing earlier than the flat sample. For 1B, the curves are similar but with different failure points. The failure point of the upright samples appears much sooner. For all three types, the flat sample has the latest fracture point, which also corresponds with the ultimate tensile strength.
The difference in elastic modulus between the ULTEM™ 1010 sample types in both materials is striking. The elastic modulus is an intrinsic property and should not be directly altered by shape. However, as the materials are anisotropic, with properties that vary with direction, the shape can dictate the orientation of stress relative to the material’s natural stiffness directions. This can lead to variations in the elastic modulus depending on the loading direction relative to the material’s geometry. Specimens 1A and 5A have a shorter (and more similar) curved region in comparison with specimen 1B, which may alter the perceived stiffness of the samples. The curved region is not the same in both sample types, which may be the reason for the difference between 1A and 5A in the ULTEM™ 9085 results.
Among the distinct types of orientations in the 1A sample tests, the on-edge 90° had the best elastic modulus and yield strength, while the on-edge 45° (in
Figure 7) had better ultimate strength and the flat sample had higher deformation at the break. The tested samples for this type of specimen obtained comparable results overall, with low standard deviation and constant behavior. In the 1B samples, the highest elastic modulus is obtained by the upright samples, the highest yield strength by the on-edge, and the highest ultimate strength by the flat samples. For sample 5A, the flat specimens obtain the best elastic and ultimate tensile strength, while the on-edge samples have the highest yield strength. The results and behavior between the sample types do not correlate, only in the case of the yield strength being higher in the on-edge 90° samples, possibly due to the anisotropic properties of the material.
As with ULTEM™ 9085, the comparison with the datasheet is with on-edge 45°. In tensile tests for ULTEM™ 1010, it was observed that the tested samples performed worse elastically compared to the datasheet. The average elastic modulus achieved was half of what was stated in the datasheet, while the ultimate strength was similar to the datasheet, and deformation at break was higher in our case. The sample is also not meant to yield. Pandelidi [
26], in their research, looked into the tensile strength and modulus of ULTEM™1010 specimens in the same flat and on-edge configurations. The results obtained for the modulus are around 0.5 GPa lower than the values presented, while the tensile strength is between 4 and 14 MPa lower.
3.2. Flexural Test
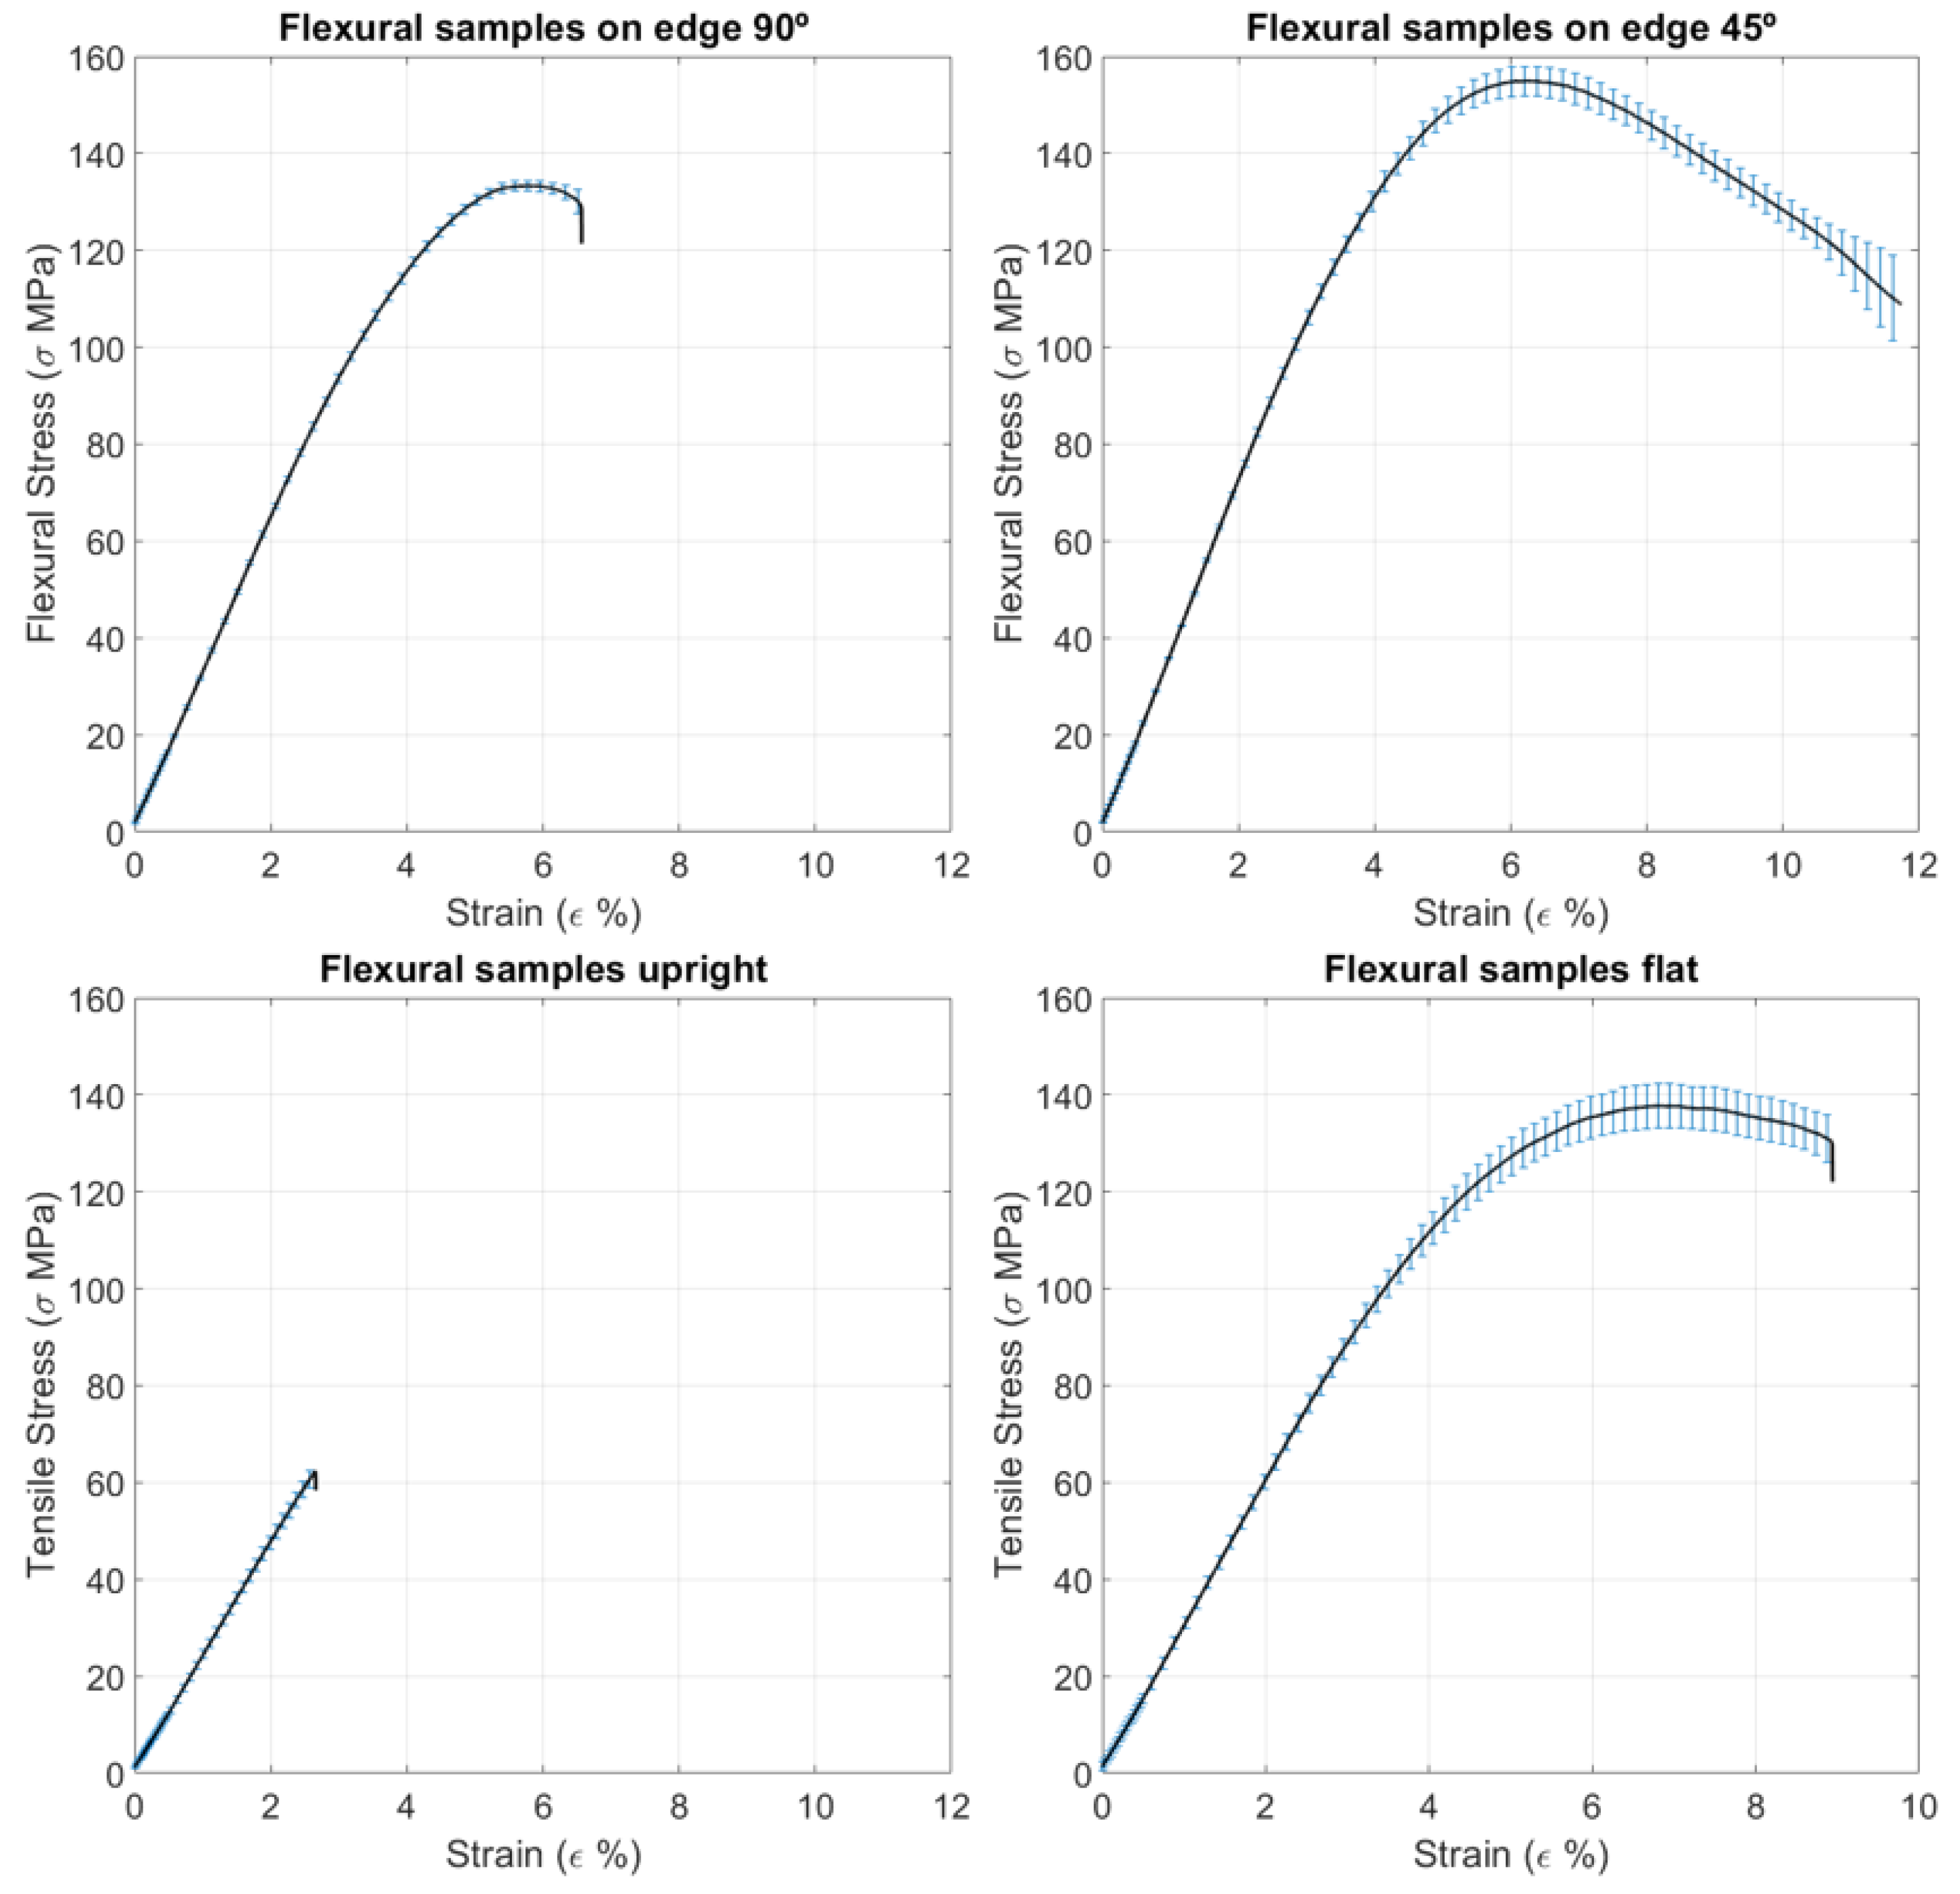
The flexural tests for ULTEM™ 9085 (see
Table 5 and
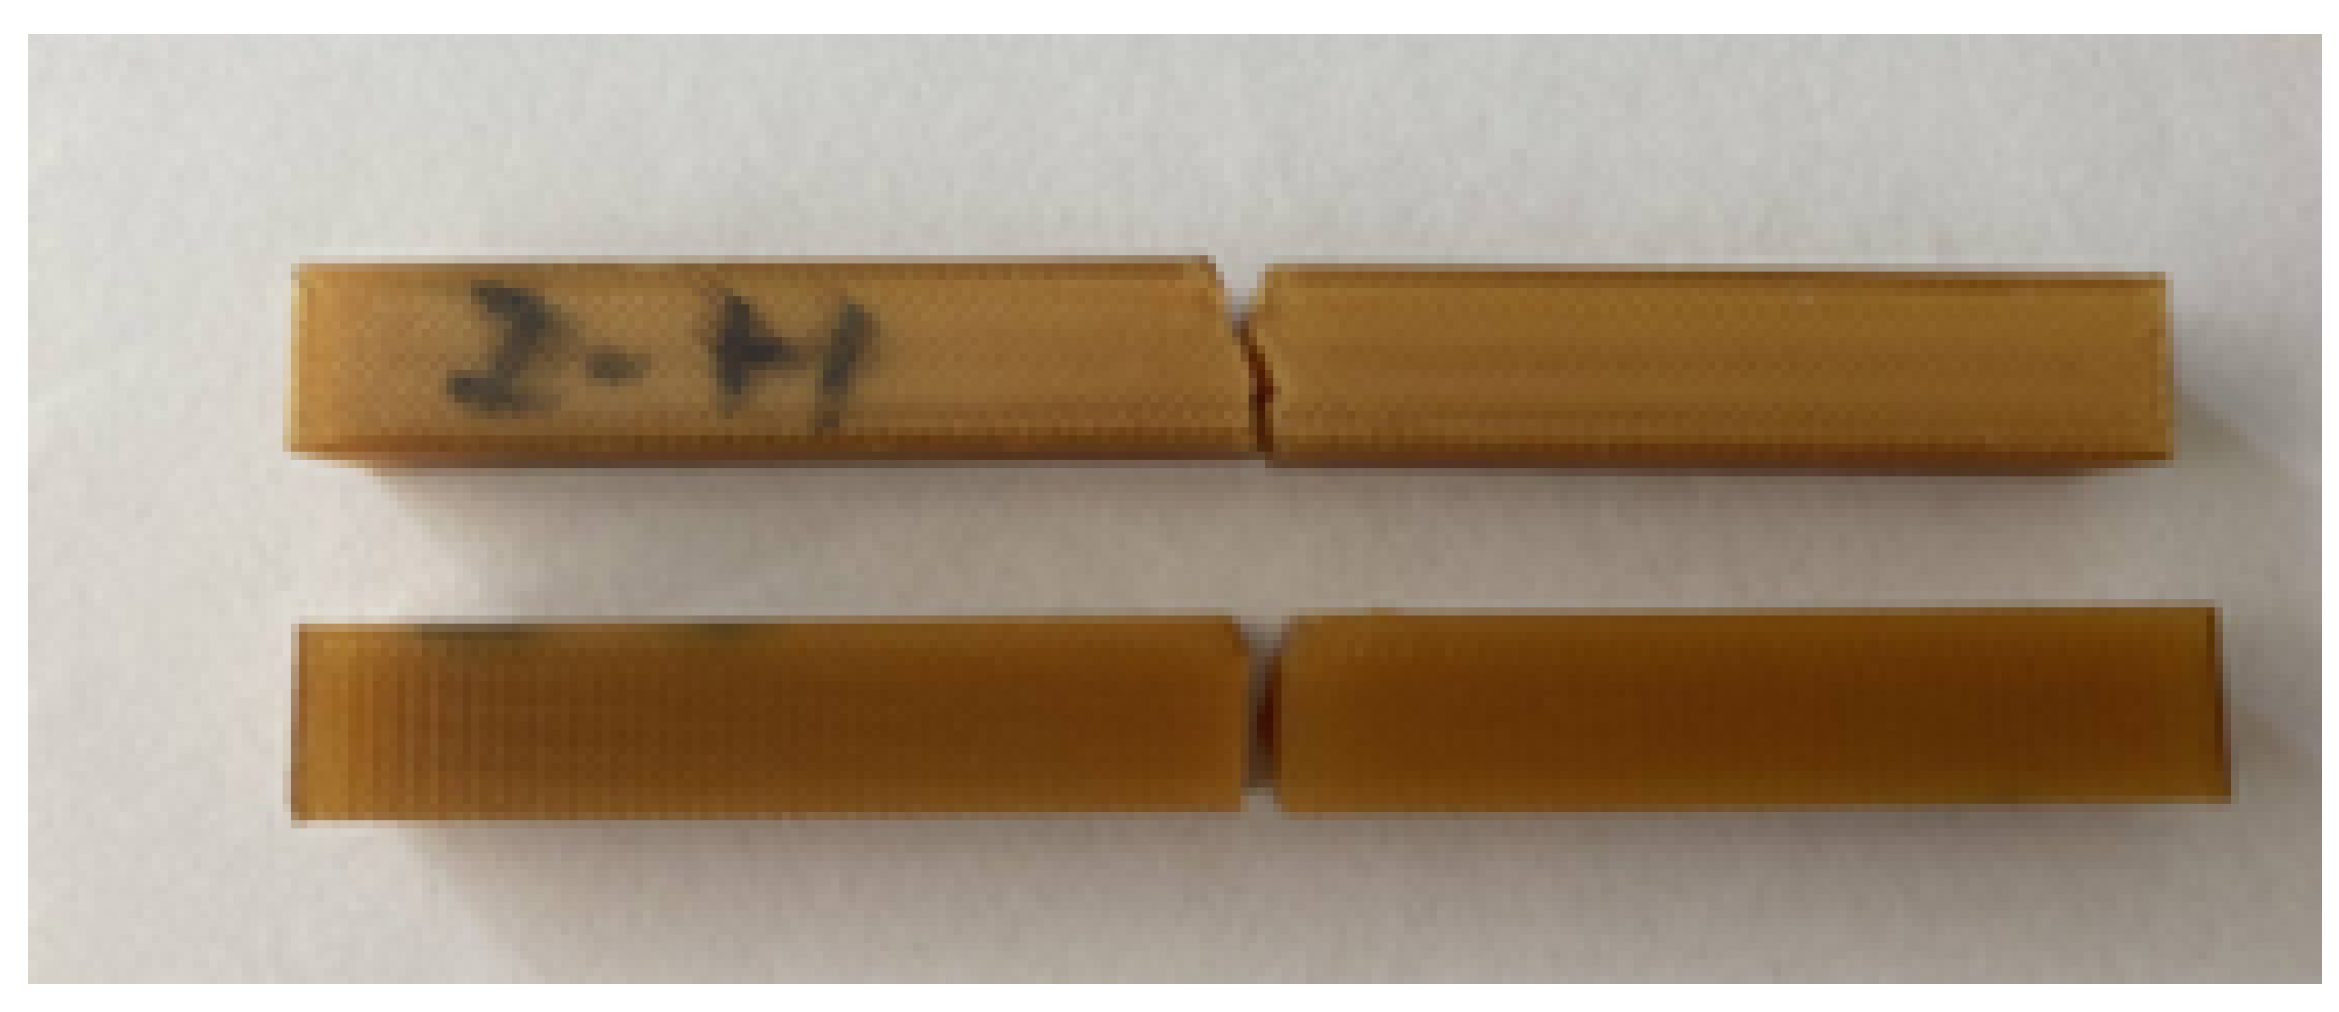
Figure 10) show similar results as the tensile tests, where the upright specimens had worse results overall and on-edge specimen (especially 45° orientation) the best. The on-edge 45° sample is the only one that did not break (although one of the samples in the batch did crack), while the on-edge 90° samples did not break apart.
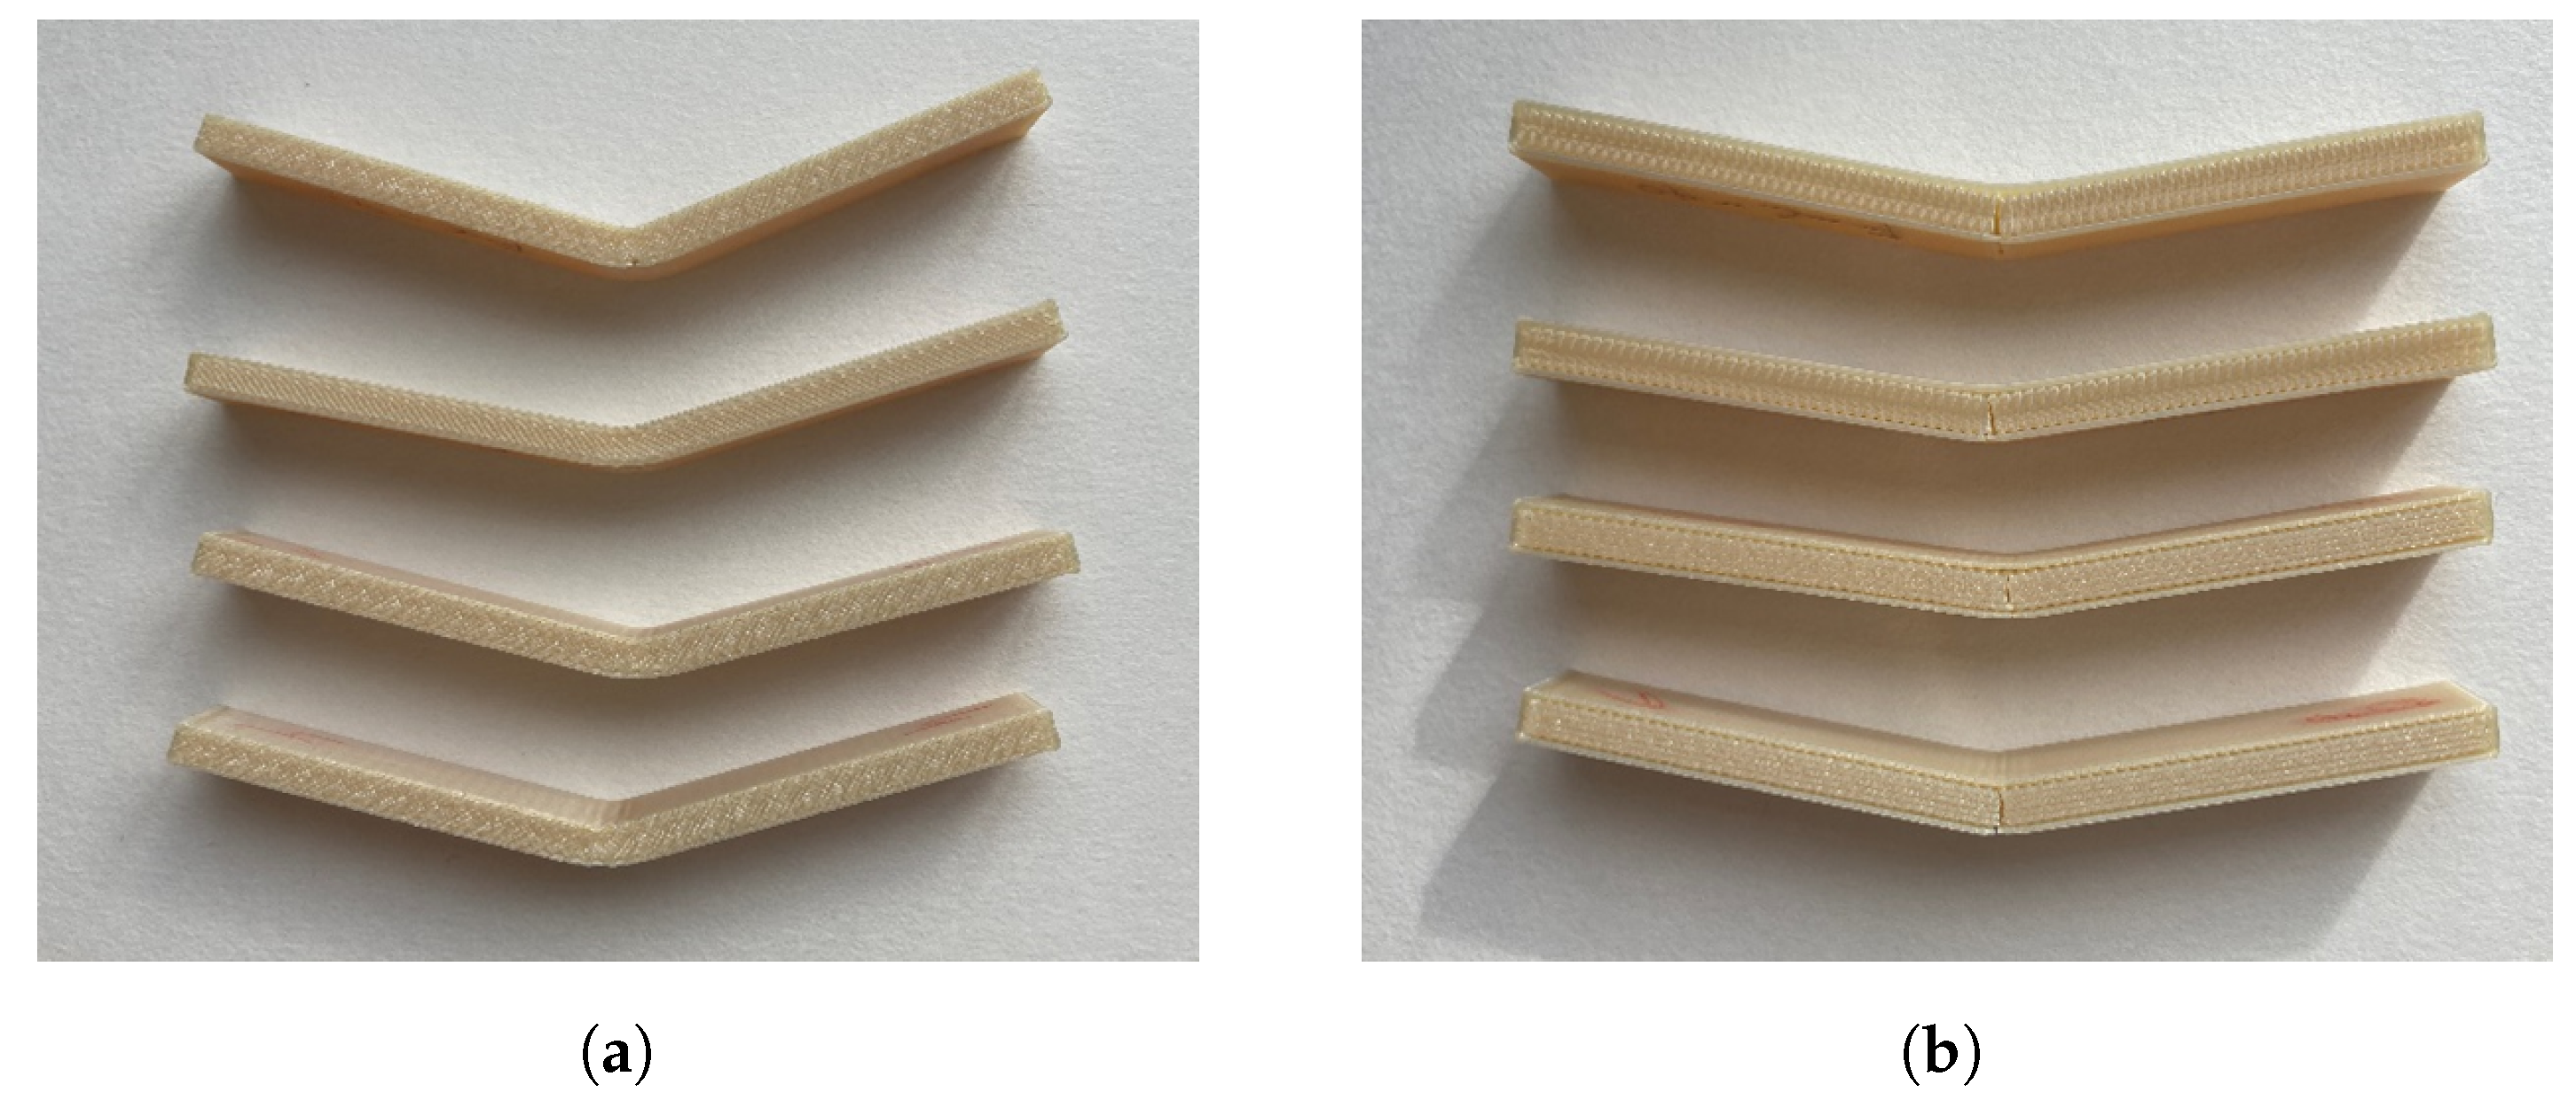
In comparison with the datasheet, the flexural modulus obtained on the on-edge 45° samples was higher than the reference value, as was the flexural strength. Both in the tests and the datasheet, the sample does not break, as can be seen in
Figure 11a. In
Figure 11b, the on-edge 90° samples can be seen cracking but not completely breaking. In the research done by Byberg [
25], the values obtained for flexural strength are lower than the results obtained here. The closest values are obtained in the on-edge 90° samples, with a 7.5% variation, while the biggest happens in the on-edge 45° samples (25.5%).
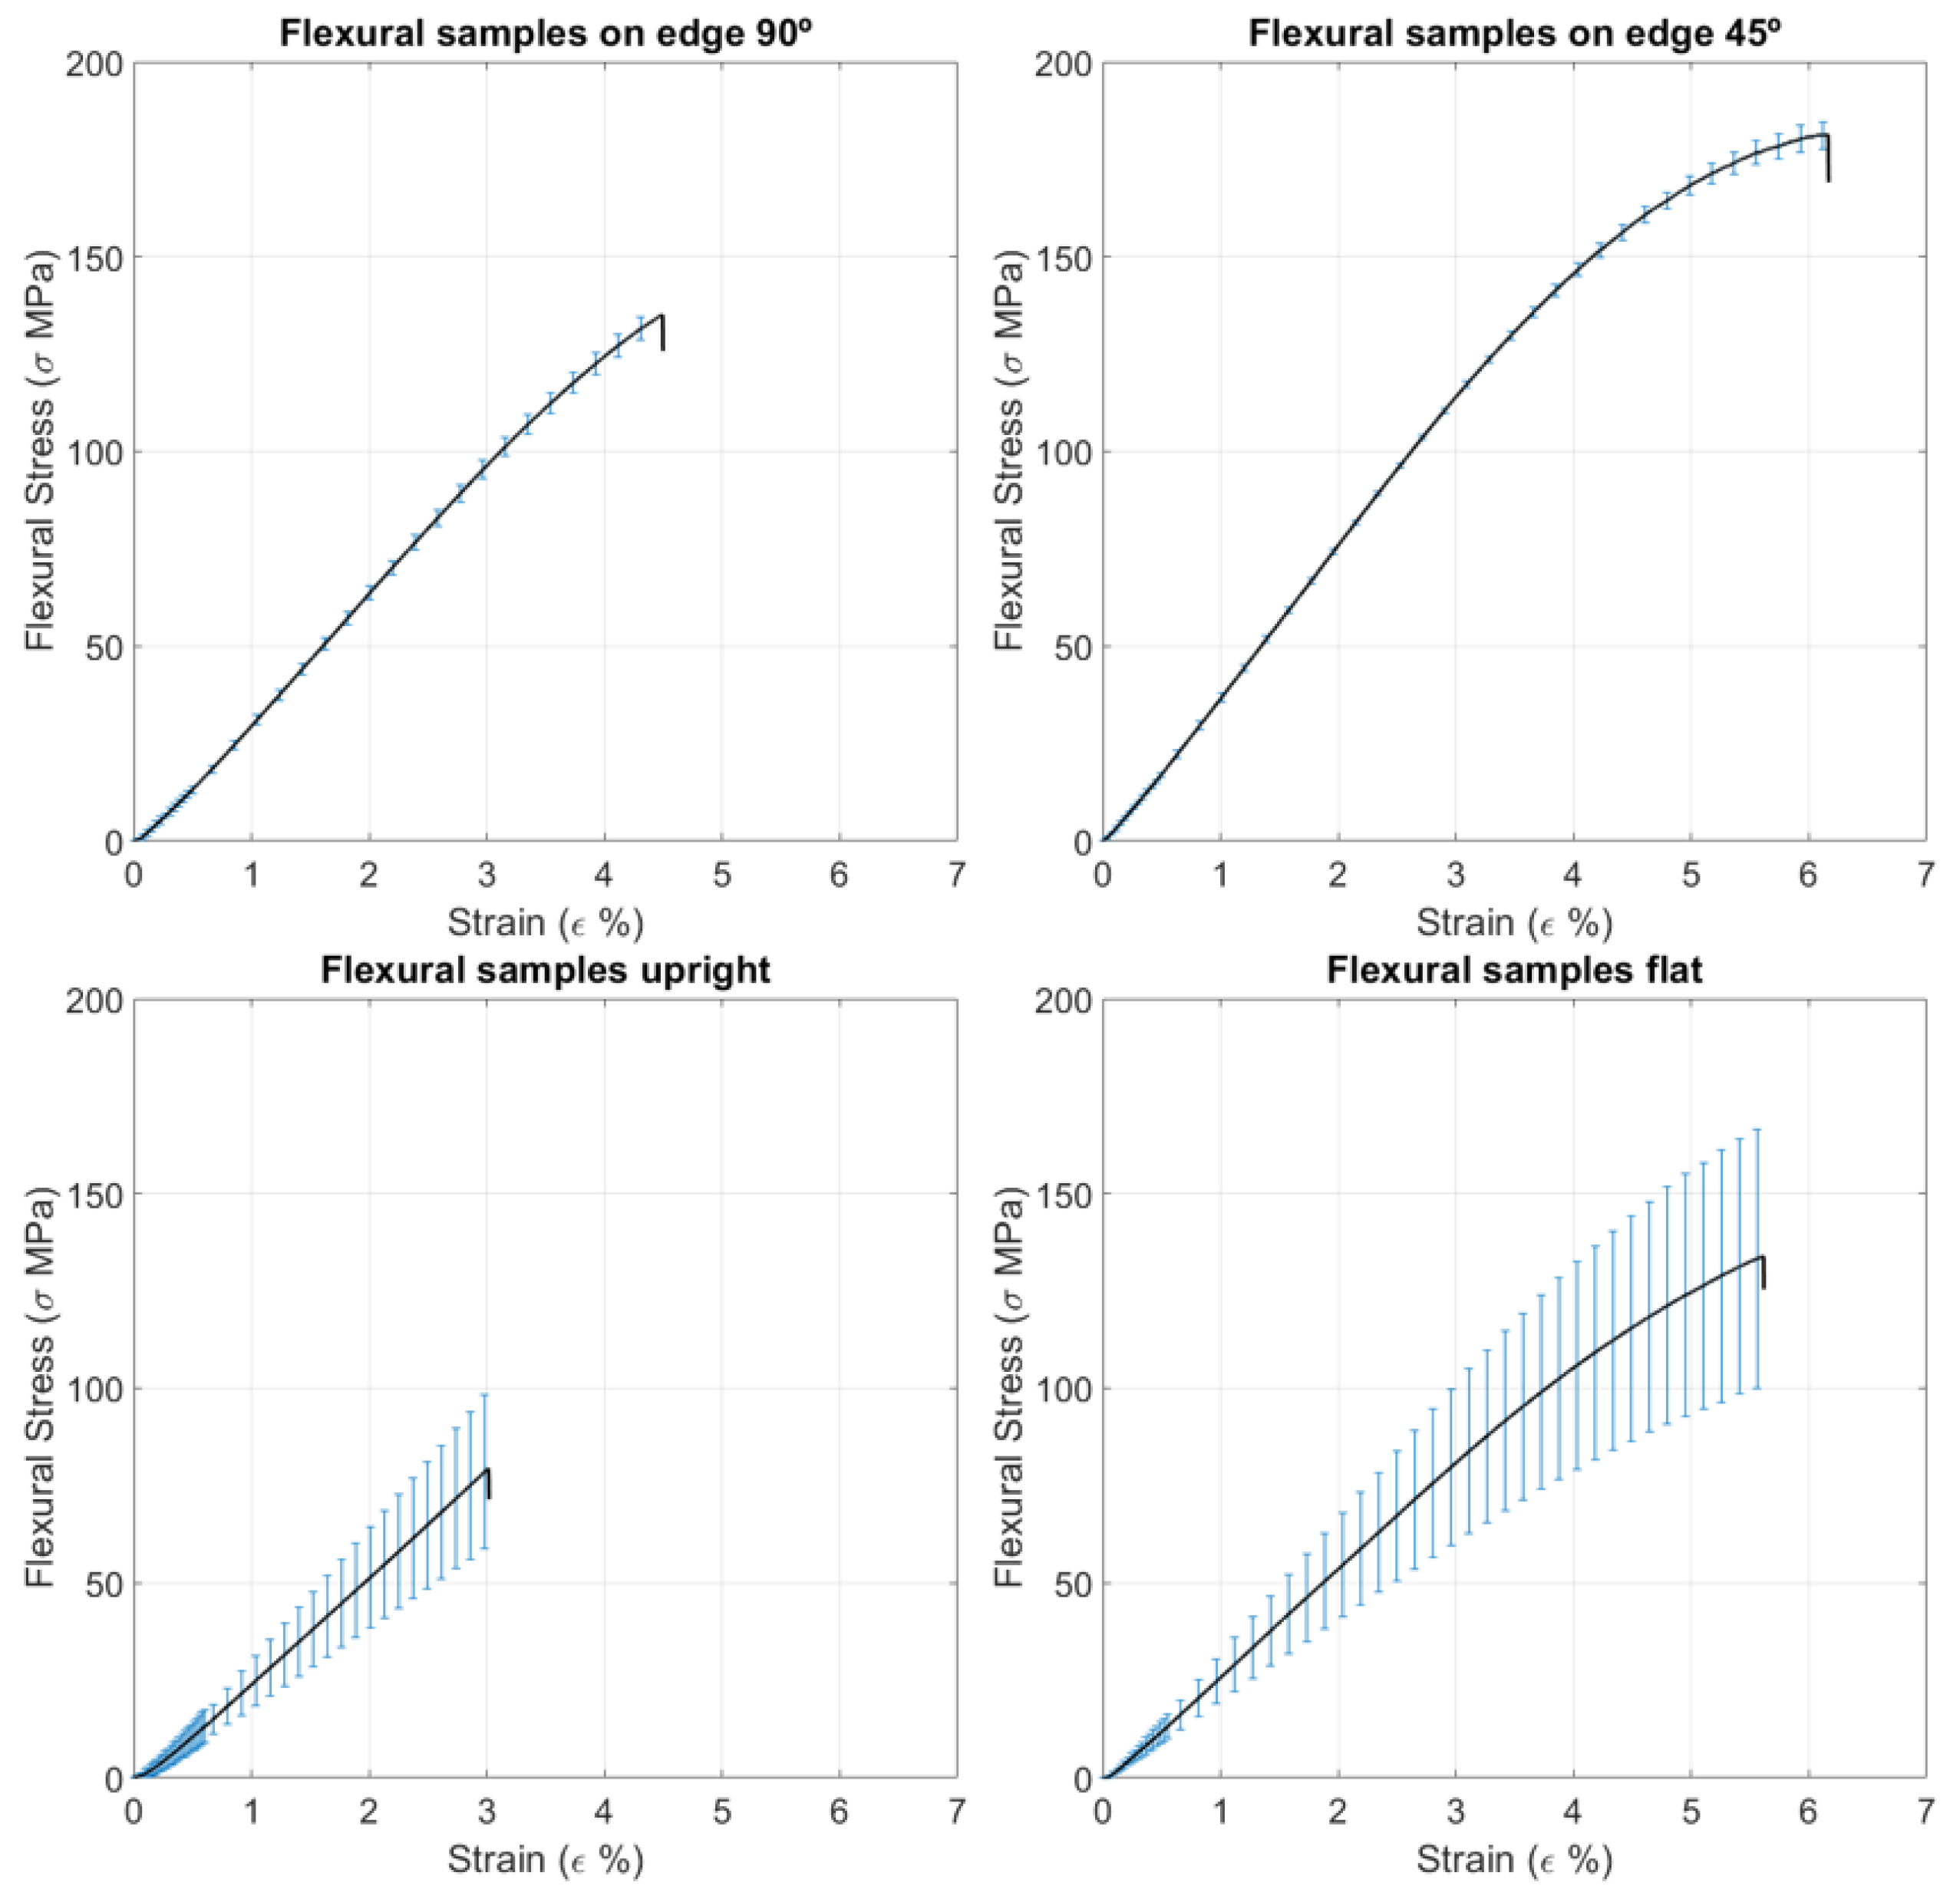
Regarding the flexural tests of ULTEM™ 1010 (see
Table 6), unlike with the ULTEM™ 9085, the on-edge 90° samples are the ones that show the highest elastic modulus, instead of the on-edge 45°, which does have the highest flexural strength.
Between samples, in
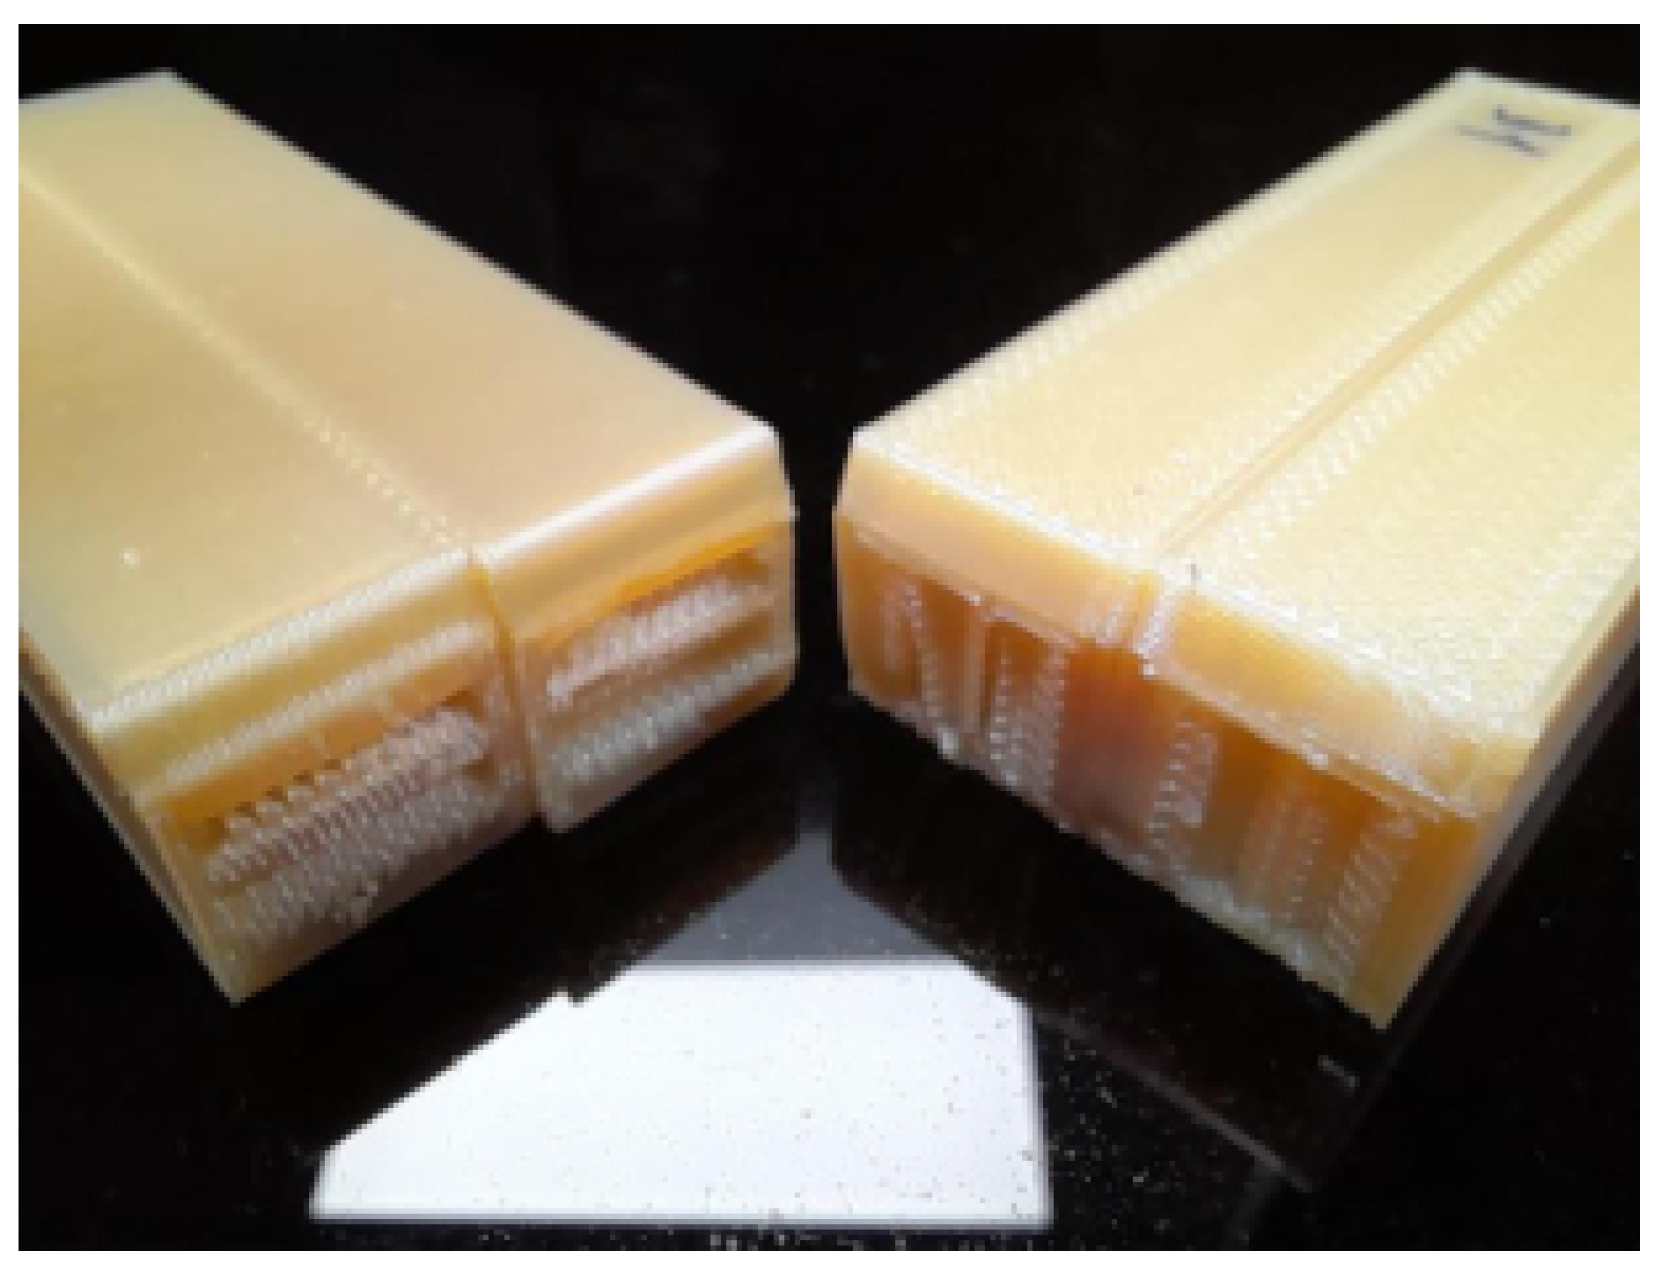
Figure 12, it can be seen how the upright and flat samples follow a similar trend (which can also be deduced from the similar elastic modulus), but the upright samples fail sooner, demonstrating a lower flexural strength. The on-edge 45° samples obtain consistent results with almost no variation.
In comparison with the datasheet, the on-edge 45° sample has a lower value. As with the tensile test, the main change is how the on-edge 45° samples break (as seen in
Figure 13), while the samples from Stratasys did not. For the upright sample, which does break according to the datasheet, the flexural strength is similar to our samples. For the samples that do not break, the datasheet gives the strength at 5% strain (130 MPa), which we can use to compare with our results. We can see that for the on-edge 45°, the strength at that point is higher than stated in the datasheet.
Both Taylor [
27] and Pandelidi [
26] looked into flexural properties of ULTEM™1010 in their research. In both articles, with the same samples tested, they obtain similar values for both the modulus, with the only exception being the modulus in the on-edge 90° samples. They obtain a 2.4 GPa and 2.5 GPa modulus versus the 3.4 GPa presented in this article. The values for yield strength obtained by Taylor are very similar to the ones obtained, while the values for flexural strength shown by Pandelidi are lower, with the notable case of the on-edge 90° samples, which is nearly 60% of the presented value.
3.3. Compression Test
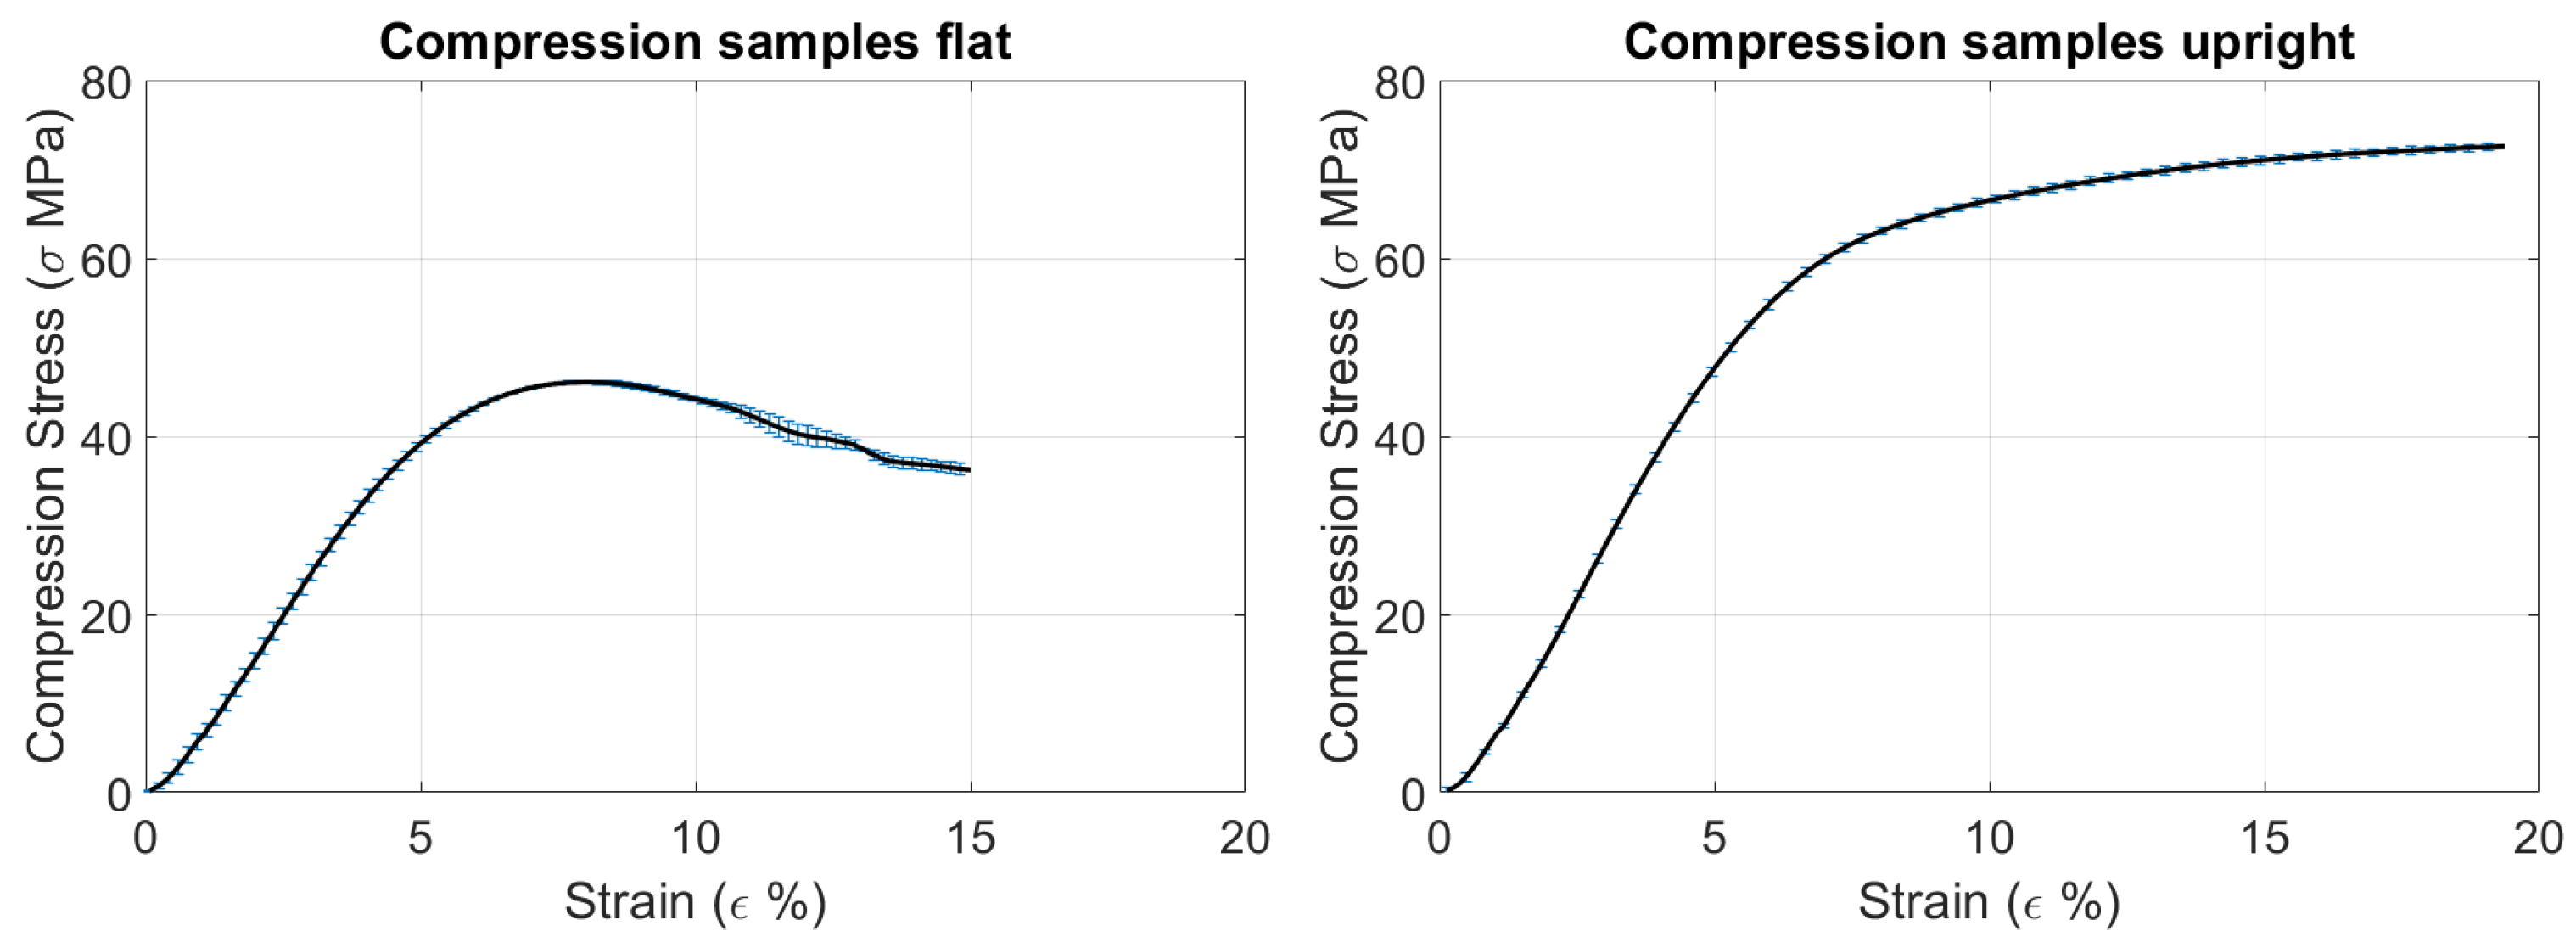
The compression tests for ULTEM™ 9085 show that the flat samples reach maximum stress at yield, showing typical behavior of tough and durable plastic, while the upright samples stay longer in the plastic region and obtain better results, most likely due to the direction of the force and the interlayer bond of the specimens. The upright samples seem to experience a slight strain hardening as the stress increases after yield. Two of the samples break once they reach ultimate strength and do not decrease, but the third one continues. The average results for the tests can be seen in
Table 7 and
Figure 14.
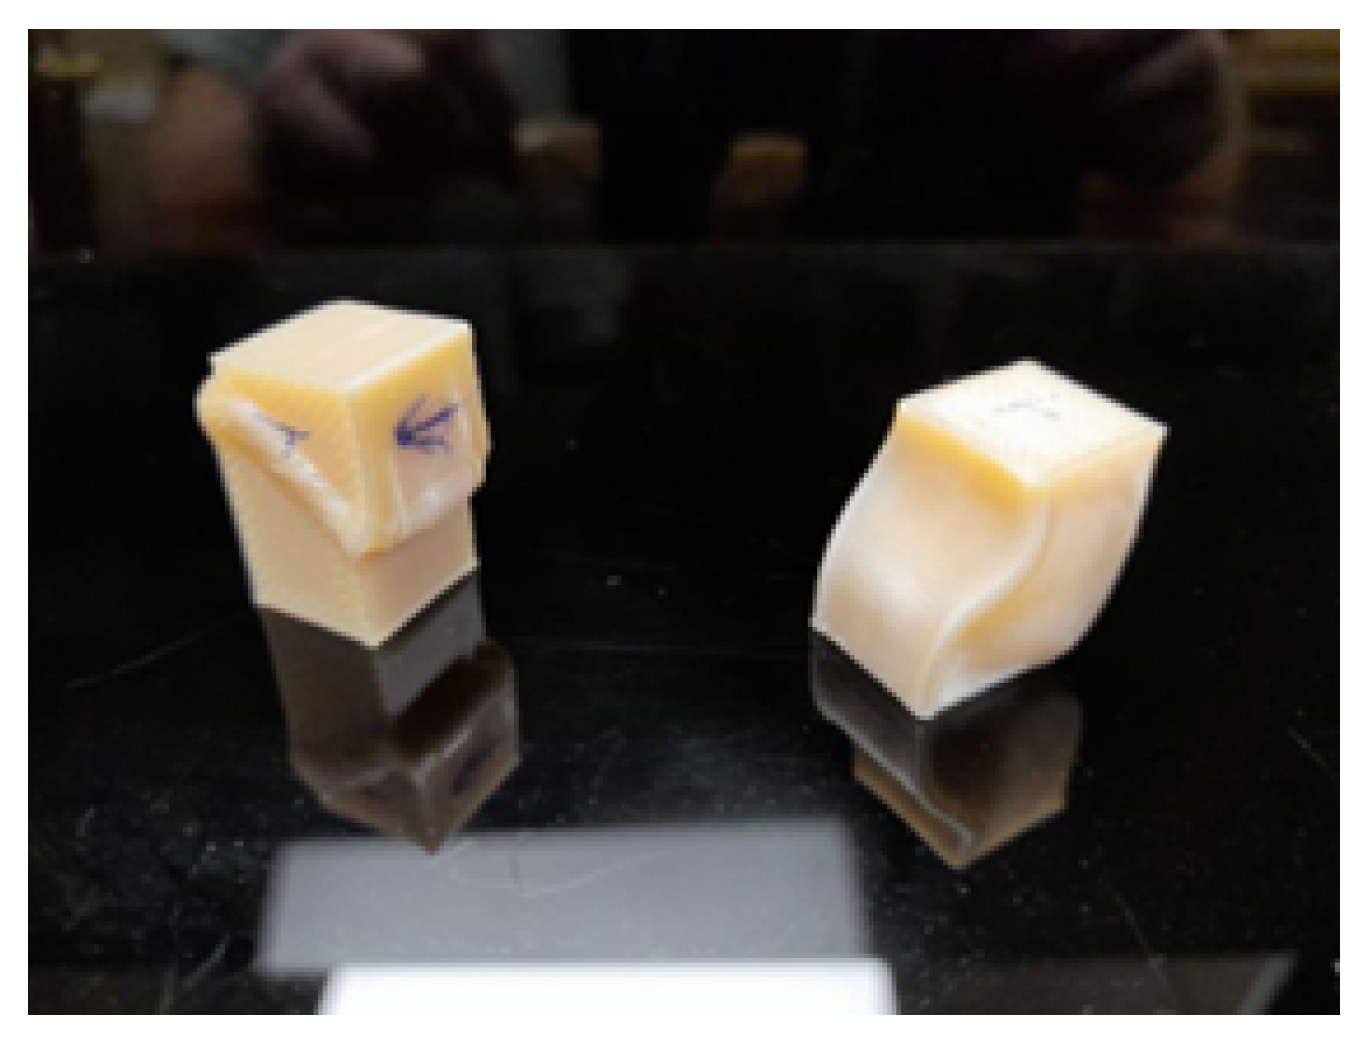
Figure 15 shows the samples after testing.
Byberg [
25] also looked into the compressive strength of ULTEM™ 9085 samples, although they used 10 × 10 × 4 mm samples. In their research, they obtained a value almost double the result obtained in this research for the horizontal samples, while the increase for the upright samples is 30%.
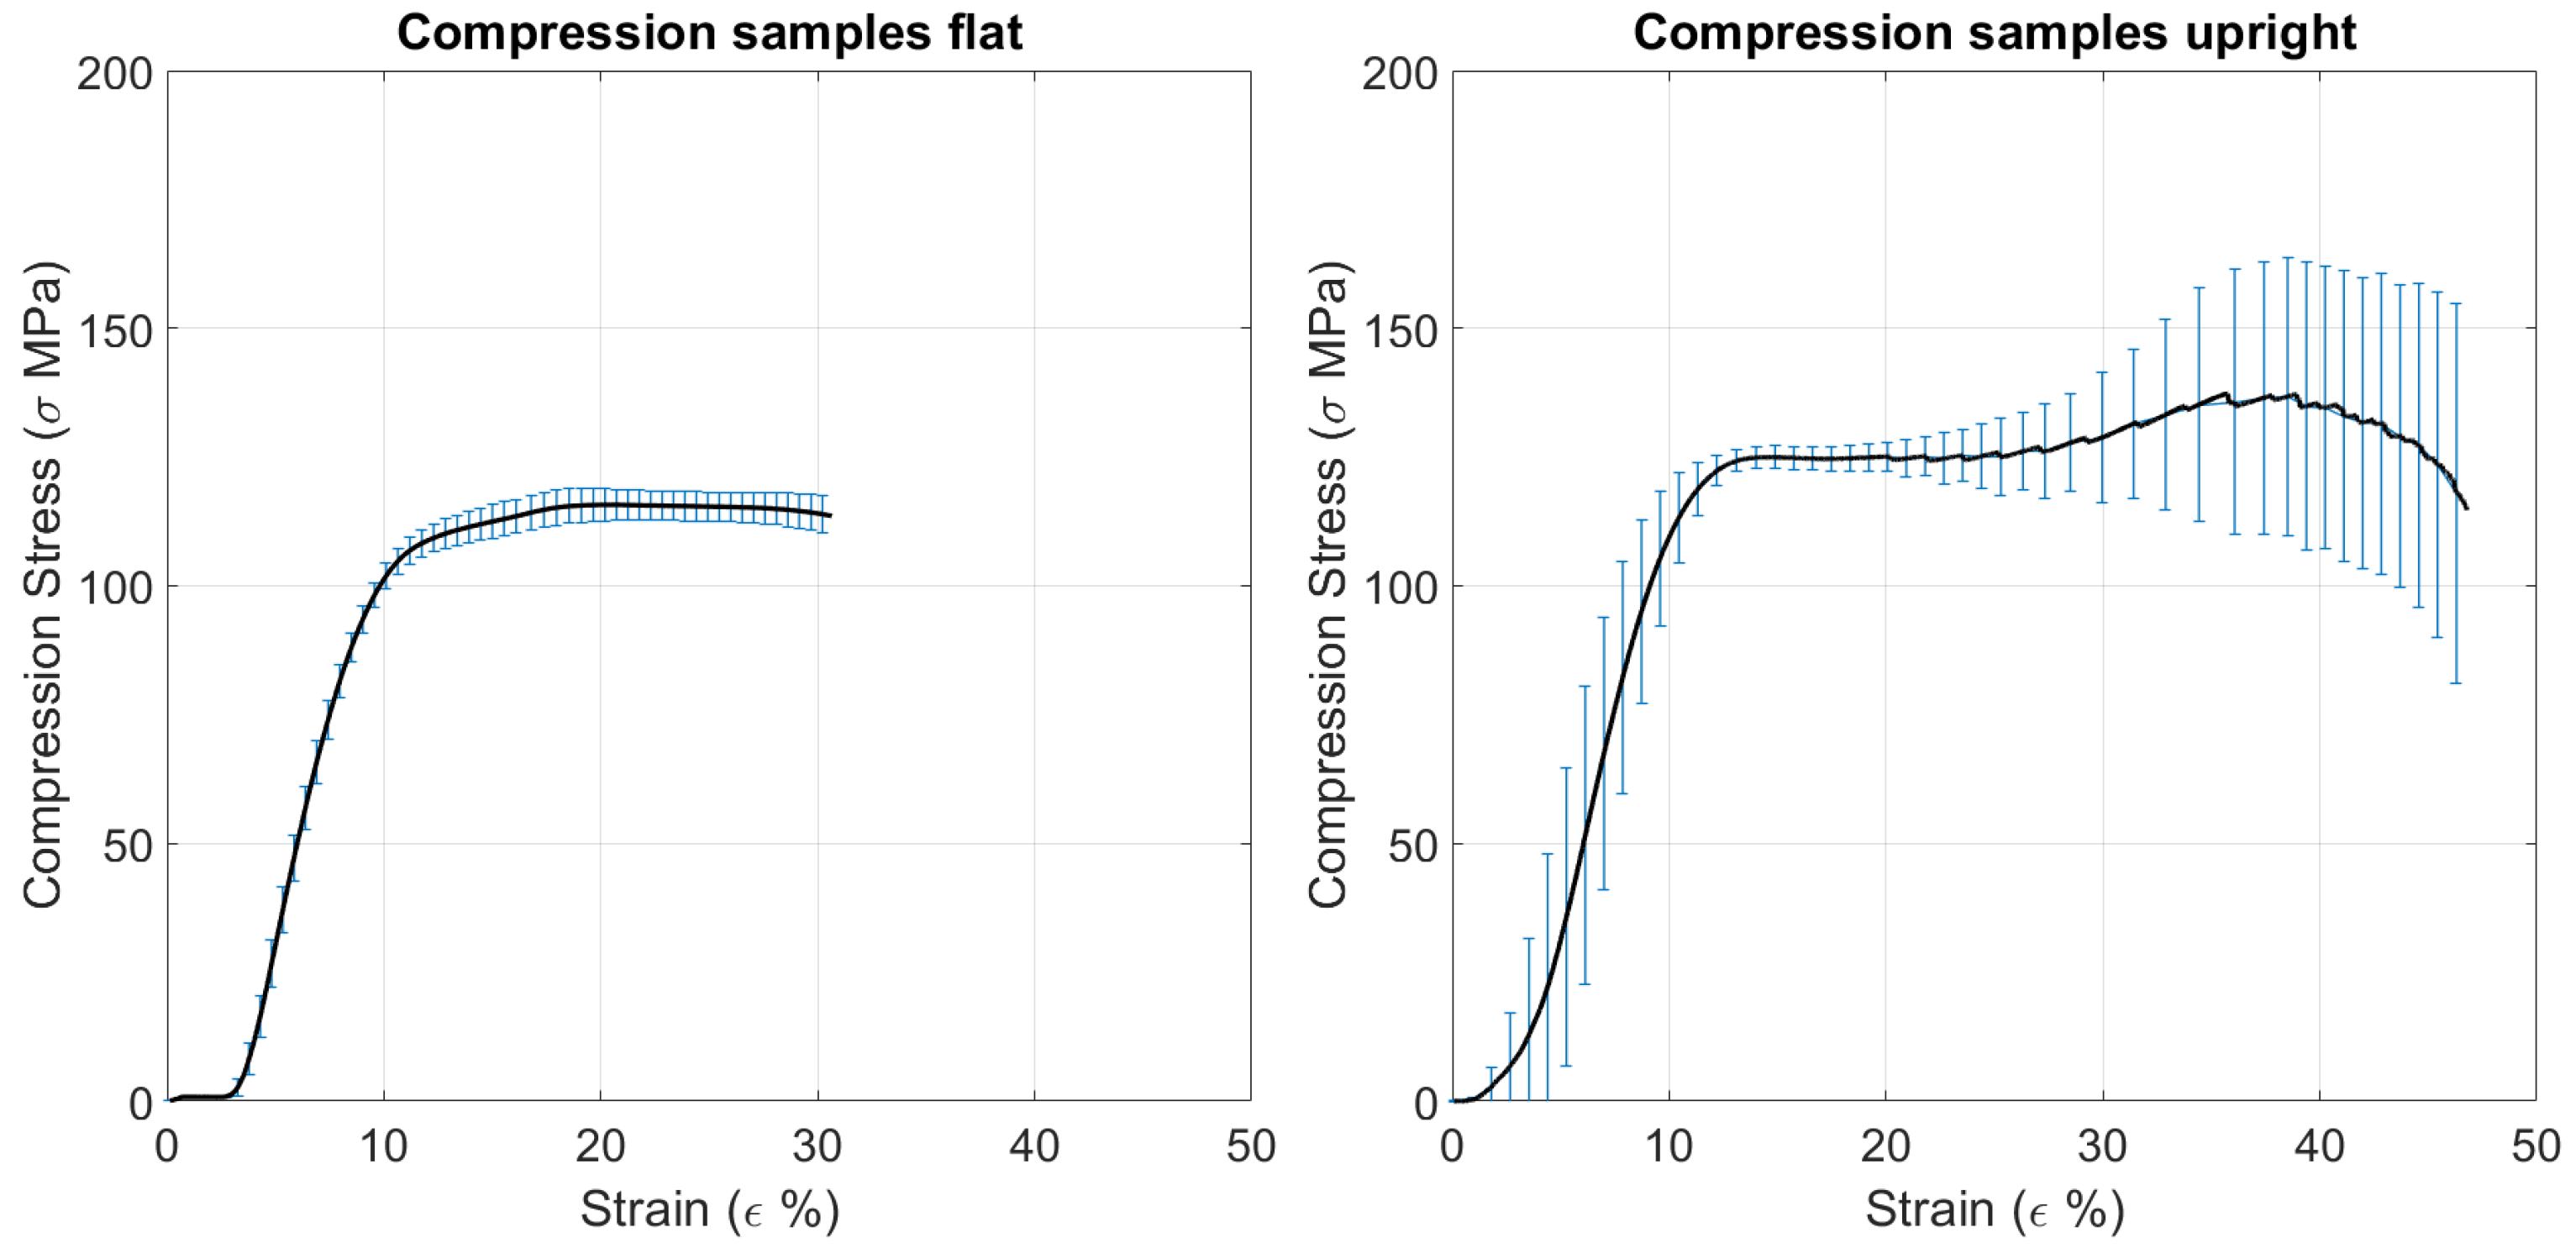
The compression test for ULTEM™ 1010 is similar to the 9085s, in which the upright samples obtained better results, as can be seen in
Table 8, for the same reason as ULTEM™ 9085. The flat samples are also able to maintain a constant compressive strength until failure, while the upright samples started breaking on the inside, so the machine did not notice the failure (see
Figure 16).
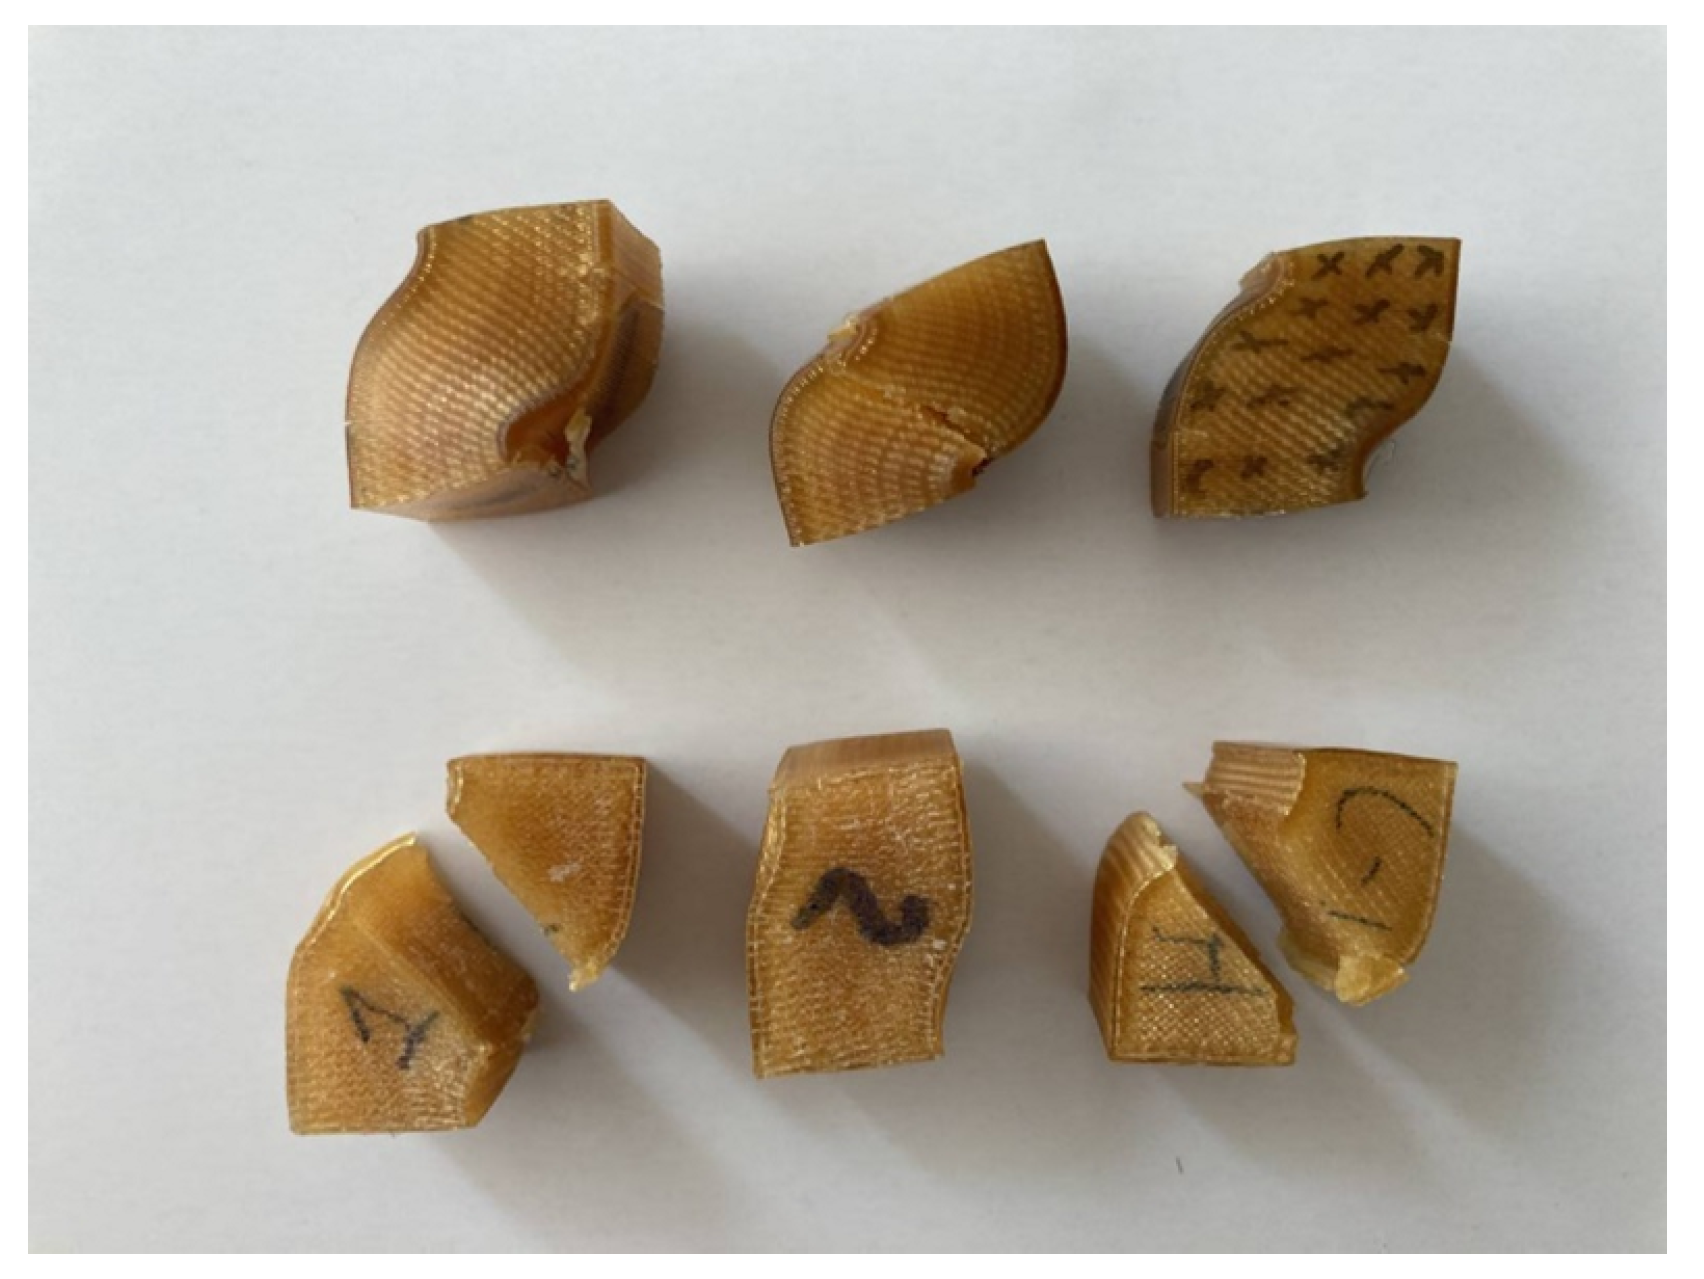
Figure 17 displays the samples after testing, showing how two of the flat samples broke apart.
In both materials, the formation of shear bands is observed, which are recognized as precursors to failure due to their ability to concentrate stress and propagate, potentially leading to fractures or other forms of mechanical degradation. Shear bands are commonly observed in polymers subjected to compressive forces, occurring when the material experiences shear strain beyond its yield point. Within the polymer, small stress-relieving cracks nucleate parallel to the direction of maximum shear stress, typically forming at an angle of 45°, as in these tests.
3.4. Charpy Impact Test
Regarding the Charpy impact test, as mentioned earlier, the Stratasys datasheet [
50] does not include any information, so the MCPP datasheet [
53] was considered for comparison. A value of 11 kJ/m
2 was found to be constant among other datasheets found. The tests performed for ULTEM™ 9085, as shown in
Table 9, resulted in lower values, around 6 kJ/m
2, with the upright samples having a higher energy absorption.
Figure 18 shows a sample of each type after testing.
Similarly, for ULTEM™ 1010, the CAMPUS datasheet was used for reference as the material datasheet did not include information about this type of test. The datasheet results for the impact test are 4 kJ/m
2, similar to our test results. The results, shown in
Table 10, are similar for both orientations, but the sideways samples obtain a higher result in this case.
Figure 19 shows the specimen after testing.
3.5. Fractures in ULTEM™ 1010
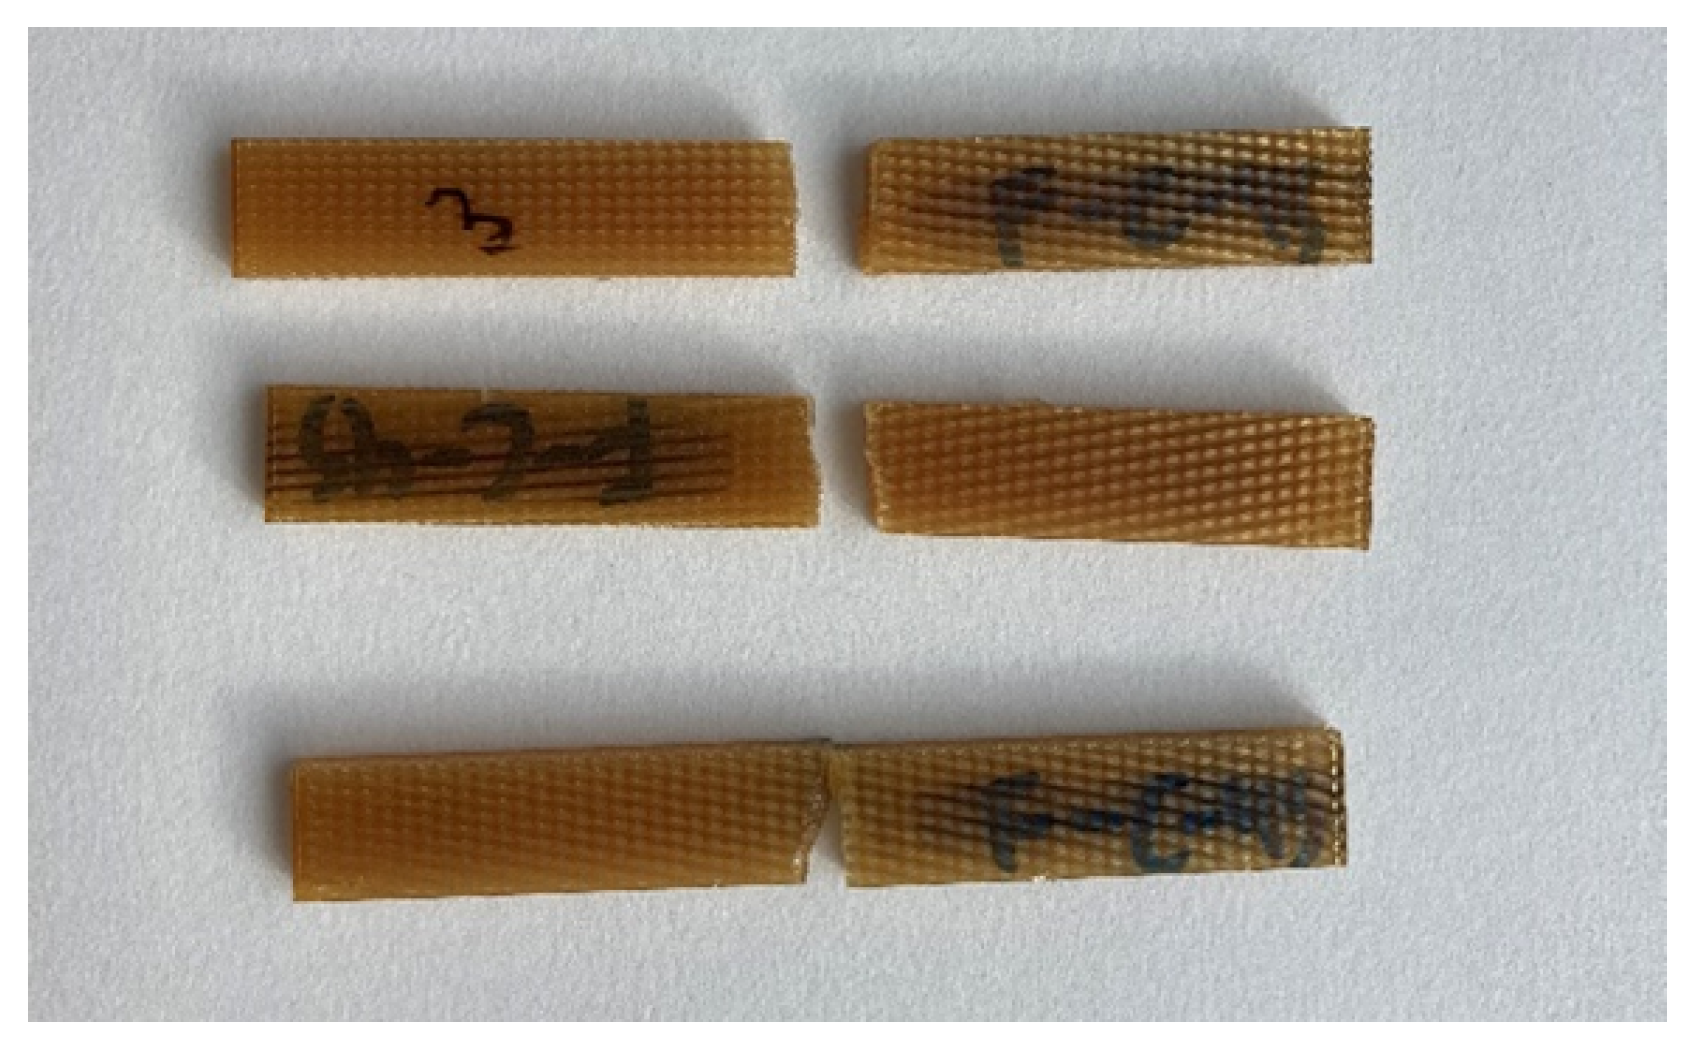
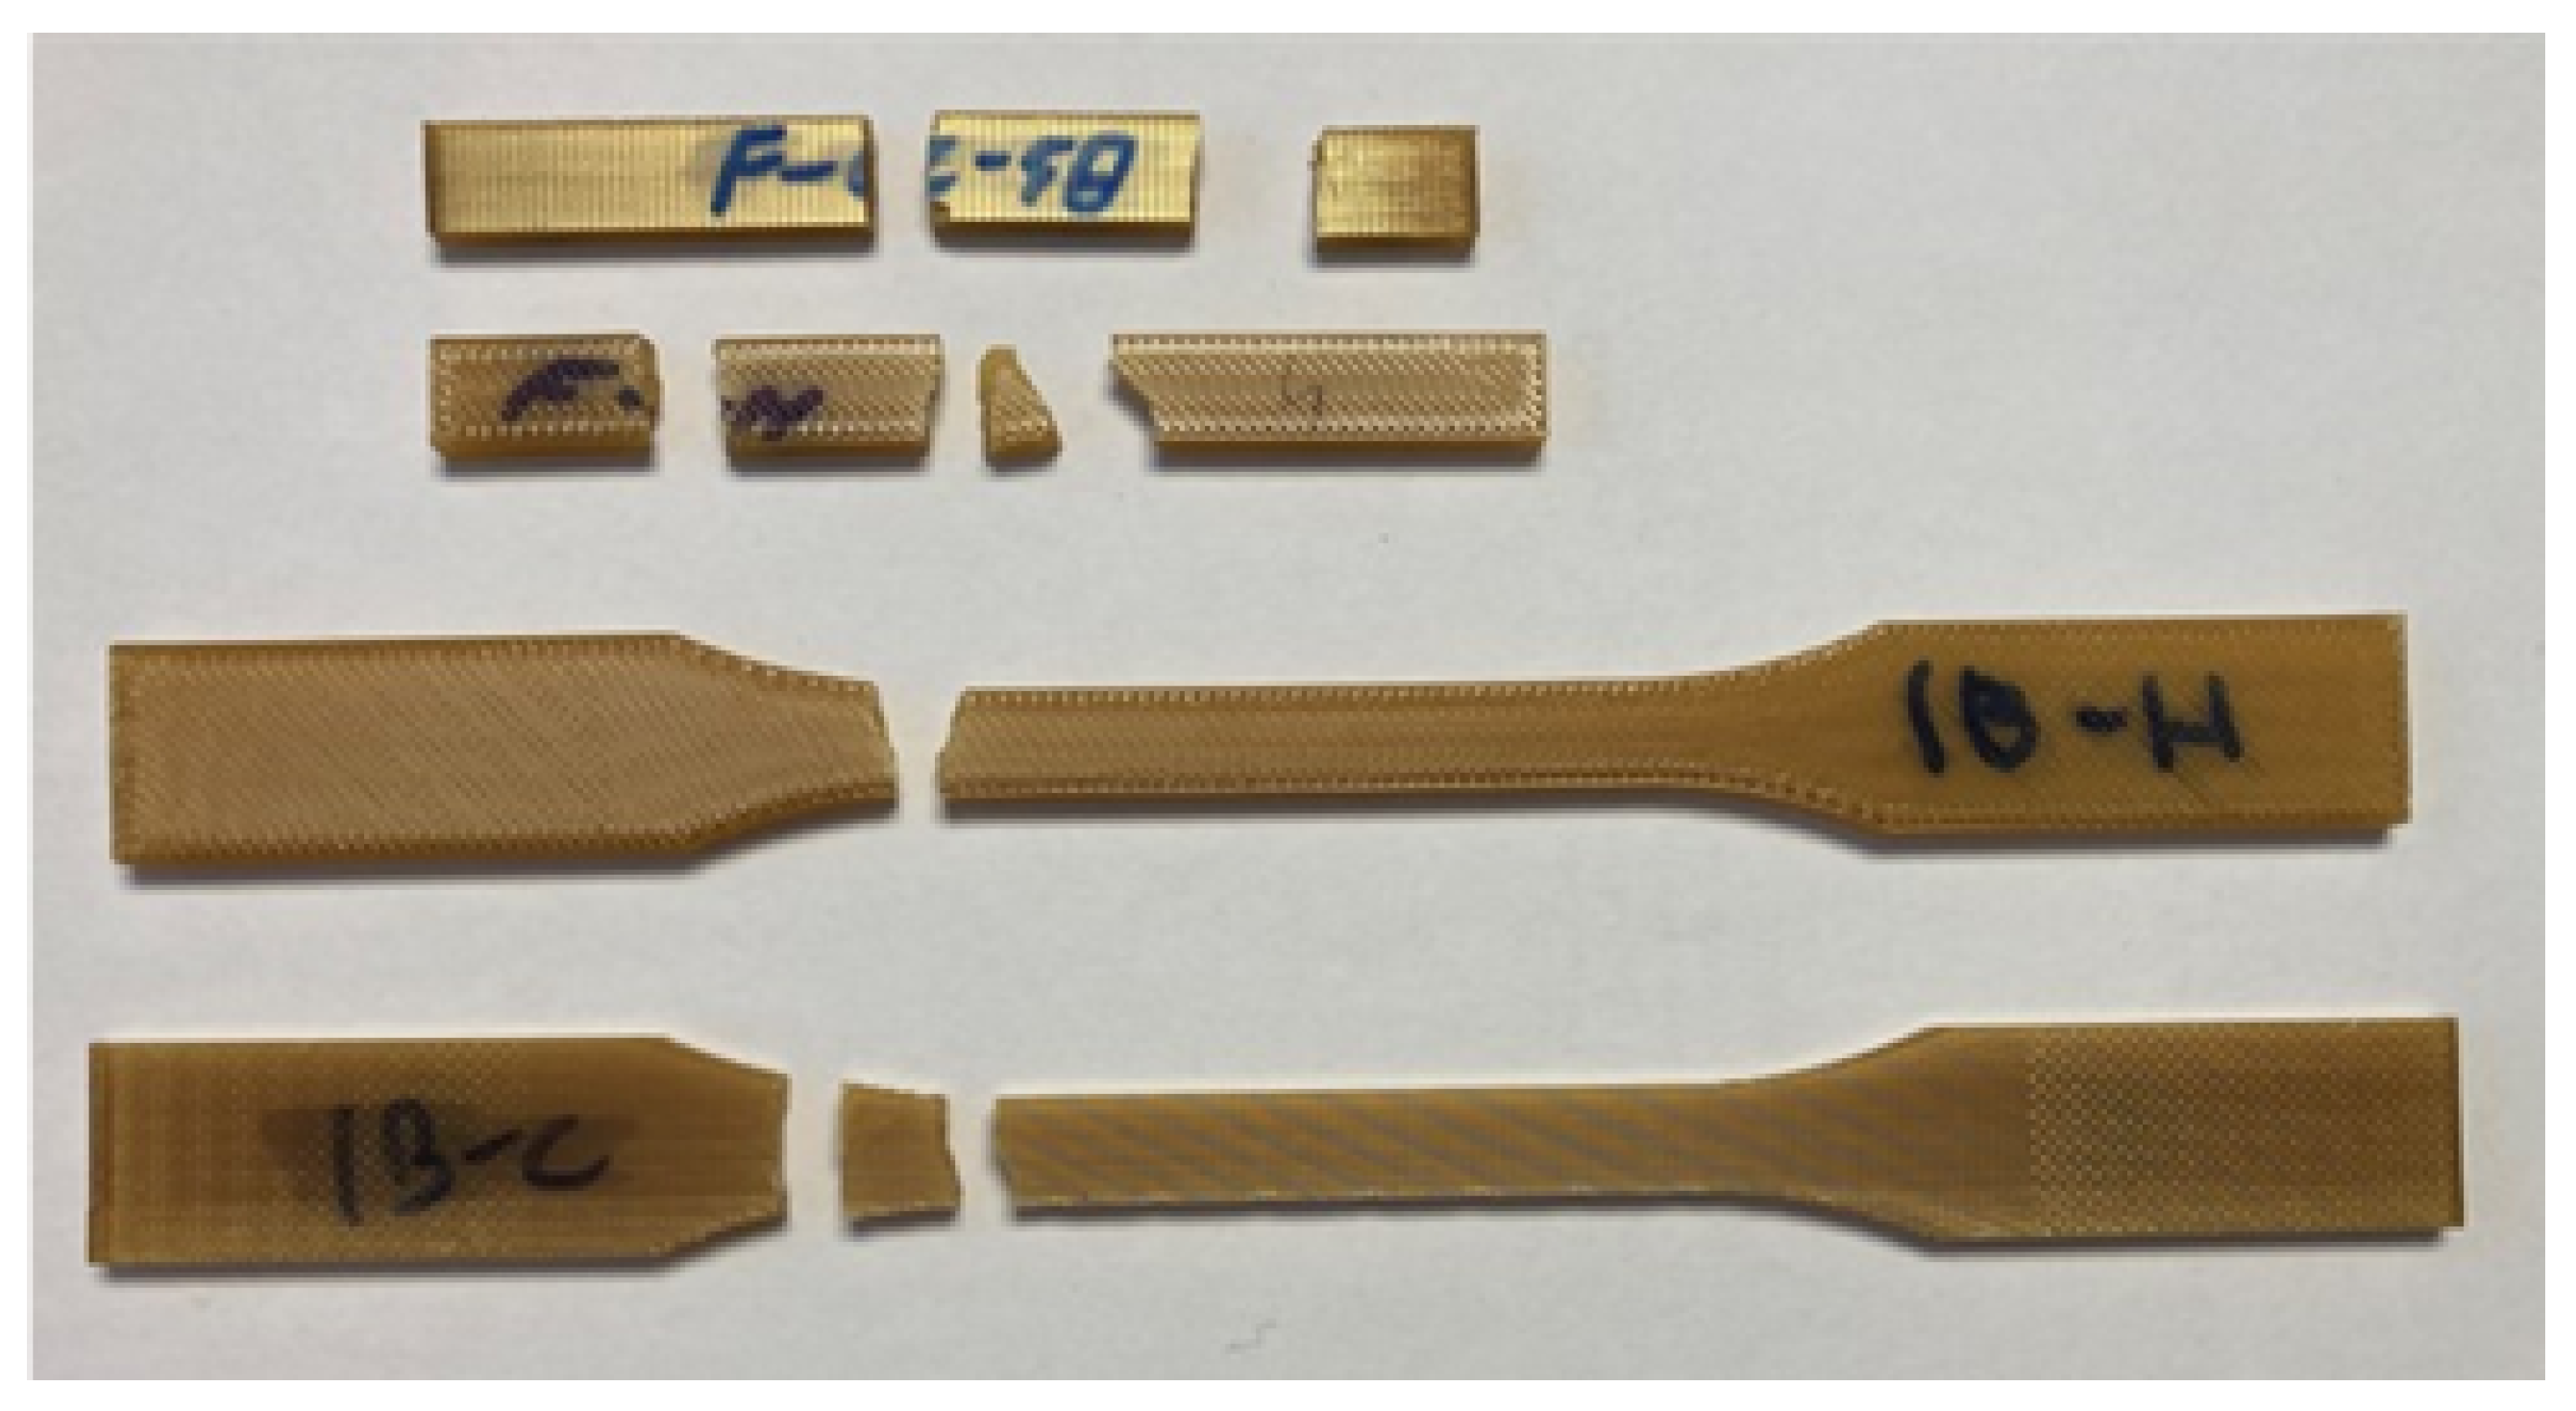
During the tensile and flexural testing of the ULTEM™ 1010 samples, it is worth noting an interesting observation: rather than breaking into two distinct pieces, some samples fractured into 3, 4, or 5 parts, as depicted in
Figure 20. Typically, these additional fragments were small pieces surrounding the primary breaking point. This phenomenon can be attributed to the release of energy upon fracture, considering that the mechanical properties obtained from these samples are quite similar. In contrast, such fragmentation was not observed in the case of ULTEM™ 9085. The occurrence of multiple fragments does not appear to be strongly influenced by the sample orientation. It was observed in specific instances of the flat and on-edge 90° samples of types 1A and 1B in the tensile tests, as well as the flat, on-edge 90°, and on-edge 45° samples in the flexural tests. Indeed, none of the upright samples or samples of Type 5A were fractured into multiple pieces. However, it is important to note that the upright samples and Type 5A samples should theoretically be more susceptible to fracture in that direction due to the layer deposition (in the case of upright samples) and reduced thickness (in the case of Type 5A samples). These findings suggest that the fracture behavior of the ULTEM™ 1010 samples can exhibit complex patterns, with some samples exhibiting multiple fragments upon failure. Further investigation is required to fully understand the underlying mechanisms contributing to this phenomenon and its implications for practical applications.
3.6. Differences with the Datasheet
The samples utilized in the materials testing procedure conducted by STRATASYS differed from those in this study, apart from the compression tests, which followed the same specifications. Disparities in sample types, testing procedures, printing parameters, and printing procedures (printing all at once instead of one by one) could contribute to the variations in observed mechanical properties. Printing multiple samples in a single batch can increase printing time, potentially leading to thermal degradation. Furthermore, higher testing speeds can result in higher measured strength values due to the strain-hardening effect, while factors like aging and environmental conditions can influence Young’s modulus.
Another key factor to consider is the influence of porosity on the mechanical properties of 3D-printed samples [
57]. Previous research by Wang et al. [
58] demonstrated that samples with lower porosity tend to exhibit better mechanical properties. The location of the pores was found to be more critical than their quantity [
59]. The porosity of the samples was not measured, and the datasheet provides limited information on the porosity of their samples. Consequently, porosity could be another contributing factor to the deviations from the reference values, and future work will test its value and influence.
It is important to also take into account that, due to the unique properties of polymers, there are also going to be some limitations on mechanical testing. Reproducibility across different batches or labs is challenging, so detailed reporting of test conditions is recommended. Polymers are temperature-sensitive and it can alter their mechanical properties. Conducting tests at various temperatures and using more temperature-controlled environments before (also controlling the humidity, as it can degrade properties over time) and during testing could help understand and reduce the variability of the samples. Aging tests are also recommended to better understand the long-term performance of the material, as well as fatigue tests under different under various loading conditions to establish S-N curves.
3.7. Applications
Among others, flexures are a type of element that would benefit from 3D printing. Flexures are bearings specifically designed to allow motion in pre-defined degrees of freedom while being relatively stiff in their degrees of constraint. Flexures are critical for precise adjustment in optical stages or actuating clamps, minimizing backlash. However, those elements usually have intricate geometries with delicate features and are vulnerable to vibrations, making them complex to manufacture by traditional means. Generally, flexures require several stages in their manufacturing process, which may include wire electrical discharge machining (EDM), water jet cutting and brazing [
60], and even a combination of these processes. Some of these methods also need different setups and components, each degree of freedom usually requiring its own set of manufacturing considerations [
61]. While for mass production, these methods are optimized for low-batch or single production (these types of components for space applications are singular in most cases), traditional manufacturing is costly.
The materials normally used for flexures are steel and aluminum, depending on the desired type of flexure. Alloys, such as beryllium copper and Inconel, can also be used in specific applications due to their properties. While these materials have better mechanical and thermal properties than ULTEM™ 9085 and 1010, as shown in
Table 11, and their density is much higher (except for aluminum), other factors must be taken into account, like material cost and their buy-to-fly ratio. Methods such as milling, electric discharge machining, and water jet machining can result in significant material waste [
62], and as mentioned in the introduction, the emergence of additive manufacturing can effectively reduce it. Recent literature has researched the use of metal-based additive manufacturing for different types of flexures: hinges [
63], pivots [
64], and joints [
65], with the results showing great potential.
While polymers may not be able to substitute metals in high-stress conditions, there are specific scenarios where the mechanical properties of high-performance thermoplastics are sufficient. Kiener et al. [
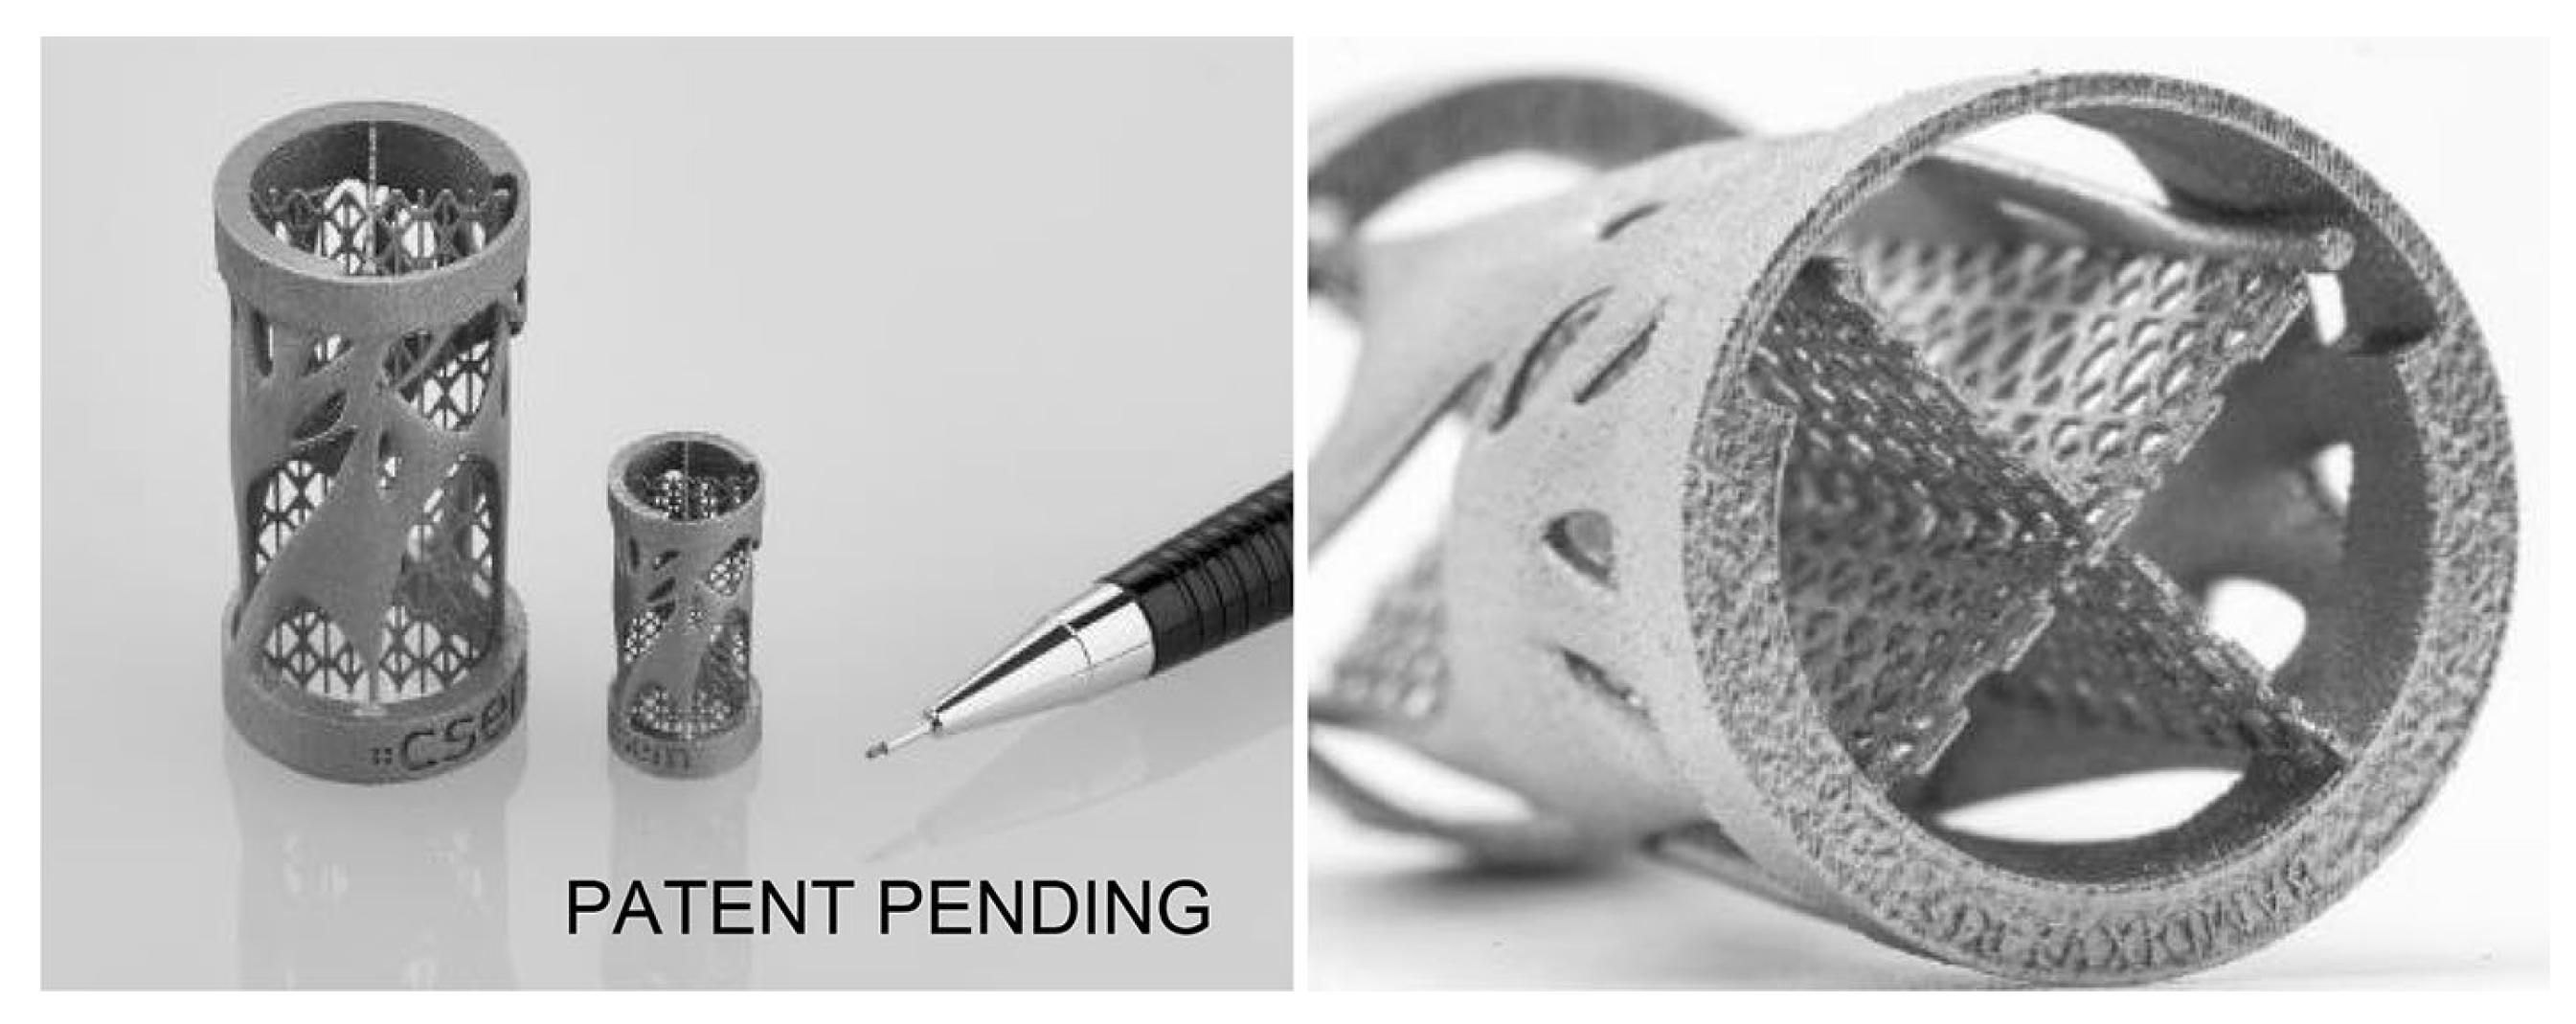
66] developed a compliant mechanism based on additive manufacturing for ESA (European Space Agency) for high-precision and harsh environments in cryogenic and space applications. They confirmed the lead time reduction that additive manufacturing provides thanks to the absence of assembly and the ability to make complex geometries, and even a combination of these processes. Some of these methods also need different setups and components, each degree of freedom usually requiring its own set of manufacturing considerations. They also found benefits in using lattice flexure blades, with encouraging results. For the PULSAR (Prototype for an Ultra Large Structure Assembly Robot) project, CSEM (Swiss Center for Electronics and Microtechnology) developed a redesigned C-flex type pivot, shown in
Figure 21. These pivots were successfully integrated into a mirror tile prototype for large telescopes assembled in space [
67].
Domerg et al. [
68] studied the use of PEKK in 3D-printed compliant systems (flexural pivots) in small satellites, with the objective of orienting payloads such as sensors or cameras, with notable results, although improvements and further work required concerning the effect of the printing parameters and porosity. The possibility of using more 3D-printed components in satellites would help increase their accessibility, as additive manufacturing would reduce weight and costs, as stated in the introduction.
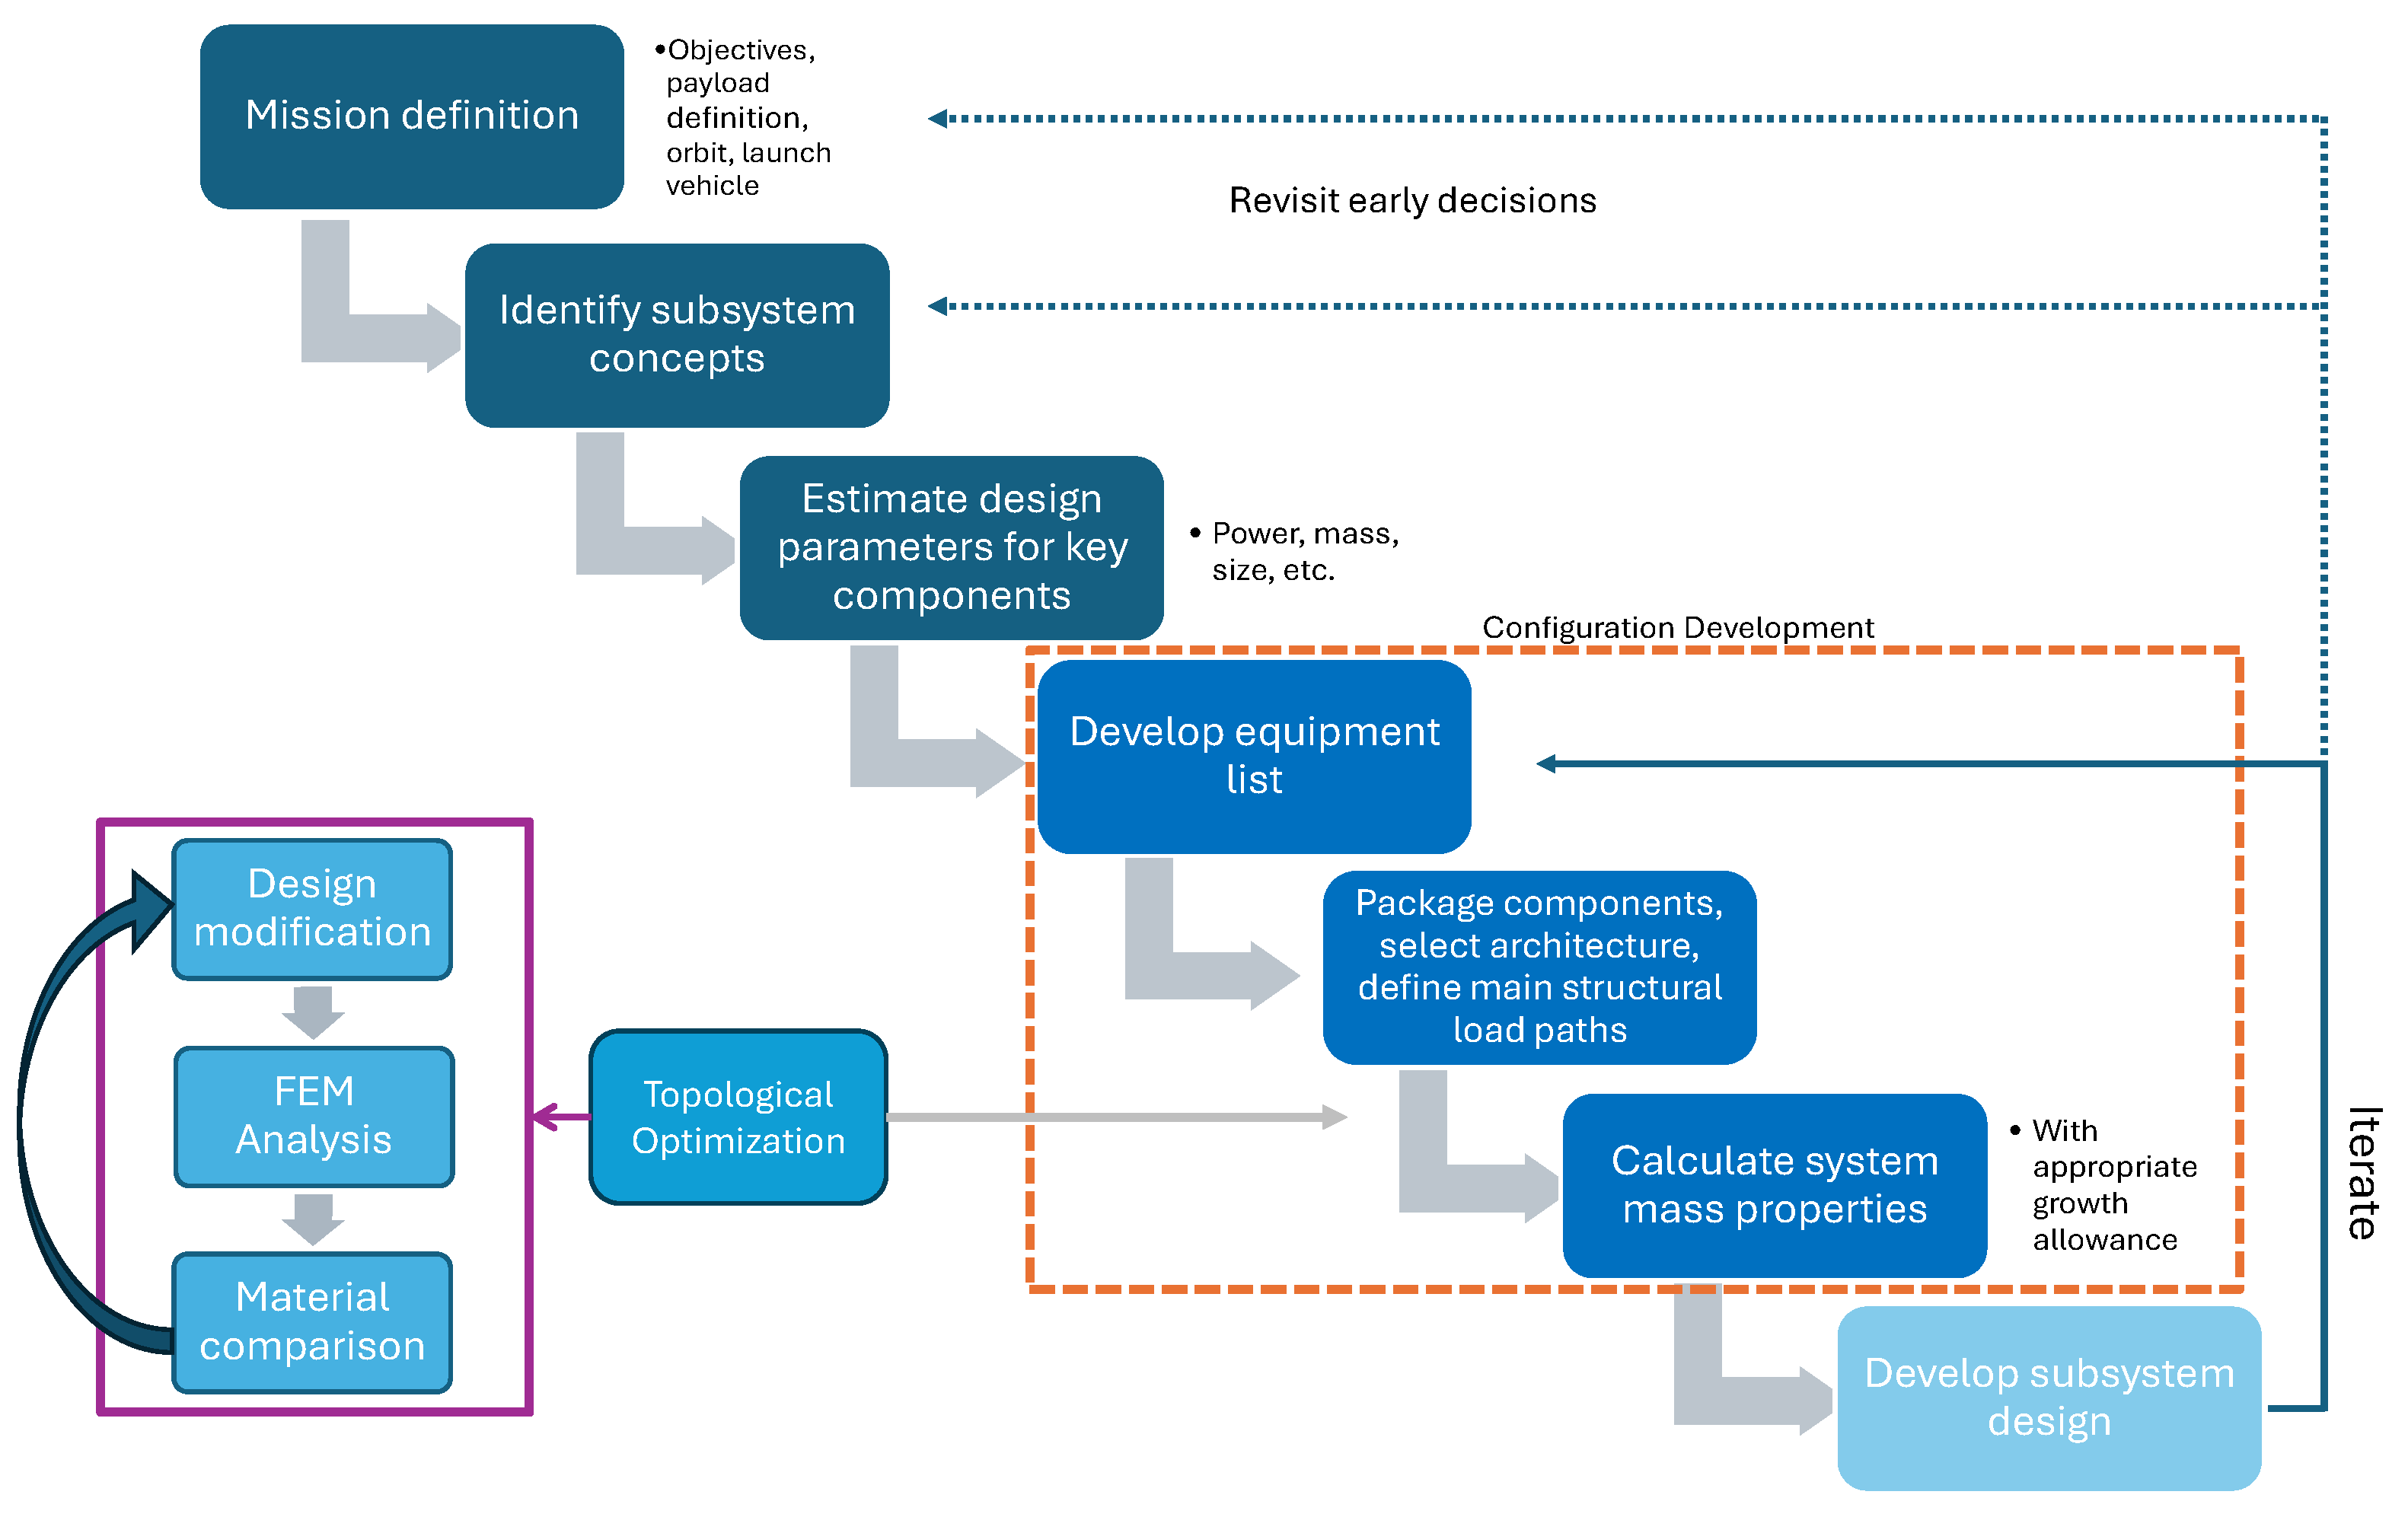
The mechanical properties of polymers could be introduced to the structural subsystem of concurrent design facilities by integrating comprehensive polymer property databases and simulation tools into the design workflow. A database could be built with the material’s theoretical properties from the datasheet and the results obtained from the tests. A FEM software like MSC Apex, which is fairly new, but has the potential of quickly meshing and analyzing a model from CAD software automatically or almost automatically, can be used to run several tests in fast succession, with both sets of properties to compare, as the actual properties of the component would be in between them. After obtaining results from the FEM software, the CAD model can be quickly modified to sustain better the forces it will experience and then run again to check. This would be an iterative process, optimizing the structure, until reaching a design that fulfills all requirements.
Figure 22 shows how and where the process would be included in the general steps of satellite definition, becoming a part of the development phase. After defining a structural architecture and load path for a component, the team would proceed to optimize said component through several iterations until reaching a satisfying result and calculating the system mass properties. Then, develop the subsystem design and start the iteration of the process again until the team obtains the best outcome.
This integration could allow for real-time access to critical data such as tensile strength, elasticity, toughness, and, with future research done on the matter, thermal behavior, enabling designers to make informed decisions on material selection and structural optimization. Additionally, incorporating advanced modeling software that could simulate polymer behavior under various conditions would enhance the predictive accuracy of the structural performance, ensuring that the chosen materials meet the required specifications and performance criteria.
