Article

Coupling Analysis between the Transonic Buffeting Flow and a Heaving Supercritical Airfoil Based on Dynamic Mode Decomposition

School of Astronautics, Northwestern Polytechnical University, Xi’an 710072, China
*
Author to whom correspondence should be addressed.
Aerospace 2024, 11(9), 722; https://doi.org/10.3390/aerospace11090722
Submission received: 10 June 2024 / Revised: 15 August 2024 / Accepted: 27 August 2024 / Published: 3 September 2024
(This article belongs to the Special Issue Transonic Flow (2nd Edition))

Abstract

:
The coupling between a transonic buffeting flow and a supercritical airfoil with harmonic heave motion was studied. A parametric space of the heave frequency and amplitude was investigated using a verified fluid–structural interaction framework. The spatial-temporal flow pattern around the transonic airfoil was studied using dynamic mode decomposition (DMD) to unveil the physical coupling mechanism. The results show three types of flow responses under the heave motion: (I) A buffet frequency response with a λ -shape shock wave structure and recirculation zone at the shock foot. The aerodynamic performance was alike the scenario in the flow past the stationary airfoil. (II) A transitional response with a weakened shock and enhanced boundary layer. The aerodynamic performance deteriorated sharply at f = f buffet and recovered after the frequency was past the buffet frequency. The flow pattern was characterized by a double-shock structure that interacted with the enhanced boundary layer. (III) A heave frequency response with the dominant heave motion. The variance in the aerodynamic loading increased significantly at f > f buffet and there were higher heave amplitudes in this stage. The driving motion of the airfoil transferred the energy of the buffet mode to the boundary layer with a more even energy balance according to the energy contribution analysis of the DMD modes.

1. Introduction

When a high-speed aircraft is passing through the transonic regime, the shock wave in the upper surface of the wing strongly couples with the separated boundary layer. Such an aerodynamic excitation phenomenon is termed a “transonic buffet”, which may induce flow instabilities and aerodynamic efficiency. It limits the flight envelope of the aircraft and imposes a threat of structural fatigue failure and maneuverability inefficiency.
Extensive efforts have been made to the physical understanding of transonic shock buffeting [1,2]. The early 1990s research paid attention to the buffet onset prediction and physical mechanism of the shock wave/boundary layer interaction. Lee [3] proposed a prediction model that accounts for the self-sustained shock wave oscillation in a transonic buffet flow. Knipfer and Schewe [4] experimentally observed the transonic dip phenomena to study the flutter instability boundary and the aerodynamic loading of a supercritical airfoil under the forced and self-sustained oscillation in a transonic flow. The transonic dip is directly related to the transonic buffet, in which the critical flutter velocity drops near the transonic region due to aerodynamic nonlinearity. Deck [5] evaluated the capability of a high-fidelity zonal DES method to study the transonic buffet of a supercritical airfoil. The results highlight that upstream-propagating waves are generated by the impingement of a coherent structure on the upper surface of the airfoil. Dietz et al. [6] studied the self-sustained oscillation of a supercritical airfoil NLR 7301 in a wind tunnel from the viewpoint of the local energy exchange between the fluid and the structure. They found that the presence of a shock wave stabilized the aeroelastic system near the transonic dip when the Mach number exceeded the minimum value in the transonic dip. Crouch [7] found that a global instability in a transonic buffet flow accounts for the buffet onset, which is characterized by shock wave oscillations.
In the buffet flow, it is of particular interest to consider the coupling effect on these of forcing the fluid by oscillating the airfoil in a prescribed oscillating motion of a certain amplitude and frequency. The relationship between the oscillating frequency and the buffet frequency play a central role in determining the aerodynamic loading, which highly affects the structural safety and maneuverability.
In the 2000s, the onset of the transonic buffet and its relation with the airfoil’s motion were explored from the flow stability perspective [8,9,10]. Raveh and Dowell [11] emphasized the lock-in phenomenon of the pitching airfoil in transonic flow. They pointed out that the shock wave oscillation frequency is synchronized to the prescribed motion frequency with a certain combination of motion frequency and amplitude, which is termed as “frequency lock-in”. The work suggested to study the link between the flow instability and structural actuation. In their work, the coupling between the pitch motion and the buffet flow was extensively investigated. However, the coupling mechanism of the heave motion of the airfoil was yet to be uncovered. Hartmann et al. [12] experimentally investigated the transonic flow around a supercritical airfoil in buffeting conditions with heave and pitch motion. The results validated the existence of the frequency lock-in in the buffet flow. Crouch et al. [13] identified three global instability modes linked to swept-wing buffeting, which are short-wavelength and intermediate-wavelength stationary modes and long-wavelength oscillatory modes. The aforementioned studies on transonic buffeting focused on the underlying physics in the pre-buffeting and developed buffeting conditions. Nevertheless, the complex interaction between the motion of the airfoil and the buffeting flow was paid less attention to. The coupling pattern significantly impacted the aerodynamic design and loading analysis of transonic wings. Gao and Zhang [1] studied the flow modes in the self-excited oscillation of the airfoil in a transonic flow. In their work, they found that the transonic buffeting and single-degree-of-freedom flutter were associated with different modes in the coupling. However, the flow field information was not provided since the work was reduced-order-model based. The current work focused on the relationship between the buffeting and airfoil motions and the impact of the coupling on aerodynamic forces when an airfoil was heaving in buffet flows. The coupling between the airfoil motion and buffet flow essentially reflects the nature of the nonlinear responses of the shock wave and boundary layer in the interaction. The underlying physics needs to be answered, e.g., how does the aerodynamic loading develop in the buffet flow? How does the dominant flow feature evolve with respect to different parameters? The aerodynamic loading characteristics and the related flow pattern will shed light on the aerodynamic design and transonic flow control.
Recently, the modal decomposition methods, such as proper orthogonal decomposition (POD) and dynamic mode decomposition (DMD), provided valuable tools for analyzing flow fields. They can extract a set of modes from consecutive snapshots of the flow fields [14]. These modes reflect the fundamentals of flow physics. Szubert et al. [15] investigated the flow physics of the transonic shock wave, shear layer, and wake interactions past a supercritical airfoil for a Reynolds number R e = 3 × 10 6 , angle of attack (AOA) 3.5 , and Mach number M = 0.73 . The POD method was used for the analysis of the amplitude modulation caused by the interaction between the buffet and von Karman modes. Kou and Zhang [16] proposed a general criterion for the selection of the dominant DMD modes. An NACA0012 airfoil in a transonic buffeting flow was tested and the flow reconstruction based on the proposed criterion was evaluated for better accuracy and modal convergence. Poplingher et al. [17] conducted a modal analysis of a transonic shock buffet of a 2D RA16SC1 airfoil using proper orthogonal decomposition (POD) and dynamic mode decomposition (DMD). Three types of modes were identified, i.e., the buffet mode, shock-traveling model with the multiples of the buffet frequency, and boundary layer mode with mixed frequencies. Giannelis et al. [18] conducted unsteady Reynolds-averaged Navier–Stokes simulations of flow around a supercritical aerofoil in transonic buffet conditions. Higher-order dynamic mode decomposition was used to identify the dominant buffet mode and its sub- and super-harmonics. They highlighted the type A/C shock motions that were caused by the emergence of the sub- and super-harmonic mode pairs of the fundamental buffet mode. Zauner and Sandham [19] performed a direct numerical simulation of a laminar flow airfoil in buffeting conditions at a Mach number M = 0.7 and Reynolds number R e = 5 × 10 5 . A global mode that represented the coupled acoustic and flow separation was identified and validated using DMD. The results imply that the shock motion is not necessarily correlated with the dominant oscillations in the lift signal. Although significant progress has been accomplished for the mechanism of the buffet mode and its related flow pattern around the static airfoil, there still remain open questions with regard to the response of the buffeting flow under prescribed oscillations of the airfoil. The underlying physics of the coupling between the harmonics of the fundamental buffet mode and the given actuation deserves further exploration.
This study investigated the coupling mechanism between the transonic buffeting flow and the airfoil with harmonic heave motion. The flow response and coupling mechanism were studied using DMD tools. This paper is organized as follows: Section 2 presents the details of the numerical model. Section 3 explains the DMD methodology, and the dominant flow patterns are analyzed in Section 4. Finally, Section 5 outlines the main findings of this study.

2. Numerical Model

2.1. CFD Method

The Reynolds-averaged Navier–Stokes equations in Cartesian coordinates are written in integral form:
Ω Q ˙ d Ω + Ω F · n d S = 0 ,
where Q = ( ρ , ρ u , ρ v , ρ w , ρ e ) T , Q ˙ is the temporal partial derivative of Q , Ω is the boundary of fluid domain Ω , and n is the normal vector of the boundary Ω . The flux vector F is divided into the convective flux F c and the diffusive flux F v , that is, F = F c F v . The expression of the flux is given in Appendix A.
All the variables are nondimensionalized by the chord and freestream velocity. The Reynolds number is defined as R e = ρ U c μ , where c denotes the chord of the airfoil, and ρ and μ are the freestream density and the viscosity of the freestream flow, respectively.
An in-house fluid solver, ASUM, was developed for the computation [20,21,22]. The cell-based finite volume method was used in the solver on a structured grid. The advective flux term was discretized by an ROE scheme, whilst the diffusive flux was approximated by a second-order central differential scheme. The lower–upper symmetric Gauss–Seidel method was used for the temporal marching. The Spalart–Allmaras turbulence model was adopted in the simulation.

2.2. Heave Motion of the Airfoil

The motion is driven by a harmonic oscillation. The choice of the frequency is based on the first-order frequency of the flows obtained from the spectral analysis of the time history of the lift coefficient. The heave motion of the airfoil is given in Equation (2):
A ˜ = A ˜ 0 + A ˜ m sin ( ω h t ˜ )
where A ˜ is the vertical displacement of the heaving airfoil, A ˜ 0 is the equilibrium of the heave motion, A ˜ m is the heave amplitude (m), ω h = 2 π f h is the circular frequency, and f h is the heave frequency (Hz).
The heave motion is non-dimensionalized by the chord of the airfoil, which yields
A = A 0 + A m sin ( 2 f t )
where A = A ˜ / c is the dimensionless vertical displacement of the heaving airfoil, A 0 = A ˜ 0 / c is the dimensionless equilibrium of the heave motion, and A m = A ˜ m / c is the dimensionless heave amplitude. f = π f h c / U is the reduced frequency and t = t ˜ U / c .

2.3. Mesh-Moving Technique

During the interaction between the fluid and structure, the CFD grid must simultaneously conform to the motion or deformation of the structure. The spring analogy was adopted for the mesh moving. This assumes the CFD mesh is a balance spring system connected with fictious springs. The stiffness of the spring is associated with the edge length of the mesh. When the dynamic boundary is updated, the new position of the grid node is determined by the equilibrium condition of the spring system. The Jacobian iterative scheme is used to solve the equilibrium Equation (4). Due to the sparse and positive definite iterative matrix, it requires less than 400 times per time step before it satisfies the given criteria. The convergence criteria satisfies | | x i new x i old | | 1.0 × 10 5 .
x i new = x i old + j = 1 n i K i j x j new j = 1 n i K i j x j old j = 1 n i K i j
where x i new is the new position of the i t h node. x j new is the new position of the j t h node near the i t h node. n i denotes the total number of nodes near the i t h node. K i j is the spring stiffness coefficient related to the i t h and j t h nodes, and K i j = β ϕ · l i j 2 . l i j denotes the distance between the i t h node and the j t h node. β represents the coefficient for the enhancement of the spring stiffness on the boundary; it is larger near the boundary so that the influence from the displacements of the boundary can propagate into the meshes more quickly. ϕ is the minimum interior angle of the element for torsional stiffness.

2.4. CFD Validation

The flow past an OAT15A airfoil was simulated for the validation of the CFD solver in a transonic flow condition with a Mach number M = 0.73 and an angle of attack A O A = 3.5 . The turbulence model was the Spalart–Allmaras (S-A) model with a turbulence intensity TI = 1 % . The S-A model was adopted based on the turbulence model study from the existing literature [23], in which the S-A model provided a more accurate prediction than the k ω model for the transonic buffet flow. The boundary conditions were set as follows: the farfield boundary conditions were set as non-reflection freestream conditions, and the airfoil surface was set as a no-slip adiabatic wall boundary condition. Unsteady computation for the flow past the stationary OAT15A airfoil was carried out with a time step of approximately 3 × 10 5 s, and the total number of computational steps was 45,000.
The computational domain was discretized with a C-type structured grid. The first cell height for the normal wall grids was about 1 × 10 6 c , which held yplus to be less than 1. The growth rate of the cell size along the normal direction was 1.1. The mesh independence test is presented in Table 1. The relative errors of the time-averaged lift and drag coefficients between the coarse-sized mesh and middle-sized mesh were 3.79% and 5.23%, whilst the relative errors for the fine-sized mesh reduced to −1.26% and 0.228%.
It was found that the flow was self-oscillatory due to the unsteady interaction between the shock wave and boundary layer at M = 0.73 and AOA = 3.5°. In this case, the reduced buffeting frequency was defined as f b u f f e t = π f h c U , where f h is the primary frequency extracted from the time history of the lift coefficient when the shock wave boundary layer interaction was predominant. The reduced frequency converged in the three mesh scale cases, which was consistent with the experimental result f b u f f e t = 0.208 [24]. The pressure distributions in three different scales were in reasonable agreement with the experimental data [24] in Figure 1. The coarse-sized grid overpredicted the shock position, whilst the middle- and fine-sized grids described consistent shock positions. In this study, the middle-size grid was chosen because of the trade-off between the computational cost and accuracy.
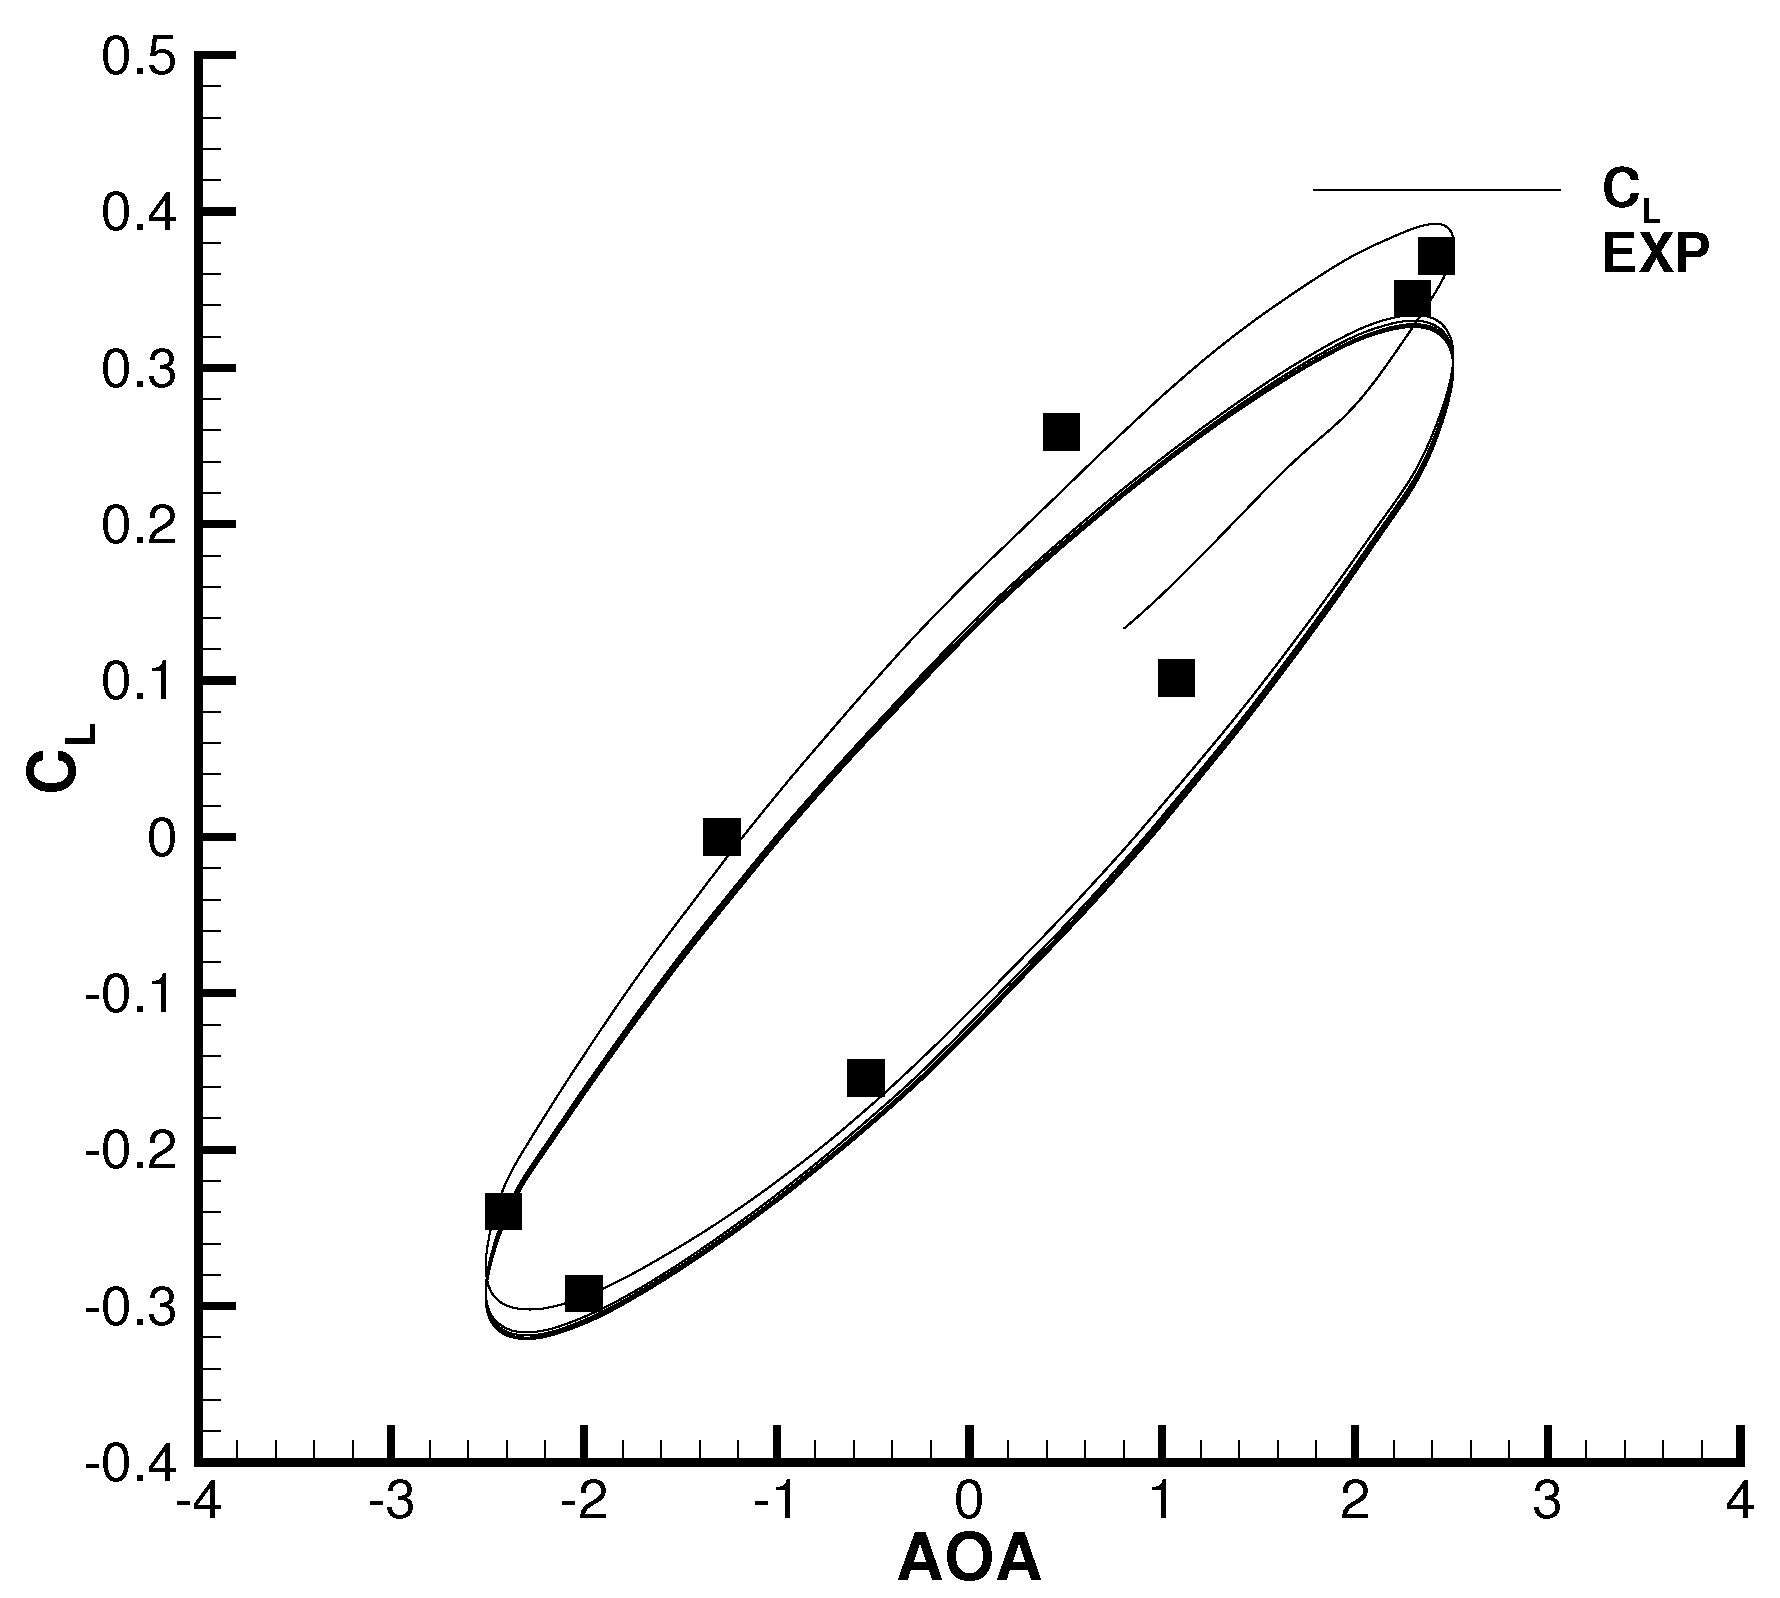
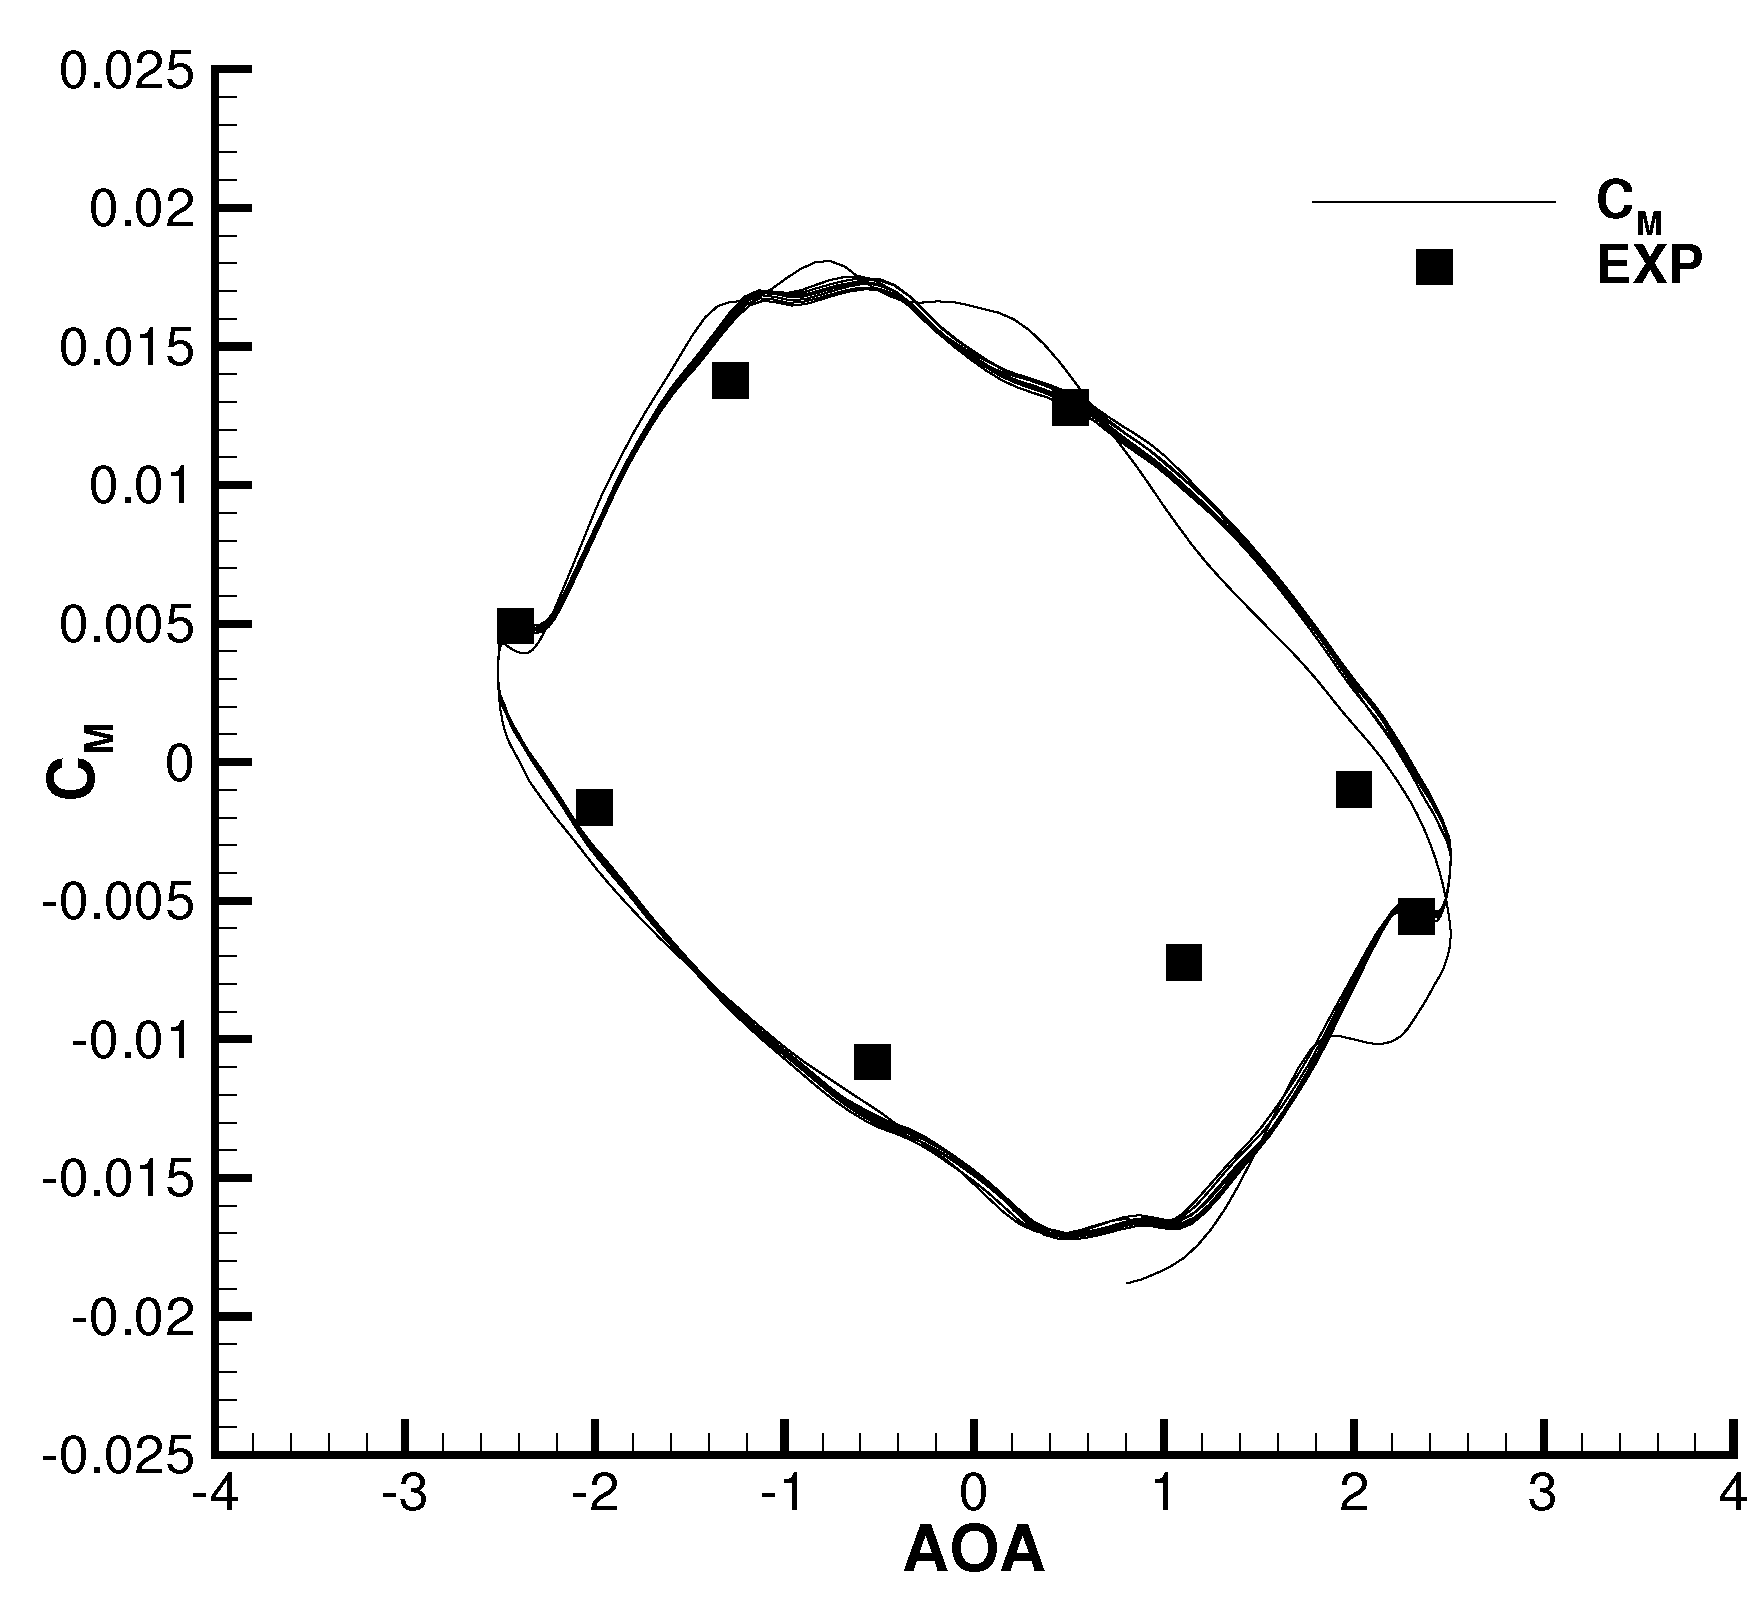
The AGARD CT5 case was selected to validate the fluid–structure interaction for the presented method [25]. In this case, an NACA0012 airfoil was pitched harmonically about its quarter chord. The pitch motion of the airfoil was given as follows:
α t = α 0 + α m sin Ω c t 5 t
where α 0 = 0.016 , α m = 2.51 , and k = Ω c t 5 2 U = 0.0814 is the reduced frequency.
The freestream Mach number was 0.755 and the Reynolds number was 5 × 10 6 . The S-A model was employed for the turbulence description. The farfield boundary conditions were set as the non-reflection freestream condition, and the airfoil surface was set as a no-slip adiabatic boundary condition.
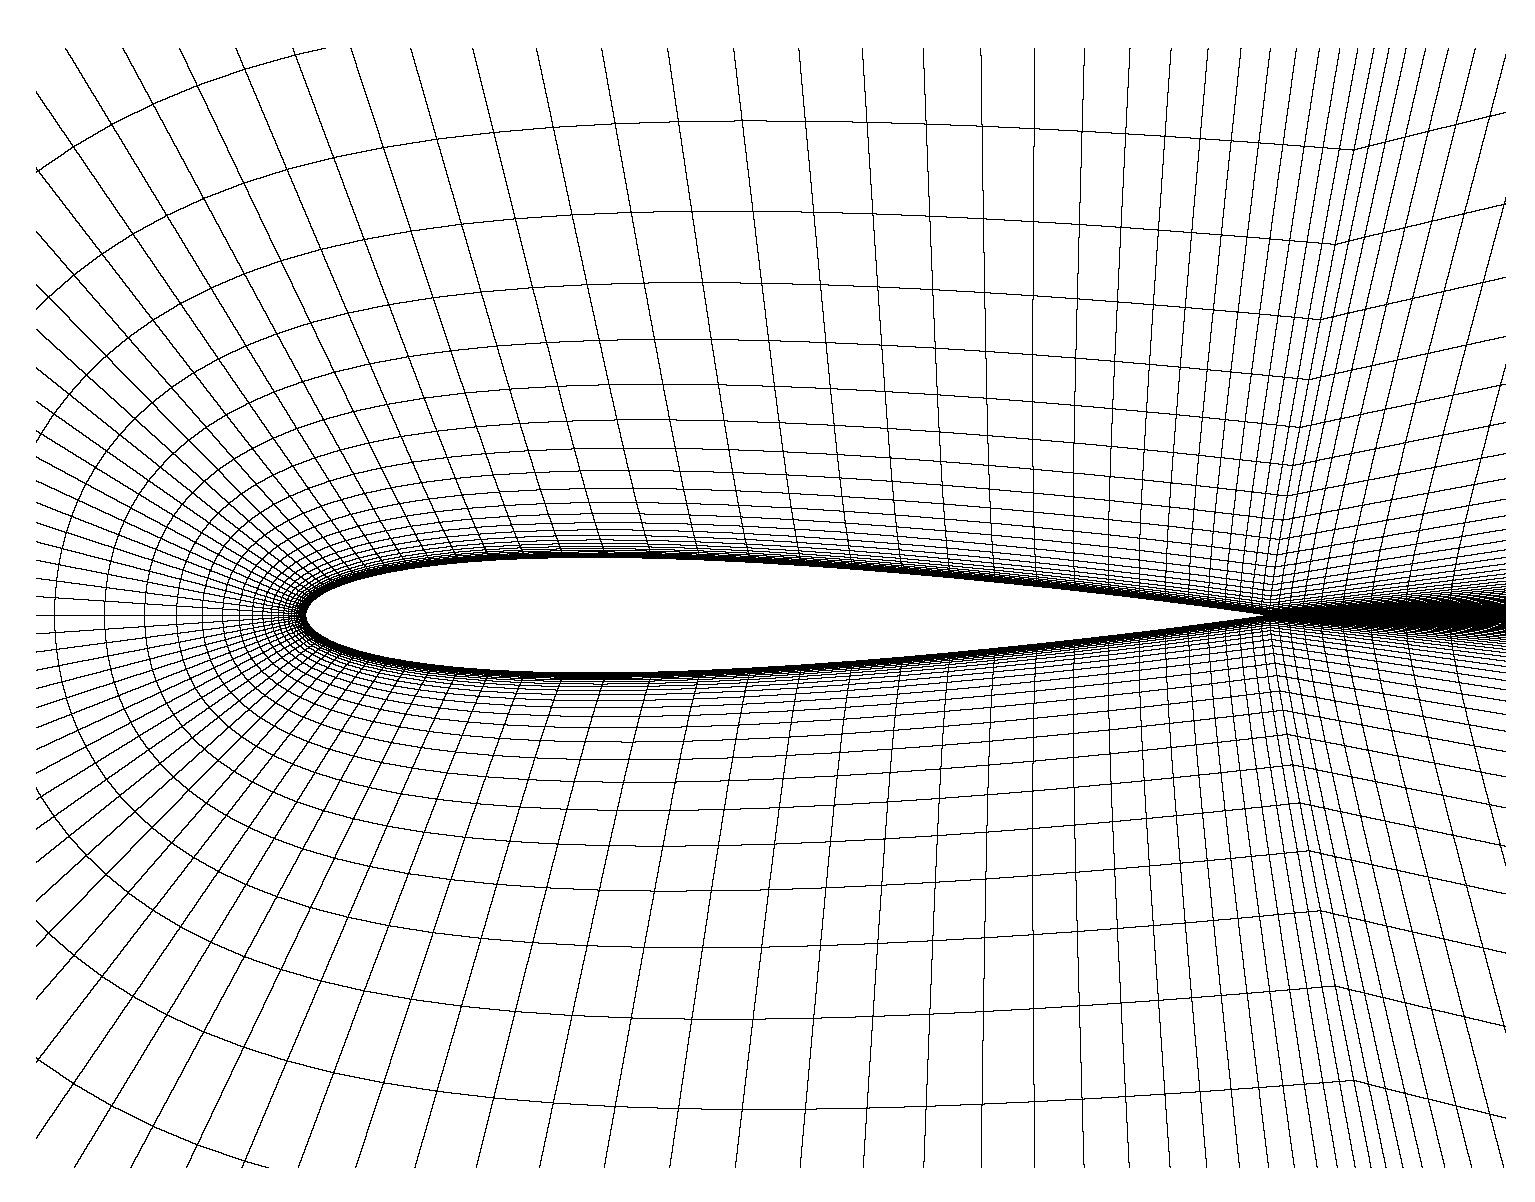
The mesh was a C-type structured grid with 641 × 129. The first cell height for the normal wall grids is about 4 × 10 6 c (see Figure 2). The growth rate of the cell size along the normal direction was 1.1. Ten time cycles with 100 time steps per cycle were simulated. In Figure 3 and Figure 4, the lift and moment coefficients agreed reasonably well with the results from [25].

3. Dynamic Model Decomposition

Dynamic mode decomposition (DMD) is a data-driven method that is capable of extracting the spatio-temporal coherent structures that arise in dynamical systems.
Consider a dynamical system from a CFD discrete form:
x i + 1 = R ( x i ) ,
where i is the time step at time t = i Δ t .
Then, a set of snapshots of flow fields x 1 , x 2 , , x m 1 , x m is collected from the CFD simulation, and then rewritten in the matrices X and X given by
X = | | | x 1 x 2 x m 1 | | |
and
X = | | | x 2 x 3 x m | | |
where the data matrix X is of size m × n , m is the number of snapshots, and n is the dimension of the collected data.
Define a linear operator A that satisfies
X = AX ,
which yields the operator A = X X , where † denotes the Moore–Penrose inverse.
In the fluid flow, since the CFD state vector is typically high-dimensional, the eigen-decomposition of A has to be approximated. One of the commonly used techniques is to leverage an SVD of the snapshot matrix X to obtain the low-rank approximation of A , i.e.,
X = U Σ V * a n d X = AU Σ V * .
Truncate the SVD by selecting the r-dominant singular values and their corresponding modes. Define a low-rank r linear operator A ˜ :
A ˜ = U * X V Σ 1 = U * AU .
where A ˜ has the same eigenvalues as A .
Following the deduction of [26], the DMD modes are extracted:
Φ = X V Σ 1 W ,
where W is the eigenvector matrix of A ˜ .
The amplitude of the DMD modes b is computed using b = Φ x 0 , where x 0 is the initial condition.
The mode selection is critical for the reflection of the dynamic behaviors. The typical choice is based on the magnitude of the amplitudes b. However, the noise in the data may produce modes with large amplitudes and smaller eigenvalues. This leads to the selected modes with a rapid decay but little contribution to the reconstruction [27]. In this study, a mode selection criterion presented by Kou et al. [16] was used based on the eigenvalue-weighted amplitudes:
I k = j = 0 N 1 | b k λ k j Δ t |
where b k is the magnitude of the amplitude of mode k; N is the total mode number; and Δ t is the time interval, which was constant in this study.

4. Interaction between Buffeting Flow and the Heaving Airfoil

4.1. Case Description

In this study, the coupling characteristics of the heaving OAT15A airfoil with the buffeting flow were M = 0.73, R e = 6.2 × 10 6 , and AOA = 3 . 5 . The buffeting flow past a stationary airfoil at the same flow condition was considered as a baseline case. The heaving frequency was chosen as a linear function of the buffeting reduced frequency f buffet , i.e., f = n f buffet , n = 0.25 , , 2.5 , where f buffet is the primary frequency of the flow past a stationary OTA15A airfoil at M = 0.73, R e = 6.2 × 10 6 , and AOA = 3.5 . The non-dimensional heave amplitude was chosen as A m = 0.002 / 0.01 / 0.02 . The aerodynamic performance and coupling characteristics were investigated parametrically.

4.2. Aerodynamic Analysis

The time-averaged lift coefficients of the supercritical airfoil with different heave amplitudes and frequencies are shown in Figure 5a. For the heave amplitudes of A m = 0.02 and A m = 0.01 , the average lift coefficient remained stable, as the frequency did not exceed 0.6 f buffet . At A m = 0.01 and f = 0.6 f buffet , the lift coefficient decreased by 2.1% compared with 0.8732 for the stationary airfoil. When the heaving frequency increased from f = 0.6 f buffet to f buffet , the average lift coefficient dropped sharply to reach a minimum at the buffeting frequency. For A m = 0.02 and f = f buffet , the lift coefficient decreased by up to 13.3%. The phenomenon that showed a dramatic reduction in the lift coefficients from f = 0.25 f buffet to f = f buffet and a gentle increase after f = f buffet was similar with the transonic dip observed in the aeroelastic system [6].
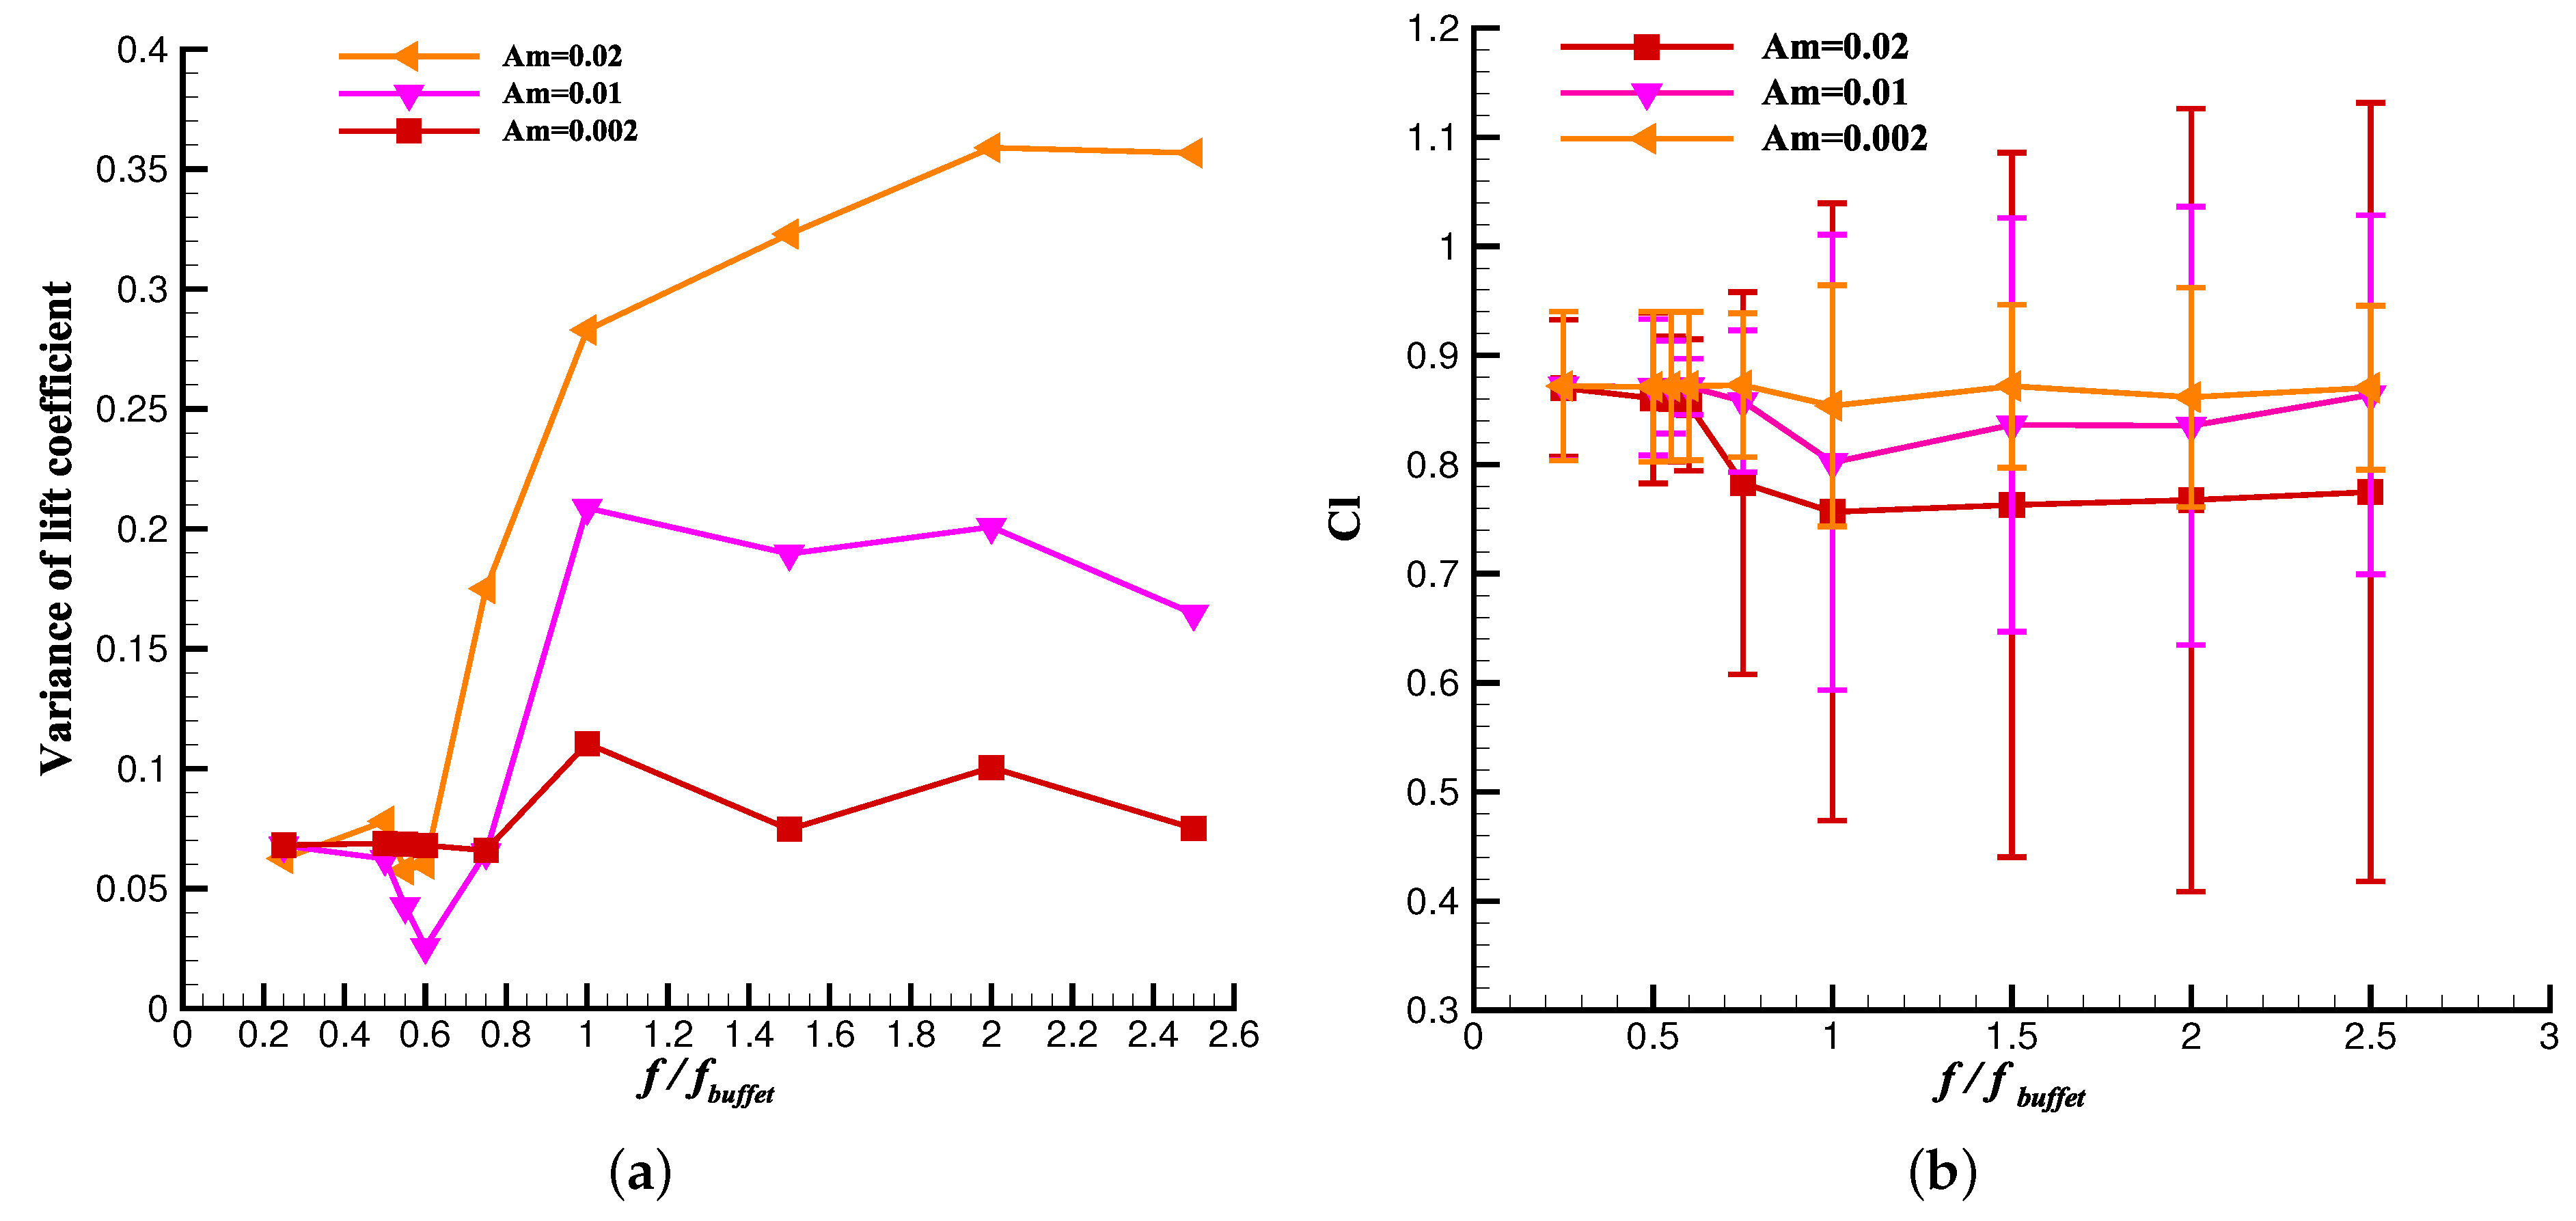
The variation in the lift coefficient with the heaving frequency was measured by the standard deviation, as shown in Figure 6. At a small amplitude of A m = 0.002 , the time-averaged value and standard deviation changed within a limited range. At a higher amplitude of A m = 0.02 , the mean lift coefficient changed abruptly for f f buffet , whilst the variance in the lift coefficient increased for f f buffet .
The standard variance in the lift coefficient was relatively stable for f 0.6 f buffet . It was observed that the variance dropped from 0.061 at f = 0.5 f buffet to 0.027 at f = 0.6 f buffet in the case of A m = 0.01 . The decrease in the variance indicates that the transonic flow responded to the increased heave amplitude. The self-sustained shock wave/boundary layer began to interact with the heave motion. Further frequency analysis and flow pattern analysis explained the drop caused by the transition of the double shock induced by the heave frequency. The standard deviation also greatly increased with the oscillating frequency at the buffeting flow. As the heaving frequency increased beyond f = f buffet , the average lift coefficient increased slightly, while the standard deviation changed gently at A m = 0.01 and A m = 0.002 , but significantly increased at A m = 0.02 . It is known that the amplitude of the oscillation can be used as the energy indicator for the input oscillation. The heaving motion with a greater amplitude inputs more energy into the flow and substantially alters the flow. From the dynamic mode analysis in the subsequent section, it is seen that the aerodynamic response was predominantly determined by the heave amplitude rather than the inherent shock wave/boundary layer interaction at A m = 0.02 .
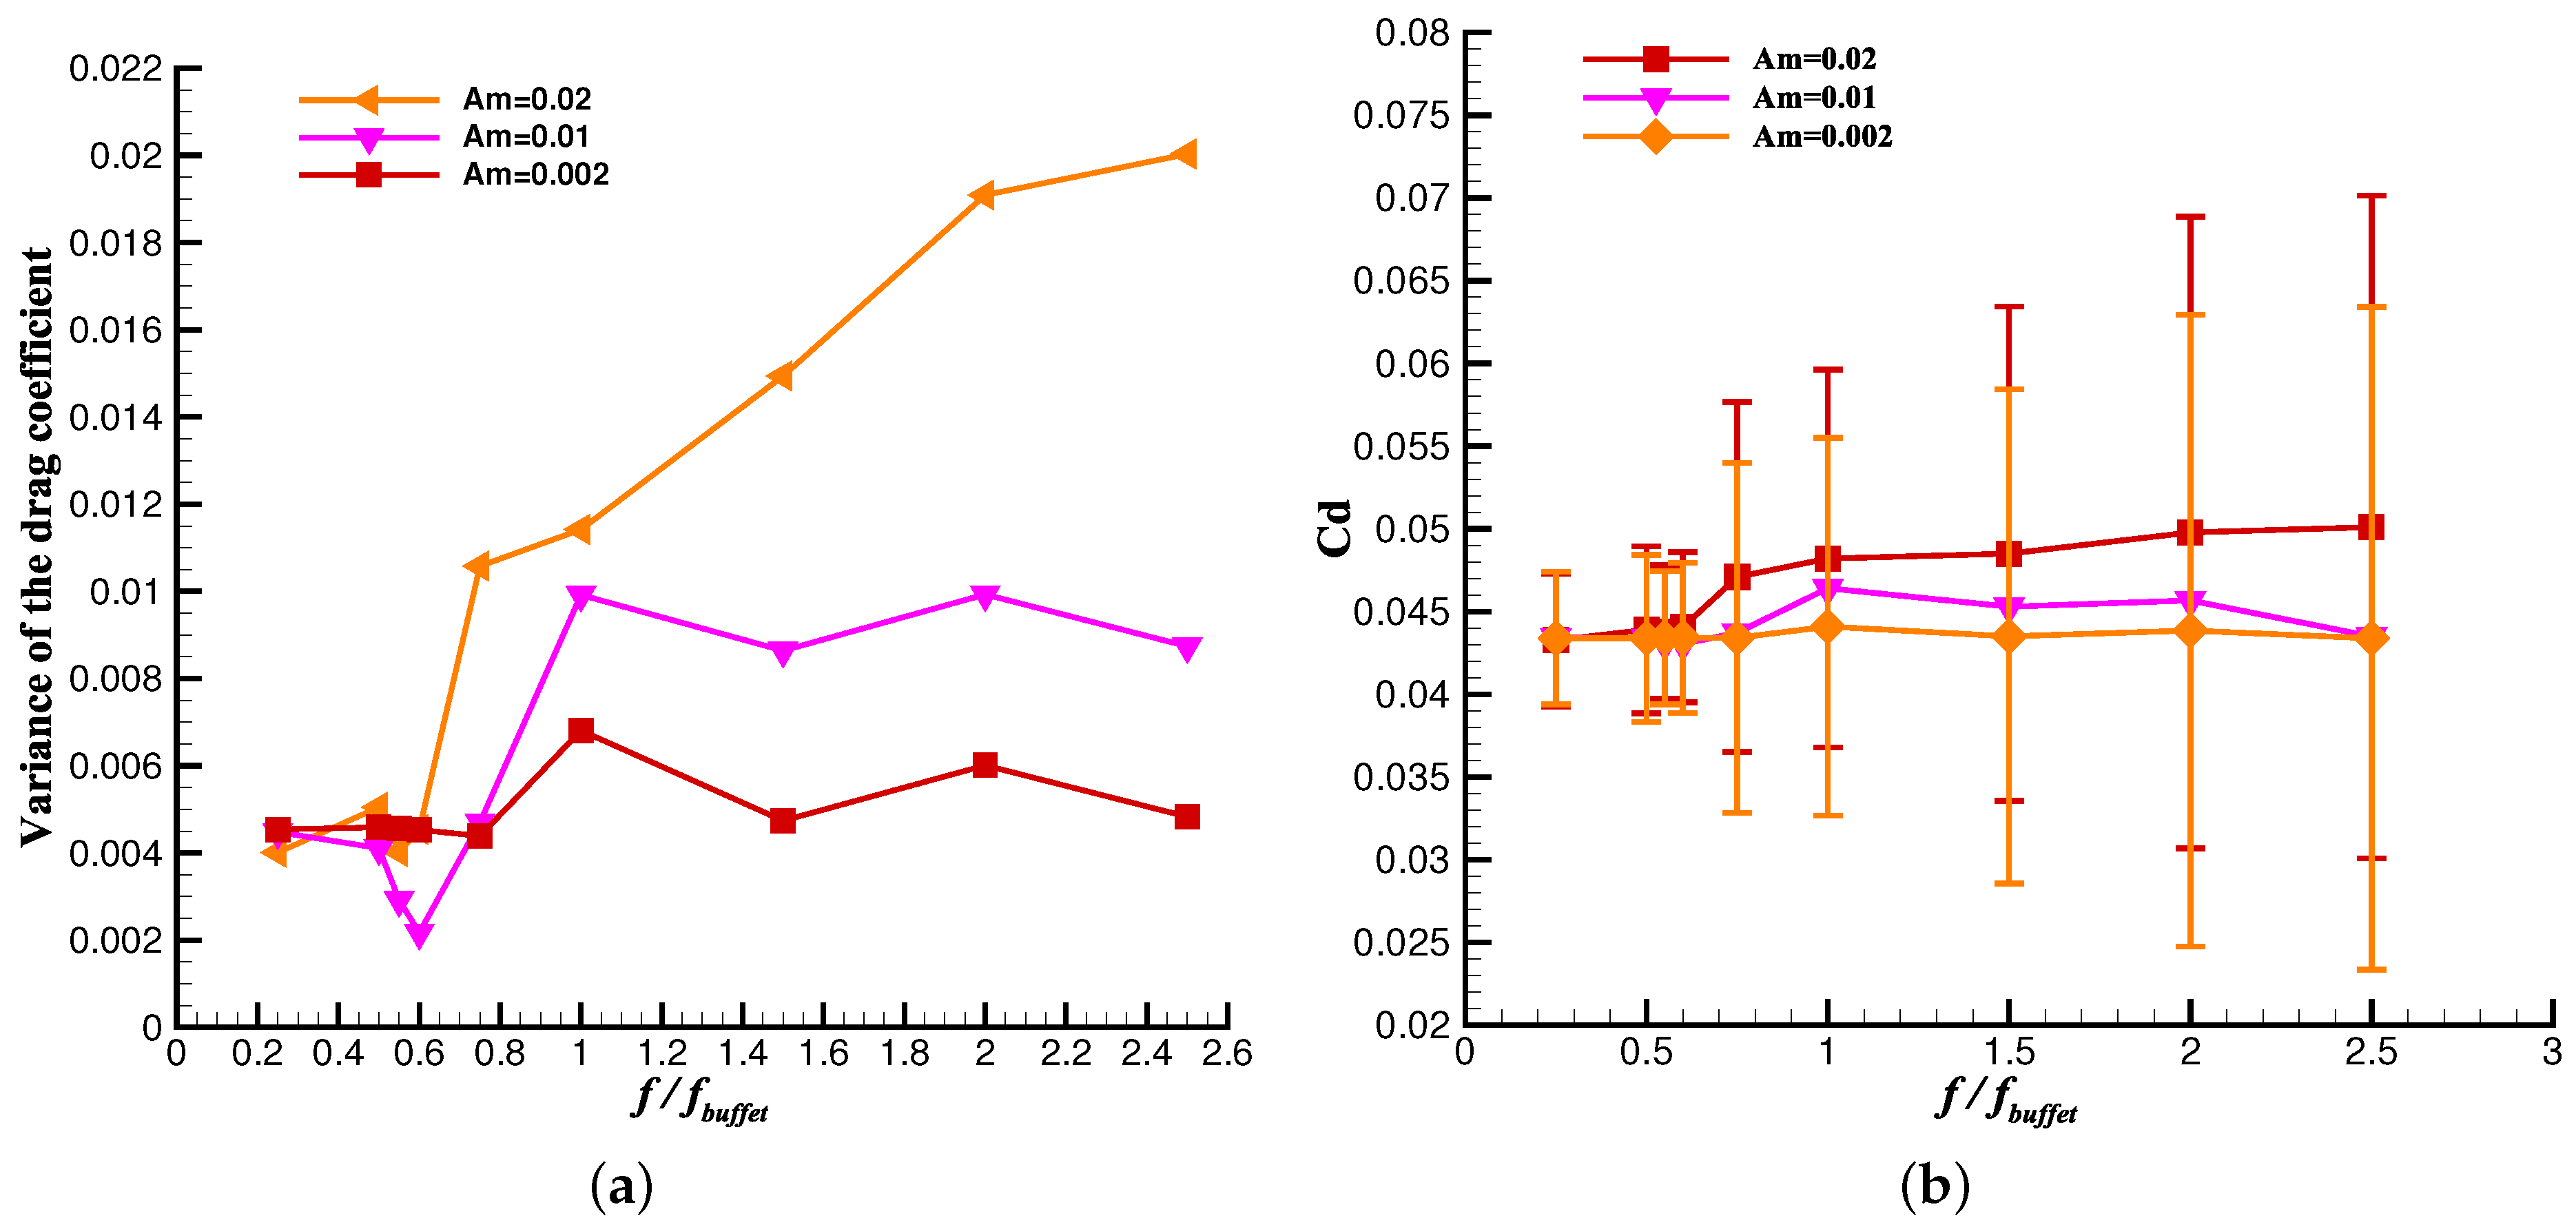
Figure 5b presents the time-averaged drag coefficients of the airfoil with different heaving parameters. When the frequency was below f = 0.6 f buffet , the drag coefficient remained nearly constant. As the heaving frequency increased from f = 0.6 f buffet to f = f buffet , the time-averaged drag coefficient significantly rose. For frequencies greater than f buffet , the changes in the drag coefficient were similar to the variations in the time-averaged lift coefficient. A rising trend was observed in the standard deviation of the drag coefficient, as shown in Figure 7, while the impact of the amplitude on the drag coefficient exhibited a similar manner with the lift coefficient.

4.3. Frequency Analysis

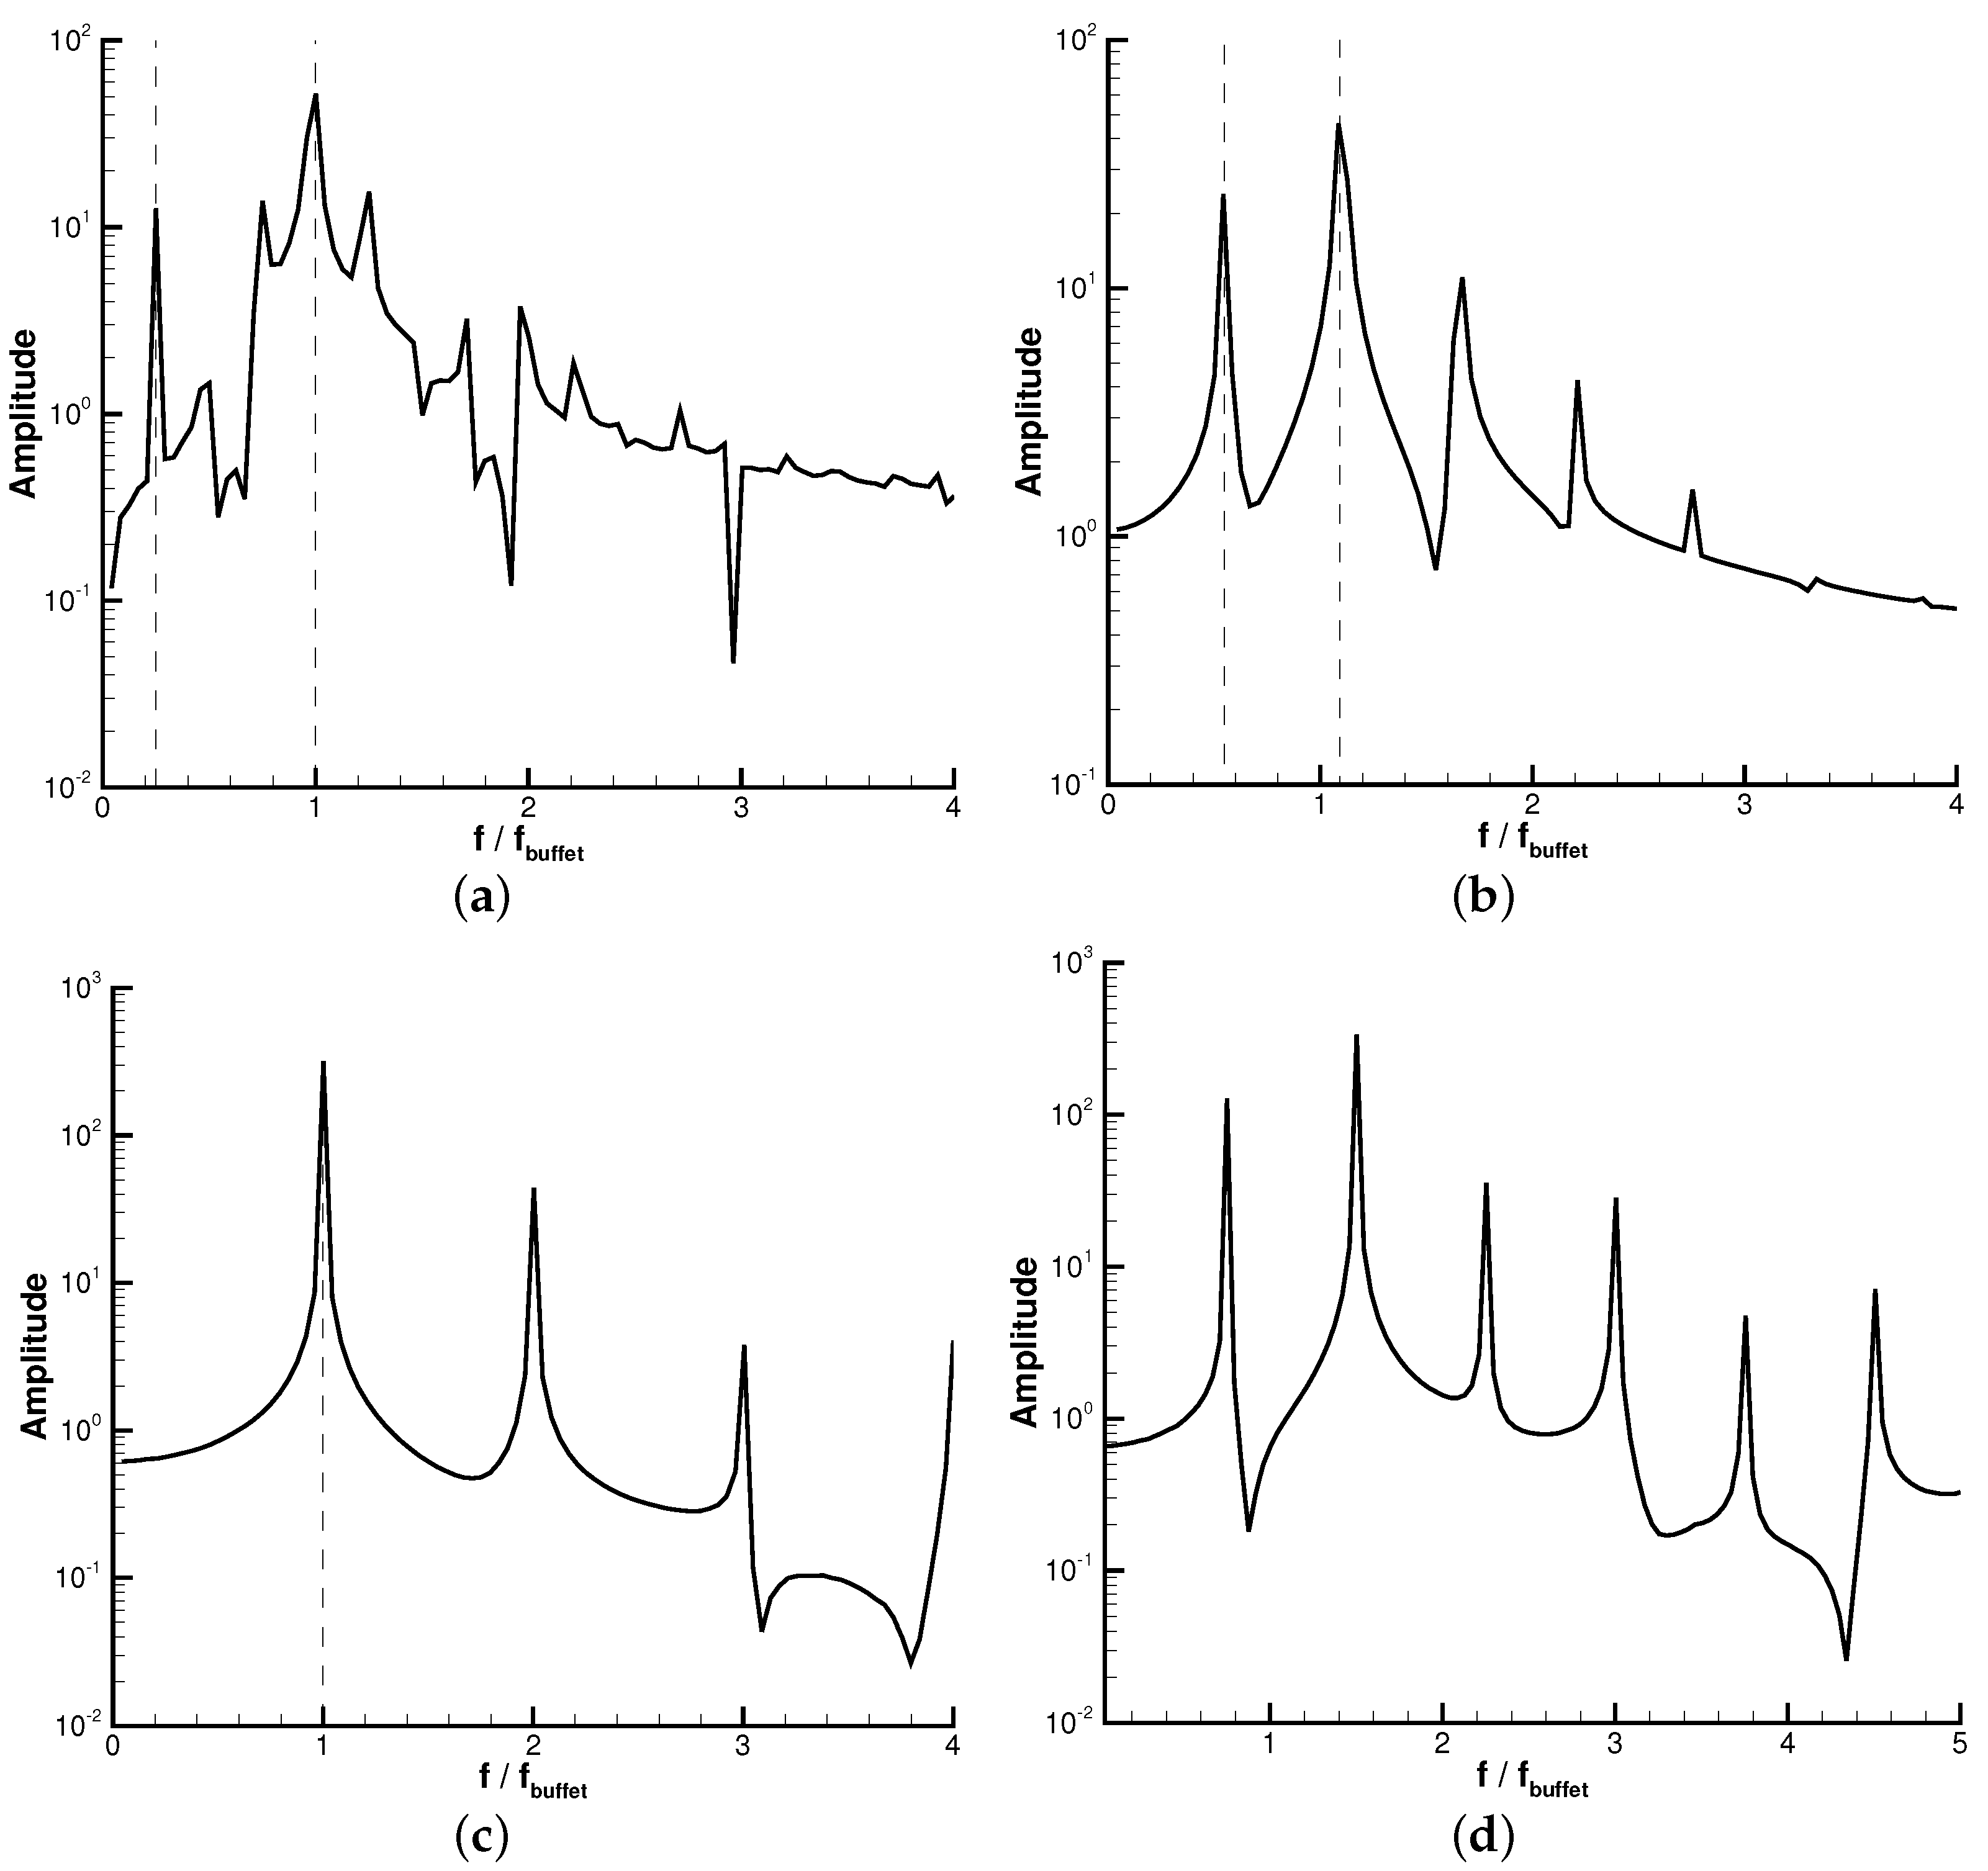
Figure 8 shows the spectrum characteristics of the flow response under the heave motion with different frequencies and the amplitude of A m = 0.01 . The frequency spectrum was derived from the fast Fourier transformation of the time history of the lift coefficient. Based on the primary peak frequencies in the spectrum, the lift coefficient response could be categorized into three types:
  • Buffet frequency response in Figure 8a: The flow response was characterized by the buffet reduced frequency for the transonic shock wave boundary layer interaction. The impact of the heave motion was negligible. The spectrum amplitude corresponding to the frequency spectrum was relatively small.
  • Transitional response in Figure 8b: The heave frequency and its double harmonics are observed in the spectrum. However, the dominant frequency was near the buffet range. This is a transition phase where the impact of heave motion became competitive with the inherent oscillating shock wave boundary layer interaction. In this phase, the lift coefficient experienced a significant drop of 12% from f = 0.55 f buffet to f = f buffet .
  • Heaving frequency lock-in response in Figure 8c,d: The spectral amplitude with the inherent buffet frequency was weakened. The flow response exhibited the harmonic motion of a given heave frequency with super-harmonics.
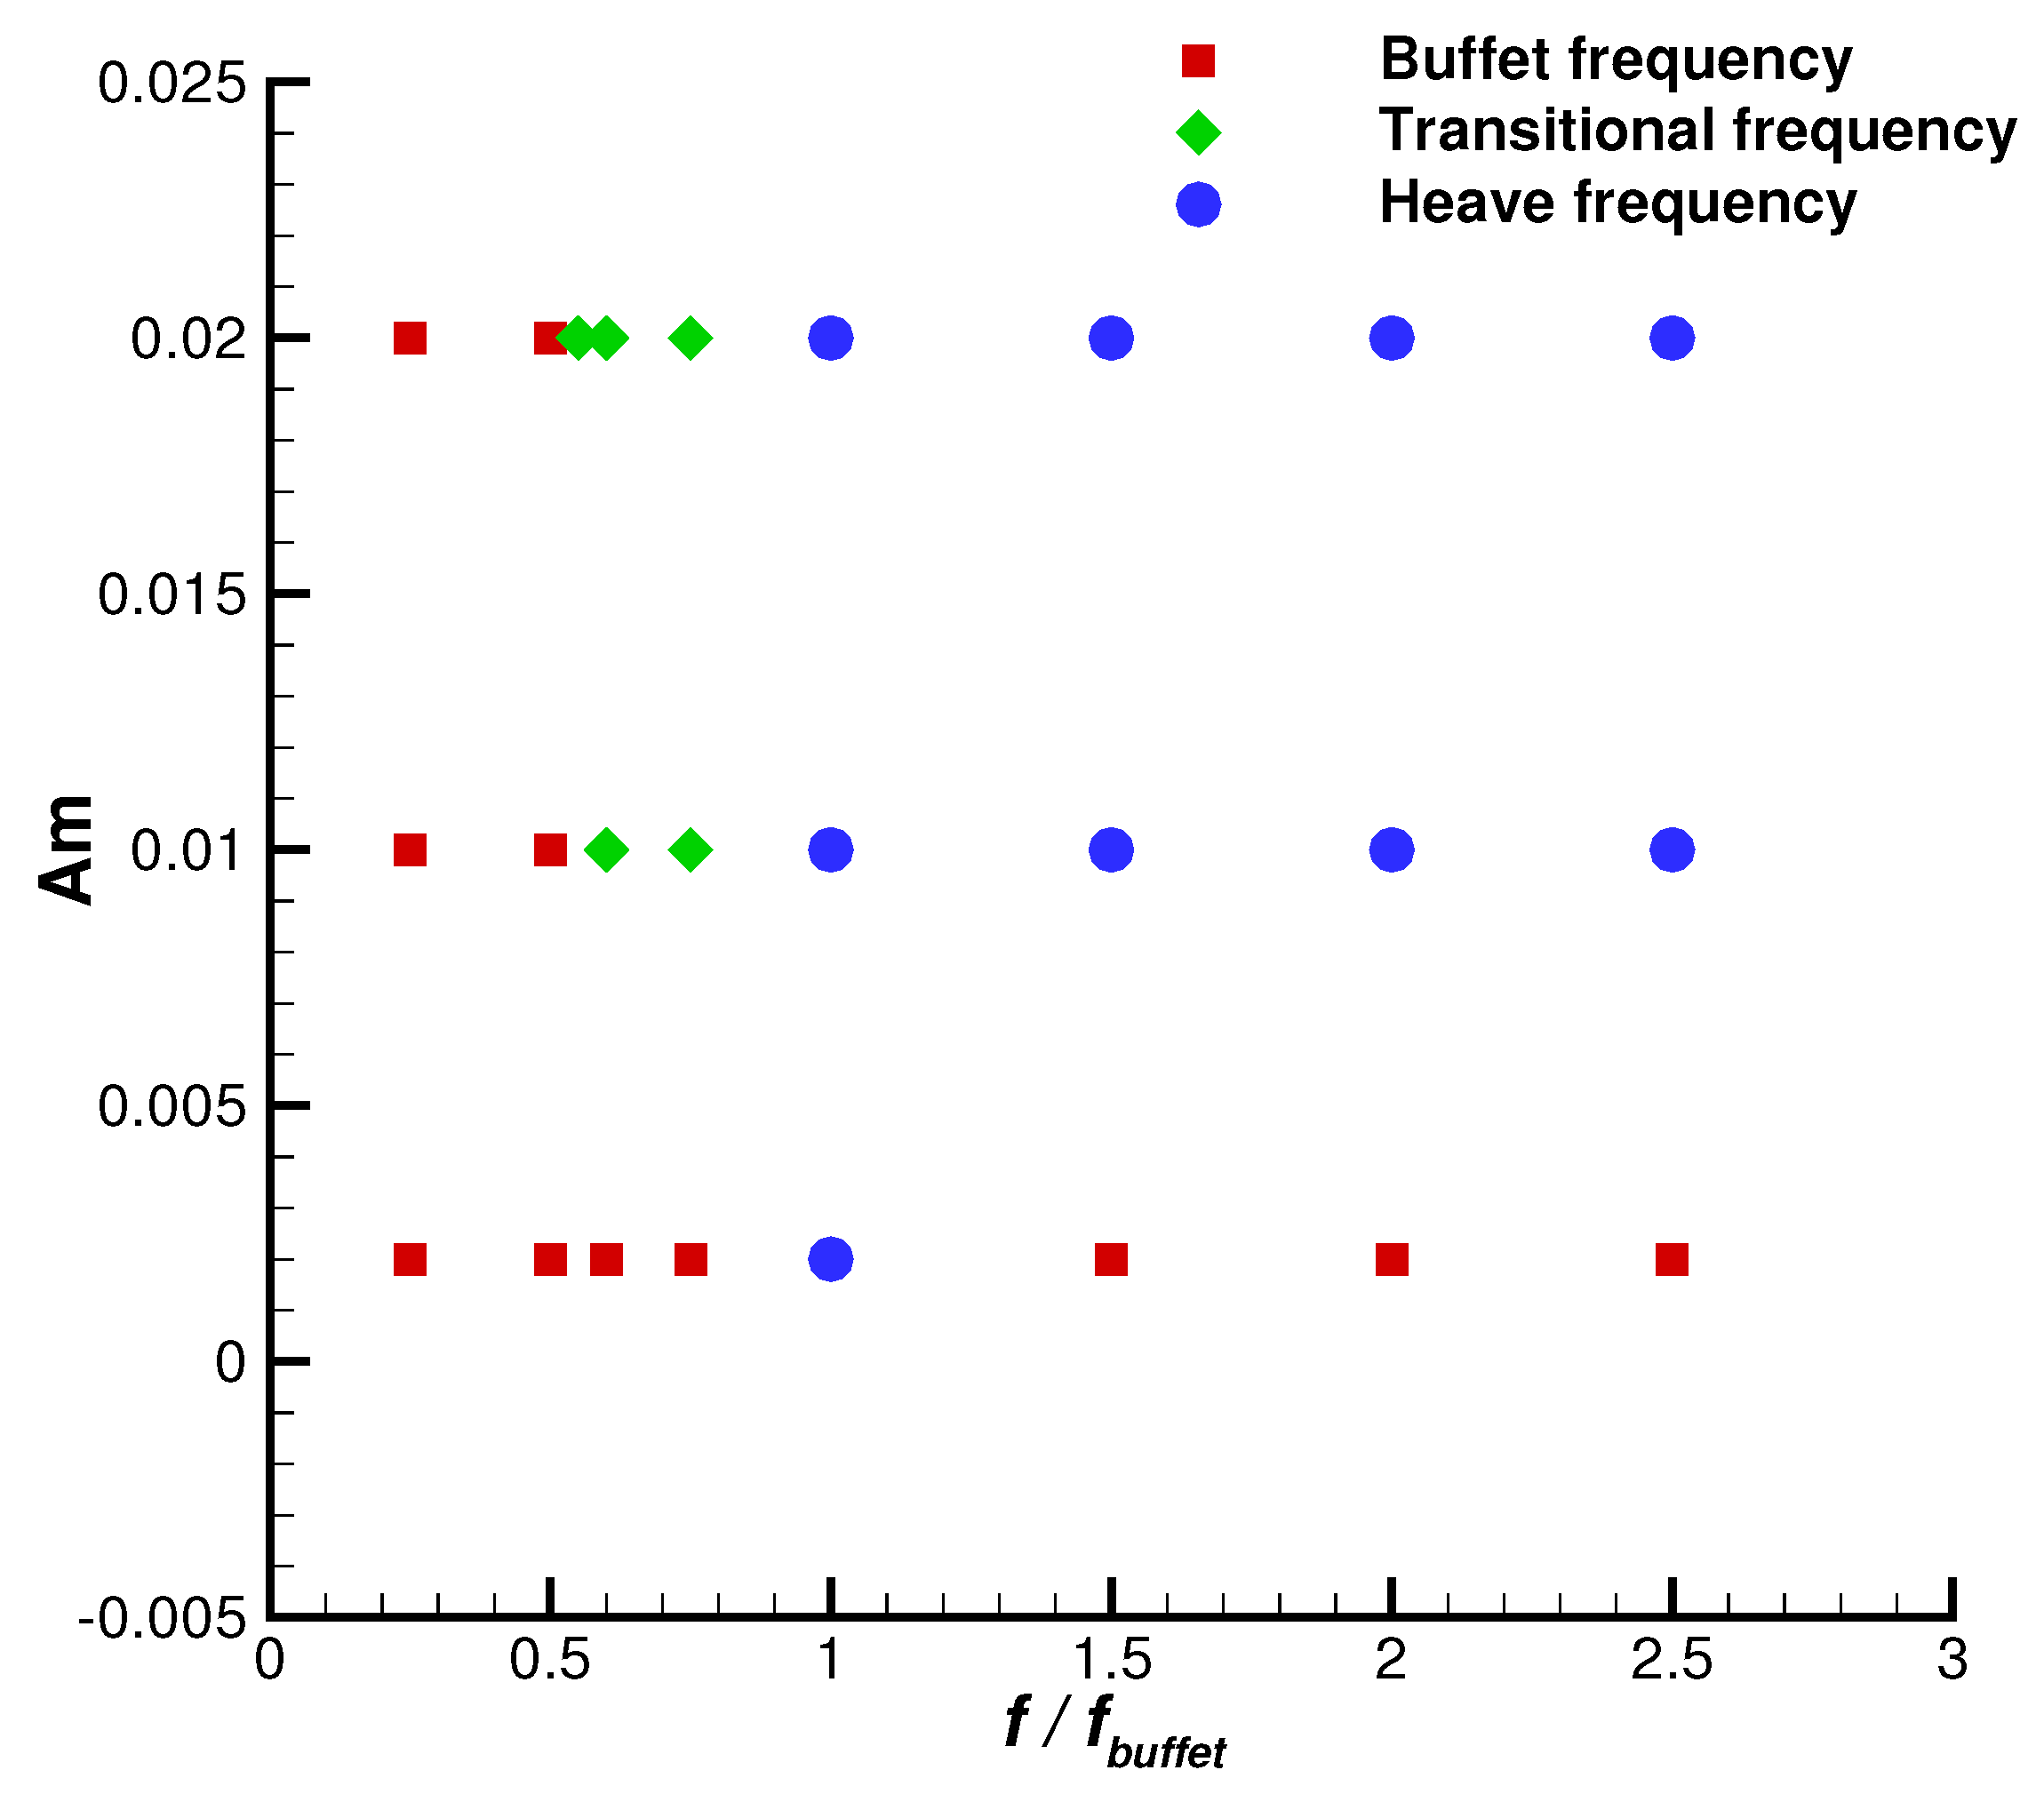
Figure 9 further illustrates the frequency characteristics of the lift coefficient response under different combinations of the heave motion amplitude and frequency. It is evident that the flow response frequency characteristics were influenced by both the motion amplitude and frequency.
When the amplitude of the heave motion was small at A m = 0.002 , the lift coefficient response was consistently dominated by the buffet frequency, regardless of the changes in the motion frequency, which corresponded to the type I response. In this scenario, the variation in the lift coefficient was minimal. For instance, in Figure 5a, at a frequency of f = f buffet , the minimum lift coefficient was 0.8539, which was only a 2.2% decrease compared with the stationary airfoil’s lift coefficient.
As the amplitude increased sufficiently to A m = 0.01 , the response at the shock buffet frequency began to synchronize with the airfoil motion frequency at a higher actuation frequency of f = 0.55 f buffet . In this transition to the type II response, as previously mentioned, there was a significant change in the buffet intensity with more dominant peaks that led to significant changes in the time-averaged value and its variance in the lift and drag coefficients. In this case, the response frequency was at the shock buffet/airfoil motion frequency and dominant in the near-buffet range. As the frequency was further increased to f f buffet , the flow frequency locked onto the frequency of the airfoil’s heave motion. In these cases, the frequency spectrum in the flow exhibited airfoil motion frequencies and their super-harmonics. This phenomenon where the flow-responding frequency locks into the heaving airfoil motion frequency at the combinations of airfoil motion frequencies and amplitudes is known as frequency lock-in [11,22].
When the motion frequency was higher than the buffet frequency, the resulting flow oscillation became harmonic. The mean aerodynamic force changed slightly. For example, as shown in Figure 5, when the amplitude was A m = 0.02 and the frequency exceeded f buffet and continued to rise, the lift coefficient changed by 2.3%. However, due to the greater energy input from the driving motion of the airfoil, the variance in the aerodynamic force was highly enhanced by the amplitude of the heave motion.

4.4. Flow Pattern Analysis

4.4.1. Flow Field Analysis

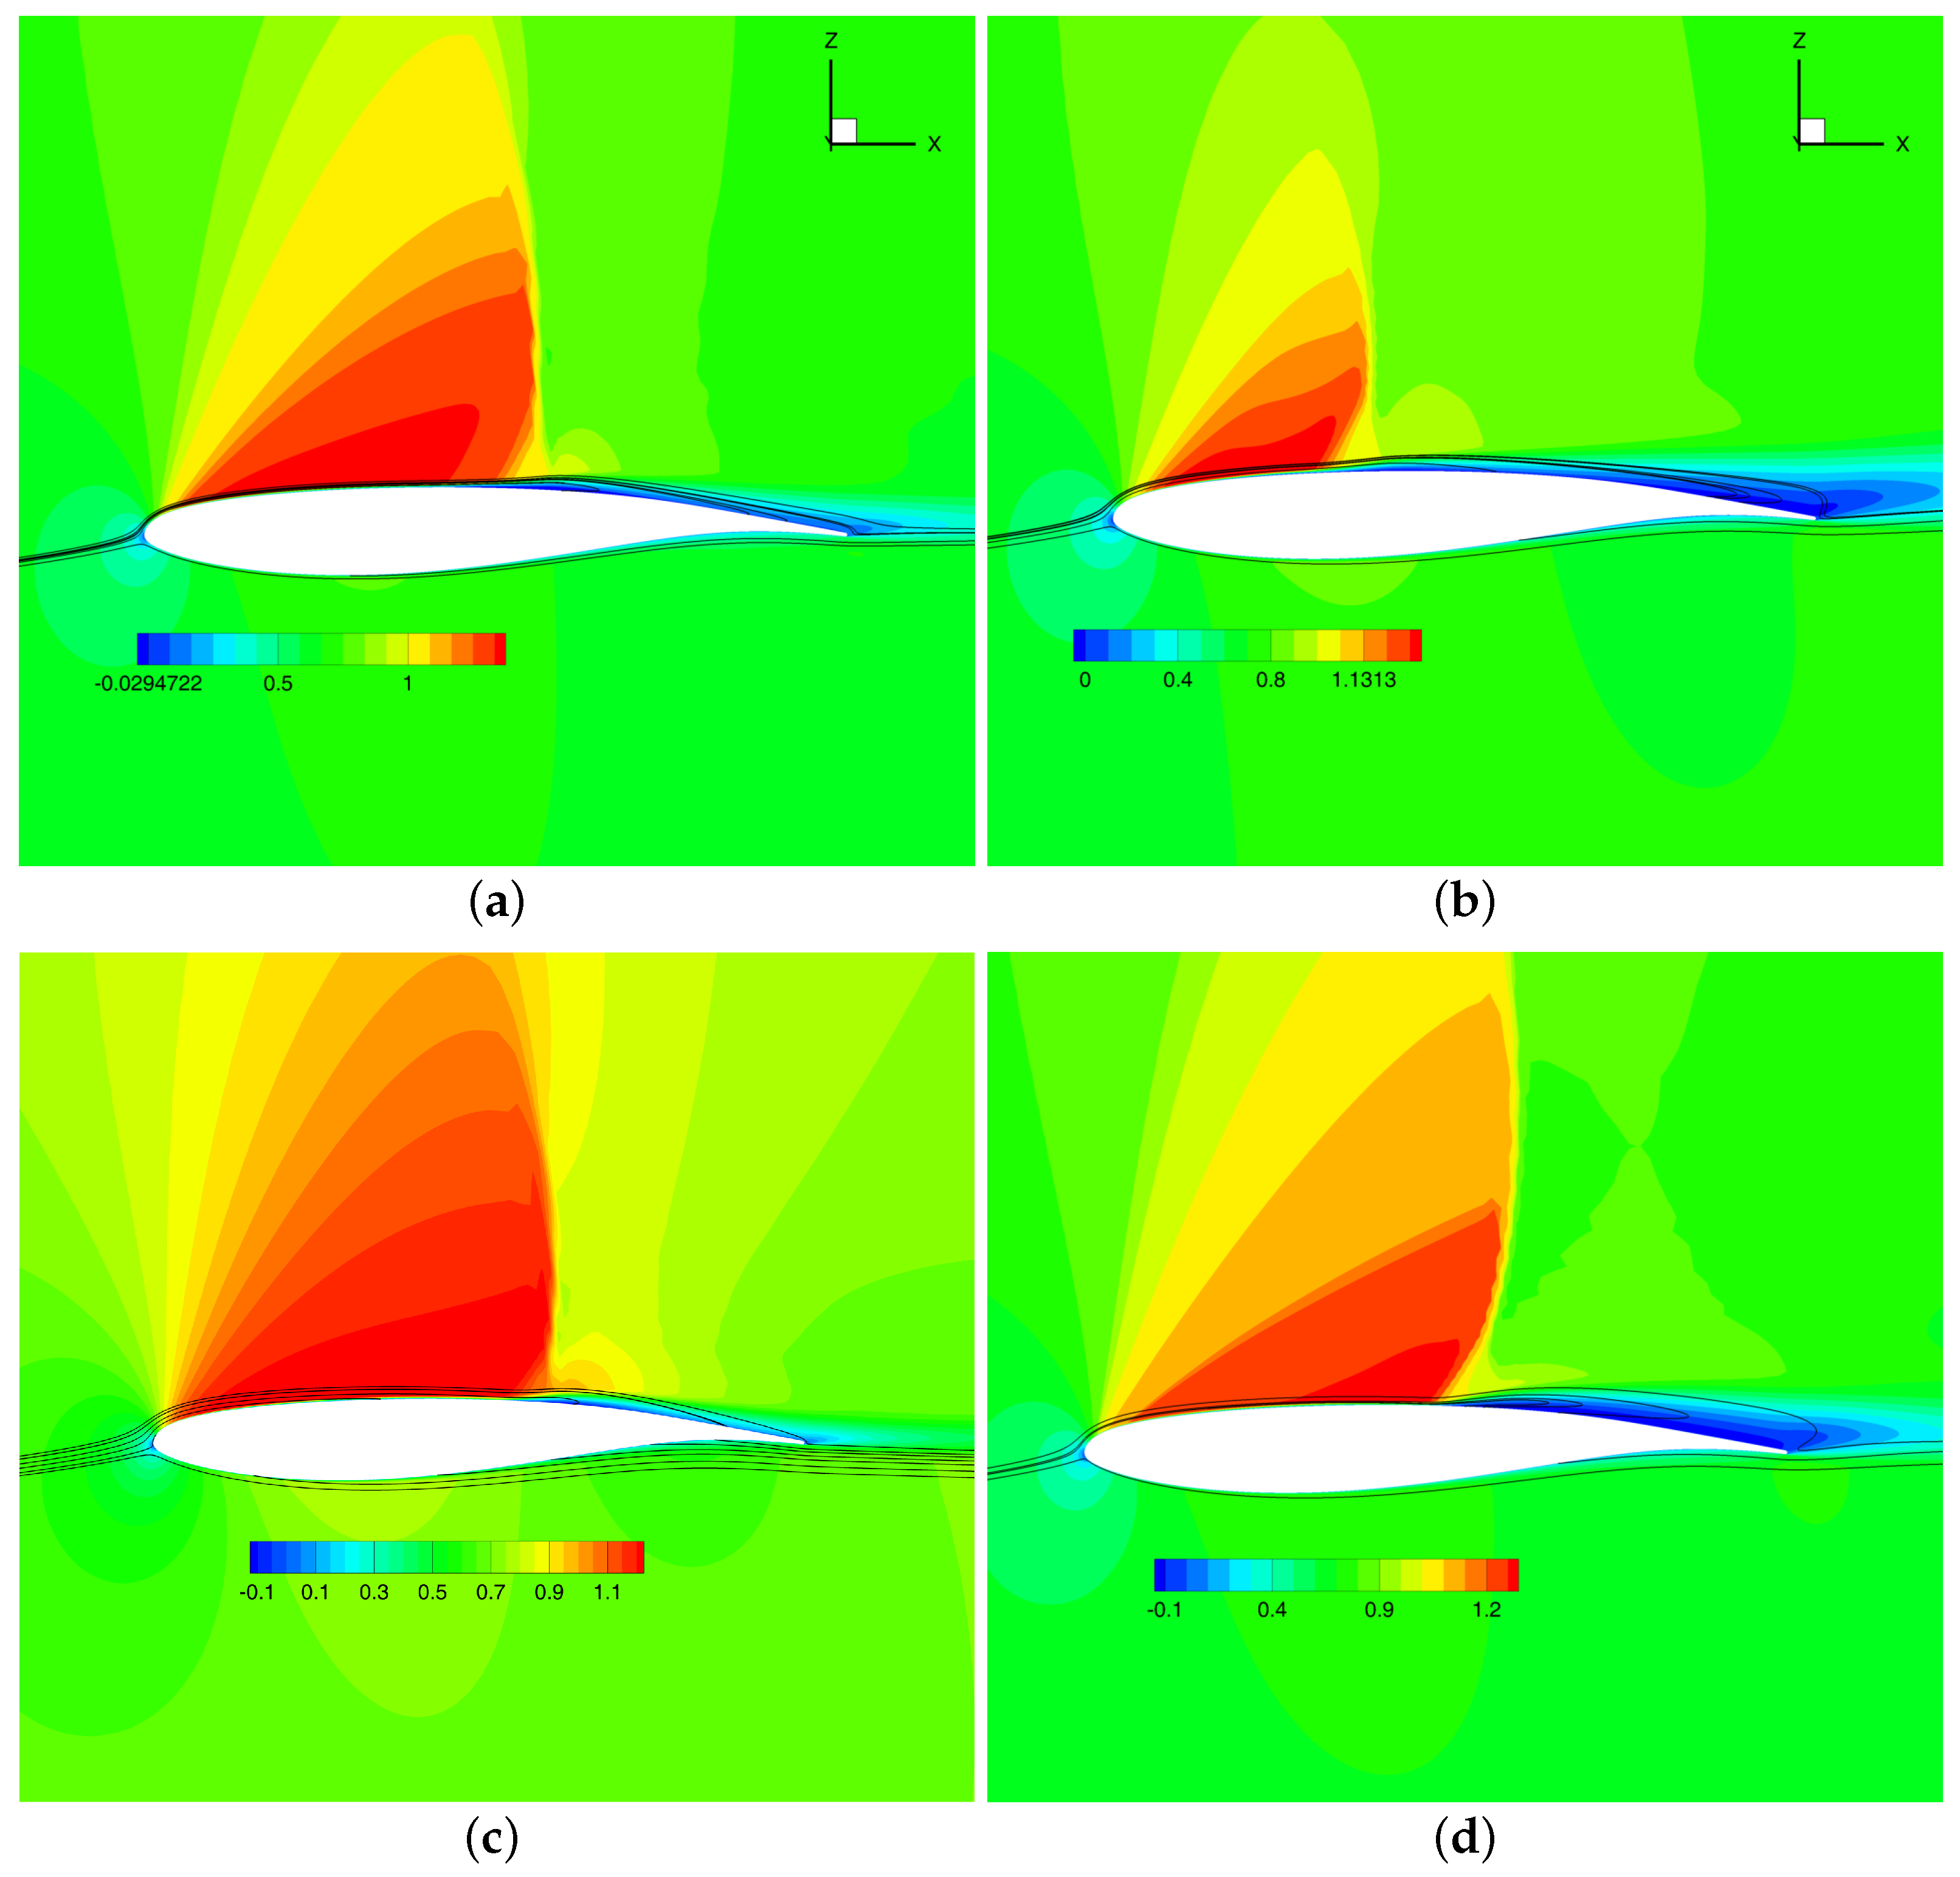
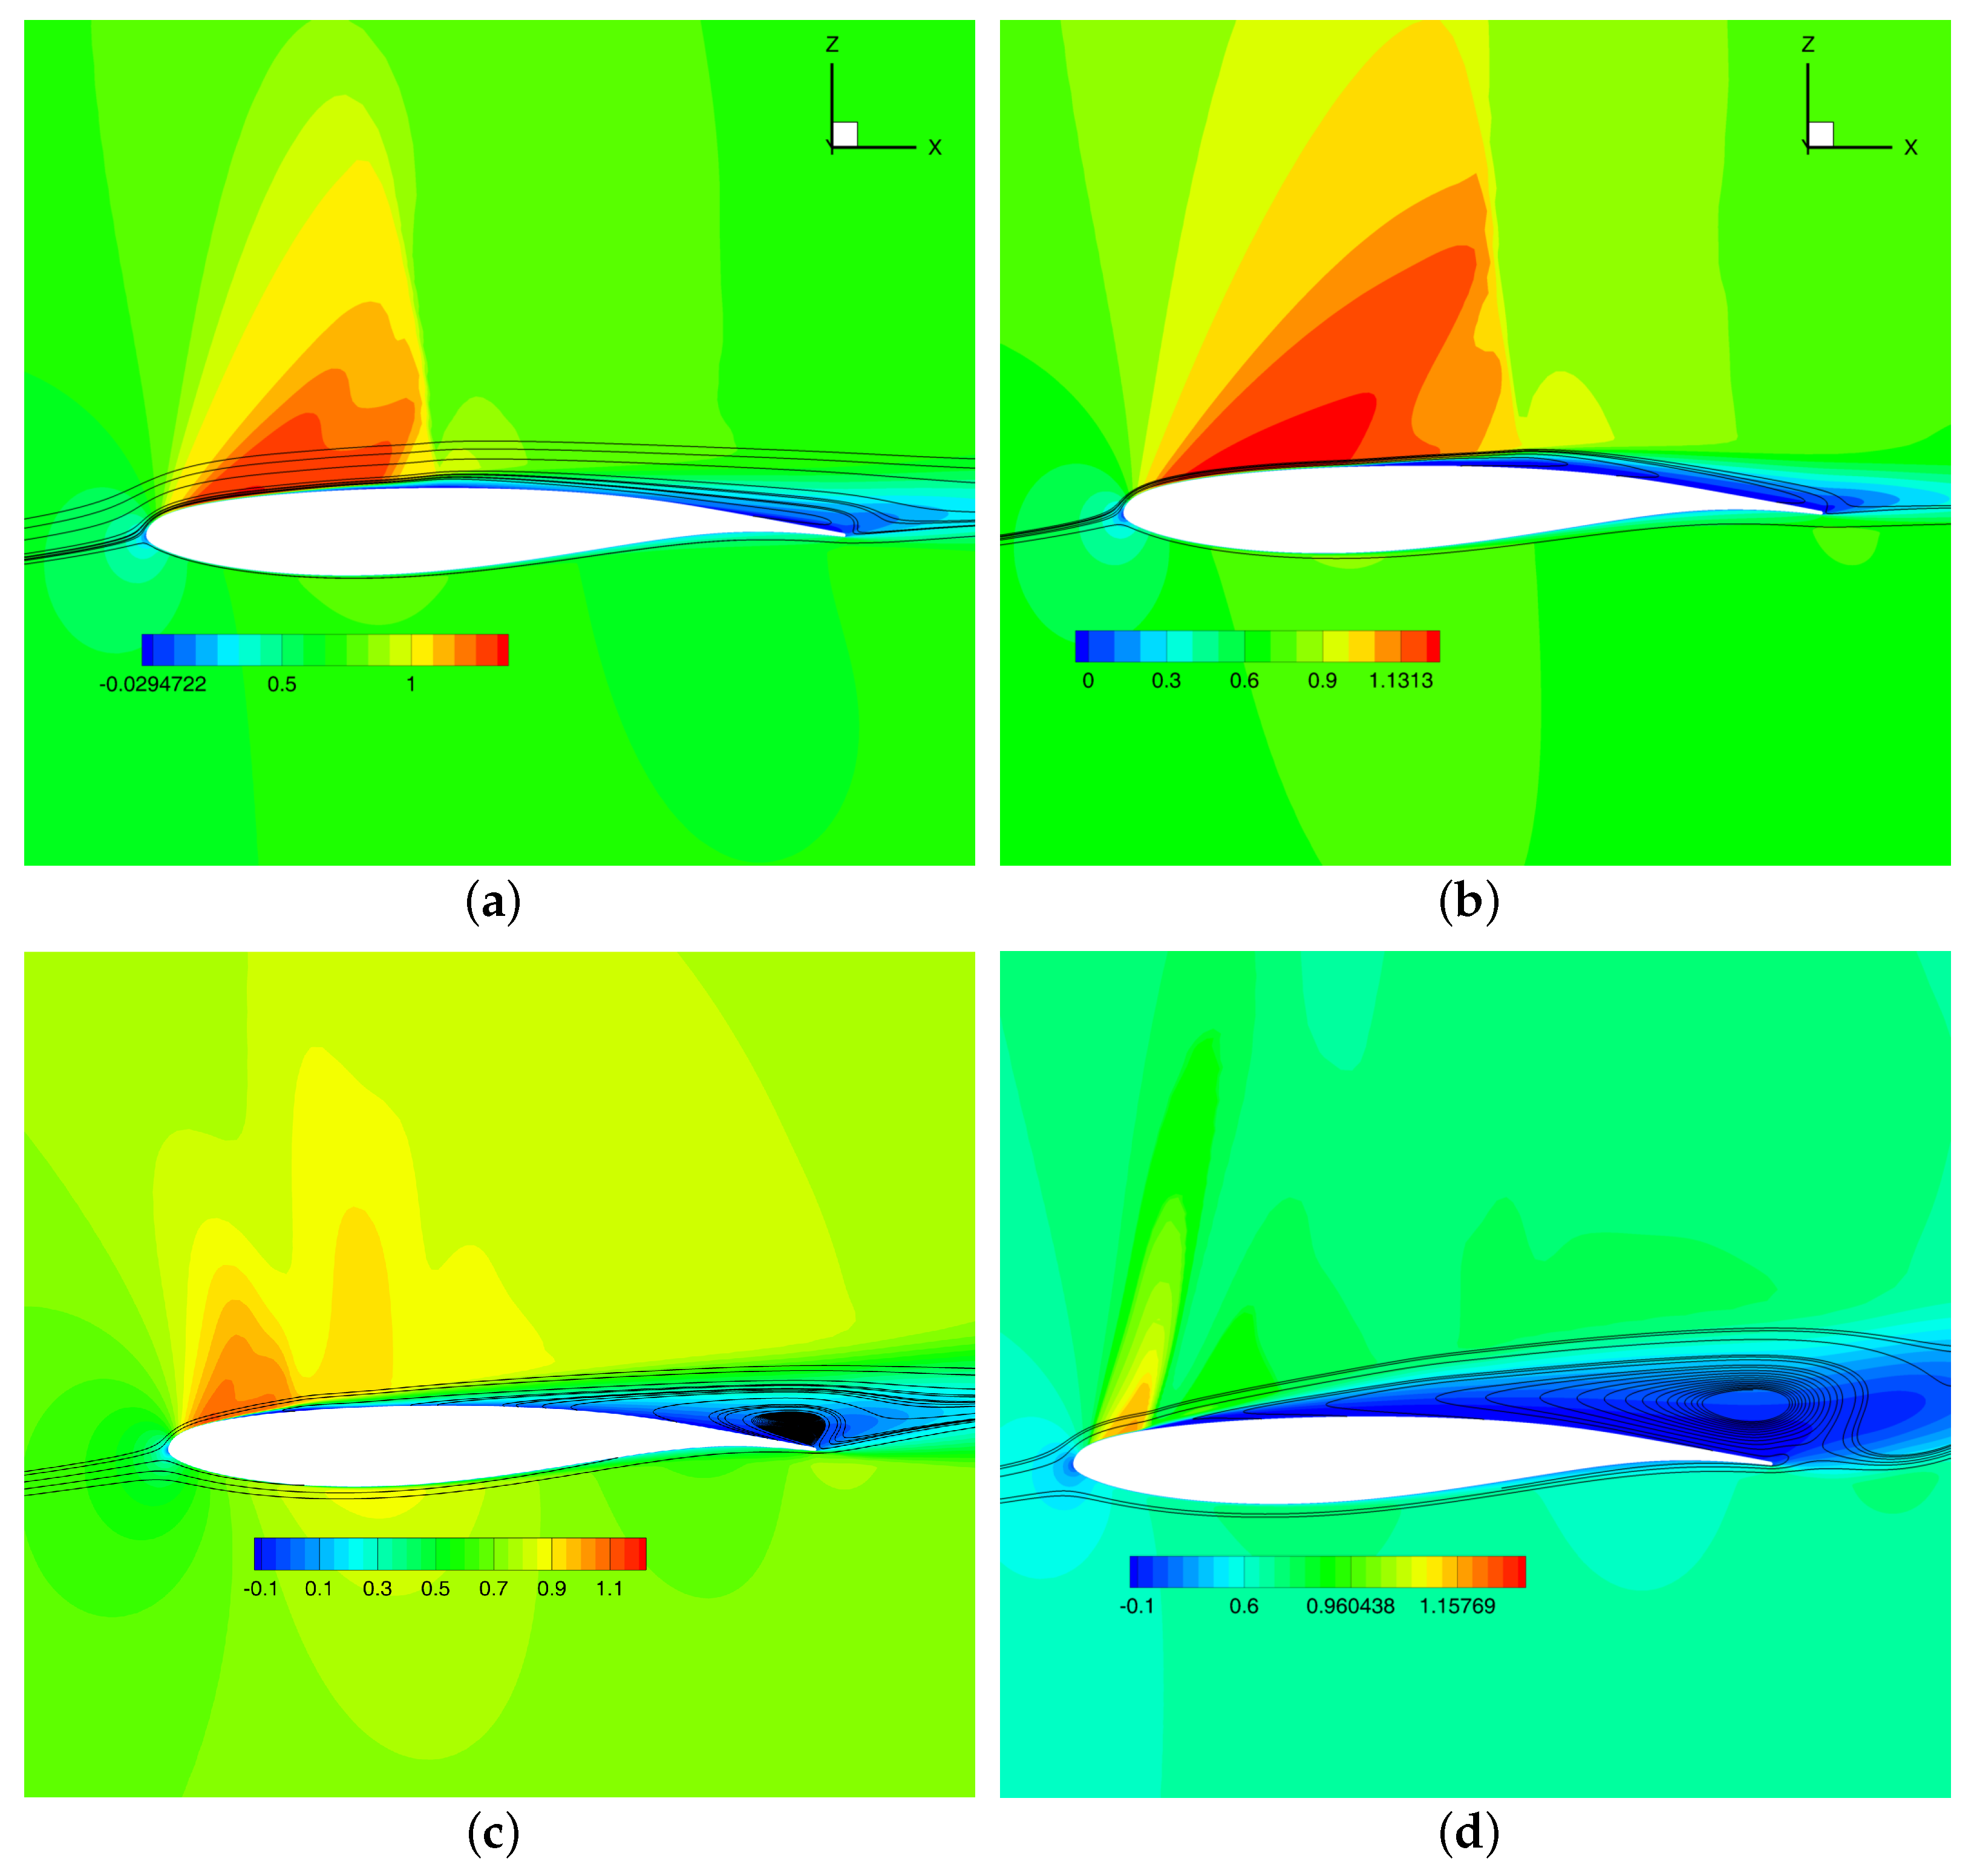
Figure 10 presents the u-velocity contour around the transonic airfoil with different heave frequencies and A m = 0.01 at the time of the maximum lift coefficients of the airfoil. The u-velocity contours at the time of the maximum lift coefficients exhibited similar flow pattern with different heave frequencies. The shock was formed on the upper surface coupling with the separation bubble covering the rear section of the airfoil, i.e., the recirculation zone. The main difference between these cases lays in the length and its strength of the recirculation zone. It is seen in Figure 10 that the length of the recirculation zone that covered the rear surface of the airfoil increased from 43% of the chord length at f = 0.25 f buffet to 65% of the chord length at f = 0.55 f buffet , and then decreased from 41% of the chord length at f = f buffet to 45% of the chord length at f = 1.5 f buffet . Furthermore, the velocity magnitude in the recirculation zone increased with the heave frequency, which implies the vortices induced by the separation were strengthened by the heave motion, which enhanced the lift.
Figure 11 presents the u-velocity contour around the transonic airfoil with different heave frequencies and A m = 0.01 at the time of the minimum lift coefficients of the airfoil. During the upstroke stage of the heave motion, the lift coefficients of the airfoil for all these four cases reached their minimum values. However, the flow patterns associated with the different heave frequencies were quite distinct. It is seen that the separation bubble was enlarged with the increase in the oscillating frequencies. The flow separated at x = 0.34 c at f = 0.25 f buffet , which approximated to the separation location for the baseline case (the stationary airfoil). When the frequency increased to f = 0.55 f buffet , the shock wave/boundary layer interaction was influenced by the heave motion. The separation bubble moved upstream and induced a secondary shock formed at x = 0.55 c . As the frequency reached f = f buffet , the vortex in the recirculation zone was enhanced with the increased velocity magnitude. The strengthened separation compelled the shock to move upstream. As the separation point continued to move upstream at f = 1.5 f buffet , the interacted shock was pushed back to the leading edge. The typical shedding vortex structure was observed on the upper surface, which accounted for the aerodynamic enhancement shown in Figure 5.

4.4.2. Dynamic Mode Decomposition Analysis

Although the flow contour and streamline are the straightforward tools used to identify the flow structure, the relation between the heave motion and inherent spatial-temporal structures in the flow field is still unclear. In this section, the dynamic mode decomposition (DMD) method was employed to gain valuable insights into underlying flow physics. The streamwise velocity information was obtained from the instantaneous flow field solution taken at equally spaced time intervals with Δ t ˜ = 3 × 10 5 s. The snapshots with more than five times of the buffet period were chosen for the DMD mode extraction, and all oscillatory modes were derived as complex conjugate pairs, except the time-averaged flow field. In this study, the time-averaged flow mode was excluded in the model selection, i.e., the modes were only the fluctuations on the time-averaged flow field.
Figure 12 presents the energy contribution of the first two DMD modes. In the case of the stationary airfoil, the buffet mode and its harmonics (second-order mode) were predominant, which accounted for 97% of the entire flow dynamic system. At a heave frequency of f = 0.25 f buffet , the first two modes still contributed most of the energy in the flow field. However, the total energy percentage dropped slightly to 91.2%. As the frequency increased further to f = 0.55 f buffet , the energy proportion was 79% for the first DMD mode, with a weakened shock structure, and the contribution from the second mode increased substantially to 14.9%. The pronounced peak of the flow response corresponded to the second-order mode with f = 1.1 f buffet , which interacted with the shock oscillation with the buffet frequency. In this case, the flow pattern transited from the buffet mode to the transition stage. It is indicated that there was competition between the heave motion and shock wave/boundary interaction from the inherent transonic flow. When the motion frequency f f buffet , the flow was entirely caused by the driving motion of the airfoil. The motion frequency and its harmonics became the main characteristics of the flow response. It was also seen that the total energy percentage of the first two DMD modes decreased with the heave frequency. The energy percentage of the first-order DMD mode was decreased to 56% at f = 1.5 f buffet , and that for the second-order DMD mode further increased to 22%. This implies that the driven motion of the airfoil transferred the energy of the buffet mode to the boundary layer then propagated upstream and downstream with a more even energy balance. Such an energy transition mechanism may provide significant insight for the design of the flow control methodology.
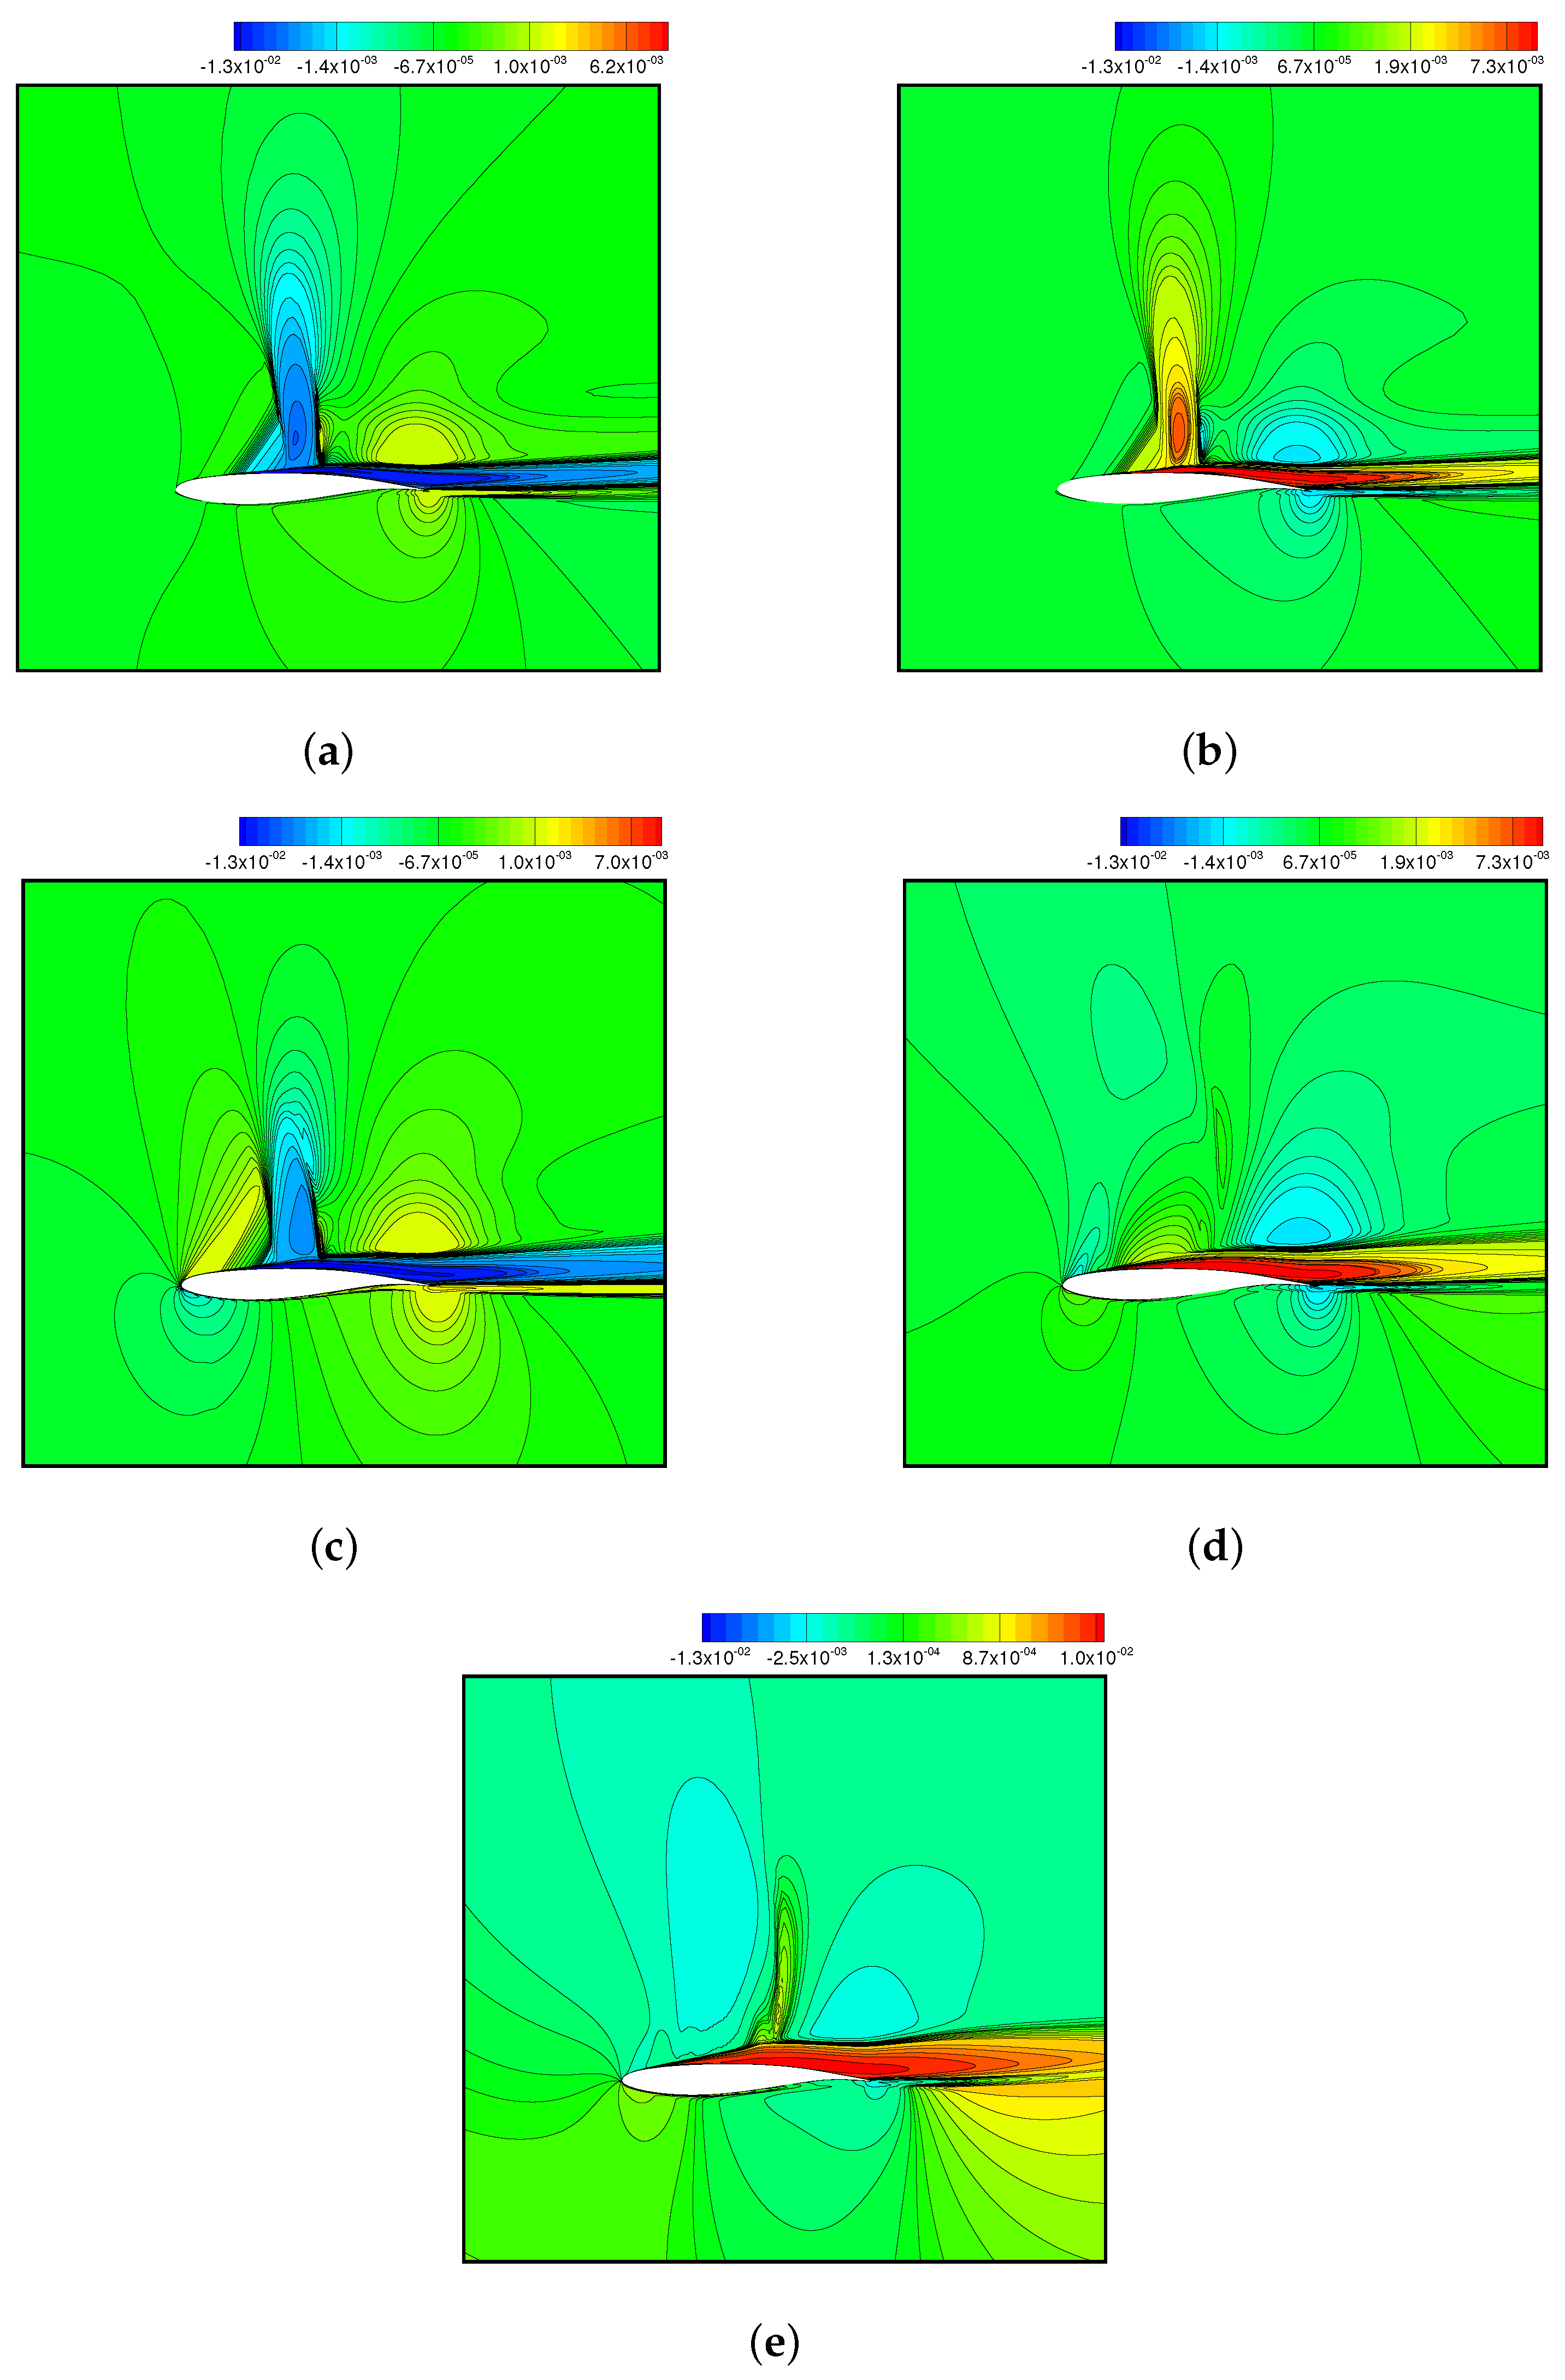
The u-velocity contours of the first-order mode with different heave frequencies are given in Figure 13 and were used to identify the dominant characteristic modes of the coupling flow with the driving motion. Figure 13a reveals that the buffet mode for the flow past a stationary airfoil featured the shock motion and the pulsating recirculation. A λ -shaped shock wave was observed on the upper surface of the airfoil. Its location was approximately at the middle of the chord, and the recirculation zone started at the shock foot. The dynamics of the buffet flow was identified by selecting the DMD modes, whose growth or decay rates were close to zero [28] and indicating a pair of marginally stable modes with the frequency f = 0.205 . A similar flow pattern was observed at f = 0.25 f buffet in Figure 13b. The shock structure and the recirculation were of opposite phase distribution in comparison with those for the stationary airfoil.
As the motion frequency increased, the boundary layer on the wing surface became thicker compared with Figure 13a,b. The buffet-mismatched heave motion weakened the shock and caused a less pronounced λ -shaped shock structure at f = 0.55 f buffet in Figure 13c. When the motion frequency was f = f buffet , the λ -shaped shock wave in Figure 13d completely diminished, as the boundary layer thickness increased further. The flow separation point moved close to the leading edge. When the heave frequency increased to f = 1.5 f buffet , a shock wave appeared at the middle of the chord on the upper surface in Figure 13e. The flow separated at the leading edge with the interaction of the shock.
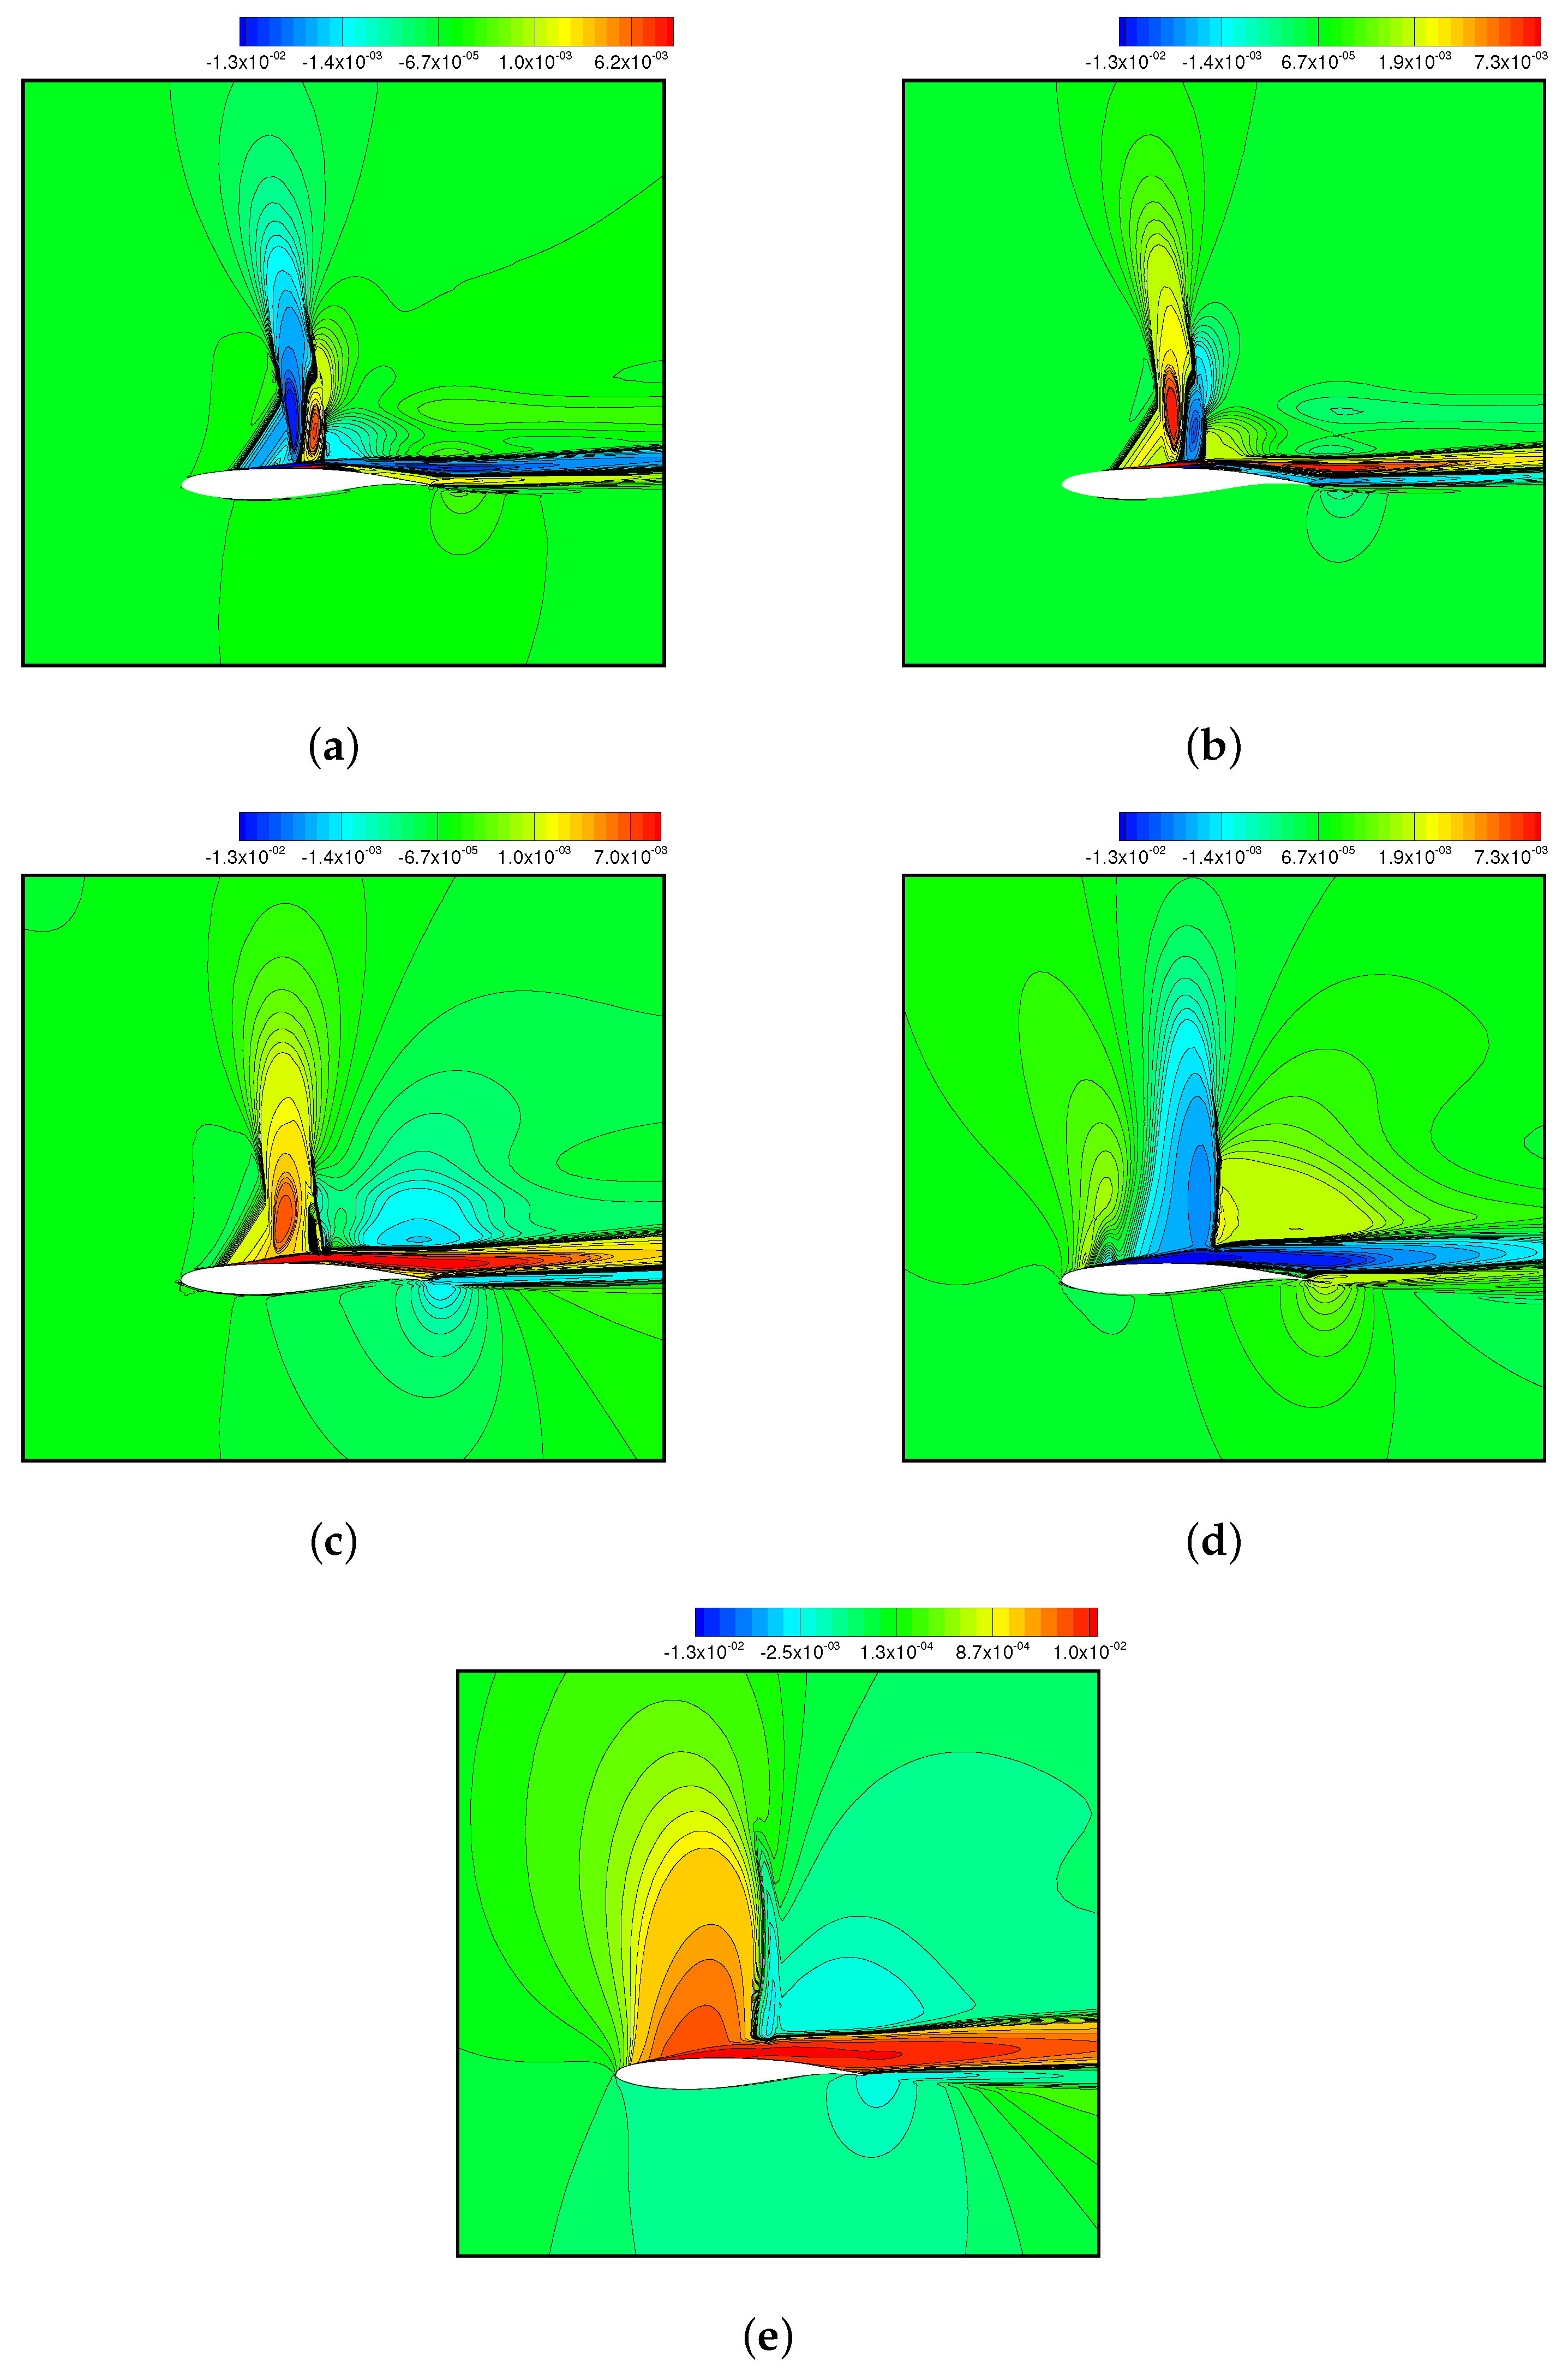
Figure 14 shows the second-order mode of the u-velocity field around the airfoil with a heave motion amplitude of 0.01 at different frequencies. A pair of the shock contour and pulsating recirculation contour were observed in the second-order modes for the stationary airfoil and f = 0.25 f buffet . This is consistent with the fact that the higher mode behaves according to the harmonics of the first-order mode in a proper orthogonal decomposition [14]. At f = 0.55 f buffet , the impact of the heave motion became significant. The harmonic response of the second-order mode was correspondingly altered. The pair of the recirculation zone was merged as one with a double-shock structure. As the motion frequency was f = f buffet , both of the shock wave and recirculation structures were fully merged, which was similar to the buffet mode in Figure 13a,b. When the motion frequency was further increased to f = 1.5 f buffet , a relatively strong shock wave was found on the upper surface. The boundary layer was formed near the leading edge instead of the shock foot, which implies that the shock oscillation was driven by the dominant heaving motion. In this case, the flow behaved like a forced response of the heave motion, which was consistent with the flow pattern analysis.

5. Conclusions

In this study, the coupling between the transonic buffeting flow and the airfoil with harmonic heave motion was investigated. An in-house fluid solver, AUSM, was used to compute the flow field of the airfoil with heaving motion under different combinations of reduced frequencies and amplitudes. The DMD method was used to analyze the coupling mechanism. The main conclusions that were drawn are as follows:
(1)
Both the time-averaged lift and drag coefficient experienced a remarkable deterioration at f = f buffet for A m = 0.01 and A m = 0.02 . The time-averaged lift coefficient decreased by a maximum of 13.3% for A m = 0.02 . However, when the motion amplitude was small for A m = 0.002 , the changes in the time-averaged and variance of the lift and drag coefficient were minor.
(2)
A parametric study of the heave frequency and amplitude indicates that the flow response under the heave motion could be categorized into three types: (a) A buffet frequency response, where the impact of the heave motion was negligible. (b) A transitional response, i.e., a transition phase for the increasing impact of the heave motion. The aerodynamic performance changed remarkably in this stage. (c) A heaving frequency lock-in response, where the flow oscillation exhibited a harmonic motion of a given frequency with super-harmonics. These three types of flow responses were associated with the change in the aerodynamic performance.
(3)
The energy contribution of the DMD modes shows that the buffet mode accounted for more than 95% of the entire fluid system when the motion frequency was relatively low (e.g., f = 0.25 f buffet ). As the frequency increased to f = 0.55 f buffet , the airfoil motion gradually became influential with an increased energy percentage of the boundary layer mode. When the motion frequency f f buffet , the energy transferred from the buffet mode to the boundary layer with a more even balance for each mode due to the predominantly heaving motion.
(4)
The dynamic mode decomposition was used to identify the characteristic flow pattern in the coupling. It shows that the buffet mode was a pair of marginally stable modes with the frequency f = 0.205 featured the shock motion and the pulsating recirculation. For the transitional response, the λ -shaped shock structure was weakened and the boundary layer became thicker in the first-order DMD mode, whilst the recirculation was merged with a double shock in the second-order DMD mode. As the motion frequency increased to f = f buffet , the merger of the shock wave and boundary layer that was observed in the first-order mode and the second-order DMD mode exhibited a similar pattern to the buffet mode. At f = 1.5 f buffet , the heave motion dominated the flow response with the heave frequency and its super-harmonics. The mode was characterized with the boundary layer that formed near the leading edge, rather than the shock foot.

Author Contributions

Conceptualization, W.K.; methodology, W.K.; software, W.K.; validation, W.K. and B.C.; formal analysis, W.K. and B.C.; investigation, W.K., B.C. and S.H.; resources, W.K.; data curation, W.K., B.C. and S.H.; writing—original draft preparation, W.K., B.C. and S.H.; writing—review and editing, W.K., B.C. and S.H.; visualization, W.K., B.C. and S.H.; supervision, W.K.; project administration, W.K.; funding acquisition, W.K. All authors read and agreed to the published version of this manuscript.

Funding

This research was supported by the National Natural Science Foundation of China (grant no. 11972307).

Data Availability Statement

The data presented in this study are available on request from the corresponding author.

Conflicts of Interest

The authors declare no conflicts of interest.

Nomenclature

AOAAngle of attack
DMDDynamic mode decomposition
SVDSingular value decomposition
fReduced frequency, f = π f h c U
f buffet Buffet reduced frequency
DESDetached eddy simulation
PODProper orthogonal decomposition
F c Convective flux
F v Diffusive flux
ρ Freestream density
μ Freestream viscosity
U Freestream velocity
cAirfoil chord length
t ˜ Dimensional time, s
tNon-dimensional time, t = t ˜ U / c
A ˜ Dimensional displacement of the heaving airfoil
A ˜ 0 Dimensional equilibrium of the heave motion
A ˜ m Dimensional heave amplitude
ANon-dimensional displacement of the heaving airfoil
A 0 Equilibrium of the heave motion
A m Non-dimensional heave amplitude, A m = A ˜ m / c
ω h Circular frequency
f h Dimensional heave frequency, Hz
x i new New position of i t h node
x j new New position of j t h node
n i Total number of nodes near the ith node
K i j Spring stiffness coefficient related to the i t h and the j t h nodes
β Coefficient for the enhancement of the spring stiffness on the boundary
ϕ Minimum interior angle of the triangle element for torsional stiffness
TITurbulent intensity
x 0 , x 1 , x 2 , , x m 1 , x m Snapshots of the flow fields
X , X Flow field data matrix
A , A ˜ Linear operator
U , V Unitary matrix
Σ Diagonal matrix
Φ DMD modes matrix
W Eigenvector matrix of A ˜
bAmplitude of the DMD modes

Appendix A

F c = ρ u i + ρ v j + ρ w k ( ρ u 2 + p ) i + ρ u v j + ρ u w k ρ u v i + ( ρ v 2 + p ) j + ρ v w k ρ u w i + ρ v w j + ( ρ w 2 + p ) k ( ρ u e + u p ) i + ( ρ v e + v p ) j + ( ρ w e + w p ) k
F v = 0 τ x x i + τ x y j + τ x z k τ y x i + τ y y j + τ y z k τ z x i + τ z y j + τ z z k Π x i + Π y j + Π z k
where ρ is the density of the fluid; u, v, and w are the components of velocity on the x, y, and z axes, respectively; p is the pressure; e is the energy; τ is the stress tensor; and Π = τ ( u , v , w ) T .

References

  1. Gao, C.; Zhang, W. Transonic aeroelasticity: A new perspective from the fluid mode. Prog. Aerosp. Sci. 2020, 113, 100596. [Google Scholar] [CrossRef]
  2. Giannelis, N.F.; Vio, G.A.; Levinski, O. A review of recent developments in the understanding of transonic shock buffet. Prog. Aerosp. Sci. 2017, 92, 39–84. [Google Scholar] [CrossRef]
  3. Lee, B.H. Self-sustained shock oscillations on airfoils at transonic speeds. Prog. Aerosp. Sci. 2001, 37, 147–196. [Google Scholar] [CrossRef]
  4. Knipfer, A.; Schewe, G. Investigations of an oscillating supercritical 2D wing section in a transonic flow. In Proceedings of the 37th Aerospace Sciences Meeting and Exhibit, Reno, NV, USA, 11–14 January 1999; pp. 1–12. [Google Scholar]
  5. Deck, S. Numerical simulation of transonic buffet over a supercritical airfoil. AIAA J. 2005, 43, 1556–1566. [Google Scholar] [CrossRef]
  6. Dietz, G.; Schewe, G.; Mai, H. Amplification and amplitude limitation of heave/pitch limit-cycle oscillations close to the transonic dip. J. Fluids Struct. 2006, 22, 505–527. [Google Scholar] [CrossRef]
  7. Crouch, J.D.; Garbaruk, A.; Magidov, D.; Travin, A. Origin of transonic buffet on aerofoils. J. Fluid Mech. 2009, 628, 357–369. [Google Scholar] [CrossRef]
  8. Accorinti, A.; Baur, T.; Scharnowski, S.; Kähler, C.J. Experimental investigation of transonic shock buffet on an OAT15A profile. AIAA J. 2022, 60, 6289–6300. [Google Scholar] [CrossRef]
  9. Ramey, J.M.; Sekula, M.K.; Piatak, D.J.; Heaney, P.S.; Soranna, F. Development of Buffet Forcing Functions using Frequency-Dependent Coherence Factors. In Proceedings of the AIAA Scitech 2021 Forum, Virtual Event, 11–15, 19–21 January 2021; pp. 1–13. [Google Scholar]
  10. Timme, S. Global instability of wing shock-buffet onset. J. Fluid Mech. 2020, 885, A37. [Google Scholar] [CrossRef]
  11. Raveh, D.E.; Dowell, E.H. Frequency lock-in phenomenon for oscillating airfoils in buffeting flows. J. Fluids Struct. 2011, 27, 89–104. [Google Scholar] [CrossRef]
  12. Hartmann, A.; Klaas, M.; Schröder, W. Coupled airfoil heave/pitch oscillations at buffet flow. AIAA J. 2013, 51, 1542–1552. [Google Scholar] [CrossRef]
  13. Crouch, J.D.; Garbaruk, A.; Strelets, M. Global instability in the onset of transonic-wing buffet. J. Fluid Mech. 2019, 881, 3–22. [Google Scholar] [CrossRef]
  14. Kang, W.; Zhang, J.-Z.; Ren, S.; Lei, P.-F. Nonlinear galerkin method for low-dimensional modeling of fluid dynamic system using POD modes. Commun. Nonlinear Sci. Numer. Simul. 2015, 22, 943–952. [Google Scholar] [CrossRef]
  15. Szubert, D.; Grossi, F.; Garcia, A.J.; Hoarau, Y.; Hunt, J.C.; Braza, M. Shock-vortex shear-layer interaction in the transonic flow around a supercritical airfoil at high reynolds number in buffet conditions. J. Fluids Struct. 2015, 55, 276–302. [Google Scholar] [CrossRef]
  16. Kou, J.; Zhang, W. An improved criterion to select dominant modes from dynamic mode decomposition. Eur. J. Mech.-B/Fluids 2017, 62, 109–129. [Google Scholar] [CrossRef]
  17. Poplingher, L.; Raveh, D.E.; Dowell, E.H. Modal analysis of transonic shock buffet on 2D airfoil. AIAA J. 2019, 57, 2851–2866. [Google Scholar] [CrossRef]
  18. Giannelis, N.F.; Levinski, O.; Vio, G.A. Origins of atypical shock buffet motions on a supercritical aerofoil. Aerosp. Sci. Technol. 2020, 107, 106304. [Google Scholar] [CrossRef]
  19. Zauner, M.; Sandham, N.D. Modal analysis of a laminar-flow airfoil under buffet conditions at re = 500,000. Flow Turbul. Combust. 2020, 104, 509–532. [Google Scholar] [CrossRef]
  20. Kang, W.; Hu, S.; Wang, Y. Lift enhancement mechanism study of the airfoil with a dielectric elastic membrane skin. J. Fluids Struct. 2024, 125, 104083. [Google Scholar] [CrossRef]
  21. Kang, W.; Lei, P.; Zhang, J.; Xu, M. Effects of local oscillation of airfoil surface on lift enhancement at low reynolds number. J. Fluids Struct. 2015, 57, 49–65. [Google Scholar] [CrossRef]
  22. Kang, W.; Xu, M.; Yao, W.; Zhang, J. Lock-in mechanism of flow over a low-reynolds-number airfoil with morphing surface. Aerosp. Sci. Technol. 2020, 97, 105647. [Google Scholar] [CrossRef]
  23. Zhang, W.; Gao, C.; Liu, Y. The interaction between flutter and buffet in transonic flow. Nonlinear Dyn. 2015, 82, 1851–1865. [Google Scholar] [CrossRef]
  24. Jacquin, L.; Molton, P.; Deck, S.; Maury, B.; Soulevant, D. Experimental study of shock oscillation over a transonic supercritical profile. AIAA J. 2009, 47, 1985–1994. [Google Scholar] [CrossRef]
  25. Landon, R. NACA 0012 oscillating and transient pitching, Compendium of unsteady aerodynamic measurements. In Data Set 3 in AGARD Report No. 702; Defense Technical Information Center: Fort Belvoir, VA, USA, 1982; pp. 3.1–3.25. [Google Scholar]
  26. Tu, J.H.; Rowley, C.W.; Luchtenburg, D.M.; Brunton, S.L.; Kutz, J.N. On dynamic mode decomposition: Theory and applications. J. Comput. Dyn. 2014, 1, 391–421. [Google Scholar] [CrossRef]
  27. Weiner, A.; Semaan, R. Robust dynamic mode decomposition methodology for an airfoil undergoing transonic shock buffet. AIAA J. 2023, 61, 4456–4467. [Google Scholar] [CrossRef]
  28. Feldhusen-Hoffmann, A.; Lagemann, C.; Loosen, S.; Meysonnat, P.; Klaas, M.; Schröder, W. Analysis of transonic buffet using dynamic mode decomposition. Exp. Fluids 2021, 62, 66. [Google Scholar] [CrossRef]
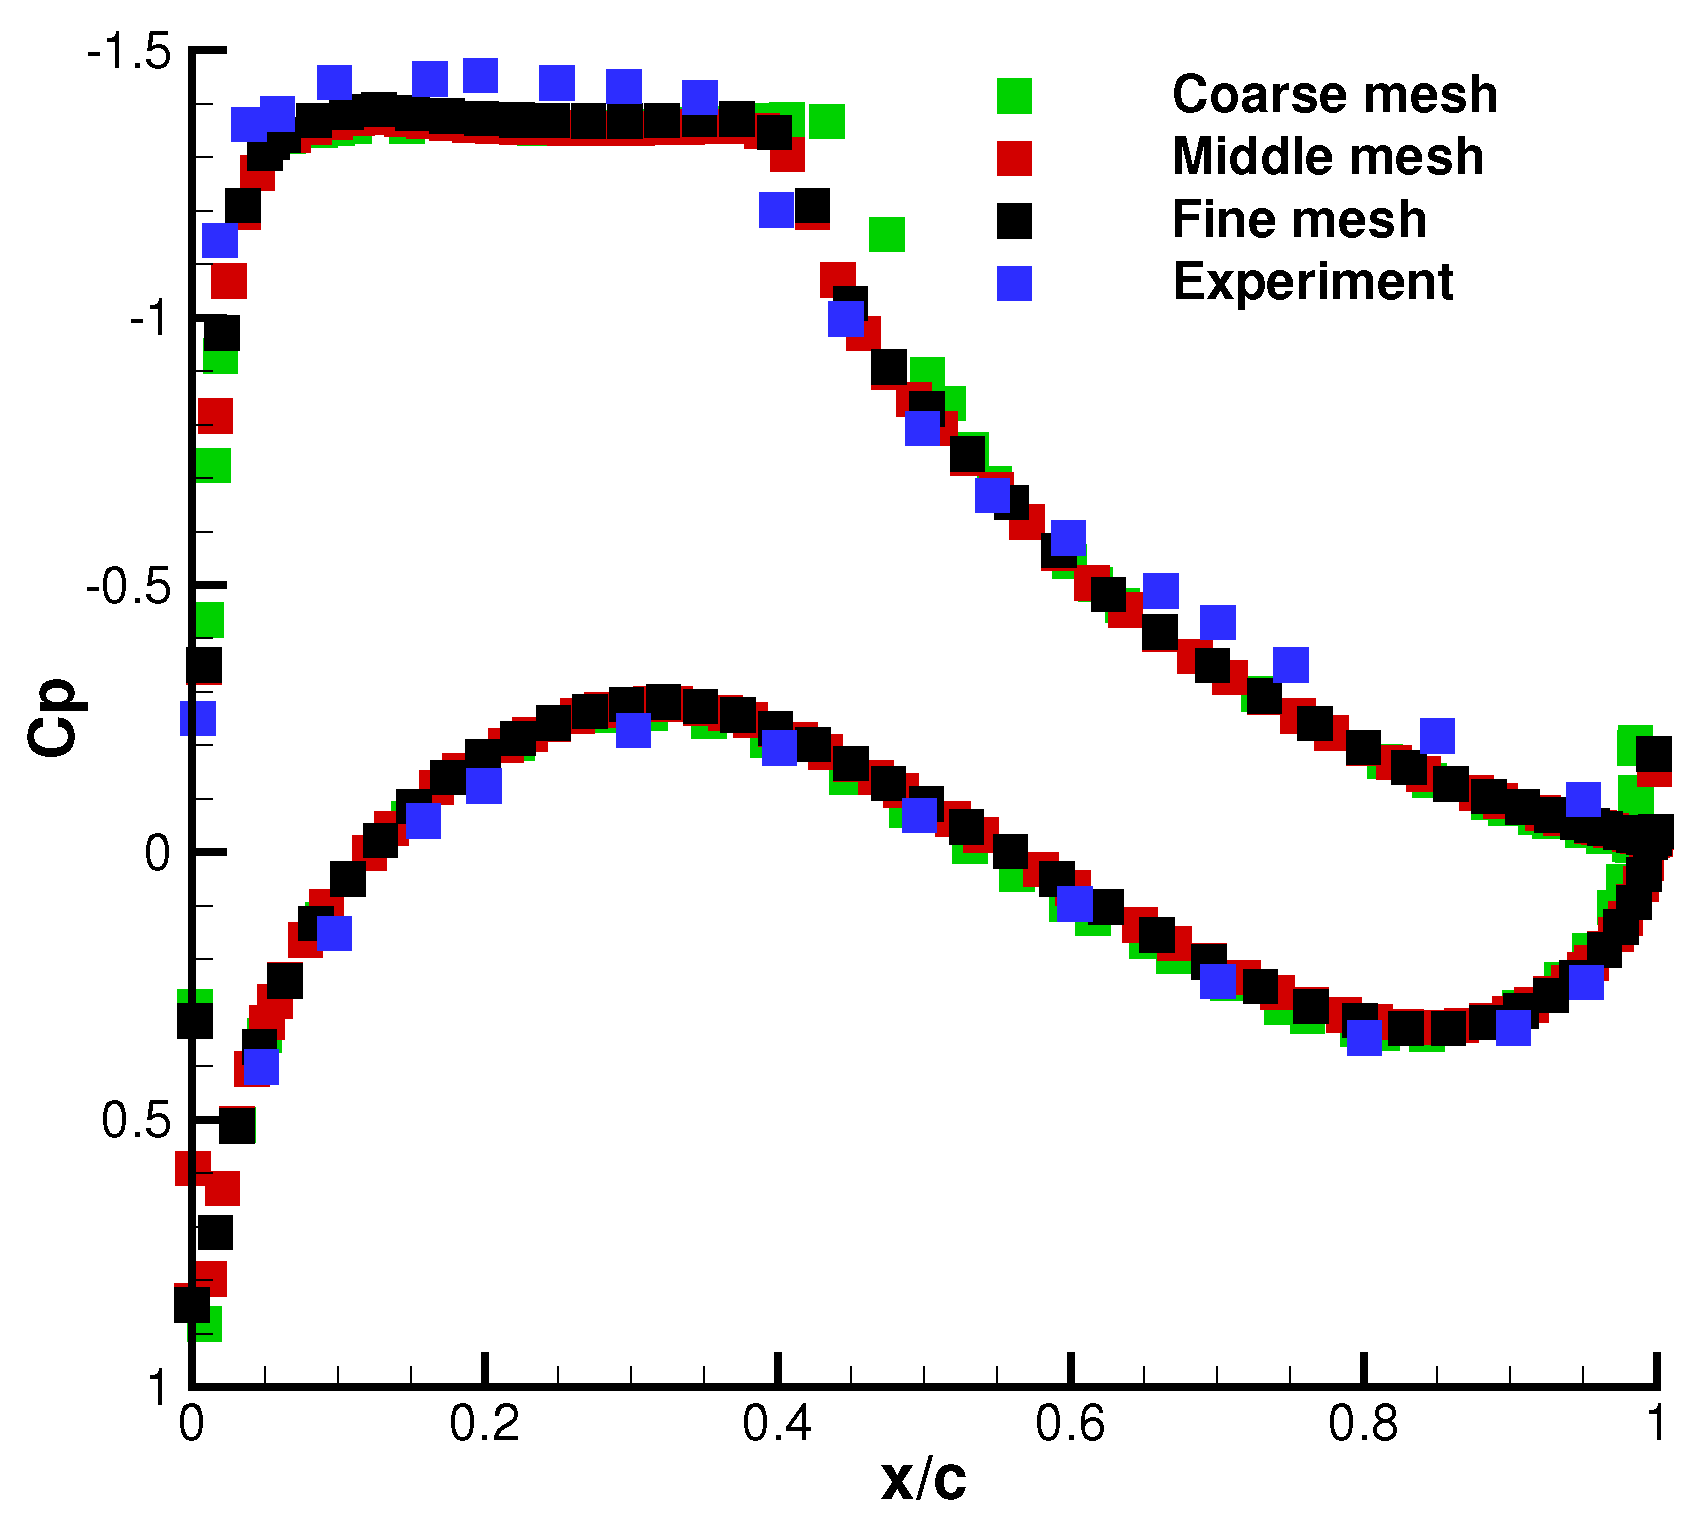
Figure 1. Comparison of pressure distribution over the airfoil.
Aerospace 11 00722 g001
Figure 2. Mesh close-up near the airfoil for the AGARD CT5 case.
Aerospace 11 00722 g002
Figure 3. Lift coefficient of the pitching airfoil.
Aerospace 11 00722 g003
Figure 4. Moment coefficient of the pitching airfoil.
Aerospace 11 00722 g004
Figure 5. Time-averaged lift (a) and drag (b) coefficients of transonic airfoil at M = 0.73 with respect to different heaving amplitudes and frequencies.
Aerospace 11 00722 g005
Figure 6. Standard variance in lift coefficients of transonic airfoil at M = 0.73 with respect to different heaving amplitudes and frequencies. (a) Standard variance. (b) Standard variance with time-averaged value.
Aerospace 11 00722 g006
Figure 7. Standard variance in drag coefficients of transonic airfoil at M = 0.73 with respect to different heaving amplitudes and frequencies. (a) Standard variance. (b) Standard variance with time-averaged value.
Aerospace 11 00722 g007
Figure 8. Spectral analysis of the lift coefficient with respect to different heave frequencies and A m = 0.01 . (a) f = 0.25 f buffet . (b) f = 0.55 f buffet . (c) f = f buffet . (d) f = 1.5 f buffet .
Aerospace 11 00722 g008
Figure 9. Frequency characteristics of the heave parameter space.
Aerospace 11 00722 g009
Figure 10. U-velocity contour at maximium lift coefficient with different heave frequencies and A m = 0.01 . (a) f = 0.25 f buffet . (b) f = 0.55 f buffet . (c) f = f buffet . (d) f = 1.5 f buffet .
Aerospace 11 00722 g010
Figure 11. U-velocity contour at minimum lift coefficient with different heave frequencies and A m = 0.01 . (a) f = 0.25 f buffet . (b) f = 0.55 f buffet . (c) f = f buffet . (d) f = 1.5 f buffet .
Aerospace 11 00722 g011
Figure 12. Energy percentage of the first- and second-order DMD modes.
Aerospace 11 00722 g012
Figure 13. First-order u-velocity DMD mode with different heave frequencies and A m = 0.01 . (a) Stationary airfoil. (b) f = 0.25 f buffet . (c) f = 0.55 f buffet . (d) f = f buffet . (e) f = 1.5 f buffet .
Aerospace 11 00722 g013
Figure 14. Second-order u-velocity DMD mode with different heave frequencies and A m = 0.01 . (a) Stationary airfoil. (b) f = 0.25 f buffet . (c) f = 0.55 f buffet . (d) f = f buffet . (e) f = 1.5 f buffet .
Aerospace 11 00722 g014
Table 1. Grid information for the mesh independence tests and the related results.
CasesGrid Size C l ¯ C d ¯ f = π f h 1 st c U
Coarse-sized grid345 × 650.9040.04620.205
Middle-sized grid529 × 1290.8710.04390.205
Fine-sized grid855 × 2010.8820.0440.206
Disclaimer/Publisher’s Note: The statements, opinions and data contained in all publications are solely those of the individual author(s) and contributor(s) and not of MDPI and/or the editor(s). MDPI and/or the editor(s) disclaim responsibility for any injury to people or property resulting from any ideas, methods, instructions or products referred to in the content.