1. Introduction
The problem of fluid flows around bluff bodies has been studied extensively in engineering to provide an understanding of several fundamental problems in fluids engineering, and to address a variety of daily-life engineering problems such as building structural design, aerodynamic design, noise reduction, and so on. An understanding of the aerodynamic noise generation and propagation and the sources that generate it is very important. One way to predict aerodynamic noise is by employing computational aeroacoustics (CAA), which is a branch of aeroacoustics and involves the accurate prediction of aerodynamic sound generated by turbulent flow by itself or interacting with solid surfaces. CAA can be classified into two broad categories: (i) direct computation, and (ii) hybrid computations (Wang et al. [
1], Wagner et al. [
2]), as elaborated below.
In the hybrid approach, the computation of flow is decoupled from that of the acoustic prediction based on the Reynolds analogy, which states that the transient flow generates acoustic waves, but the acoustic waves do not affect the flow. The near-field (acoustic source) is solved using compressible Navier–Stokes equations, while the far-field acoustic propagation is predicted using the solution to simplified equations. This approach ensures that the noise generation sources, such as flow separation and turbulence in the boundary layer, are accurately accounted. A variant of the hybrid approach makes use of the acoustic/viscous splitting technique, as investigated by Slimon et al. [
3]. In this method, both the near-field aerodynamic field and the far-field acoustic waves are calculated using a CFD technique. First, incompressible viscous equations are solved for mean flow predictions; then, using the mean flow variables, a set of perturbation equations is solved. In the near-field, the perturbation variables represent the differences between the fully compressible flow and the assumed incompressible mean flow. In the far-field, the perturbation variables are equivalent to the acoustic variables. Bogey et al. [
4] used DNS for the near-field computations, which were coupled with linearized Euler’s equations for the far-field propagation. The method was applied to canonical problems involving interaction between co-rotating vortices and mixing layer. In a precursor study, Harris et al. [
5] coupled Loci-CHEM, a Navier–Stokes solver, with a discontinuous Galerkin (DG) method that was used to solve Euler equations in the far-field, using an overset method. The Loci-CHEM solver provided the acoustic source by simulating an energetic, turbulent flow field from a rocket nozzle plume. At a short distance from the plume, the flow field was sampled and used to reconstruct a polynomial solution within the cells inside the interpolation layer of the mesh. These polynomial interpolations were then taken as the evolving DG solution for those cells, which then propagated to the adjacent cells using the standard interface fluxes.
Given the source of noise from the CFD solution, the far-field noise can be also calculated using the so-called acoustic analogy techniques first developed by Lighthill [
6], who proposed the initial acoustic analogy equation by reformulating the continuity and momentum equations as an inhomogeneous wave equation. Curle [
7] extended the equation to include solid surfaces, and it was further extended by Ffowcs Williams-Hawkings (FWH) [
8] to include moving bodies. Lyrintzis [
9] provides a review of the integral formulations used in computational aeroacoustics, including Kirchhoff’s method, a permeable/porous-surface FWH equation. Although these methods have shown promise for far-field acoustics prediction, they depend on an estimation of the acoustic source. This approach has been extensively used in the literature, such as in recent studies by Karthik et al. [
10] and Cai et al. [
11], who predicted far-field acoustic propagation for flow over a cylinder using large eddy simulation (LES) for the near-field source predictions and FWH acoustic analogy equations for the far-field acoustic propagation.
In the direct approach, the compressible Navier–Stokes equations are solved directly throughout the flow domain, without involving any modeling techniques, thus both acoustic generation and propagation are predicted simultaneously. The main challenge for this approach is that it requires accurate spatial and temporal discretization (with low dispersion and low dissipation errors), and sufficiently fine grid and temporal resolutions to resolve the dissipation length scales. They can be prohibitively expensive for far-field computations and thus has been applied for simple flow configurations at low Reynolds numbers (Freund [
12], Inoue and Hatakeyama [
13], Muller [
14]).
An alternative approach is to use a turbulence model that can accurately resolve the turbulence scales relevant for aeroacoustics. LES is a good candidate for this purpose as it can resolve turbulent coherent structures (Wagner et al. [
2], Rumpfkeil et al. [
15]), but it can be prohibitively expensive, especially in the boundary layer regions. Hybrid RANS/LES models, which behave in unsteady Reynolds-averaged Navier–Stokes (URANS) mode in the boundary layer and LES mode in the regions of interest, can alleviate the LES computation issues. Overall, simulation of both flow and sound field is a challenge due to the multi-scale physics ranging from non-linear aerodynamics in the near-field, linear acoustic in the far-field, and broadband frequency content due to turbulence, which requires an efficient turbulence model, high spatial and temporal resolution, and low numerical diffusion and dispersion errors.
The flow and acoustic fields generated by flow past a circular cylinder have been extensively investigated both experimentally and numerically. Cylinder flows exhibit different behavior based on Reynolds number (Williamson [
16]). A steady laminar flow exists up to
Re ≤ 40, where a pair of symmetric counter-rotating vortices remain attached behind the cylinder (throughout this study, Reynolds number is based on the freestream velocity, the diameter of the cylinder, and the freestream kinematic viscosity). As
Re increases, the laminar flow becomes unsteady, and the vortices show periodic Karman-like shedding. Around
Re = 1200, the shear layer separating from the cylinder becomes unstable, resulting in three-dimensional turbulent wake. Flow up to
Re = 2 × 10
5 is referred to as subcritical, where a thin laminar boundary layer remains attached on the cylinder, and the flow transitions to turbulence only after separation. Flow for
Re > 2 × 10
5 is referred to as supercritical, where the cylinder boundary layer becomes turbulent before separation, and thus the flow separation location moves towards the leeward side compared to the sub-critical case.
Early experimental (Strouhal [
17], Gerrard [
18], Phillips [
19]) and computational (Slimon et al. [
3], Hardin and Lamdin [
20], Cox et al. [
21]) aeroacoustic studies using the hybrid approach showed that the acoustic frequency generated by the flow is identical to the vortex shedding frequency, which is referred to as Aeolian tone and has directivity normal to the inflow. Inoue and Hatakeyama [
13] used the direct approach by performing DNS for
Re = 150, Mach number (
M) = 0.05–0.3 to study the far-field aeroacoustics generated by a 2D circular cylinder and confirmed that the vortex shedding acts as the dipole-type sound source. The study also proposed scaling laws for pressure wave propagation angle and amplitude as a function of Mach number. Muller [
14] performed aeroacoustic simulations for flow over a 2D cylinder at
Re = 150 and
M = 0.1 and 0.2 using DNS. The study focused on validation of higher-order numerical scheme for far-field (up to 100
D) propagation of the acoustic waves.
Some recent studies have used a direct approach for aeroacoustic analysis for somewhat complex configurations, but they have been limited to low
Re. Hattori and Komatsu [
22] performed DNS of flow past two cylinders, one oscillating and the other fixed, for
Re = 150,
M = 0.2, including different configurations of fixed and oscillating cylinders. The study showed that the acoustic power is significantly reduced when the fluid motion locks into a frequency lower than the natural frequency of vortex shedding from a fixed cylinder. In addition, significant sound reduction is observed when a fixed cylinder is placed upstream of the oscillating cylinder. Ganta et al. [
23] performed DNS of flow over a 2D oscillating circular cylinder for
Re = 150 and
M = 0.2 and analyzed the acoustic signatures at a radial distance
r = 75
D. The study concluded that the cylinder oscillation frequency and the amplitude dictate the frequency content and directivity of the sound field, respectively. The frequency content increases with the oscillation frequency, and higher-amplitude oscillations distribute the sound energy more evenly than the lower-amplitude oscillations.
Aeroacoustic simulations for somewhat complex configurations and high
Re flows have been performed using the hybrid approach. Liow et al. [
24] performed computations for flow over a square cylinder at
Re = 300 and 400, for
M = 0.05–0.2. The near-field computations were performed using DNS, and the far-field acoustic waves were computed by solving the wave equation. Results showed that acoustic waves are generated by the vortex shedding from both the leading and trailing edges, but the trailing edge vortices had considerably stronger acoustic source. The aeroacoustic signature from the trailing edge vortex shedding was found to be similar to that of the circular cylinder flow. Lockard et al. [
25] performed experiments and computations for flow over tandem cylinders (
Re = 1.66 × 10
5,
M = 0.13) using a quasi-laminar approach, wherein the URANS model was used in the narrow cylinder boundary layer region, and the turbulence production was switched off elsewhere. Karthik et al. [
10] studied aeroacoustics for flows around finite-length circular cylinders for various length-to-diameter (
L/D) ratios (=3 to 35) at
Re = 8.5 × 10
4 and
M = 0.2, using a hybrid approach, where LES and FWH were used for near- and far-field computations, respectively. The study reported good agreement between CFD and experiments for the tonal frequency and peak sound pressure level (SPL) at
r = 70
D. The
L/
D ratio significantly affected the vortex shedding and consequently the sound generation, where the Strouhal number (
St) and SPL increased with the increase in the cylinder
L/D ratio. Cai et al. [
11] studied the far-field propagation of noise generated by a cylinder in the presence of four different permeable surfaces in the flow fields. The computations were performed using LES in the near-field and FWH in the far-field. The study reported good agreement between CFD and experiments for sound directivity plots at
r = 64
D.
The focus of this research is to assess the performance of URANS and hybrid RANS/LES turbulence models and numerical algorithms in predicting far-field acoustic waves propagation generated by flows over a circular cylinder, in comparison to a much more expensive DNS which can be prohibitive for high Reynolds number. To achieve these objectives, DNS are performed for the prediction of far-field acoustics (80
D, where
D is cylinder diameter) for a range of Reynolds numbers
Re = 150 to 5000, based on cylinder diameter, using a sixth-order accurate finite-difference solver (Hattori and Komatsu [
22]). Turbulence model simulations are performed using a finite-volume method solver (Loci-CHEM) (Luke and Cinnella [
26], Tong and Luke [
27], Liu et al. [
28]) using k-ω SST URANS (Menter [
29]), hybrid RANS/LES (Nichols and Nelson [
30]), dynamic hybrid RANS/LES (DHRL) (Bhushan and Walters [
31], Walters et al. [
32], Bhushan et al. [
33]), and implicit LES (ILES) turbulence models, including grid size, time-step size and numerical scheme sensitivity analysis, and the results are validated against DNS results. For the numerical scheme sensitivity, simulations are also performed using second-order least-square and second-order low-dissipation optimization-based gradient reconstruction (OGRE) schemes (Poe et al. [
34]).
The following section provides a brief description of the governing equations, the DNS numerical schemes, and the Loci-CHEM flow solvers, as well as turbulence models employed in this study. A summary of computational domain, grids, and simulation conditions used in the study is provided in
Section 3. The DNS results are discussed in
Section 4, followed by validation of turbulence model results in
Section 5. Conclusions and future research are included in
Section 6.
2. Governing Equations and Numerical Methods and Models
The governing equations are represented by the three-dimensional Favre-averaged unsteady compressible Navier–Stokes equations for single phase and single species, which involves mass, momentum, and energy equations:
where
and
are nabla and Laplacian operators, respectively, ρ and
are fluid density and velocity, respectively,
is thermal conductivity, and
are the viscous stresses:
where
is the identity matrix and
is dynamic viscosity.
is the rate-of-strain tensor. The pressure (
p) is defined assuming fluid to be a perfect gas:
where
R is universal gas constant and
T is the fluid temperature. Energy
E and enthalpy
H are:
where
and
are heat transfer coefficients for constant volume and pressure, respectively. The dynamic viscosity
and thermal conductivity
are functions of temperature via the Sutherland law.
The terms
and
are the turbulent stress tensor and heat transfer vector, respectively, and are included only for turbulence modeling purposes. For modeled turbulence computations, the flow variables ρ,
p, and T are either Reynolds-averaged for URANS or filtered for LES and are denoted by (
). The velocity is mass-weighted or Favre-averaged:
The turbulence stress and heat transfer are:
- B.
Direct Numerical Simulation Solver
For DNS, the compressible Navier–Stokes equations are solved in cylindrical coordinates. The spatial derivatives in the governing equations are discretized using a sixth-order compact scheme in the form
where
is the spatial step and
is a generic flow variable. At the boundary point, the following schemes are used:
The procedure for the second-derivative computation is the same as that for the first-derivative. The tridiagonal Padé compact scheme for the second derivative,
, is expressed as:
At the boundary point, the following scheme is used:
High-order tridiagonal Padé filtering (Gaitonde and Visbal [
35]) was employed throughout the domain to eliminate the high-frequency oscillations caused by the non-linearity of the governing equation. For time marching, a fourth-order Runge–Kutta method was employed. The solver has been previously validated for DNS of aeroacoustics for flow past oscillating and fixed cylinders at
Re = 150 (Hattori and Komatsu [
22]).
- C.
URANS and Hybrid RANS/LES Simulation Solver
The URANS, hybrid RANS/LES, and ILES are performed using Loci-CHEM solver, a multi-species, chemically reacting flow solver that has been extensively validated for predictions of energetic flows found in rocket plumes, and used extensively for launch vehicle, propulsion, and missile systems analysis (Luke and Cinnella [
26], Tong and Luke [
27], Liu et al. [
28]). The governing equations are discretized using a finite-volume procedure, where the equations are integrated over a computational cell of volume
Ωc and surface S
c:
where
are the conservative state variables,
Fi are the inviscid fluxes (including both convective and pressure gradient terms), and
Fv are the viscous fluxes. The variables and fluxes are given as
The Loci-CHEM solver includes a suite of turbulence models and numerical schemes. Available URANS models include several versions of the k–ω, realizable k–ε, and Spalart–Allmaras (SA) models. Available hybrid RANS/LES models include Nichols–Nelson [
30], SA-based DES and delayed DES (DDES), and dynamic hybrid RANS/LES (DHRL) (Bhushan and Walters [
31], Walters et al. [
32], Bhushan et al. [
33]) models. In this study, the k–ω SST model (Menter [
29]) is used for URANS, and Nichols–Nelson (referred to as HRL) and DHRL models are used for hybrid RANS/LES. Simulations are also performed without any turbulence model, which are referred to as implicit LES (ILES). The salient points of the models are described below.
The k–ω SST URANS model expresses the turbulent stress tensor as a linear function of rate-of-strain tensor following Boussinesq’s hypothesis:
where turbulent eddy viscosity
is obtained as:
where
is vorticity magnitude. This requires the solution of two additional transport equations, one for turbulent kinetic energy (
k) and a second for specific dissipation (
ω).
where ‘ : ’ is the double-dot product. The model involves several unknown coefficients:
,
,
,
,
,
,
, and
. Readers are referred to Walters et al. [
32] for details.
The hybrid RANS/LES models seek to retain URANS models in the far-field and in the boundary layer regions, where resolution of large-scale structures is sufficient, and switch to LES modeling in the regions where resolved turbulence can help improve flow predictions. The Nichols–Nelson HRL model achieves this by blending the turbulent eddy viscosity obtained from the
k–ω SST model (
with LES-based subgrid eddy viscosity (
) to obtain effective turbulent eddy viscosity:
where
is the blending function. The LES eddy viscosity is obtained as:
where
is the grid scale based on cell volume (
). The blending function is prescribed as:
where
is an estimate of largest energy-containing length scale predicted by URANS. The limiting behavior of the blending function shows that:
Bhushan and Walters [
31] pointed out that applicability of the above model is limited to the flow conditions with sufficient resolved turbulence in the LES regime. However, for flow with limited resolved turbulence, the models switch from URANS to LES as predefined based on grid scale, which results in modeled stress depletion or grid-induced separation in the boundary layer. To overcome the deficiency, a physics-based blending was proposed:
where
is the resolved turbulence velocity vector, and ‘
’ is the ensemble averaging. The above blending function allows generation of a buffer region, where URANS and LES models are blended to ensure the continuity in turbulence productions. Note that in the absence of resolved turbulent fluctuations, the RHS of Equation (18) is zero, resulting in
= 0. Thus, the turbulent stresses are the same as that of the underlying URANS model. In this case, the flow has sufficient resolved turbulence and RHS exceeds the value of 1,
is clipped to 1; thus, the turbulent stresses are the same as that of the underlying LES model. Application of the model has shown that for flow conditions with limited resolved turbulence, the model starts in URANS mode (even though the grid is sufficiently fine for LES) and slowly transitions to LES with the growth of background resolved turbulence (Bhushan et al. [
33]). Herein, the above blending function is used to couple k–ω SST URANS and ILES. The latter is used instead of explicit LES models based on previous research, which demonstrated that numerical dissipation from second-order schemes is a good surrogate model for sub-grid stresses (Adedoyin et al. [
36]).
The solver uses advanced generalized grid algorithms based on cell-centered finite-volume methods and high-resolution Riemann solvers. Time integrations are performed using second-order three-point backward implicit schemes for time-accurate simulations. The volume integrals are performed using the second-order midpoint rule. The inviscid terms of the Navier–Stokes equations are treated using flux-difference-splitting techniques. The application of this approach in the context of high-resolution finite-volume algorithms involves the reconstruction of functional values within each cell to provide left and right states at cell faces. The reconstruction may introduce non-physical overshoots in gradients due to discontinuities present in the system, which are constrained by using a Venkatakrishnan limiter. The evaluation of the viscous fluxes requires careful consideration, since the final integrated stencil (the sum of all the numerical viscous fluxes for any given cell) must consist of positive coefficients if the numerical approximation of the diffusion process is to maintain the maximum principle associated with the Laplace equation. To achieve this, face values of density and velocities are evaluated using a simple volume-weighted average of the integrated cell values on either side of the face. The face gradients are estimated using a two-step approach. First, the average of the least-square gradient is computed for the cells on either side of the face, similar to inviscid flow, but without the limiter. Second, the gradient in the direction normal to the face is computed and is combined with the gradients obtained in the first step. Details of the flow solver including physical models and numerical methods are provided in (Luke [
37]). Recently, a low-dissipation OGRE scheme was implemented for the inviscid (particularly the convective term) to improve the accuracy of the solver for hybrid RANS/LES computations (Poe et al. [
34]). The scheme achieves this by modifying the linear reconstruction of face states from neighboring cells by implementing: (1) an iterative least-square gradient computation procedure to minimize the second-order dissipative error contribution to the face reconstruction; and (2) a slope-limiting scheme which enforces local monotonicity near discontinuities without the detrimental effect of limiting in smooth regions of the flow field.
3. Numerical Simulation Settings
In this study, two sets of simulations are performed using direct approach: DNS for range of Re = 150 to 5000, M = 0.2 encompassing laminar to sub-critical turbulent conditions. The laminar cases Re = 150 and 300 are performed using a two-dimensional domain, whereas simulations for Re = 600, 2500, and 5000 are performed in three dimensions using a lateral domain width of L/D = 0.2. A smaller domain size was used to retain two-dimensionality of the flow or to avoid generation of spanwise instabilities. The drag, lift, and vortex shedding frequency predictions, in terms of global quantities, are validated against results available in the literature, and the aeroacoustic signatures, including tonal frequency, directivity, and SPL at r = 80D are analyzed. Simulations using different turbulence models, such as k–ω SST for URANS, HRL, and DHRL for hybrid RANS/LES, and implicit LES (ILES), are performed for Re = 5000, M = 0.2, and L/D = 1.0. The study also includes investigation of numerical schemes, grid, and time-step sensitivity to identify appropriate resolution and schemes required for accurate aeroacoustic predictions. A larger L/D was used compared to DNS, because coarser grids (compared to DNS) with small L/D may inhibit the generation of the three-dimensional coherent turbulent structures as expected in hybrid RANS/LES and LES. The turbulence model predictions are validated against DNS results.
- B.
Flow Domain and Grid and Boundary Condition
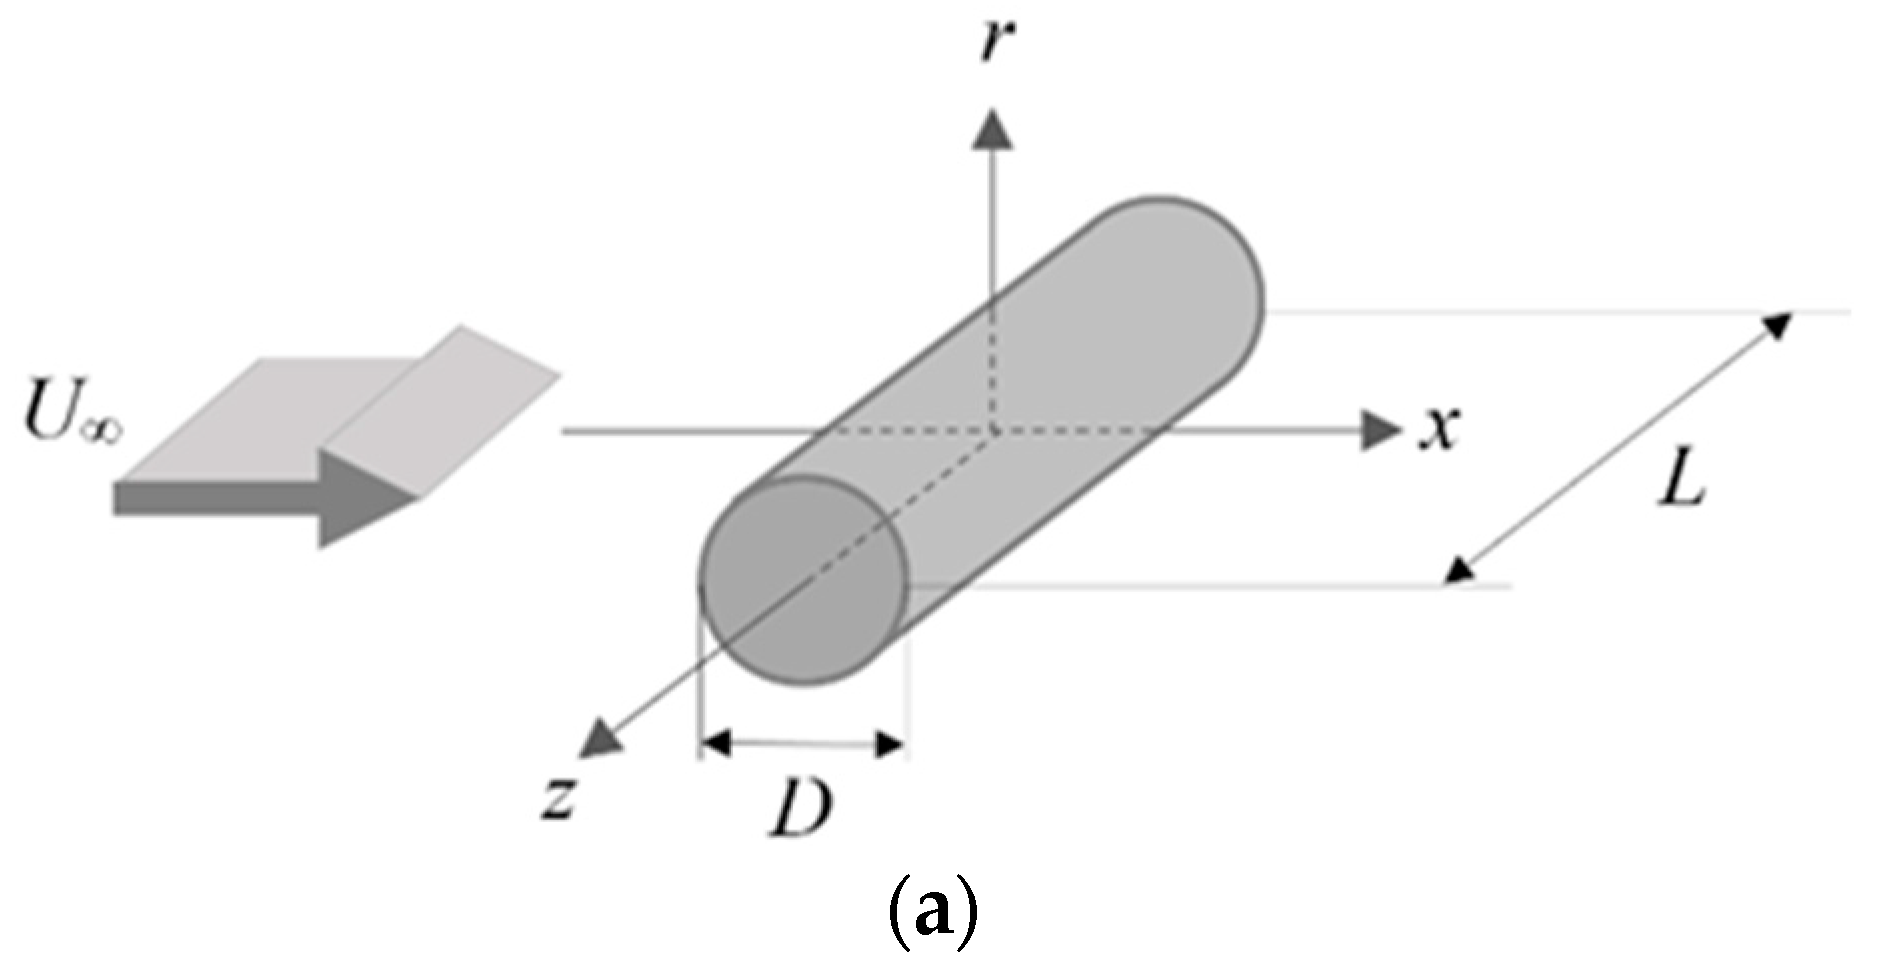
Figure 1 shows the cylinder geometry and the coordinate system used for the computations. The coordinate parallel to the free stream velocity is denoted by
x while the coordinate aligned with the radial direction is denoted by
r or
y, and
z is along the cylinder axis. The computational domain expands from the center at
r = 0, to an outer boundary face at
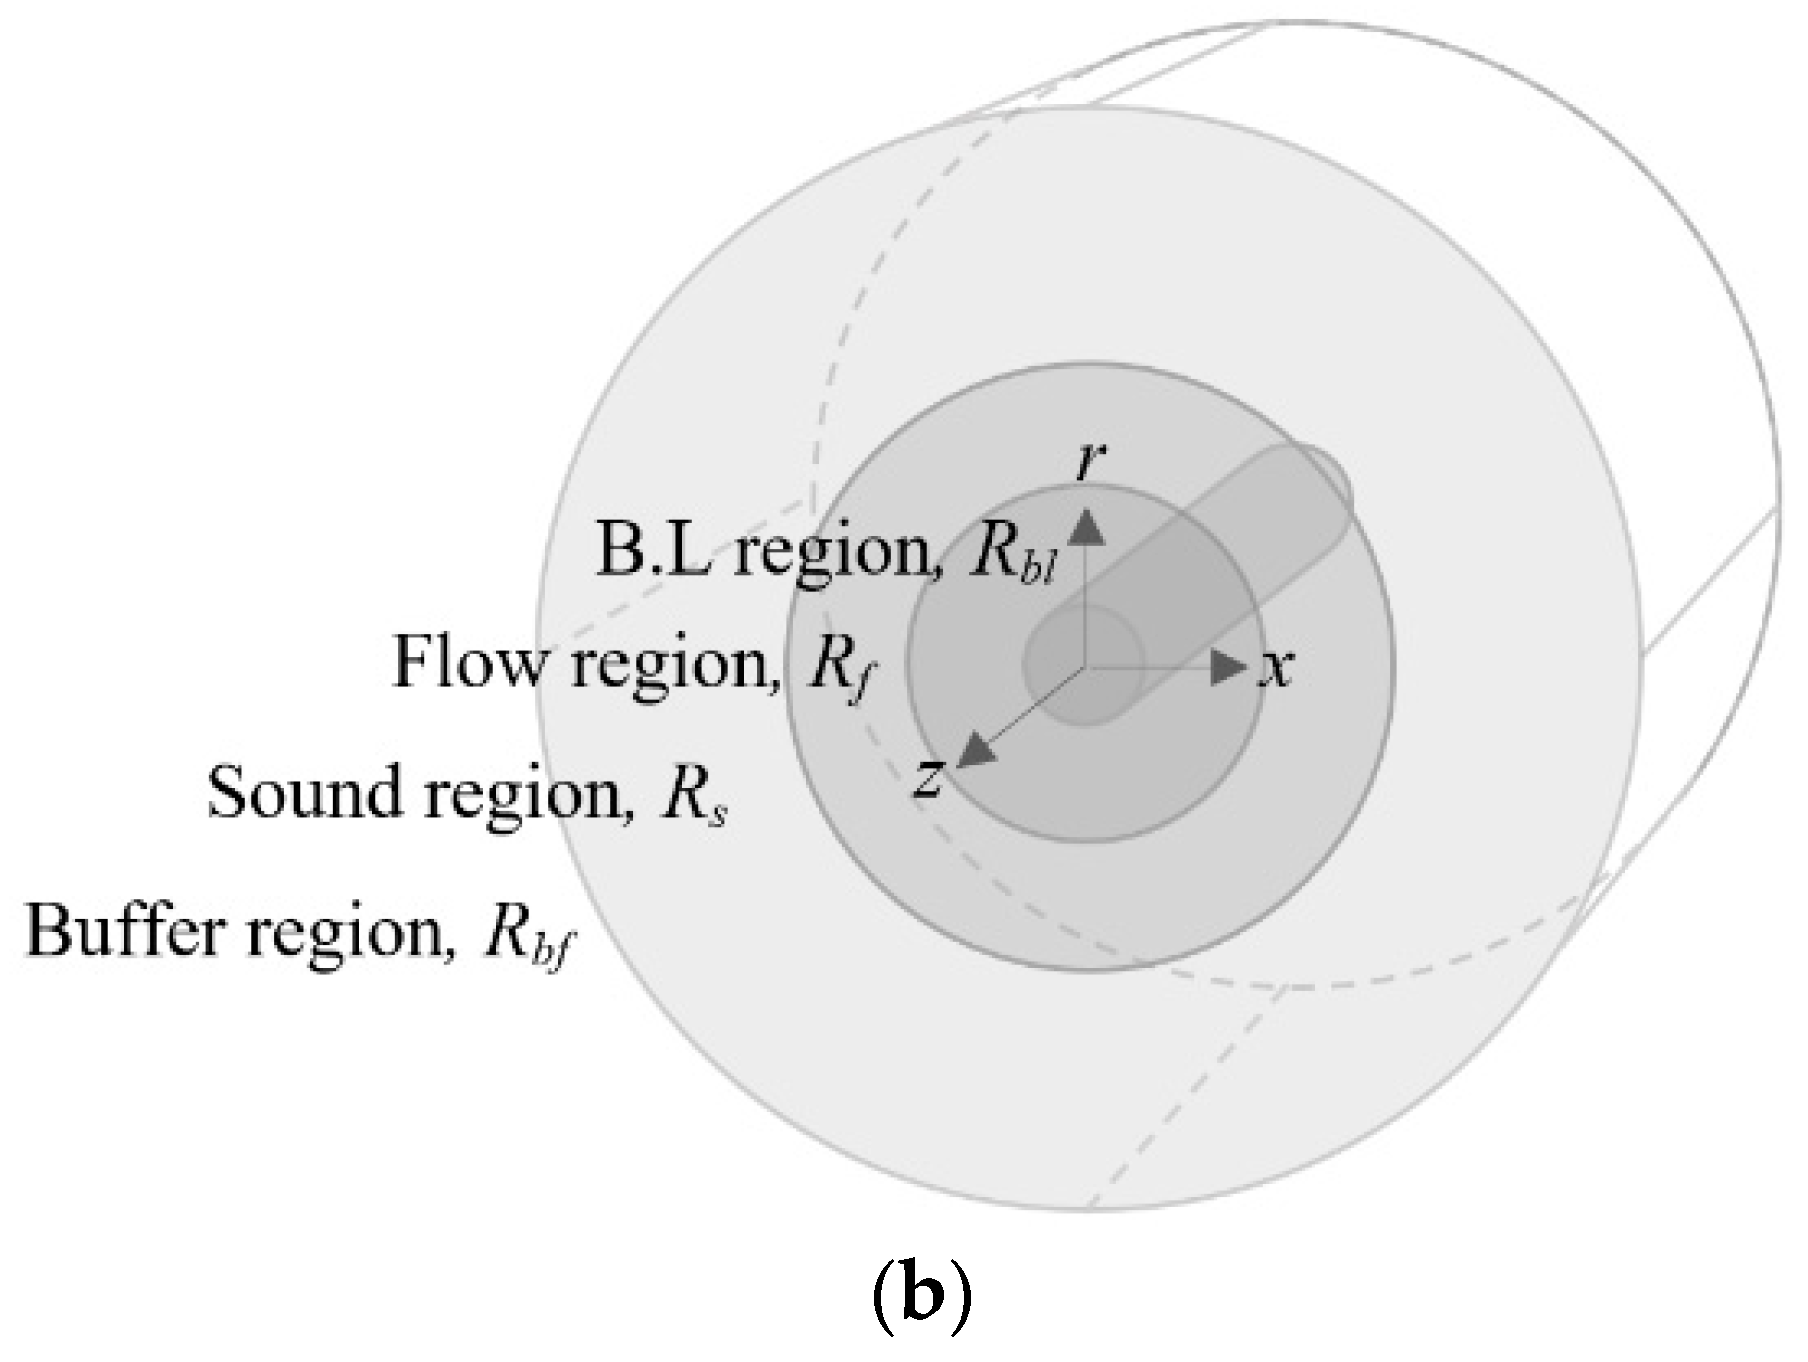
r = 500D. The computational domain includes four regions along the radial direction: (i) a boundary layer region up to 4
D, which encompasses large gradients; (ii) a flow region up to 20
D, which encompasses vortex shedding and aerodynamic noise propagation; (iii) a sound region up to 200
D, where aerodynamic noise decays and only sound wave remains with much lower pressure fluctuation; and (iv) a buffer region up to 500D, which is added to avoid reflection from the boundary.
A uniform grid spacing was used along the circumferential and cylinder-axis directions, and a non-uniform mesh spacing was used in the radial direction. The DNS grid consisted of 721 points in the circumferential direction, 501 points in the radial direction, and 61 points along the axis. The grid spacing in the radial direction was varied according to the expected local flow properties and numerical considerations. In the boundary layer region, the surface normal grid spacing was chosen to maintain y+ < 1. The grid spacing was increased: steadily in the boundary layer region; aggressively in the flow region, such that the grid spacing was ~1D at the interface of the flow and sound region; very slowly in the sound region, such that grid spacing was ~3D at the edge of sound and buffer region; and very aggressively in the buffer region, such that the largest grid spacing was ~20D. The DNS grid consisted of around 360 K cells for the two-dimensional simulations and 23 M cells for three-dimensional simulations. For the Re = 5000 case, the above time-step is equivalent to ~1200 time-steps per pressure oscillation at r = 80D.
For modeled turbulence simulations, three systematically refined grids, using refinement ratio 21/4, consisting of around 2.8 M, 4.8 M, and 7.5 M cells, were generated. The finest mesh consisted of 361 points in the circumferential direction, 61 grid points along the length, and 351 points along the radial direction. The near-wall grid resolution was around y+ = 0.41 on the coarse mesh, 0.35 on the medium grid, and 0.29 on the fine mesh. A time-step study was performed using the DHRL model using Δt = 0.165 c/D and 0.0293 c/D, which correspond to around 145 and 835 time-steps per pressure wave oscillation cycle at r = 80D, respectively. The large time-step size resulted in a maximum Courant–Freidrich–Lewy (CFL) number of ~6.6 during the computation, whereas the smaller time-step size resulted in a maximum CFL < 1.
In both DNS and modeled turbulence simulations, a no-slip boundary condition was used at the cylinder surface, r = D. A far-field boundary condition was used at the r = 500D surface. A periodic boundary condition was used along the spanwise planes. The far-field was assumed to be at atmospheric conditions, i.e., p = 1 bar, T = 300 K, and Pr = 0.72. The inflow velocity and dynamic viscosity μ were chosen to match Re = 5000 and M = 0.2. Modeled turbulence simulations were performed on 40 processors for 80,000 time-steps. The SST and HRL simulations (on the same grid) required similar CPU time per time-step, but DHRL required 10% more CPU time, whereas ILES required 20% lower CPU time. ILES involves a lower computational cost because it does not require solution of two additional transport equations, as do URANS, HRL, and DHRL. DHRL involves added computational cost over URANS due to additional averaging operations requirements. For the time integration, five Newton iterations were used for each time-step, and five Gauss–Seidel iterations were used for the solution of the linear system of equations within each Newton iteration.
4. Direct Numerical Simulation Results
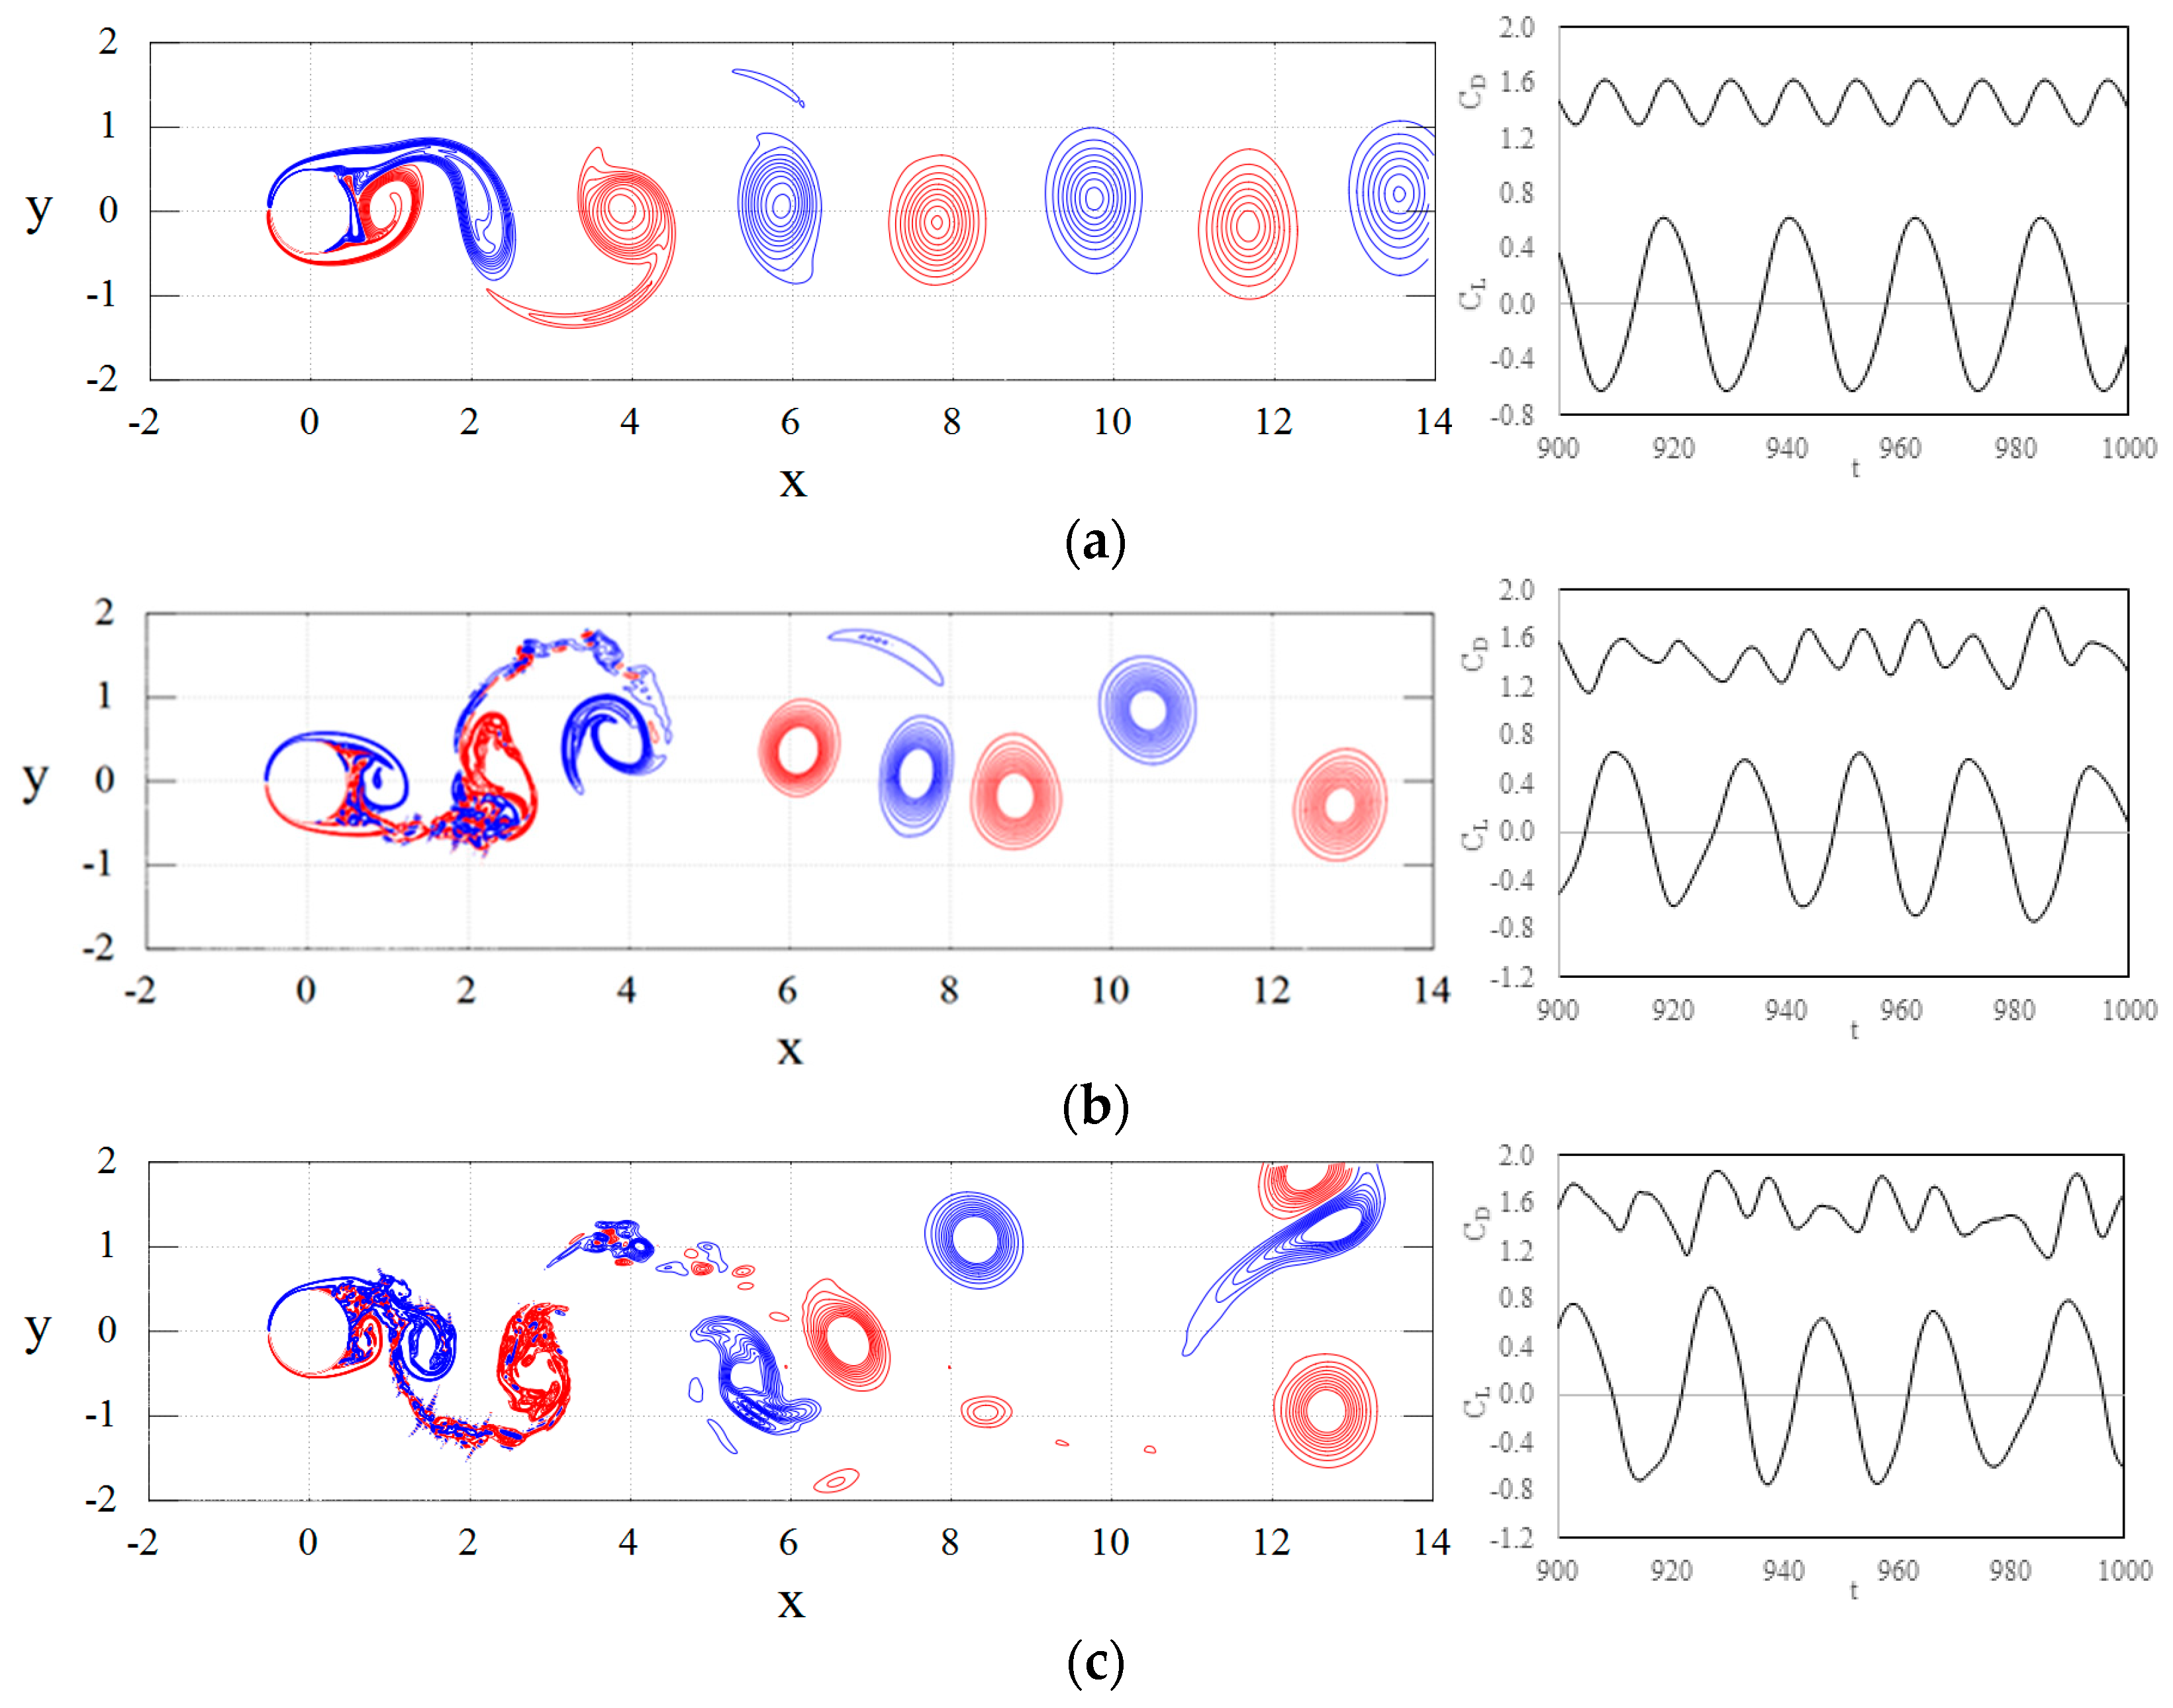
Direct numerical simulations (DNS) contour plots in
Figure 2 show consecutive vortex shedding of opposite signs downstream of the cylinder. The vortices show well organized large-scale flow structures for
Re < 1000, and the length-scale of the vortices decreases with the increase in Reynolds number. The flow corresponding to
Re = 2500 and 5000 shows a laminar boundary layer in the vicinity of the cylinder, which becomes turbulent in the downstream as a result of flow separation. With the increase in
Re, the turbulence intensity in the wake increases, the boundary-layer separation is delayed, and the wake becomes narrower, as expected (Kravchenko and Moin [
38], Breuer [
39]).
The accuracy of the DNS predictions is evaluated by comparing the mean flow quantities, such as the mean drag coefficient,
, the root mean square of lift coefficients,
CLrms, and vortex shedding Strouhal number,
St = fD/U0, where
f is vortex shedding frequency, with available experimental data (Williamson [
16], Norberg [
40]) and simulation results (Rajani et al. [
41], Mittal and Suresh [
42], Ali et al. [
43], Labbe and Wilson [
44], Mittal and Balachandar [
45], Lei et al. [
46], and Rajani et al. [
47]) for
Re = 150, 300, and 1000 (see
Table 1). As shown in
Figure 2, the lift and drag coefficients show a regular sinusoidal pattern for
Re < 1000, and become more and more irregular with the increase in the
Re. The irregularity is more prominent in drag than in lift, as the latter is primarily dominated by the large-scale vortex shedding. As shown in
Table 1,
increases steadily from 1.332 for
Re = 150 to 1.542 for
Re = 5000. A survey of CFD studies in the literature shows that
= 1.32 ± 3.2% for
Re = 150 and 300. The DNS results lie within the scatter of the data for
Re = 150 but are 5% higher than the averaged value for
Re = 300. The prediction for
Re = 600 is 6% higher than the average value reported in the literature for
Re = 1000.
The lift coefficient (
CL) shows a mean value of zero, and its fluctuation amplitude is larger than that of the drag coefficient. In addition, the frequency of
CL fluctuation is half of
, which is because the former responds to the vortex shedding from both sides, but the latter responds to the independent vortex shedding from either side. The
CL,RMS peaks for
Re = 300 in the laminar regime, and increases with
Re in the turbulent regime. The DNS predictions for laminar case are about 30% higher than the averaged values reported in the literature, which is within the 35% scatter reported in the literature. The vortex shedding
St is obtained from the Fast Fourier Transform (FFT) of the
CL. The results show
St = 0.185 for
Re = 150,
St = 0.21 for
Re = 300, and
St = 0.23 ± 2% for
Re = 600 to 5000. The DNS predictions compare very well with experimental data and CFD predictions in the literature for
Re = 150 to 1000. The results for higher
Re are consistent with results from Techet [
48], which reported that the Strouhal number in the turbulent regime does not vary much between
Re = 1000 and 10,000.
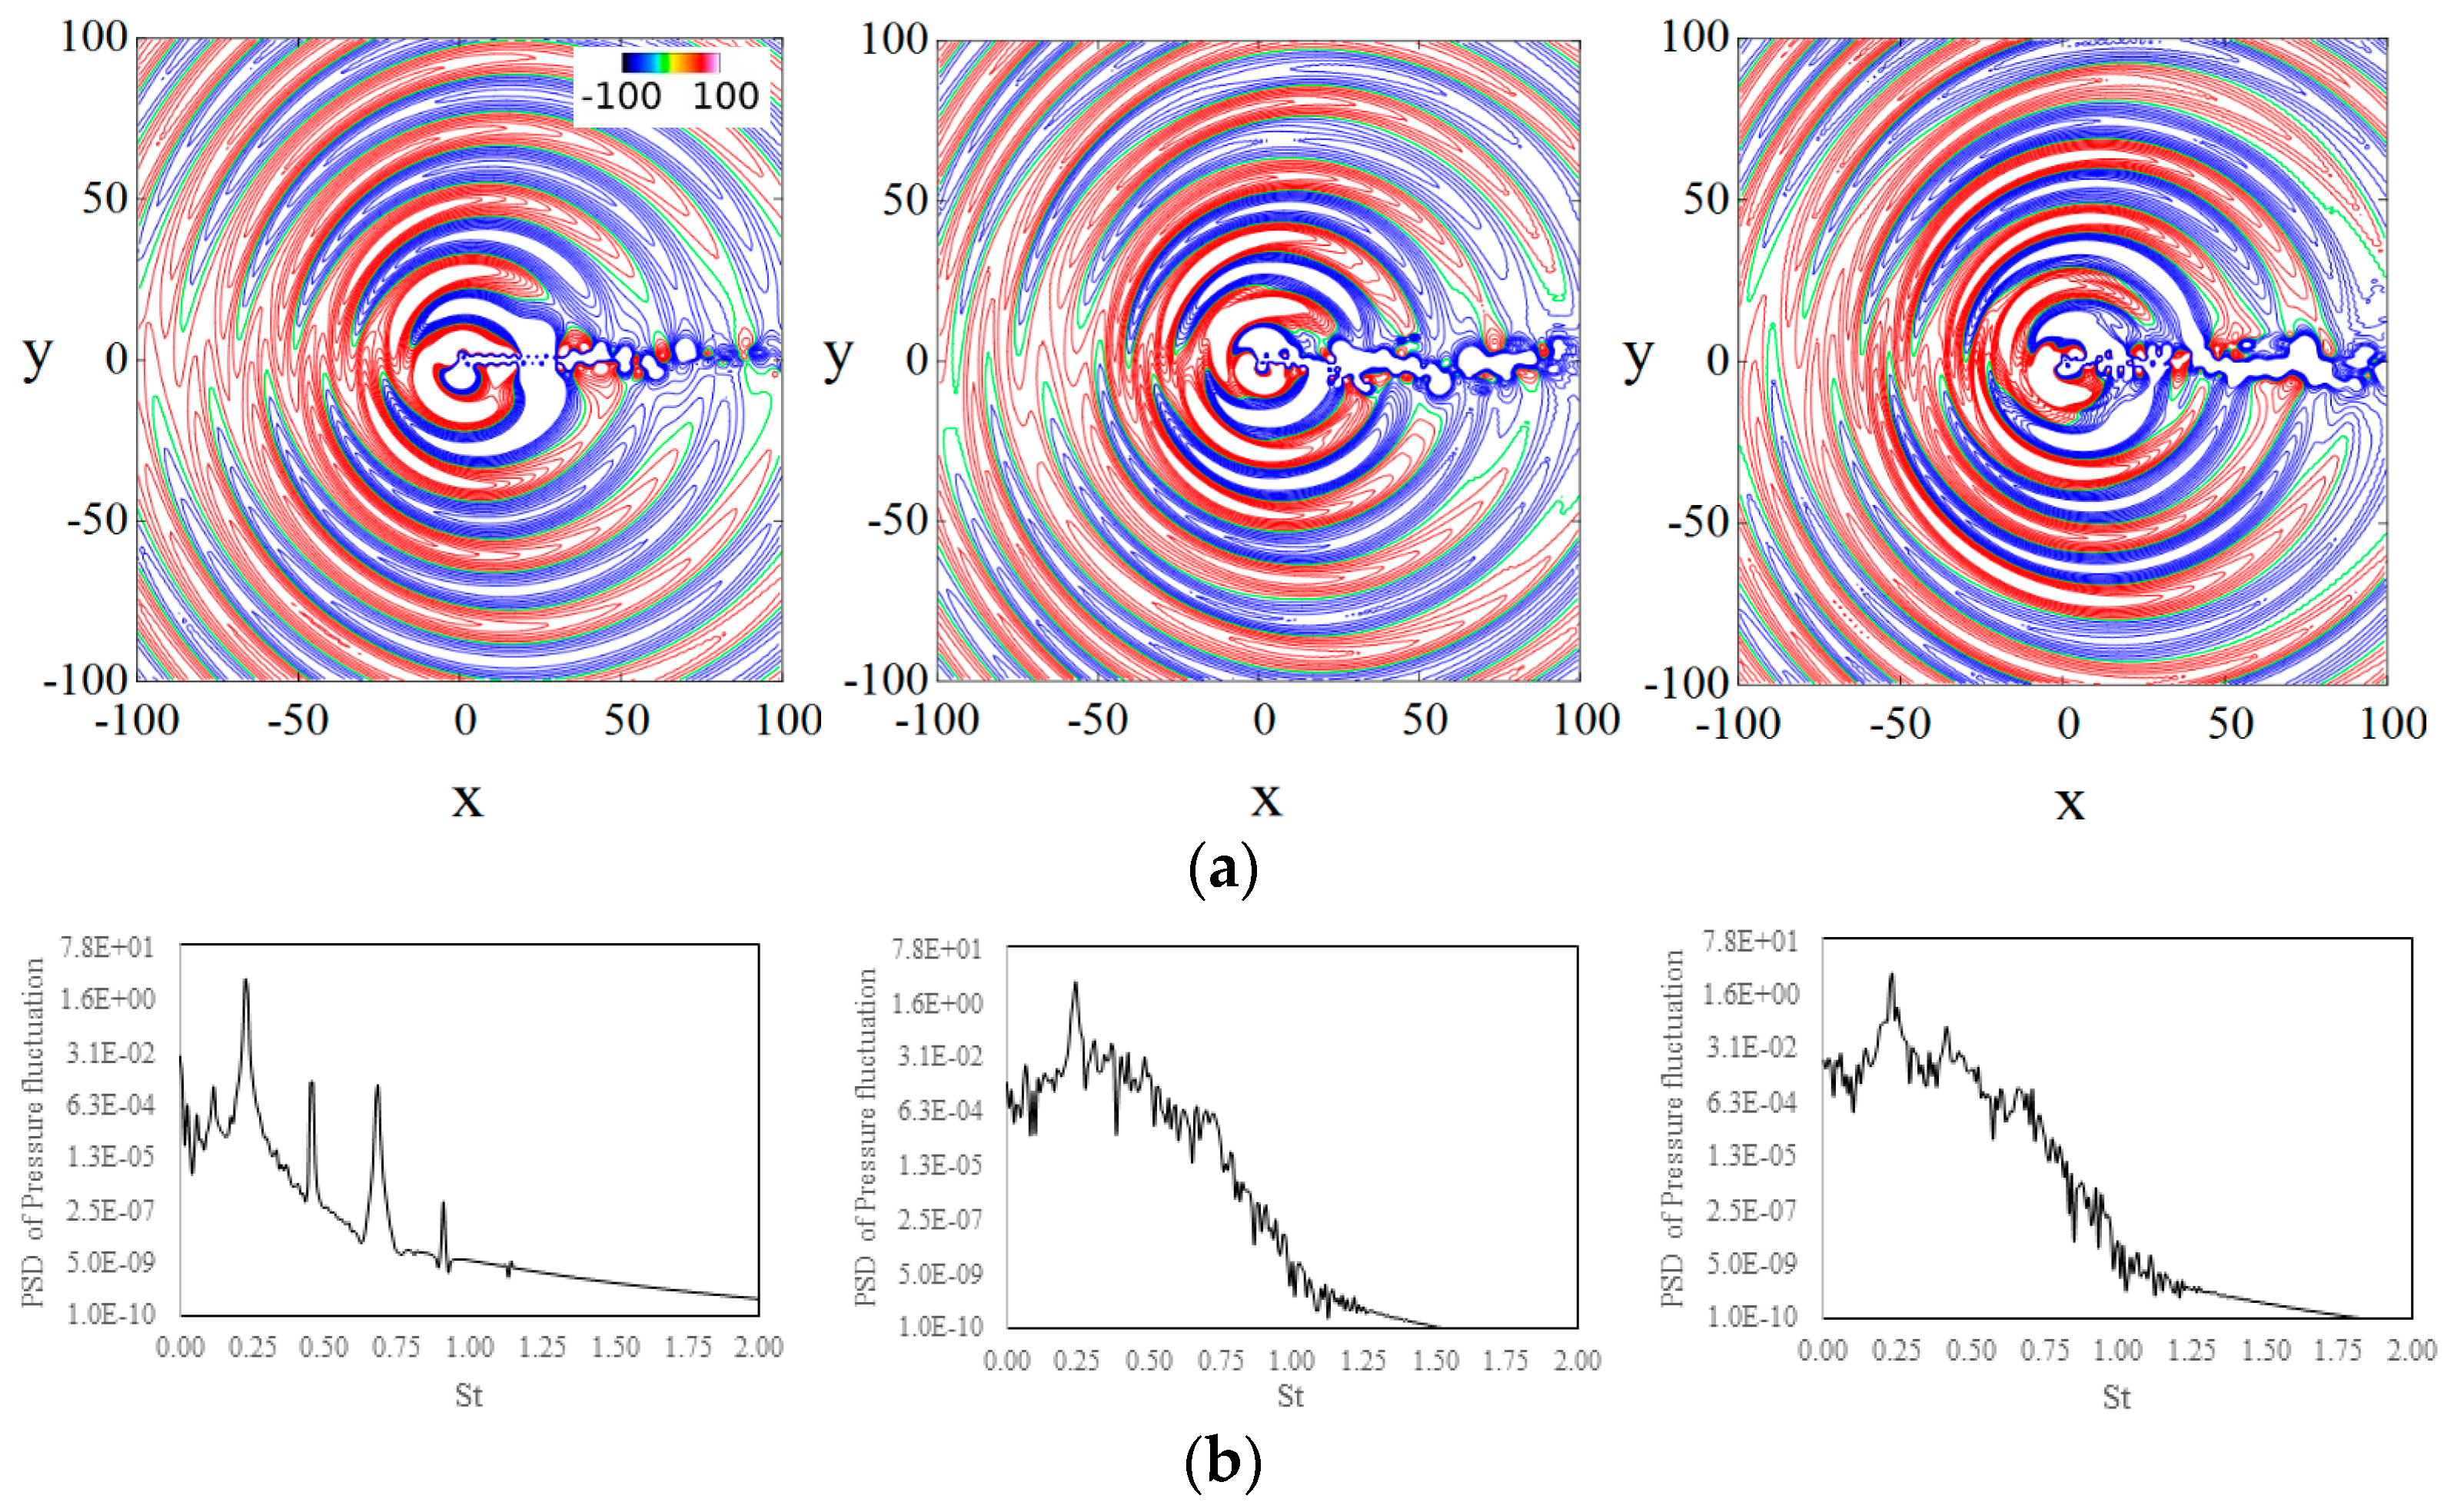
The far-field pressure fluctuation in
Figure 3a shows peaks and troughs of pressure fluctuations radiating outwards from the cylinder, representing the acoustic waves. Analysis shows that when the vortex is shed from one side of the cylinder, negative pressure is generated on that side, and simultaneously positive pressure is generated on the other side. The positive and negative pressure generations alternate with counter-rotating vortex shedding, which results in the ‘dipole’-type sound (see Inoue and Hatakeyama [
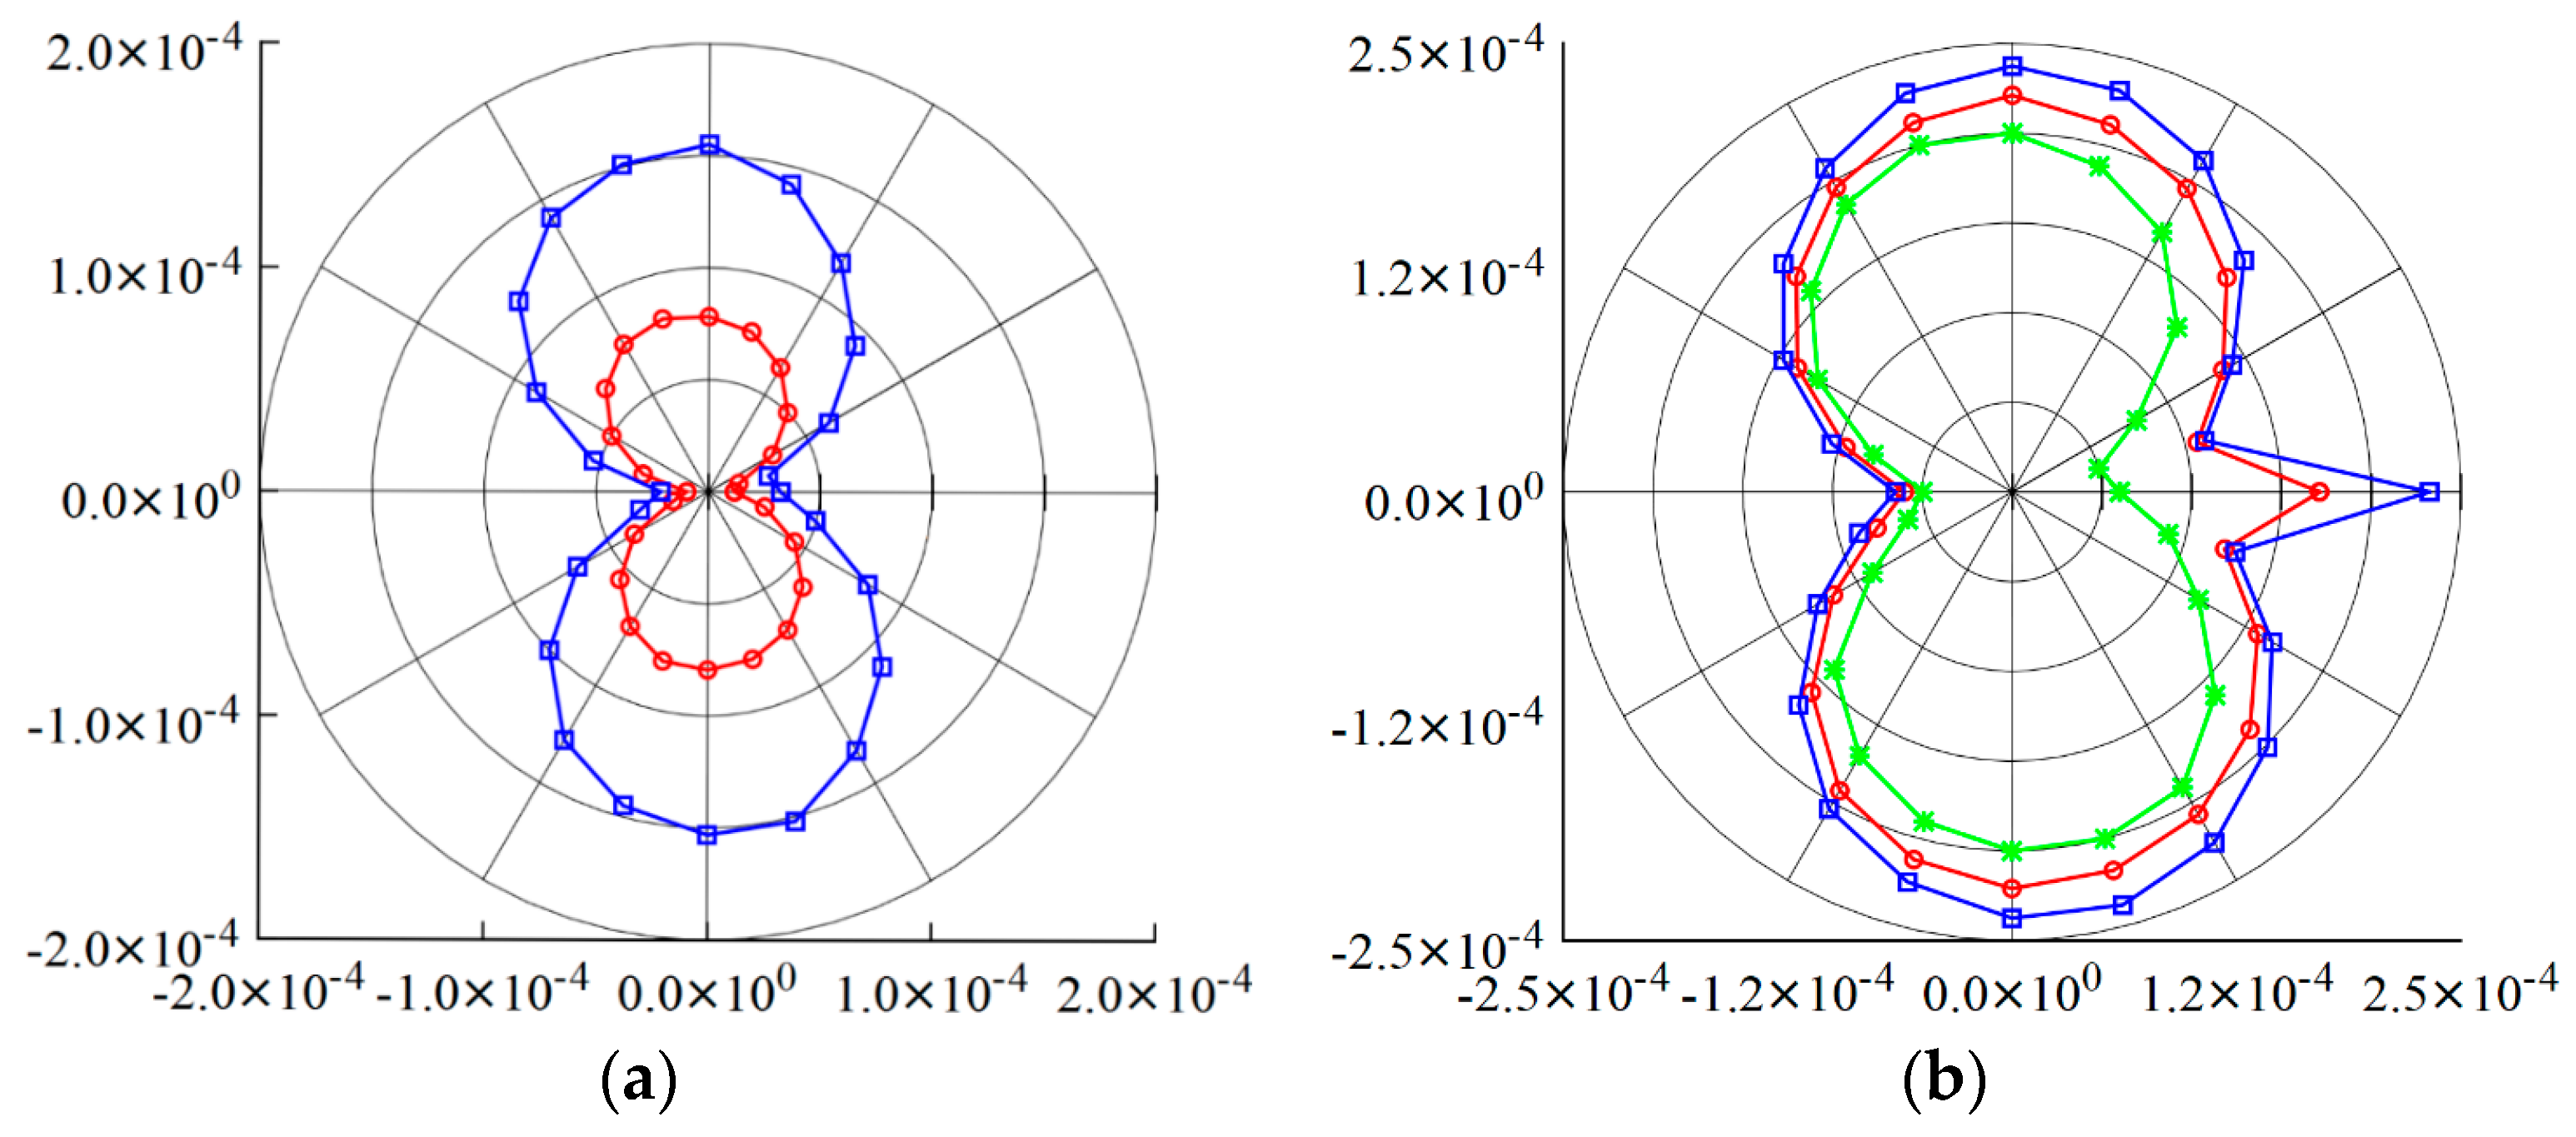
13]). Polar plots of the root mean square of the pressure fluctuations,
prms, obtained at
r = 80
D every 15° in
Figure 4a, show a double-lobe curve, where the lobes are directed normal to the inflow, i.e., the acoustic propagation is strongest along
θ = ±90°. The sound directivities are symmetric about the flow direction and asymmetric between the upstream and downstream regions. Upstream of the cylinder along its center line, dipole sound waves meet and cancel each other, resulting in lower values, whereas a pressure spike is observed in the cylinder wake. The acoustic field intensity increases with the Reynolds number, as expected (see Tiago et al. [
49]), but the directivity does not change.
Table 1.
Summary of simulation, domain, grid, and flow conditions, and key results.
Table 1.
Summary of simulation, domain, grid, and flow conditions, and key results.
| Model | Re | Aspect Ratio | Grid
Size | Δt × D/c | | CL,RMS | Vortex Shedding St | ) |
|---|
| St | Peak SPL(dB) |
|---|
| Literature | |
| CFD [23,25,38,39] | 150 | | 1.321 ± 3.2% | 0.278 ± 40% | 0.185 ± 2.7% | |
| Experiment [24] | 300 | - | 0.432 | 0.203 |
| CFD [23,39] | 1.321 ± 3.2% | 0.492 ± 32% | 0.2 ± 2% |
| Experiment [35] | 1000 | - | - | 0.21 |
| CFD [47,49] | 1.376 ± 9.3% | 0.72 ± 6.2% | 0.23 ± 8.3% |
| Benchmark Study | |
| DNS | Laminar | 150 | 0 | 2D,
360 K | 0.02 | 1.332 | 0.365 | 0.182 | 7.76 × 10⁻⁵ | 0.180 | |
| 300 | 1.392 | 0.572 | 0.208 | 1.07 × 10⁻⁴ | 0.210 |
| 600 | 0.2 | 23 M | 1.464 | 0.442 | 0.227 | 2.06 × 10⁻⁴ | 0.228 |
| Turbulent | 2500 | 0.2 | 23 M | 1.467 | 0.448 | 0.236 | 2.21 × 10⁻⁴ | 0.24 |
| 5000 | 1.542 | 0.518 | 0.230 | 2.37 × 10⁻⁴ | 0.237 | 105.7 |
| Turbulence Modeling Study | |
| Numerical scheme sensitivity | DHRL, ILES;
Least-square, OGRE | 5000 | 1.0 | 7.5 M | 0.165 | | Figure 4 |
| Grid sensitivity | DHRL; OGRE | 2.8 M | 0.029 | 1.899 | R = 0.37 | 1.129 | R = −0.01 | 0.187 | R = 0.75 | 2.74 × 10⁻⁴ | R = 0.13 | 0.175 | R = 0 | 108.2 | R = 0.57 |
| 4.8 M | 1.776 | 0.968 | 0.191 | 2.33 × 10⁻⁴ | 0.178 | 109.6 |
| 7.5 M | 1.731 | 0.970 | 0.194 | 2.38 × 10⁻⁴ | 0.178 | 110.4 |
| Time-step sensitivity | URANS, HRL, DHRL, ILES; OGRE | 7.5 M | 0.165, 0.029 | | |
| Turbulence model sensitivity | URANS; OGRE | 7.5 M | 0.029 | 1.905 | E = 23.5% | 1.168 | E = 125% | 0.214 | E = −7% | 2.87 × 10⁻⁴ | E = 21% | 0.195 | E = −18% | 110.3 | E = 4.3% |
| HRL; OGRE | 1.750 | E = 13.5% | 0.998 | E = 92% | 0.201 | E = −13% | 2.40 × 10⁻⁴ | E = −0.8% | 0.178 | E = −25% | 111.3 | E = 5.3% |
| DHRL; OGRE | 1.731 | E = 12.3% | 0.970 | E = 87% | 0.194 | E = 16% | 2.38 × 10⁻⁴ | E = 0% | 0.178 | E = −25% | 110.4 | E = 4.5% |
| ILES; OGRE | 1.768 | E = 14.7% | 1.000 | E = 93% | 0.230 | E = 0% | 2.53 × 10⁻⁴ | E = 6.3% | 0.178 | E = −25% | 111.3 | E = 5.3% |
As summarized in
Table 1, the peak amplitude at
θ = ±90° increases rapidly in the laminar region, i.e., a 37% increase from
Re = 150 to 300, and 100% increase from
Re = 300 to 600. However, the amplitude increases nominally by 7% when
Re is increased from 600 to 2500, and from 2500 to 5000. The turbulent cases also show a sharp increase in the pressure fluctuations in the wake, i.e.,
θ = 0°, with
Re. For
Re = 5000, the amplitude in the wake is as large as the amplitude at
θ = ±90
o. The Fourier spectrum of the pressure fluctuation at
r = 80D, θ = ±90° in
Figure 3b shows a dominant peak at approximately
St = 0.18–0.21 for the laminar case (left panel), which is associated with the periodic vortex shedding from the cylinder and representing the fundamental mode; there are also lower-amplitude peaks at higher frequencies, which correspond to higher-order harmonic modes. The turbulent cases (middle and right panels) show a dominant peak frequency, which compares within 3% of the vortex shedding
St. The peak from the fundamental mode co-exists with a broadband spectrum, extending up to six times the dominant frequency, and corresponding to the noise generated by turbulence.
5. Modeled Turbulence Simulation Results
The turbulence model study includes an assessment of numerical schemes, grid and time-step sizes, and low- and high-fidelity turbulence models, and their effect on aeroacoustic predictions. The analysis of the results focuses on the prediction of integral flow quantities, , CLrms, vortex shedding frequency; qualitative assessment of the vortical structures and pressure fluctuations; analysis of the pressure fluctuation at several probes located around the cylinder up to r = 80D, including FFT and RMS decay along the radial direction; and validation of the sound pressure directivity plots at r = 80D and peak sound pressure level against DNS data obtained above. To compute the prms, tests were performed using different data lengths to ensure that estimates are not affected by the sampling size. It was found that time history of at least 10 pressure oscillation cycles is required to reach a converged directivity pattern. FFT analysis requires that the dataset be the nth power of 2, 3, 5, or 7. In addition, the data series must cover an integer number of periodic sound pressure cycles. The data sampling cannot meet both requirements simultaneously, resulting in discontinuity between the end points of the sample data and potential distortion of the spectrum. To minimize this impact, a Hann windowing function was applied in the FFT process. The FFT analysis was performed using 32,768 (=215) instances of pressure history results, which corresponds to approximately 40 pressure cycles.
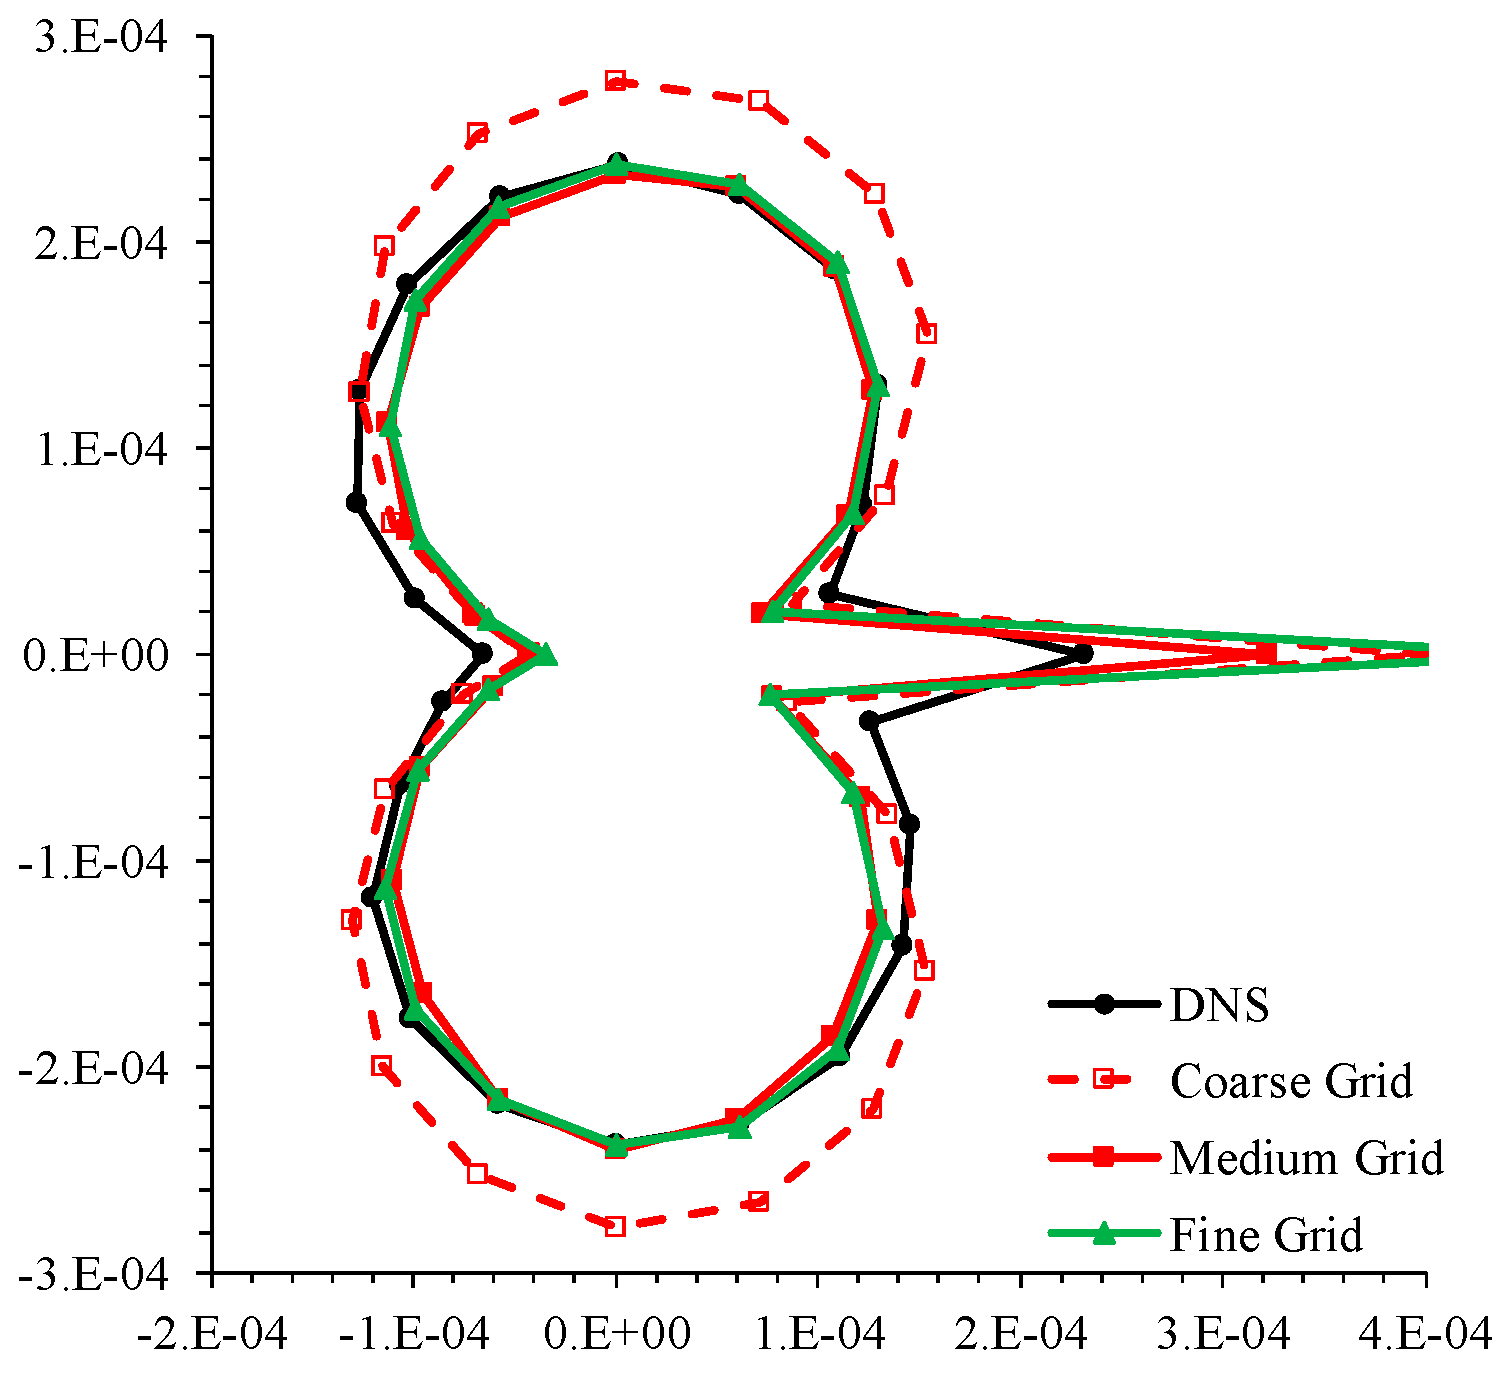
The grid sensitivity study In
Table 1 shows that both the Integral flow parameters and far-field acoustic predictions monotonically converge with grid refinement. The averaged convergence ratio
R = (
S1 – S2)/(
S2 – S3) ~0.22, which is significantly smaller than 1, suggests that grids are in the asymptotic range (Bhushan et al. [
50]), where
S1, S2, and
S3 represent numerical solutions obtained on the fine, medium, and coarse grids, respectively (sound directivity results for different grid counts are also shown in
Figure 5).
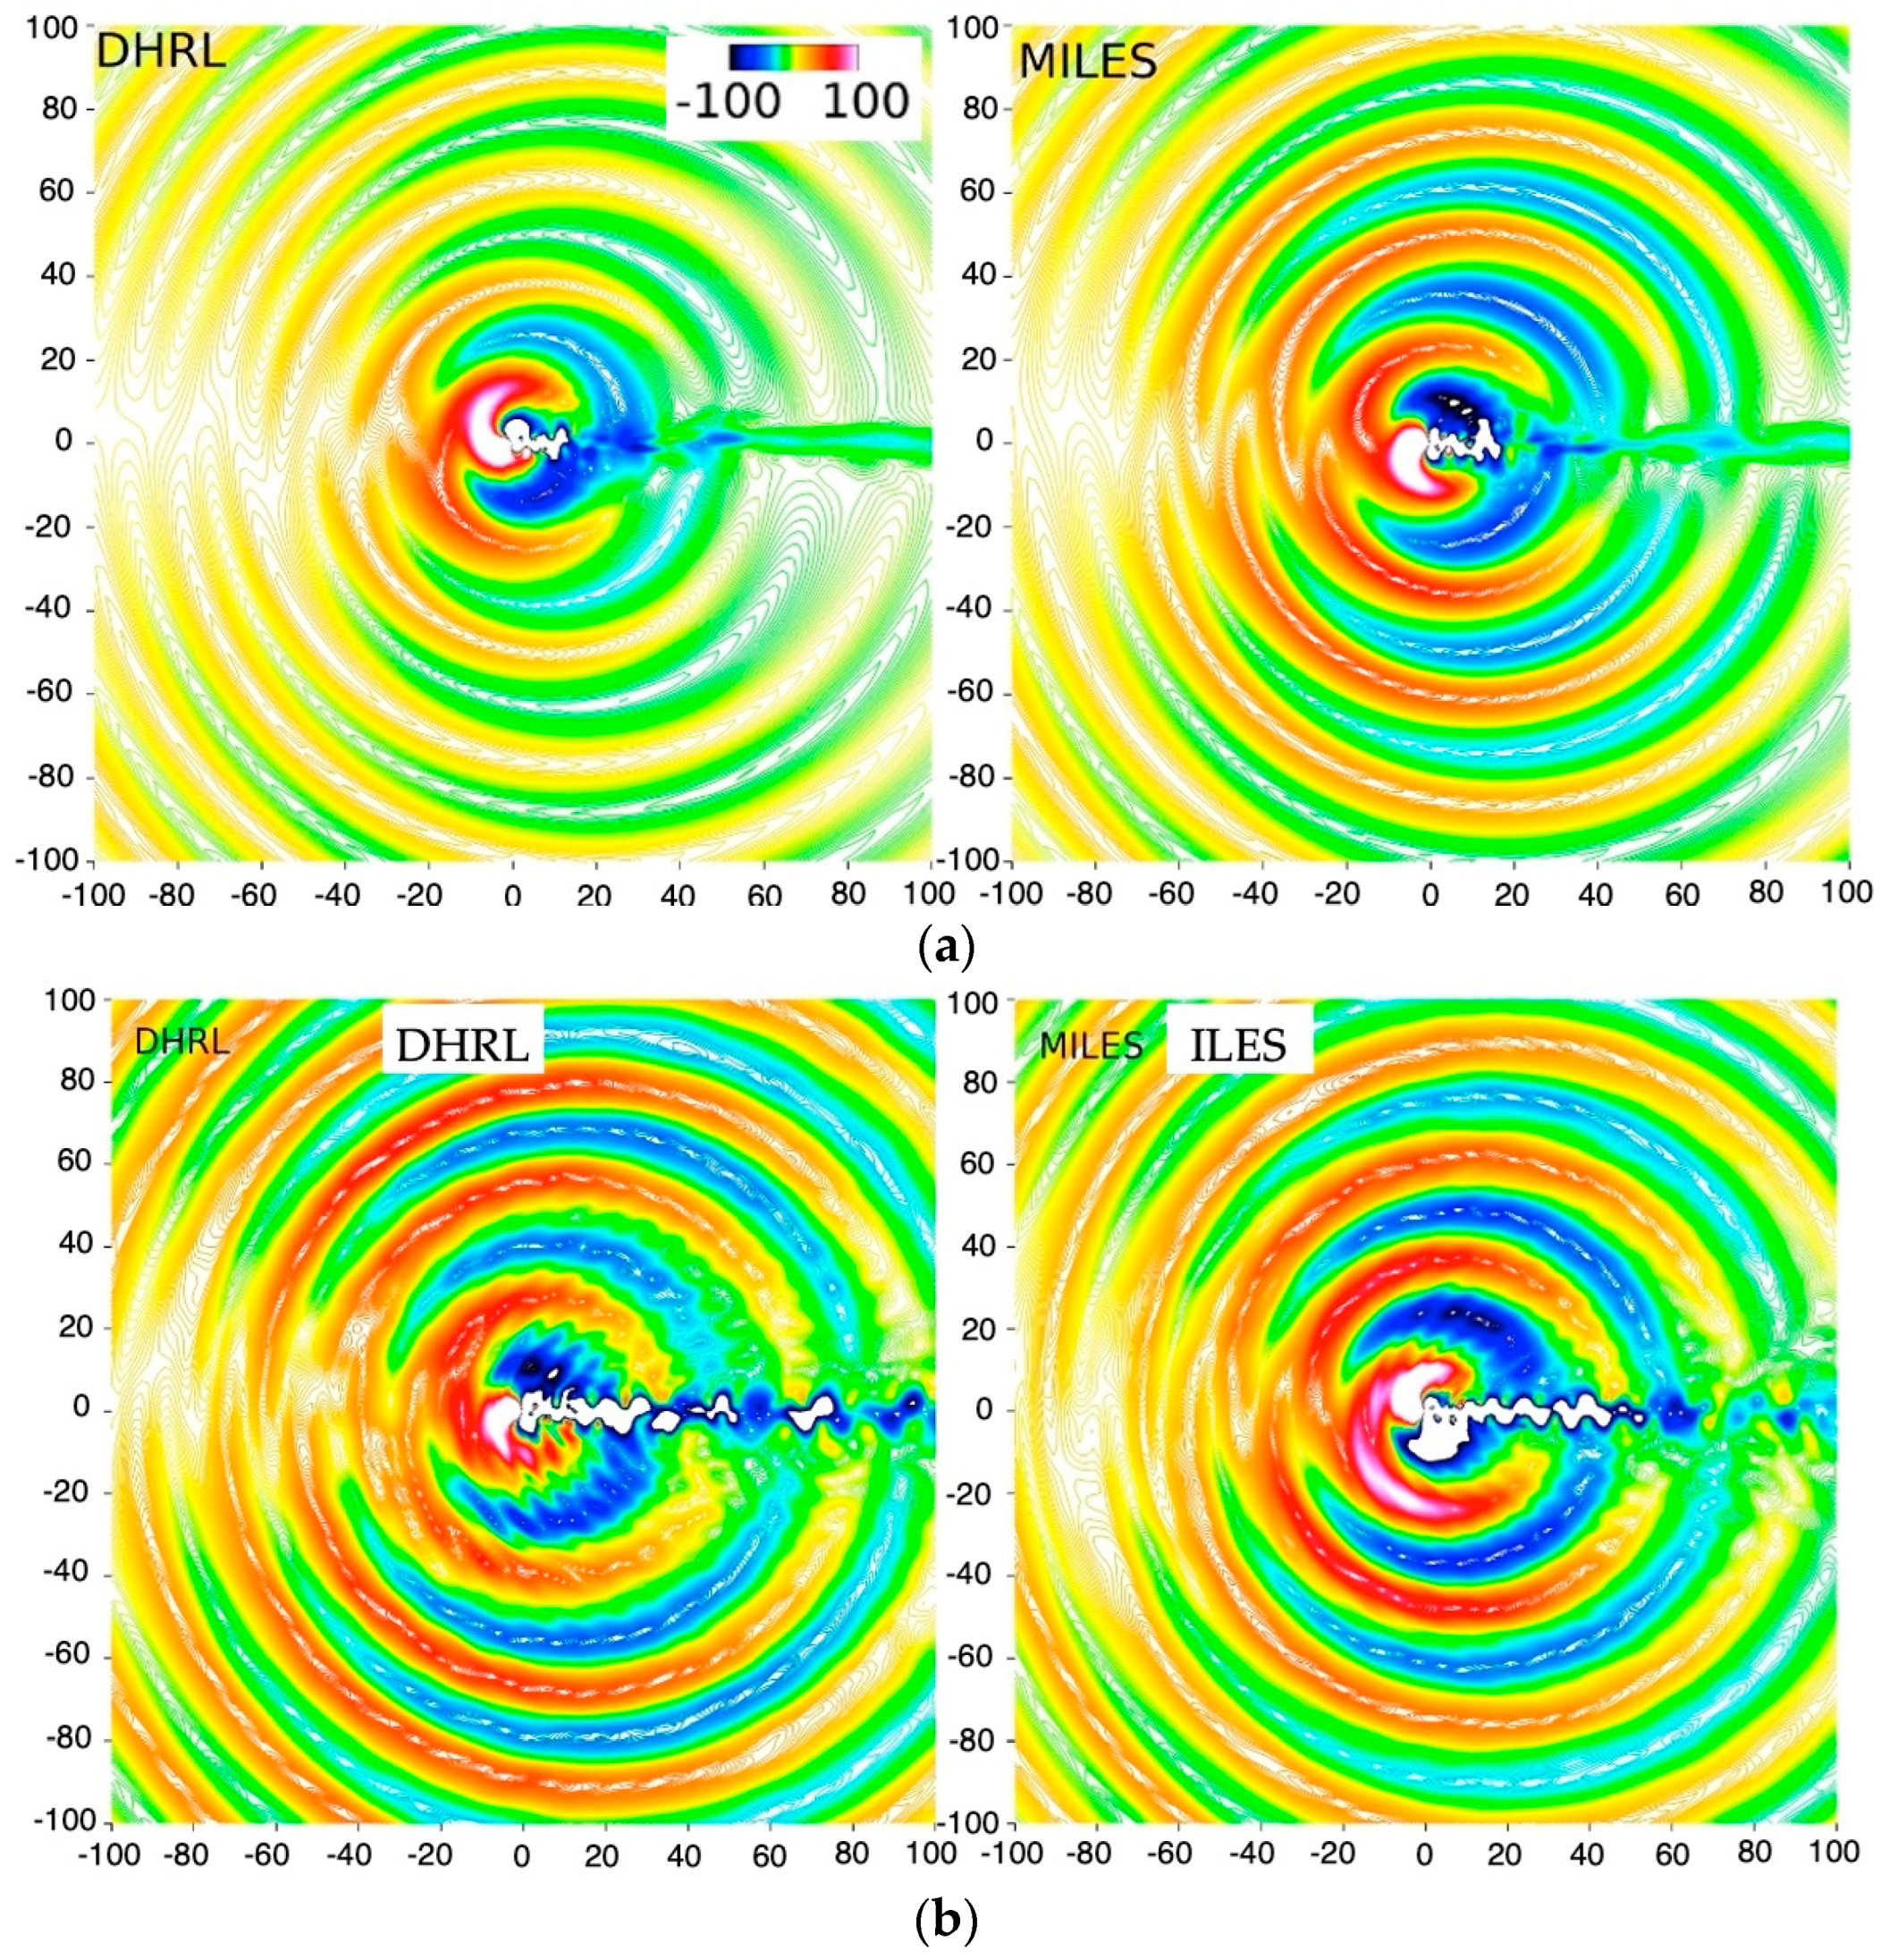
The URANS predictions do not show significant dependence on the numerical scheme, but higher-fidelity predictions show significant dependence. As evident from
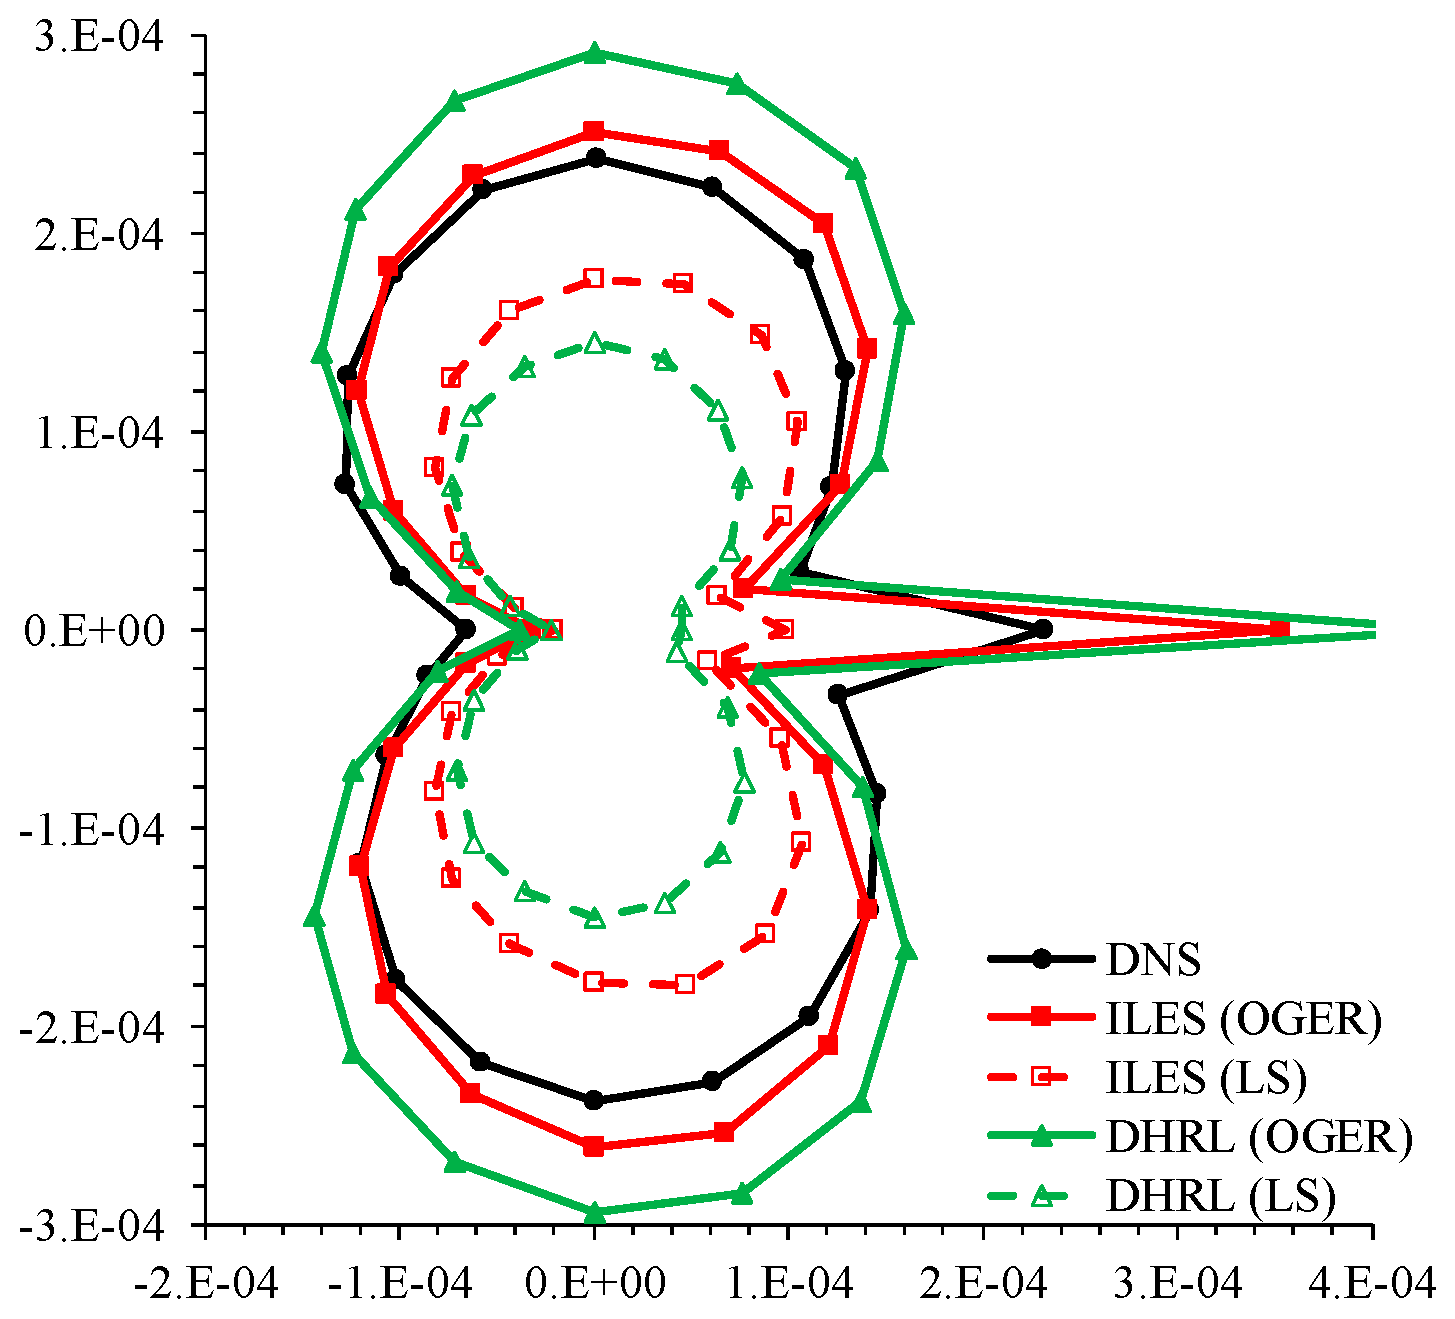
Figure 6a,b, results obtained using the least-square scheme show significant dissipation in the far-field pressure fluctuations, and the dissipation is more prevalent for DHRL. The predictions of the sound pressure directivity at
r = 80
D in
Figure 7 show that DHRL and ILES predictions (red and green dashed lines) are 40% and 25% lower than the DNS. The predictions obtained using the OGRE scheme (red and green solid lines) show a 200–300% increase in the far-field pressure fluctuations over the least-square method, as the former has less numerical dissipation. OGRE results using ILES compare well with the DNS results, while the DHRL results are overpredicted. One can observe that the DHRL results show a dramatic change with numerical scheme, i.e., from 40% underprediction using least-square methods to 20% overprediction using OGER. Further, the latter is similar to those predicted by URANS. To further evaluate this behavior, a time-step sensitivity study is performed using two dramatically different time-step sizes, Δ
t = 0.165
c/D and 0.029
c/D. URANS predictions do not show significant differences in the vortex shedding pattern for the two different time-steps. However, as shown in
Figure 8a, the smaller time-step resulted in 6% lower pressure fluctuations, resulting in a minor 3% improvement in the directivity amplitude predictions. URANS is unable to predict the acoustic noise amplitude in the wake, but overpredicts the amplitude in the flow normal direction by 21%. The high-fidelity models overpredict the noise amplitude in the wake by 100%, but agree reasonably well with DNS elsewhere. ILES predictions show a less than 3% change in the results because of time-step size and are around 6% overpredictive compared to DNS in the flow normal direction. As shown in
Figure 8b, both HRL and DHRL
prms amplitude predictions showed around 20% change, where DHRL predictions decreased with the decrease in the time-step size and an opposite behavior was observed for HRL predictions. In the flow normal direction, both HRL and DHRL results using a smaller time-step fall within 1% of the DNS. The sound pressure level spectra at
r = 80
D,
θ = 90° in
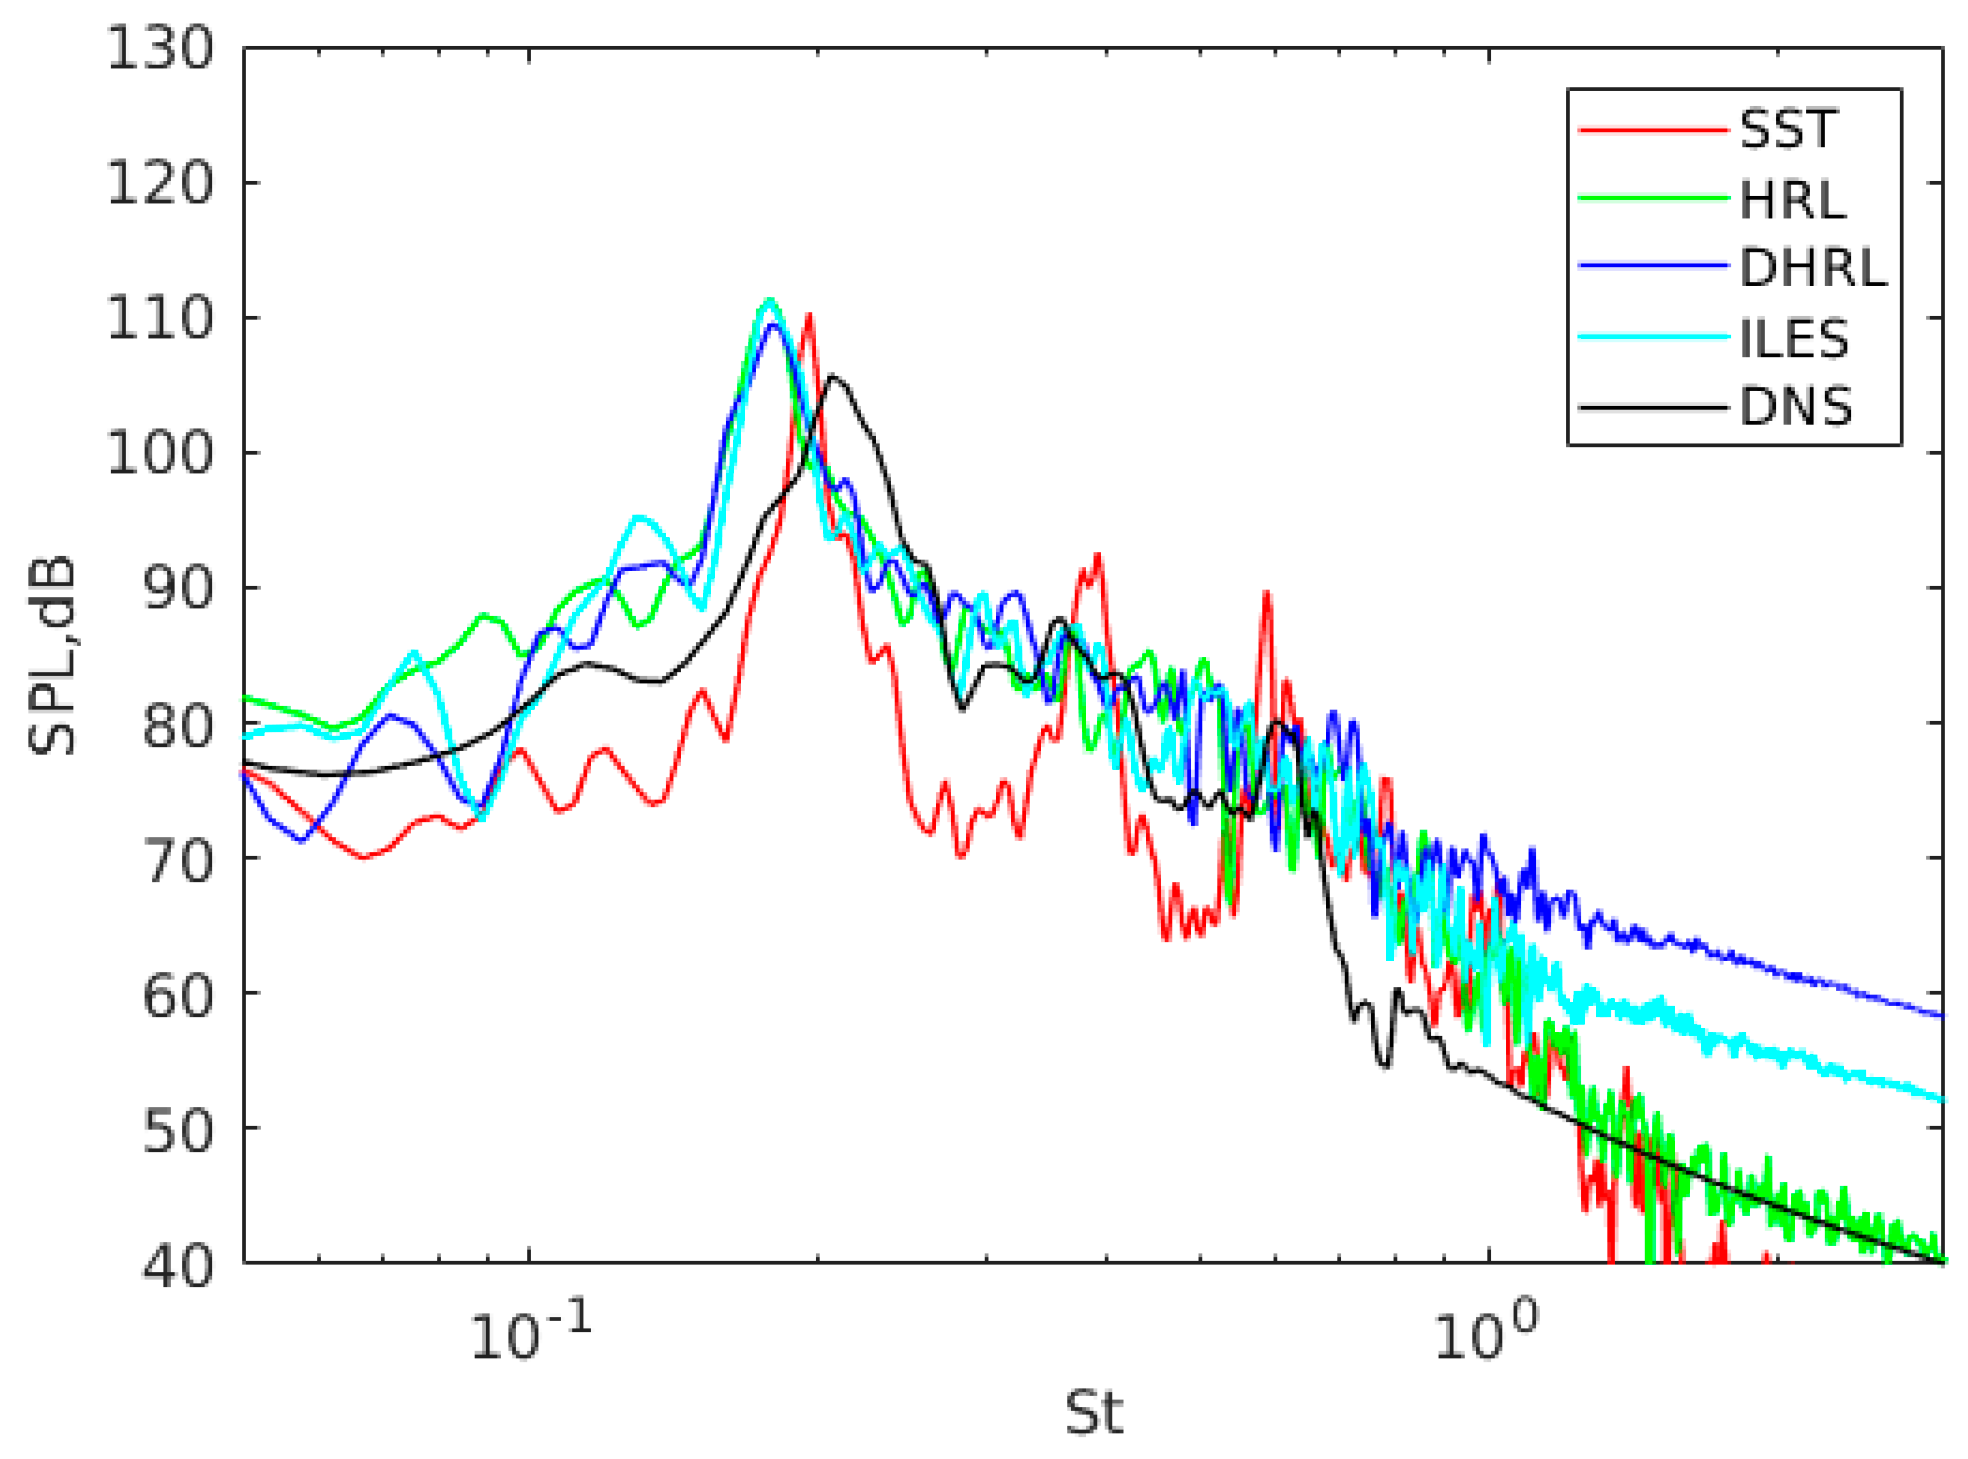
Figure 9 using smaller time-step size shows that URANS does not predict a broadband spectrum, and the dominant frequency is 20% lower than the DNS results, although the peak SPL amplitude falls within 4% of DNS. The high-fidelity models show a broadband spectrum similar to DNS, and the peak SPL compares very well with DNS; however, the dominant frequency is underpredicted by ~25%.
Overall, the analysis reveals that smaller time-step size is essential in combination with finer grid resolution and higher-order numerical schemes to obtain accurate predictions of the resolved turbulence predictions using hybris RANS/LES models. This is expected, considering that accurate resolution of resolved turbulence structure requires resolution of both their length (wavenumber) and time-scales (frequency). The lower-order schemes dissipate the resolved turbulence, thereby underpredicting pressure fluctuations (or sound pressure level). URANS is excessively dissipative and predicts only the large-scale vortex shedding. It overpredicts the sound pressure level because of overprediction of large-scale structures, as its break-up to smaller-scale structures is not predicted. DHRL predictions on fine grids and a higher-order scheme, but using larger time-step size, are unable to predict the resolved turbulence accurately, and the results behave more like URANS. HRL predictions on a fine grid using a higher-order scheme, but with larger time-step size, predict the break-up of the large-scale structures, but the turbulence structures are dissipated much more rapidly, resulting in underprediction of the pressure fluctuations. ILES predictions show reasonable prediction of high-frequency fluctuations even using large time-step size, probably because of the lack of sub-grid stress modeling that allows numerical fluctuations to be sustained. Even though the ILES predictions turned out to be accurate for the present set-up, these results should be considered with caution. For even finer grids, ILES may result in excessive numerical fluctuations causing energy pile-up in higher frequencies, leading results to deteriorate or diverge.
As shown in
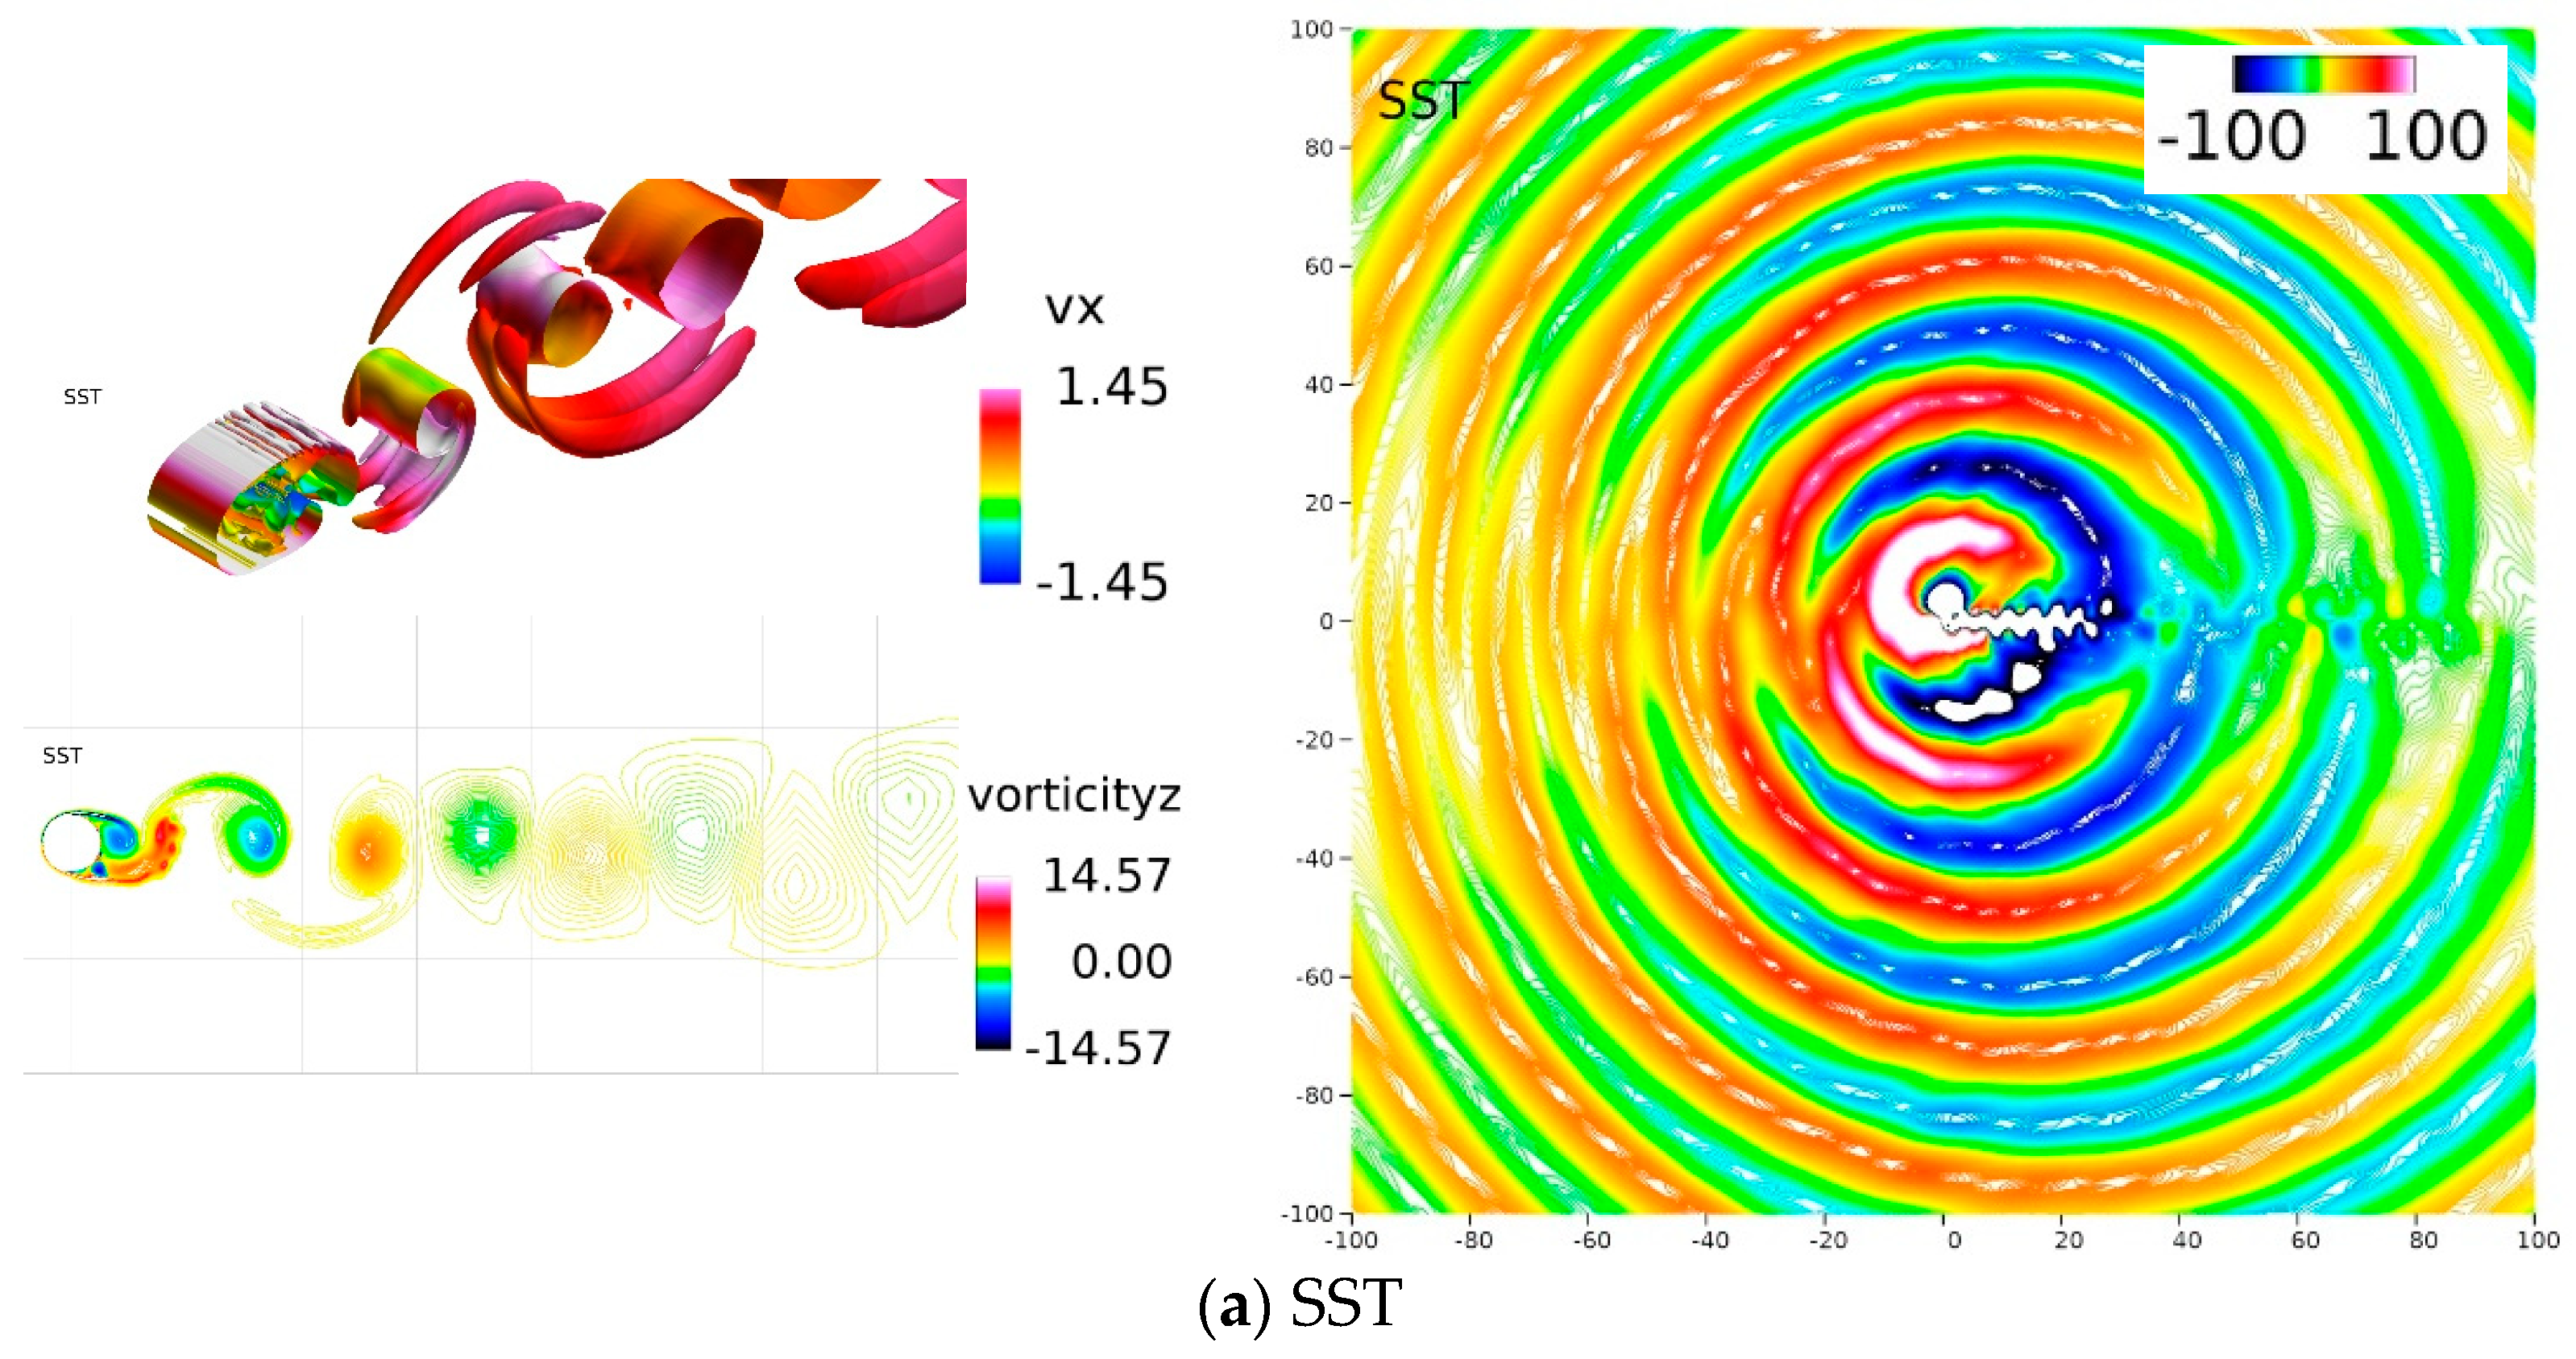
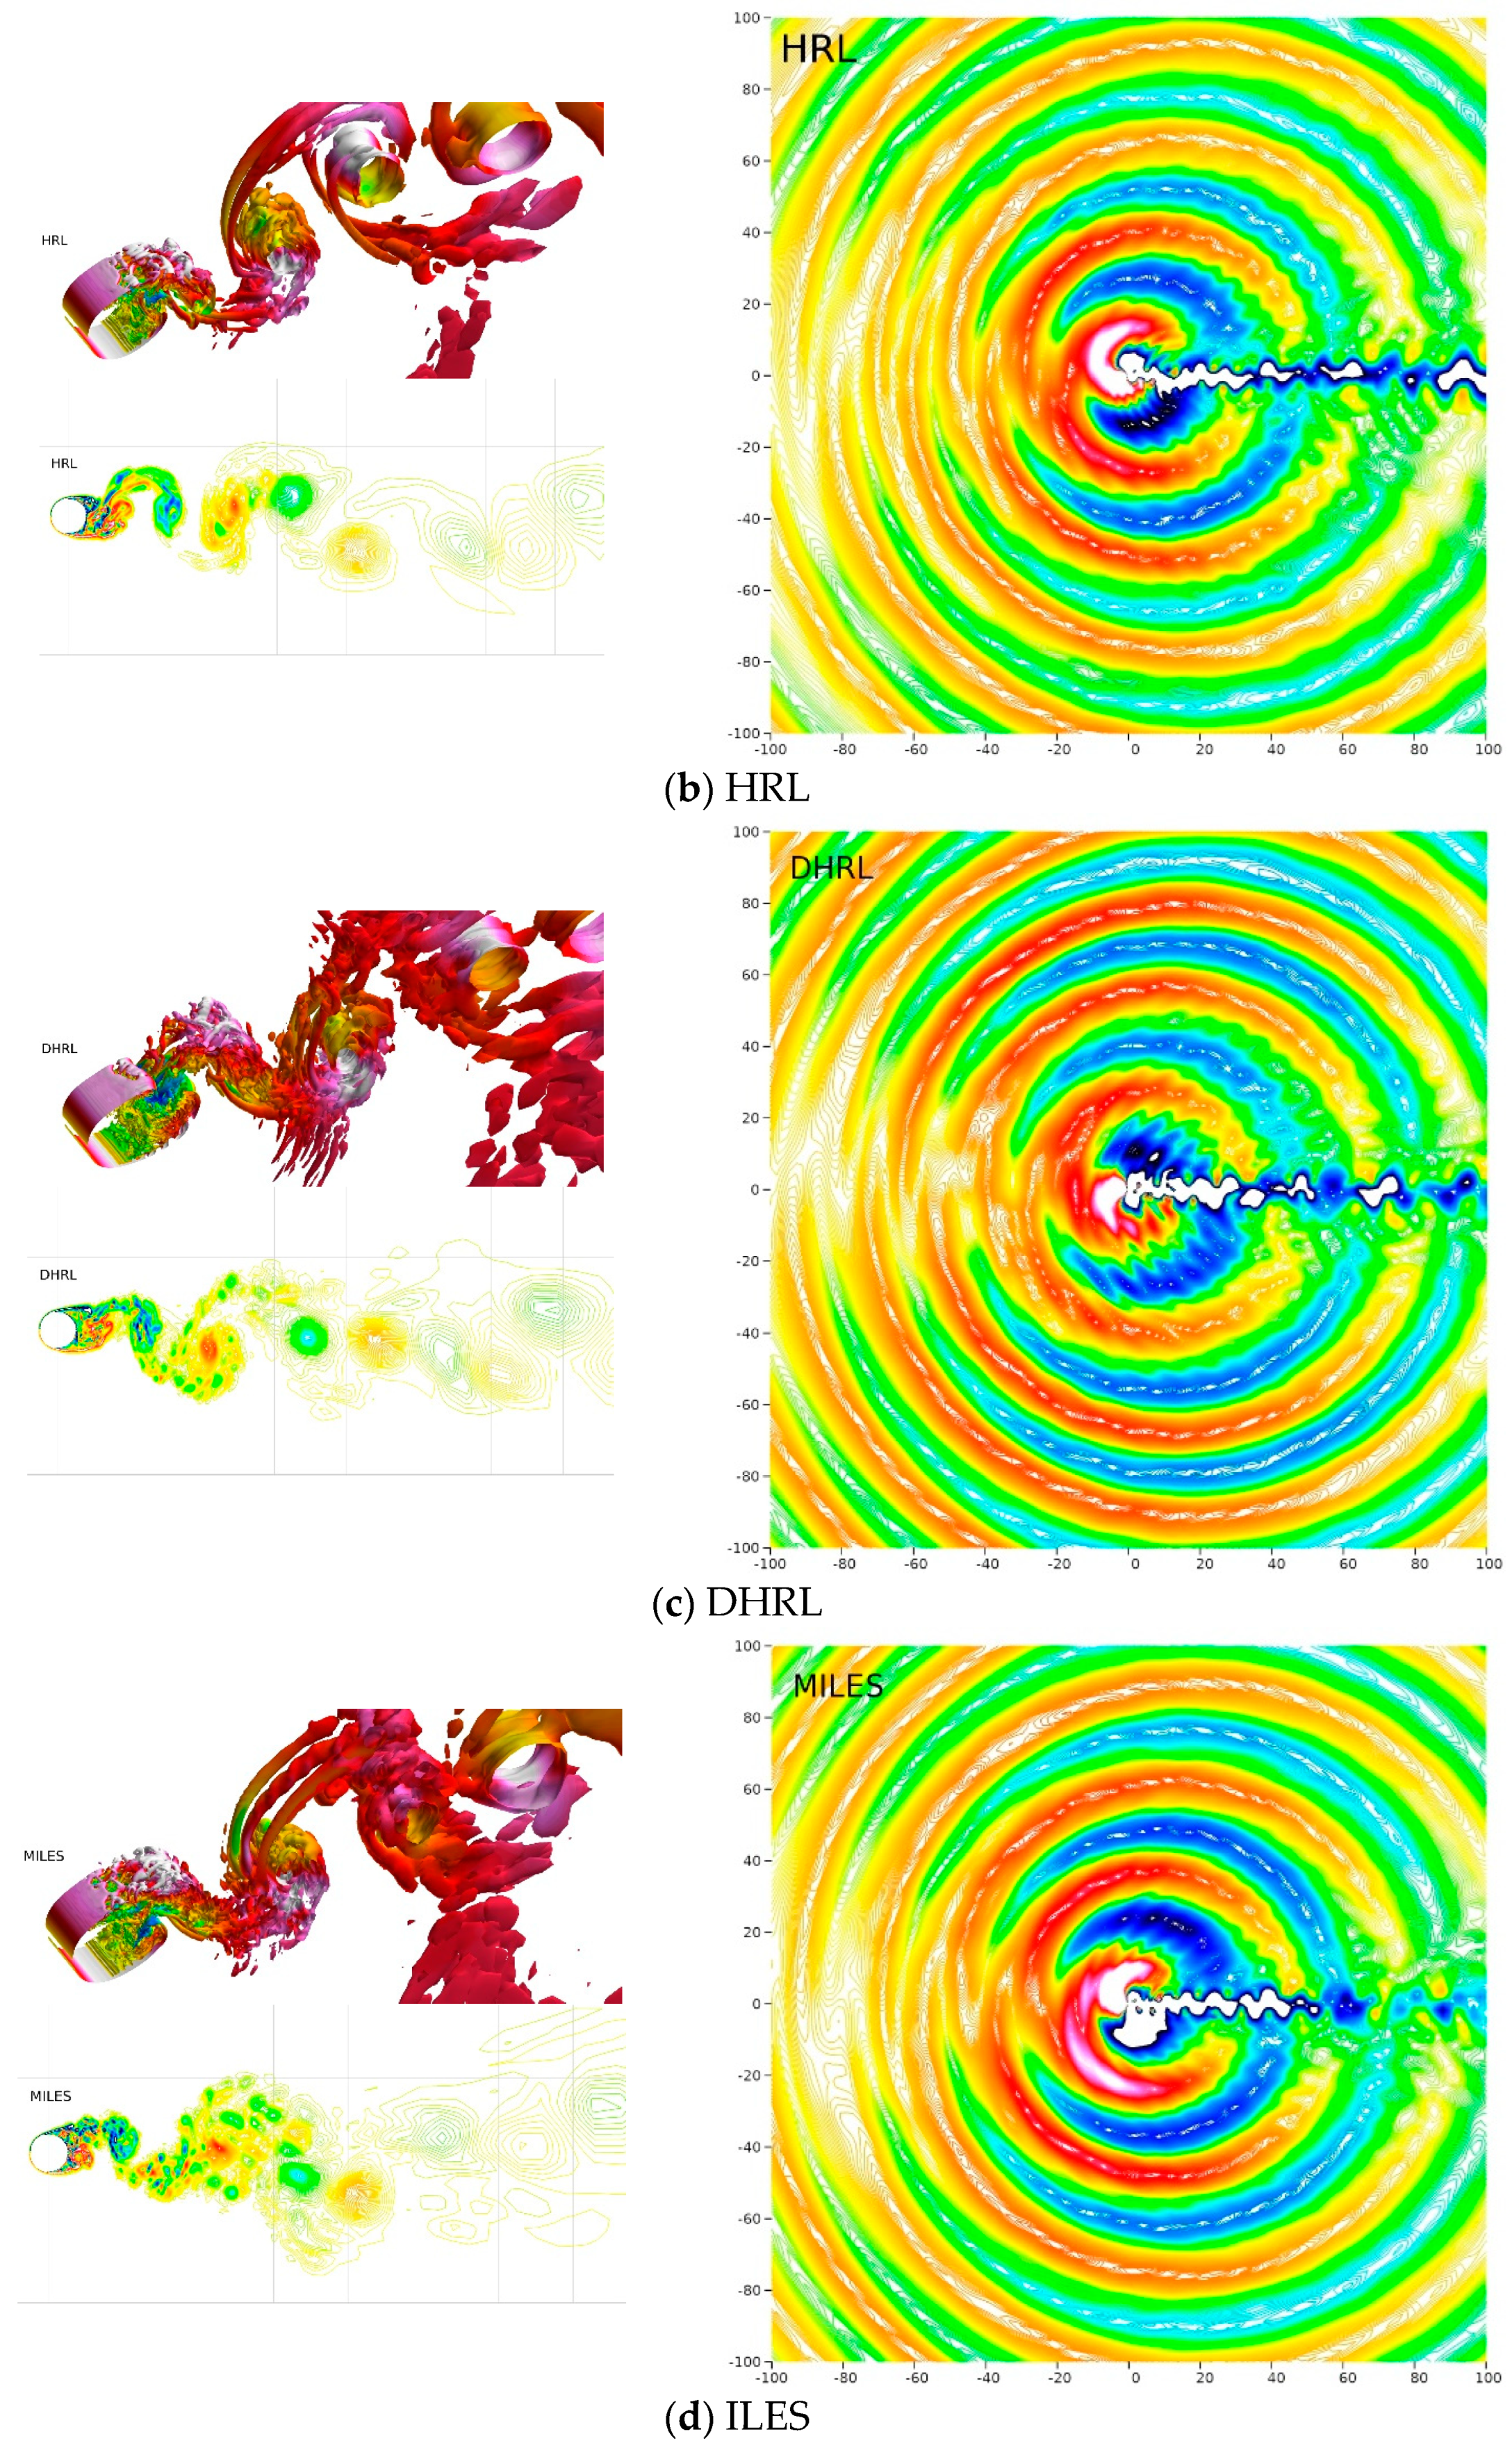
Figure 10a, URANS predicts primarily large-scale vortex shedding downstream of the cylinder, which is 2D in nature. HRL, DHRL, and ILES (together referred to as higher-fidelity models) in
Figure 10b–d, respectively, show generation of 3D coherent structures and break-up of the 2D shear layer right after separation. The break-up of the shear layer occurs much faster in ILES than in HRL or DHRL. All the models show a pressure wave emanating from the cylinder similar to DNS. Qualitatively, the primary difference between the turbulence models is the extent of the fluctuations in the wake. URANS predicts a much shorter extent than higher-fidelity models. Among the higher-fidelity models, the HRL predicts the most active wake, and ILES predicts the least active wake. For the drag predictions, all the turbulence models are overpredictive compared to DNS. The errors are largest for URANS (~24%), whereas the high-fidelity models show lower error levels of 12–15%. The turbulence model simulations significantly overpredict
CLrms. URANS is the most overpredictive (~125%), whereas the high-fidelity models show somewhat lower error levels of ~90%.
Table 1 also summarizes CFD predictions available in the literature using high-fidelity turbulence models (LES or hybrid RANS/LES) and their validation against experimental data. Note that detailed validation is available mostly for low
Re, and one can observe that CFD prediction errors for drag increase up to 9.3% for
Re = 1000. The large errors for higher (sub-critical)
Re are because of inaccurate prediction of the laminar separation from the cylinder surface and shear layer break-up after separation. Accurate predictions of these features require significantly finer grids. Thus, the large errors herein are attributed to coarse grid resolution near the separation and shear-layer regions. For the vortex shedding
St, all the simulations show mixed over- and underpredictions, and HRL and DHRL predict the largest error of ~15%, while ILES predicts the least error of <0.1%.
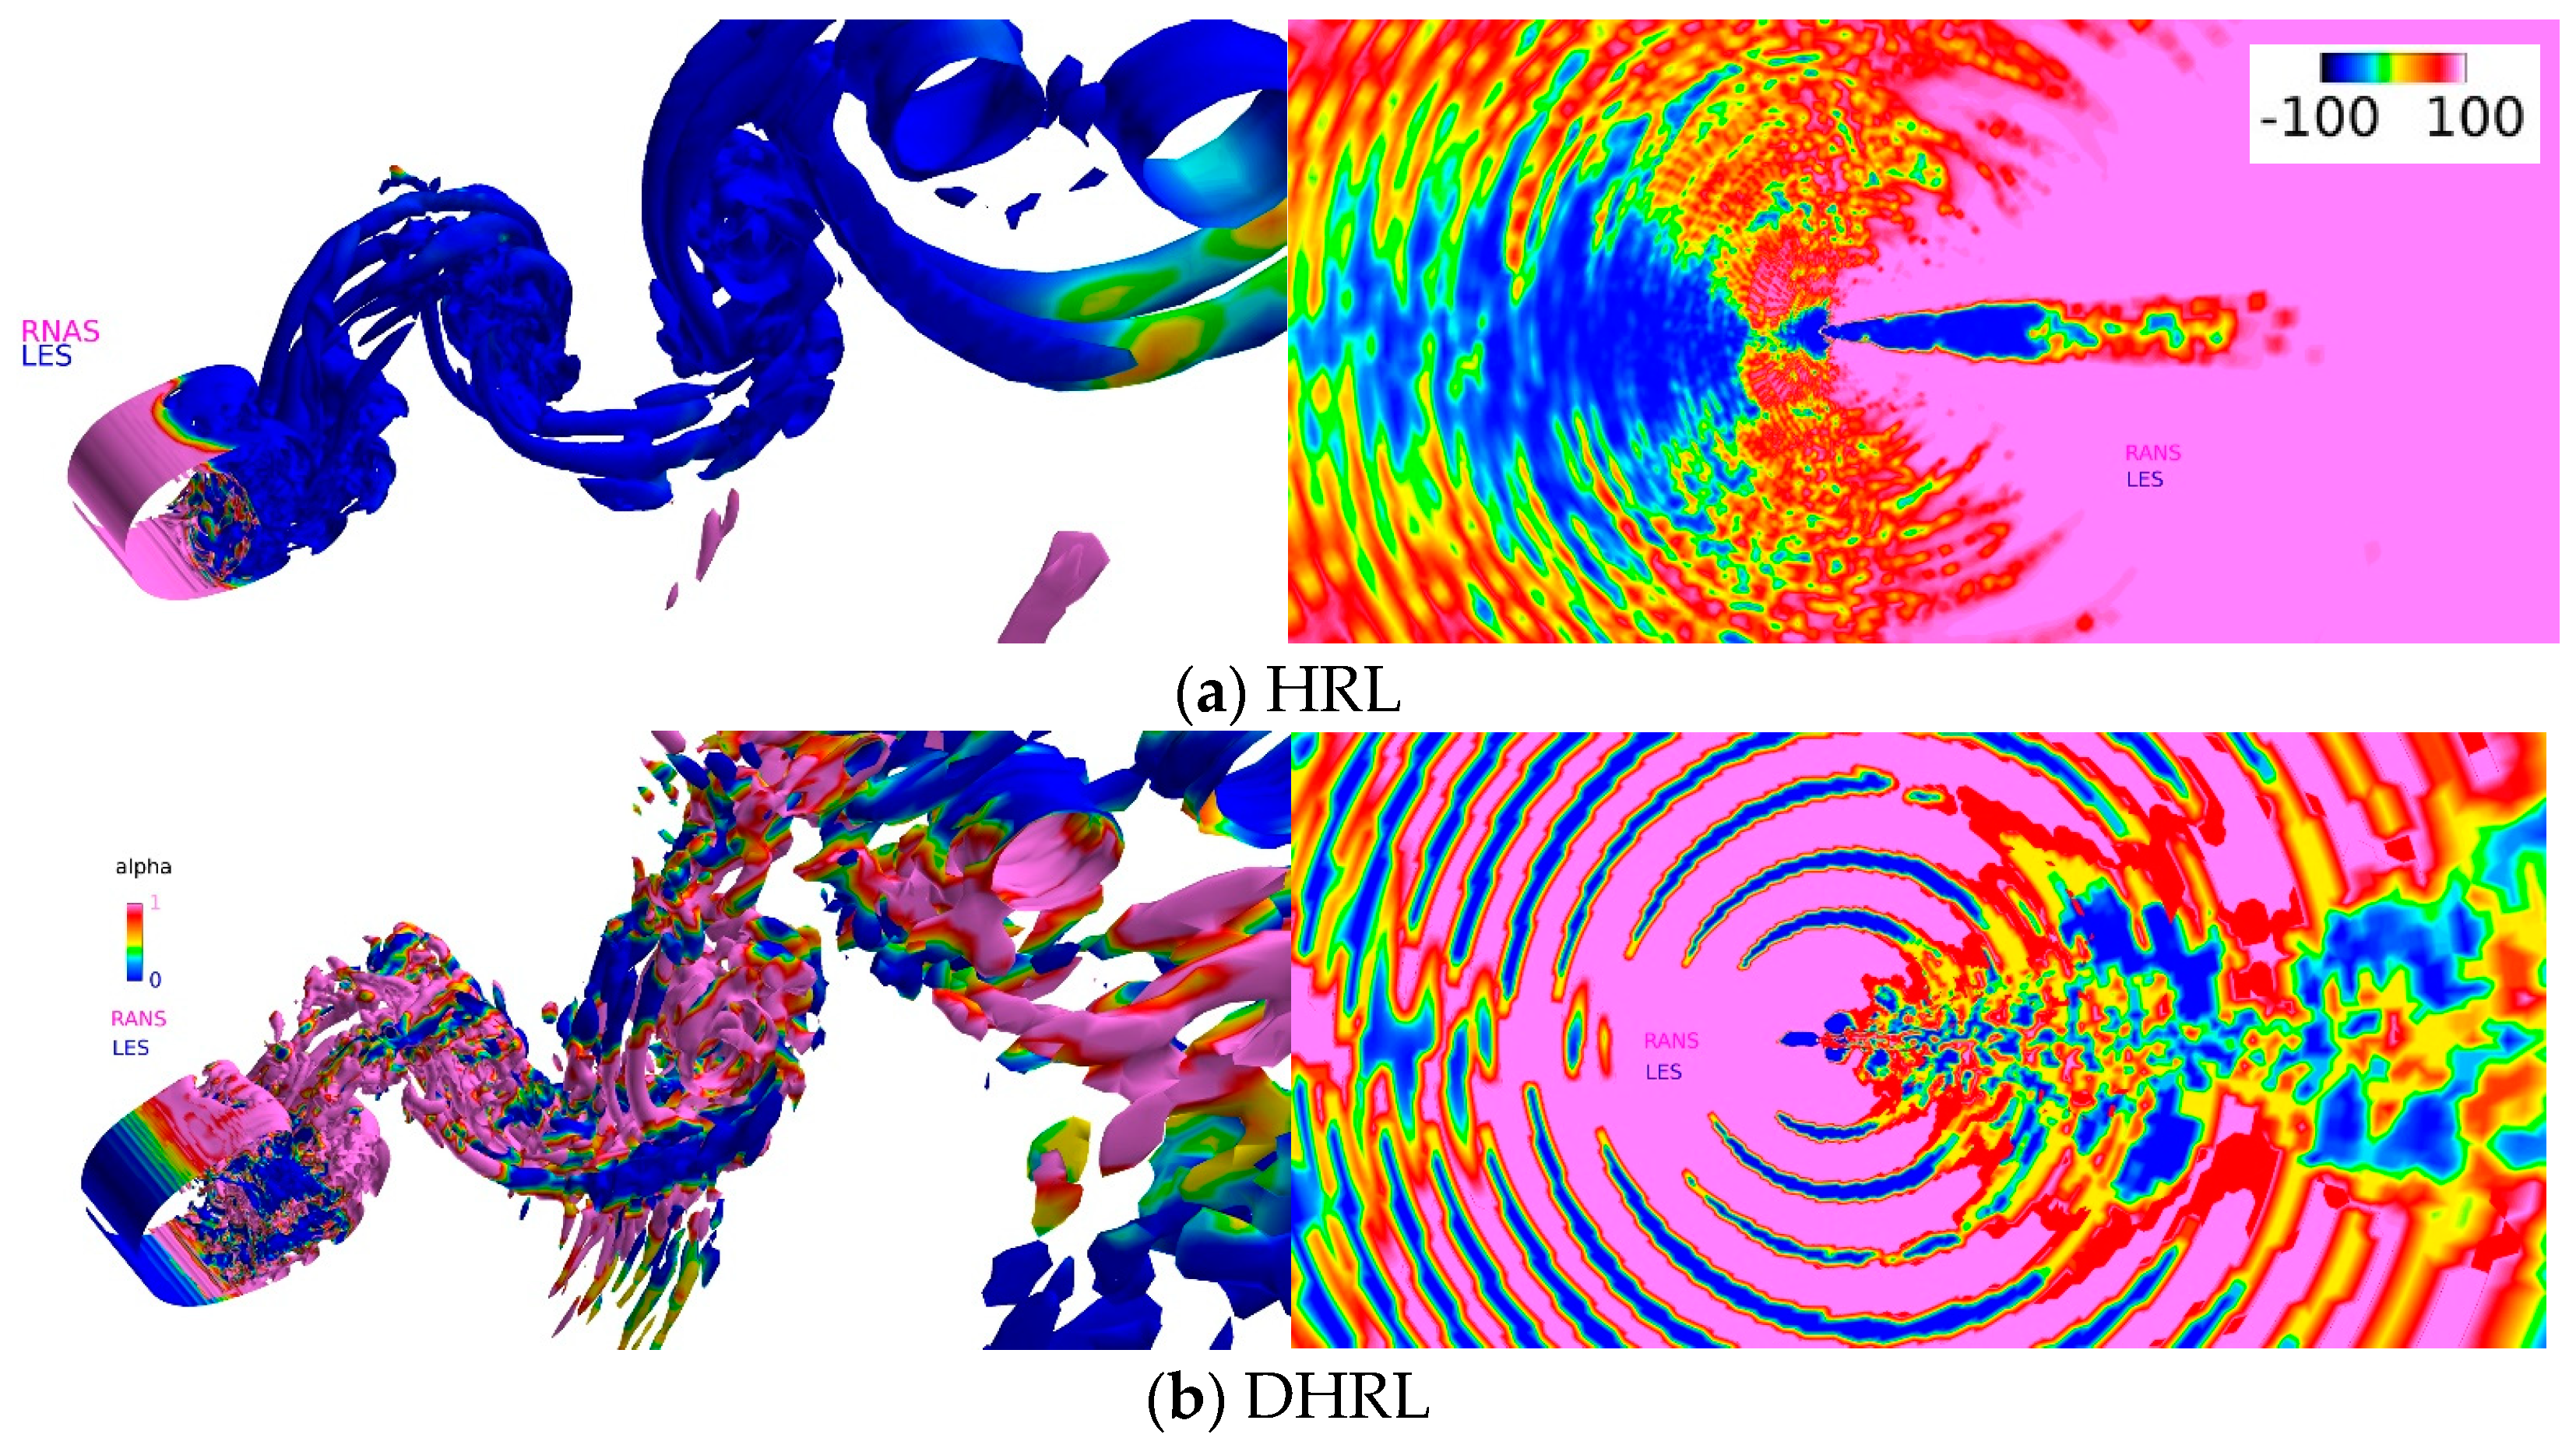
HRL and DHRL show very similar predictions for the integral quantities and far-field acoustics (on the finest grid and using small time-step size). However, they predict very different RANS and LES regimes, as shown in
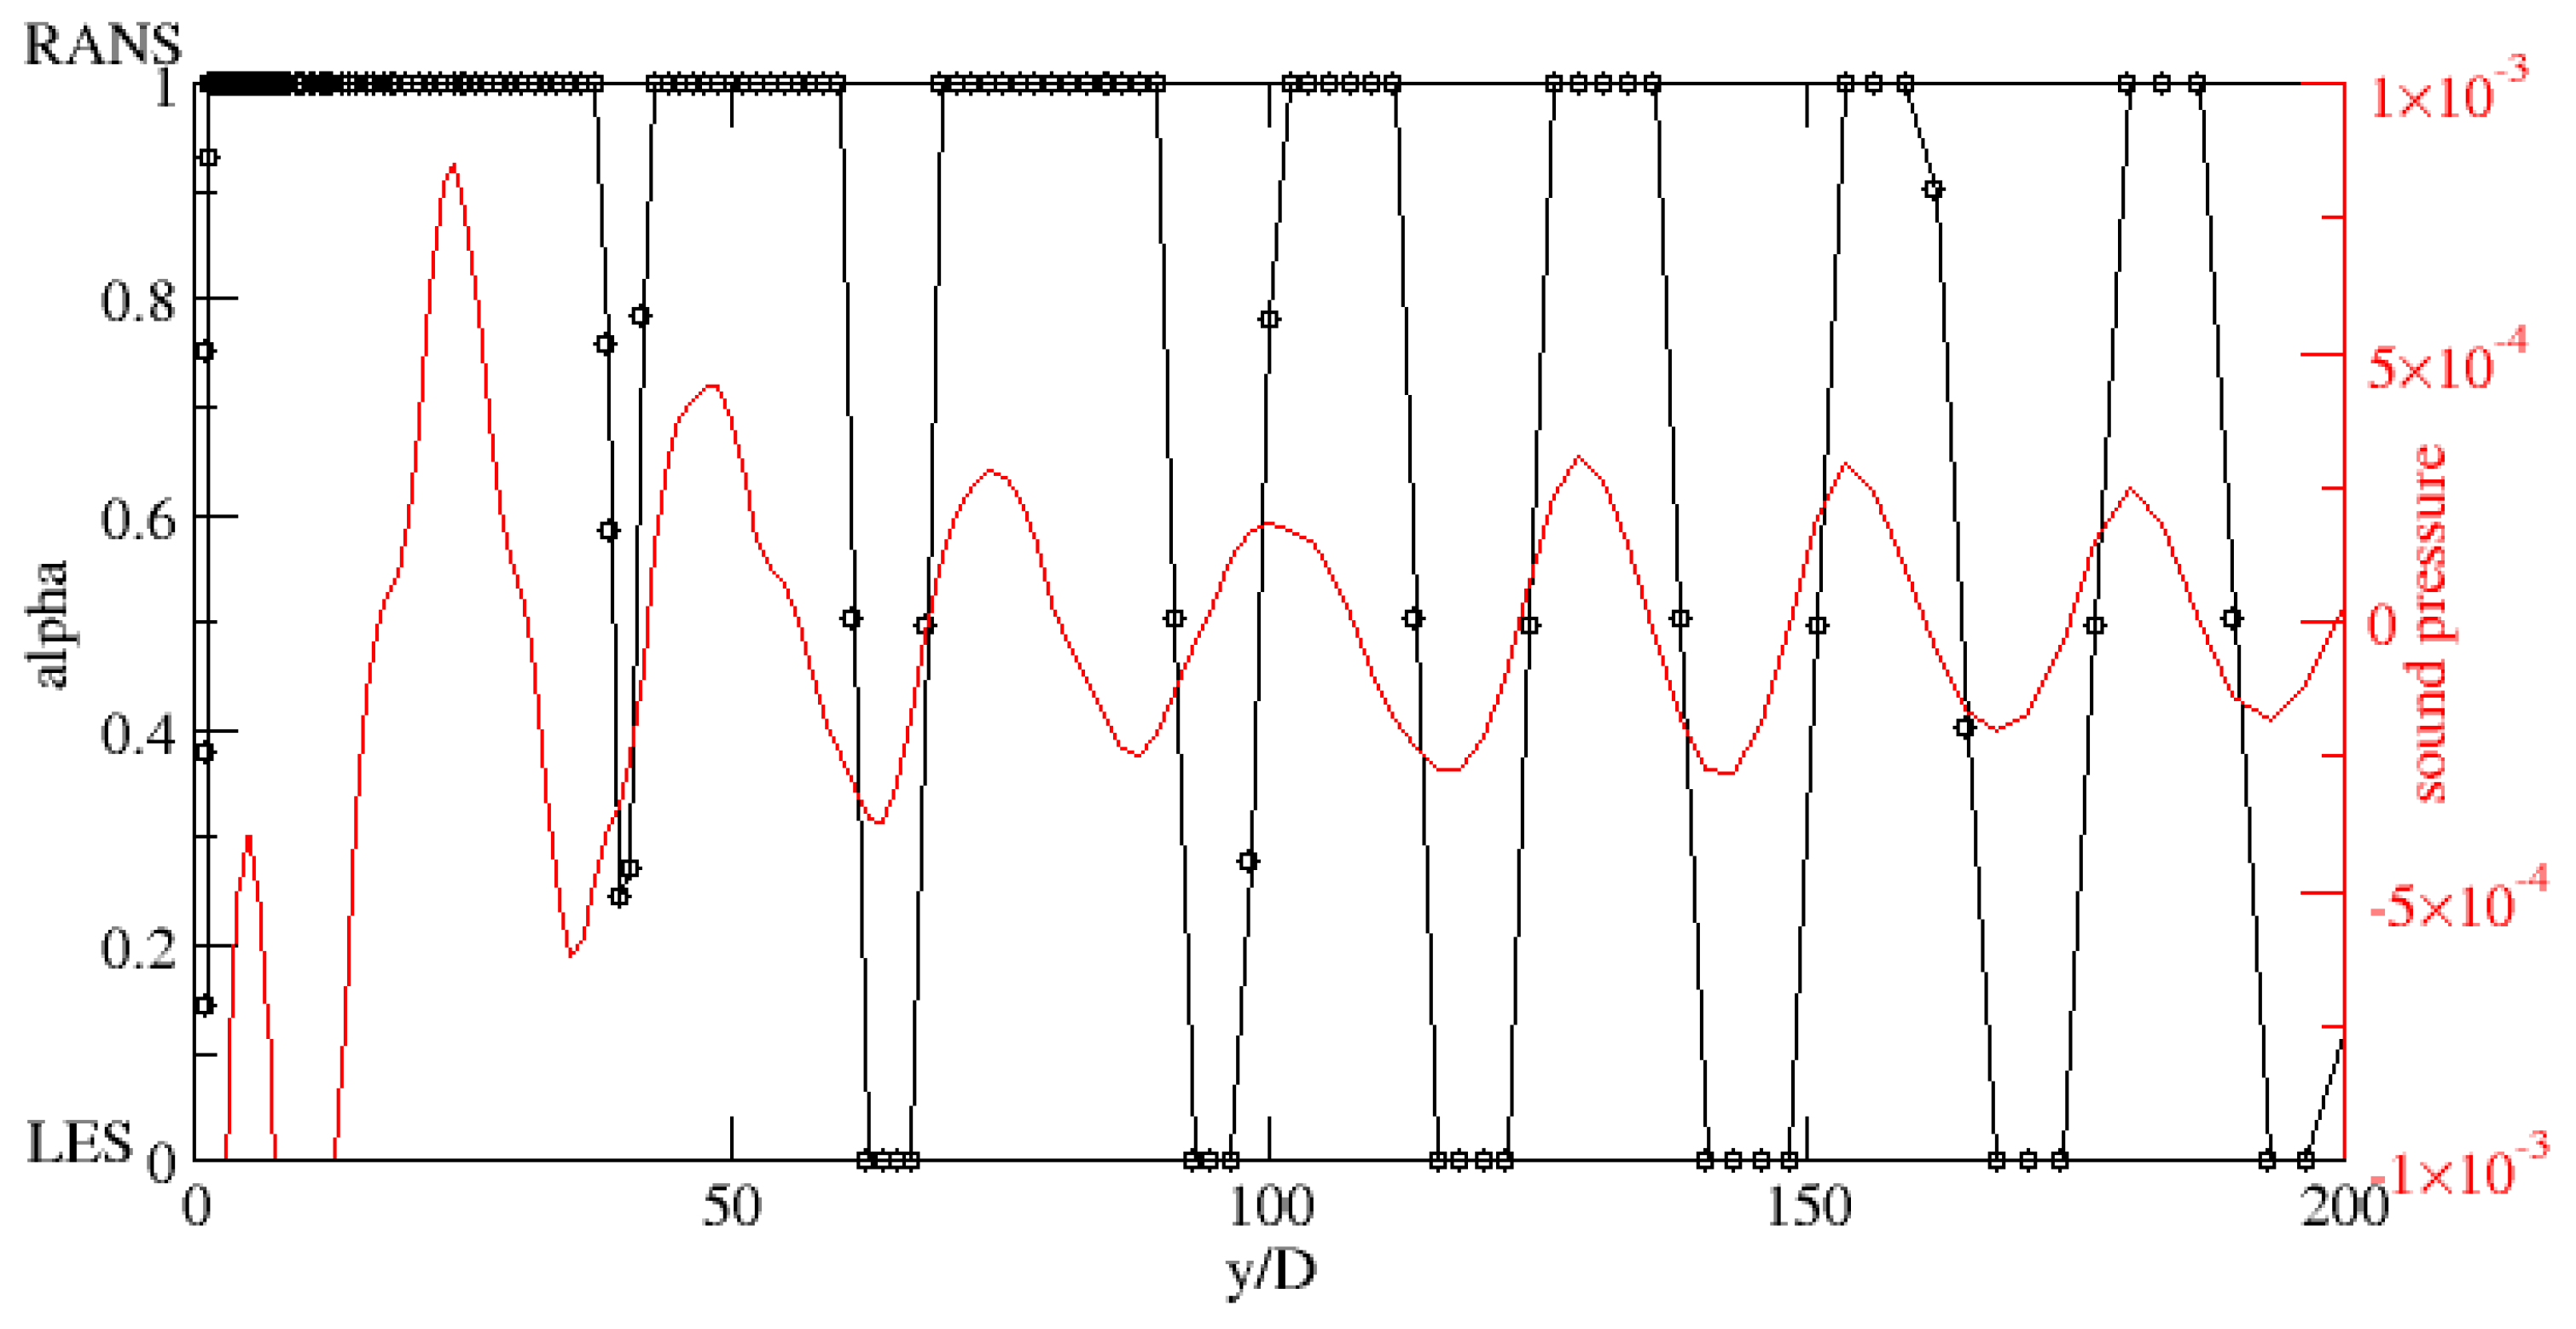
Figure 11. In HRL, the LES region is active in the wake, and along the
θ = 90° direction where the acoustic propagation is strongest. LES is also active in the upstream region; this is because turbulence is negligible in this region. DHRL predicts mixed RANS and LES regions throughout the domain. One of the primary differences is the activation of mixed RANS/LES regions for
θ ≤ ±45° in DHRL, whereas HRL shows primarily the RANS region. Secondly, DHRL predicts RANS and LES regions aligned with the pressure waves, where RANS is activated at sound wave peaks while LES is activated in the sound wave troughs, as shown in
Figure 12. This suggests that resolved turbulence is higher in the trough than at the peaks. Overall, the distribution of the RANS and LES regions in DHRL seems more realistic than those in HRL; however, they do not show significant impact on the prediction variables considered in this study.
To understand the differences in the turbulence model predictions, the spectrum of pressure fluctuations and decay of the pressure (
prms) and velocity (
vrms) (radial and normal components) fluctuations in the wake are plotted in
Figure 13. The FFT of pressure fluctuations in the wake (
Figure 9) does not show the dominant frequency peak as the unsteadiness due to Karman-like vortex shedding is comparable to the high-amplitude broadband noise from turbulence. The spectra show a slope of −3.5/3 for all the radial distances, but the amplitude of the fluctuations and the range of the frequency content decrease gradually with the increase in the radial distance. The slope of the spectra is consistent with the expected κ
−7/3 scaling for
in the inertial subrange of isotropic turbulence (Pullin and Rogallo [
51]), where κ is the modulus of wavenumber. The plots of
prms and
vrms (right panels in
Figure 13a) show that both decay slowly up to
r = 5
D, but show a sharp decay thereafter, where the pressure fluctuations decay much faster than the velocity fluctuations. In addition, the fluctuations predicted by URANS are three to four times lower than those predicted by a high-fidelity model. The FFT of pressure fluctuations in the flow normal direction (
θ = 90°) in
Figure 13b shows a dominant peak around ~0.2 for all the radial directions and is consistent with the vortex shedding frequency. The fluctuation amplitudes decay with the increase in radial distance, and the spectra show a slope higher than −3.5/3, suggesting faster energy cascade rate to the smaller scales than isotropic turbulence. The decay of
prms and
vrms show a steep decay up to
r = 8
D compared to those in the wake, and the decay rate is somewhat slower for a larger
r, opposite to the behavior observed in the wake. Further, the velocity fluctuations show faster decay than the pressure fluctuations, opposite to the trends in the wake. In addition, all turbulence models show a similar decay for
prms. The FFT spectra at circumferential location, i.e., different θ at
r = 80
D, in
Figure 13c show that the broadband spectrum shrinks somewhat from the downstream (
θ = 0°) to upstream (
θ = 180°) direction, and the slope of the spectrum more or less increases with θ. The velocity fluctuations are two orders of magnitude smaller than those of pressure fluctuation in the wake, but are around four orders of magnitude smaller elsewhere. This suggests that acoustics due to turbulence are mostly negligible in the far-field; however, they may make some contribution in the wake.
