Article

Damage Detection and Localization Methodology Based on Strain Measurements and Finite Element Analysis: Structural Health Monitoring in the Context of Industry 4.0

1
School of Engineering, Universidad Pontificia Bolivariana, Medellín 050031, Colombia
2
Corporación Rotorr-Motor de Innovación, Universidad Nacional de Colombia, Cr. 45 26-85, Bogotá 111311, Colombia
*
Author to whom correspondence should be addressed.
Aerospace 2024, 11(9), 708; https://doi.org/10.3390/aerospace11090708
Submission received: 28 June 2024 / Revised: 1 August 2024 / Accepted: 29 August 2024 / Published: 30 August 2024
(This article belongs to the Special Issue Aircraft Structural Health Monitoring and Digital Twin)

Abstract

:
This paper investigates the integration of Structural Health Monitoring (SHM) within the frame of Industry 4.0 (I4.0) technologies, highlighting the potential for intelligent infrastructure management through the utilization of big data analytics, machine learning (ML), and the Internet of Things (IoT). This study presents a success case focused on a novel SHM methodology for detecting and locating damages in metallic aircraft structures, employing dimensional reduction techniques such as Principal Component Analysis (PCA). By analyzing strain data collected from a network of sensors and comparing it to a baseline pristine condition, the methodology aims to identify subtle changes in local strain distribution indicative of damage. Through extensive Finite Element Analysis (FEA) simulations and a PCA contribution analysis, the research explores the influence of various factors on damage detection, including sensor placement, noise levels, and damage size and type. The findings demonstrate the effectiveness of the proposed methodology in detecting cracks and holes as small as 2 mm in length, showcasing the potential for early damage identification and targeted interventions in diverse sectors such as aerospace, civil engineering, and manufacturing. Ultimately, this paper underscores the synergistic relationship between SHM and I4.0, paving the way for a future of intelligent, resilient, and sustainable infrastructure.

1. Introduction

The United Nations included Sustainable Development Goal (SDG) 9 within Agenda 2030, which emphasizes the importance of building resilient infrastructure, promoting inclusive and sustainable industrialization, and fostering innovation [1]. Achieving SDG 9’s targets is crucial for sustainable economic growth and equitable development [2]. In this context, advanced technologies are playing a pivotal role in enhancing the efficiency and safety of infrastructure systems. The integration of Industry 4.0 (I4.0) technologies [3], including the Internet of Things (IoT), artificial intelligence (AI), machine learning (ML), big data analytics, and cloud computing, among others, into infrastructure management can enable real-time monitoring and enhance predictive maintenance processes [4,5]. Hence, I4.0 has become a required framework for Structural Health Monitoring (SHM), which has been used to ensure the longevity and safety of critical infrastructure by providing high-quality information for decision-making in risk management.
SHM is a well-known concept and practice [6,7,8] and its main techniques that have been used are shown in Figure 1. It is useful not only to prevent damage but also to extend the lifespan of elements, avoiding costs in maintenance, repair, and grounded or inoperable structures. The concept of using machine assistance for monitoring will lead to the next step of implementation of this methodology, with the continuous monitoring of elements.
SHM has become a topic of interest due to the large number of benefits it may provide to several industries, including reliability improvement and real-time damage detection, leading to lighter structures and maintenance cost reductions [9]. By implementing a real-time damage detection strategy, safety factors can be reduced under the damage-tolerant philosophy, especially for structures with high uncertainty in their failure modes (e.g., structures made of composite materials) [10].
One crucial aspect of SHM is the generation of vast amounts of data from sensors embedded in structures [11]. Therefore, advanced ML and AI algorithms can help process and analyze these data to extract valuable insights, patterns, and trends that may not be apparent through traditional methods [12]. This analytical capability enables the identification of subtle changes in structural behavior over time, providing early warnings of potential issues.
In this regard, ML and AI techniques are particularly valuable in damage detection and classification [13]. By training models on labeled datasets, the system can learn to recognize specific damage signatures and distinguish them from normal operating conditions. This ability to detect and classify various types of damage, such as cracks, corrosion, or material degradation, contributes to effective and targeted maintenance efforts [14], where a human could take time with the large amount of data to process or be subject to human error caused by fatigue or inexperience.
In parallel with the aforementioned intelligent processing techniques, sensor technologies have also advanced considerably during the last decades. For instance, with the advent of Fiber Optic Sensors (FOS), several SHM methodologies based on these sensors have been proposed in the scientific literature, being a suitable option for SHM of aerospace vehicles due to their small size, light weight, electromagnetic immunity, and multiplexing capability [15]. Such FOS are usually classified into local or point sensors (e.g., extrinsic Fabry–Perot interferometer), multi-point sensors (e.g., fiber Bragg Gratings) and distributed sensors (e.g., Rayleigh and Brillouin distributed sensors) [16].
The future of SHM within I4.0 is indeed bright. As these technologies continue to evolve and become more sophisticated, we can expect even more innovative applications that will shape the way we monitor, maintain, and ultimately safeguard our infrastructure for generations to come [17]. This powerful combination has the potential to create a world where infrastructure is not just static and reactive, but intelligent, adaptable, and capable of anticipating and responding to the ever-changing demands of the modern world [18].
SHM is set to revolutionize intelligent infrastructure development and management by transitioning from simple data collection to predictive maintenance systems [19]. By leveraging vast amounts of data collected from a dense network of sensors, SHM systems can utilize advanced analytics to predict potential failures. ML algorithms play a key role in this process, analyzing data to identify patterns and anomalies that may indicate emerging problems [20]. This predictive approach enables targeted interventions before issues escalate, saving time, money, and lives.
Modern sensors, combined with I4.0 technologies such as the IoT, enhance SHM systems by creating interconnected networks within a broader industrial ecosystem [21]. These systems enable real-time data exchange, allowing for a coordinated response to potential infrastructure threats. For example, traffic management systems can reroute vehicles to prevent overloading a bridge [22], while engineers receive notifications to plan necessary repairs. This real-time communication minimizes downtime, safeguards public safety, and supports proactive maintenance [23].
By harnessing the power of I4.0, SHM promotes improved safety, optimized resource allocation, and the longevity and resilience of infrastructures. In alignment with SDG 9’s targets, this paper addresses a successful case focused on a novel SHM methodology for detecting and locating damages in metallic aircraft structures, employing dimensional reduction techniques. The proposed methodology aims to identify subtle changes in local strain distribution indicative of damage. The study explores the influence of various factors on damage detection, including sensor placement, noise levels, and damage size and type. The proposed methodology for detecting cracks and holes as small as 2 mm in length showcases the potential for early damage identification and targeted interventions in diverse sectors such as aerospace, civil engineering, and manufacturing.
This paper is organized as follows. Section 2 addresses the important relation between SHM and I4.0. Section 3 describes the ML methods used in this study, the virtual testing setup, and the damage detection methodology. Then, Section 4 contains the results and the discussion, and finally Section 5 includes the conclusions.

2. SHM Context Within the Framework of I4.0

The SHM context within the framework of I4.0 emphasizes the transformative impact of integrating advanced technologies into infrastructure monitoring and maintenance. Figure 2 illustrates this integration, showing how key I4.0 components, such as artificial intelligence, machine learning, big data analytics, cloud computing, and the Internet of Things, enhance SHM systems across various industrial sectors. At the core, SHM is supported by these technologies, facilitating applications in fields like transportation, utilities, nuclear, health, mining, agriculture, construction, and manufacturing, among others. Figure 2 highlights specific uses, such as condition monitoring in manufacturing, power generation monitoring in utilities, and disease detection in health, demonstrating how I4.0 technologies can enable proactive maintenance, improve safety, and operational efficiency.

2.1. Modern SHM Applications

In the field of infrastructure, SHM transcends its traditional domain, evolving into a versatile technique for safeguarding infrastructures. For example, a bridge structure with steel beams can be instrumented with strain gauges and accelerometers to extract a lot of data [24], revealing early fatigue damage before it manifests as catastrophic failure. Hence, SHM can extend the bridge’s lifespan, ensuring the safe passage of individuals and vehicles of all kinds [25].
In the oil and gas industry, several subterranean aging pipelines [26] silently transport very important fluids and gases, mostly oil-based fluids. Here, acoustic emission sensors act as vigilant guards, listening intently for leaks or the initiation of corrosion. Their timely warnings prevent environmental catastrophes and economic losses, ensuring the smooth flow of resources that humanity relies on [27].
Shifting focus to the power generation industry, which has been transitioning to renewable sources, wind turbines transform kinetic energy from the wind into electrical energy. Fiber optic sensors embedded within the blades can detect minute deflections [28]. These whispers unveil impending cracks under extreme weather, enabling timely interventions that optimize energy production while safeguarding these colossal structures.
SHM has emerged as a significant advancement in the aerospace industry. Aircraft wings, once solely instruments for lift, are now equipped with embedded sensors that continuously monitor stress and potential damage during flight. This innovation enhances safety and operational efficiency, enabling more confident exploration of the skies [29]. Additionally, SHM has become a key factor in ensuring the high quality of spaceships and their parts in different stages like manufacturing and the operation of parts and machines. The use of this technique is often classified as a non-destructive test (NDT), and there are two main classes of measurement, dynamic testing and static testing. Typically, dynamic tests are related to electrical measurement: mechanical impedance, and thermal measurements [30,31,32]; on the other hand, static tests regard electrical impedance and strain-based measurements [33,34].
Strain-based measurements are the ones that approached the aerospace industry due to their effectiveness in damage detection [30]. This does not mean it is easy to measure damage in structures; instead this method represents many challenges in measuring small strains and also temperature changes. In order to partially overcome these challenges and to enhance damage detection, increasingly smaller in size and also reducing false indications, a new approach is used by means of optical fiber sensors like fiber Bragg grating (FBG) [35,36,37]. In FBG technology, a periodic grating inscribed in an optical fiber reflects specific wavelengths of light; changes in strain and temperature affect the grating’s period, allowing the fiber to detect these physical quantities [38]. Advantages of FBG sensors include [39] immunity to electromagnetic interference, high sensitivity and accuracy, multiplexing capability, long-term stability, light weight and small size, corrosion resistance, wide temperature range, and safety. There are other approaches in SMH with piezo-electric and piezo-resistive sensors in which the materials induce an electric charge when their shape changes due to stresses, but these are not often used in the aerospace industry since they are heavy and susceptible to failure under greater strains, and their size could result in installation issues [29]; however, piezo-electric sensors are cheaper to acquire.

2.2. SHM and I4.0 within Industrial Processes

SHM has been positioned as a game changer within the I4.0 paradigm, which emphasizes intelligent machines and data-driven decisions [40]. Sensors embedded in machinery and equipment continuously monitor their health, providing a steady stream of real-time data. Advanced analytics, powered by ML algorithms, analyze these data to not only detect current issues but also predict potential equipment failures before they impact production [41]. This proactive approach enables preventative maintenance, minimizes downtime, and optimizes production schedules.
In I4.0, SHM can excel by integrating with other industrial processes. For example, if an SHM system detects a potential issue with a bridge [42], it could trigger a series of automated responses: traffic management systems might reroute vehicles and nearby factories could adjust their production schedules to minimize disruptions. This real-time communication across various industrial systems creates an interconnected ecosystem, enhancing efficiency, safety, and cost-effectiveness.
Additionally, SHM data can be integrated with digital twin technology [43], creating virtual simulations of equipment performance. This integration allows engineers to test potential repair scenarios and predict the effectiveness of interventions before physically implementing them [44]. By optimizing maintenance schedules and predicting the impact of future operational changes, this approach streamlines maintenance processes, minimizes risks, and enhances process control. Ultimately, it ensures the continued smooth operation of the entire industrial ecosystem while reducing costs in the manufacturing environment.
SHM is primordial in modern manufacturing processes, particularly within I4.0. Its application has so many nuances in manufacturing, varying from monitoring the health of manufacturing equipment and facilities to ensuring the integrity of the products themselves [45,46,47]. In this context, SHM systems are employed to continuously assess the structural integrity of critical components and machinery, detecting any deviations from normal operating conditions.
By utilizing a network of sensors and advanced data analytics, SHM can provide real-time insights into equipment performance, alerting operators to potential failures or inefficiencies before they occur [48,49]. This proactive approach to maintenance enhances operational efficiency, reduces downtime, and ensures the safety and reliability of several processes [50,51]. Furthermore, SHM enables predictive maintenance [52], optimizing maintenance schedules based on actual equipment conditions rather than predefined intervals, resulting in cost savings and improved asset utilization. As I4.0 continues to evolve, the integration of SHM into manufacturing processes [53] will be essential, so that efficiency, productivity, and product quality could be higher.
Embedded sensors, strategically placed on critical equipment and machinery, continuously monitor parameters like vibration [54], strain [55], and temperature [56]. This data stream feeds into real-time analytics, allowing for the detection of anomalies and potential equipment degradation before they escalate into catastrophic failures. This empowers predictive maintenance, enabling targeted interventions at the early stages of wear and tear, minimizing time where the parts of machines are inoperative, and maximizing production efficiency [57,58,59].

2.3. Sensor Integration and IoT for SHM

SHM is advancing significantly in areas like sensor integration, the Internet of Things (IoT), and advanced data analytics to enhance decision-making regarding structural damage. Sensor integration and miniaturization involve embedding devices more deeply within the fabric of structures, enabling more comprehensive and continuous monitoring. This approach provides a global view of a structure’s health [60]. Additionally, miniaturized sensors are less intrusive and easier to deploy on existing infrastructure.
The Internet of Things and cloud computing represent key future trends for interconnected SHM systems. Sensors embedded in bridges, buildings, and other structures will transmit real-time data to a central cloud platform [61]. This facilitates remote monitoring and centralized analysis by experts, who can diagnose issues from anywhere in the world. Cloud computing also offers virtually limitless storage and processing power, making it easier to manage the growing data volumes from SHM systems. The scalability of cloud-based SHM systems will enable the easy integration of additional sensors and data sources in the future, paving the way for more comprehensive structural health assessments [62,63,64].

2.4. Advanced Analytics for SHM

AI offers significant potential to enhance SHM by enabling the analysis of complex sensor datasets [65]. ML algorithms can be applied to identify fine patterns and anomalies that may be missed by conventional methods and this capability allows the early detection of damage significantly before it progresses to a critical stage [66,67]. Additionally, AI algorithms can be trained by using historical data to predict the degradation of a structure over time [68,69], facilitating a transition from reactive repairs to preventative maintenance strategies. This proactive approach not only reduces life-cycle costs but also minimizes the risk of catastrophic failures by addressing issues before they escalate and by integrating AI with SHM systems. Infrastructure can be transformed into intelligent entities capable of communicating their health status and anticipating future maintenance needs [70,71,72].
SHM has entered the age of big data because the network of sensors embedded in bridges, buildings, and other structures generates massive amounts of data on strain, vibration, and environmental conditions. This massive amount of data, while valuable, presents a challenge and traditional analysis methods struggle to keep pace with the sheer volume and complexity of the information. Big data offers a solution by employing big data analytics, engineers can unlock the hidden insights within the SHM data [73], so these techniques allow for real-time monitoring, enabling early detection of potential problems before they become critical.
The introduction of big data in SHM has improved data management in terms of collecting, storing, and analyzing massive amounts of data with real-time processing [74,75], so adding ML to big data results in predictions about patterns and anomalies that might indicate structural damage and the insights from data analysis can be used to predict potential failures, so the lifespan of the structure could be increased and catastrophic failures prevented [76,77]. ML algorithms will become even more sophisticated and capable of not only identifying damage but also predicting its future progression and recommending optimal maintenance strategies [78]. This information can be used to create digital twins or virtual replicas of real-world structures and these can be continually updated with real-time sensor data, allowing engineers to virtually test different repair scenarios and predict the effectiveness of various interventions [79,80].

3. Materials and Methods

With the evolution of computer science, advancements in hardware, and the development of new software that facilitates the rapid implementation of ML algorithms, the need for constant human monitoring has decreased. Instead, tools from I4.0 and AI are increasingly used to prevent structural damage. These tools are based on fundamental ML algorithms and schemes [81], as illustrated in Figure 3. Combining these data-processing methods with various SHM monitoring systems represents the next step in maintenance for several engineering domains.

3.1. Descriptive Methods

Descriptive methods in ML focus on analyzing and summarizing data to understand its patterns and characteristics without making predictions [82]. These methods aim to reveal the inherent structure of the data through statistical measures, visualization tools, and clustering algorithms, which help uncover trends, distributions, and relationships within the dataset. Descriptive techniques provide a comprehensive overview, serving as a crucial initial step in the ML process. They guide subsequent modeling decisions and establish a solid foundation for further analysis. Often referred to as unsupervised methods, they do not require labeled datasets and can identify patterns in the data. The dataset and model will have the following characteristics:
  • Recent historical data are crucial for this analysis as it forms the foundation of the model. The model aims to identify trends based on recent behavior or events. If the dataset includes outdated historical data, the model may struggle to accurately simulate and classify current events. Therefore, it is essential to purge older data and retain only recent information that reflects current trends.
  • Nonexistence of an objective variable: As previously mentioned, these models focus on understanding the inherent structure of the data rather than making predictions. The model aims to describe phenomena effectively rather than optimizing or predicting a specific numerical value.
Clustering, exemplified by the k-means technique, is an ML method that groups similar data points based on shared characteristics [83]. k-means iteratively partitions the dataset into k clusters, each represented by its centroid. This technique is widely used for segmentation and pattern recognition, helping to identify distinct subgroups within a larger dataset.
Factor selection involves choosing relevant variables to improve the performance of the model. Regression trees use a tree-like structure to recursively split data based on variables, identifying key predictors for the target variable. Conversely, Principal Component Analysis (PCA) is a dimensionality reduction technique that transforms the original variables into a smaller set of uncorrelated components [84]. Both regression trees and PCA assist in factor selection by highlighting the most influential variables, leading to more efficient and interpretable models.

3.2. Predictive Methods

Predictive methods in ML involve using algorithms to analyze historical data and identify patterns, which allows the model to make predictions or classifications for new, unseen data [85]. These methods rely on mathematical models to learn relationships between input features and output labels, adjusting their parameters through training. Common predictive techniques include regression for continuous results and classification for discrete categories. The goal is to develop a model that generalizes well to new data, providing accurate predictions and insights based on learned patterns [86]. Often referred to as supervised methods, these techniques require a labeled dataset to train the model and recognize results within a defined set of options. The dataset and model will have the following characteristics:
  • Historical Data: the dataset may include older historical data compared to descriptive methods, while the data describe the same event, and the age of the data—whether from 5 years ago or 20 years ago—does not matter as long as the dataset is labeled with the expected results.
  • Existence of an Objective Variable: The model must predict a specific result, which can be numerical or categorical. If categorical, it is typically represented by a binary dummy variable.
  • Relation Between Predictive and Result Variables: The dataset needs to be cleaned and analyzed to select variables that have a direct relationship with the objective variable. This requirement distinguishes predictive methods from descriptive methods, which do not need this level of variable selection.
Classification involves assigning predefined labels to input data based on their features [87]. Neural networks, with their interconnected nodes organized in layers, are effective at learning complex patterns and relationships for accurate classification. Decision trees recursively split the dataset based on feature conditions to create a tree-like structure, facilitating efficient classification. Support Vector Machines (SVMs) are skilled at finding optimal hyperplanes to separate distinct classes in high-dimensional space, making them versatile for both linear and non-linear classification tasks. K-nearest neighbors (KNN) classifies data points by evaluating the majority class among their k-nearest neighbors, providing a straightforward yet effective approach. These diverse classification techniques address various data structures and problem complexities, demonstrating the versatility of ML in solving real-world classification challenges across different domains.
Regression, on the other hand, involves predicting continuous values based on input features [88]. Neural networks excel in capturing complex patterns for accurate predictions. Time series regression models are designed for temporal data, capturing trends over time. An SVM for regression identifies optimal hyperplanes to model non-linear relationships in the data. These techniques, including neural networks, time series models, and SVMs, provide adaptable solutions for predicting numerical values across various domains.

3.3. Virtual Testing Setup

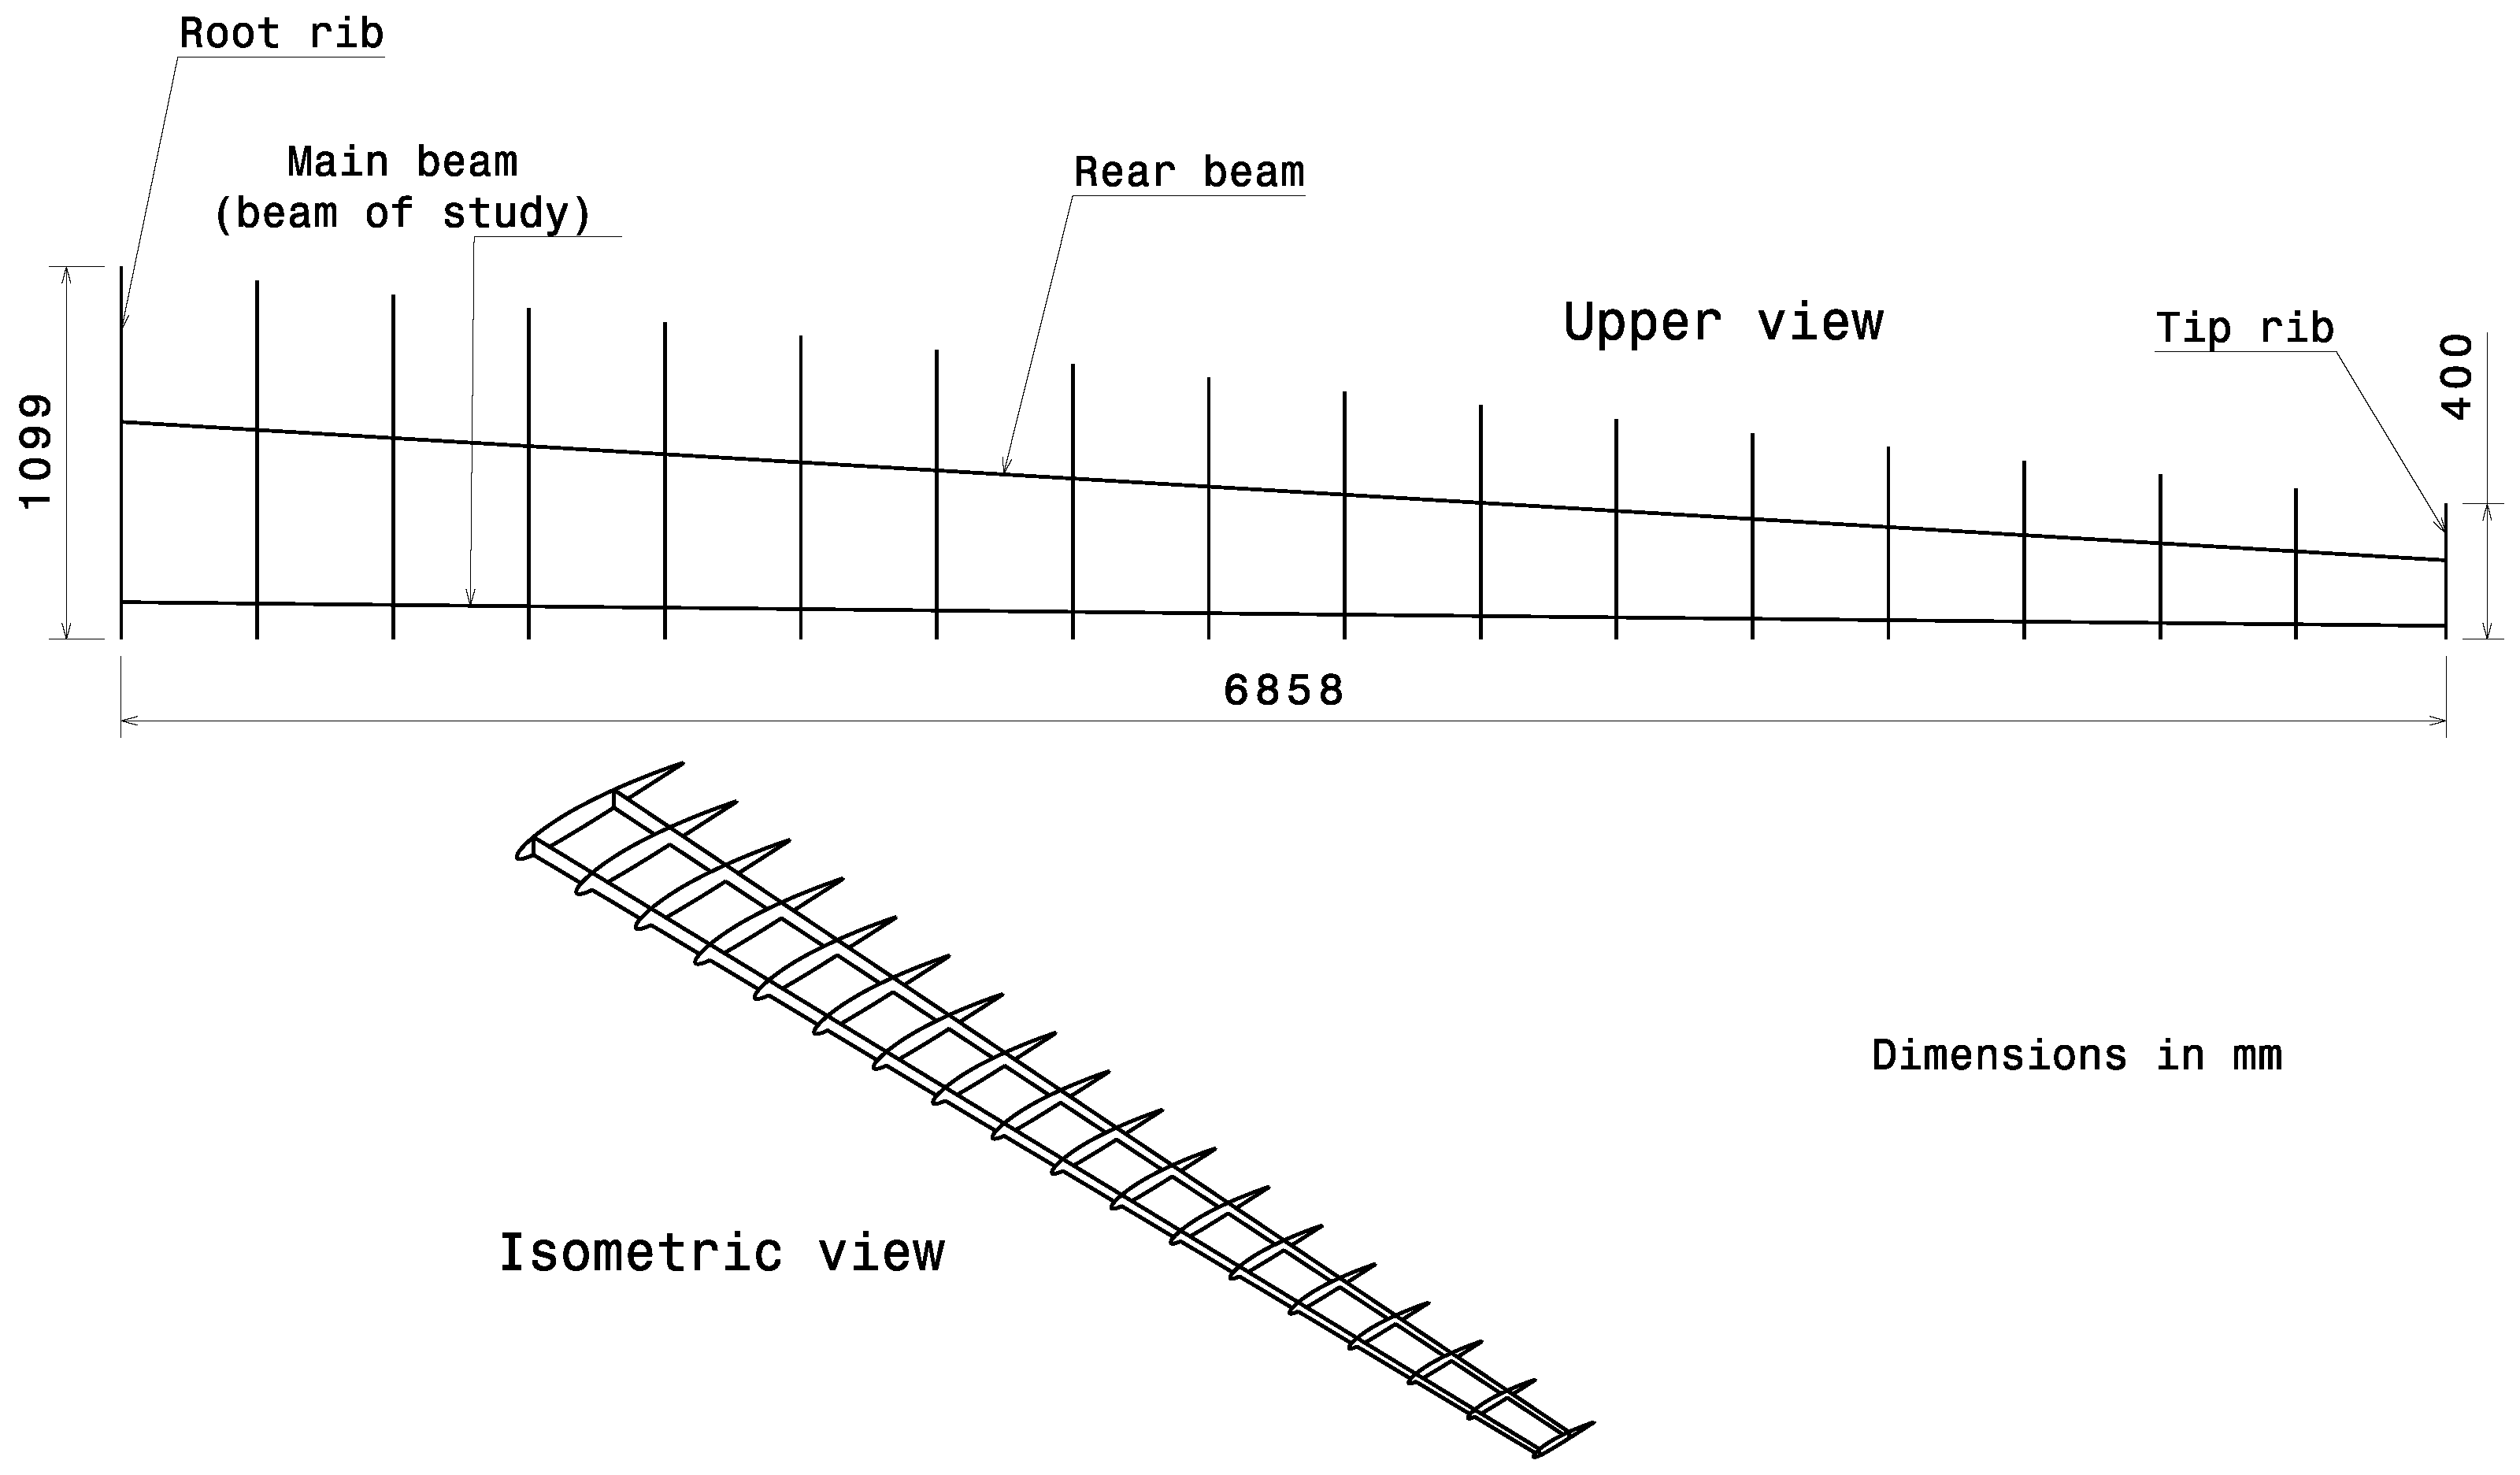
To perform a virtual testing methodology within the context of SHM, the wing structure of an MQ1 Predator aircraft [89], made of aluminum alloy 2024-T3, was chosen for this study. The structure comprises two beams, 18 ribs, and skins [90]. Rivets and other structural joints were replaced with perfect contacts between components, and fuel tanks and other systems were omitted to reduce computational cost. Figure 4 illustrates the drawing views of the wing structure.
The Static Structural Simulation solver in ANSYS 2020 R1 was employed, with non-linear effects being neglected. The boundary conditions for the model included fixed supports for each beam at the root and a distributed load applied to the lower skin, representing the total lift generated by the aircraft during steady cruise flight. This load was calculated as 3753 N per semi-wing, based on the aircraft’s weight of 766 kg.
The model’s mesh used hexahedral elements with a multi-zone method applied to the beams, and a finer mesh refinement was applied to the main beam, which was the primary focus of this study. The damage was positioned at various locations (25%, 50%, and 75% of the wingspan), as shown in Figure 5. This approach helped minimize significant mesh changes when damage was introduced, as depicted in Figure 6. Additionally, beams, ribs, and skins were modeled with shell elements to reduce overall model complexity, resulting in a total of 50,144 elements with a minimum element quality of 0.22 (where a quality index of 1 indicates maximum reliability).
The primary component studied in this structure was the leading edge beam, also referred to as the main beam, of the aircraft wing. A total of 408 virtual strain sensors were defined along this beam: 102 sensors were placed on the top face, 102 on the lower face, 102 on the front face, and 102 on the back face. These virtual sensors were configured to measure the normal strains along the longitudinal axis of the beam, emulating the functionality of FBG sensors; see Figure 7.
Mesh convergence was assessed by comparing the degrees of freedom (DOF) in the mesh with the maximum deflection of the wing, as shown in Figure 8. The analysis indicated a mesh convergence around 440,000 DOF. This configuration was achieved with a general element size of 15 mm in the geometry and a special refinement of 5 mm in areas near the damage. However, given the need to analyze the strain field around very small damages relative to the overall structure size, the maximum number of elements possible within the available computational capacity was utilized. This involved applying a special mesh refinement specifically around the damaged areas to ensure accurate analysis.
Two types of damage were analyzed: a circular hole and a high-aspect ratio rhombus, simulating a crack. For each damage type, three different sizes were defined: 20 mm, 10 mm, and 2 mm in diameter for the holes, with equivalent lengths for the rhombus’s largest diagonal (maintaining an aspect ratio of 10). The damages were positioned at three different locations along the wingspan: 25%, 50%, and 75% (Figure 5). Table 1 provides the details of the damage locations and sizes.
To emulate a real sensing scheme using FBGs, different experimental trials were artificially defined. The trials were based on the strains measured for each sensor and replicated I times using a random number generated from a Gaussian distribution, with a mean equal to the initial strain value and a standard deviation of ( 1 × 10 6 ) . This deviation was chosen considering that the sensitivity of the available FBG sensing techniques in the market is approximately ( 1 μ ε ) . Thus, the dimensions for each data matrix were 1000 × 600 for baseline ( B L ) , 700 × 600 for validation data ( D 0 ) , and 900 × 600 for damages ( D 1 to D 9 ).
Several sensitivity analyses were performed, including an examination of how changes in the F1 Score were influenced by the number of operative sensors. The F1 Score is a measure of a model’s accuracy in classification tasks [91], especially when dealing with imbalanced datasets. By running the detection algorithm multiple times and artificially removing some sensors each time, the change in the F1 Score in response to variations in artificial noise was evaluated.

3.4. Validation model

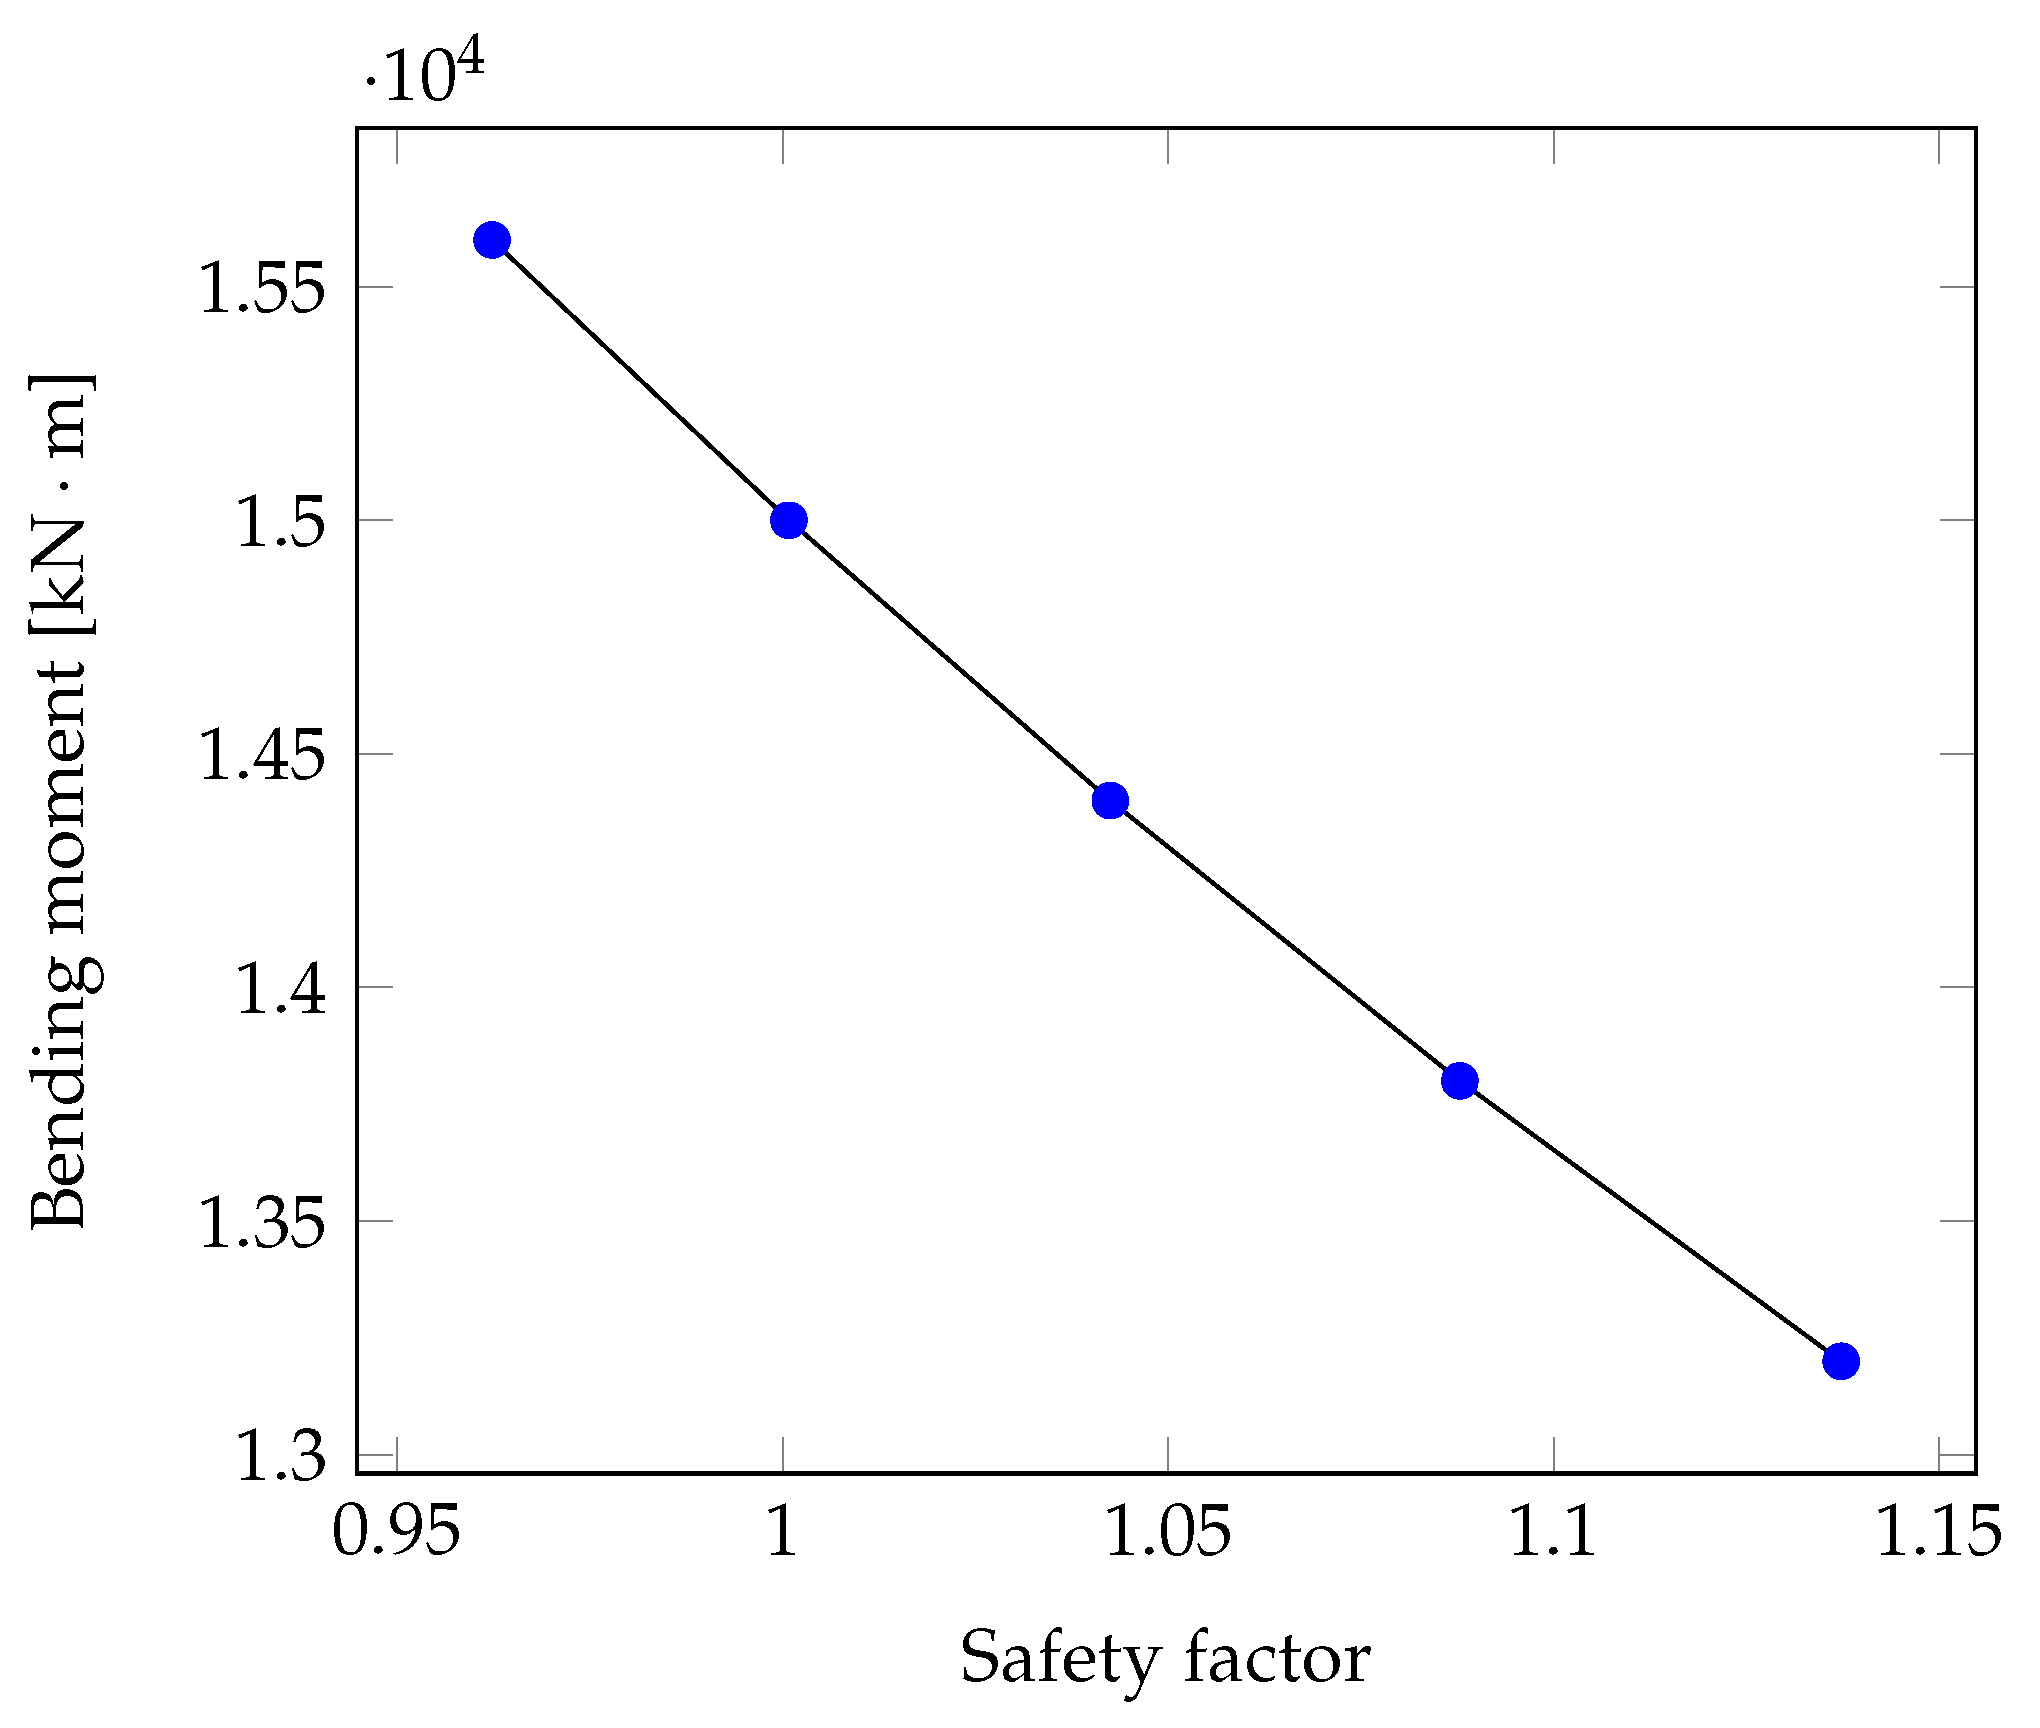
To validate the model, an experiment involving a double-supported steel beam was replicated using cross-validation with ANSYS 2020 R1 [77]. In this model, two supports were placed at both ends of the beam, one fixed and one with displacement, with two vertical loads applied at the midpoint, as shown in Figure 9. The entire geometry was meshed with 2 mm shell elements. The model convergence was evaluated on the basis of the maximum bending moment. Various loads were applied and compared to the minimum safety factor associated with each load. Finally, a linear regression analysis was performed to determine the load corresponding to a safety factor of one.
The maximum calculated moment corresponding to a safety factor of one was 15.032 kN·m, as shown in Figure 10. In comparison, the maximum moment reported by [77] was 15.227 kN·m, resulting in an absolute error of 1.82%.

3.5. Damage Detection Methodology

For the experiments presented in this work, which involve simulations of the damaged structure with cracks and holes and their respective variations, each dataset was organized into a matrix A M ( I × J ) , where I represents the trial number and J represents the sensor number. As mentioned above, the main objective of PCA is to reduce J to several principal components while retaining a significant portion of total variability.
Recently, other dimensionality reduction techniques such as UMAP (Uniform Manifold Approximation and Projection) and t-SNE (t-Distributed Stochastic Neighbor Embedding) have emerged in the field of SHM, offering advantages and limitations compared to PCA [92]. A significant advantage of these techniques is their ability to capture highly nonlinear relationships, unlike traditional PCA, which only captures linear relationships. However, previous work by the authors demonstrated that for metallic structures and even some made of composite materials, the structural behavior is predominantly linear. Therefore, the use of nonlinear dimensionality reduction and modeling techniques does not significantly enhance detection sensitivity relative to sensor density, while the computational cost increases substantially, especially for large datasets. In the context of damage detection based on strain measurements, traditional PCA has shown a superior “quality-price” ratio compared to other nonlinear dimensionality reduction techniques in predominantly linear structures [93].
For this study, 90% of the variability was retained by selecting three principal components, as suggested by Jolliffe [94]. To achieve this, the matrix P M ( J × J ) , which represents the covariance eigenvalues of A, was calculated for the baseline (BL) dataset. The remaining datasets, corresponding to the damage conditions, were then projected using the P matrix obtained from the BL data. The principal component matrix T is given by
T = A P M ( I × J ) ,
where the first three columns correspond to the three first principal components of the new dataset [95].
Then, to calculate the Q statistic, the residual error matrix E is computed as follows:
E = A A ¯ ,
where A ¯ is given by
A ¯ = T P T .
With these values, the Q statistic array is given by
Q i = e i e i T .
where e i denotes the ith row of E. Then, T 2 is calculated as follows:
T i 2 = a i T ( P Λ 1 P T ) a i ,
where a i is the ith row of matrix A, and Λ is a diagonal matrix composed of the eigenvalues of A.
To determine if there is a damage or not, a damage threshold is defined based on BL’s χ 2 inverse distribution. To calculate this threshold T H , mean ω and variance ν of Q and T 2 M ( I × 1 ) for BL dataset is computed as follows [96]:
T H = [ χ 2 ] 1 ( α , 2 ω 2 / ν ) y ,
where
y = ν / 2 ω .
Given that [ χ 2 ] 1 represents the squared inverse statistical distribution for a specified confidence level α ; previous experiments reported by Sierra-Pérez et al. [97] indicated that using α values between 95% and 99% yields acceptable results. It is important to note that D0 corresponds to a validation dataset (pristine state); therefore, the statistics for D0 should fall below the threshold, while the data for damaged conditions should be above the threshold.
According to the threshold, each datum is classified as true when it exceeds the threshold and false when it falls below it, with true data considered as having detected damage. With this in mind, ROC analysis was performed, classifying data into true positive ( T P ), true negative ( T N ), false positive ( F P ), and false negative ( F N ) categories. Finally, the F1 Score, which measures the experiment’s accuracy, can be computed as follows:
F 1 = ( 2 T P ) / ( 2 T P + F P + F N ) .
This score, which ranges between 0 and 1, measures the accuracy of data classification. In the context of SHM methodology, a higher F1 Score indicates more successful damage detection.

3.6. Damage Localization Methodology

Once the Q and T 2 statistics have been calculated and a dataset with successfully detected damage is obtained, a contribution analysis is performed. This analysis assigns a numerical value to each column (or data measured by each sensor) of the original dataset, quantifying the influence of the data of each sensor on the increase in statistics Q and T 2 . In the context of SHM, damage is identified in sensors (or rows of the original dataset) with higher contribution magnitudes. The contribution analysis for the Q statistic is calculated as follows:
C ( Q i ) l = [ e i T e l ] 2 ,
where e l M ( J × J ) is l t h row of the identity matrix and C ( Q i ) l denotes the contribution of each row based on the Q statistic. Similarly, the contribution analysis for the T 2 statistic is given by
C ( T i 2 ) l = [ a i P [ Λ 1 ] 1 / 2 e l ] 2 .
Once the contribution values for each sensor have been obtained, the damage location is estimated based on the sensors with the highest contribution.

4. Results and Discussion

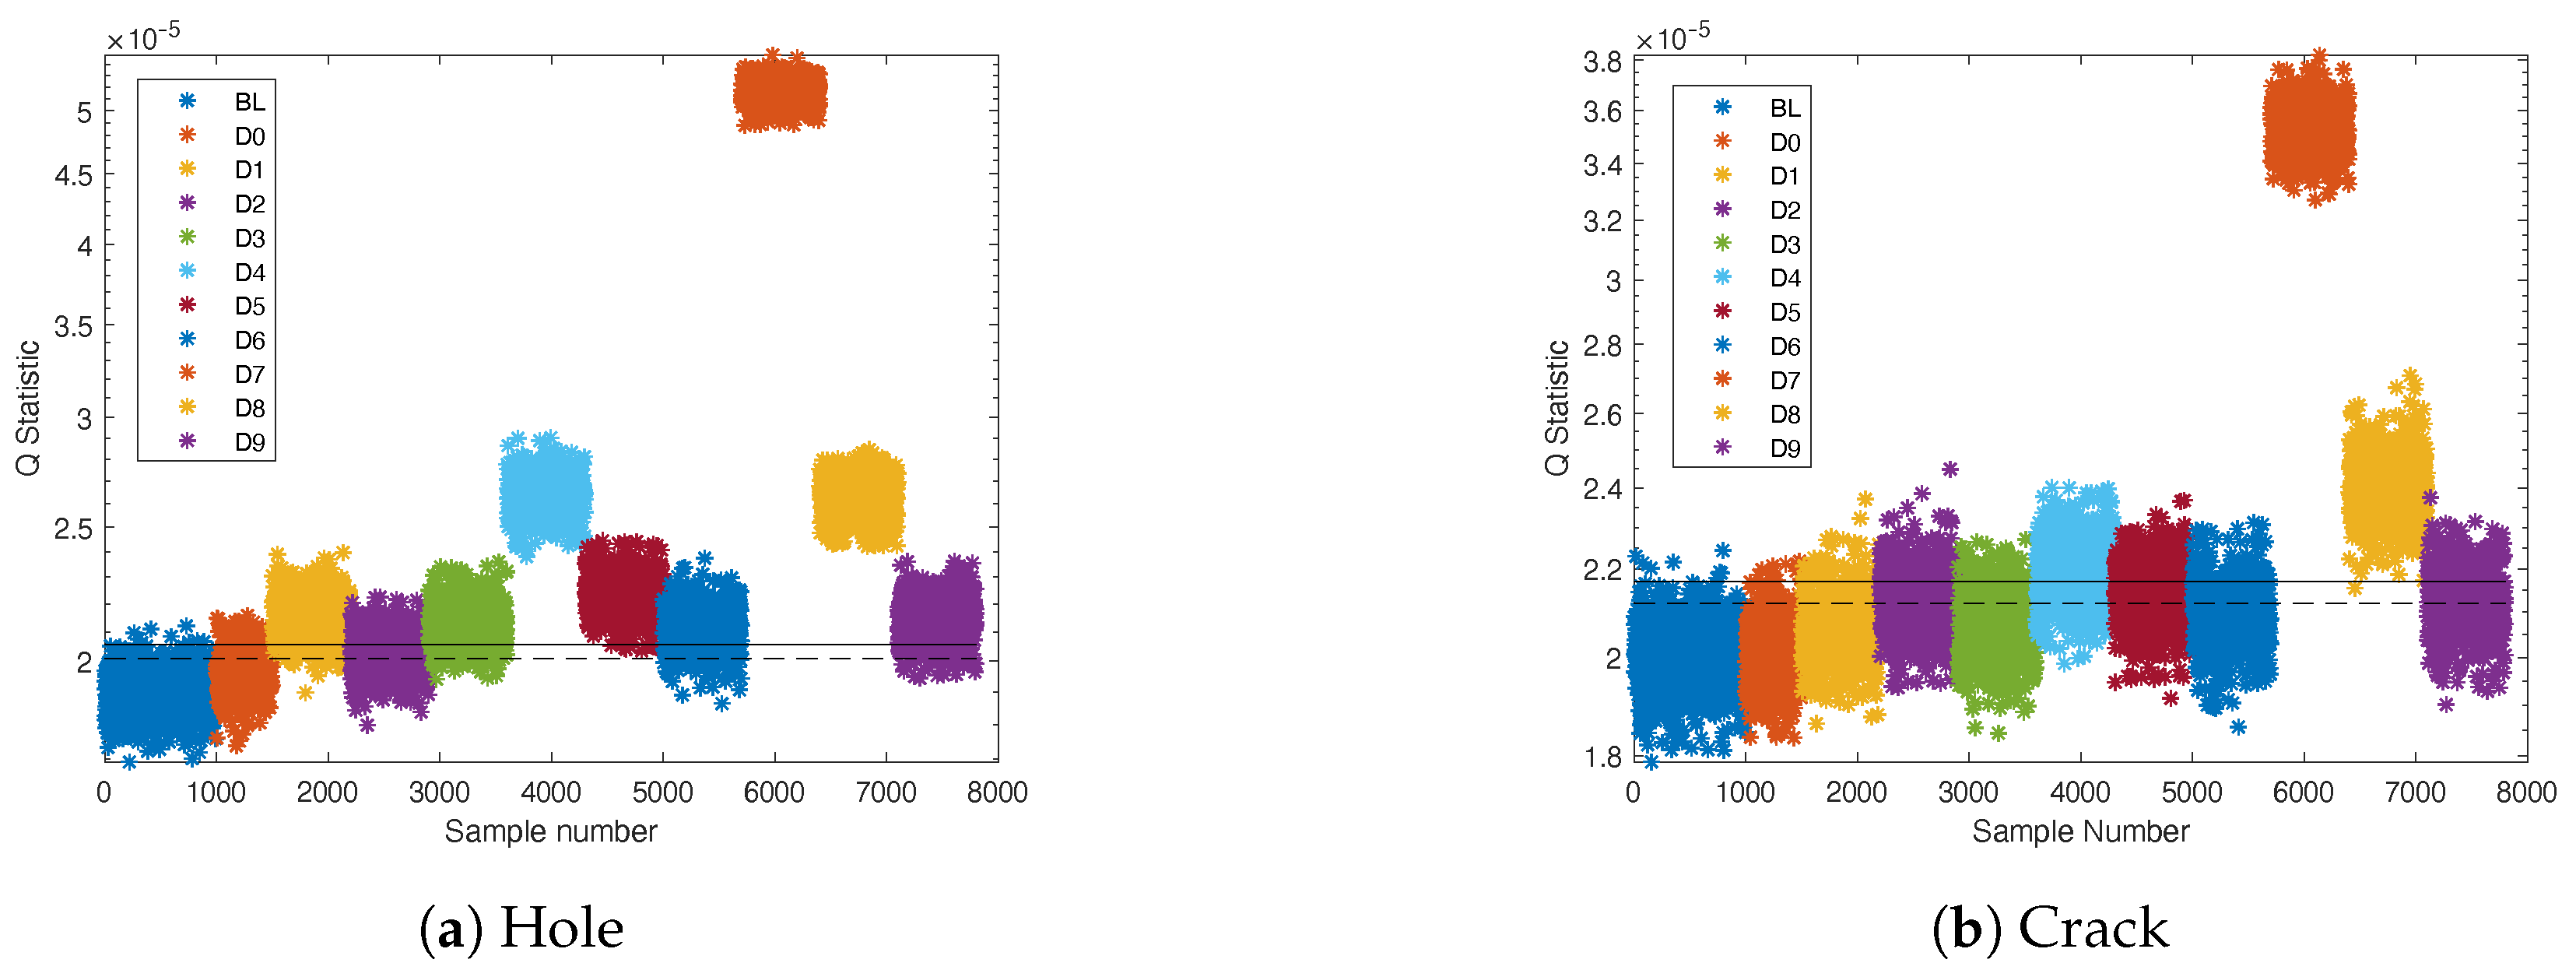
After applying the previously proposed methodology, the F1 Score based on the Q statistic was calculated for each damage type and location. Table 2 and Table 3 present the obtained F1 Score values for hole crack and crack damages, respectively. Additionally, Figure 11 illustrates the distribution of the Q statistic for each measurement and its location relative to the defined threshold.
The results show the F1 Scores for detecting hole and crack damages at various positions and sizes. For hole damages (Table 2), the F1 Scores indicate high accuracy for 10 mm and 20 mm sizes across all positions, particularly at 25% and 50%, with scores near 0.9852. However, the detection accuracy drops significantly for 2 mm holes, especially at the 50% position (0.0976). For crack damages (Table 3), the F1 Scores are similarly high for 10 mm and 20 mm sizes, with the 25% position reaching nearly perfect scores of 0.9936. The scores decrease for the 75% position, particularly for smaller crack sizes, where the 2 mm crack has an F1 Score of only 0.1584. These results indicate that larger damages and certain positions are more reliably detected.
According to these results, the location of the damage appears to influence the detection capability. For both types of damage, a decrease in the F1 Score can be observed when the damage is located in the central position of the wing (i.e., approximately 50% of the wingspan), especially for smaller damages. This could be attributed to the distribution of stresses and strains in the wing structure, where the central region might experience less variation compared to areas near the root and tip, making it harder to identify subtle damages in these areas.
Furthermore, comparing the results between the two damage types, there is a slight advantage in detecting holes compared to cracks, particularly for smaller damages. This suggests that damage geometry can influence the sensitivity of the methodology. Holes create an abrupt discontinuity in the structure and therefore might produce more distinctive strain patterns than cracks, which tend to propagate more slowly and subtly. Consequently, the proposed methodology might require specific adjustments or improvements for the early detection of cracks, especially in critical locations of structures.
Once damage was identified, a contribution analysis was performed to determine the most contributing sensors. The results of this analysis are detailed in Table 4 and Table 5.
In most cases, the contributing sensor was located on the lower face of the beam and close to the actual damage. It should be noted that the lower face typically experiences maximum tensile stresses and strains. Additionally, there are instances of undetected damages where the most contributing sensor is affected by system noise rather than damage locations. This occurs because the contribution analysis is only valid when damage is detected; thus, several contribution results are rejected if they do not correspond to actual damage.
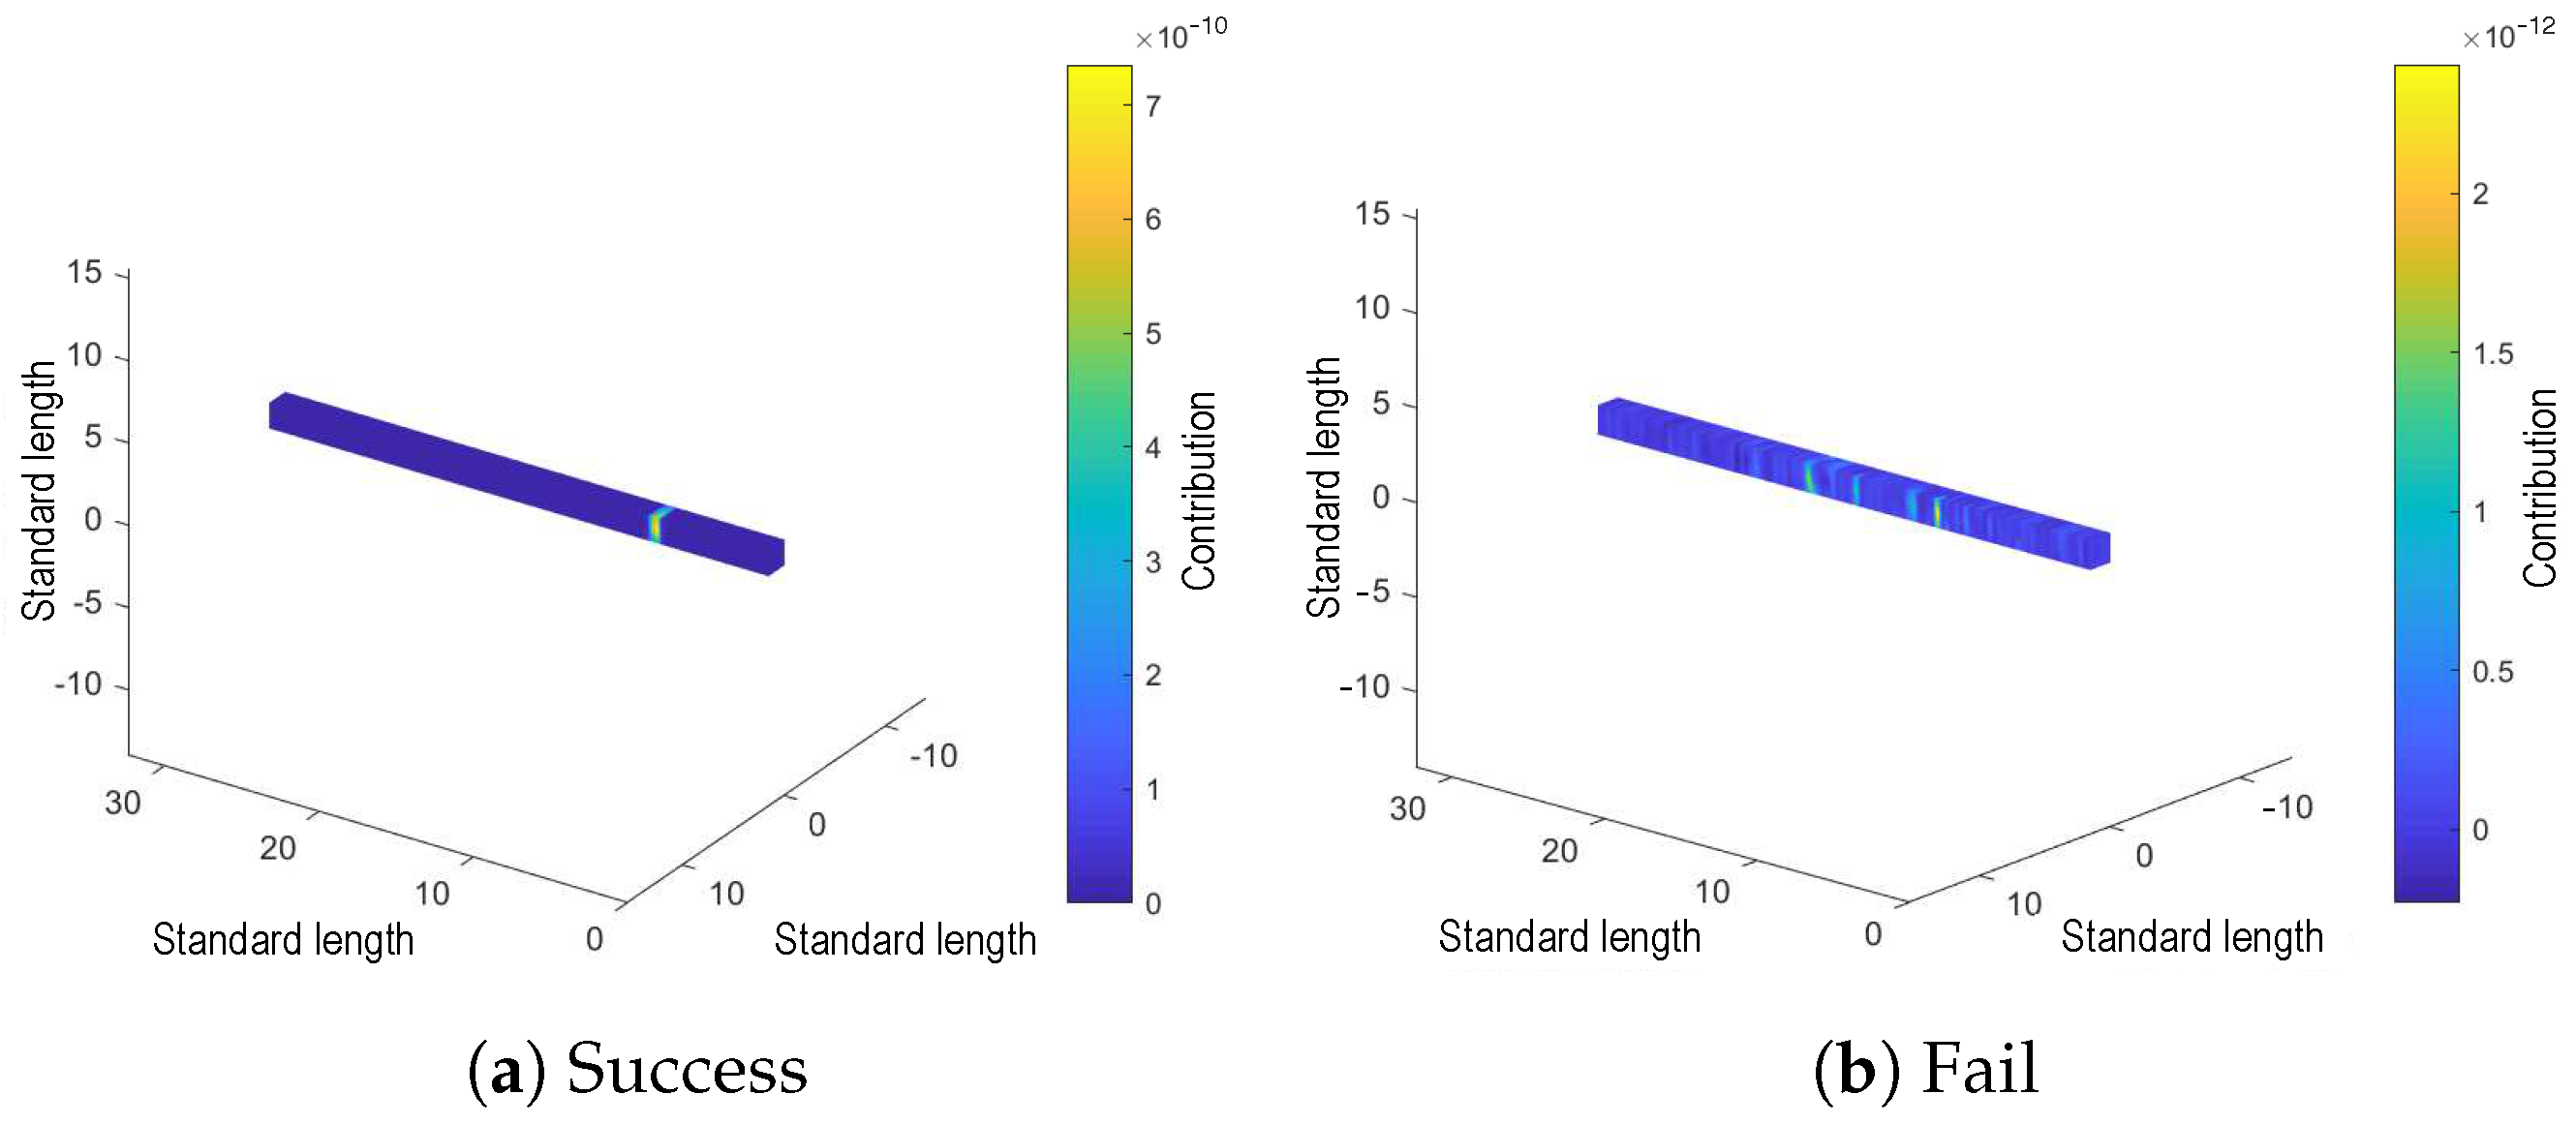
Figure 12 and Figure 13 present representative heat maps showing the contribution levels around the beam for different types of damage. In these maps, the damage location is clearly identified when the F1 Score is high. Conversely, when the F1 Score is lower, the highest contribution is not concentrated in a single, clearly marked spot.
In the sensitivity analysis based on the number of operative sensors, one of the largest damages (20 mm length at 25% of the wingspan) was selected. Previous calculations were performed by iteratively removing one sensor at a time nearest to the damage. The trends observed, shown in Figure 14, indicate that up to 15 sensors closest to the damage can be inoperative, and the damage can still be detected normally for both types of damage (hole and crack).
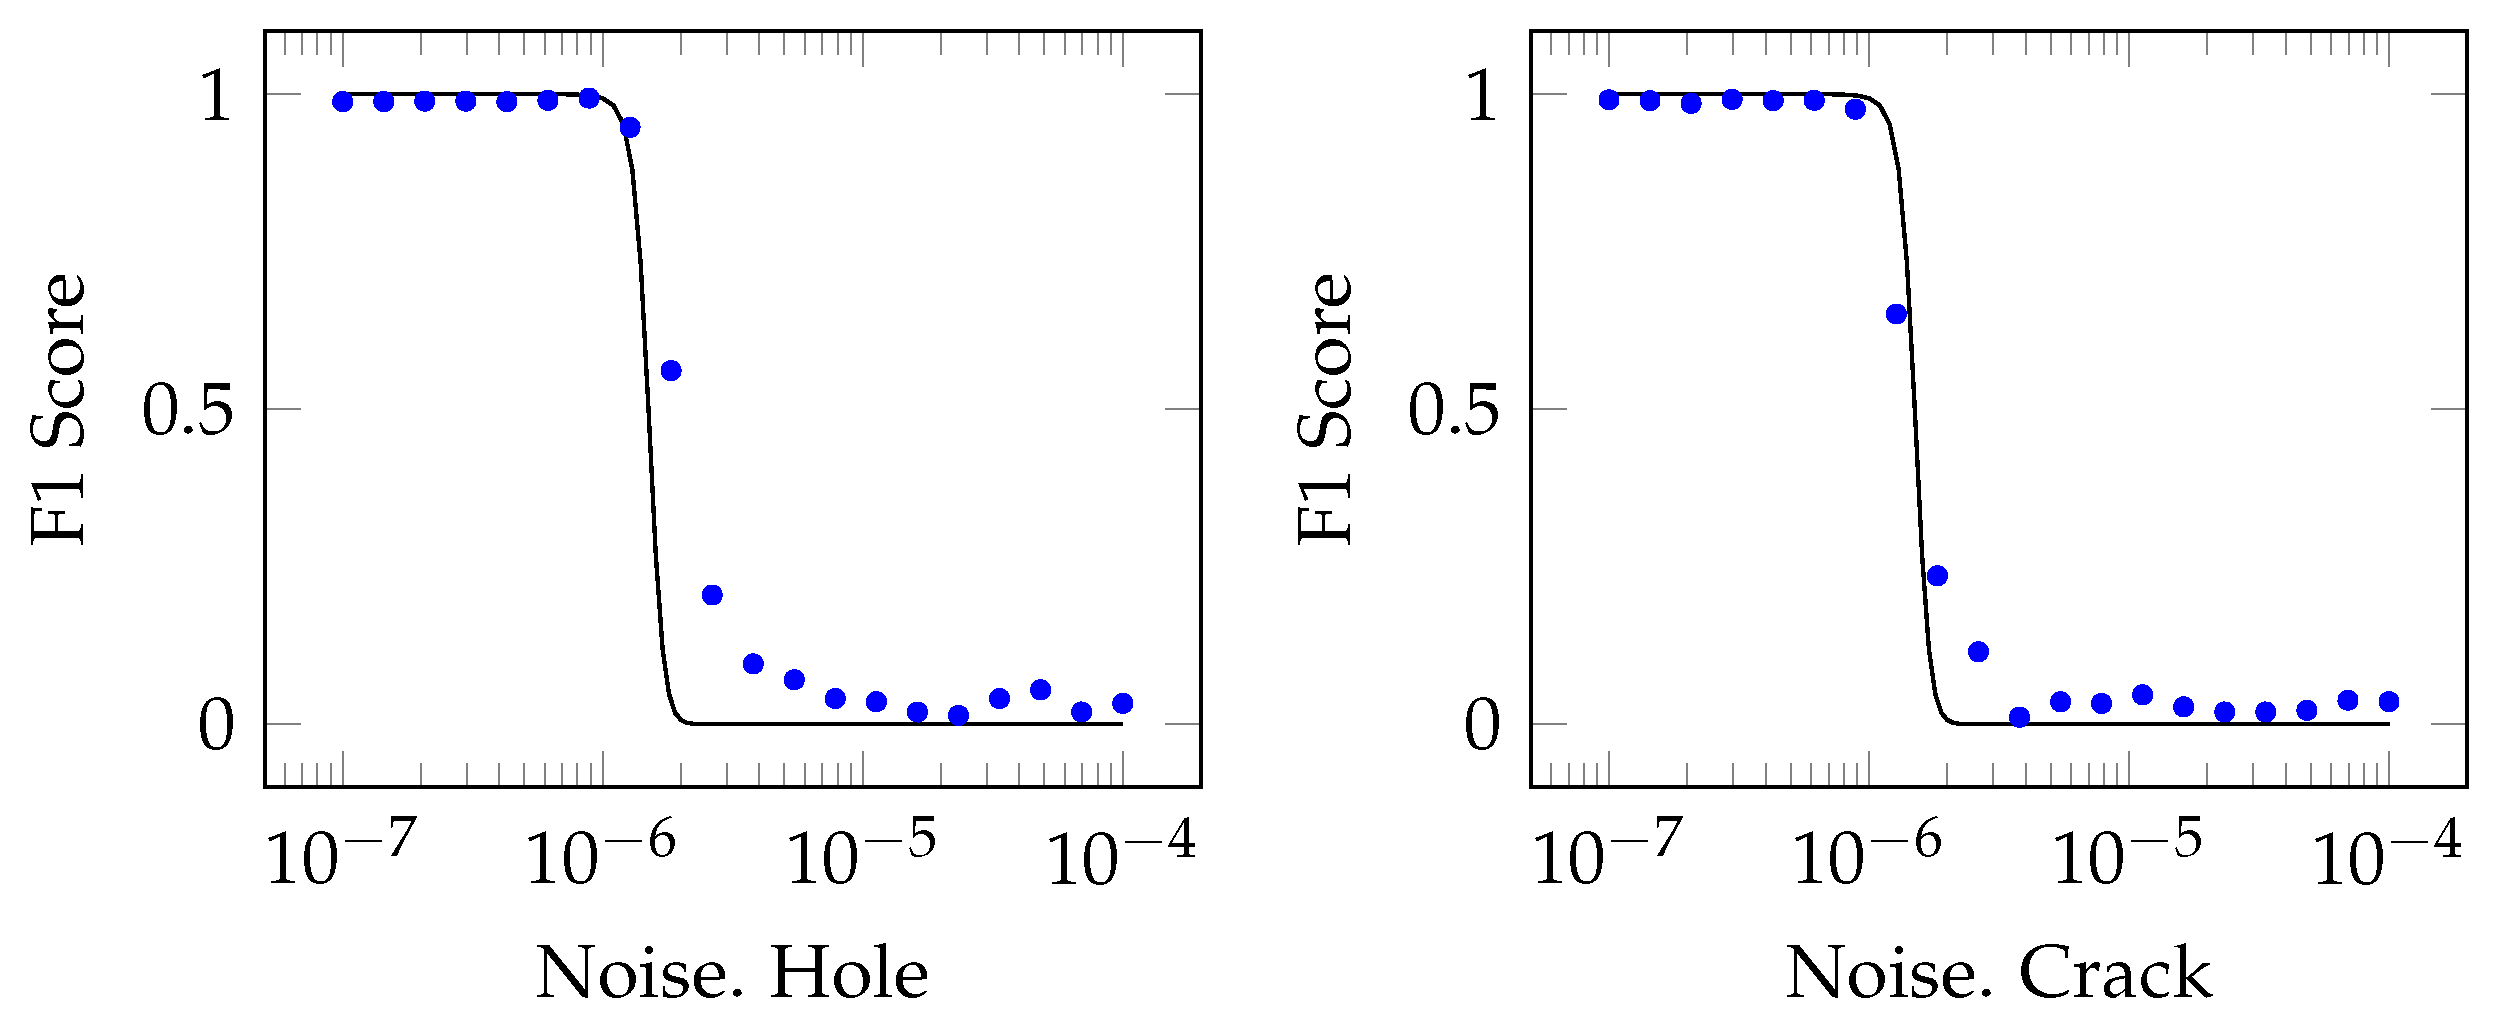
For the sensitivity analysis based on noise, a previously detected damage (10 mm length at 75% of the wingspan) was selected. The F1 Score was calculated for varying noise levels, ranging from 0.1 μ ε to 100 μ ε . As shown in Figure 15, the damage can be detected in both cases when the noise level is 1 μ ε . However, detection becomes unreliable at higher noise levels.
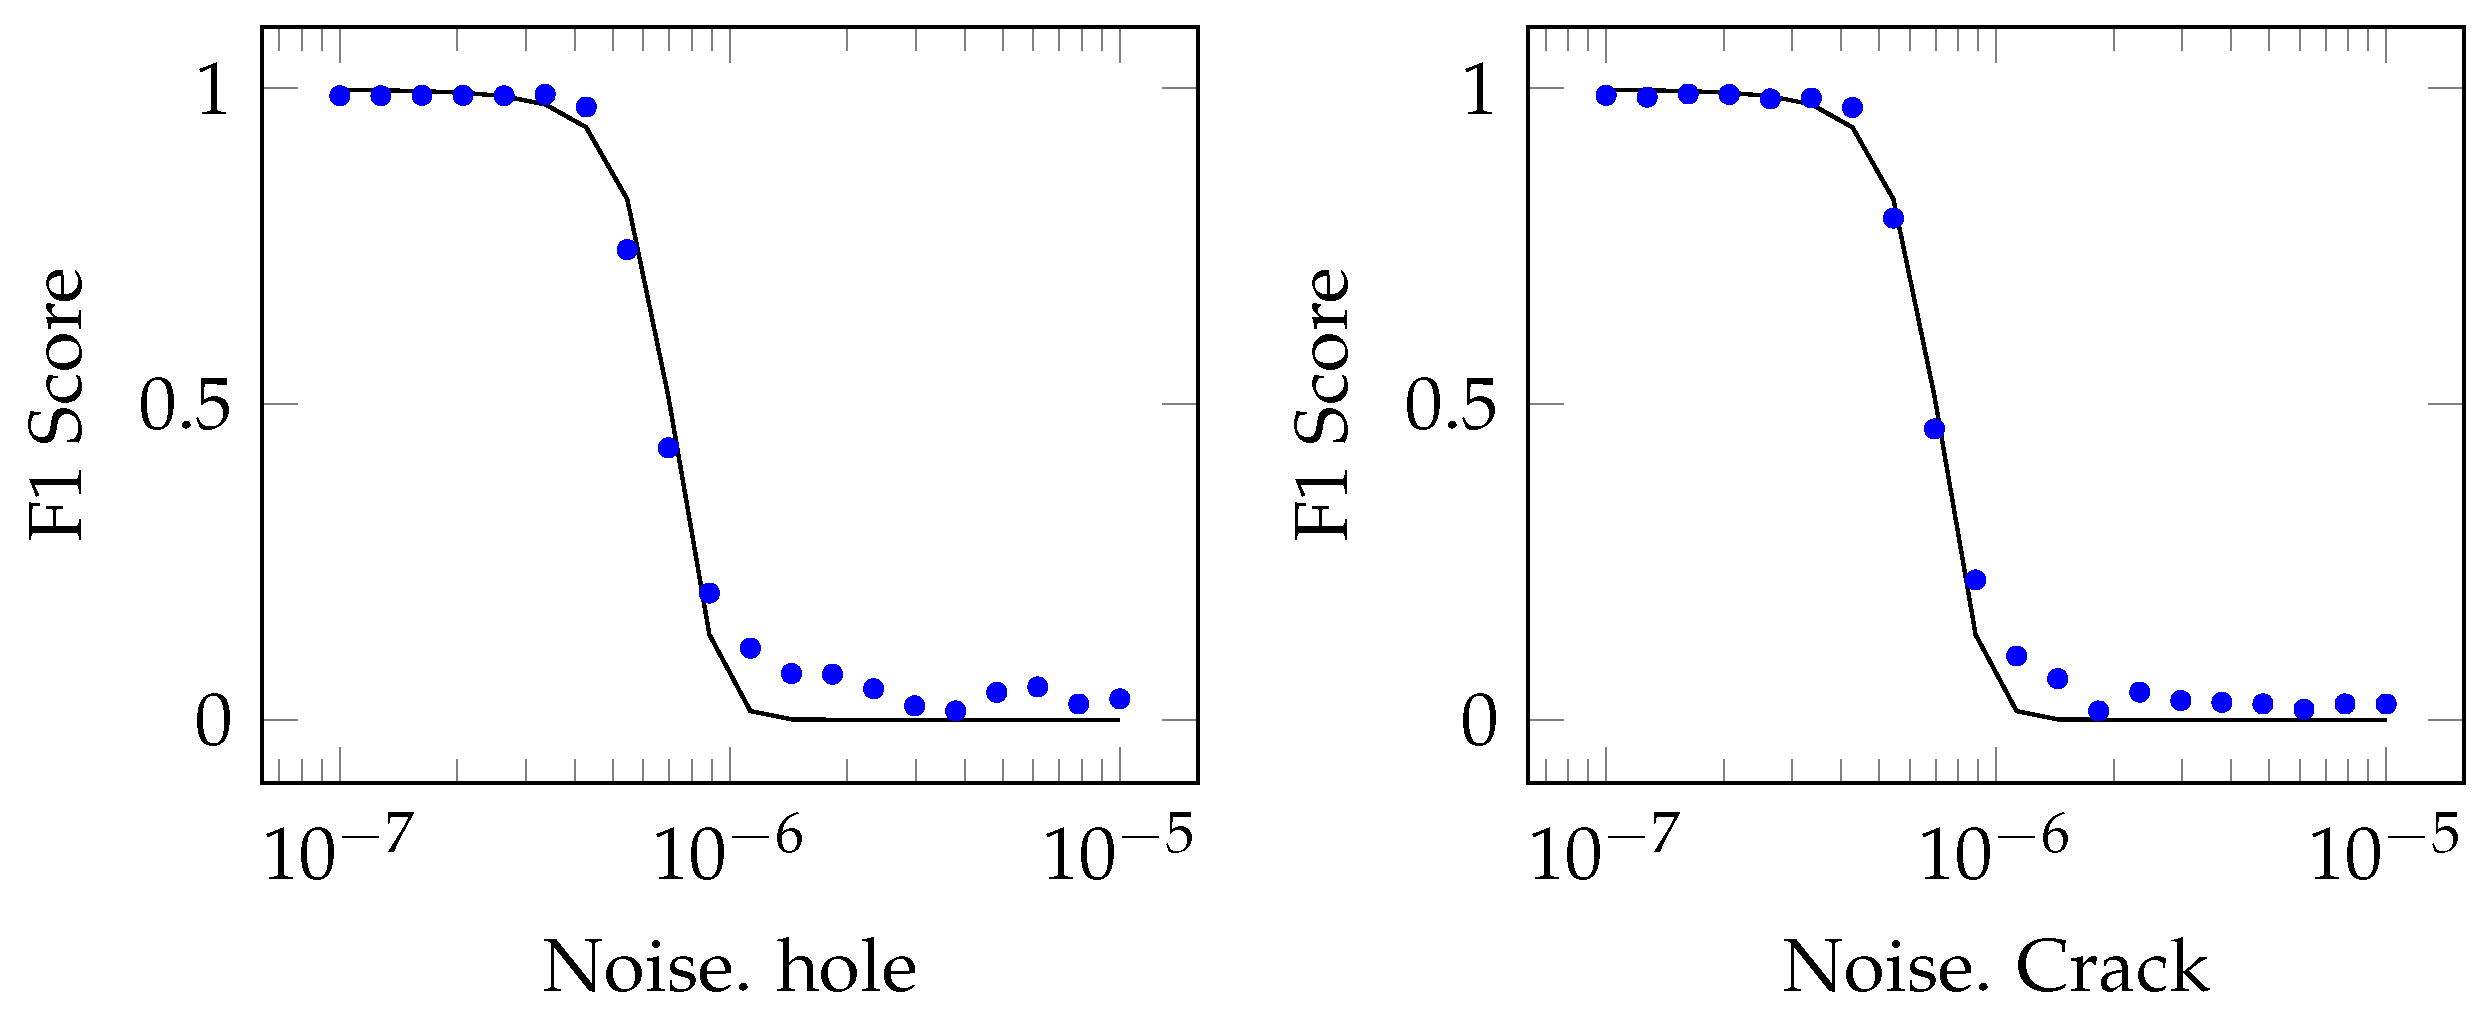
According to Table 4 and Table 5, the damages with the lowest performance of the technique correspond to D 2 for the hole and D 3 for the crack. These damages were analyzed at different noise levels to determine an adequate level for achieving acceptable F1 Score results. As shown in Figure 16, it is possible to detect smaller damages as long as the noise level is sufficiently low. Compared to the minimum noise in previous analyses, this noise decreases to levels around 0.4 μ ε .
The proposed damage detection and localization methodology is aligned with the advances highlighted in the state-of-the-art and the targets proposed in SDG 9. Our approach leverages the potential of SHM systems to transition from mere data collection to predictive maintenance by employing data analytics, including PCA and contribution analysis, to identify and localize structural damage. This methodology not only detects damage but also identifies its location with high accuracy, thereby confirming the system’s effectiveness in a real-world context. Furthermore, our sensitivity analysis underlines the robustness of the proposed technique, showing that even with a significant number of inoperative sensors or the presence of noise, the system can still reliably detect damages. This capability is crucial in an I4.0 context, where interconnected systems and real-time data processing are essential for timely interventions in aerospace systems. The integration of such advanced SHM systems into broader industrial ecosystems, as discussed, underscores the importance of this work for enhanced infrastructure safety and management through predictive and proactive maintenance strategies.
The proposed damage detection and localization methodology, while effective, has some limitations. It relies on sensor placement quality and density, and is sensitive to noise in the data, which can affect detection accuracy. The computational demands are significant, potentially limiting real-time applications. Additionally, the methodology’s effectiveness was tested on specific damage types and sizes, which may not generalize to all structural configurations. Further refinement and validation in diverse settings are needed to ensure consistent performance. Another limitation of this study is the reduced sensitivity of the methodology in detecting cracks compared to holes, particularly for smaller damages. This suggests that the geometry of the damage can affect detection accuracy, indicating a need for adjustments to improve the early detection of cracks in critical structural locations.

5. Conclusions

SHM is poised for a revolutionary transformation as it integrates with the core principles of I4.0. This paper has explored various areas where this synergy will have the most significant impact, fundamentally reshaping our approach to infrastructure management in diverse sectors.
Big data analytics and ML algorithms are set to unlock the hidden potential within the vast amount of SHM data. These data will no longer merely serve as a record of the past; it will become a powerful tool for predicting future issues. This predictive capability will extend the lifespan of structures in various domains, from the delicate wings of aircraft to the buildings that support cities. Early detection of anomalies will enable targeted interventions before problems escalate, leading to significant cost savings and improved safety across all fields.
Real-time communication will enable proactive responses to potential issues before they snowball into major disruptions. Data acquisition is instantly transmitted to a central hub, triggering a cascade of automated responses within interconnected ecosystems, optimizing efficiency, safety, and cost-effectiveness in unprecedented ways.
The sensitivity of FBGs is a crucial factor in detecting small damage, as it relates to the strain field generated by the damage itself; if the sensitivity is not high enough, the damage will not be sensed. However, the strain field is associated with stress concentrations, which depend on geometry and size. Thus, the damage type is also important, as each type has a different geometry and therefore a different stress concentration.
In this study, several sensitivity analyses were performed, concluding that sensor noise and the number of sensors are key factors for achieving adequate accuracy in this methodology. This study is based on currently available FBGs; however, the sensitivity analysis results presented in this paper show that improving FBG performance can enhance SHM accuracy, potentially surpassing traditional NDT techniques.
Furthermore, the placement of FBGs plays a crucial role in damage detection; they must be located at points where strains are highest and near potential damage sites. Otherwise, they will only sense noise or very low-strain fields. As a result, some sensors near the damage may not contribute significantly to statistical indexes, even though they are close to the damage.
The main advantage of the methodology presented in this paper, compared to other methodologies previously developed by the authors, is that it enables damage detection and localization with good precision using sparse sensor networks. Unlike other techniques that require highly dense sensor networks, this approach is more efficient and cost-effective. Additionally, the developed methodology exhibits greater sensitivity, allowing the detection of even smaller damages than those detectable by previously developed methods. This results in a better relationship between damage size and sensor density, enhancing the overall effectiveness and applicability of the SHM system [97,98].
The proposed methodology is promising but also has some limitations. It is highly dependent on sensor placement quality and density, and sensitive to data noise, which can impact detection accuracy. The computational demands are substantial, which may hinder real-time applications. The methodology was tested on specific damage types and sizes, which may not be representative of all structural configurations. Additionally, the methodology demonstrated reduced sensitivity in detecting cracks compared to holes, particularly for smaller damages, highlighting the need for further adjustments and validation in diverse settings to improve accuracy and performance.
The future of SHM within I4.0 is promising. As these technologies continue to evolve and become more sophisticated, they will give rise to innovative applications that will reshape how we monitor, maintain, and ultimately safeguard our infrastructure. This powerful combination has the potential to create a world where infrastructure is not just static and dynamic, but also intelligent, adaptable, and capable of anticipating and responding to the changing demands of the modern world.

Author Contributions

Conceptualization, A.R.H., J.A., C.H., S.R., R.E.V. and J.S.-P.; methodology, A.R.H., J.A. and J.S.-P.; validation, J.R., J.S.-P. and R.E.V.; formal analysis, A.R.H., J.A., C.H., S.R., R.E.V., C.A.E. and J.S.-P.; investigation, A.R.H., J.A., C.H. and J.S.-P.; writing—original draft preparation, A.R.H., J.A., C.H., S.R. and C.A.E.; writing—review and editing, J.S.-P. and R.E.V.; supervision, J.R., J.S.-P. and R.E.V. All authors have read and agreed to the published version of the manuscript.

Funding

This work was developed with the funding of the Universidad Pontificia Bolivariana (UPB) and with the support of the Universidad Nacional de Colombia in association with Contraloría General de la República in the frame of Contract CGR-373-2023.

Institutional Review Board Statement

Not applicable.

Informed Consent Statement

Not applicable.

Data Availability Statement

Data are available on request from the authors.

Conflicts of Interest

The authors declare no conflicts of interest.

Abbreviations

The following abbreviations are used in this manuscript:
AIArtificial Intelligence
BLBaseline
DOFDegrees of Freedom
FBGFiber Bragg Grating
FEAFinite Element Analysis
FOSFiber Optic Sensors
KNNK-Nearest Neighbors
I4.0Industry 4.0
IoTInternet of Things (IoT)
MLMachine Learning
NDTNon-Destructive Test
PCAPrincipal Component Analysis
ROCReceiver Operating Characteristic
SDGSustainable Development Goal
SHMStructural Health Monitoring
SVMsSupport Vector Machines

References

  1. United Nations. Transforming Our World: The 2030 Agenda for Sustainable Development. 2023. Available online: https://sdgs.un.org/2030agenda (accessed on 15 October 2023).
  2. United Nations. The Sustainable Development Goals Report 2023; Department of Economic and Social Affairs: New York, NY, USA, 2023; Available online: https://unstats.un.org/sdgs/report/2023/ (accessed on 15 December 2023).
  3. Cárdenas-Robledo, L.A.; Hernández-Uribe, O.; Reta, C.; Cantoral-Ceballos, J.A. Extended reality applications in industry 4.0—A systematic literature review. Telemat. Inform. 2022, 73, 101863. [Google Scholar] [CrossRef]
  4. Zonta, T.; da Costa, C.A.; da Rosa Righi, R.; de Lima, M.J.; da Trindade, E.S.; Li, G.P. Predictive maintenance in the Industry 4.0: A systematic literature review. Comput. Ind. Eng. 2020, 150, 106889. [Google Scholar] [CrossRef]
  5. Shaheen, B.W.; Németh, I. Integration of Maintenance Management System Functions with Industry 4.0 Technologies and Features—A Review. Processes 2022, 10, 2173. [Google Scholar] [CrossRef]
  6. Mishra, M. Machine learning techniques for structural health monitoring of heritage buildings: A state-of-the-art review and case studies. J. Cult. Herit. 2021, 47, 227–245. [Google Scholar] [CrossRef]
  7. Ahmed, O.; Wang, X.; Tran, M.V.; Ismadi, M.Z. Advancements in fiber-reinforced polymer composite materials damage detection methods: Towards achieving energy-efficient SHM systems. Compos. Part B Eng. 2021, 223, 109136. [Google Scholar] [CrossRef]
  8. Zaparoli Cunha, B.; Droz, C.; Zine, A.M.; Foulard, S.; Ichchou, M. A review of machine learning methods applied to structural dynamics and vibroacoustic. Mech. Syst. Signal Process. 2023, 200, 110535. [Google Scholar] [CrossRef]
  9. Farrar, C.R.; Worden, K. An introduction to structural health monitoring. Philos. Trans. R. Soc. A Math. Phys. Eng. Sci. 2007, 365, 303–315. [Google Scholar] [CrossRef]
  10. Abouzeida, E.; Quinones, V.; Gowayed, Y.; Soobramaney, P.; Flowers, G.; Black, R.J.; Costa, J.M.; Faridian, F.; Moslehi, B. Design, manufacture and testing of an FBG-instrumented composite wing. AIP Conf. Proc. 2014, 1581, 1141–1148. [Google Scholar] [CrossRef]
  11. Han, J. Data Mining, 3rd ed.; Morgan Kaufmann Series in Data Management Systems; Morgan Kaufmann/Elsevier: Waltham, MA, USA, 2012. [Google Scholar]
  12. Tapeh, A.T.G.; Naser, M.Z. Artificial Intelligence, Machine Learning, and Deep Learning in Structural Engineering: A Scientometrics Review of Trends and Best Practices. Arch. Comput. Methods Eng. 2023, 30, 115–159. [Google Scholar] [CrossRef]
  13. Khazaee, M.; Derian, P.; Mouraud, A. A comprehensive study on Structural Health Monitoring (SHM) of wind turbine blades by instrumenting tower using machine learning methods. Renew. Energy 2022, 199, 1568–1579. [Google Scholar] [CrossRef]
  14. Avci, O.; Abdeljaber, O.; Kiranyaz, S.; Hussein, M.; Gabbouj, M.; Inman, D.J. A review of vibration-based damage detection in civil structures: From traditional methods to Machine Learning and Deep Learning applications. Mech. Syst. Signal Process. 2021, 147, 107077. [Google Scholar] [CrossRef]
  15. Glisic, B.; Inaudi, D. Fibre Optic Methods for Structural Health Monitoring; John Wiley & Sons: Chichester, UK, 2007. [Google Scholar]
  16. Güemes, A.; Fernandez-Lopez, A.; García-Ramírez, J.; Reyes-Perez, M.E.; Zurita, F.C. Simulation Tools for a Fiber-Optic Based Structural Health Monitoring System. Trans. Nanjing Univ. Aeronaut. Astronaut. 2018, 35, 219–225. [Google Scholar] [CrossRef]
  17. Meindl, B.; Ayala, N.F.; Mendonça, J.; Frank, A.G. The four smarts of Industry 4.0: Evolution of ten years of research and future perspectives. Technol. Forecast. Soc. Chang. 2021, 168, 120784. [Google Scholar] [CrossRef]
  18. Imoize, A.L.; Adedeji, O.; Tandiya, N.; Shetty, S. 6G Enabled Smart Infrastructure for Sustainable Society: Opportunities, Challenges, and Research Roadmap. Sensors 2021, 21, 1709. [Google Scholar] [CrossRef]
  19. De Simone, M.C.; Lorusso, A.; Santaniello, D. Predictive maintenance and Structural Health Monitoring via IoT system. In Proceedings of the 2022 IEEE Workshop on Complexity in Engineering (COMPENG), Florence, Italy, 18–20 July 2022; pp. 1–4. [Google Scholar] [CrossRef]
  20. Huang, C.; Bu, S.; Lee, H.H.; Chan, C.H.; Kong, S.W.; Yung, W.K. Prognostics and health management for predictive maintenance: A review. J. Manuf. Syst. 2024, 75, 78–101. [Google Scholar] [CrossRef]
  21. Chen, Q.; Cao, J.; Zhu, S. Data-Driven Monitoring and Predictive Maintenance for Engineering Structures: Technologies, Implementation Challenges, and Future Directions. IEEE Internet Things J. 2023, 10, 14527–14551. [Google Scholar] [CrossRef]
  22. Ventura, R.; Maternini, G.; Barabino, B. Traffic Hazards on Main Road’s Bridges: Real-Time Estimating and Managing the Overload Risk. IEEE Trans. Intell. Transp. Syst. 2024, 15, 12239–12255. [Google Scholar] [CrossRef]
  23. Yusof, Y.B.; Ping, T.H.; Isa, F.B.M. Strengthening Smart Grids Through Security Measures: A Focus on Real-Time Monitoring, Redundancy, and Cross-Sector Collaboration. Int. J. Intell. Autom. Comput. 2023, 6, 14–36. [Google Scholar]
  24. Worden, K.; Cross, E. On switching response surface models, with applications to the structural health monitoring of bridges. Mech. Syst. Signal Process. 2018, 98, 139–156. [Google Scholar] [CrossRef]
  25. An, Y.; Chatzi, E.; Sim, S.; Laflamme, S.; Blachowski, B.; Ou, J. Recent progress and future trends on damage identification methods for bridge structures. Struct. Control Health Monit. 2019, 26, e2416. [Google Scholar] [CrossRef]
  26. Wright, R.F.; Lu, P.; Devkota, J.; Lu, F.; Ziomek-Moroz, M.; Ohodnicki, P.R. Corrosion Sensors for Structural Health Monitoring of Oil and Natural Gas Infrastructure: A Review. Sensors 2019, 19, 3964. [Google Scholar] [CrossRef] [PubMed]
  27. Ho, M.; El-Borgi, S.; Patil, D.; Song, G. Inspection and monitoring systems subsea pipelines: A review paper. Struct. Health Monit. 2019, 19, 606–645. [Google Scholar] [CrossRef]
  28. Liu, Z.; Zhang, L. A review of failure modes, condition monitoring and fault diagnosis methods for large-scale wind turbine bearings. Measurement 2020, 149, 107002. [Google Scholar] [CrossRef]
  29. Rocha, H.; Semprimoschnig, C.; Nunes, J.P. Sensors for process and structural health monitoring of aerospace composites: A review. Eng. Struct. 2021, 237, 112231. [Google Scholar] [CrossRef]
  30. Giurgiutiu, V.; Zagrai, A. Damage Detection in Thin Plates and Aerospace Structures with the Electro-Mechanical Impedance Method. Struct. Health Monit. 2005, 4, 99–118. [Google Scholar] [CrossRef]
  31. Winklberger, M.; Kralovec, C.; Humer, C.; Heftberger, P.; Schagerl, M. Crack Identification in Necked Double Shear Lugs by Means of the Electro-Mechanical Impedance Method. Sensors 2020, 21, 44. [Google Scholar] [CrossRef]
  32. Bergmayr, T.; Kralovec, C.; Schagerl, M. Vibration-Based Thermal Health Monitoring for Face Layer Debonding Detection in Aerospace Sandwich Structures. Appl. Sci. 2020, 11, 211. [Google Scholar] [CrossRef]
  33. Güemes, A.; Fernandez-Lopez, A.; Pozo, A.R.; Sierra-Pérez, J. Structural Health Monitoring for Advanced Composite Structures: A Review. J. Compos. Sci. 2020, 4, 13. [Google Scholar] [CrossRef]
  34. Hunt, S.R.; Hebden, I.G. Validation of the Eurofighter Typhoon structural health and usage monitoring system. Smart Mater. Struct. 2001, 10, 497–503. [Google Scholar] [CrossRef]
  35. Chen, C.; Wu, Q.; Xiong, K.; Zhai, H.; Yoshikawa, N.; Wang, R. Hybrid Temperature and Stress Monitoring of Woven Fabric Thermoplastic Composite Using Fiber Bragg Grating Based Sensing Technique. Sensors 2020, 20, 3081. [Google Scholar] [CrossRef]
  36. Morozov, O.G. Fiber Bragg Grating-Based Sensors and Systems. Sensors 2021, 21, 8225. [Google Scholar] [CrossRef] [PubMed]
  37. Zhang, H.; Liu, T.; Lu, J.; Lin, R.; Chen, C.; He, Z.; Cui, S.; Liu, Z.; Wang, X.; Liu, B.; et al. Static and ultrasonic structural health monitoring of full-size aerospace multi-function capsule using FBG strain arrays and PSFBG acoustic emission sensors. Opt. Fiber Technol. 2023, 78, 103316. [Google Scholar] [CrossRef]
  38. Braunfelds, J.; Senkans, U.; Skels, P.; Janeliukstis, R.; Salgals, T.; Redka, D.; Lyashuk, I.; Porins, J.; Spolitis, S.; Haritonovs, V.; et al. FBG-Based Sensing for Structural Health Monitoring of Road Infrastructure. J. Sens. 2021, 2021, 8850368. [Google Scholar] [CrossRef]
  39. Sahota, J.K.; Gupta, N.; Dhawan, D. Fiber Bragg grating sensors for monitoring of physical parameters: A comprehensive review. Opt. Eng. 2020, 59, 060901. [Google Scholar] [CrossRef]
  40. Tseng, M.L.; Thuy-Tran, T.P.; Ha, H.M.; Bui, T.D.; Lim, M.K. Sustainable industrial and operation engineering trends and challenges Toward Industry 4.0: A data driven analysis. J. Ind. Prod. Eng. 2021, 38, 581–598. [Google Scholar] [CrossRef]
  41. Diez-Olivan, A.; Del Ser, J.; Galar, D.; Sierra, B. Data fusion and machine learning for industrial prognosis: Trends and perspectives towards Industry 4.0. Inf. Fusion 2019, 50, 92–111. [Google Scholar] [CrossRef]
  42. Khan, S.M.; Atamturktur, S.; Chowdhury, M.; Rahman, M. Integration of Structural Health Monitoring and Intelligent Transportation Systems for Bridge Condition Assessment: Current Status and Future Direction. IEEE Trans. Intell. Transp. Syst. 2016, 17, 2107–2122. [Google Scholar] [CrossRef]
  43. Honghong, S.; Gang, Y.; Haijiang, L.; Tian, Z.; Annan, J. Digital twin enhanced BIM to shape full life cycle digital transformation for bridge engineering. Autom. Constr. 2023, 147, 104736. [Google Scholar] [CrossRef]
  44. van Dinter, R.; Tekinerdogan, B.; Catal, C. Predictive maintenance using digital twins: A systematic literature review. Inf. Softw. Technol. 2022, 151, 107008. [Google Scholar] [CrossRef]
  45. Gardner, L. Metal additive manufacturing in structural engineering—Review, advances, opportunities and outlook. Structures 2023, 47, 2178–2193. [Google Scholar] [CrossRef]
  46. Segura, P.; Lobato-Calleros, O.; Ramírez-Serrano, A.; Soria, I. Human–robot collaborative systems: Structural components for current manufacturing applications. Adv. Ind. Manuf. Eng. 2021, 3, 100060. [Google Scholar] [CrossRef]
  47. Tian, Y.; Chen, C.; Sagoe-Crentsil, K.; Zhang, J.; Duan, W. Intelligent robotic systems for structural health monitoring: Applications and future trends. Autom. Constr. 2022, 139, 104273. [Google Scholar] [CrossRef]
  48. Gordan, M.; Sabbagh-Yazdi, S.R.; Ismail, Z.; Ghaedi, K.; Carroll, P.; McCrum, D.; Samali, B. State-of-the-art review on advancements of data mining in structural health monitoring. Measurement 2022, 193, 110939. [Google Scholar] [CrossRef]
  49. Maes, K.; Van Meerbeeck, L.; Reynders, E.; Lombaert, G. Validation of vibration-based structural health monitoring on retrofitted railway bridge KW51. Mech. Syst. Signal Process. 2022, 165, 108380. [Google Scholar] [CrossRef]
  50. Chadha, M.; Ramancha, M.K.; Vega, M.A.; Conte, J.P.; Todd, M.D. The modeling of risk perception in the use of structural health monitoring information for optimal maintenance decisions. Reliab. Eng. Syst. Saf. 2023, 229, 108845. [Google Scholar] [CrossRef]
  51. Orcesi, A.D.; Frangopol, D.M. Optimization of bridge maintenance strategies based on structural health monitoring information. Struct. Saf. 2011, 33, 26–41. [Google Scholar] [CrossRef]
  52. Ndinga Okina, S.; Taillandier, F.; Ahouet, L.; Hoang, Q.A.; Breysse, D.; Louzolo-Kimbembe, P. Using Conceptual Graph modeling and inference to support the assessment and monitoring of bridge structural health. Eng. Appl. Artif. Intell. 2023, 125, 106665. [Google Scholar] [CrossRef]
  53. Ghosh, A.; Edwards, D.J.; Hosseini, M.R.; Al-Ameri, R.; Abawajy, J.; Thwala, W.D. Real-time structural health monitoring for concrete beams: A cost-effective ‘Industry 4.0’ solution using piezo sensors. Int. J. Build. Pathol. Adapt. 2020, 39, 283–311. [Google Scholar] [CrossRef]
  54. Goyal, D.; Pabla, B.S. The Vibration Monitoring Methods and Signal Processing Techniques for Structural Health Monitoring: A Review. Arch. Comput. Methods Eng. 2015, 23, 585–594. [Google Scholar] [CrossRef]
  55. Katsikeros, C.; Labeas, G. Development and validation of a strain-based Structural Health Monitoring system. Mech. Syst. Signal Process. 2009, 23, 372–383. [Google Scholar] [CrossRef]
  56. Dutta, C.; Kumar, J.; Das, T.K.; Sagar, S.P. Recent Advancements in the Development of Sensors for the Structural Health Monitoring (SHM) at High-Temperature Environment: A Review. IEEE Sens. J. 2021, 21, 15904–15916. [Google Scholar] [CrossRef]
  57. Fu, T.S.; Ghosh, A.; Johnson, E.A.; Krishnamachari, B. Energy-efficient deployment strategies in structural health monitoring using wireless sensor networks. Struct. Control Health Monit. 2012, 20, 971–986. [Google Scholar] [CrossRef]
  58. Dong, T.; Haftka, R.T.; Kim, N.H. Advantages of Condition-Based Maintenance over Scheduled Maintenance Using Structural Health Monitoring System. In Reliability and Maintenance—An Overview of Cases; IntechOpen: London, UK, 2019; pp. 11–36. [Google Scholar] [CrossRef]
  59. Gunawan, F.E.; Nhan, T.H.; Asrol, M.; Kanto, Y.; Kamil, I.; Sutikno. A New Damage Index for Structural Health Monitoring: A Comparison of Time and Frequency Domains. Procedia Comput. Sci. 2021, 179, 930–935. [Google Scholar] [CrossRef]
  60. Sony, S.; Laventure, S.; Sadhu, A. A literature review of next-generation smart sensing technology in structural health monitoring. Struct. Control Health Monit. 2019, 26, e2321. [Google Scholar] [CrossRef]
  61. Dang, H.; Tatipamula, M.; Nguyen, H.X. Cloud-Based Digital Twinning for Structural Health Monitoring Using Deep Learning. IEEE Trans. Ind. Inform. 2022, 18, 3820–3830. [Google Scholar] [CrossRef]
  62. Sofi, A.; Jane Regita, J.; Rane, B.; Lau, H.H. Structural health monitoring using wireless smart sensor network—An overview. Mech. Syst. Signal Process. 2022, 163, 108113. [Google Scholar] [CrossRef]
  63. Mishra, M.; Lourenço, P.B.; Ramana, G. Structural health monitoring of civil engineering structures by using the internet of things: A review. J. Build. Eng. 2022, 48, 103954. [Google Scholar] [CrossRef]
  64. Bao, Y.; Li, H. Machine learning paradigm for structural health monitoring. Struct. Health Monit. 2020, 20, 1353–1372. [Google Scholar] [CrossRef]
  65. Zinno, R.; Haghshenas, S.S.; Guido, G.; VItale, A. Artificial Intelligence and Structural Health Monitoring of Bridges: A Review of the State-of-the-Art. IEEE Access 2022, 10, 88058–88078. [Google Scholar] [CrossRef]
  66. Azimi, M.; Eslamlou, A.; Pekcan, G. Data-Driven Structural Health Monitoring and Damage Detection through Deep Learning: State-of-the-Art Review. Sensors 2020, 20, 2778. [Google Scholar] [CrossRef]
  67. Sun, L.; Shang, Z.; Xia, Y.; Bhowmick, S.; Nagarajaiah, S. Review of Bridge Structural Health Monitoring Aided by Big Data and Artificial Intelligence: From Condition Assessment to Damage Detection. J. Struct. Eng. 2020, 146, 04020073. [Google Scholar] [CrossRef]
  68. Flah, M.; Nunez, I.; Ben Chaabene, W.; Nehdi, M.L. Machine Learning Algorithms in Civil Structural Health Monitoring: A Systematic Review. Arch. Comput. Methods Eng. 2020, 28, 2621–2643. [Google Scholar] [CrossRef]
  69. Yuan, F.G.; Zargar, S.A.; Chen, Q.; Wang, S. Machine learning for structural health monitoring: Challenges and opportunities. In Sensors and Smart Structures Technologies for Civil, Mechanical, and Aerospace Systems 2020; Zonta, D., Sohn, H., Huang, H., Eds.; SPIE: Bellingham, WA, USA, 2020. [Google Scholar] [CrossRef]
  70. Salehi, H.; Burgueño, R. Emerging artificial intelligence methods in structural engineering. Eng. Struct. 2018, 171, 170–189. [Google Scholar] [CrossRef]
  71. Malekloo, A.; Ozer, E.; AlHamaydeh, M.; Girolami, M. Machine learning and structural health monitoring overview with emerging technology and high-dimensional data source highlights. Struct. Health Monit. 2021, 21, 1906–1955. [Google Scholar] [CrossRef]
  72. Vagnoli, M.; Remenyte-Prescott, R.; Andrews, J. Railway bridge structural health monitoring and fault detection: State-of-the-art methods and future challenges. Struct. Health Monit. 2017, 17, 971–1007. [Google Scholar] [CrossRef]
  73. Entezami, A.; Sarmadi, H.; Behkamal, B.; Mariani, S. Big Data Analytics and Structural Health Monitoring: A Statistical Pattern Recognition-Based Approach. Sensors 2020, 20, 2328. [Google Scholar] [CrossRef]
  74. Bao, Y.; Tang, Z.; Li, H.; Zhang, Y. Computer vision and deep learning–based data anomaly detection method for structural health monitoring. Struct. Health Monit. 2018, 18, 401–421. [Google Scholar] [CrossRef]
  75. Bao, Y.; Chen, Z.; Wei, S.; Xu, Y.; Tang, Z.; Li, H. The State of the Art of Data Science and Engineering in Structural Health Monitoring. Engineering 2019, 5, 234–242. [Google Scholar] [CrossRef]
  76. Qi, Q.; Tao, F. Digital Twin and Big Data Towards Smart Manufacturing and Industry 4.0: 360 Degree Comparison. IEEE Access 2018, 6, 3585–3593. [Google Scholar] [CrossRef]
  77. Zhao, R.; Yan, R.; Chen, Z.; Mao, K.; Wang, P.; Gao, R.X. Deep learning and its applications to machine health monitoring. Mech. Syst. Signal Process. 2019, 115, 213–237. [Google Scholar] [CrossRef]
  78. Wu, Q.; Okabe, Y.; Yu, F. Ultrasonic Structural Health Monitoring Using Fiber Bragg Grating. Sensors 2018, 18, 3395. [Google Scholar] [CrossRef] [PubMed]
  79. Ye, Y.; Yang, Q.; Yang, F.; Huo, Y.; Meng, S. Digital twin for the structural health management of reusable spacecraft: A case study. Eng. Fract. Mech. 2020, 234, 107076. [Google Scholar] [CrossRef]
  80. Kang, J.S.; Chung, K.; Hong, E.J. Multimedia knowledge-based bridge health monitoring using digital twin. Multimed. Tools Appl. 2021, 80, 34609–34624. [Google Scholar] [CrossRef]
  81. Matloff, N.S. Statistical Regression and Classification; A Chapman & Hall book; CRC Press: Boca Raton, FL, USA, 2017. [Google Scholar]
  82. Burkov, A. The Hundred-PAGE Machine Learning Book; Andriy Burkov: Quebec City, QC, Canada, 2019. [Google Scholar]
  83. Piernik, M.; Morzy, T. A study on using data clustering for feature extraction to improve the quality of classification. Knowl. Inf. Syst. 2021, 63, 1771–1805. [Google Scholar] [CrossRef]
  84. Salih-Hasan, B.M.; Abdulazeez, A.M. A Review of Principal Component Analysis Algorithm for Dimensionality Reduction. J. Soft Comput. Data Min. 2021, 2, 20–30. [Google Scholar] [CrossRef]
  85. Carvalho, T.P.; Soares, F.A.A.M.N.; Vita, R.; da P. Francisco, R.; Basto, J.P.; Alcalá, S.G.S. A systematic literature review of machine learning methods applied to predictive maintenance. Comput. Ind. Eng. 2019, 137, 106024. [Google Scholar] [CrossRef]
  86. Makridakis, S.; Spiliotis, E.; Assimakopoulos, V. Statistical and Machine Learning forecasting methods: Concerns and ways forward. PLoS ONE 2018, 13, e0194889. [Google Scholar] [CrossRef]
  87. Chen, R.C.; Dewi, C.; Huang, S.W.; Caraka, R.E. Selecting critical features for data classification based on machine learning methods. J. Big Data 2020, 7, 52. [Google Scholar] [CrossRef]
  88. Fernández-Delgado, M.; Sirsat, M.; Cernadas, E.; Alawadi, S.; Barro, S.; Febrero-Bande, M. An extensive experimental survey of regression methods. Neural Netw. 2019, 111, 11–34. [Google Scholar] [CrossRef]
  89. Wallpapers Vista. General Atomics MQ-1 Predator. 2024. Available online: https://vistapointe.net/general-atomics-mq-1-predator.html (accessed on 15 July 2024).
  90. Gobbato, M.; Conte, J.P.; Kosmatka, J.B.; Farrar, C.R. A reliability-based framework for fatigue damage prognosis of composite aircraft structures. Probabilistic Eng. Mech. 2012, 29, 176–188. [Google Scholar] [CrossRef]
  91. Tharwat, A. Classification assessment methods. Appl. Comput. Inform. 2021, 17, 168–192. [Google Scholar] [CrossRef]
  92. Rezazadeh, N.; Polverino, A.; Perfetto, D.; De Luca, A. Dimensionality Reduction in Structural Health Monitoring: A Case Study on Damaged Wind Turbine Blades. Macromol. Symp. 2024, 413, 2400044. [Google Scholar] [CrossRef]
  93. Sierra-Pérez, J.; Torres-Arredondo, M.A.; Alvarez-Montoya, J. Damage detection methodology under variable load conditions based on strain field pattern recognition using FBGs, nonlinear principal component analysis, and clustering techniques. Smart Mater. Struct. 2017, 27, 015002. [Google Scholar] [CrossRef]
  94. Jolliffe, I. Principal Component Analysis. In International Encyclopedia of Statistical Science; Lovric, M., Ed.; Springer: Berlin/Heidelberg, Germany, 2011; pp. 1094–1096. [Google Scholar] [CrossRef]
  95. Ruiz, M.; Mujica, L.E.; Sierra, J.; Pozo, F.; Rodellar, J. Multiway principal component analysis contributions for structural damage localization. Struct. Health Monit. 2018, 17, 1151–1165. [Google Scholar] [CrossRef]
  96. Nomikos, P.; MacGregor, J.F. Multivariate SPC charts for monitoring batch processes. Technometrics 1995, 37, 41–59. [Google Scholar] [CrossRef]
  97. Sierra-Pérez, J.; Güemes, A.; Mujica, L.E. Damage detection by using FBGs and strain field pattern recognition techniques. Smart Mater. Struct. 2012, 22, 025011. [Google Scholar] [CrossRef]
  98. Sierra-Pérez, J.; Güemes, A.; Mujica, L.E.; Ruiz, M. Damage detection in composite materials structures under variable loads conditions by using fiber Bragg gratings and principal component analysis, involving new unfolding and scaling methods. J. Intell. Mater. Syst. Struct. 2015, 26, 1346–1359. [Google Scholar] [CrossRef]
Figure 1. Methodology of SHM and the main techniques nowadays.
Aerospace 11 00708 g001
Figure 2. SHM industry applications within the framework of I4.0.
Aerospace 11 00708 g002
Figure 3. Machine learning classification and main algorithms.
Aerospace 11 00708 g003
Figure 4. Drawing views of the wing structure.
Aerospace 11 00708 g004
Figure 5. Meshed geometry and localization of damages.
Aerospace 11 00708 g005
Figure 6. Geometry and mesh for a 20 mm hole and a crack.
Aerospace 11 00708 g006
Figure 7. Virtual sensor localization.
Aerospace 11 00708 g007
Figure 8. Mesh convergence study.
Aerospace 11 00708 g008
Figure 9. Boundary conditions used for the validation model.
Aerospace 11 00708 g009
Figure 10. Maximum moment applied.
Aerospace 11 00708 g010
Figure 11. Q statistic for hole and crack.
Aerospace 11 00708 g011
Figure 12. Damage location comparison between lower and higher F1 Score values for hole.
Aerospace 11 00708 g012
Figure 13. Damage location comparison between lower and higher F1 values for crack.
Aerospace 11 00708 g013
Figure 14. Sensors removed for hole and crack.
Aerospace 11 00708 g014
Figure 15. Signal-to-noise ratio for hole and crack at damage D6.
Aerospace 11 00708 g015
Figure 16. Signal-to-noise ratio for hole and crack at damage D3.
Aerospace 11 00708 g016
Table 1. Damage locations and sizes.
Position Size
(% of Wingspan) 2 mm 10 mm 20 mm
25%D1D4D7
50%D2D5D8
75%D3D6D9
Table 2. F1 Score for hole damage.
Size
Position 2 mm 10 mm 20 mm
25%0.65110.98520.9852
50%0.09760.98520.9852
75%0.22630.17700.9737
Table 3. F1 Score for crack damage.
Size
Position 2 mm 10 mm 20 mm
25%0.03600.99360.9936
50%0.04680.89390.9936
75%0.15840.38500.6016
Table 4. Most contributing sensors for hole damages.
Size
Position 2 mm 10 mm 20 mm
25%321321321
50%347347149
75%364351351
Table 5. Most contributing sensors for crack damages.
Size
Position 2 mm 10 mm 20 mm
25%322321321
50%347347148
75%68373373
Disclaimer/Publisher’s Note: The statements, opinions and data contained in all publications are solely those of the individual author(s) and contributor(s) and not of MDPI and/or the editor(s). MDPI and/or the editor(s) disclaim responsibility for any injury to people or property resulting from any ideas, methods, instructions or products referred to in the content.