Article

Analysis of the Effect of Sampling Probe Geometry on Measurement Accuracy in Supersonic Gas Flow

1
School of Aero Engine, Shenyang Aerospace University, Shenyang 110136, China
2
AECC Sichuan Gas Turbine Establishment, Mianyang 621000, China
*
Author to whom correspondence should be addressed.
Aerospace 2024, 11(7), 595; https://doi.org/10.3390/aerospace11070595
Submission received: 17 June 2024 / Revised: 12 July 2024 / Accepted: 16 July 2024 / Published: 21 July 2024
(This article belongs to the Section Aeronautics)

Abstract

:
The accuracy of sampling of gas components has a significant impact on the measurement of various performance parameters in the combustion chamber of an aero-engine. In order to investigate the effect of the probe geometry of a six-point gas sampling probe on sampling accuracy in supersonic gas flow, a three-dimensional probe gas flow characteristic solution model is established through numerical simulation methods of components of transport and fluid–solid coupling. Probes with three angles of 28°, 30°, and 32° and an optimized conical probe are constructed. The sampling accuracy of the probes with different geometries is compared and evaluated by the deviation of the component volume fraction before and after sampling and the resulting combustion efficiency error. This paper presents a set of calculation methods for solving the relative deviation of volume fraction by an iterative method based on the ideal gas law and the Redlich–Kwong equation (R-K equation). The method is designed to solve the exact component volume fraction problem in the simulation calculation. The study results demonstrate that the 28° and optimized conical probes improve sampling accuracy more effectively than the original 30° structure. The deviation of the volume fractions of the two structures is less than 1.7%, and the combustion efficiency error is less than 0.09%. The developed iterative calculation method can significantly reduce the theoretical calculation error to less than 0.06%. The experimental data of the test bench are in good agreement with the simulation results, thereby demonstrating the reliability and accuracy of the sampling probe following structural optimization.

1. Introduction

Gas analysis is a method of collecting high-enthalpy gases through a sampling system and determining their components using instruments to infer the performance parameters of the engine’s combustion chamber, which is one of the essential means of studying the engine’s performance [1,2,3]. As the engine thrust-to-weight ratio increases, the gas temperature of the combustion chamber outlet becomes higher and higher, and some models can even reach more than 2500 K, which exceeds the measurement limit of conventional thermocouples. As a result, researchers have begun to explore new gas extraction techniques that are suitable for this high-temperature environment. One of the more reliable methods for gas extraction is the probe sampling method, which utilizes a sampling probe to extract a sample of the combustion chamber gas to infer the combustion temperature. This method offers several advantages over thermocouples, including a more comprehensive temperature range and measurement accuracy. The key to probe sampling is ensuring that the composition of the collected sample gas remains consistent throughout the sampling period, ensuring authentic and representative sampling results.
Current scholars have carried out a great deal of research on the gas analysis method and sampling probes. As early as the 1960s, Williamson et al. [4] first used the gas analysis method to study jet engine combustion temperature. In the 1980s, the National Aeronautics and Space Administration (NASA) [5] and China’s aerospace industry standard unit [6] published gas sampling test procedures for deriving combustion chamber performance. Since then, gas analysis has moved into routine measurement techniques.
Numerous scholars have extensively optimized measurement procedures for gas analysis systems and practically validated the feasibility of the gas analysis method. Sevcenco et al. [7] constructed a gas analysis system to evaluate the size and quantity of aircraft gas turbine exhaust in real time. Mutschler et al. [8] improved the traditional gas chromatography analysis method. They proposed a new, rapid, real-time quantitative gas analysis method based on mass spectrometry to realize the analysis of reaction kinetics. In 2016, the American Society of Motor Vehicle Engineers developed a continuous sampling measurement program for aviation turbine engines based on gas analysis [9,10] to realize continuous sampling and analysis of gas emissions from gas turbine engines. Zhong et al. [11] established a set of gas analysis systems and researched various gas composition estimation methods. Li et al. [12] designed a set of gas combustion calculation and analysis systems and successfully calculated multiple values of gas components. Wang et al. [13,14] carried out research on the temperature field distribution of the combustion chamber of aviation turbine engines based on the gas analysis method. They analyzed the influence of measurement error of the gas analysis method of the calculation results of combustion chamber performance parameters. The results showed that the gas analysis method could ensure sufficient measurement accuracy under a reasonable layout. The above studies show that the parameters measured using the gas analysis method can reflect the actual gas conditions.
For the study of sampling probes, Cloket et al. [15,16] demonstrated that the establishment of supersonic flow is feasible in fine channels (0.075–2 mm). Mitani et al. [17,18,19,20] demonstrated the feasibility of freezing chemical reactions in supersonic flow tubes. Numerous scholars have analyzed the flow parameters of the probe and summarized the influence laws of gas components and state parameters on sampling accuracy [21,22,23]. Zhang [24] studied the angle of attack structure and internal and external field of the sampling probe based on the super combustion test bench and computational fluid dynamics (CFD) calculation and proposed a design scheme for the probe size. Zhang et al. [25] designed a set of six-point intermittent gas sampling systems to measure the O2, CO, and CO2 content at the outlet of the engine combustion chamber. Liu et al. [26] designed a six-point sampling probe, carried out a numerical simulation of the internal and external flow of the sampling probe, and carried out a calibration test under the supersonic environment at the exit of the gas generator. Liu et al. [27] designed a dual-cavity mixed sampling probe with water–air cooling. They analyzed and verified the sampling performance of the probe by combining numerical simulation with experimental results, providing a new idea for the structural design of the probe. The studies mentioned above provide many criteria and much theoretical guidance for probe design.
The existing research generally focuses on monitoring component data at the test stand for back extrapolation of the combustion chamber performance parameters. The research results mainly focus on the influence of the flow parameters outside of the probe on the sampling accuracy. However, there are fewer studies on the changes in the gas flow field caused by the geometry of the sampling probe itself and the influence of the sampling accuracy. On the combustion chamber experiment platform, the researchers found that the head position of the sampling probe appeared as a detached shock wave, seriously affecting the sampling accuracy. At the same time, the probe operates in an extreme environment of high temperature and low pressure at the outlet location, resulting in high-speed gas flow rates and constant changes in the gas flow parameters. Therefore, it is necessary to weaken the detached shock wave by enhancing the probe geometry and providing the real-time, accurate calculation value of the component content in the simulation test.
In response to the problems mentioned above, this paper modifies the sampling probe structure in supersonic gas flow. It establishes three probe structures, 28°, 30°, and 32°, and a conical probe structure for comparative analysis. The sampling accuracy is evaluated by the deviation of the component volume fraction before and after sampling and the resulting combustion efficiency error, which aims to provide ideas and necessary data for investigating the probe air intake angle. At the same time, the optimal sampling conditions are provided for the actual test. The idea of using the Redlich–Kwong equation (R-K equation) to solve the molar volume is mainly used in molecular dynamics [28,29] and in chemical thermodynamics calculations for gas entropy and gas enthalpy [30]. The application of this technology in aerospace measurement and control is not prevalent. In order to solve the problem of an accurate components volume fraction solution, this paper establishes a set of calculation methods for solving the relative deviation of volume fraction using an iterative method based on the ideal gas law and the R-K equation. This method aims to improve the accuracy of the theoretical calculations and ensure the accuracy and reliability of the gas components data.

2. Solving Model and Computational Methods

2.1. Solving Model

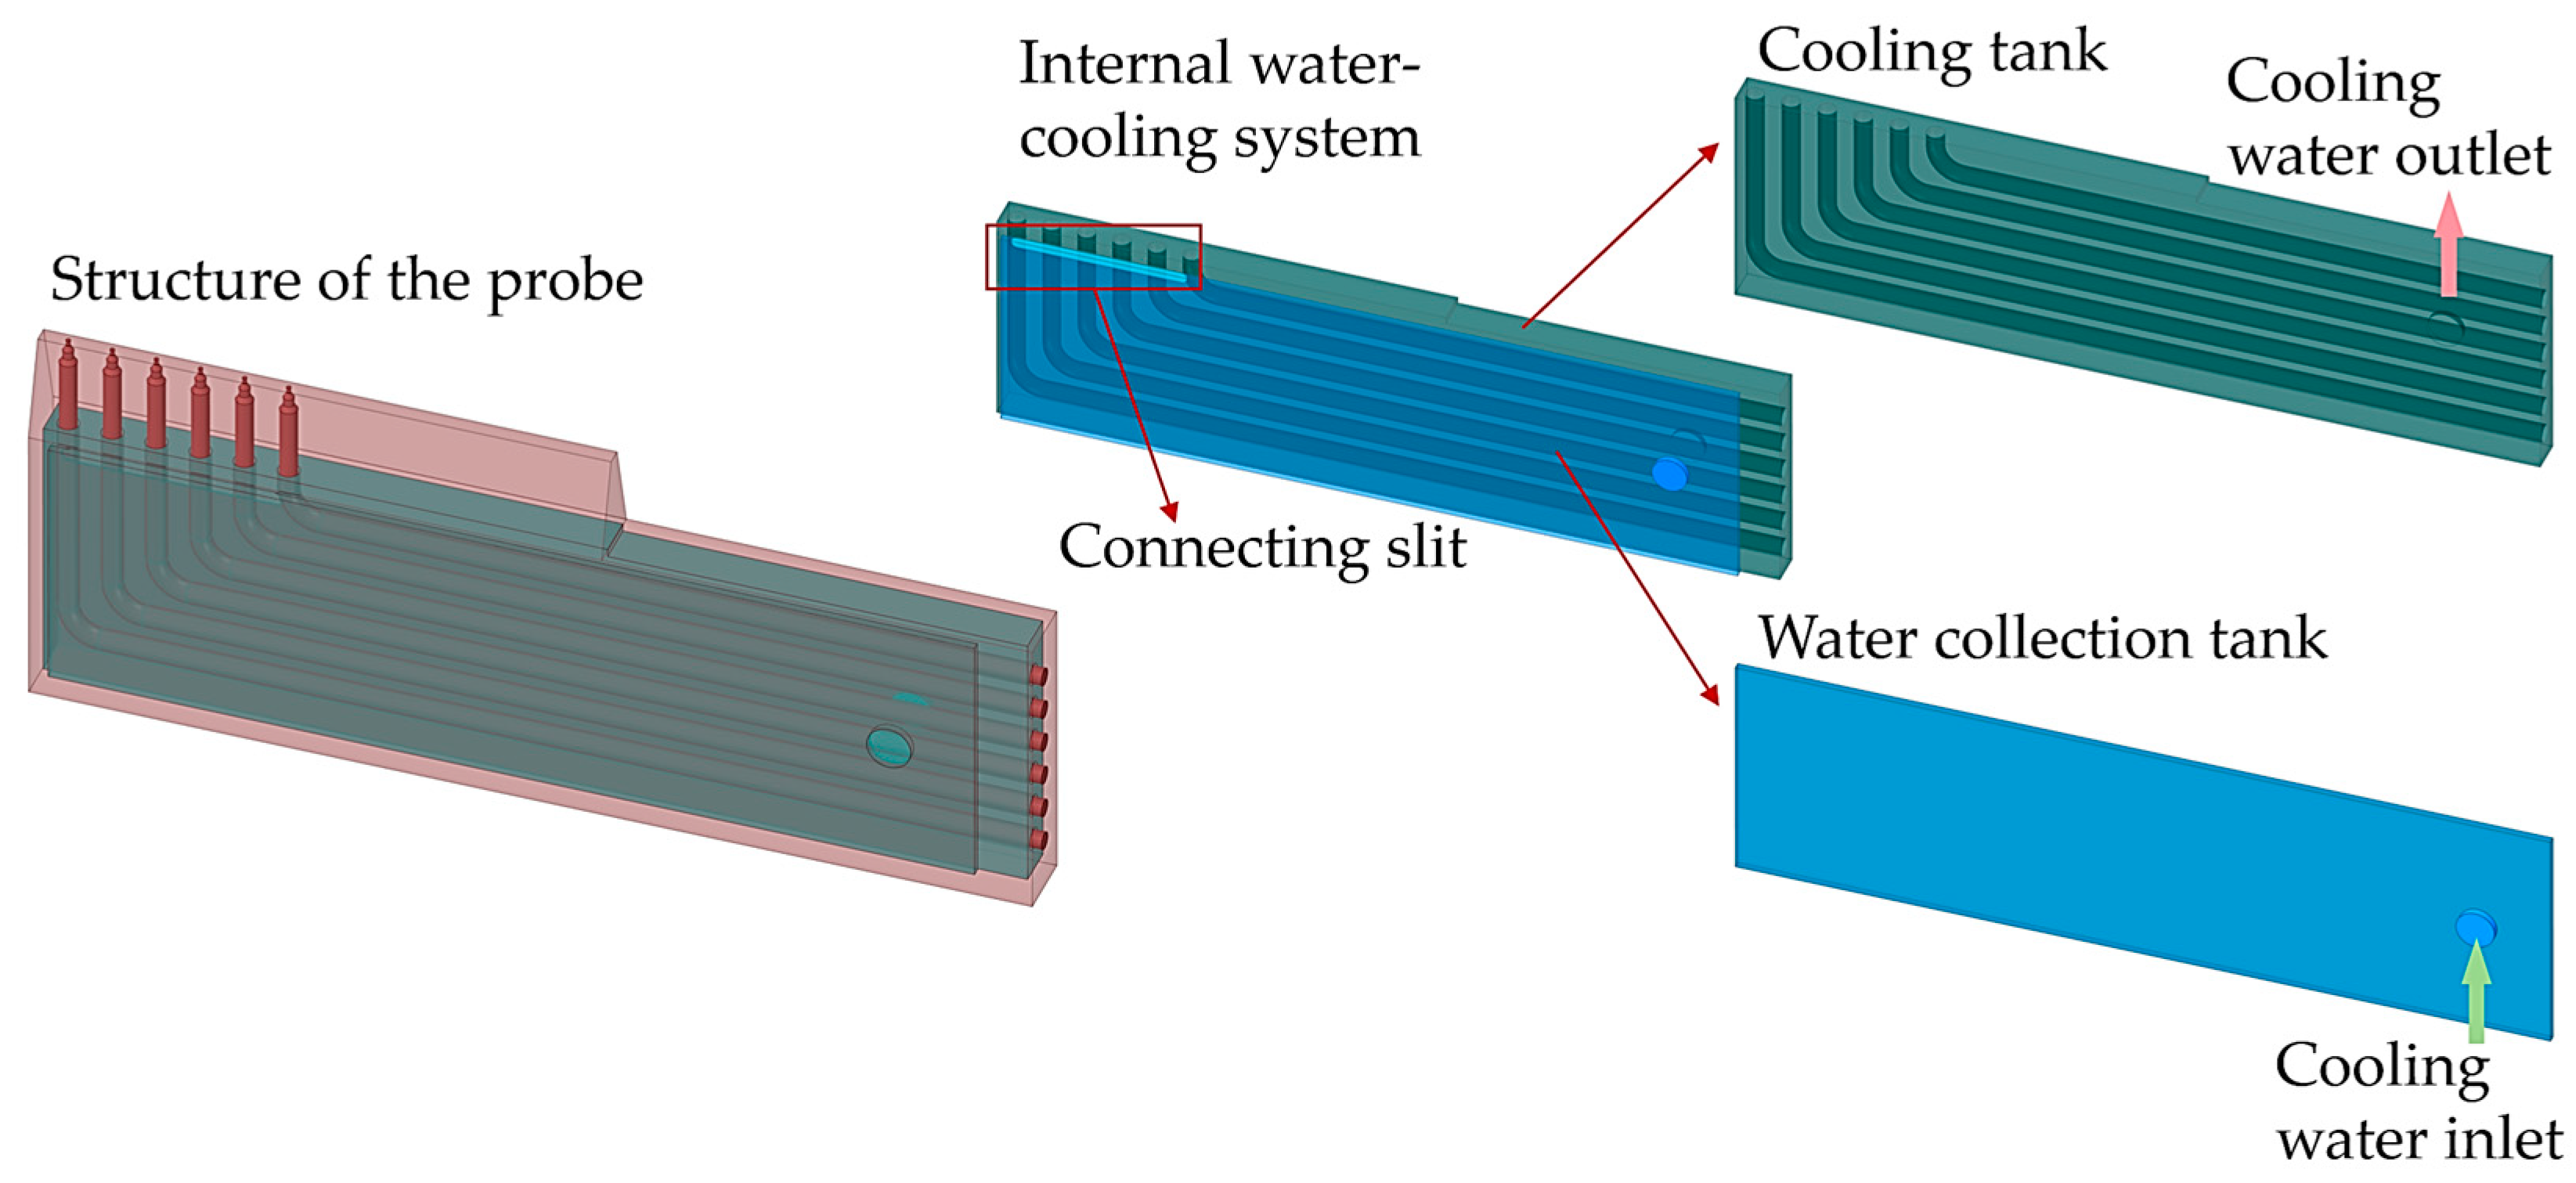
This paper uses a six-point gas sampling probe as the primary research model. This model is the traditional test model of a gas turbine research institute and has been widely used in many steam turbine works. In order to rapidly cool the sample gas to a temperature where chemical reactions are virtually non-existent, the probes are usually fitted with an internal expansion channel and an external water-cooling system. The structure of the probe head is shown in Figure 1, and its internal flow path adopts a secondary expansion structure with a 30° expansion per stage. In the actual experiment, since the effective sampling time of the sampling probe can only last about 1–3 s, the probe is constructed with a 30° leading edge to reduce the influence of an external detached shock wave on the gas flow parameters. The sampling probe is approximately 17 mm tall and comprises six sets of inlet channels. Each inlet channel has an inlet diameter of 0.8 mm, a spacing of 8 mm, and an inner diameter of 3.2 mm. The dimensions of the flow channel inside of the probe are shown in Table 1.
Figure 2 presents the overall structure of the probe model and the internal water-cooling system. The water-cooling system comprises a double-tank circulation structure, with a water collection tank on the inlet side and a cooling tank on the outlet side. The water collection tank is connected to the cooling tank with a slit 40 mm long and 2.5 mm wide at the end of the probe head. The water-cooling system has an inlet and an outlet. In order to prevent the calculation boundary of the water-cooling system from being overly close to the object and causing backflow, the cooling water inlet and outlet are typically extended by approximately 15–20 mm in the simulation test. The backflow can be controlled within 0.01%.
Under typical circumstances, the utilization of tap water at a normal temperature can meet the cooling requirements of gas [22]. When the water inlet pressure is 0.5 MPa, the flow rates of the water inlet and the water outlet remain stable at about 15 m/s, and the mass flow rate is about 0.72 kg/s. As the cooling water pressure gradually rises to 2.5 MPa, the flow rates of the water inlet and the water outlet remain stable at about 50 m/s, and the mass flow rate is about 2.04 kg/s. The regulation of the cooling water pressure is elaborated in Section 3.2 and Section 4.2 of this paper.

2.2. Computational Methods of Numerical Study

2.2.1. Numerical Methods

The numerical simulation is mainly based on the Ansys Workbench 20222R1 platform. Space Claim software 2022R1 is used for modeling, boundary naming, topology sharing, and other pre-processing operations. FLUENT software 2022R1 is used to divide the grid and define the boundary types. This paper uses pressure inlet and pressure outlet, and the specific values are shown in Table 2. The calculation model adopts the energy equation, the viscosity equation, and components transport. During computer operation, the convergence is judged by monitoring the static temperature of the sampling probe outlet and residual error. After 3000 iterations of steady-state simulation calculation, the residual error of velocity, continuity equation, turbulence term, and components are lower than 1 × 10⁻⁴, and the residual error of energy is less than 1 × 10⁻⁷; in addition, the static temperature of the probe outlet tends to be constant. Each simulation test lasted over 12 h, and at least 80 control simulation tests were carried out.

2.2.2. Meshing and Boundary Conditions

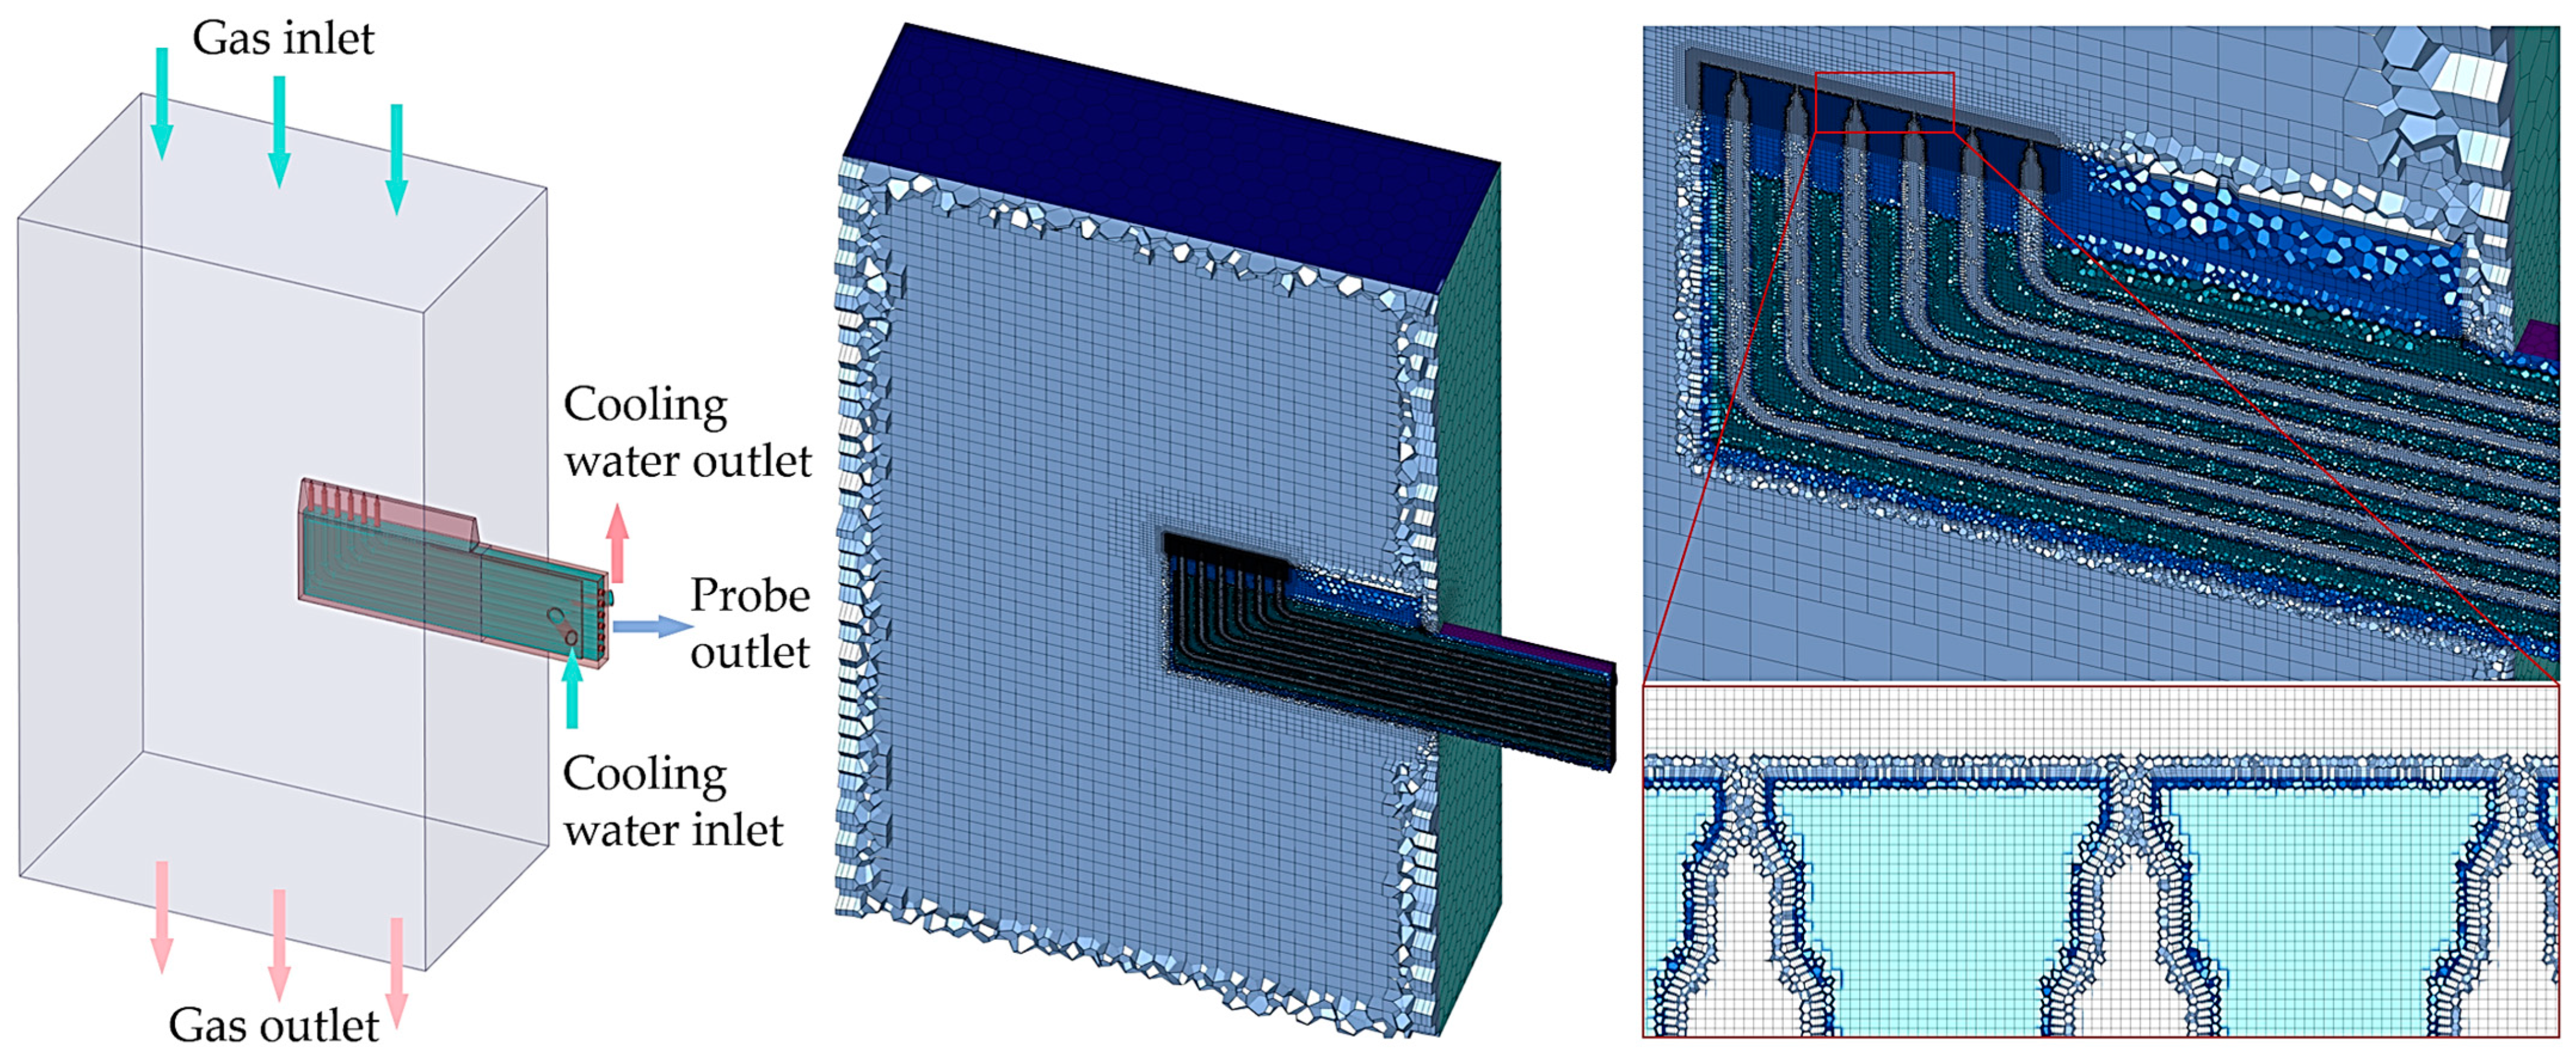
The solving model and meshing of the supersonic system are shown in Figure 3. A gas external flow field with a length of 240 mm, a width of 150 mm, and a height of 400 mm is established outside of the sampling probe. The FLUENT software is used to perform 3D meshing of the probe’s solid, gas, and cooling water fluid domains and encrypt the probe head mesh. The number of meshes is about 3.9 × 10⁶. The maximum cell length of the volume mesh is 6.4 mm, and the minimum cell length is 0.2 mm. Three boundary layers are applied between the fluid domain and the solid domain. The offset method of the boundary layers is of a smooth-transition type, with the transition ratio and growth rate being 0.272 and 1.18, respectively. The minimum orthogonal quality of the mesh is 0.09.
The mesh-independent verification calculation demonstrates that the variation in the flow parameters under this number of meshes does not exceed 0.3%, therefore, this number of meshes is chosen for subsequent simulation calculations. In order to investigate the influence of the probe structure on the sampling accuracy in a supersonic environment, a probe with an angle of 28° and 32° is added to the original 30° structure.
During the operation of the sampling probe, the flow characteristics of the gas and the nature of the components exert a non-negligible influence, due to the wide range of variation in the gas flow parameters. The simulation adopts a realizable k-ε model of real gas turbulence and combines the computational method of fluid–solid coupling. Five fluid materials are added to the components transport model and are set up for mixing (N2, O2, water vapor, CO, and CO2). The components transport model mainly deals with the mass transfer between mixtures, namely, the mass transfer from the region of high concentration to the region of low concentration, including convection and diffusion. The compressible real gas model deals with the flow behavior of gas influenced by Mach wave and the variation in the concentration of gas components. The simulation test simulates the experimental platform’s gas flow rate and emission value by adjusting the probe’s inlet and outlet pressure. When the pressure of the gas inlet is set to 2.4 MPa, and the pressure of the probe outlet is set to 7500 Pa, the resulting pressure difference can make the supersonic gas flow reach Mach 3, and the mass flow rate is maintained at 2.55 kg/s, which is consistent with the combustion chamber gas of the actual test bench. Considering the convergence of supersonic flow, the initial gauge pressure should be given simultaneously, which the supercharge ratio formula can obtain. The specific boundary conditions are shown in Table 2.

2.2.3. Solving of Component Volume Fraction

The gas flow parameters fluctuate when the probe operates, both externally around the probe and internally through the pipes, affecting the component content. Therefore, accurate component content calculation at a specific location in the simulation test is crucial. The accuracy of the molar volume solution of gas parameter calculations directly determines the accuracy of the subsequent volume fraction solution. The ideal gas law of state is as follows:
V = R T P
V, P, and T represent gas volume, pressure, and temperature, respectivley, and R is the gas constant (8.314). Due to this equation’s small range of applicability, it cannot be solved directly and accurately for high-temperature supersonic gas flow. At temperatures above room temperature and pressures less than 7 MPa, diatomic molecules can be approximated as ideal gases. However, this approximation is not generally applicable to 3-atom molecules, such as CO2. Moreover, the sampling accuracy of CO2 has a significant impact on the subsequent gas analysis. Considering the real gas properties of the gas components to reduce the computational errors, the R-K equation is used in this paper to describe the real gas behavior approximately. This equation is based on the simple form of the cubic form of the specific volume of the van der Waals gas equation, and the accuracy of the calculation is improved by correcting the internal pressure term, which is suitable for the calculation of the state of mixtures and applies to a wide range of pressures and temperatures. At the same time, compared with other real gas state description equations and their many expressions, the R-K equation has a more concise solution process to ensure calculation accuracy. Its expression is as follows:
P = R T V m b a T V m V m + b
a = ω a R 2 T c 2.5 P c
b = ω b R T c P c
where P and T represent the pressure and temperature of the gas, respectivley; Vm represents the molar volume of the gas; a and b are the relevant constants of the component gas; Tc represents the critical temperature of the gas; Pc represents the critical pressure of the gas; and ωa and ωb are the constant terms. The value of ωa is 0.42748, and ωb is 0.08664. In order to determine the precise molar volume using the R-K equation, the following iterative formula is derived by modifying Equation (2):
V i + 1 = R T P + b a V i b T P V i V i + b
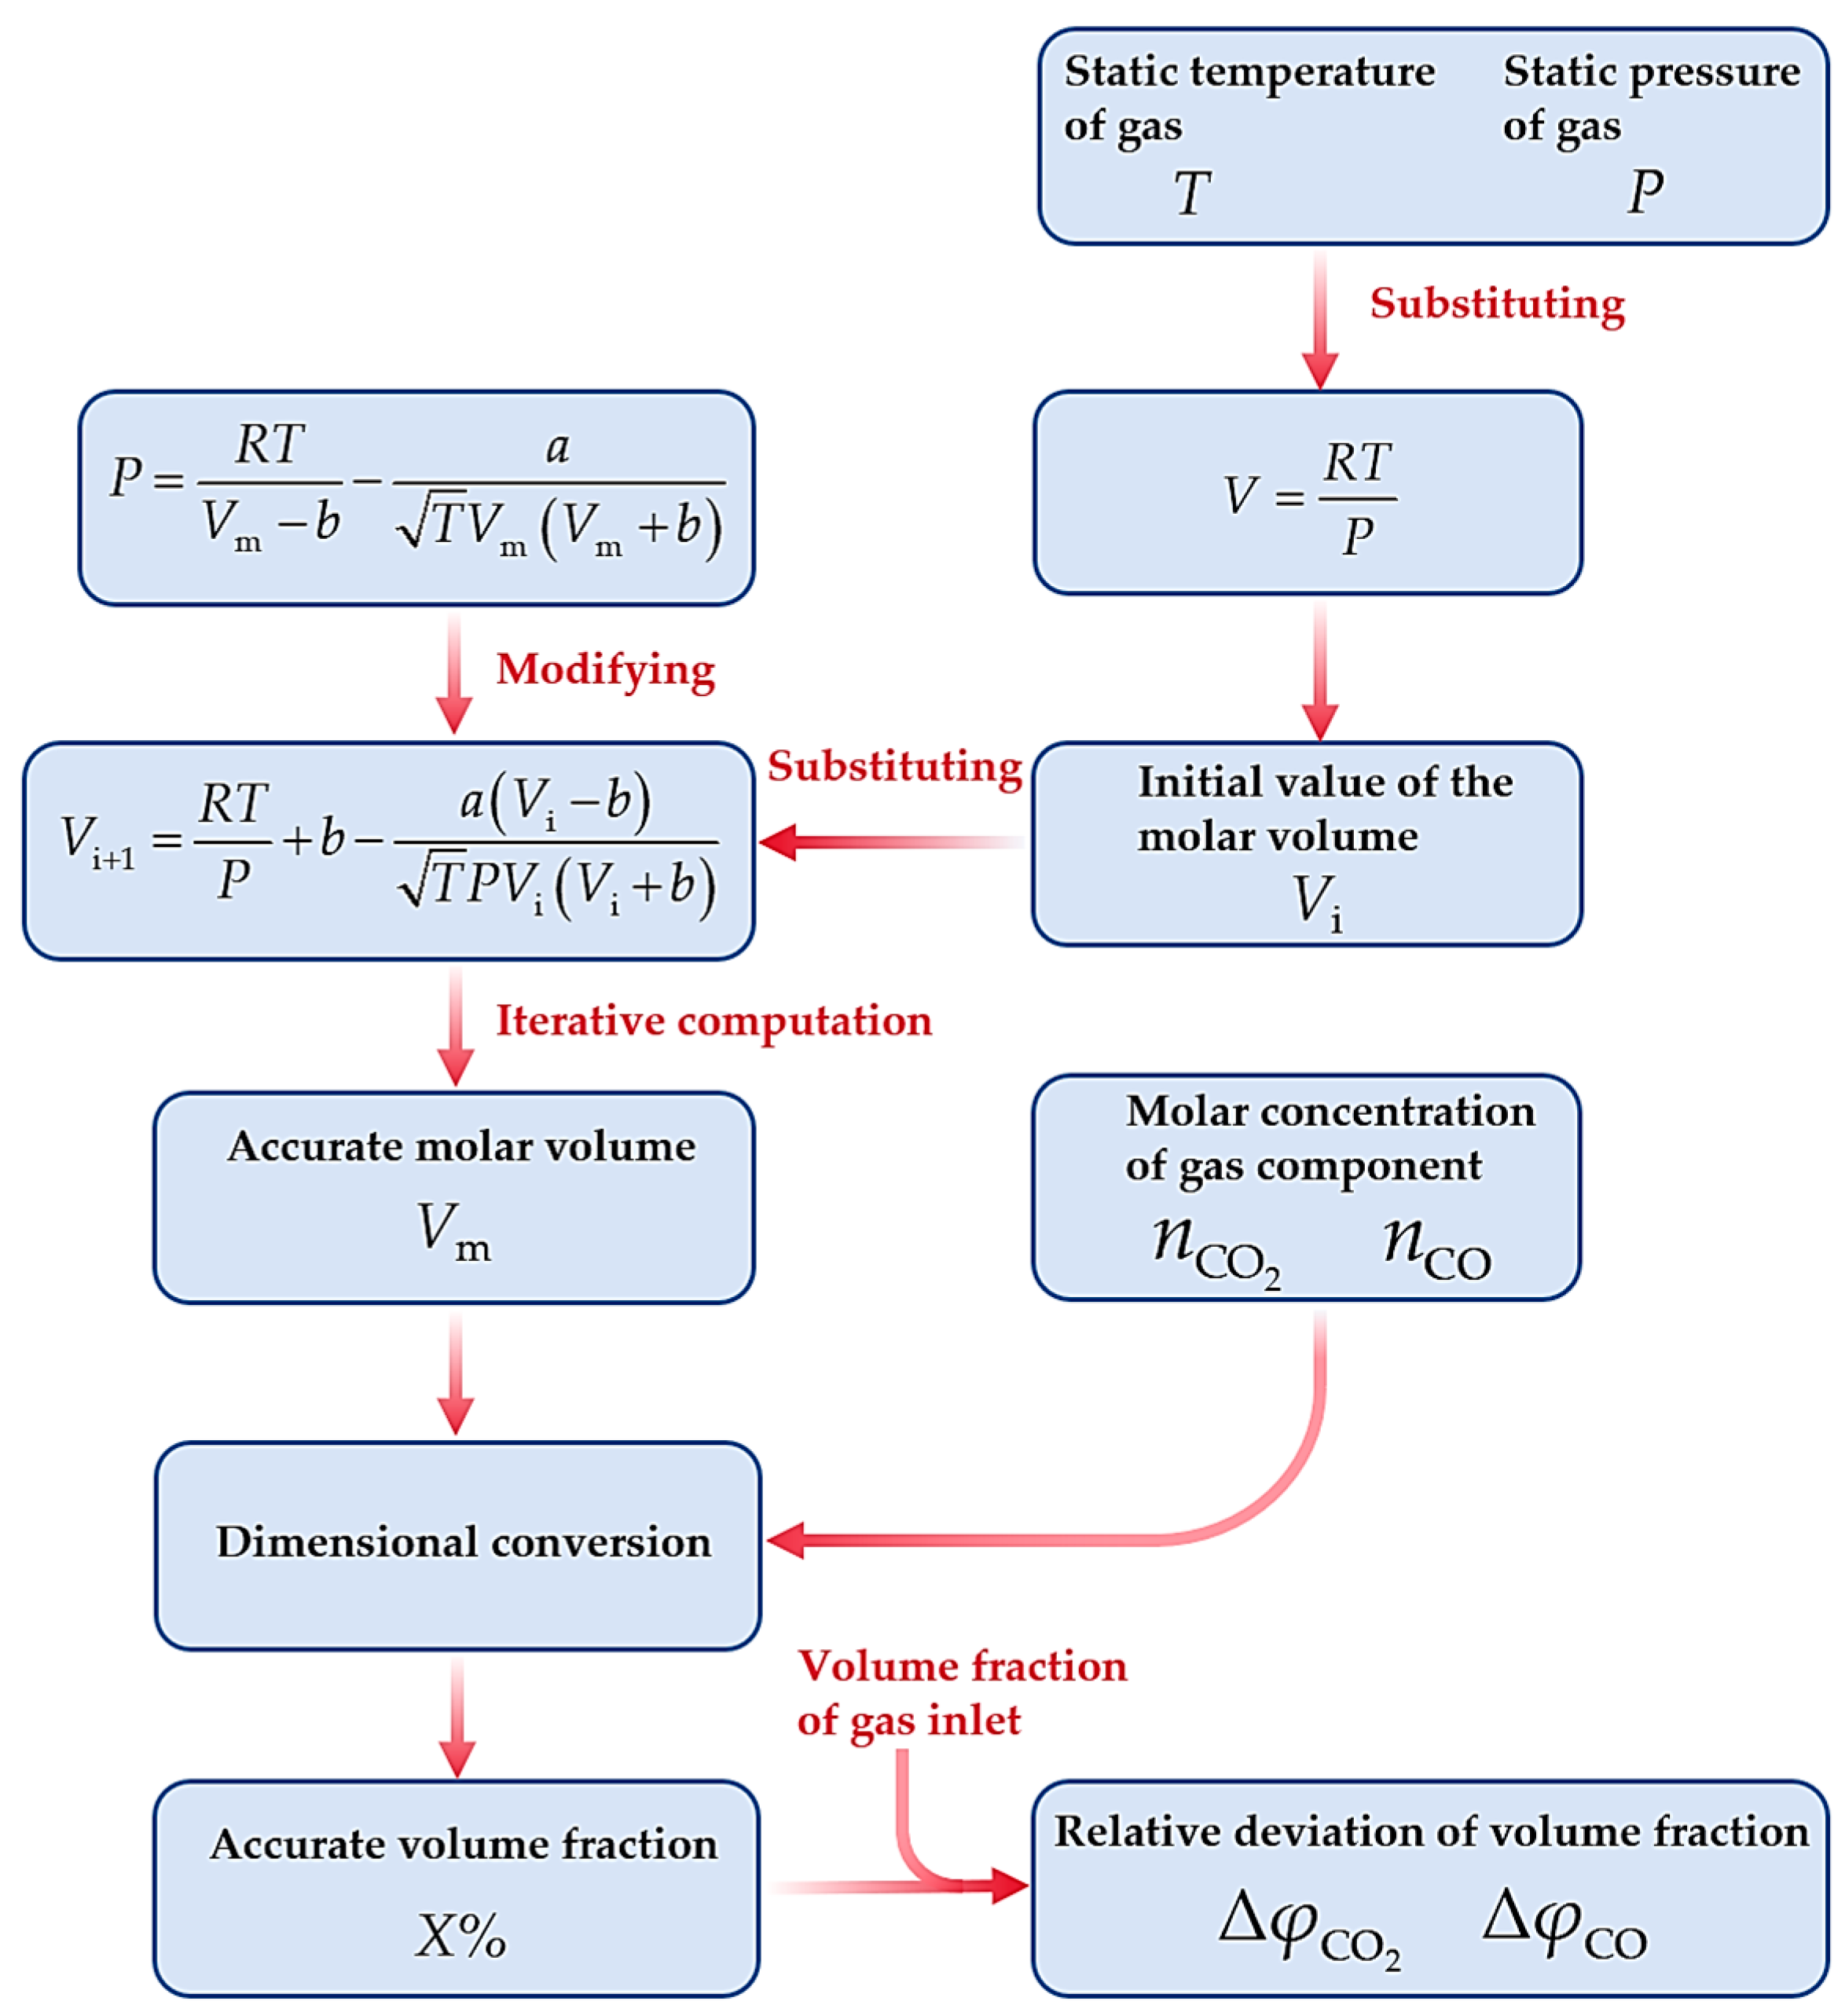
This paper presents a set of calculation methods for solving the relative deviation of volume fraction by an iterative method based on the ideal gas law and the R-K equation. The calculation process of this calculation method is as follows: the initial value of the molar volume is obtained using Equation (1), which is carried into Equation (5) for several iterative calculations until the deviation before and after the iteration is less than 0.0001%. An accurate molar volume can be obtained. The subsequent combination of molar concentration and far-field inlet volume fraction of gas can provide a more accurate relative deviation of volume fraction for calculating combustion efficiency. Figure 4 shows the complete process of solving the volume fraction and the relative deviation of the volume fraction using the R-K equation iterative algorithm.
It should be noted that the above process of solving for the molar volume requires the static temperature value and static pressure value of a specific position provided by FLUENT software. If the relative deviation of volume fractions is required, the molar concentration of components provided by FLUENT software is also necessary. The remaining variables, formulas, and calculation procedures are constant. This paper adopts a purely manual calculation method by the calculation process. In the subsequent research, if there is a problem of an increase in the number of study groups and the calculation amount, MATLAB R2018b, Python 3.11, and other software will be considered to improve the calculation efficiency and iteration accuracy.

2.2.4. Combustion Efficiency Calculation of Components

Aviation kerosene combustion produces N2, O2, H2O, CO, CO2, UHC, H2, and NOX. No H2 is detected in actual test measurements, and the volume fractions of UHC and NOX are tiny. When using the gas analysis method to measure the combustion efficiency and combustion temperature, only the volume fraction of CO and CO2 gas components that need to be measured can achieve 1% system accuracy [13]. After the simulation test, the relative deviation of the volume fraction ( Δ φ CO 2 , Δ φ CO ) of the probe outlet position is calculated using the method shown in Figure 4. The influence of sampling deviation of the CO2 volume fraction on combustion efficiency can be calculated as follows [13]:
Δ η = 0.469 φ CO + 1.319 φ CH 4 Δ φ CO 2 φ CO + φ CO 2 + φ CH 4 2
The influence of sampling deviation of CO volume fraction on combustion efficiency can be calculated as follows [13]:
Δ η = 0.469 φ CO 2 0.85 φ CH 4 Δ φ CO φ CO + φ CO 2 + φ CH 4 2
The results of Equations (6) and (7) are utilized in Equation (8) to determine the overall impact of component sampling accuracy on combustion efficiency [31], as follows:
Δ δ = i = 1 q Δ η i 2
where Δδ represents the overall combustion efficiency impact. Since this paper only considers two components, CO2 and CO, in Equation (8), the value of q is 2.

2.2.5. Feasibility Analysis of the R-K Equation Iterative Algorithm

A preliminary simulation test is conducted first to validate the reliability of the R-K equation iterative algorithm in the simulation test. Figure 5 shows the static temperature distribution sampled by the probe when the cooling water pressure is 2.0 MPa and marks the gas flow trace outside of the probe.
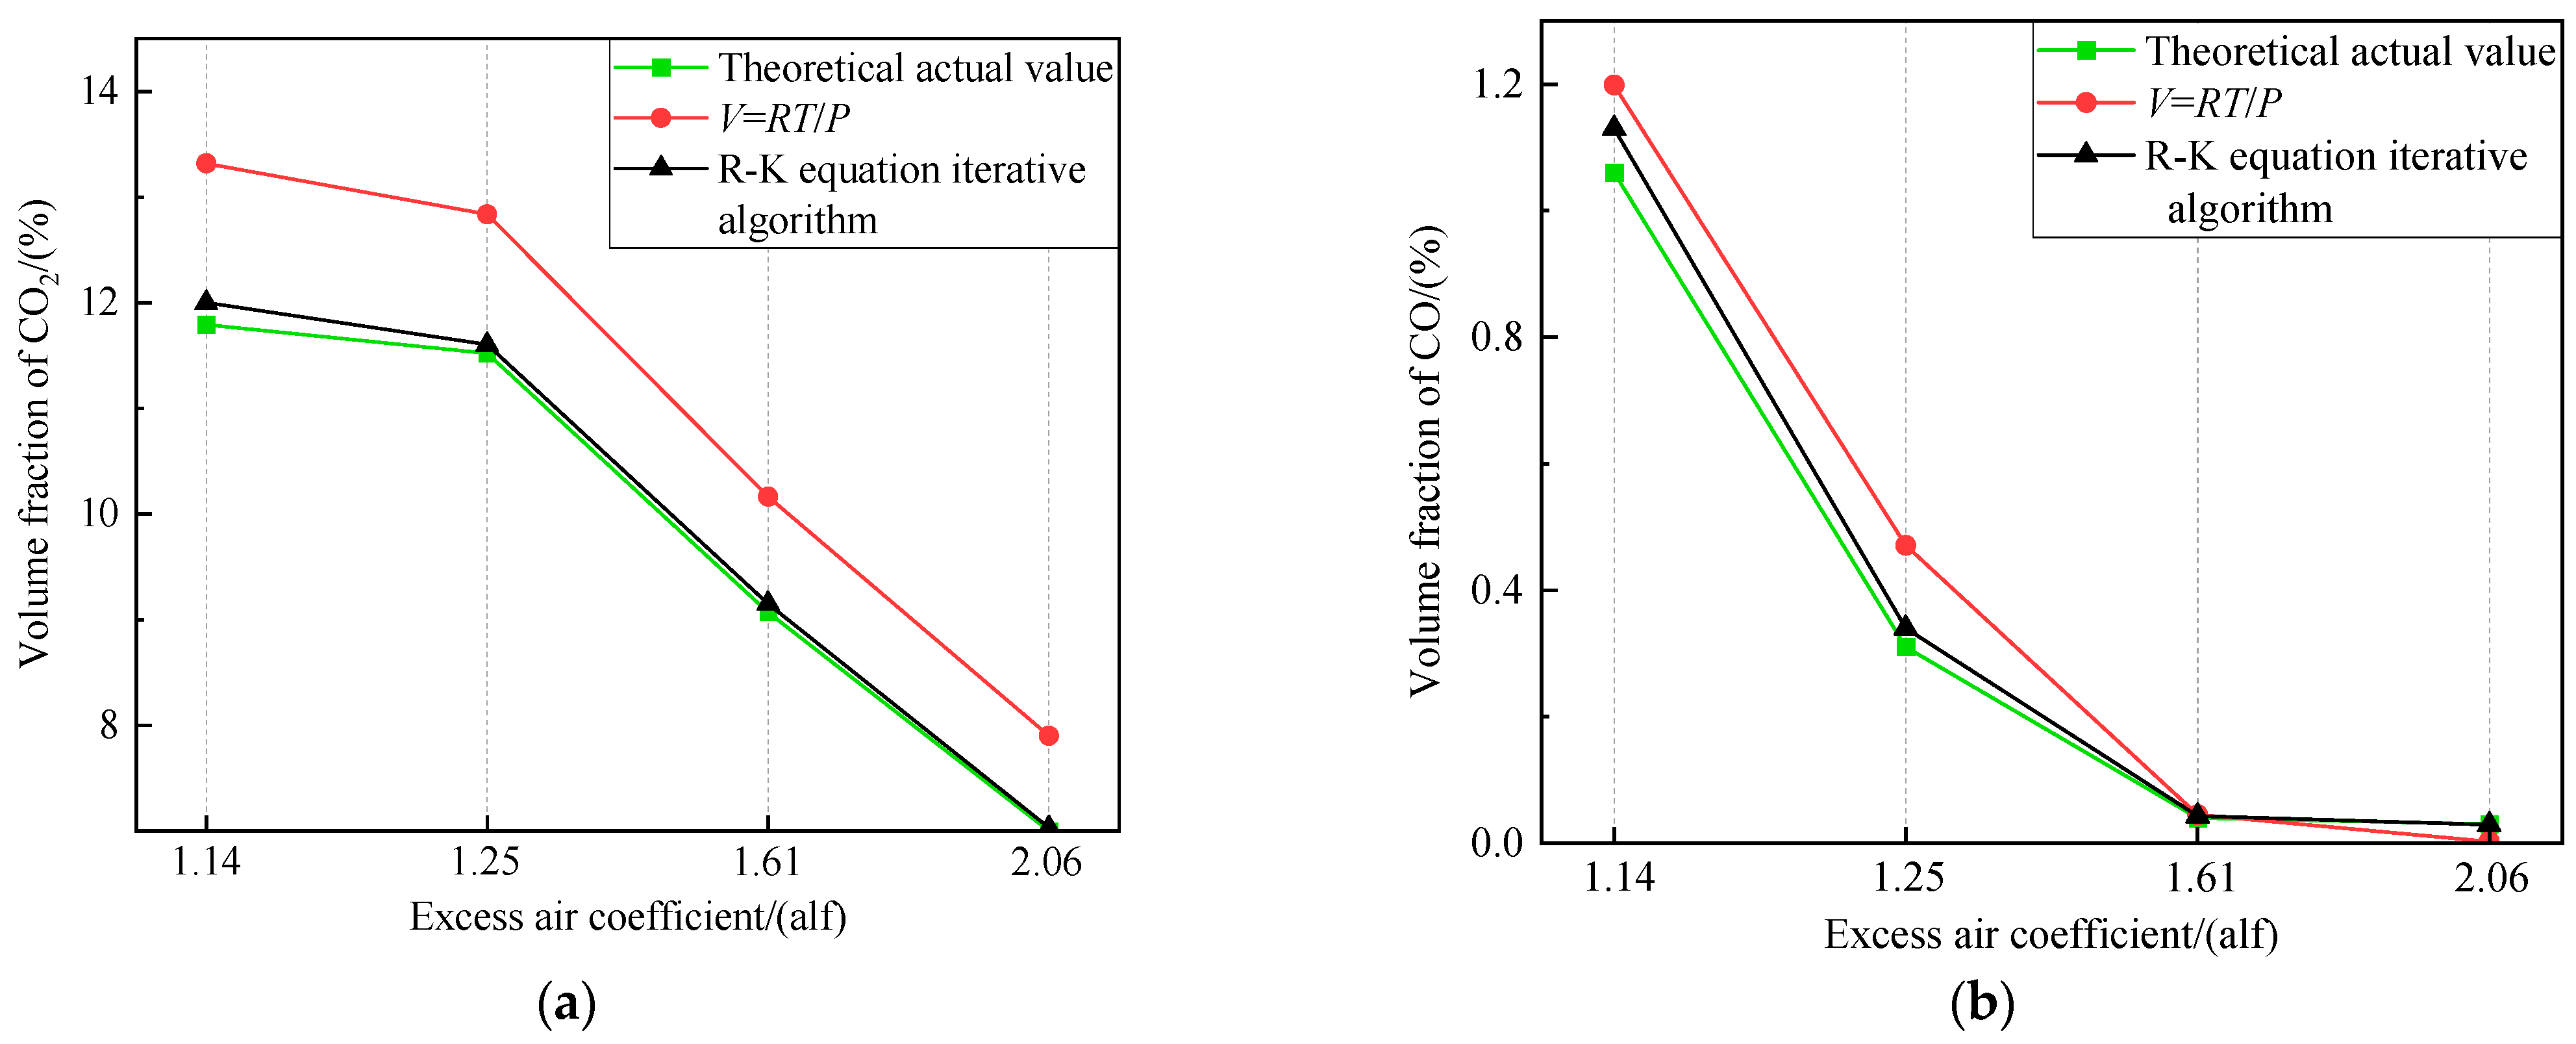
A sharp wedge object undergoing supersonic motion will deflect the airflow, which macroscopically manifests itself as an oblique shock wave. An oblique shock wave will not break away from the object if the airflow’s gyration angle is insignificant. At this point, it is an attached shock wave. When the front end of the object is blunt, the turning angle of the airflow increases, and the oblique shock wave breaks away from the object to form a detached shock wave. A preliminary analysis from Figure 5 shows that the initial analysis indicated the formation of a detached shock wave at the leading edge of the probe, located 2–4 mm ahead of the probe entrance. It can be observed that the airflow becomes disturbed, and its parameters begin to change dramatically after reaching a position 4 mm before the probe inlet. The section about 5 mm from the probe entrance is named the α section. Since no airflow disturbance is considered between the gas inlet and the α section, the components content of the α section should be consistent with the gas inlet and defined as the theoretical actual value, that is, the initial value of the gas inlet set according to the components data of the actual test bench, as shown in Section 5. The ideal gas law and the R-K equation iterative algorithm in Figure 4 are used to calculate the volume fractions of CO2 and CO under different excess air coefficients. These values are then compared with the theoretical actual value, as presented in Table 3 and Table 4.
Plot the comparison of Table 3 and Table 4, as shown in Figure 6.
According to the comparative analysis of Table 3 and Table 4 and Figure 6, the following can be concluded:
  • With the increase in the excess air coefficient, there is a gradual decrease in the volume fraction of the two components, leading to a slight increase in calculation accuracy. This phenomenon is mainly because incomplete combustion in the combustion chamber is reduced, resulting in a more stable gas component content at the front end of the probe under a high excess air coefficient.
  • Compared to the ideal gas law, the R-K equation iterative algorithm can achieve higher precision in determining the volume fractions, regardless of whether the excess air coefficient is high or the component type is different. The volume fractions obtained using this method closely match the theoretical actual value, with an average calculation error of less than 0.06%.
  • Considering the possibility of a slight disturbance caused by gas flow before the α section in practical situations, it can be concluded that the R-K equation iterative algorithm meets the analysis requirements with satisfactory calculation accuracy. In the subsequent calculation, the error of the R-K equation iterative algorithm is considered negligible.
The above R-K equation iterative algorithm exhibits high conformity to the theoretical actual value and significantly reduces the theoretical calculation error. Compared with other gas equations of state (such as the Virial equation and the Peng–Robinson equation), the R-K equation iterative algorithm ensures high precision and a more streamlined calculation process. The real-time and accurate calculated values of the component content obtained using this method guarantee the authenticity and credibility of the subsequent theoretical analysis.

3. Analysis of Simulation Results in the Control Groups

3.1. Analysis of Flow Field

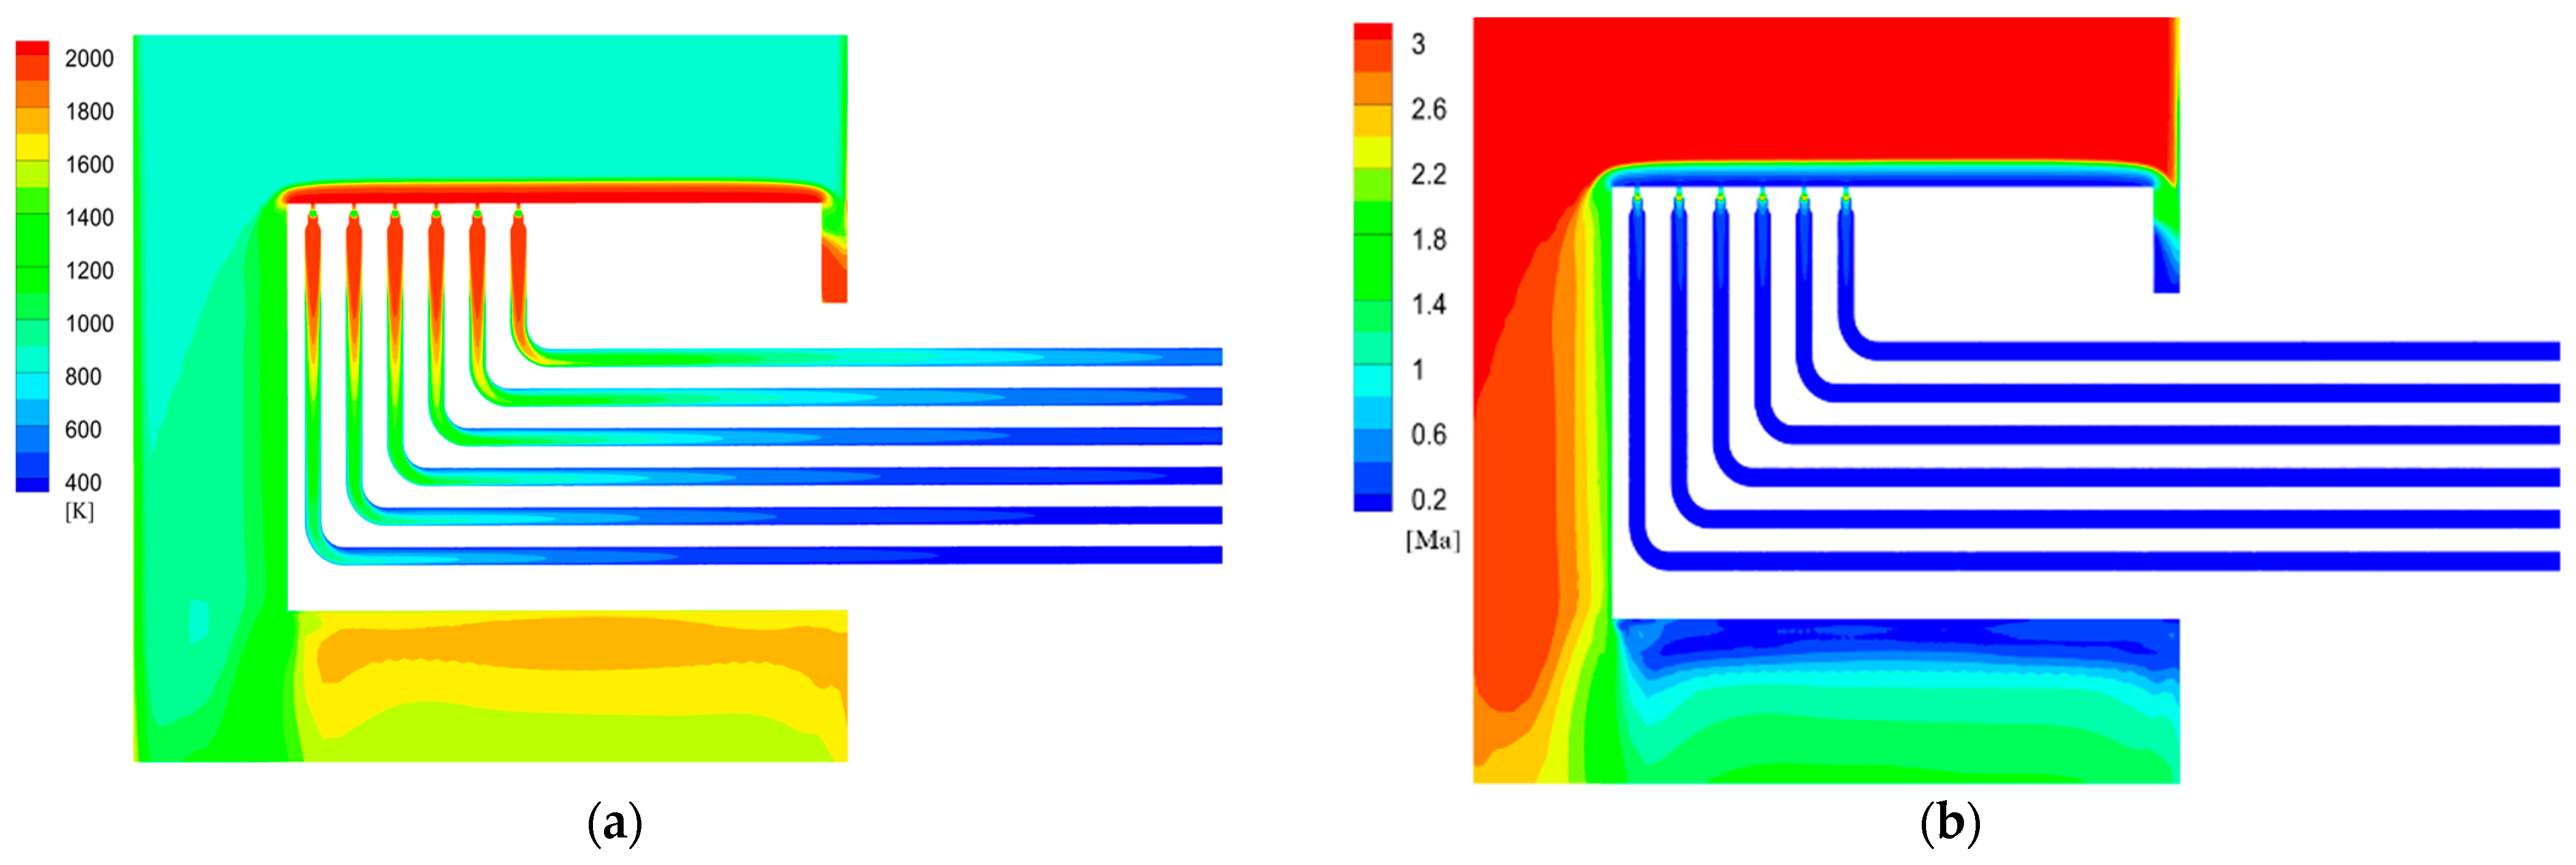
Figure 7 presents the overall distribution of static temperature and Mach number of probe sampling in a supersonic environment. As can be seen from the figure, the detached shock wave generated at the front end of the probe causes the gas flow velocity to decrease to subsonic speed and the static temperature to increase. The initial analysis shows that the variation in gas static temperature and Mach number in the probe head is contrary. The static temperature and Mach number of the gas in the probe head are consistent with the simulation results of Liu et al. [26]. As the gas passes through this part, its static temperature gradually decreases due to the water-cooling system. However, without subsequent pipeline contraction or expansion, the subsonic gas flow in this area can only slow down and stabilize gradually.
Figure 8 shows head temperature cloud images of the three probe structures. Due to the formation of a detached shock wave, a hemispherical temperature jump band is formed outside of the probe. Based on the shock wave formulas, the temperature ratio and pressure ratio of the gas before and after the shock wave can be obtained as follows:
T 2 T 1 = 1 M 1 2 sin 2 β 2 k + 1 2 k M 1 2 sin 2 β k 1 2 1 + k 1 2 M 1 2 sin 2 β
p 2 p 1 = 2 k k + 1 M 1 2 sin 2 β k 1 k + 1
where k and β are the adiabatic index and shock angle, respectivley, and M is the Mach number. As can be seen from Equations (9) and (10), when the incoming Mach number remains constant, the increase in shock wave intensity with the rise in the shock angle leads to a more significant loss of airflow through the shock wave. Based on the amplitude of the temperature jump in Figure 8, it can be initially determined that the detached distance of the 28° probe is the largest, with the lowest shock wave intensity, and the detached distance of the 32° probe is the shortest, with the highest shock wave intensity.
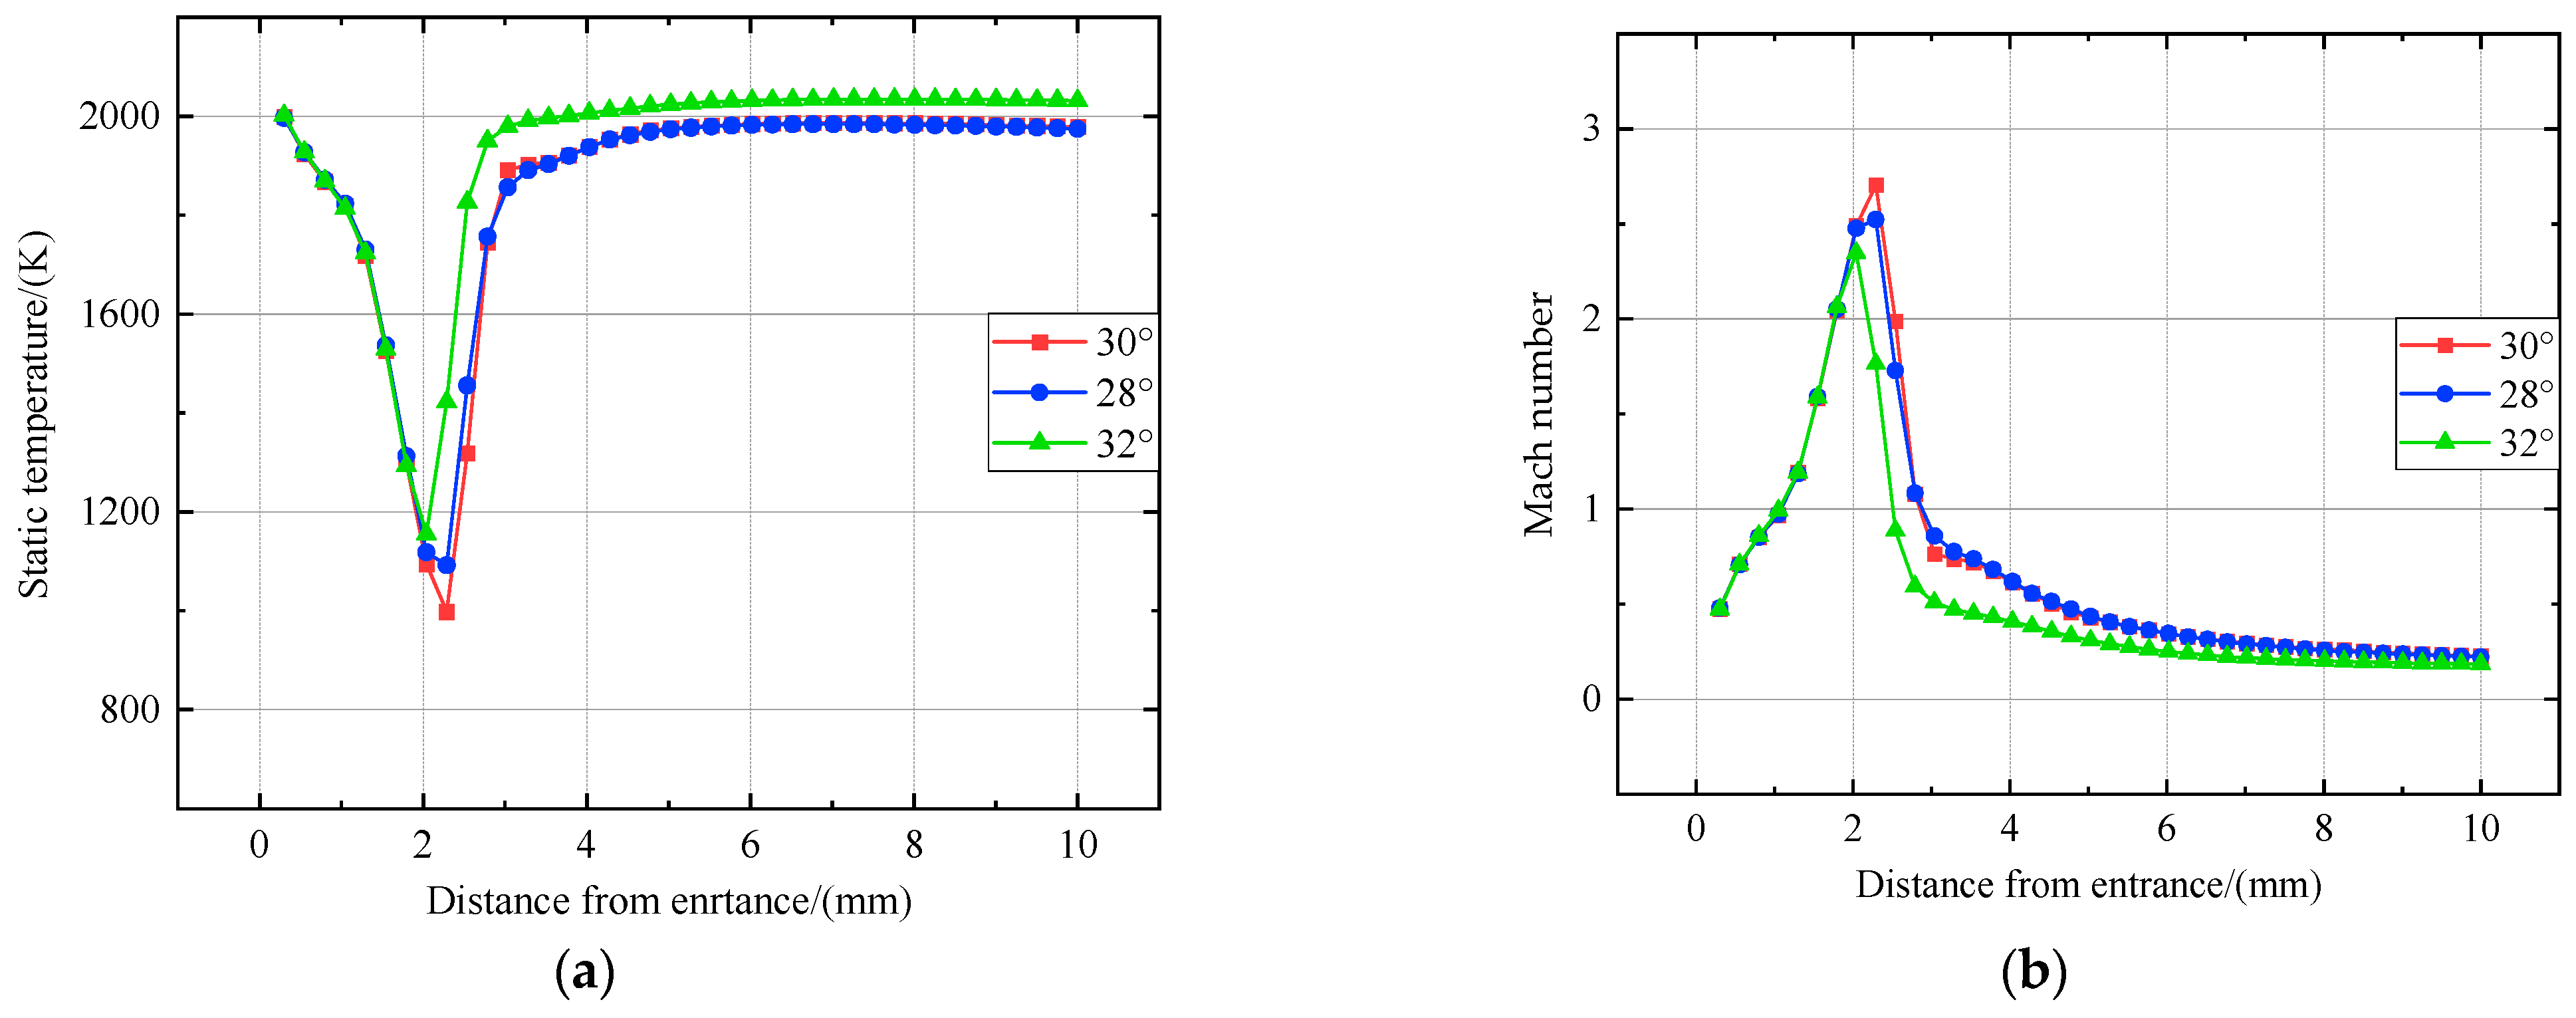
Figure 9 shows the variation in gas flow parameters in the expansion section in different clamping angle probes. The analysis of the figure reveals that, in the three structures, the gas flow undergoes expansion and compression due to the influence of the expansion wave and the shock wave in the first expansion section. However, there is only a slight change in the Mach number, resulting in an overall poor effect on expansion and compression. This deficiency can be attributed mainly to external detached shock wave interference and an excessive reduction in Mach number. Before entering the probe, the kinetic energy of the gas flow experiences significant depletion, preventing the Mach number from surpassing the speed of sound within the straight section of the inlet. After the gas passes through the shock wave, the temperature jumps sharply, but under the action of the water-cooling system, the temperature drops rapidly. The effect of this process on freezing chemical reactions is minimal [13]. In Figure 9a, the maximum Mach number of the 32° structure is approximately 2.3, while the 28° structure exhibits a higher Mach number of around 2.6. As depicted in Figure 9b, the overall freezing effect of the 28° and 30° structures is equivalent and superior to that of the 32° structure. However, it should be noted that the static temperature Mach number fluctuation is significantly reduced in the case of the 28° structure, thereby enhancing its suitability for maintaining component accuracy.

3.2. Study of the Effect of Sampling Accuracy

According to the actual test conditions, the four conditions with excess air coefficients of 1.14, 1.25, 1.61, and 2.06 are named conditions 1, 2, 3, and 4. The analysis is simplified in conditions 3 and 4 due to their more complete combustion and lower CO volume fraction levels. In the simulation test, the inlet pressure of the cooling water is adjustable and typically set at a value of 0.5 MPa. The relative deviation of component volume fractions generated with the original structure probe (30°) under these four conditions is calculated using the R-K equation iterative algorithm, as presented in Table 5 below.
The table reveals that condition 1 exhibits the highest relative deviation of volume fraction. As the excess air coefficient increases, the CO2 and CO volume fractions decrease, reducing the relative deviation of volume fractions. However, deviations exceeding 5% are still observed. By incorporating the relative deviation mentioned before into Equations (6)–(8), Table 6 presents the corresponding errors in combustion efficiency.
In order to enhance the sampling accuracy of the probe, a simulation test is conducted by adjusting the cooling water pressure. Figure 10 illustrates the correlation between the relative deviation of the component volume fractions and different probe angles under varying cooling water pressures. The preliminary analysis indicates that the sampling accuracy of a low excess air coefficient is generally superior to that of a high excess air coefficient. In the probe structure with an angle of 28°, the sampling accuracy gradually increases with the rise in cooling water pressure, but the rate of increase decreases between 1.75 and 2 MPa. For the probe structures with angles of 30° and 32°, the optimum water pressure for sampling accuracy is 1.75 MPa at a low excess air coefficient (condition 1 and condition 2) and 2 MPa at a high excess air coefficient (condition 3 and condition 4).
It can be observed that, when the excess air coefficient is low or when the cooling water pressure exceeds 1.5 MPa, the relative deviation in sampling for all three structures decreases. This phenomenon can be ascribed to a decline in O2 proportion and an elevation in other gas proportions, especially CO and CO2, at a low excess air coefficient. The temperature throughout the probe gas pipelines consistently stays above 500 K. Notably, within this temperature range, O2 demonstrates considerably lower specific heat capacity than the other constituent gases, increasing the specific heat capacity of the mixture. Consequently, when a cooling system with identical water pressure supplies equivalent heat transfer energy, there is a lesser reduction in gas temperature, leading to an elevation in sampling deviation. Additionally, excessive cooling water pressure induces small eddy currents within the chamber, further diminishing its cooling efficiency and resulting in unnecessary power consumption.
Based on the analysis above, the optimal sampling conditions for each structural probe can be preliminarily determined, and the corresponding lowest relative deviation of volume fractions can be calculated. The specific values are presented in Table 7, Table 8 and Table 9. Among these, it is observed that the probe with a 28° angle exhibits the lowest variation in the component volume fractions, and thus yields the best sampling effect.
When the probe angles are 28° and 32°, the lowest calculation error of combustion efficiency under optimal sampling conditions is obtained, as shown in Table 10 and Table 11 below. The combustion efficiency error of the probe with a 28° angle decreases significantly compared to the original 30° structure.
According to the analysis of the changes in flow field characteristics and component accuracy at the three different angles mentioned above, the following can be concluded:
The 32° probe generates the strongest detached shock wave, leading to a rapid dissipation of the strong shock wave’s kinetic energy into heat energy. This phenomenon prevents the structure from achieving rapid freezing of chemical reactions. In addition, the further increase in the probe angle will increase the strength of the detached shock wave, making rapid freezing of chemical reactions more difficult.
In the 28° probe, the weaker detached shock wave causes the chemical reactions of the structure to freeze more quickly, providing an advantage in sampling accuracy. However, it should be noted that the size of the detached distance reflects the intensity of the chemical reactions to some extent [21]. Amongst the three angle structures, it is observed that the air intake area of the 28° probe structure is comparatively larger, resulting in a larger detached distance as well. Suppose a further reduction in the angle of the probe occurs. In that case, there will be a subsequent increase in the air intake area, leading to an increase in detached distance, consequently intensifying chemical reactions at the entrance of the probe, which may affect component accuracy.

4. Optimization of Probe Structure

4.1. Study of Flow Field Characteristics

One of the aims of this paper is to explore how to eliminate the influence of the sampling accuracy caused by the detached shock wave. In order to avoid the direct detached shock wave, the probe head should be designed with a sharp lip [26]. Due to the constant installation distance of the sampling probe on the test bench, probe optimization has to ensure that the probe length remains unchanged when optimizing the probe to be conical. The optimized probe structure is shown in Figure 11, and the grid division and boundary conditions remain unchanged.
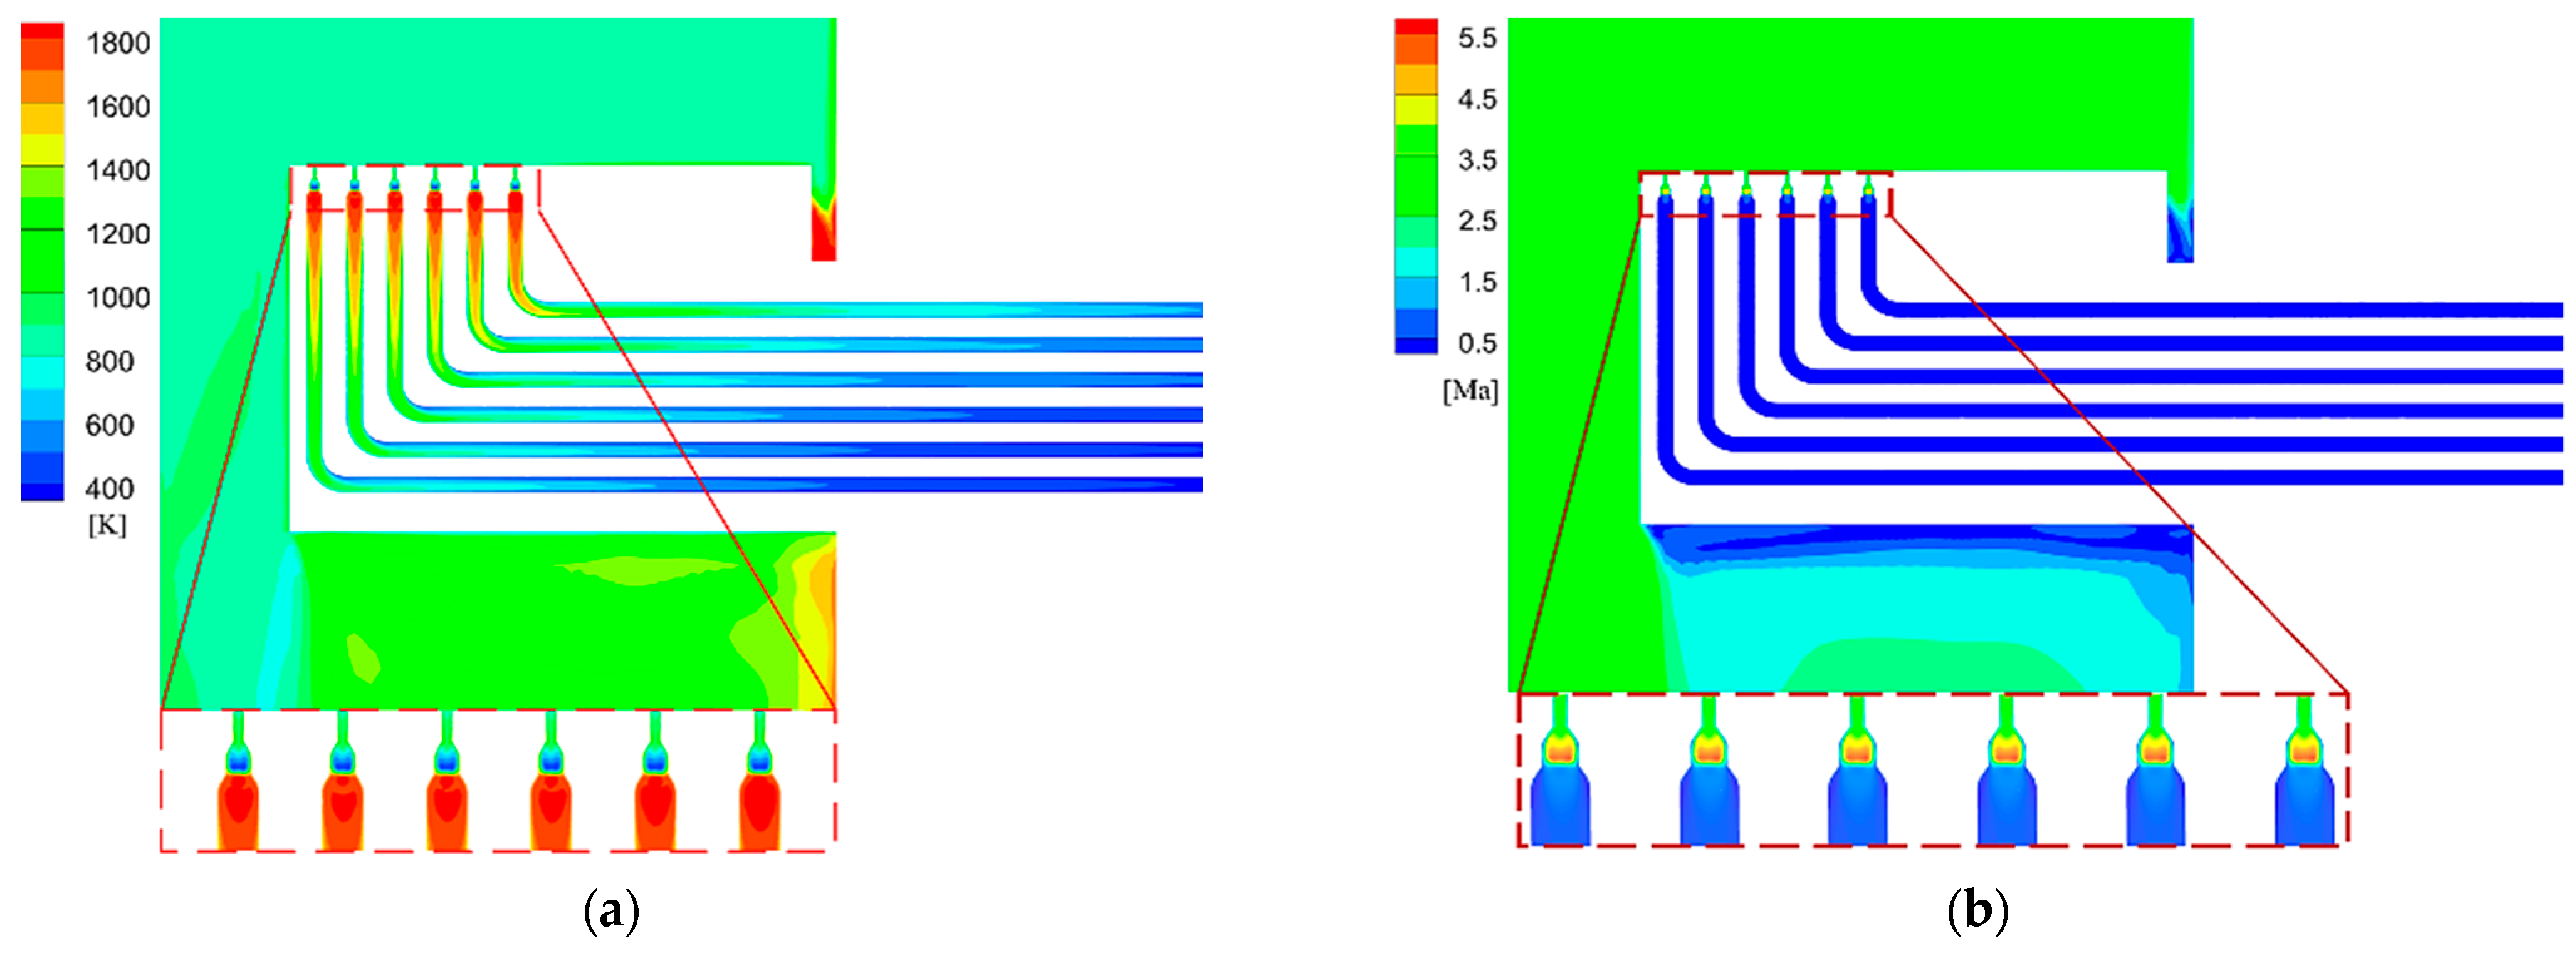
Figure 12 shows the optimized probe’s static temperature and Mach number distribution. Figure 13 compares the probe’s velocity distribution before and after optimization and marks the flow traces.
According to the analysis shown in Figure 13, an attached shock wave appears outside the front end of the optimized probe. Internally, shock waves are absorbed into the runner and interact with each other in the first expansion section [32], and the airflow closely follows the walls. The Mach number of the gas flow exhibits significant variation, and the expansion cooling effect is notably pronounced. The optimization of the expansion channel facilitates comprehensive gas flow expansion. The attached shock wave outside of the optimized probe can be approximated as a detached shock wave with an infinitesimally small detached distance. According to the previous analysis, this tiny detached distance further attenuates chemical reactions and significantly enhances sampling accuracy.
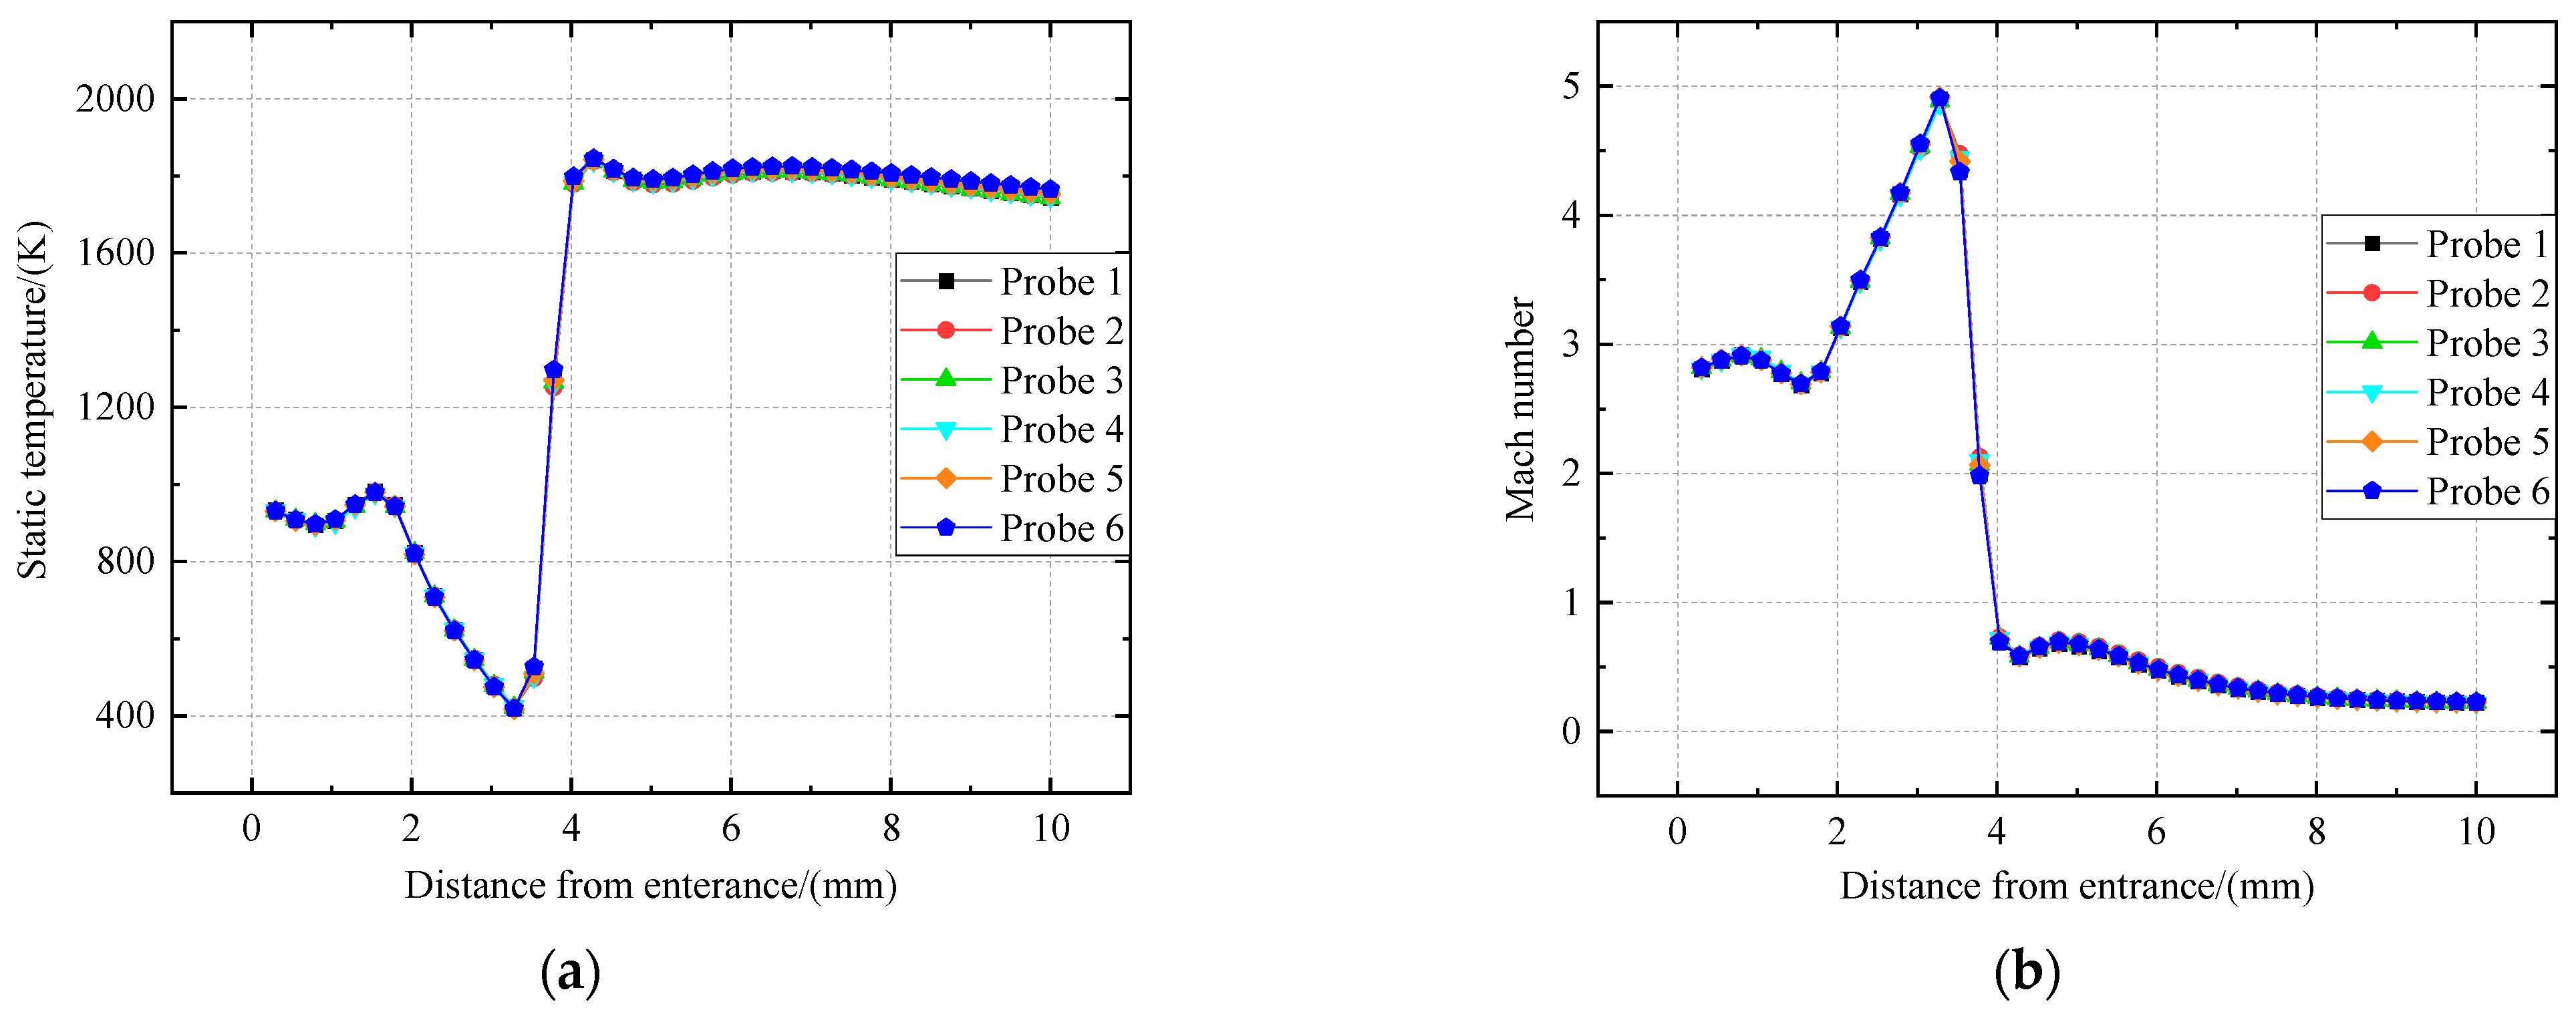
Figure 14 illustrates the relationship between gas static temperature and Mach number in the probe expansion section as distance increases. The six gas channels in the probe expansion section are displayed (Probe 1–6). It is evident that the gas flow at the leading edge of the optimized probe experiences smooth pumping at a velocity close to Mach 3. Upon passing through the expansion wave, there is a sharp increase in Mach number, with high-speed gas flow significantly intensifying the shock wave. Following this strong shock wave compression, there is a rapid decrease in the gas Mach number, reaching subsonic speeds within a short distance and time frame. The static temperature after the expansion wave can reach a minimum of approximately 400 K, demonstrating an excellent expansion cooling effect.

4.2. Study of the Effect of Sampling Accuracy

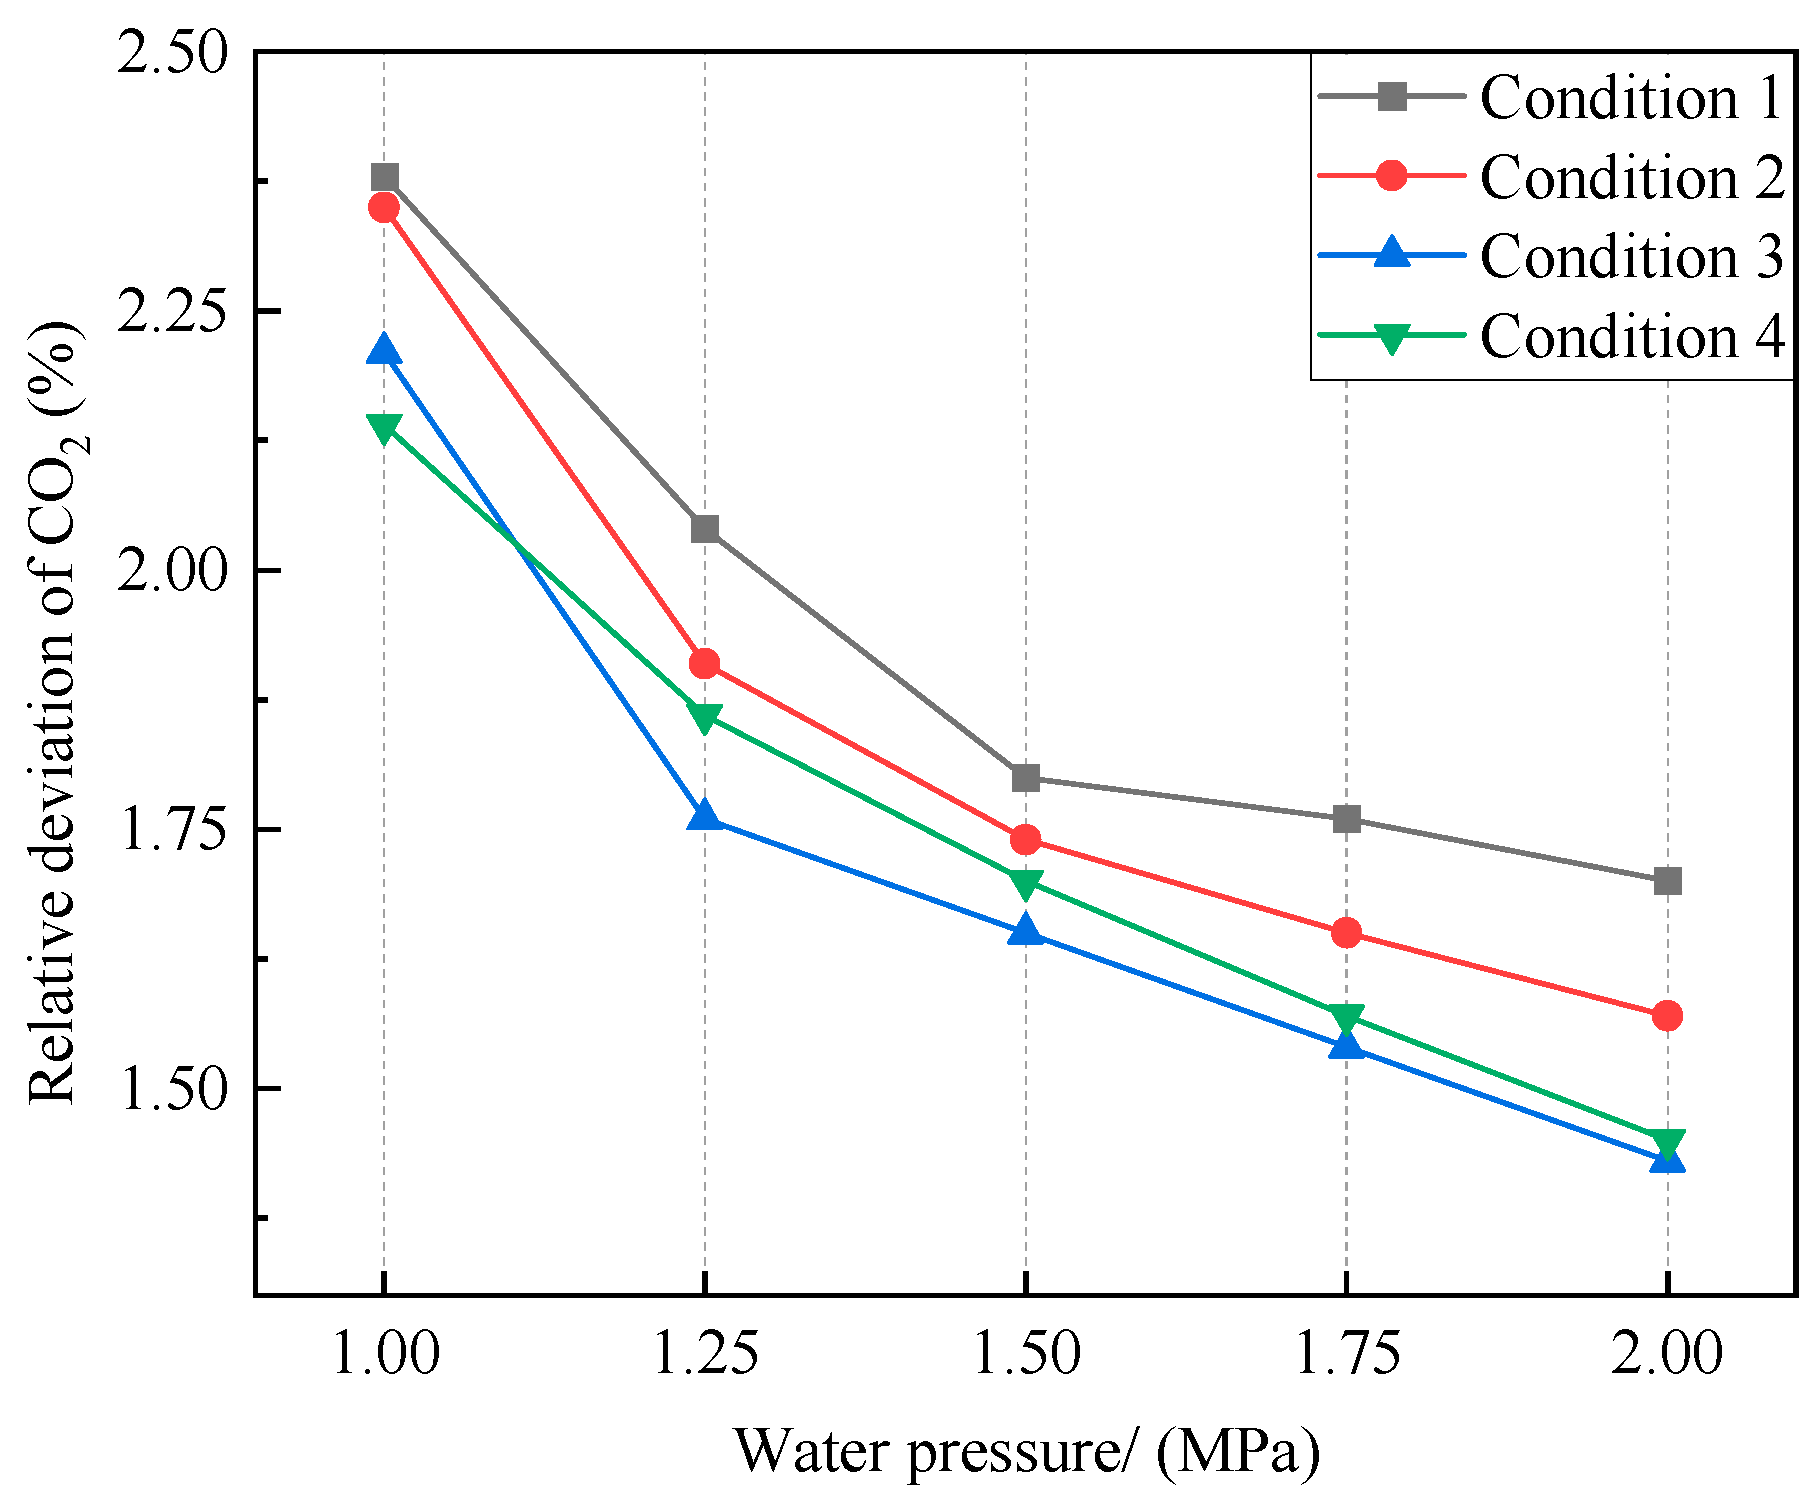
Figure 15 illustrates the variation in the optimized probe’s CO2 sampling relative deviation under different conditions and varying cooling water pressures. The sampling accuracy increases across the four conditions with rising water pressure. However, the rate of accuracy improvement diminishes at water pressures between 1.5 and 2.0 MPa. Consequently, it may be advisable to reduce the water pressure appropriately to minimize power consumption during sampling with the optimized probe.
Table 12 and Table 13 present the relative deviation of volume fractions from sampling with the optimized probe under the actual test condition (0.5 MPa) and the lowest relative deviation of volume fractions resulting from sampling under optimal water pressure (2 MPa). Upon comparison with Table 5 and Table 8, it is evident that the relative deviation of the volume fraction generated by the optimized probe is consistently lower than that of the original structure, regardless of whether the working water pressure of 0.5 MPa or the optimal water pressure is utilized.
Formulas (6)–(8) are utilized to compute the calculation error of combustion efficiency caused by the optimized probe under a working water pressure of 0.5 MPa and optimal water pressure, as presented in Table 14 and Table 15 below. Upon comparison with Table 6, Table 10, and Table 11, it is evident that the optimized probe’s calculation error of combustion efficiency has been significantly mitigated.

4.3. Comparative Analysis before and after Structural Optimization

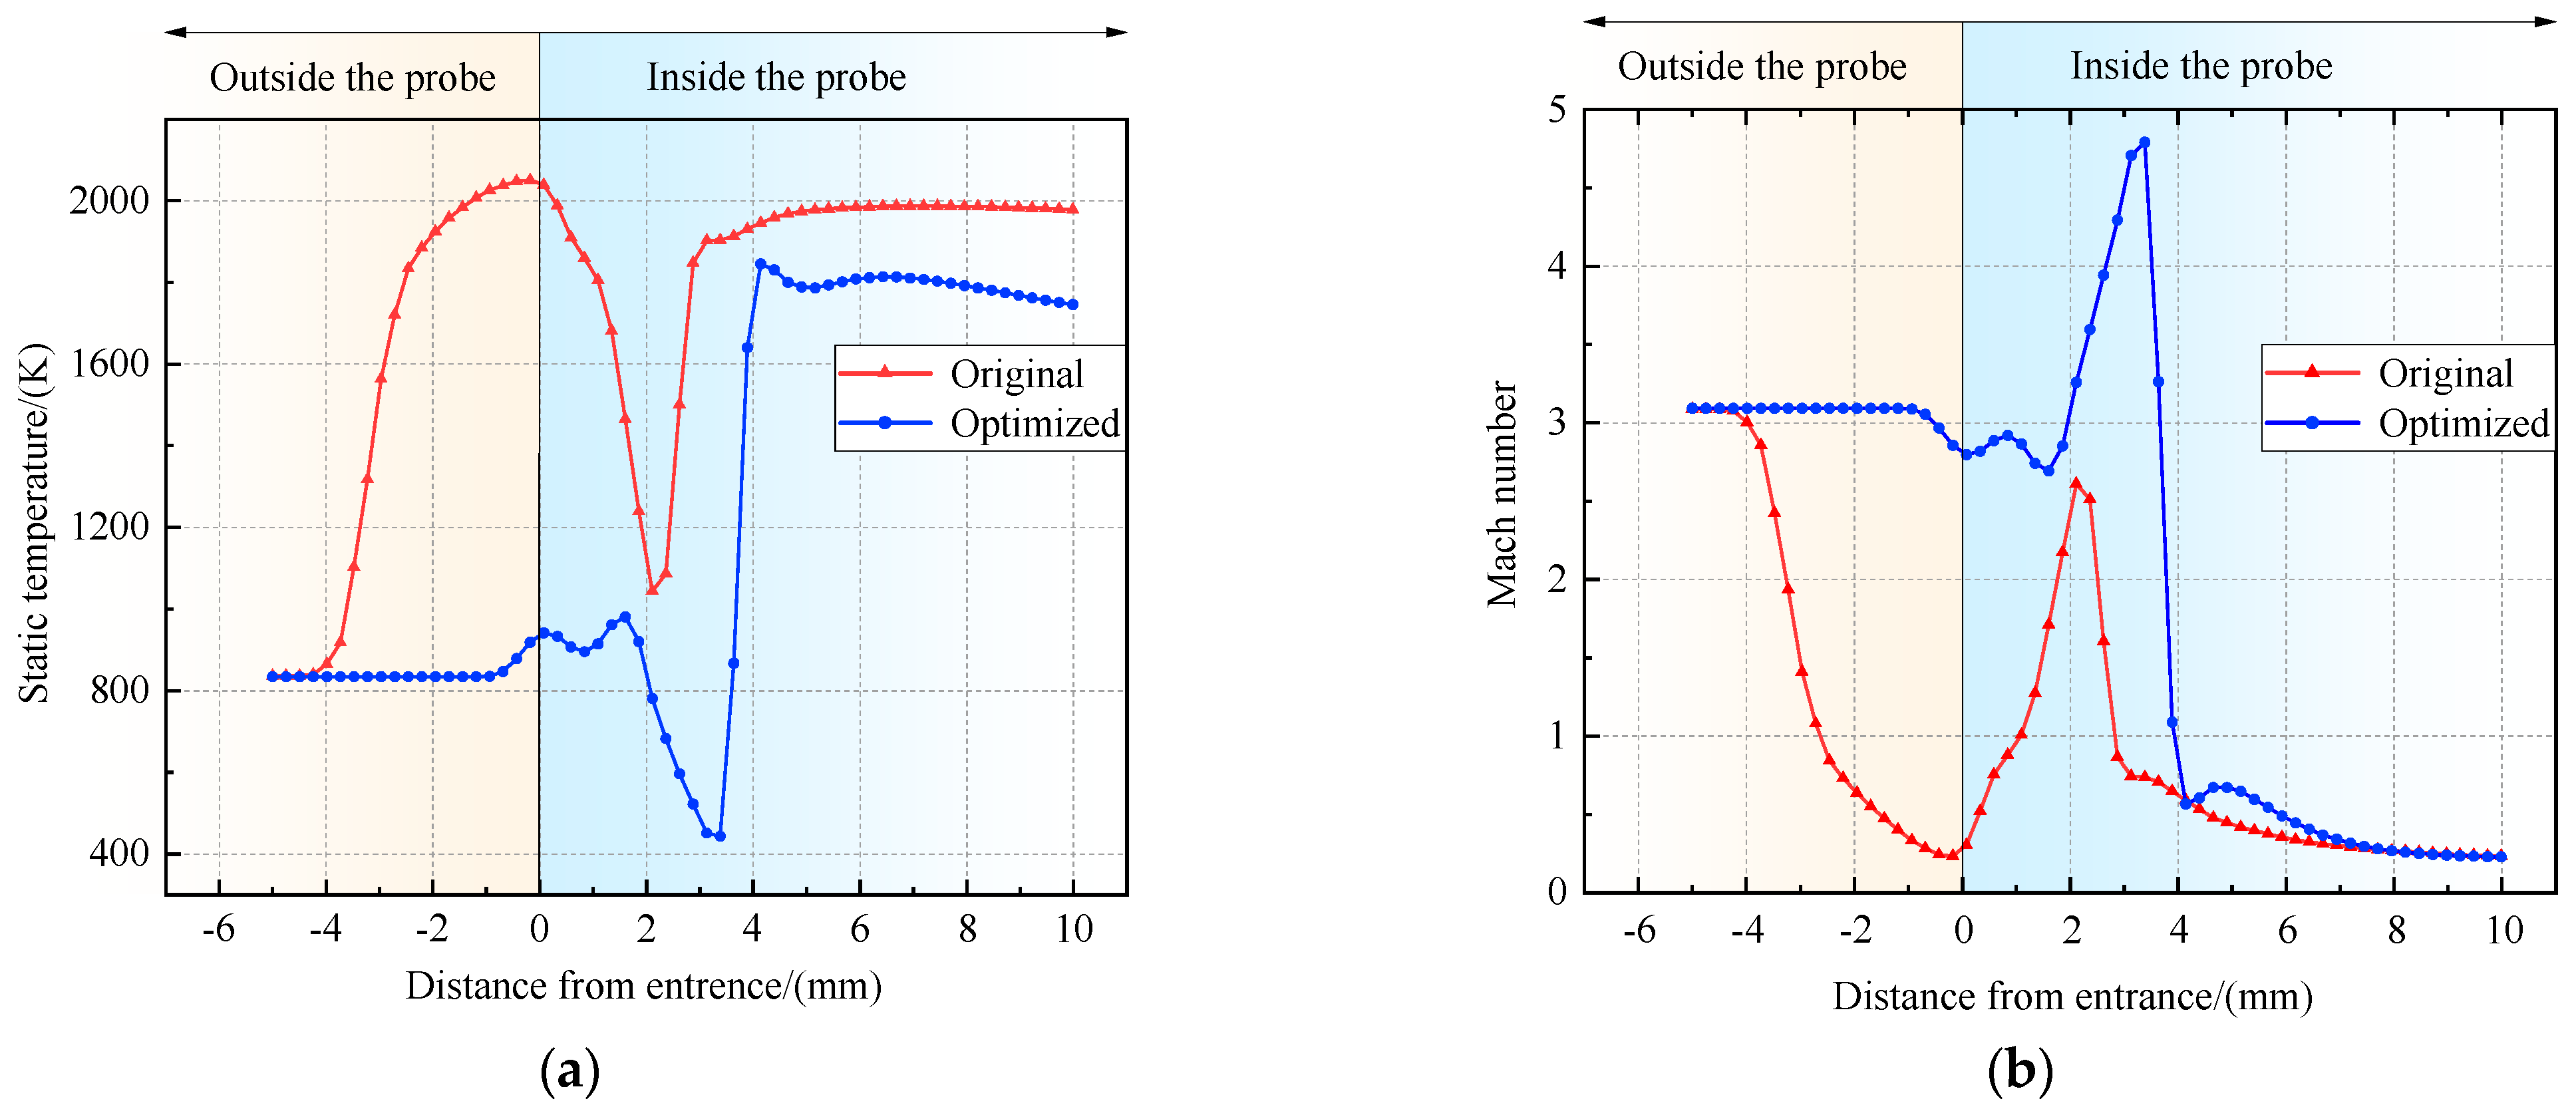
Figure 16 illustrates the variation in gas static temperature and Mach number at the probe head position between the optimized probe and the original structure probe.
Figure 16 indicates that the gas undergoes expansion and compression upon entering the probe. However, it is observed that the gas expansion is more thorough in the optimized probe, leading to a better chemical reaction freezing effect. The Mach number of the optimized gas flow at entry into the probe is higher, resulting in a stronger expansion wave and shock wave generated at the expansion channel and larger corresponding changes in flow parameters. Both structures experience compression before reaching the secondary expansion section, causing a reduction in gas velocity to subsonic levels or below. However, the overall static temperature of optimized gas remains lower. At the same time, there is almost no disturbance in the gas flow outside of the optimized probe, resulting in negligible fluctuations in airflow parameters.
At a high Mach number, the resistance of the shock wave contributes significantly to the total resistance [33]. Shock waves impede the flow of air, which is detrimental to gas pumping into the probe. Additionally, the high-temperature environment makes the probe more susceptible to ablation. The generation of the detached shock wave causes significant changes in the gas flow parameters and hinders the freezing of chemical reactions in the gas flow.
Based on the comparative analysis above, the optimized probe is more suitable for a supersonic sampling environment.

5. Experimental Verification

5.1. Test Brief

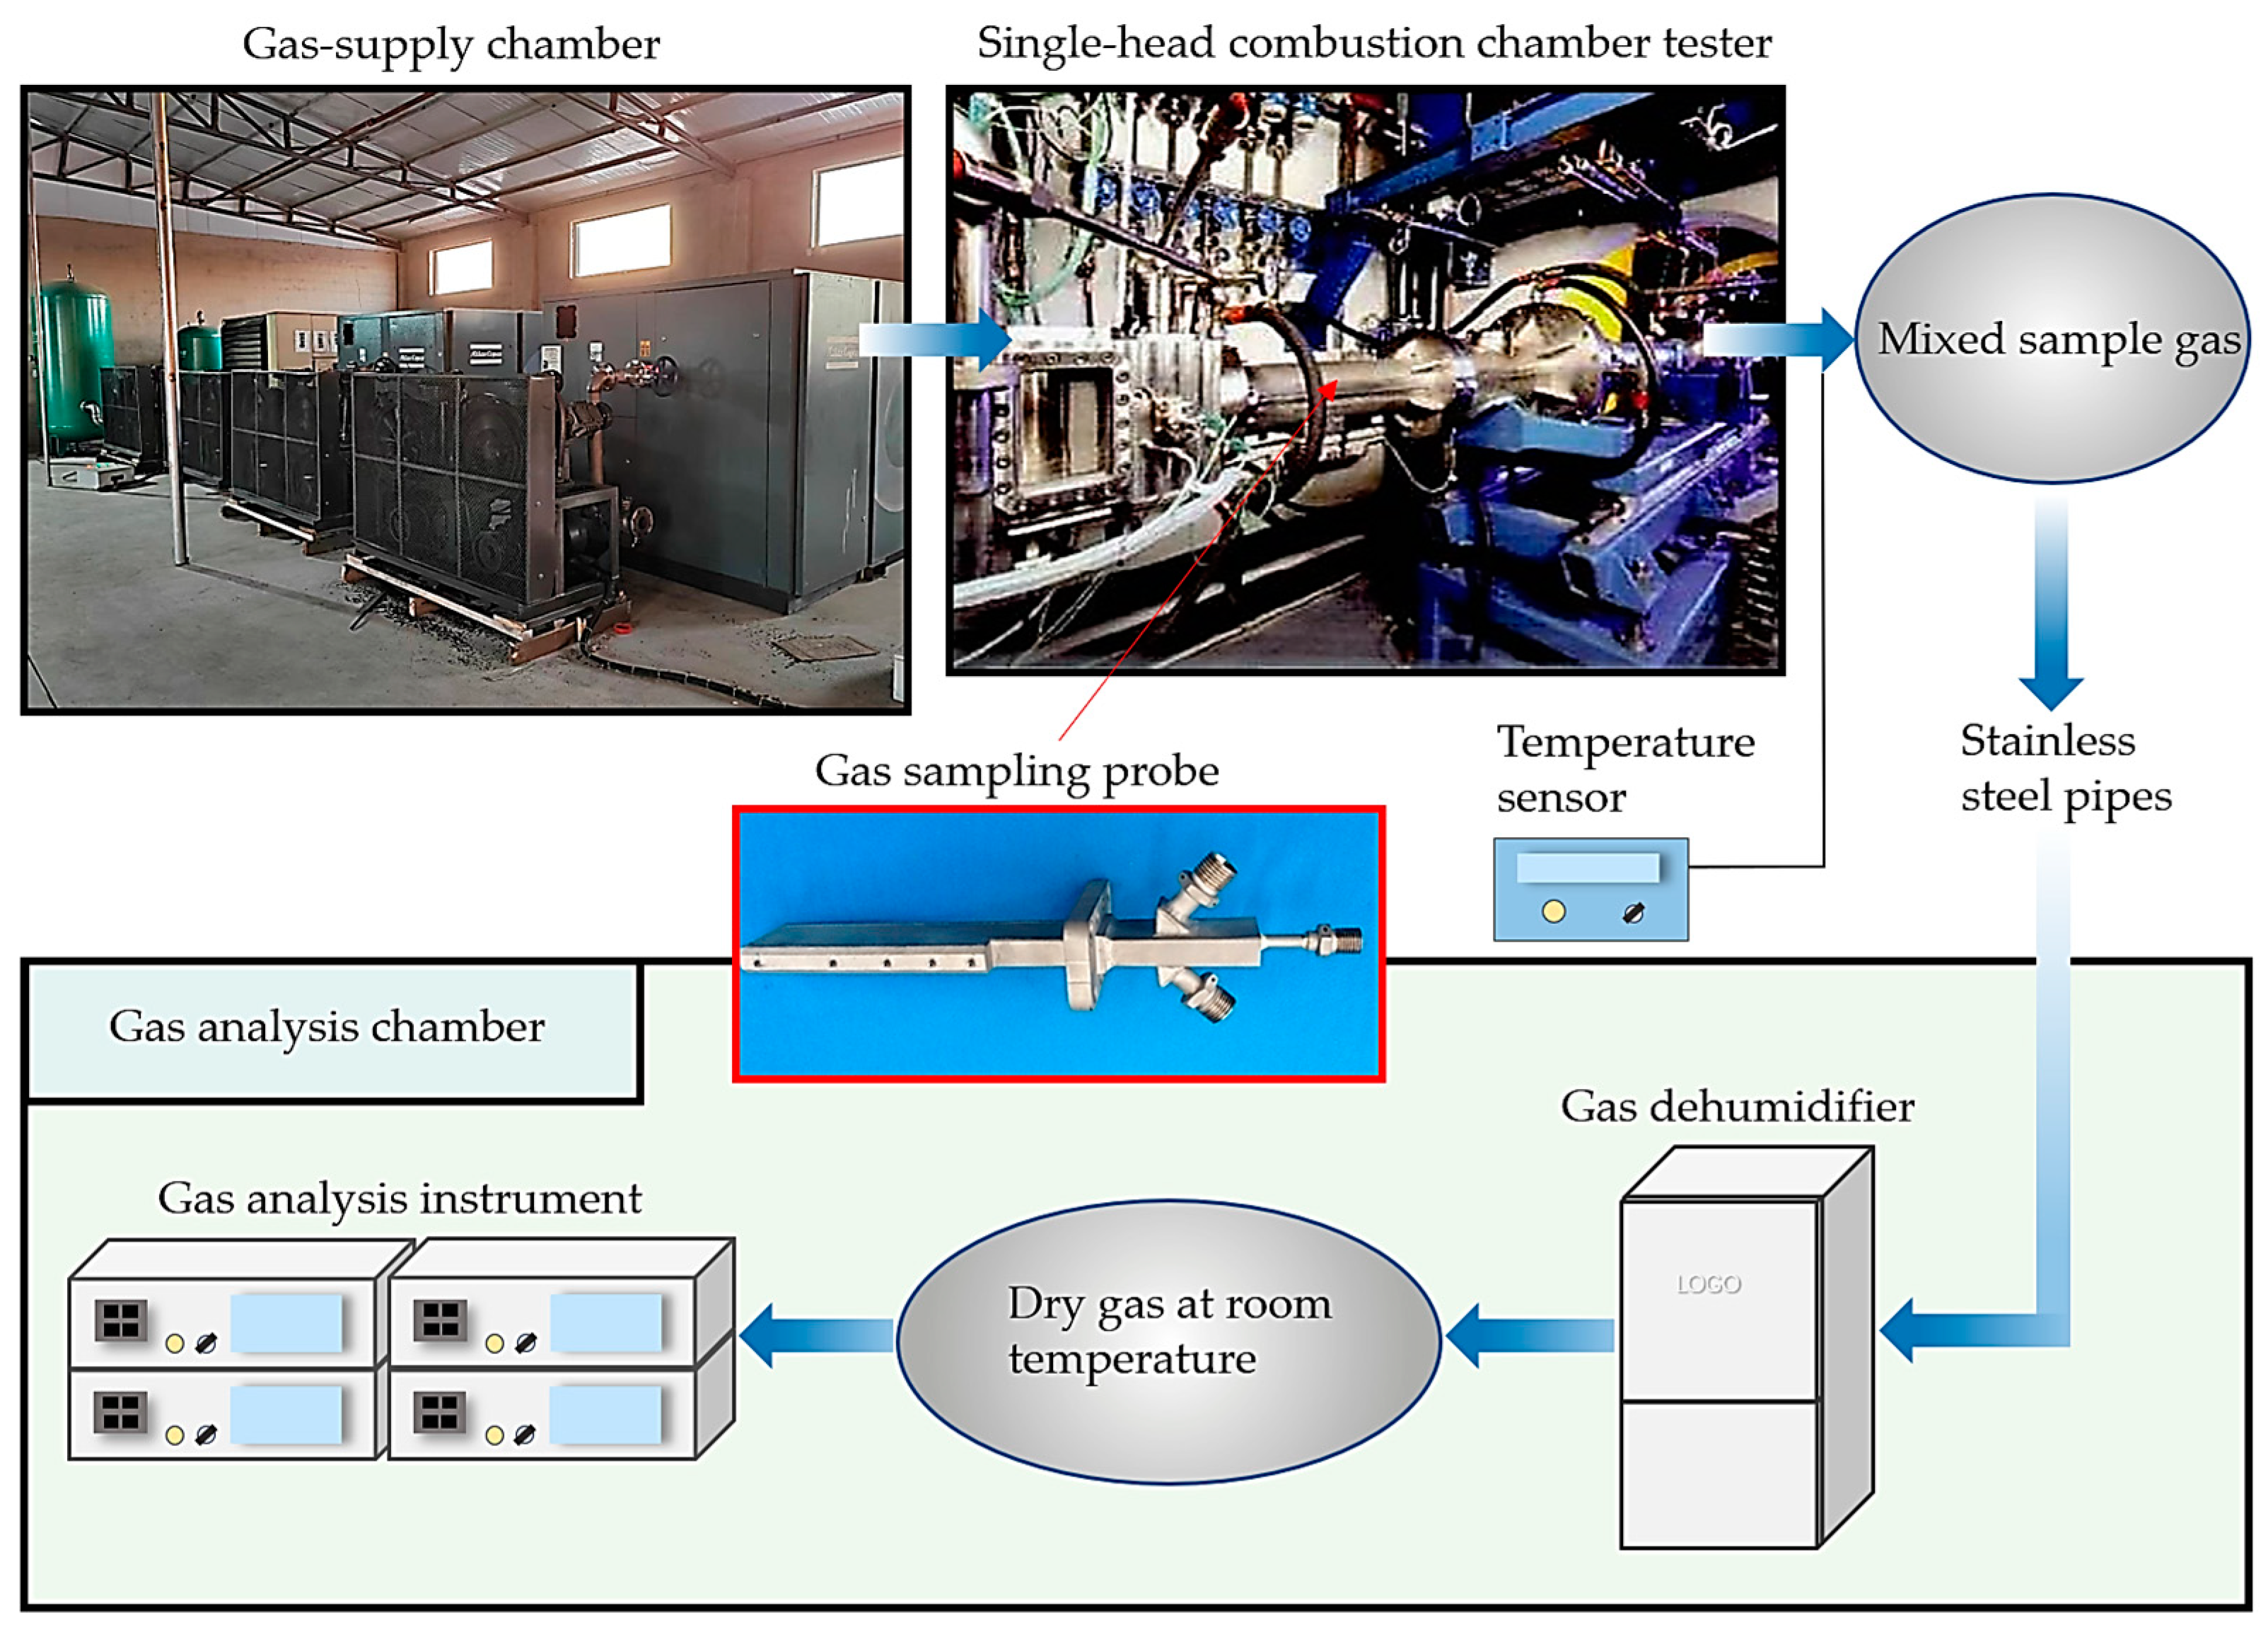
Figure 17 presents the overall test operation process. The gas-supply chamber supplies the gas to imitate the outlet of the combustion chamber. Approximately 2–5 probes are installed and fixed at the combustion chamber outlet, and the inlet end of the probes should be directly oriented toward the direction of the incoming gas flow. Once the gas flow becomes stable, suction sampling is conducted. The extracted gases are mixed and dispersed into 10–15 stainless steel pipes with a length of 15–20 m to guarantee the continuous cooling of the gas. For the CO2 and CO lines, it is necessary to introduce a gas dehumidifier to precipitate water. The gas will drop to a normal temperature before entering the gas analysis instrument. Generally, the primary determination of the content of CO2 and CO components can achieve the values of gas temperature, oil–gas ratio, flue gas, and others.
In the test, the cooling water pressure of the sampling probe is set at 0.5 MPa, and several groups of temperature sensor measurement points are arranged at the probe’s sampling gas outlet. After the gas flow is stabilized, the sampling probe starts to operate, and the gas flow stability time is usually less than 3 min. A total of five groups of tests have been configured.

5.2. Contrast Verification

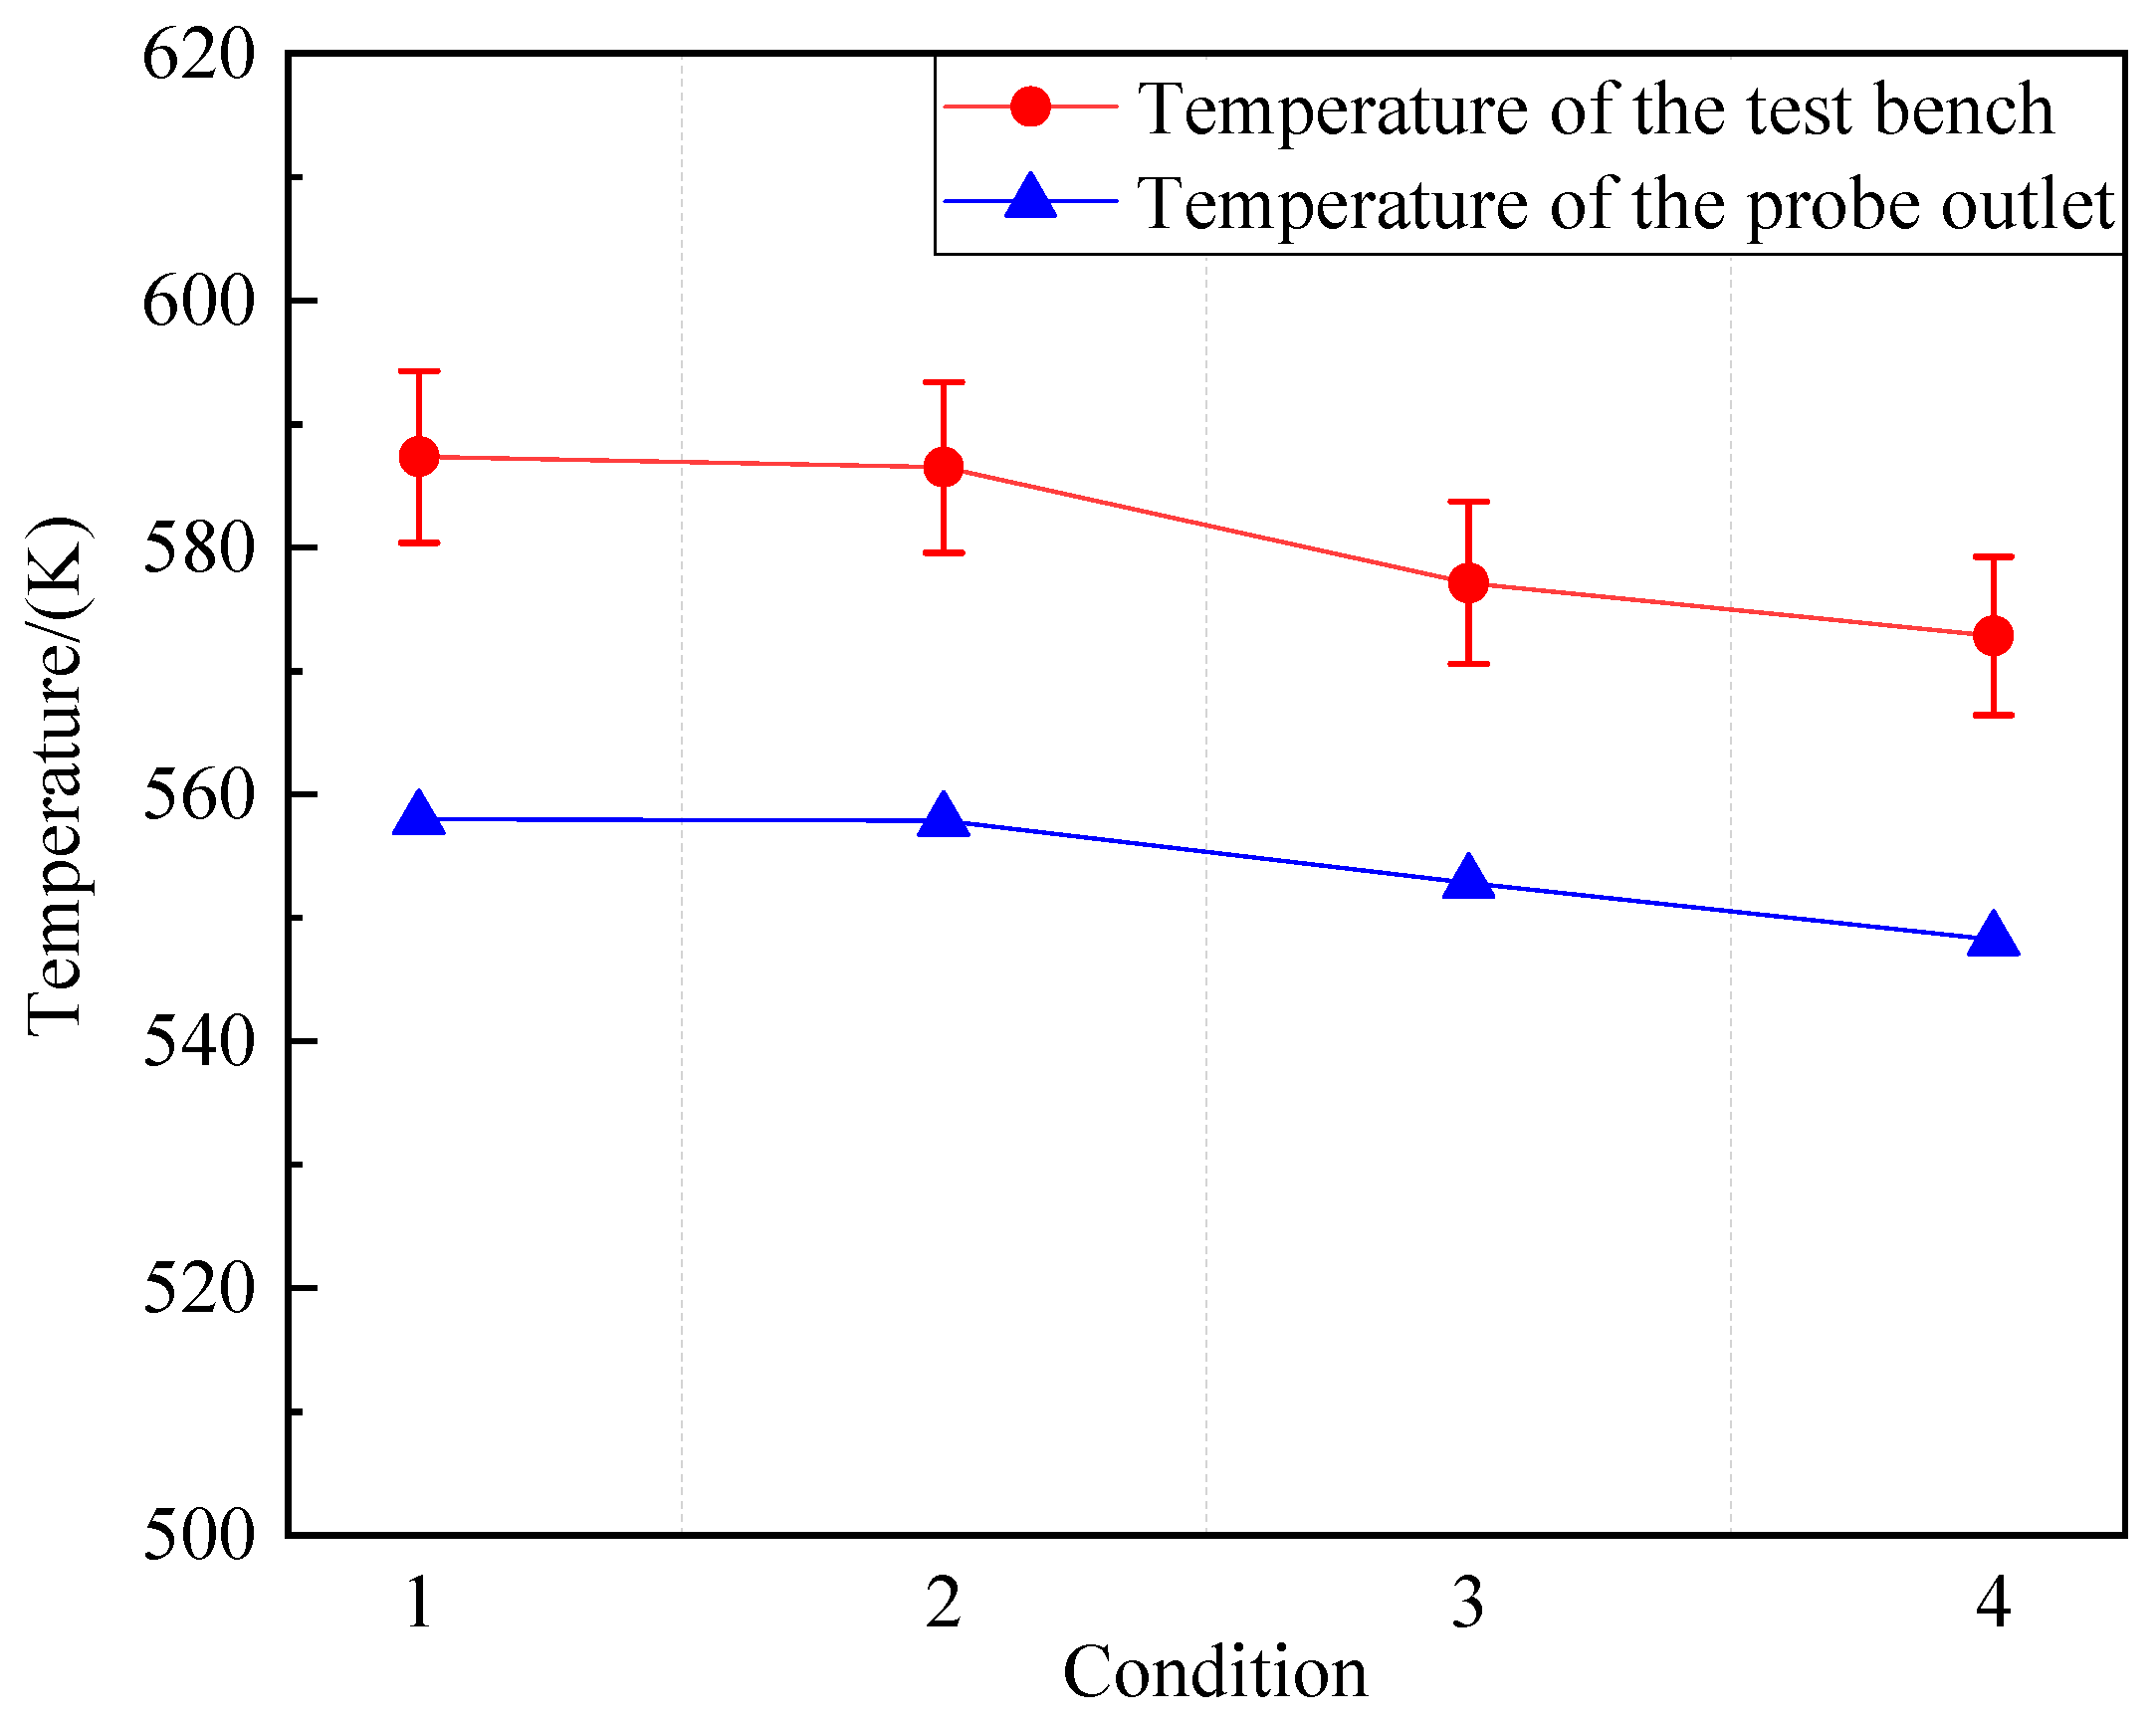
The proportion of CO2 increases when the excess air coefficient is low. Additionally, due to incomplete combustion, the concentration of CO and NOx pollutants increases. The determination of UHC (unburnt hydrocarbon) concentration is unstable, but its content remains low and can be disregarded. Table 16 presents the concentration parameters of each gas component at the combustor outlet under different excess air coefficients and the temperature at the outlet measuring points of the mixed sample gas, namely, the temperature of the test bench.
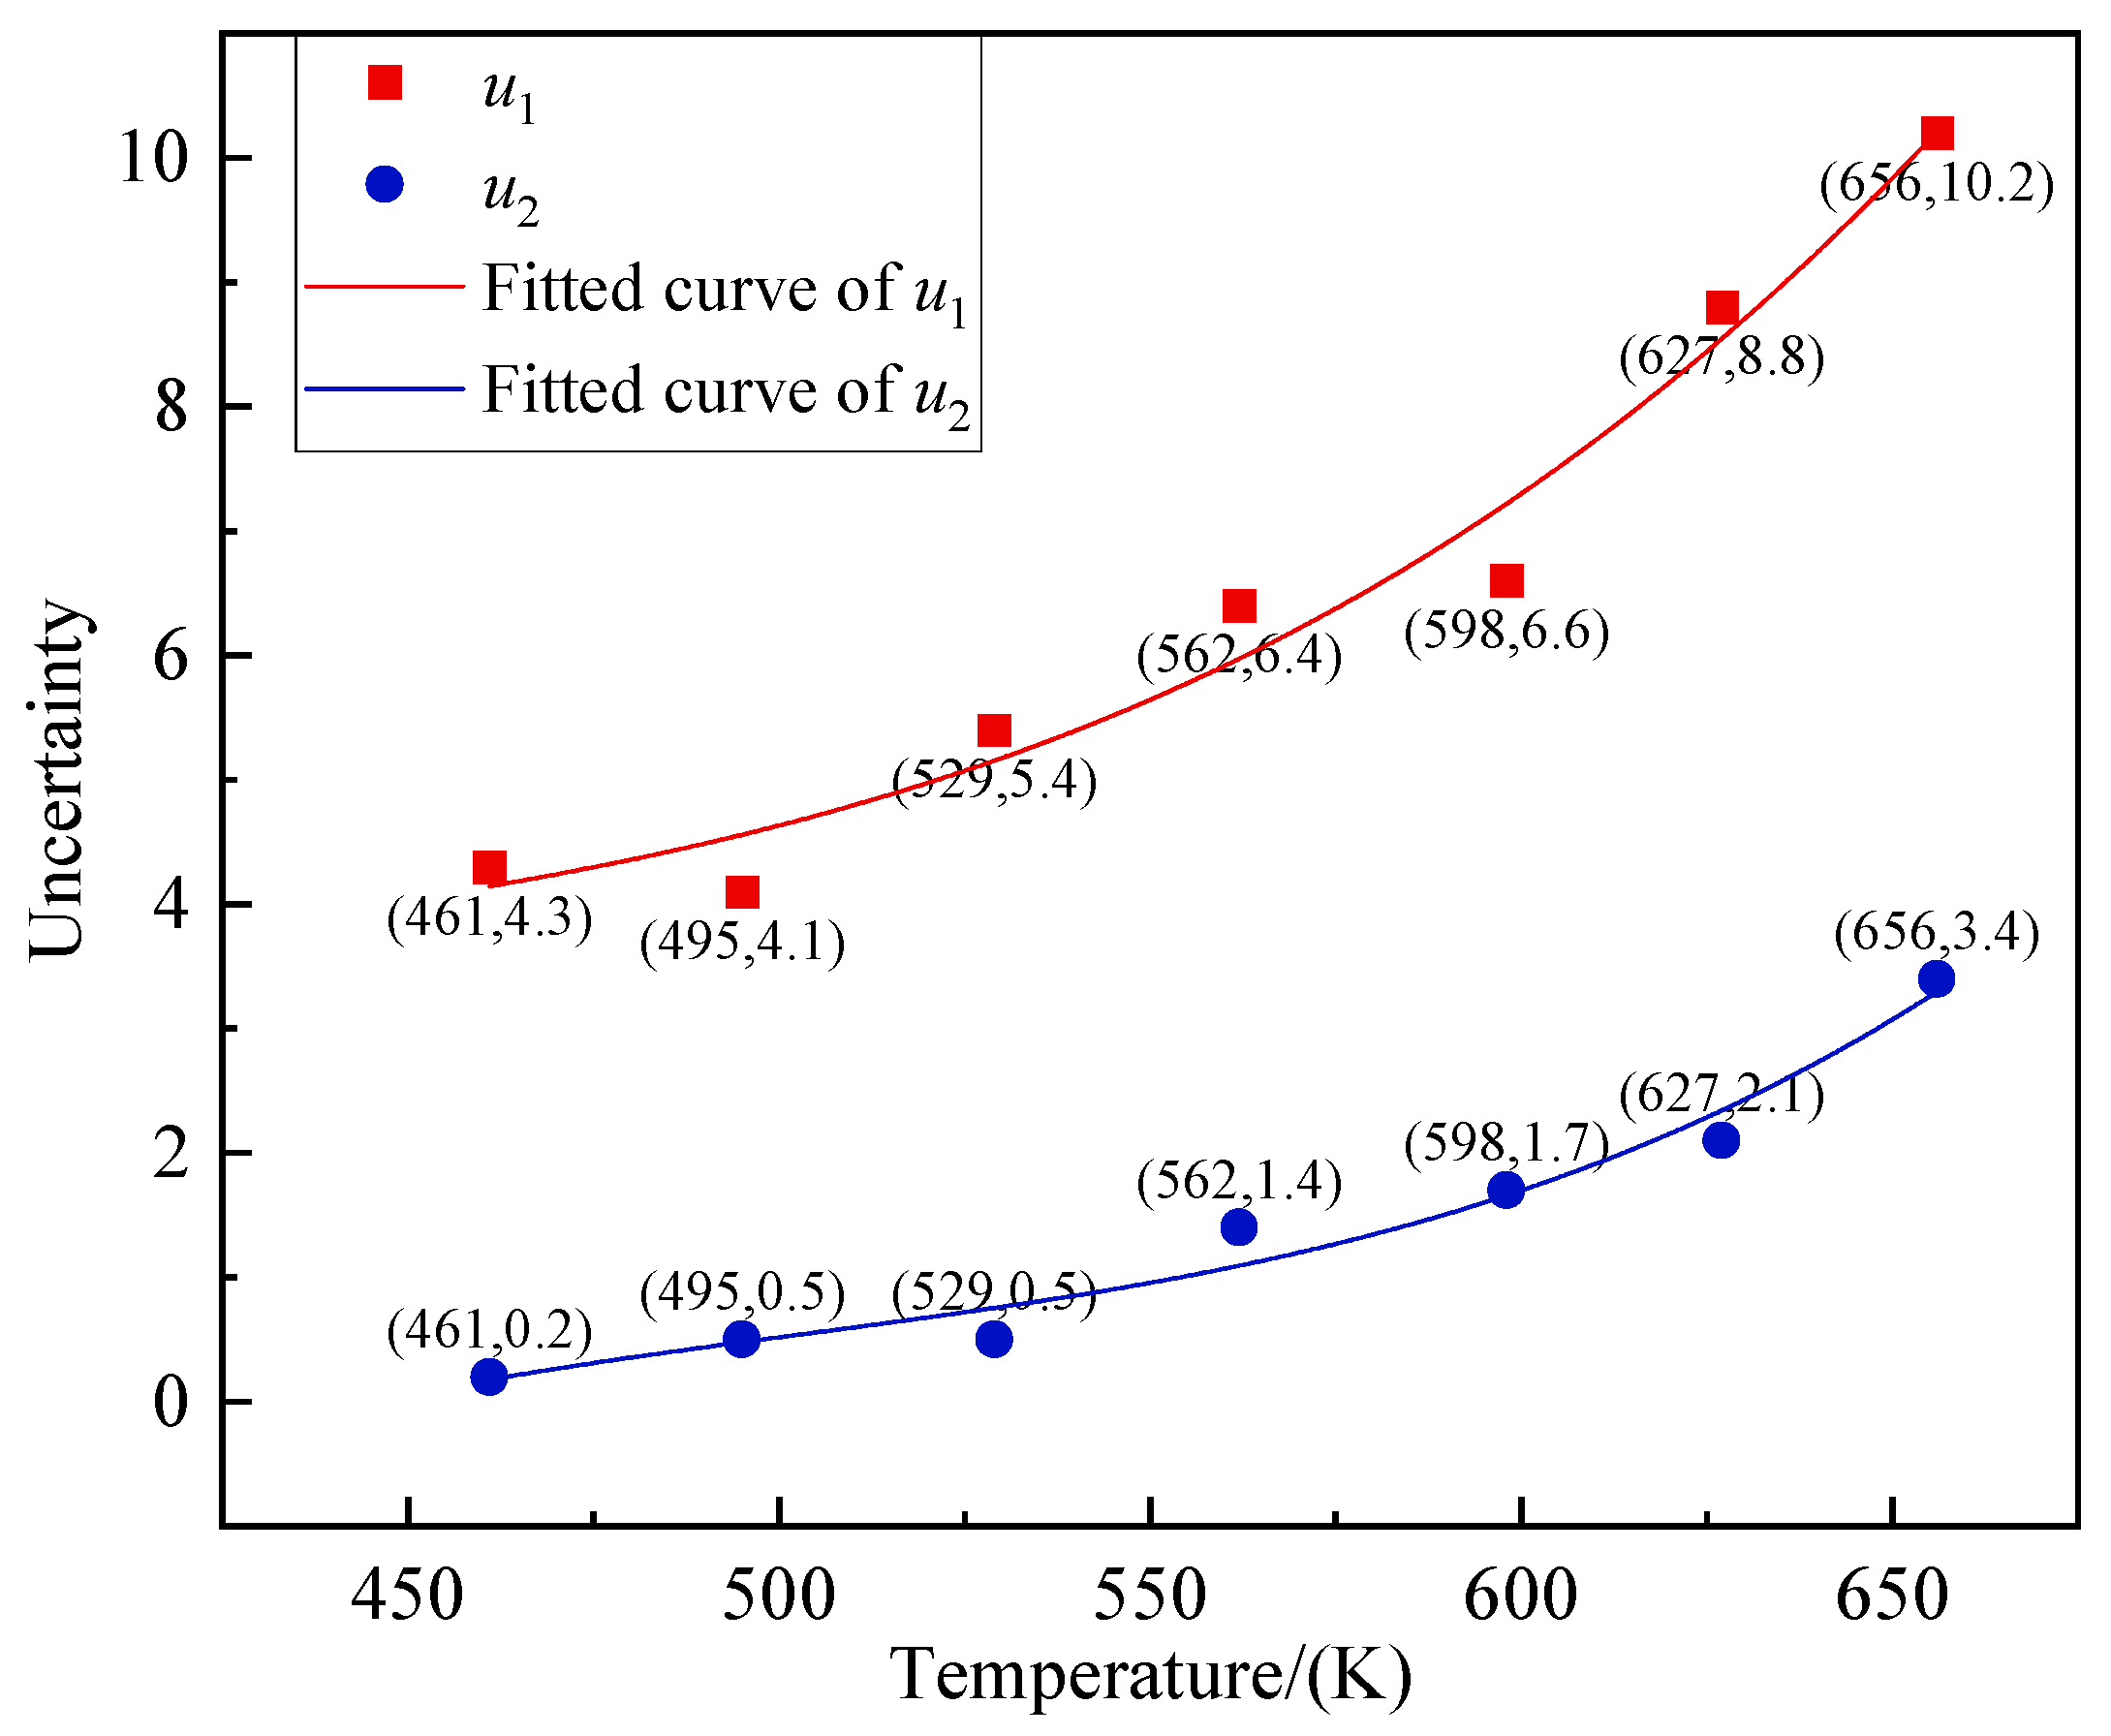
The uncertainty of this test is calculated following the type A standard. The uncertainty of the temperature measurement is evaluated. It mainly includes the following factors: the uncertainty of the temperature sensors (u1), the uncertainty of repetitive measurements (u2), and the uncertainty of the data acquisition system (u3). Based on the test reports and statistical calculations, the variation tendency of u1 and u2 with the temperature of the measuring points is shown in Figure 18.
The data acquisition system utilizes the American NI 16-bit multi-function PCI data acquisition cards. When operating under temperature measurement conditions below 2000 K, the full-scale error does not exceed 0.02 K, which is significantly small and can be considered negligible compared to the temperature fluctuations within the engine combustion chamber. The combined standard uncertainty (uc) can be calculated as follows:
u c = u 1 2 + u 2 2 + u 3 2
By bringing the five groups of measured point temperatures in Table 16 into the fitted curve equations of uncertainty in Figure 18, the uncertainty corresponding to the measured point temperatures in the five groups of tests can be acquired. Subsequently, the combined standard uncertainty is computed through Equation (11). The specific values are shown in Table 17.
After screening, the test data with an excess air coefficient in the range of 1.14–2.06 are selected for simulation testing. The pressure of the cooling water remains constant at 0.5 MPa. The results of the simulation test data and the temperature deviation from the test bench are presented in Table 18.
The temperature of the probe outlet is compared with the temperature of the test bench, and the corresponding combined standard uncertainty is presented in error bars, as depicted in Figure 19. The findings indicate that the overall discrepancy between the experimental results and the simulation data is less than 5%. Considering potential chemical reactions, the results obtained through simulation can be deemed reliable.

6. Conclusions

  • This paper establishes a set of calculation methods for solving the relative deviation of volume fraction using an iterative method based on the ideal gas law and the R-K equation. This method can significantly reduce the theoretical calculation error of component volume fractions to less than 0.06%. It also ensures the accuracy of the subsequent calculation error of combustion efficiency.
  • The sampling accuracy of the probe with angles of 28°, 30°, and 32°, and the conical probe is compared and evaluated by the deviation of the component volume fractions before and after sampling and the resulting combustion efficiency error. The probe with a 28° angle and the conical probe improve the sampling accuracy more effectively than the original 30° structure. The deviation of the volume fractions of the two structures is less than 1.7%, and the combustion efficiency error is less than 0.09%.
  • In a probe with a blunt front end, the intensity of the detached shock wave is enhanced, and the detached distance is reduced as the intake angle of the probe increases. Conversely, as the intake angle of the probe decreases, the intensity of the detached shock wave decreases and the detached distance increases. However, it should be noted that the high intensity and long detached distance of the detached shock wave can lead to a reduced sampling accuracy of the probe.
This paper presents a novel idea for the subsequent analysis of the probe flow field and accurate components calculation. It also provides the necessary data for the subsequent research on the probe angle. In future work, the influence law of the attached shock wave and the overall structure of the probe on the component accuracy will be considered in order to improve further the probe’s gas cooling effect and sampling accuracy.

Author Contributions

Conceptualization, W.Z.; methodology, W.Z., Y.C. and Y.A.; software, W.Z. and P.S.; writing—original draft preparation, W.Z. and Y.C.; writing—review and editing, W.Z. and X.Y. All authors have read and agreed to the published version of the manuscript.

Funding

This research was funded by the National Defense Technology Industry Innovation Foundation of China, grant number JJ202170301.

Data Availability Statement

Data are contained within the article.

Conflicts of Interest

Author Pengpeng Sha was employed by the company AECC Sichuan Gas Turbine Establishment. The remaining authors declare that the research was conducted in the absence of any commercial or financial relationships that could be construed as a potential conflict of interest.

Nomenclature

R-K equationRedlich–Kwong equation
NASANational Aeronautics and Space Administration
CFDComputational fluid dynamics
UHCUnburnt hydrocarbon
VVolume
PPressure
TTemperature
RGas constant
VmMolar Volume
a, b, ωa, ωbGas relevant constant
TcCritical temperature
PcCritical pressure
φ Volume fraction
Δ φ CO 2 , Δ φ CO Relative deviation of the volume fraction
Δ η CO 2 , Δ η CO Influence on combustion efficiency
ΔδOverall combustion efficiency impact
KAdiabatic index
βShock angle

References

  1. Shan, X.M.; Gao, Q.; Wei, X.L. Test and Measurement Technology for Aero Engines. Aerosp. Power 2022, 3, 67–70. [Google Scholar]
  2. Ju, H.Y.; Liang, H.X.; Suo, J.Q.; Sun, F.J. Pollution emission characteristics of hydrogen-fueled combustor of an aero-engine conversion gas turbine. J. Propul. Technol. 2024, 45, 199–211. [Google Scholar]
  3. Qiao, Q.B.; Fang, C.Y.; Mu, Y.; Liu, F.Q.; Liu, C.X.; Xu, G. Numerical Analysis and Experiment Research on Flow Field of a Micro-gas Turbine Combustor. Gas Turbine Technol. 2021, 34, 28–32. [Google Scholar]
  4. Williamson, R.; Stanforth, C. Measurement of Jet Engine Combustion Temperature by the Use of Thermocouples and Gas Analysis; SAE Technical Paper 690433; SAE International: Warrendale, PA, USA, 1969. [Google Scholar]
  5. Bideau, R.J. The Development of a Computer Code for the Estimation of Combustor Exhaust Temperature Using Simple Gas Analysis Measurements. J. Eng. Gas Turbine Power 1999, 121, 80–88. [Google Scholar] [CrossRef]
  6. HB 6117; Method for the Continuous Sampling and Measurement of Gaseous Emissions from Aircraft Gasturbine Engines. Ministry of Aviation Industry of the People’s Republic of China: Beijing, China, 1987.
  7. Sevcenco, Y.A.; Crayford, A.P.; Marsh, R.; Bowen, P.J.; Miller, M.N.; Johnson, M.P. Evaluation of a Particulate Sampling Methodology from a Gas Turbine Exhaust Using Real-Time Size and Number Analysis at Simulated Aircraft Conditions. In Proceedings of the ASME Turbo Expo 2010: Power for Land, Sea, and Air, Glasgow, UK, 14–18 June 2010. [Google Scholar]
  8. Mutschler, R.; Luo, W.; Moioli, E.; Züttel, A. Fast real time and quantitative gas analysis method for the investigation of the CO2 reduction reaction mechanism. Rev. Sci. Instrum. 2018, 89, 114102. [Google Scholar] [CrossRef]
  9. ISO ARP1256D; Procedure of the Continuous Sampling and Measurement of Gaseous Emissions from Aircraft Turbine Engines. ISO: Geneva, Switzerland, 2011.
  10. ISO ARP1533C; Procedure for the Analysis and Evaluation of Gaseous Emissions from Aircraft Engines. ISO: Geneva, Switzerland, 2016.
  11. Zhong, H.G.; Ji, H.H.; Li, J.B. Methods for Gas Temperature Measurement by Gas Analysis. J. Aerosp. Power 2005, 20, 460–466. [Google Scholar]
  12. Li, P.; Yan, C.F.; Zeng, L.K.; Cheng, X.S.; Mai, Z.H. Design of Combustion Calculation and Analysis System. Ind. Furn. 2012, 34, 37–40. [Google Scholar]
  13. Wang, M.R.; Xiao, Y.; Han, B.; Jia, L.Y. Gas analysis test and calculation method of aeroengine. J. Aerosp. Power 2015, 30, 2568–2574. [Google Scholar]
  14. Wang, M.R.; Xiao, Y.; Han, B.; Li, Y.J.; Jia, L.Y. Temperature field test for aeroengine combustor with five nozzles based on gas analysis. J. Aerosp. Power 2016, 31, 2049–2054. [Google Scholar]
  15. Colket, M.B.; Chiappetta, L.; Guile, R.N.; Zabielski, M.F.; Seery, D.J. Internal aerodynamics of gas sampling probes. Combust. Flame 1982, 44, 3–14. [Google Scholar] [CrossRef]
  16. Chiappetta, L.; Colket, M.B. Design considerations for aerodynamically quenching gas sampling probes. J. Heat Transf. 1984, 106, 460–466. [Google Scholar] [CrossRef]
  17. Mitani, T. Quenching of reaction in gas-sampling probes to measure scramjet engine performance. Symp. Int. Combust. 1996, 26, 2917–2924. [Google Scholar] [CrossRef]
  18. Mitani, T.; Takahashi, M.; Tomioka, S.; Hiraiwa, T.; Tani, K. In Proceedings of the 8th AIAA International Space Planes and Hypersonic Systems and Technologies Conference, Norfolk, VA, USA, 27–30 April 1998.
  19. Mitani, T.; Chinzei, N.; Masuya, G. Mach 2.5 experiments of reaction quenching in gas sampling for scramjet engines. Symp. Int. Combust. 1998, 27, 2151–2156. [Google Scholar] [CrossRef]
  20. Mitani, T.; Takahashi, M.; Tomioka, S.; Hiraiwa, T.; Tani, K. Analyses and Application of Gas Sampling to Scramjet Engine Testing. J. Propul. Power 1999, 15, 572–577. [Google Scholar] [CrossRef]
  21. Lin, R.; Chen, L.H.; Zhang, X.Y. Analysis and application of gas sampling in the direct-connect supersonic combustor testing. J. Exp. Fluid Mech. 2006, 1, 67–71. [Google Scholar]
  22. Li, F.; Bi, L.; Peng, L.Q.; He, Y.J.; Sun, B.G.; Cheng, M.; Liu, W.; Liu, X.Y. The Design of Combustion Efficiency Sampling-Probe in Scramjet Engine. J. Jishou Univ. 2006, 27, 43–45. [Google Scholar]
  23. Zheng, B.K.; Chen, L.H.; Lin, R.; Zhang, X.Y. Gas sampling & analysis in the high enthalpy flow. J. Aerosp. Power 2006, 21, 967–971. [Google Scholar]
  24. Zhang, Y. Analyses and Design of Gas Sampling System to the Direct-Connect Supersonic Combustor Testing. Master’s Thesis, Shanghai Jiao Tong University, Shanghai, China, 2013. [Google Scholar]
  25. Zhang, J.; Zhu, T.; Wang, J.; Meng, Z.M.; Feng, D.Q. Design and verification of intermittent gas sampling system. Gas Turbine Exp. Res. 2020, 33, 47–53. [Google Scholar]
  26. Liu, H.K.; Zhang, J.; Feng, D.Q.; Liu, C.Y.; Meng, Z.M. Design and experimental verification of gas sampling probe for scramjet engine. Gas Turbine Exp. Res. 2018, 31, 57–62. [Google Scholar]
  27. Liu, C.Y.; Qi, D.D.; Feng, D.Q.; Song, W.Y. Zhang, J. Design and verification of gas sampling probe for afterburner test. J. Propul. Technol. 2023, 44, 138–148. [Google Scholar]
  28. Hoque, M.A.; Mallik, M.S.; Hossain, M.S.; Gope, R.C.; Uddin, M.A. Large eddy simulation of a turbulent channel flow using dynamic Smagorinsky subgrid scale model and differential equation wall model. Int. J. Thermofluids 2024, 22, 100676. [Google Scholar] [CrossRef]
  29. Shen, S.; Zhu, L.; Liu, J.; Liu, X.; Zhao, W.; Wang, Y. Study on the liquid–liquid phase separation phenomenon of iohexol in a binary mixed solvent of methanol and n-butanol: Thermodynamic behavior and molecular dynamics calculation. J. Mol. Liq. 2024, 401, 124643. [Google Scholar] [CrossRef]
  30. Yu, Z.J.; Li, X.Q.; Lan, Z.; Wang, W.; Liu, D.S. The calculation of residual enthalpy and residual entropy for gaseous mixtures. Chem. Ind. Times 2016, 30, 12–14. [Google Scholar]
  31. Li, Y.J.; Wang, M.R.; Han, B.; Ma, Z.; Jia, L.Y. Gas turbine primary combustor error analysis of combustion efficiency and exhaust emission using gas analysis method. J. Aerosp. Power 2017, 32, 1051–1057. [Google Scholar]
  32. Zhu, W.; Ground, C.; Maddalena, L.; Viti, V. Computational study and error analysis of an integrated sampling-probe and gas-analyzer for mixing measurements in supersonic flow. Meas. Sci. Technol. 2016, 27, 095301. [Google Scholar] [CrossRef]
  33. Wang, Y.C.; Zhao, Y.J.; Zhu, R.R.; Zhang, P.F. Fluent Shock Wave Interference Between Conical Projectiles with High Supersonic Speed. J. Ordnance Equip. Eng. 2021, 42, 59–63. [Google Scholar]
Figure 1. Structure of the probe head.
Aerospace 11 00595 g001
Figure 2. Internal water-cooling system.
Aerospace 11 00595 g002
Figure 3. Solving model and meshing.
Aerospace 11 00595 g003
Figure 4. Procedure of solving relative deviation of volume fractions.
Aerospace 11 00595 g004
Figure 5. Static temperature distribution of initial simulation test.
Aerospace 11 00595 g005
Figure 6. Calculation of component volume fractions at different excess air coefficients. (a) Volume fraction of CO2. (b) Volume fraction of CO.
Aerospace 11 00595 g006
Figure 7. Distribution of static temperature and Mach number of probe sampling in a supersonic environment. (a) Distribution of static temperature. (b) Distribution of Mach number.
Aerospace 11 00595 g007
Figure 8. Distribution of head temperature in different clamping angle probes.
Aerospace 11 00595 g008
Figure 9. Variation in gas flow parameters in the expansion section in different clamping angle probes. (a) Variation in static temperature. (b) Variation in Mach number.
Aerospace 11 00595 g009
Figure 10. Effect of water pressure on CO2 sampling relative deviation.
Aerospace 11 00595 g010
Figure 11. Optimized probe structure.
Aerospace 11 00595 g011
Figure 12. Static temperature and Mach number distribution of the optimized probe. (a) Distribution of static temperature. (b) Distribution of Mach number.
Aerospace 11 00595 g012
Figure 13. The gas flow velocity distribution before and after optimization. (a) Before optimization. (b) After optimization.
Aerospace 11 00595 g013
Figure 14. Variation in static temperature and Mach number in the expansion section (optimized probe). (a) Variation in static temperature. (b) Variation in Mach number.
Aerospace 11 00595 g014
Figure 15. Impact of cooling water pressure on CO2 relative deviation (optimized probe).
Aerospace 11 00595 g015
Figure 16. Variation in static temperature and Mach number before and after optimization. (a) Variation in static temperature. (b) Variation in Mach number.
Aerospace 11 00595 g016
Figure 17. Test operation process.
Aerospace 11 00595 g017
Figure 18. Uncertainty at different temperature measuring points.
Aerospace 11 00595 g018
Figure 19. Comparison of test bench data with simulation results.
Aerospace 11 00595 g019
Table 1. Structural parameters of the probe head.
Structural ParameterNumerical Value
L1, L2, L41 mm
L31.5 mm
P10.8 mm
P22 mm
P33.2 mm
R1, R260 ± 1°
R330°
Table 2. Boundary conditions.
BoundaryTotal Temperature/Backflow Temperature (K)Total Pressure/Gauge Pressure (MPa)Initial Gauge Pressure (MPa)
Gas inlet20002.40.0485
Gas outlet2900.101---
Probe outlet2900.0075---
Cooling inlet290Adjustable---
Cooling outlet2900.101---
Table 3. Comparison of CO2 volume fraction.
Excess Air Coefficient (alf)Theoretical Actual Value (%)Calculated Molar Volume of V = RT/P (m3/mol)Calculated Volume Fraction of V = RT/P (%)Calculated Molar Volume of R-K Equation Iterative Algorithm (m3/mol)Calculated Volume Fraction of R-K Equation Iterative Algorithm (%)
1.1411.79165.57 × 10−313.32149.19 × 10−312.00
1.2511.52162.63 × 10−312.83146.29 × 10−311.6
1.619.07161.15 × 10−310.16143.88 × 10−39.15
2.067.00160.92 × 10−37.9143.17 × 10−37.03
Table 4. Comparison of CO volume fraction.
Excess Air Coefficient (alf)Theoretical Actual Value (%)Calculated Molar Volume of V = RT/P (m3/mol)Calculated Volume Fraction of V = RT/P (%)Calculated Molar Volume of R-K Equation Iterative Algorithm (m3/mol)Calculated Volume Fraction of R-K Equation Iterative Algorithm (%)
1.141.06165.57 × 10−31.1985156.10 × 10−31.1311
1.250.31162.63 × 10−30.4707150.73 × 10−30.3422
1.610.04161.15 × 10−30.0448143.39 × 10−30.0431
2.060.03160.92 × 10−30.027137.84 × 10−30.0295
Table 5. Relative deviation of volume fractions.
ConditionWater Pressure (MPa) Δ φ CO 2 (%) Δ φ CO (%)
10.55.525.67
20.55.315.43
30.55.07---
40.55.14---
Table 6. Calculation error of combustion efficiency.
Condition Δ η CO 2 (%) Δ η CO (%)Δδ (%)
10.2010.2010.284
20.080460.08080.114
30.007359---<0.1
40.009663---<0.1
Table 7. The lowest relative deviation of volume fractions (28°).
ConditionOptimum Water Pressure (MPa) Δ φ CO 2 (%) Δ φ CO (%)
121.441.42
21.75–21.391.36
31.75–21.21---
421.14---
Table 8. The lowest relative deviation of volume fractions (30°).
ConditionOptimum Water Pressure (MPa) Δ φ CO 2 (%) Δ φ CO (%)
11.752.212.27
21.751.831.9
321.65---
421.29---
Table 9. The lowest relative deviation of volume fractions (32°).
ConditionOptimum Water Pressure (MPa) Δ φ CO 2 (%) Δ φ CO (%)
11.753.483.4
21.753.223.26
322.87---
422.57---
Table 10. The lowest calculation error of combustion efficiency (28°).
Condition Δ η CO 2 (%) Δ η CO (%)Δδ (%)
10.052580.050150.07266
20.021100.019100.02846
30.00176------
40.002147------
Table 11. The lowest calculation error of combustion efficiency (32°).
Condition Δ η CO 2 (%) Δ η CO (%)Δδ (%)
10.12680.12040.17486
20.048840.045840.06698
30.004160------
40.004831------
Table 12. Relative deviation of volume fractions (optimized probe).
ConditionWater Pressure (MPa) Δ φ CO 2 (%) Δ φ CO (%)
10.54.253.31
20.54.183.26
30.53.97---
40.54---
Table 13. The lowest relative deviation of volume fractions (optimized probe).
ConditionOptimum Water Pressure (MPa) Δ φ CO 2 (%) Δ φ CO (%)
121.71.61
221.571.63
321.43---
421.43---
Table 14. Calculation error of combustion efficiency (optimized probe).
Condition Δ η CO 2 (%) Δ η CO (%)Δδ (%)
10.15470.1170.194
20.063310.045840.07816
30.005759---<0.01
40.007516---<0.01
Table 15. The lowest calculation error of combustion efficiency (optimized probe).
Condition Δ η CO 2 (%) Δ η CO (%)Δδ (%)
10.061860.056840.084
20.023740.022940.033
30.002080---<0.01
40.002684---<0.01
Table 16. Concentration data of gas components of the test bench.
Excess Air Coefficient (alf)CO2 (%)CO (ppm)Temperature of the Test Bench (K)HUC (ppm)NOx (ppm)
1.1411.7910,611.91587.3597.51163.39
1.2511.523685.24586.4743.90162.83
1.619.07407.93577.1245.40103.25
2.067.03283.66572.8475.1167.15
2.565.54889.36567.34389.5661.29
Table 17. Uncertainty of temperature measurement.
Temperature (K)567.34572.84577.12586.47587.35
Uncertainty
u16.1276.2996.4406.7686.805
u21.1601.2341.3001.4451.466
uc6.2356.4186.5656.9206.961
Table 18. Simulated test data and temperature deviation.
Excess Air Coefficient (alf)CO2 (%)CO (%)Temperature of the Probe Outlet (K)Temperature DeviationCondition
1.1411.791.0611557.985.00%1
1.2511.520.3685557.874.88%2
1.619.070.0408552.854.21%3
2.067.030.0284548.214.30%4
Disclaimer/Publisher’s Note: The statements, opinions and data contained in all publications are solely those of the individual author(s) and contributor(s) and not of MDPI and/or the editor(s). MDPI and/or the editor(s) disclaim responsibility for any injury to people or property resulting from any ideas, methods, instructions or products referred to in the content.