Article

A Time-Domain Calculation Method for Gust Aerodynamics in Flight Simulation

1
School of Aeronautic Science and Engineering, Beihang University, Beijing 100191, China
2
Hangzhou International Innovation Institute, Beihang University, Hangzhou 311115, China
3
Shanghai Aircraft Design and Research Institute, Commercial Aircraft Corporation of China Ltd., Shanghai 201210, China
*
Author to whom correspondence should be addressed.
Aerospace 2024, 11(7), 583; https://doi.org/10.3390/aerospace11070583
Submission received: 24 May 2024 / Revised: 13 July 2024 / Accepted: 15 July 2024 / Published: 16 July 2024
(This article belongs to the Special Issue Gust Influences on Aerospace)

Abstract

:
Gusts have a significant impact on aircraft and need to be analyzed through flight simulations. The solution for time-domain gust aerodynamic forces stands as a pivotal stage in this process. With the increasing demand for flight simulations within gusty environments, traditional methods related to gust aerodynamics cannot fail to balance computational accuracy and efficiency. A method that can be used to quickly and accurately calculate the time-domain gust aerodynamic force is needed. This study proposes the fitting strip method, a gust aerodynamic force solution method that is suitable for real-time flight simulations. It only requires the current and previous gust information to calculate the aerodynamic force and is suitable for different configurations of aircraft and different kinds of gusts. Firstly, the fitting strip method requires the division of fitting strips and the calculation of the aerodynamic force under calibration conditions. In this study, the double-lattice method and computational fluid dynamics are used to calculate the aerodynamic force of the strips. Then, the amplitude coefficients and time-delay coefficients are obtained through a fitting calculation. Finally, the coefficients and gust information are put into the formula to calculate the gust aerodynamic force. An example of a swept wing is used for validation, demonstrating congruence between the computational results and experimental data across subsonic and transonic speeds, which proves the accuracy of the fitting strip method in both discrete gusts and continuous gusts. Compared with other methods, the fitting strip method uses the shortest time. Furthermore, the results of a calculation for normal-layout aircraft show that this method avoids the shortcomings of the rational function approximation method and is more accurate than the gust grouping method. Concurrently, gust aerodynamic force calculations were performed on aircraft with large aspect ratios and used in a real-time flight simulation.

1. Introduction

Since the invention of the aircraft, aircraft designers have diligently focused on atmospheric disturbances during flight, and gusts represent one of the most important forms. During flight, an aircraft will inevitably be affected by gusts, which generate an additional aerodynamic force and aerodynamic moment, resulting in aircraft vibration, jolting, and potential impacts on flight safety [1,2]. Aircraft with large aspect ratios and high flexibility have smaller wing loads than conventional aircraft, are more sensitive to gusts, and have a more obvious response. Among more than 4000 weather-related flight accident reports from 1999 to 2001, 12% listed gusts as direct or indirect causes [3]. Therefore, it is necessary to study the gust response of aircraft to reduce the adverse effects of gusts on them and improve the comfort of flight.
Gust response analysis mainly includes models of aircraft dynamics, gust models, gust aerodynamic force solutions, and comprehensive analyses. Gust aerodynamic force refers to the aerodynamic force caused by gusts, as well as an increase in lift that they cause. The key is the calculation of an unsteady gust aerodynamic force because the accurate determination of this force is essential for obtaining the correct response of an aircraft. Unsteady aerodynamic forces require the consideration of the unsteady effects caused by gusts. Presently, the most commonly used calculation methods for the gust aerodynamic force include rigid-body models, the unsteady surface element methods, and computational fluid dynamics (CFD) methods.
The method of calculating the gust aerodynamic force with a rigid-body model regards a rigid-body aircraft as a particle to obtain its overall gust aerodynamic force. It considers the effects of gusts as changes in the aircraft’s angle of attack to compute additional aerodynamic forces and moments. It is widely used in the primary stage of aircraft responses caused by gusts. Since the aircraft is regarded as a particle, this method cannot be used to obtain distributed aerodynamic forces and consider elastic effects, and it cannot meet the computational requirements of flexible aircraft.
The unsteady surface element method is a frequency-domain aerodynamic calculation method. It involves simple grid division and has high calculation efficiency and accuracy, thus meeting the demands of engineering applications. Currently, it stands as a prevalent method for computing unsteady aerodynamic forces in various projects. The double-lattice method (DLM) is one of the typical surface element methods. It can be used to calculate three-dimensional turbulence problems through a two-dimensional plane grid, so it is widely used in flutter calculations, gust alleviation, and other types of research. Karpel et al. established a comprehensive process for gust response analysis and used the surface element method to obtain a set of discrete frequency-domain aerodynamic influence coefficient matrices [4,5,6]. A frequency-domain gust response analysis for an aircraft was then accomplished via Fourier transformation. Wu et al. investigated missile aeroservoelastic systems and proposed calculation methods for both discrete and continuous gust responses [7]. Qiu et al. used a theoretical model to calculate aircraft gust responses and developed a time-domain equivalent emulation method for them [8]. Zhao et al. proposed a multi-input multi-output adaptive feedforward control scheme for gust load alleviation based on measured gust information and simulations [9].
CFD methods involve certain simplifications based on reasonable assumptions and then solve the basic flow equations to obtain the relevant characteristics of the flow field. This approach is adept at calculating various nonlinear aerodynamic forces and has found widespread application across scientific research and engineering endeavors. In 1997, Baeder et al. developed the field velocity method (FVM) based on the unsteady Euler equation. They were able to introduce gust models into CFD calculations, and a two-dimensional airfoil was analyzed [10]. Nayer et al. developed a methodology for introducing gusts into a computational model in order to efficiently simulate their effects on fluid flow [11]. Zhang et al. studied the response of a propeller and wing coupling system to gusts and conducted experiments to validate their model [12,13]. Pfluger et al. investigated a morphing wing model by using unsteady fluid–structure interaction simulations [14].
Flight simulation technology serves as a simulation analysis method for complex systems, with a focus on aircraft motion. With the ongoing development of aircraft, there has been a growing demand for flight simulations that take the effects of aircraft elasticity into account, which requires the consideration of the coupling relationship between elastic deformation and rigid-body motion [15,16]. The key to flight simulations involving elastic aircraft with gusts is quickly and accurately obtaining the gust aerodynamic force. However, the various existing methods cannot meet these demands. For instance, a rigid-body model cannot consider the elastic effects of gusts, and the time cost of CFD is too high. Therefore, there is a need for an efficient and accurate time-domain calculation method for gust aerodynamic force that can be applied to flight simulations.
To solve the above problems, this study proposes a gust aerodynamic force solution method that is suitable for flight simulations. The fitting strip method first divides equivalent strips and obtains the aerodynamic force corresponding to each strip through the DLM or CFD methods. Then, the aerodynamic coefficients and time-delay coefficients are determined through fitting. Finally, the gust aerodynamic force of the aircraft can be calculated by substituting the coefficients into the formula.

2. Review of Existing Time-Domain Gust Load Calculation Methods

2.1. Frequency-Domain Inverse Fourier Transform Analysis Method

The frequency-domain inverse Fourier transform analysis method consists of two primary steps: computing the frequency-domain aerodynamic force and converting it into the time domain through the inverse Fourier transform. The DLM is used as an example for the frequency-domain calculation. The DLM is a panel method based on linearized small perturbation velocity potential theory [17]. This method divides the lift surface into several trapezoidal grids with two sides parallel to the incoming flow and considers that the aerodynamic force on each grid acts at the intersection of the mid-section of the grid and the 1/4 chord of the grid, which is called the pressure point. The boundary condition is satisfied at the intersection of the mid-section of the grid and the 3/4 chord of the grid, which is called the downwash control point.
The unsteady aerodynamic force distribution on the aerodynamic grid is determined by solving the basic equation
Δ p = 1 2 ρ V 2 D 1 w
where Δ p is a pressure matrix, ρ is the air density, V is the flying velocity, D is the aerodynamic coefficient matrix, and w is a matrix of downwash control points.
The generalized unsteady aerodynamic expression considering the downwash caused by gusts can be written as follows:
f = 1 2 ρ V 2 A g w g V
where f is the generalized unsteady aerodynamic force, A g is the generalized unsteady aerodynamic coefficient matrix, and w g is the gust velocity.
Firstly, the generalized unsteady aerodynamic coefficient matrix of the aerodynamic grid A g ( k ) is calculated. Then, the gust is transformed to obtain the frequency-domain form F w g ( t ) by using a Fourier transform. Finally, the gust aerodynamic force f g ( ω ) in the frequency-domain form can be obtained with the following formula:
f g ( ω ) = 1 2 ρ V 2 1 V A g ( k ) F w g ( t )
where ρ is the air density, V is the flying velocity, and w g ( t ) is the gust velocity.
Then, the frequency-domain aerodynamic force is transformed into the time-domain aerodynamic force via an inverse Fourier transform f g ( t ) .
f g ( t ) = F 1 f g ( ω )
The advantage of this method lies in its high calculation accuracy and efficiency. However, since it relies on frequency-domain calculations, the complete time-domain waveform of the gust is required to compute the gust aerodynamic force in the time domain. Typically, during flight simulation calculations, only current and previous gust information is available, making it impossible to obtain the complete gust waveform. Consequently, this method is applicable only after the gust ends and cannot be used in real-time flight simulations.

2.2. Rational Function Approximation

The rational function approximation method begins by solving the generalized unsteady aerodynamic influence coefficient matrix in the frequency domain using the DLM. Then, the matrix is converted into the time domain through rational function approximation, and a state-space model is established. Specific calculation methods include Roger’s method, the least squares (LS) method, and the minimum state (MS) method [18]. In this study, the standard MS method is used for the subsequent calculations. The steps of the MS method are as follows. Firstly, the aerodynamic influence coefficient matrix is approximately expressed in the Laplace domain:
A g ( s ¯ ) = A 0 g + s ¯ A 1 g + s ¯ 2 A 2 g + s ¯ D ( s ¯ I R ) 1 E g
where s ¯ is a dimensionless Laplace variable, R is a diagonal matrix composed of aerodynamic lag roots, and I is the unit matrix of the same order as R . A i g , D , and E g are the fitting polynomial coefficient matrices. The aerodynamic augmented state vector x a is brought into the aerodynamic formula to obtain the state-space equation. The time-domain gust aerodynamic force can be calculated as follows:
x ˙ a = V b R x a + E g V w ˙ g f g = 1 2 ρ V 2 A 0 g w g V + b V 2 A 1 g w ˙ g + D x a
The advantage of this method is its expression in state-space form, which facilitates real-time flight simulations. However, there are instances where the fitting curve exhibits excessive spiraling during the rational function approximation process, leading to errors that exceed acceptable levels of accuracy in calculations.

2.3. Time-Domain Solution Method for Gust Grouping

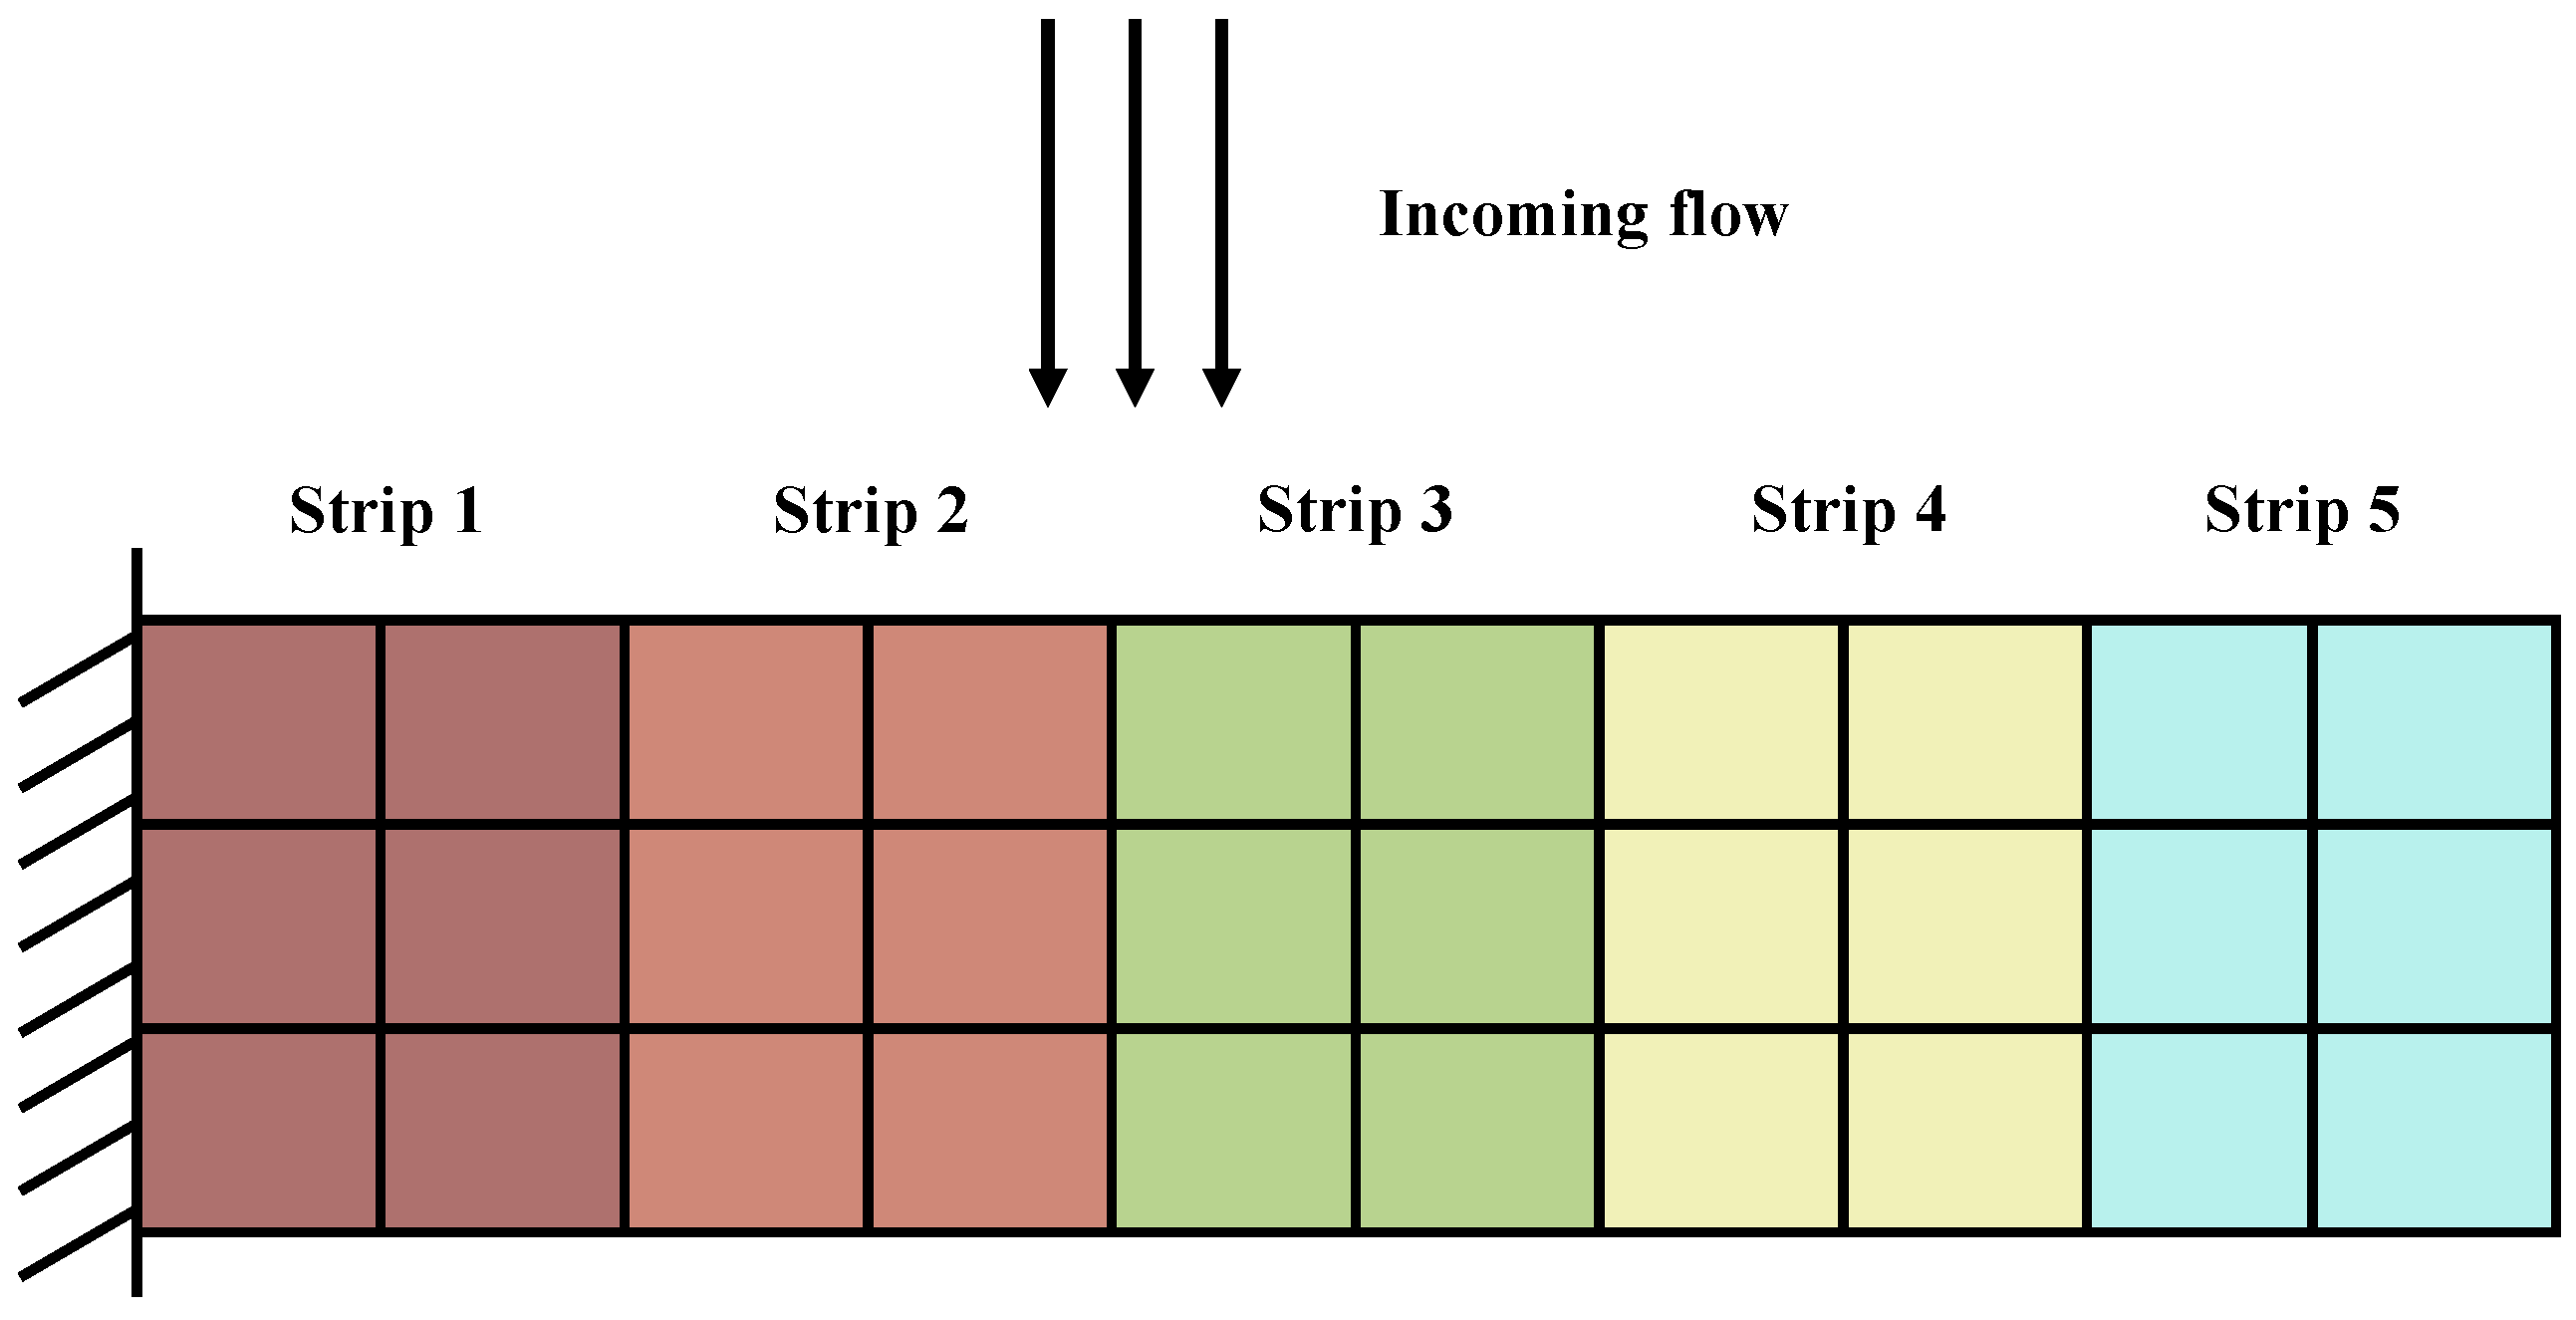
In engineering applications, it has been found that the approximation curve of the RFA in the complex plane is a spiral. In some cases, the curve is highly spiralized, resulting in excessive fitting errors. Karpel pointed out that the degree of spiralization of the curve is closely related to the position of the gust reference point. To address this issue, Karpel et al. proposed a gust grouping method based on rational function fitting [19]. This method involves grouping wings in the direction of flow and selecting different gust reference points for each partitioned wing, as shown in Figure 1. By separately calculating the aerodynamic forces of different groups, this method enables smoother variations in the gust aerodynamic force influence coefficient with frequency, thereby mitigating the spiralization of the curve to some extent.
After selecting different reference points, the gusts are also divided into m groups accordingly. There are only time delays between different groups of gusts, but there are no differences in amplitude or frequency. Then, the expression for the unsteady aerodynamic force of gusts is as follows:
f = 1 2 ρ V 2 A g w g 1 V w g m V
Compared with RFA, this approach mitigates the spiralization of the curve to a certain extent, and the fitting of the aerodynamic forces of different groups is more accurate. However, it still struggles to accurately fit the aerodynamic coupling terms between different partitions, resulting in excessive errors in certain aerodynamic aspects. As a result, the improvement in the calculation accuracy is limited and may not fully meet project requirements.

2.4. CFD

To compute the time-domain aerodynamic force in a gust environment using the CFD method, the corresponding gust must be introduced into CFD solver. Typically, there are usually two methods. The first method involves adding the gust load to the flow field as velocity boundary conditions. The second method, which is based on relative motion, considers the aircraft’s encounter with upward airflow as equivalent to the aircraft’s movement downward at the same speed. Thus, the flow field around the wings can be consistent with the gust.
This method has a high calculation accuracy and can be applied to various aircraft configurations and different gust types [20,21]. However, the calculation requires much time and many computing resources, and it is unsuitable for real-time flight simulations, which require a fast calculation of the aerodynamic force. Consequently, some scholars have tried to use CFD data to establish a reduced-order aerodynamic model in recent years. Shi et al. used flying wings as their research object and incorporated a reduced-order model to carry out a dynamic simulation analysis of an aircraft in a gusty environment [22]. The calculation results were consistent with the experimental and fluid-structure interaction analysis results.

3. Fitting Strip Method

3.1. Proposal of the Method

In flight simulations involving aircraft with a large aspect ratio, such as commercial airliners, it is necessary to obtain the gust aerodynamic force in the time domain before calculating the response of the aircraft structure. However, RFA often encounters challenges when applied to aircraft with a large aspect ratio.
Factors such as a swept wing and tail can lead to highly spiraled fitting curves, resulting in significant errors that fail to precisely represent the aerodynamic forces of aircraft. A frequency-domain method cannot be used to calculate the gust aerodynamic force in real time, so it is necessary to propose a simple and efficient time-domain gust aerodynamic force method to meet the needs of flight simulations.
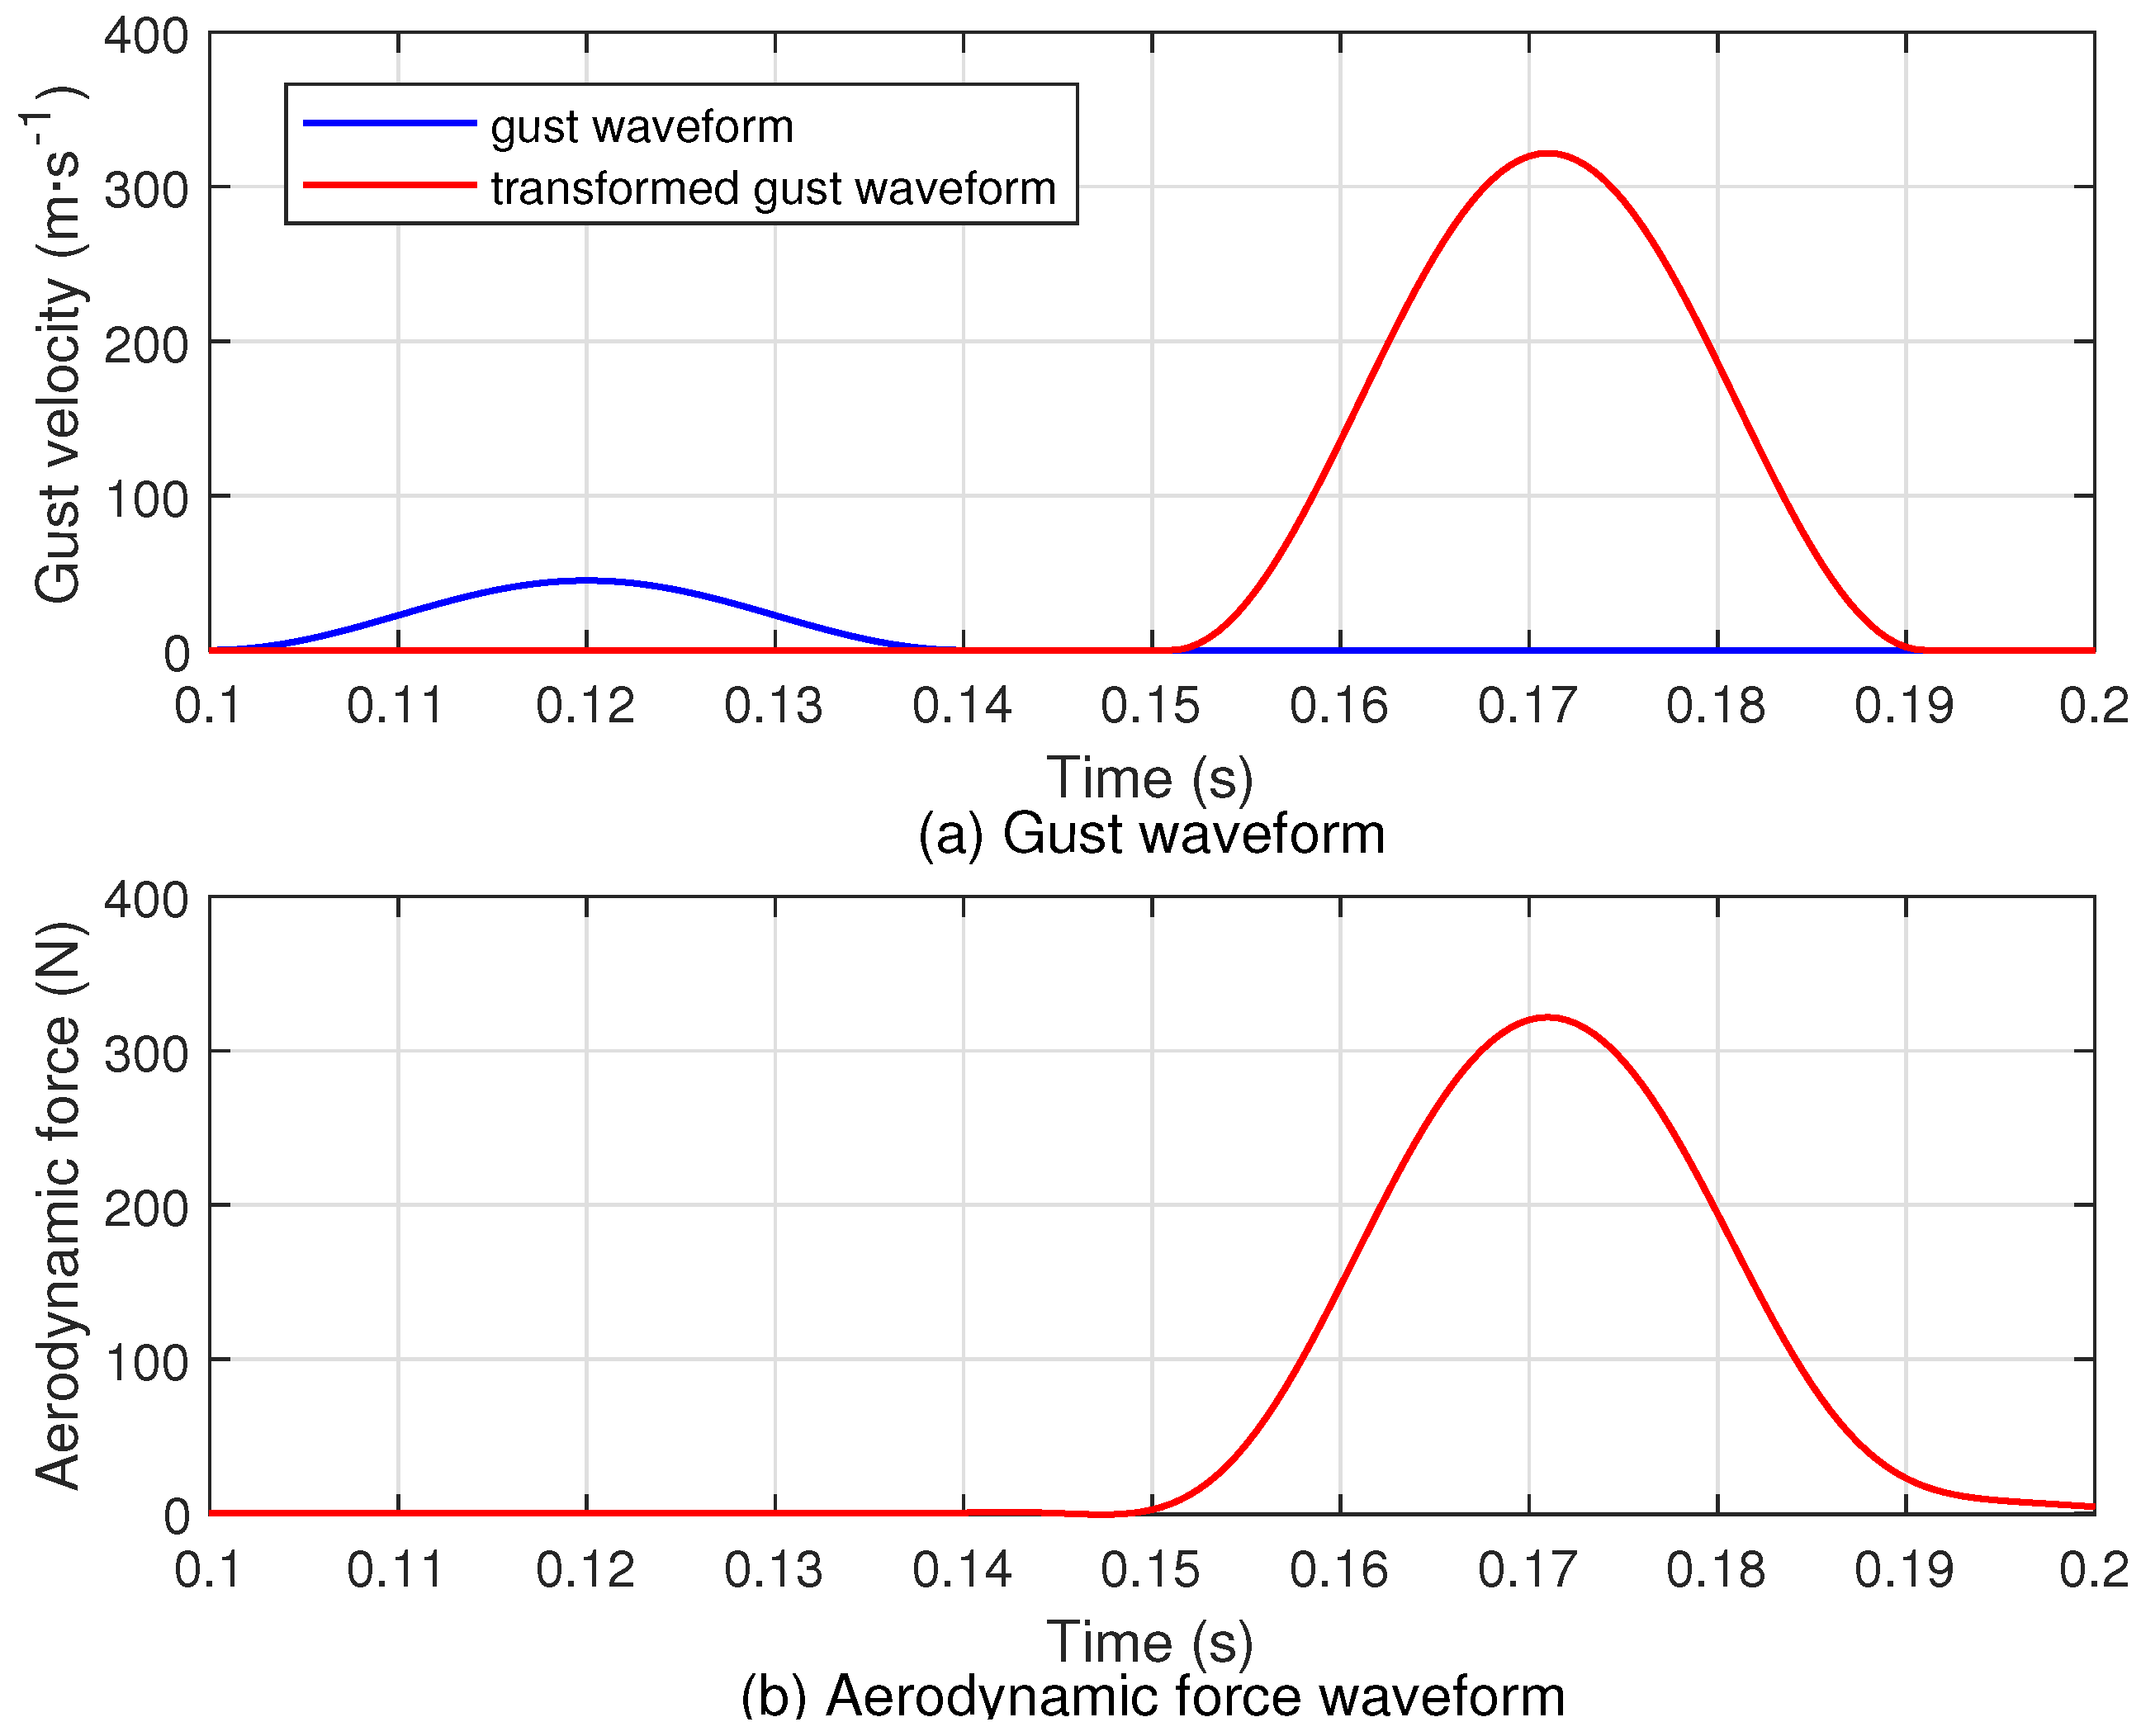
In previous calculation processes for the gust aerodynamic force on aircraft, it was noted that the time-domain gust aerodynamic curve of an aircraft remains highly similar to the gust curve. The conjecture that the aerodynamic force can be obtained from the gust waveform is put forward. As shown in Figure 2, it can be seen that the difference between the gust waveform and the aerodynamic force waveform is only in the peak value and duration. Typically, when calculating the aerodynamic force caused by a discrete gust, the first wave peak value and its occurrence time are the most important in flight simulations. The precise replication of the entire curve is not essential.
This observation suggests the possibility of utilizing the gust waveform to approximate the aerodynamic force waveform. The gust waveform is multiplied by an amplitude coefficient and shifted in time. The transformed curve is shown in Figure 2a. It can be seen that the transformed curve is almost consistent with the aerodynamic force curve. This indicates that the aerodynamic force curve can be derived by adjusting the gust curve with the appropriate amplitude coefficient and time delay, meeting the accuracy requirements of the calculation.
Based on the discussion above, this study proposes the following new gust aerodynamic force solution formula:
f i g ( t ) = 1 2 ρ V 2 B i g w g ( t τ i ) V
where f i g ( t ) is the time-domain aerodynamic force caused by the gust in the i-th strip, which is an increase in lift caused by the gust acting on the aerodynamic center. B i g is the amplitude coefficient of the i-th strip, and τ i is the time-delay coefficient of the i-th strip. w g is the gust velocity. This formula is suitable for both discrete gusts and continuous gusts.
It is necessary to compute the amplitude coefficients and time-delay coefficients before using Equation (8). The frequency-domain inverse Fourier transform or CFD method can be used to accurately solve for the time-domain aerodynamic force caused by gusts under calibration conditions and then fit the coefficients.
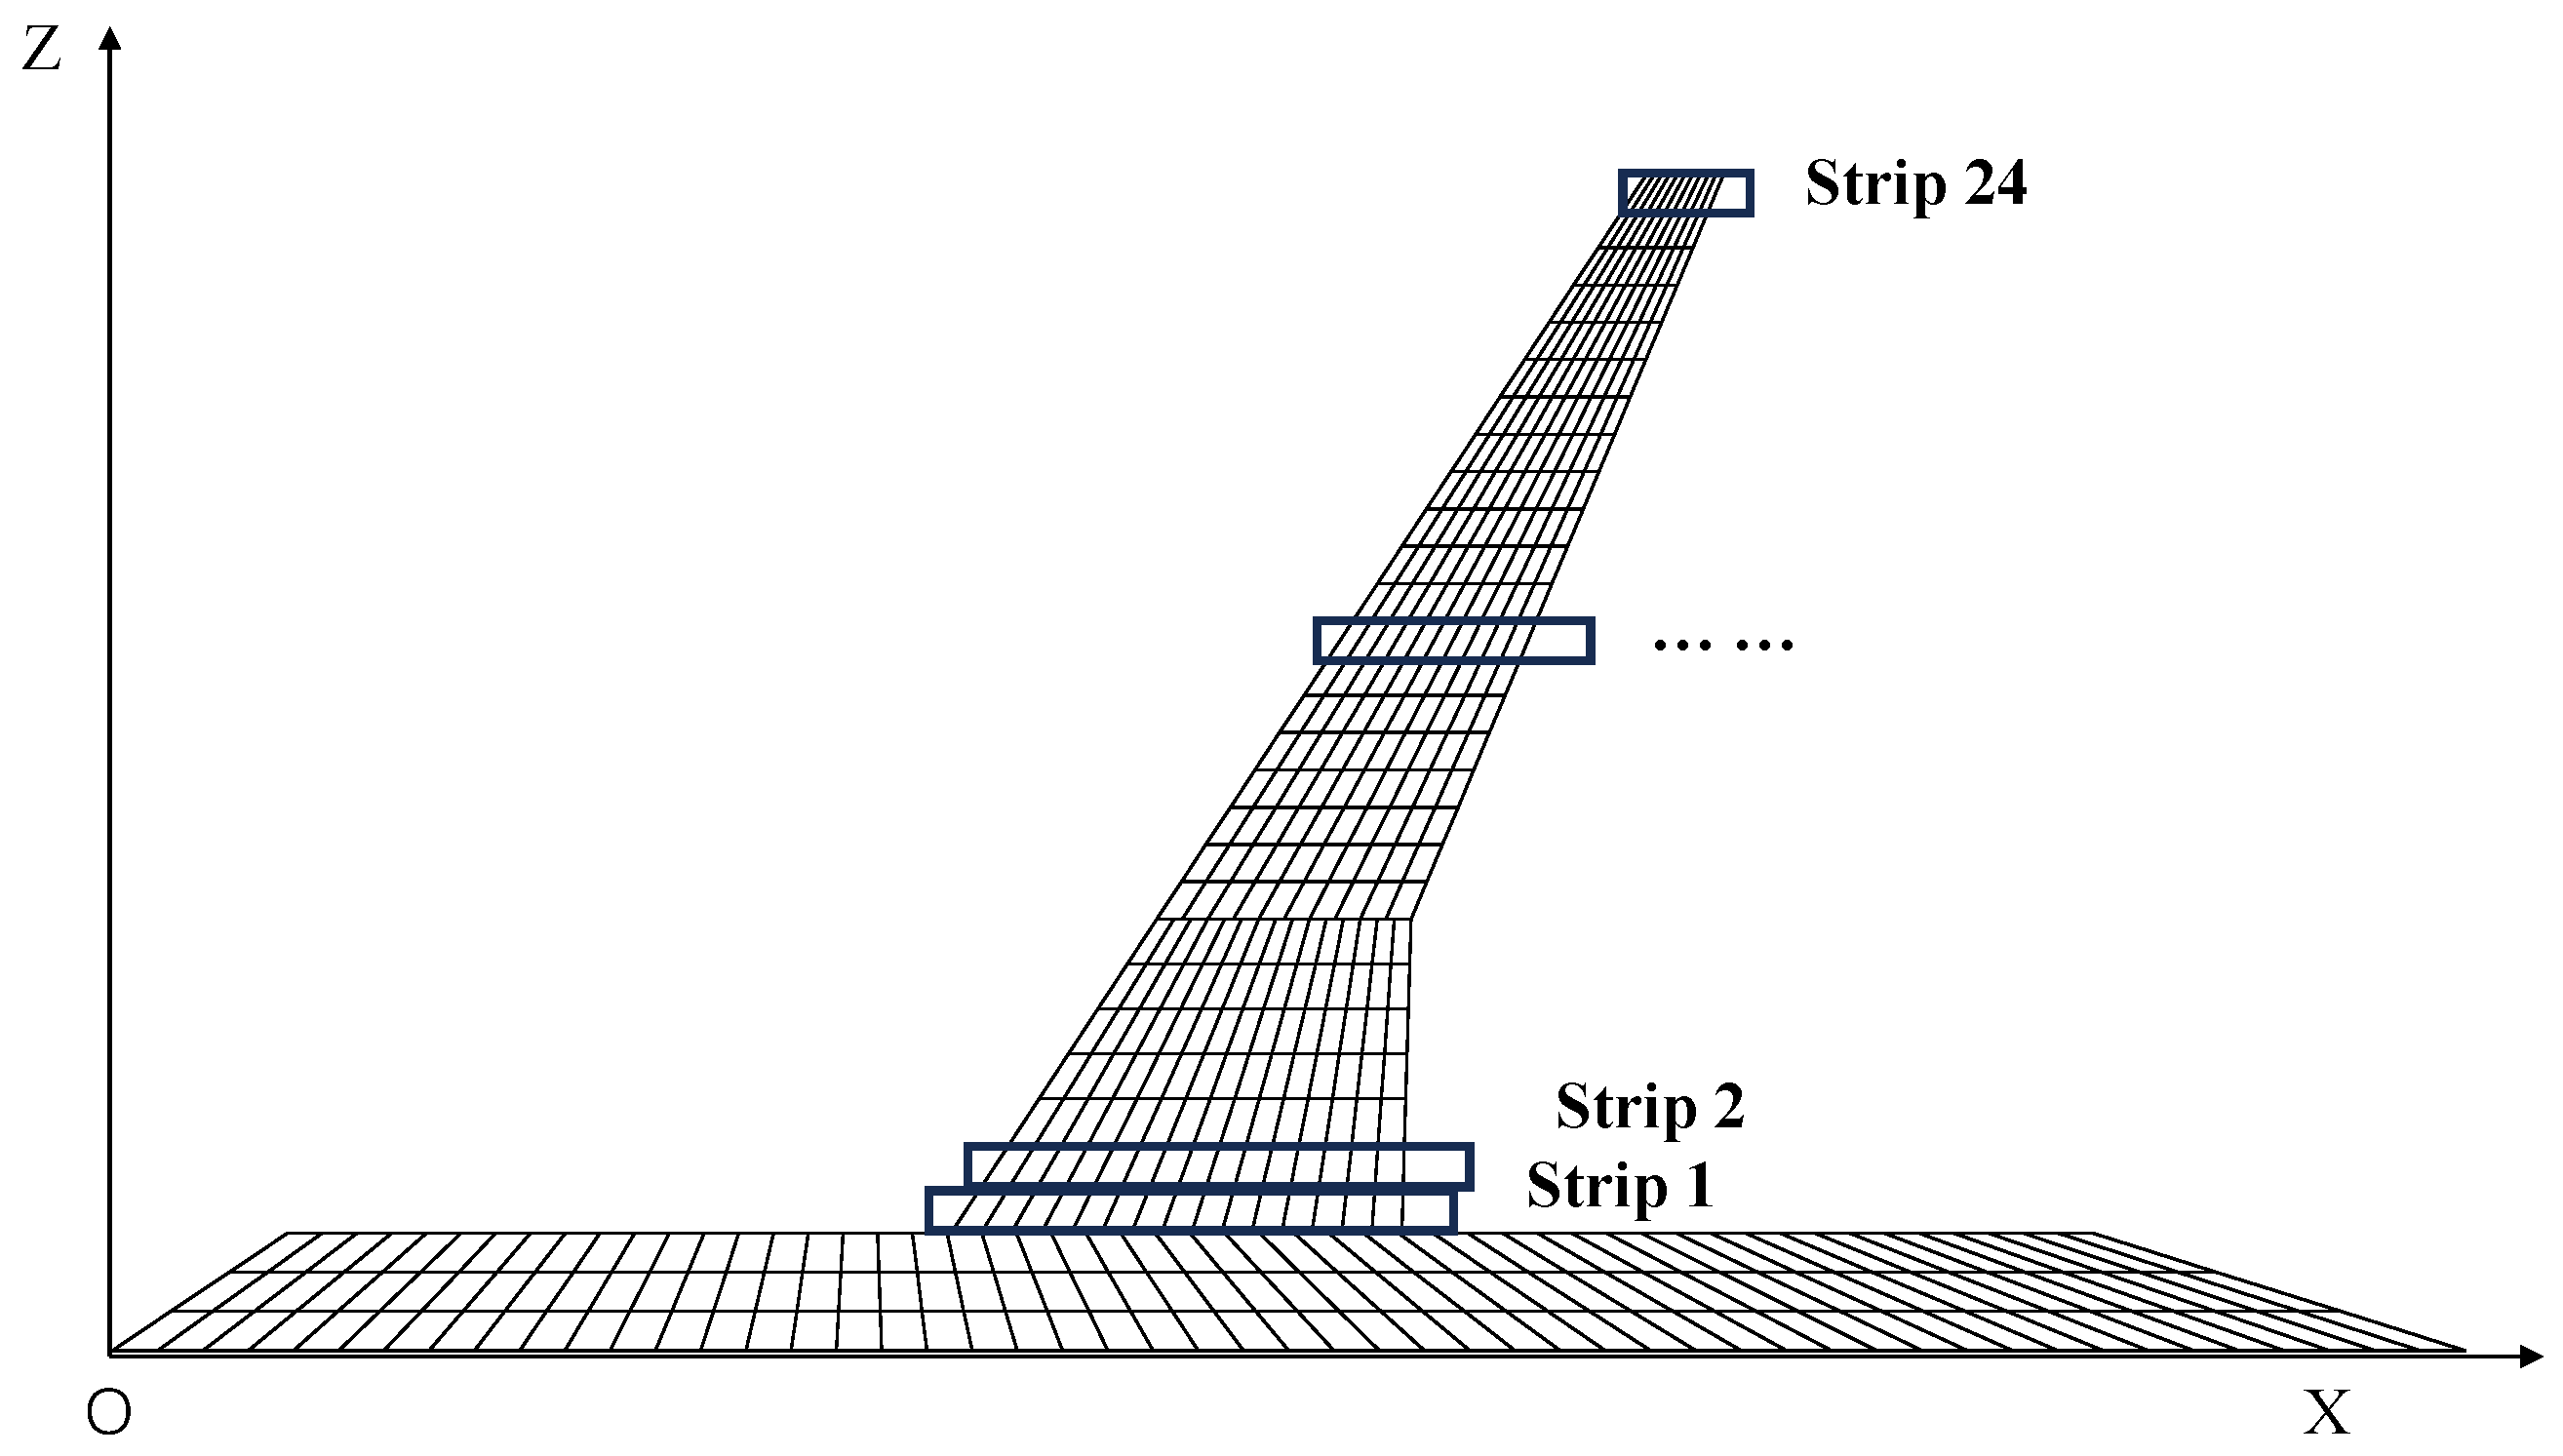
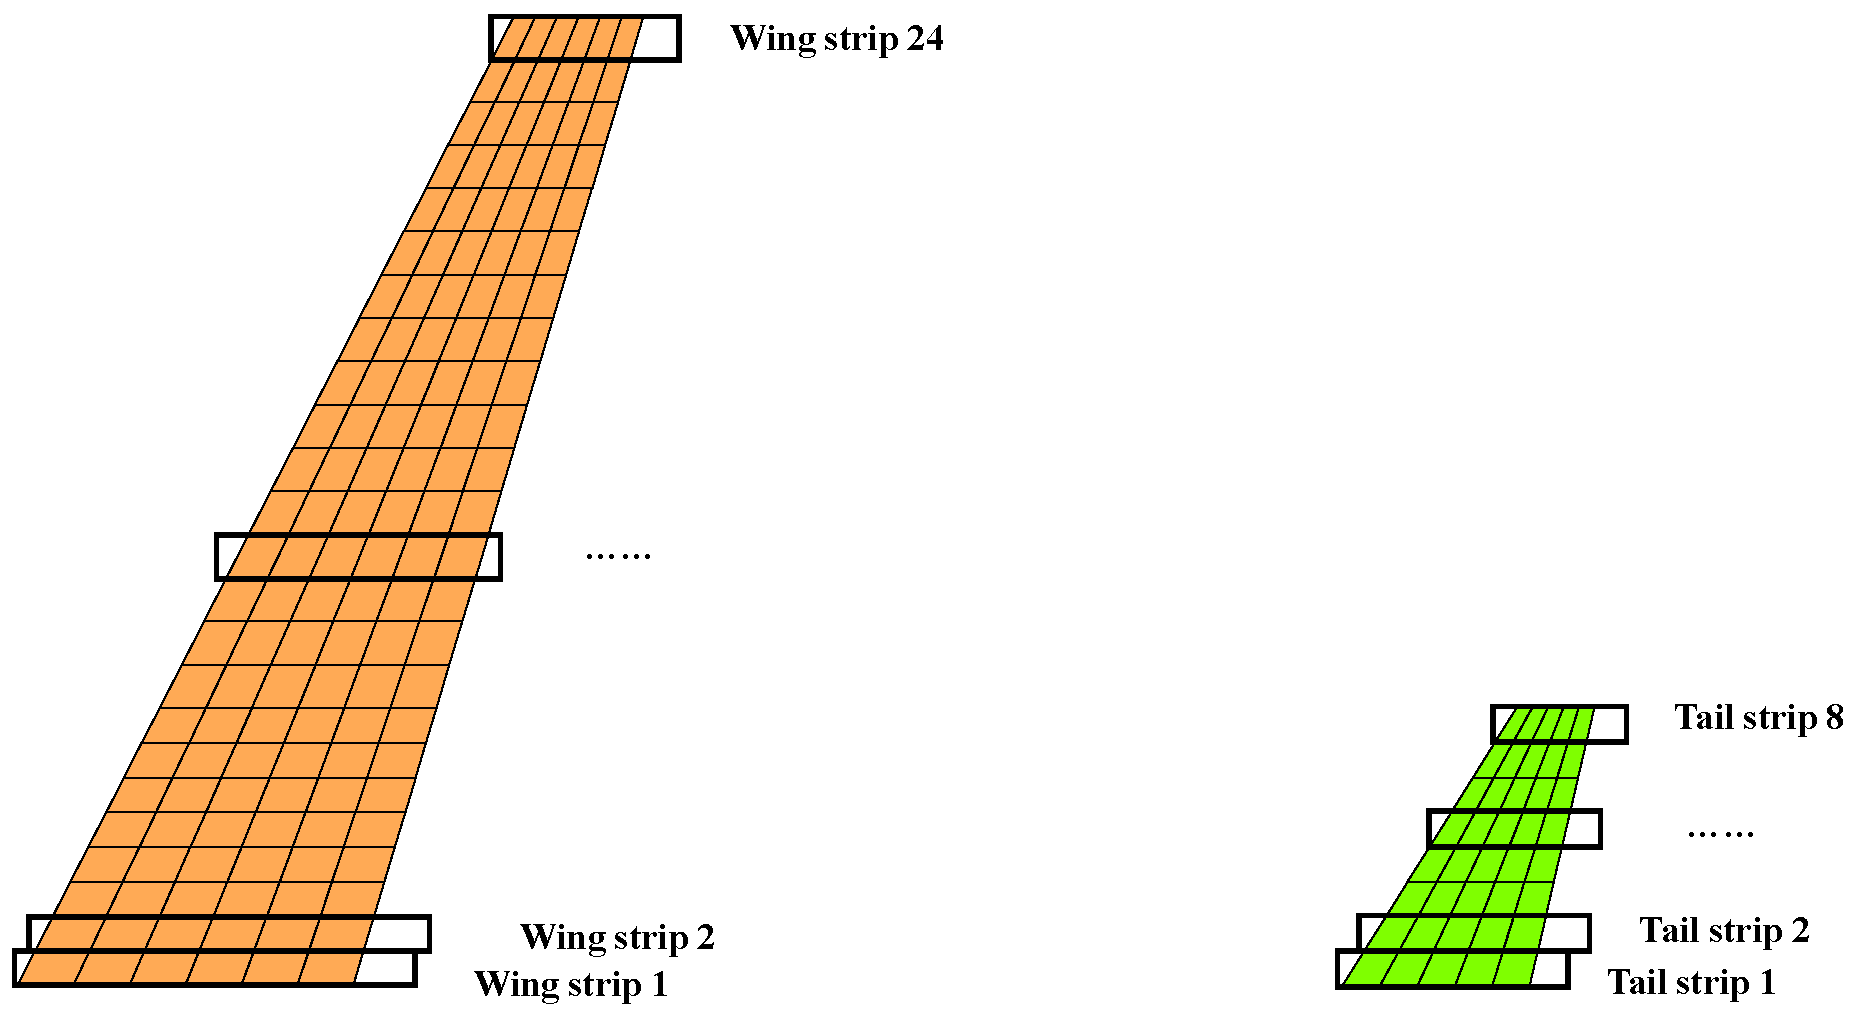
Taking the frequency-domain inverse Fourier transform solution as an example, the DLM is used to compute the aerodynamic force. When considering the entire aircraft as a singular entity, the effects of different components such as wings and tails cannot be distinguished, and the fitting error under different working conditions will also be larger. If each grid of the DLM is fitted independently, the calculation accuracy can be effectively improved. However, a large number of grids will greatly increase the amount of calculations and is inconvenient for engineering applications. To balance the calculation efficiency and accuracy, the idea of aerodynamic strips was adopted. Aerodynamic surface element meshes with the same spanwise coordinates are merged into one slice, as shown in Figure 3.
Based on the ideas presented above, this study proposes the fitting strip method for the calculation of the time-domain gust aerodynamic force in a way that is suitable for flight simulations. First, the DLM is used to calculate the generalized aerodynamic coefficient matrix, or CFD is used to calculate the aerodynamic forces caused by gusts under calibration conditions. Then, the aerodynamic mesh is divided into multiple strips to calculate the gust aerodynamic force, and the coefficients are fitted. Finally, the aerodynamic forces of the different strips are added to obtain the total gust aerodynamic force on the aircraft. Furthermore, the fitting strip method is suitable for continuous gusts, which is proved in Section 4.4.

3.2. Specific Steps of the Method

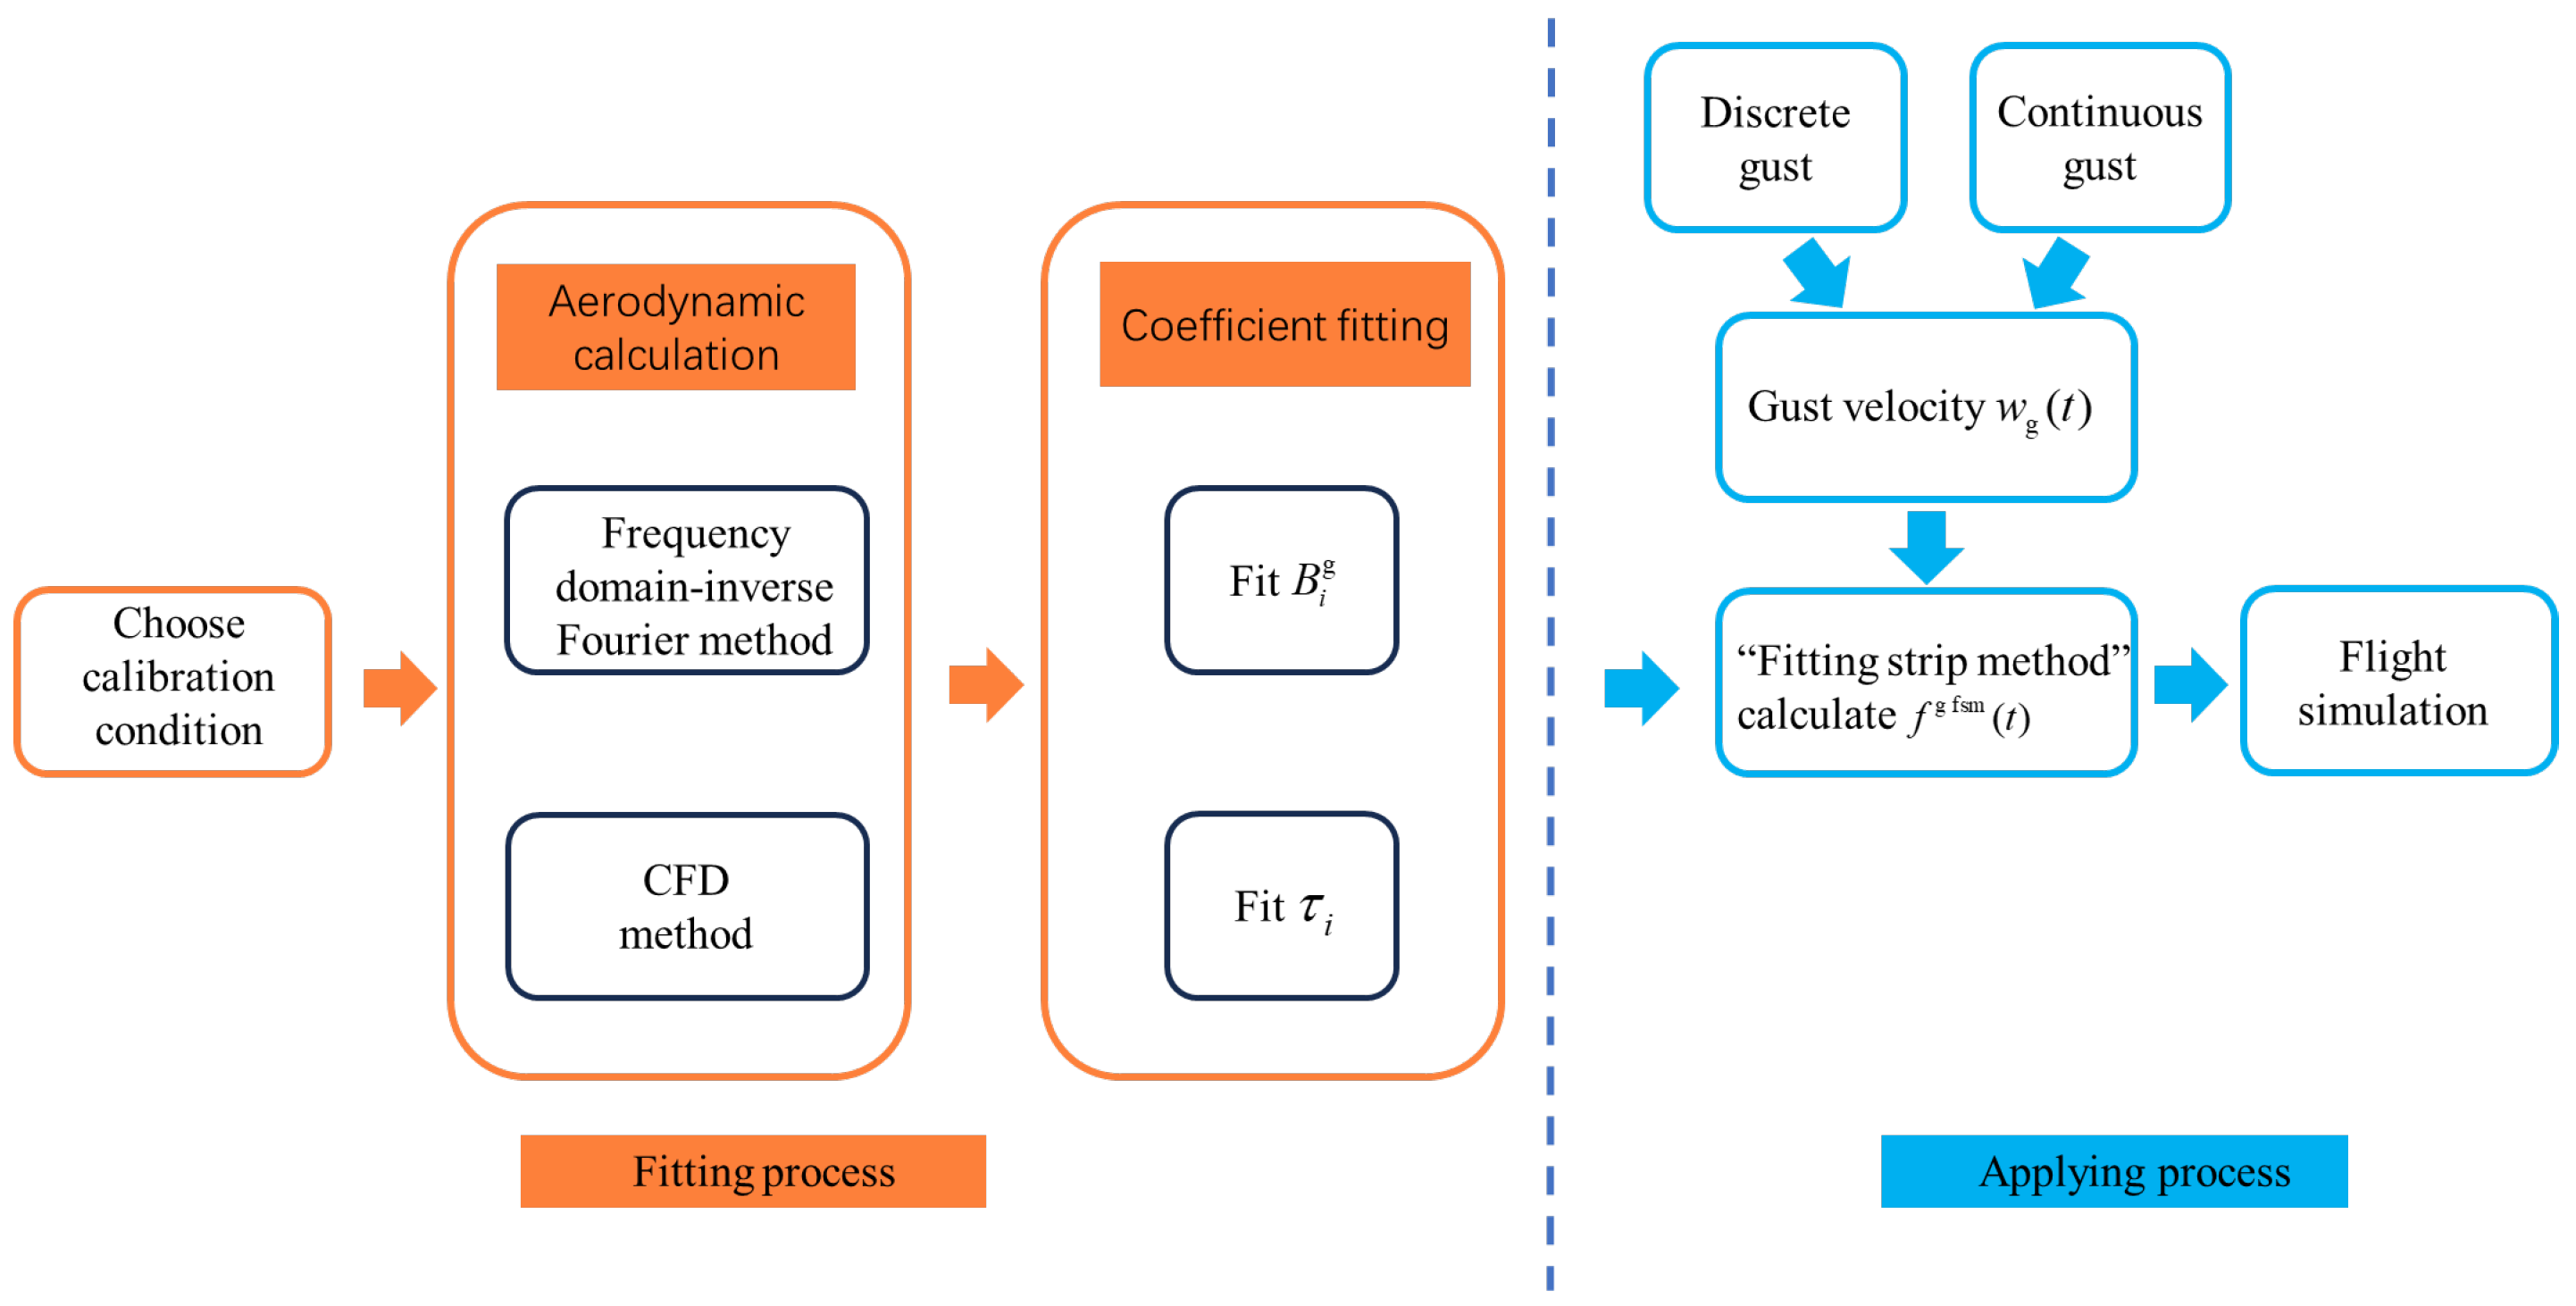
For the fitting strip method, the specific calculation process is formulated as shown in Figure 4. There are no essential differences between discrete and continuous gusts for the application of this method. The steps are as follows:
Step 1: The calibration conditions for the aerodynamic force calculation are chosen.
According to the gust scale and gust amplitude in the calculation conditions, the gust parameters under the calibrated conditions are determined, and they are used to calculate the amplitude coefficients and time-delay coefficients in Equation (8).
When considering a discrete gust, the gust under the calibration conditions is a discrete gust. The Mach number under the calibration conditions is consistent with that under the calculation conditions. The flow velocity, gust scale, and gust velocity are similar to those under the calculation conditions.
For continuous gusts, the gust type under the calibration conditions is also a discrete gust. The gust velocity is defined by the root mean square of the gust in the calculation conditions. The flow velocity and gust length are selected in the same way.
Step 2: The aerodynamic mesh is divided into strips, and the corresponding gust aerodynamic force under the calibration conditions is calculated for each strip.
The frequency-domain inverse Fourier method or CFD method can be used to calculate the gust aerodynamic force on the aircraft under the calibration conditions.
When employing the frequency-domain inverse Fourier method, the aerodynamic mesh is divided into different strips according to the spanwise coordinates. After determining the Mach number and the reduction frequency, the DLM is applied to compute the generalized aerodynamic influence coefficient matrix for each grid. The generalized aerodynamic influence coefficient matrices of strips A i g ( k ) are calculated individually. The aerodynamic forces in the frequency domain are calculated and converted into the time-domain form f i g ( t ) through an inverse Fourier transform.
Aerodynamic forces can also be calculated using CFD. When employing the CFD method, the CFD mesh is split into different strips in the span direction according to the calculation requirements. The gust is introduced into the CFD solver to compute the time-domain gust aerodynamic force for each strip f i g ( t ) .
Step 3: The amplitude coefficient B i g is fitted for each strip.
The core of the fitting strip method is the calculation of the amplitude coefficient B i g in Equation (8) for each strip. During the computation of the gust aerodynamic force, greater emphasis is placed on the peak value of the wave, while some distortion in the non-peak part is allowed. Consequently, the amplitude coefficient can be calculated using the peak value of the wave and the peak value of the gust velocity.
The maximum value of the aerodynamic force f i max g fsm obtained using the fitting strip method should be consistent with the maximum value of the aerodynamic force in strips f i max g obtained in Step 2.
f i max g = f i max g fsm
The maximum value of the aerodynamic force f i max g fsm obtained using the fitting strip method can be written as follows:
f i max g fsm = 1 2 ρ V 2 B i g w gmax V
where w g m a x is the maximum value of the gust velocity in each strip.
Equation (10) is substituted into Equation (9) to derive the aerodynamic force amplitude coefficient B i g .
f i max g = 1 2 ρ V 2 B i g w g max V B i g = 2 ρ V f i max g w g max
Step 4: The time-delay coefficient τ i is fitted for each strip.
In addition to the peak value, the timing of the peak gust aerodynamic force also significantly influences the outcomes of a flight simulation. Due to factors such as swept wings, the time of occurrence of the aerodynamic peak in each strip is not consistent. Thus, it is necessary to calculate the time delay between the peak of the gust aerodynamic force in each strip and the peak of the gust velocity.
The time of the peak of the aerodynamic force calculated with the fitting strip method should be consistent with the peak time of the strips calculated in Step 2.
t i max f g = t i max f g   f s m
where t i max f g represents the time corresponding to f i max g , and t i max f g   f s m represents the peak time of f i max g fsm .
t i max f g f s m can be expressed as follows:
t i max f g   f s m = t w g m a x + τ i
where t w g m a x is the time corresponding to w g m a x . τ i is the time delay of the i-th strip.
Equation (13) is substituted into Equation (12) to derive the time-delay coefficient τ i .
τ i = t i max f g t w g m a x
Step 5: The time response of the aerodynamic force is calculated under the calculation conditions.
Whether it is a discrete gust or a continuous gust, the gust velocity w g ( t ) can be obtained when the gust is determined under the calculation conditions. B i g and τ i calculated in Steps 3 and 4 are put into Equation (15) to solve for the time-domain aerodynamic force f i g fsm ( t ) of each strip.
f i g fsm ( t ) = 1 2 ρ V 2 B i g w g ( t τ i ) V
The results of the calculation of the time-domain aerodynamic force of each strip f i g fsm ( t ) are superimposed to obtain the total aerodynamic force f g fsm ( t ) .
f g fsm ( t ) = i = 1 n f i g fsm ( t )
Step 6: The time-domain aerodynamic force f g fsm ( t ) calculated with the fitting strip method is brought into a state-space model with elastic aircraft dynamics. Then, a real-time flight simulation can be performed to calculate the aircraft response.

4. Validation of the Method

In this section, a swept wing was chosen as the research object for the validation of the calculation of discrete gusts and continuous gusts. A 1-cos discrete gust and Dryden continuous gusts were selected as the test conditions for calculation and analysis [23,24]. Through a comparison of the calculated gust results with those obtained from the frequency-domain inverse Fourier method and experimental data, the accuracy and applicability of the gusts are demonstrated. The time cost of the fitting strip method is significantly less than that of other methods.

4.1. Swept-Wing Model

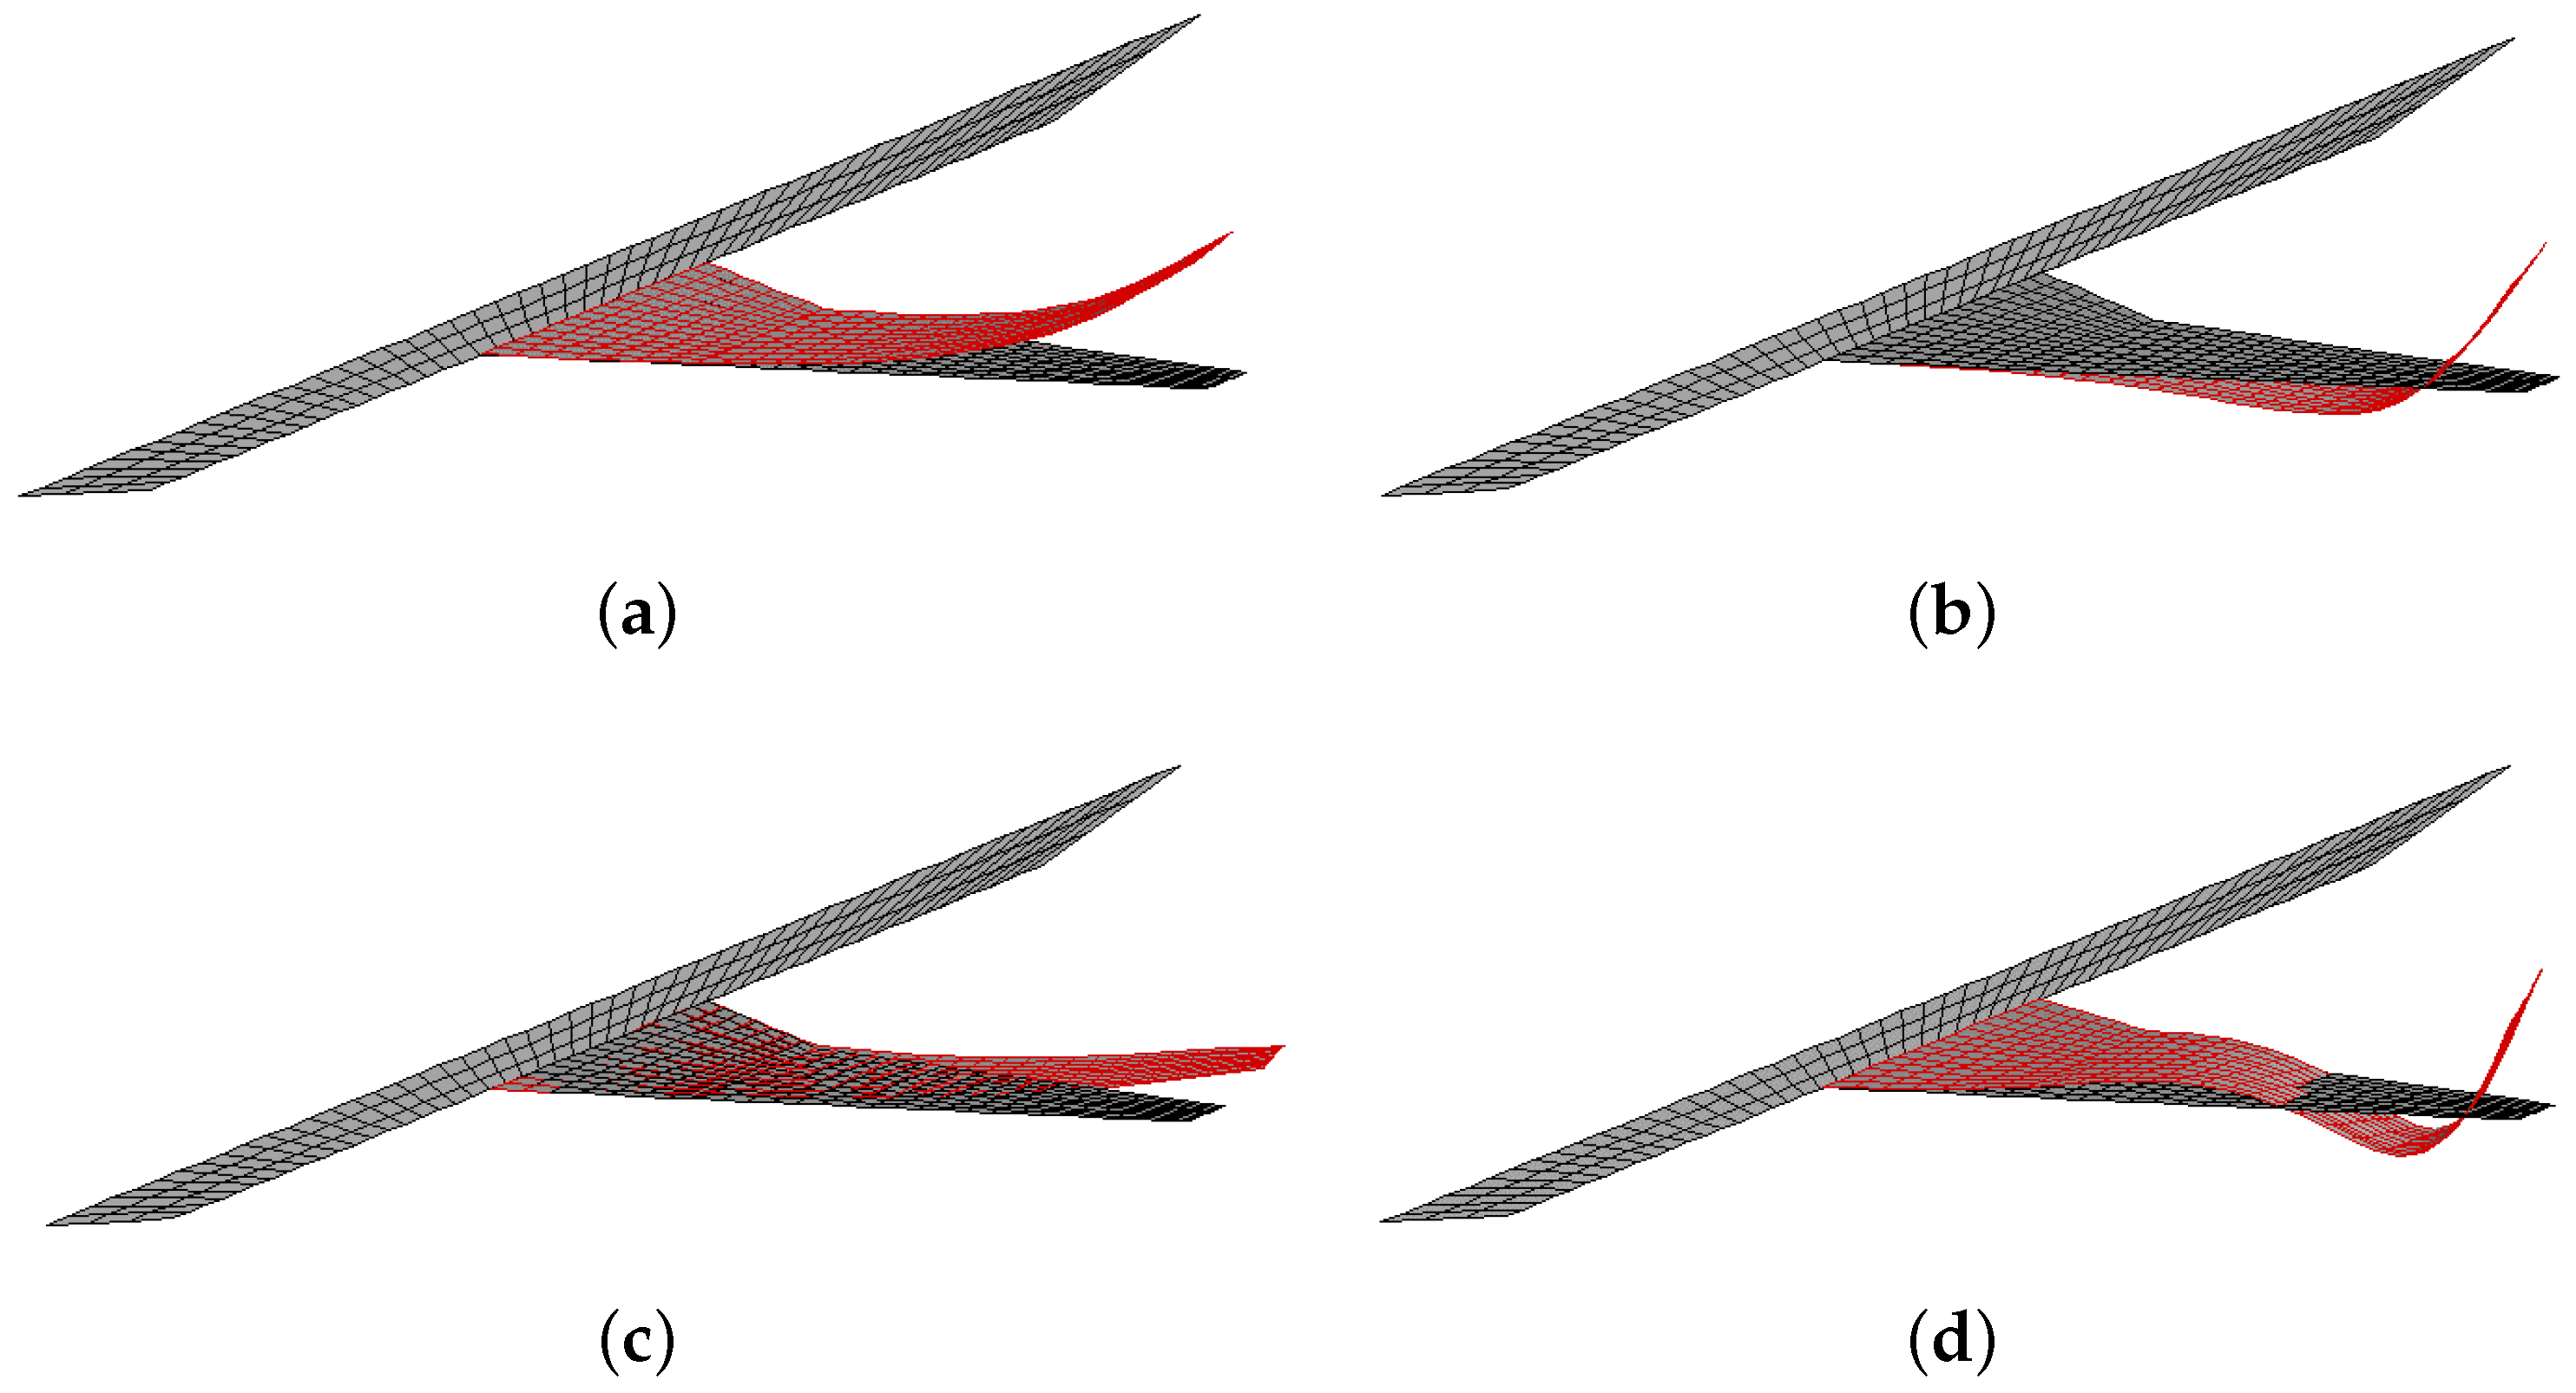
A finite element model of a swept wing was established, and this was followed by a modal analysis. The first four modal frequencies are presented in Table 1. Figure 5 illustrates the finite element model of a half mold of the aircraft. Figure 6 shows the aerodynamic mesh of the DLM, with aerodynamic strips partitioned based on the span direction. Figure 7 shows the first four modes of the finite element model in sequence.

4.2. Experimental Model of the Swept Wing

Commercial Aircraft Corporation of China Ltd. (Shanghai, China) conducted a series of wind tunnel tests on a scaled model with a steady incoming flow and gust response. The tests were conducted at the British ARA transonic wind tunnel, which has a working area measuring 2.74 m wide, 2.44 m high, and 4.27 m long.
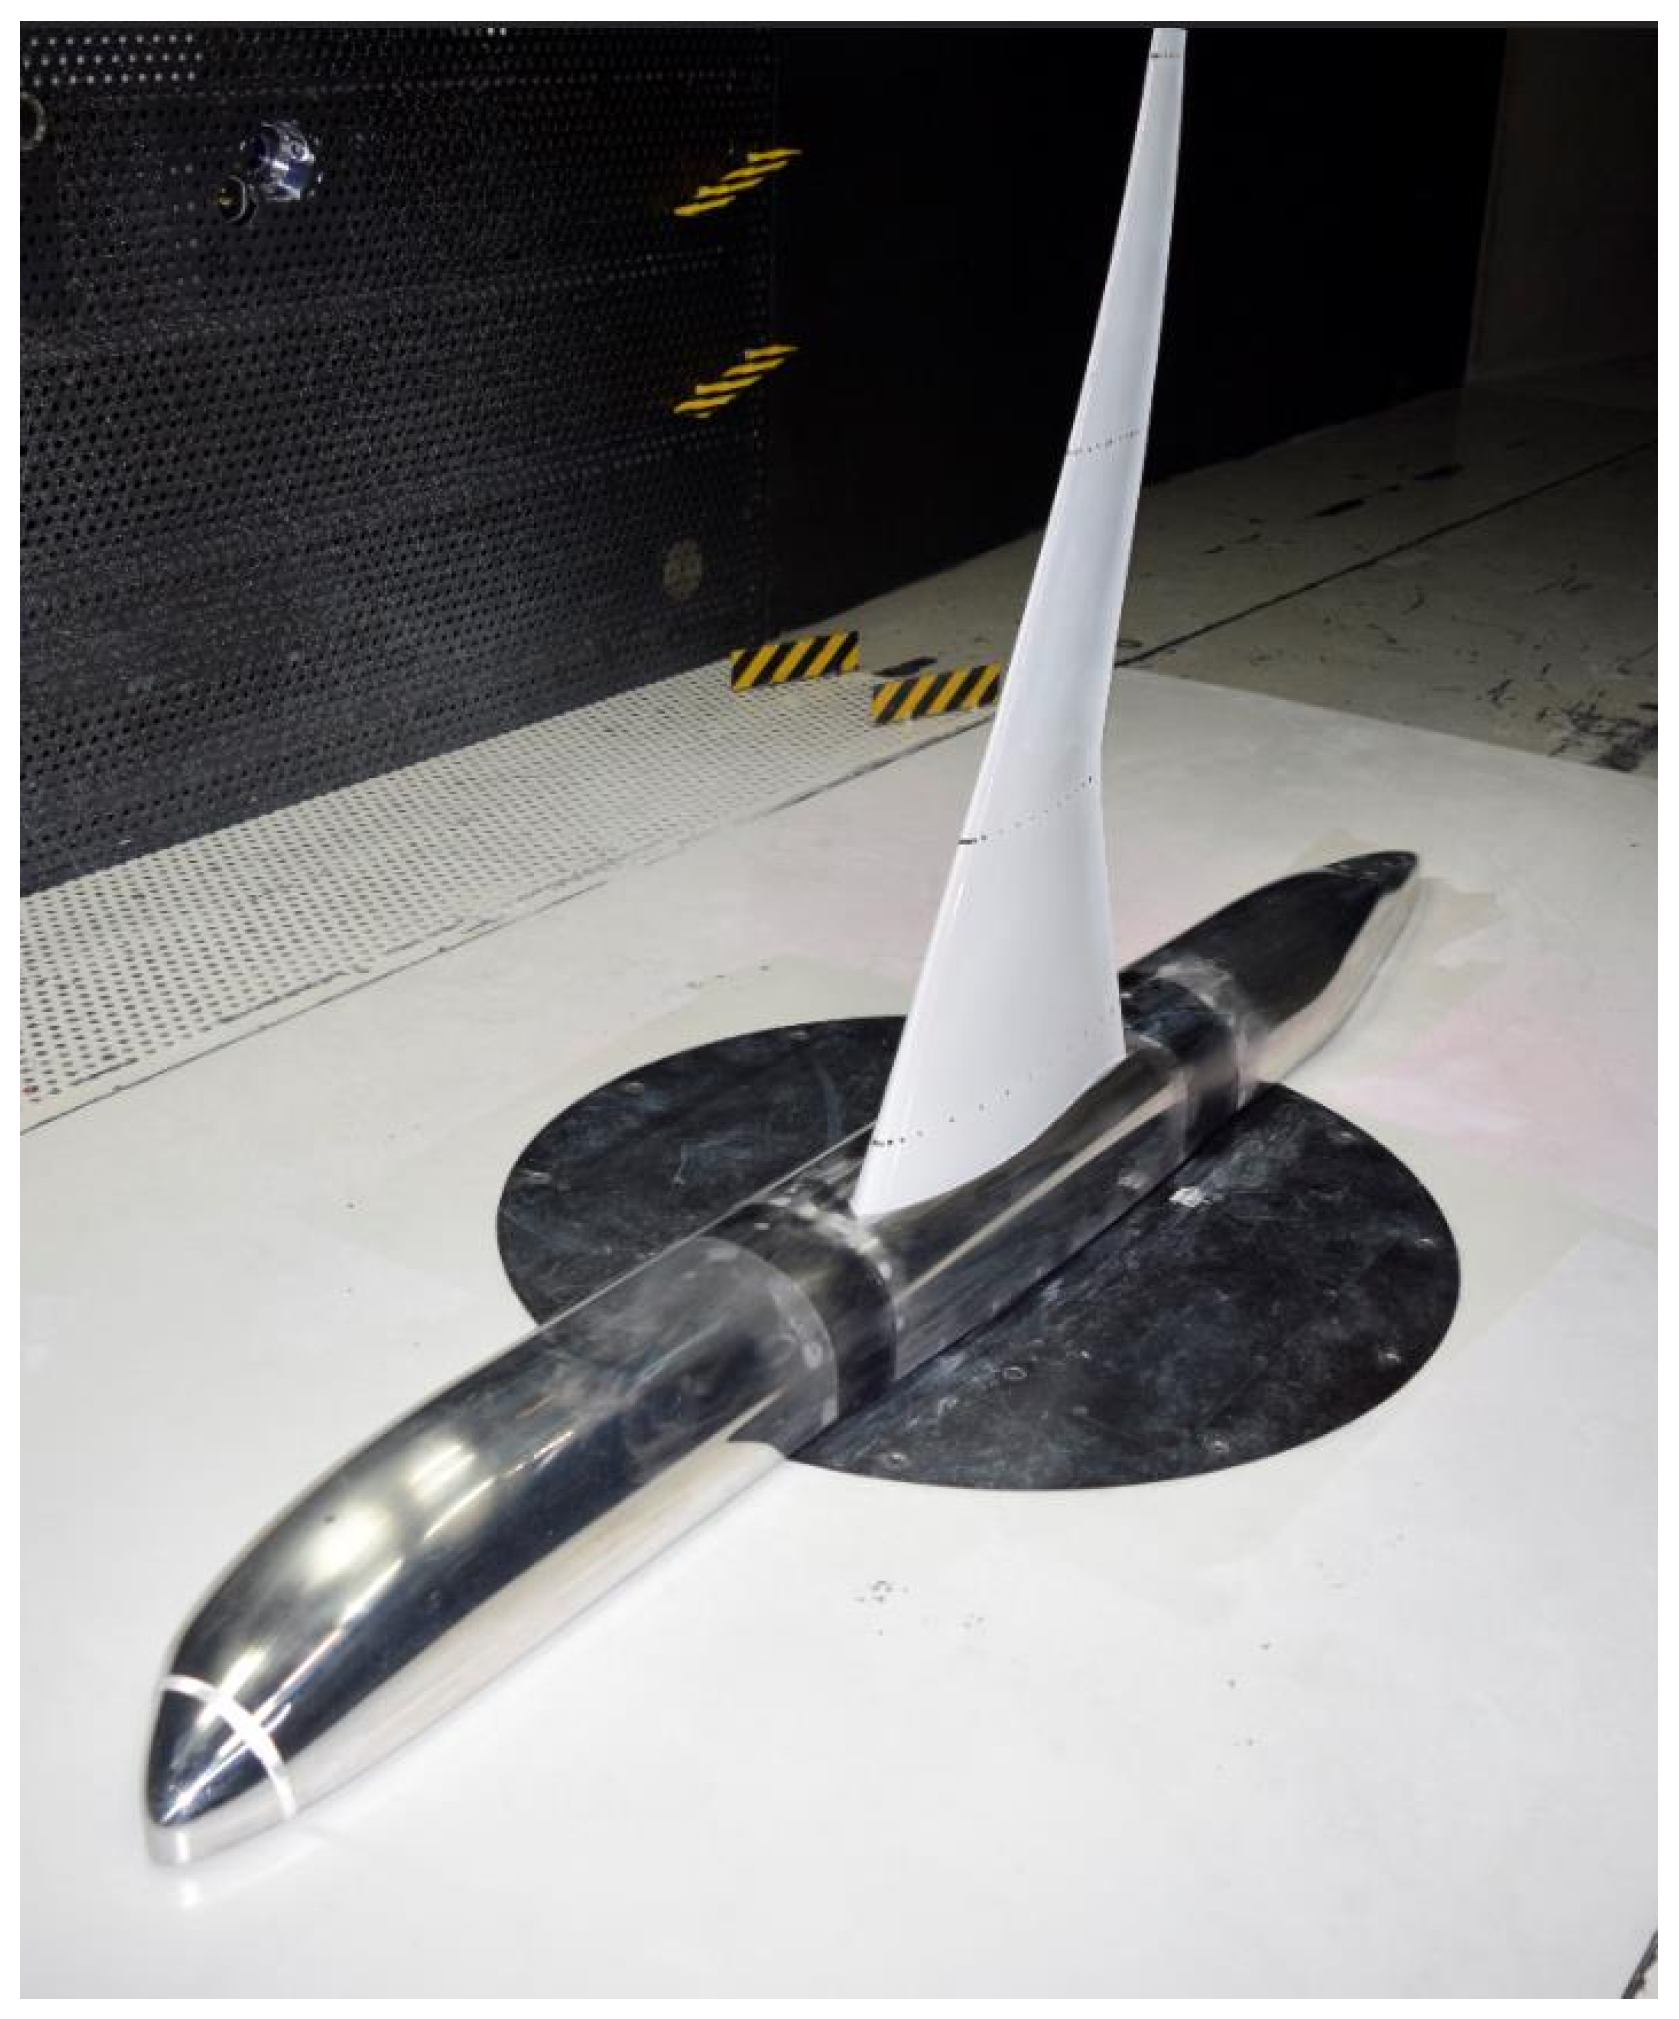
The scaled model in the wind tunnel is shown in Figure 8. The wing-root-bending moment was measured using strain gauges installed at the wing root, while a six-component balance located at the bottom of the aircraft measured the lift and bending moment data. Additionally, two accelerometers were positioned on the wing tip; these were named No. 1 (near the leading edge) and No. 2 (near the trailing edge) according to the chord direction.

4.3. Results of the Calculation of Discrete Gusts

In the gust load analysis, the damping ratio of each structural mode was 0.02, and the type of the discrete gust was a 1-cos gust. The conditions of the discrete gusts are detailed in Table 2. Three different methods—the frequency-domain inverse Fourier transform method, the fitting strip method, and an experiment—were used to compute the aerodynamic force caused by the gust, facilitating a comprehensive comparison and analysis of the results. The aerodynamic force caused by the gust means an increase in lift caused by gust.
Working conditions 1 to 3 were subsonic working conditions. The fitting strip method used the frequency-domain inverse Fourier transform method to calculate the aerodynamic force under the calibration conditions. Working condition 4 was a transonic condition, and the DLM was no longer applicable. The fitting strip method used the CFD method to calculate the aerodynamic force under the calibration conditions.
The aerodynamic force coefficient C f and root-bending moment coefficient C M are defined as
C f = 2 f g ( t ) ρ V 2 S C M = 2 M g ( t ) ρ V 2 SL
where S is the area of the wing, L is the wing’s half span, and M g ( t ) is the root-bending moment.
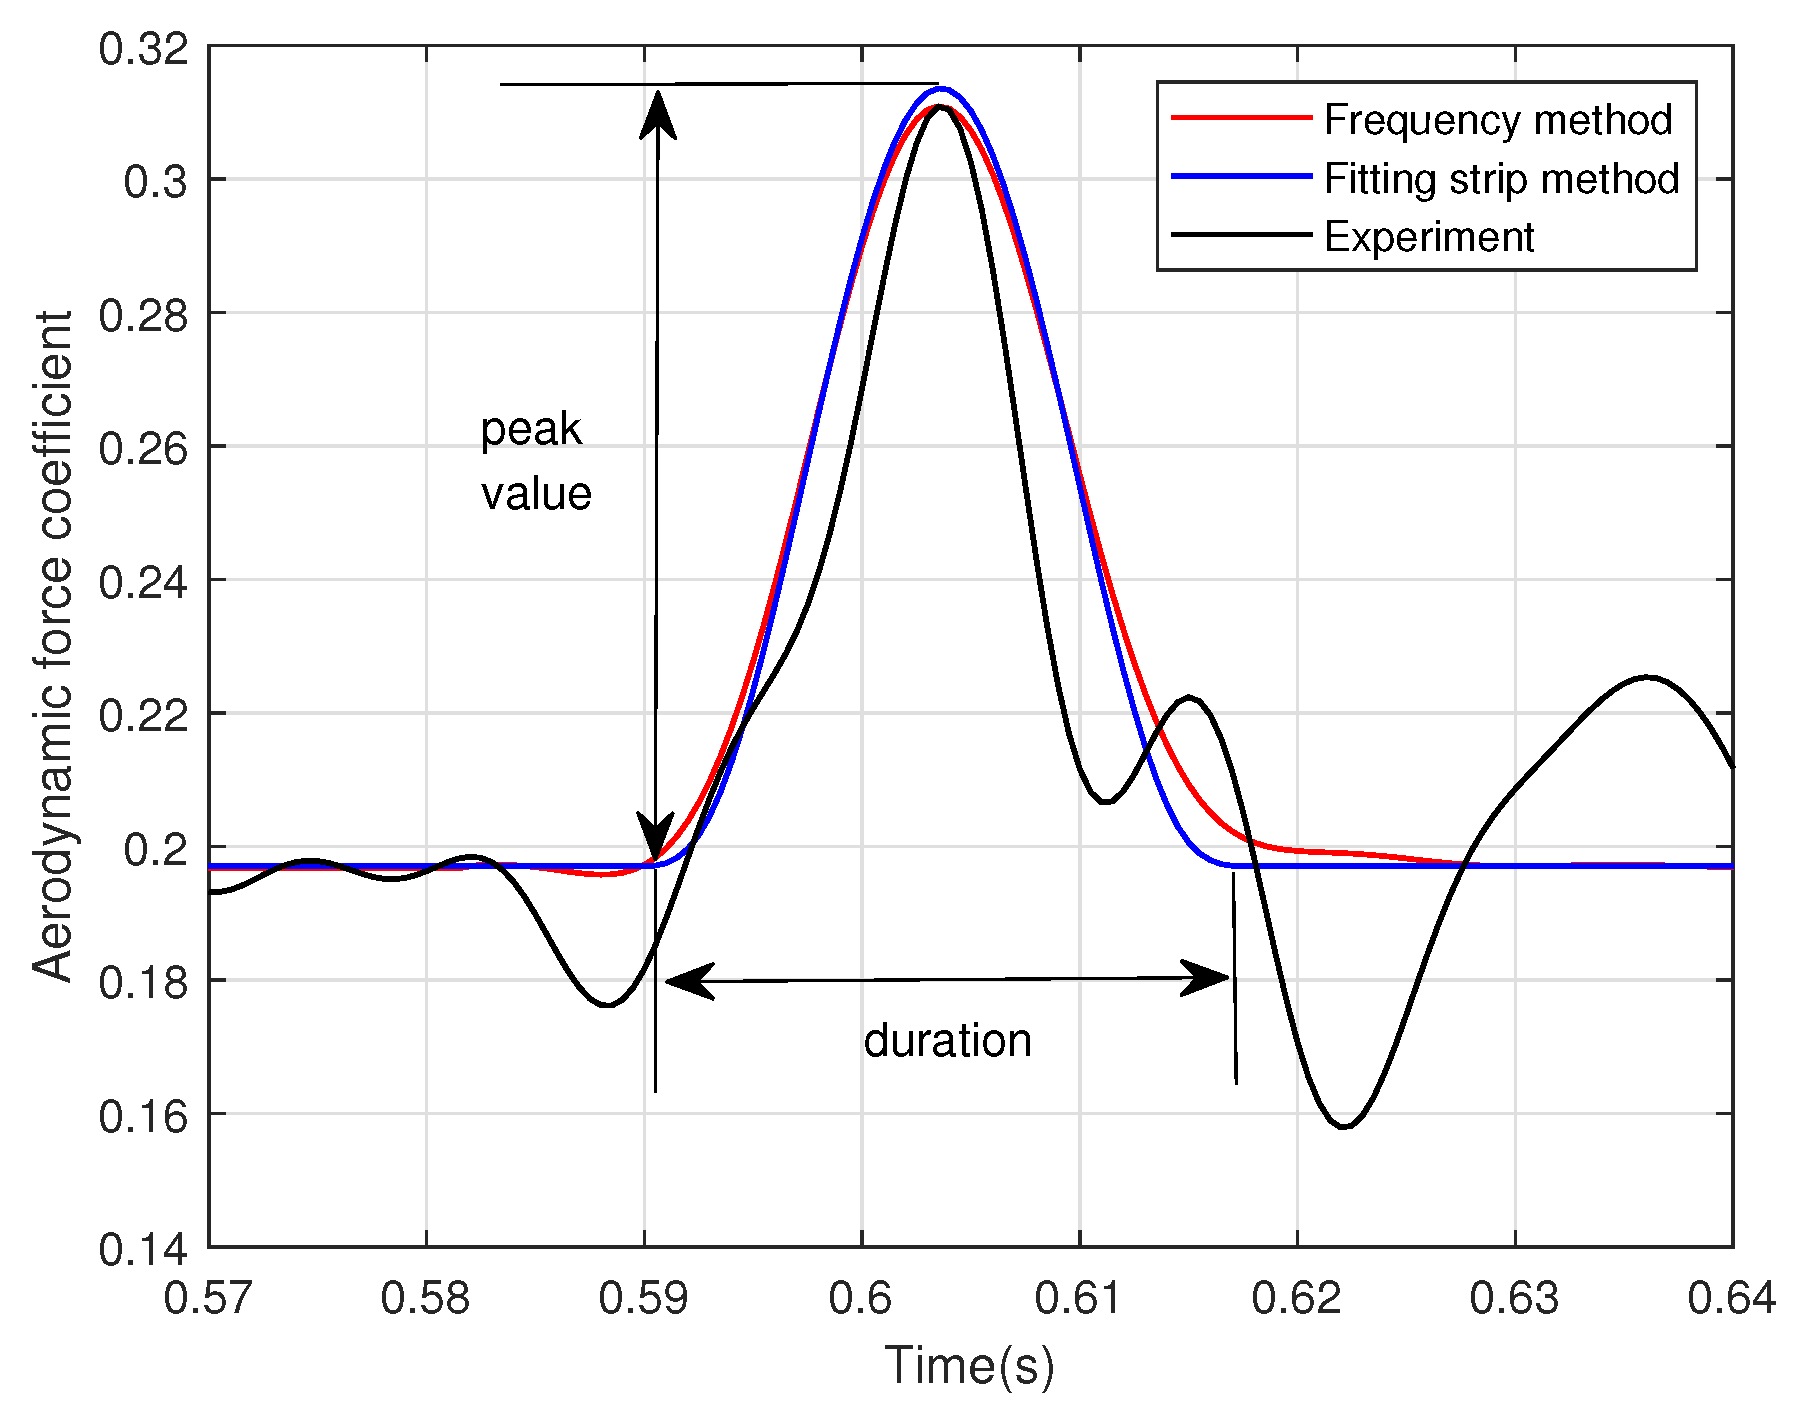
Figure 9 and Figure 10 show the time-domain responses of the aerodynamic force coefficients and wing-root-bending moment coefficients in working condition 1. The red line represents the results of the frequency-domain inverse Fourier transform method, the blue line shows the result of the fitting strip method proposed in this study, and the black line illustrates the results of the wind tunnel test.
Table 3 and Table 4 show the results for the aerodynamic force coefficient and aerodynamic moment coefficient. The peak value is the maximum value minus the constant value. The duration is the duration of the waveform, as shown in Figure 9. The peak value of the aerodynamic force coefficient and the peak value of the wing-root-bending moment coefficient of the different methods in working condition 1 were consistent. The error of the results when using the fitting strip method was slightly larger than that when using the frequency-domain method, with a maximum discrepancy of approximately 3%. For working condition 2, the results of the fitting strip method were highly consistent with those of the frequency-domain inverse Fourier transform method. Although there was a peak error of 6%, which was slightly larger than that in working condition 1, it remained within acceptable limits for flight simulation purposes.
The results for condition 3 were basically consistent with the test results, and the peak error was within 5%. Due to factors such as significant noise in the test data and inherent errors in the method, there were some differences between the test data and the calculation results.
With its high Mach number, the DLM was no longer suitable for solving for the aerodynamic force in transonic condition 4 due to significant errors. The fitting strip method used CFD to compute the aerodynamic force under the calibration conditions and obtain the fitting coefficient. The results of the CFD method and fitting strip method were basically consistent with the test results in terms of the peak value, and the fitting strip method still had a high calculation accuracy.
Table 5 shows the computation time of the three methods with the same eight-core computer. The time taken by CFD was significantly longer than that of the others. Compared with the frequency-domain inverse Fourier transform method, the computing efficiency was also improved.
The comparison between working conditions 1 and 2 shows that the fitting strip method can be applied at different gust scales and achieve good results. The comparison between working conditions 2 and 3 shows that the fitting strip method using the DLM is suitable for subsonic conditions. The comparison between working condition 4 and the other working conditions shows that the fitting strip method using DLM is not suitable for transonic conditions, but when using CFD, it can still solve for the aerodynamic force within gusty environments.

4.4. Calculation Results for Continuous Gusts

A swept-wing model was selected to analyze continuous gusts, and the Dryden model was selected for the gusts. The flight speed was 200 m/s, the root mean square of the gusts was 3.32 m/s, and the gust scale was 100 m.
To simulate continuous gusts, 100 sets of white noise signals were passed through a filter to generate gust signals. Both the frequency-domain method and the fitting strip method were used to compute the gust aerodynamic forces, which were then integrated into the structural model to calculate the accelerometer responses. During the calculations, the aerodynamic force caused by deformation was calculated with other methods. The time-domain results were then subjected to power spectral density analysis and converted into the frequency domain for comparison.
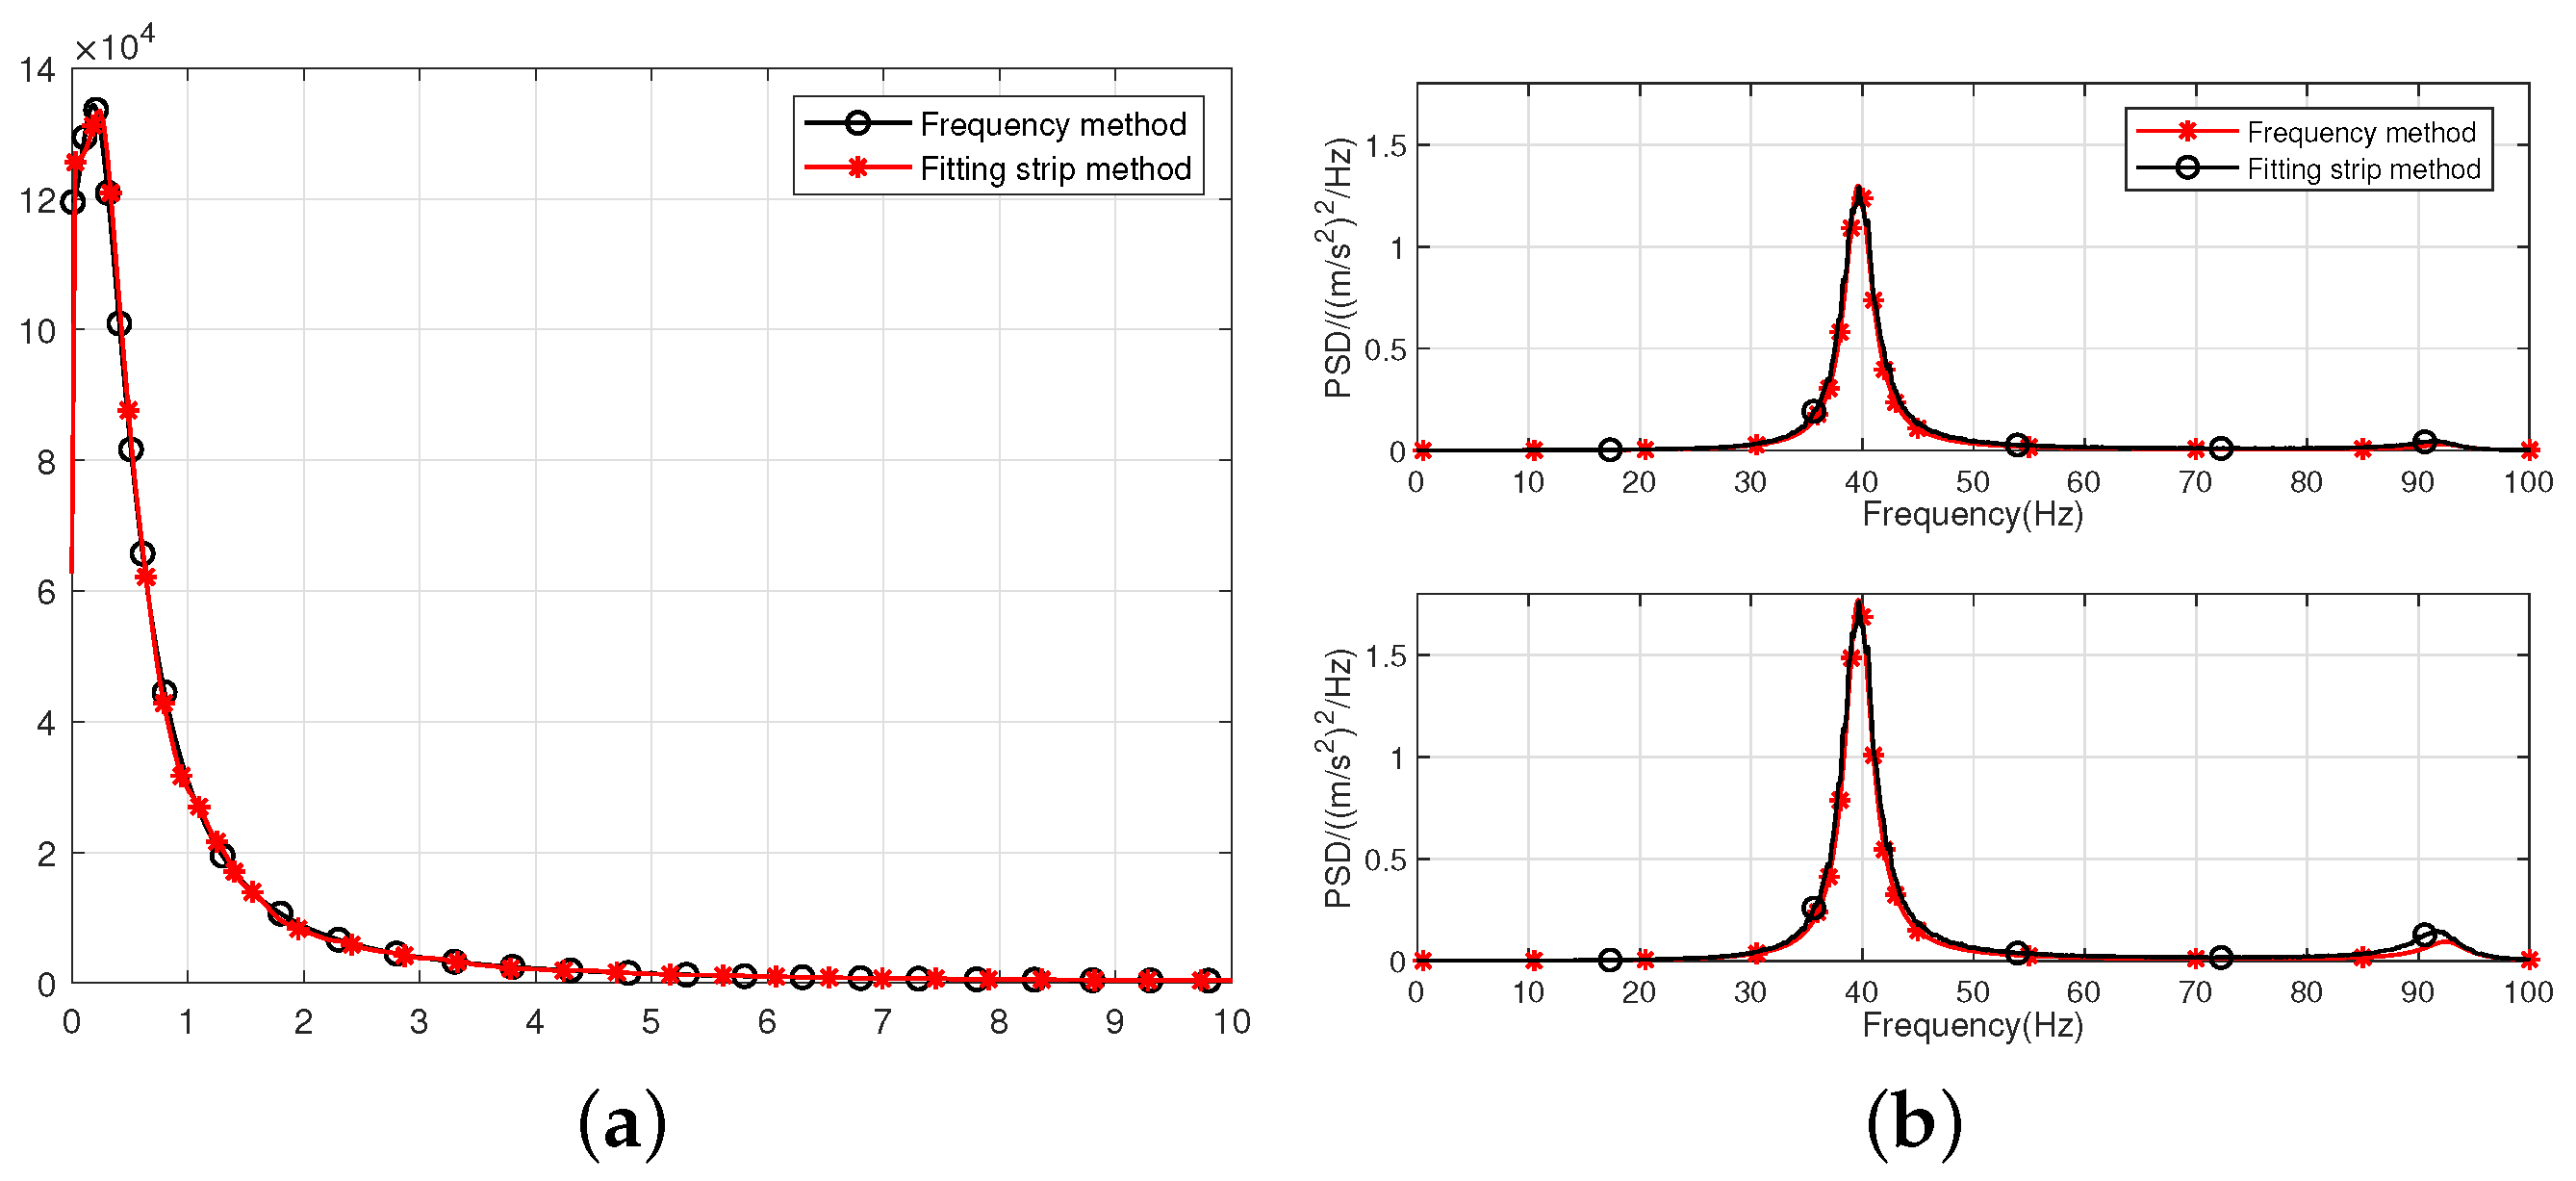
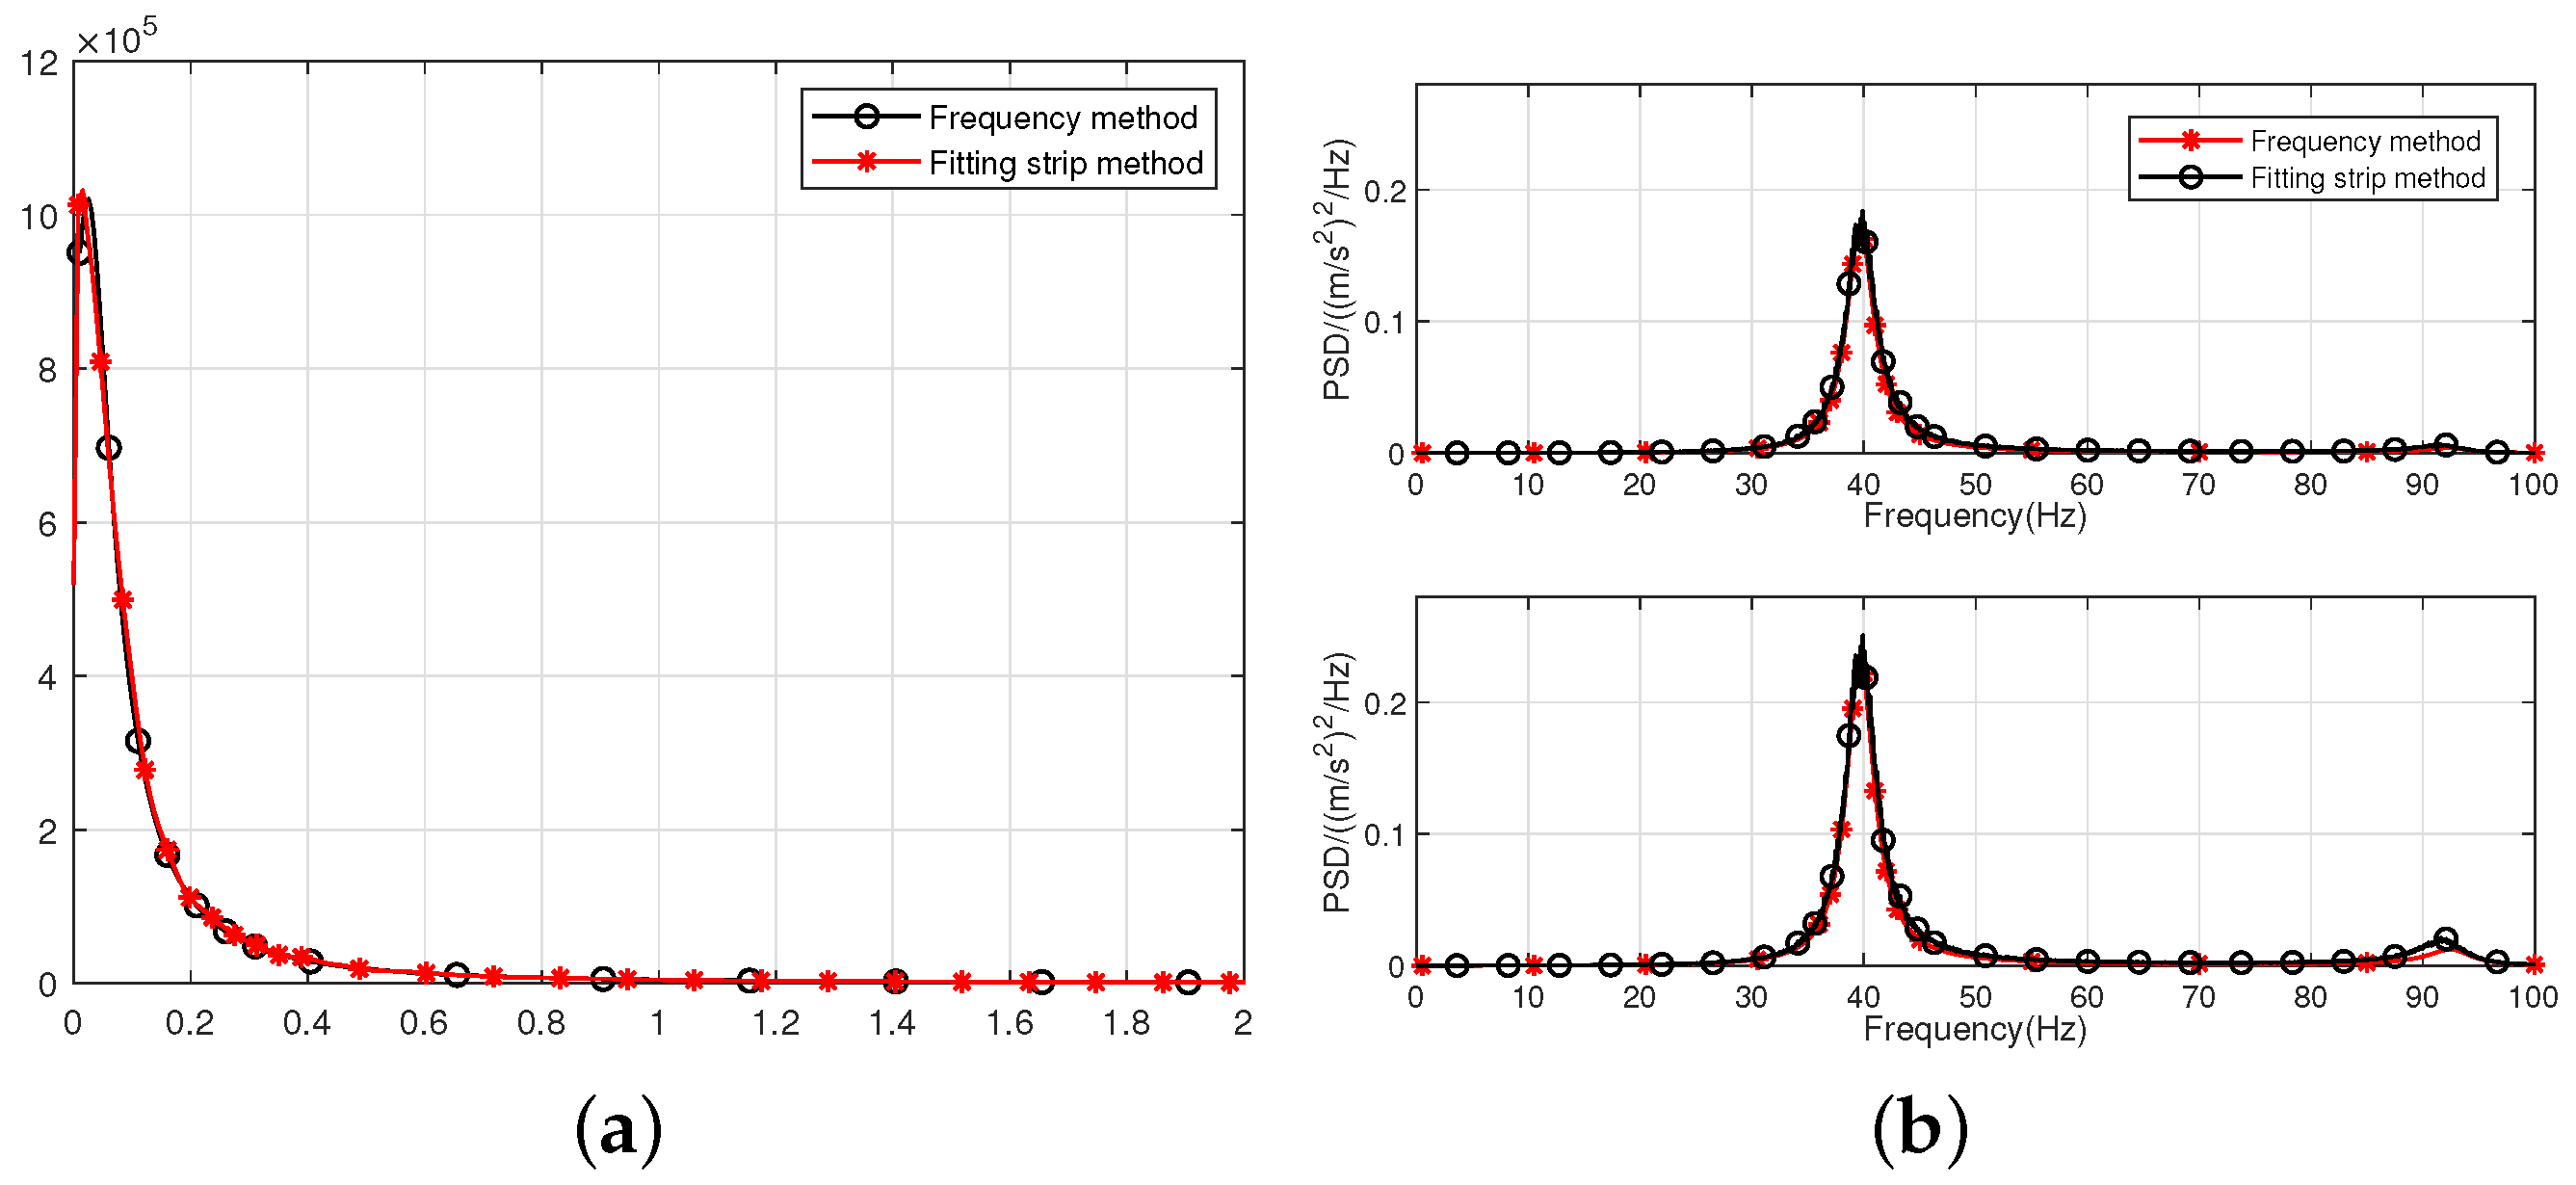
In Figure 11a shows a comparison of the aerodynamic force and Figure 11b shows a comparison of the accelerometer response. The red line shows the results of the frequency-domain method, and the black line shows the results of the fitting strip method. The two curves of aerodynamic force coincided with each other, which proved that the aerodynamic force calculated with the fitting strip method was consistent with the results of the DLM. In Figure 11b, the two curves exhibited consistency in terms of the peak value and the frequency near the first-order mode of the wing. Because of the fitting error of the second-order aerodynamic force, there were slight differences in the peak values near the frequency of the wing’s second-order mode.
In the same way, calculations were conducted for working conditions with a gust scale of 760 m. A comparison of the aerodynamic force is shown in Figure 12a. The two curves were basically consistent. A comparison of the accelerometer response is shown in Figure 12b. Compared with Figure 11b, the frequency-domain response amplitude of the accelerometer was relatively reduced. The increase in the gust scale was equivalent to the gust becoming milder, resulting in a decrease in the response.
It can be seen from the comparison that the fitting strip method is suitable for calculating continuous gusts. The results are accurate and effective, and the accuracy can meet engineering requirements.

5. Comparison of Different Methods

5.1. Model of a Normal-Layout Aircraft

As shown in Figure 13, a simplified structural model of a normal-layout aircraft was established as the calculation object. It was assumed in the calculation that the aircraft model was rigidly fixed, with neither rigid-body motion nor elastic deformation.
Figure 14 shows the aerodynamic mesh of the DLM. The wing was located at 17.3 m, and the tail was located at 37.8 m. The working condition parameters were as follows: Ma = 0.6, the flight altitude was 6000 m, atmospheric density was 0.66 kg / m 3 , flight speed was 190 m/s, and reference chord length was 1.5 m. The gust model was a 1-cos gust, the maximum gust velocity was 12 m/s, and the gust scale was 75 m.
A total of four methods were selected for the calculation of the time-domain aerodynamic force, and the results are compared.
(1) Frequency-domain inverse Fourier transform method: This method provided the most accurate results and served as the baseline for comparing the results of the other methods.
(2) Rational function approximation method: The gust reference point was uniformly selected at x 0 = 0 at the nose, and then rational function fitting was performed.
(3) Time-domain solution method for gust grouping: Different gust reference points were selected for the wing and tail. The wing reference point was selected at x 0 1 = 17.3 m, and the tail reference point was selected at x 0 2 = 37.8 m. Then, RFA was used to calculate the aerodynamic forces of the wings and tail, which were subsequently combined to obtain the aerodynamic forces on the aircraft.
(4) The fitting strip method proposed in this study.

5.2. Calculation Results

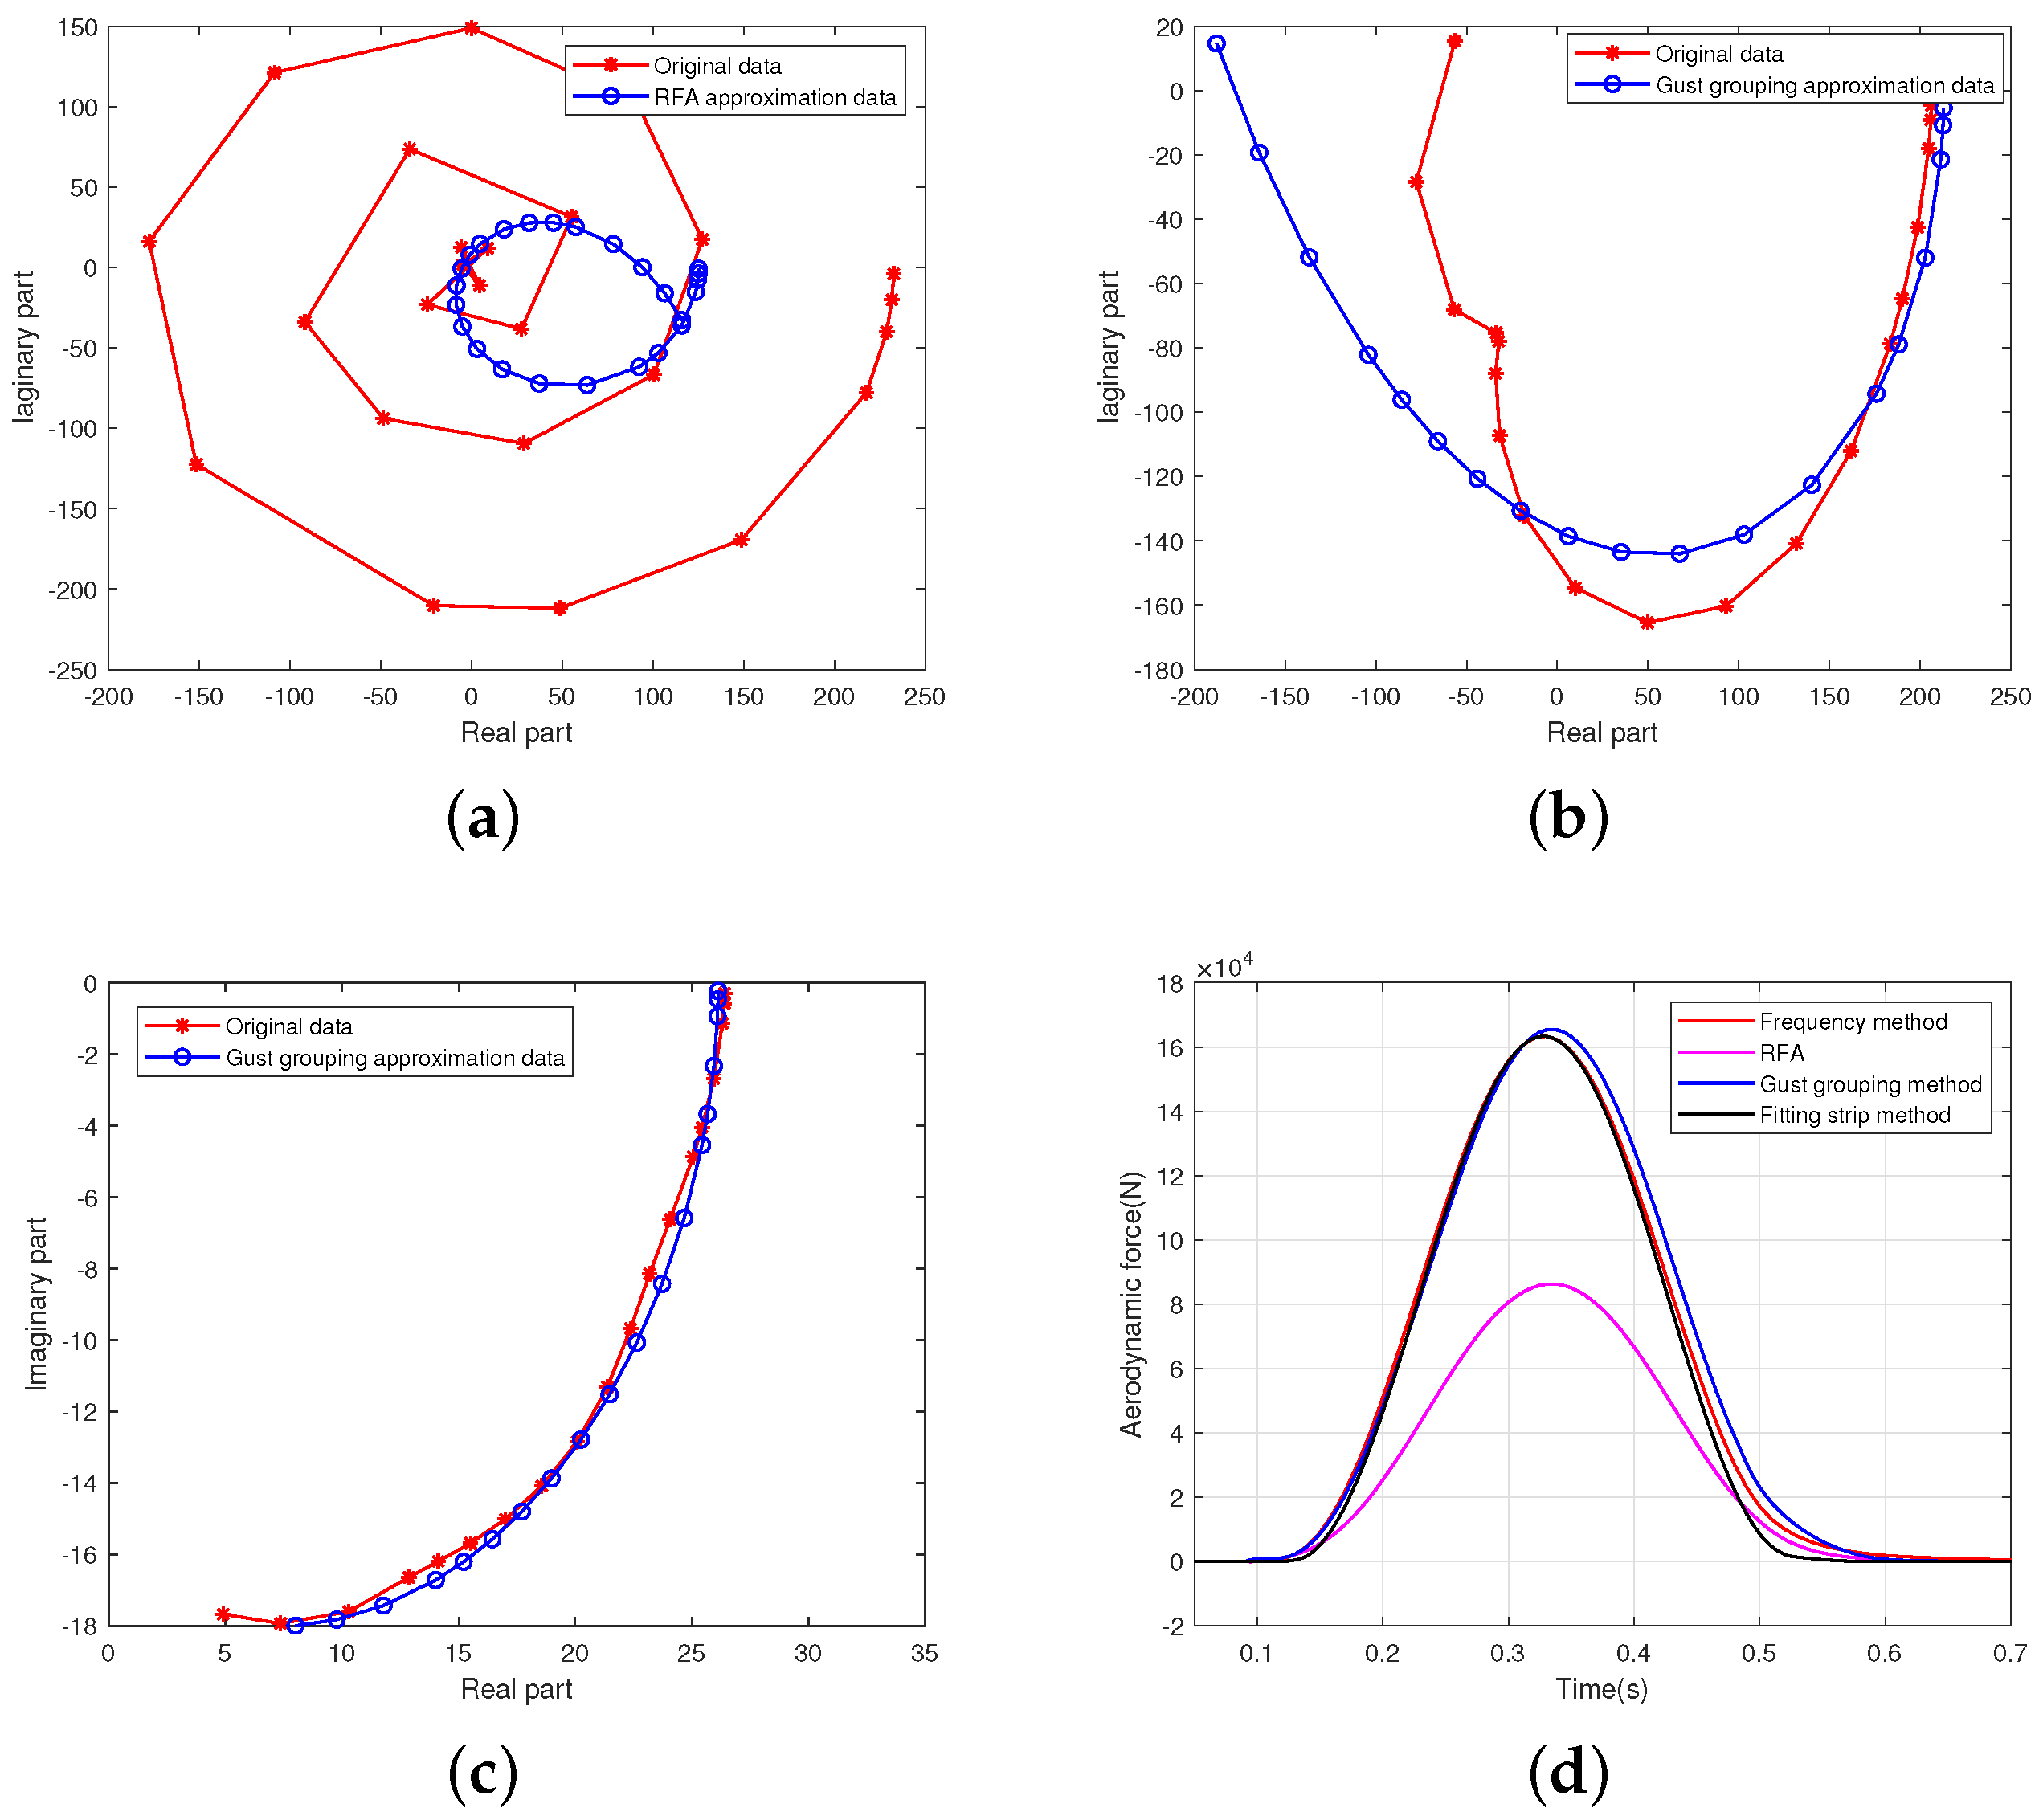
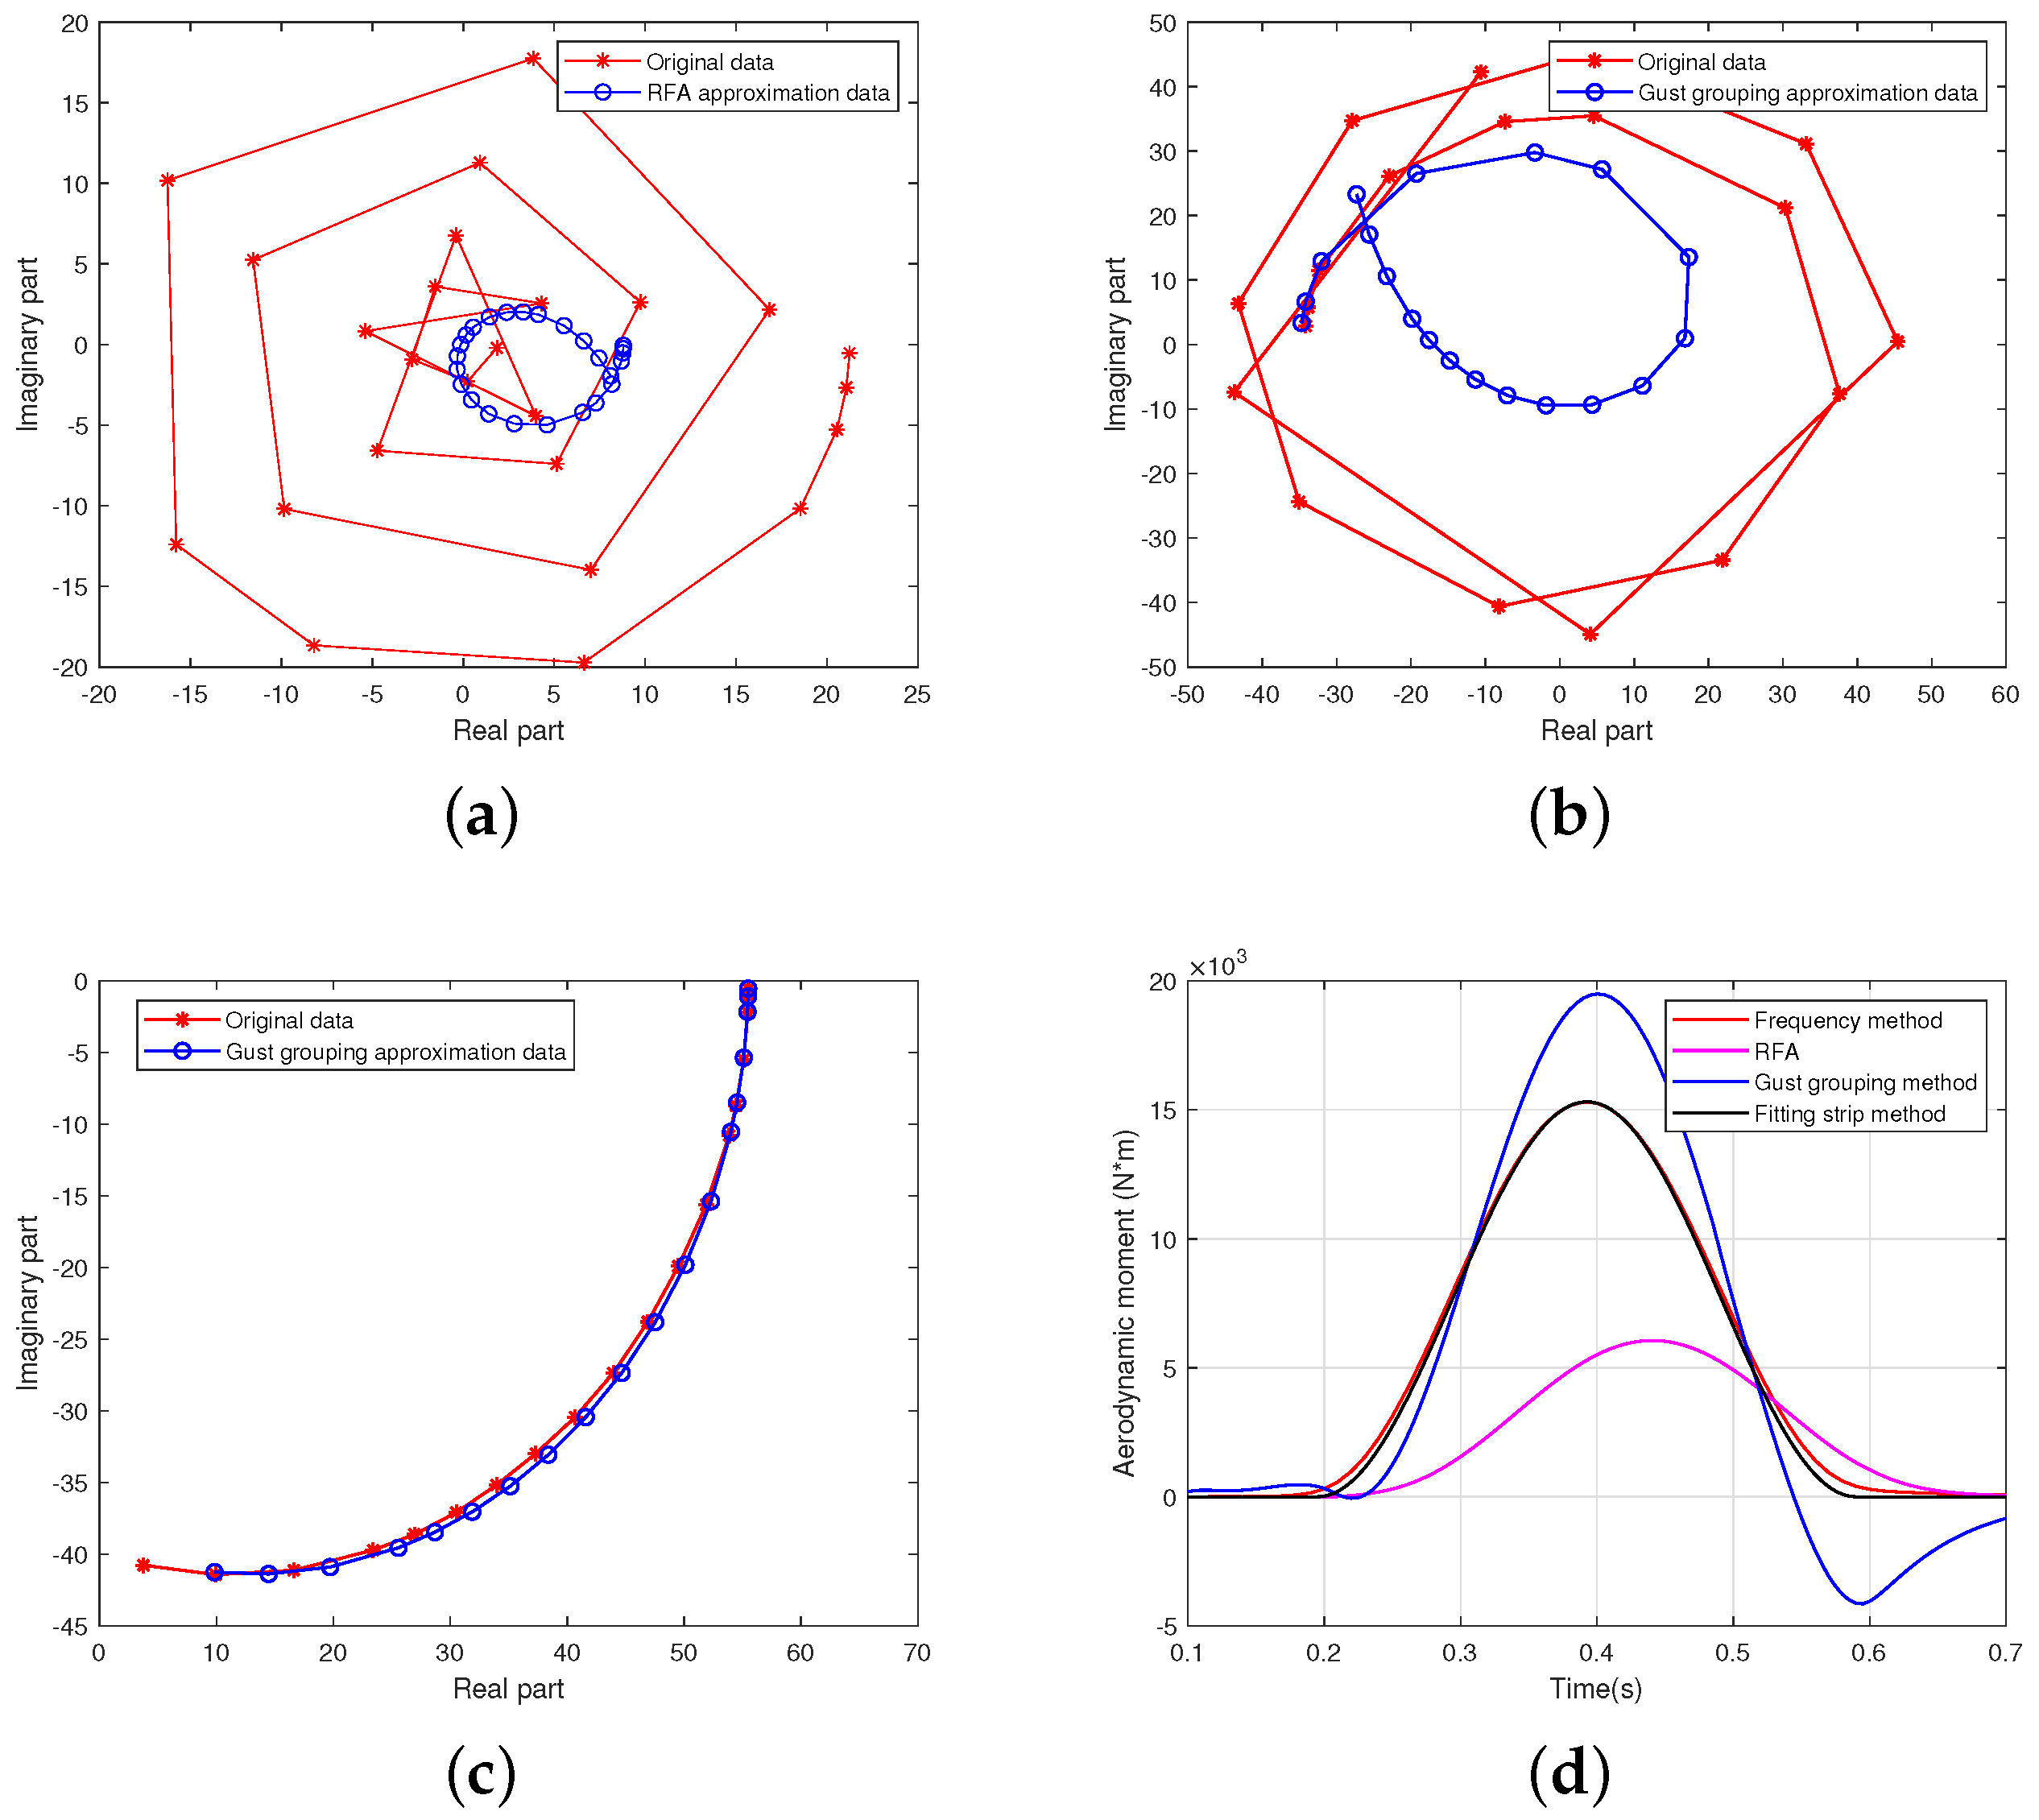
Figure 15 shows the curve of the lift coefficient of the aircraft: Figure 15a shows the approximation curve when the wing and tail were treated as a whole object, as employed in RFA; Figure 15b shows an approximation curve of the wing when the wing and tail were fitted separately, as in the gust grouping method; Figure 15c shows the approximation curve of the tail when the wing and tail were fitted separately, as in the gust grouping method. It can be seen that when the wing and tail were fitted as a whole, the curve was highly spiralized, and the fitting effect was very poor. When fitting them separately, the wing fitting effect was improved, but there was still a certain error.
Figure 15d shows the aerodynamic time-domain curves calculated with the four different methods. The results of the fitting strip method proposed in this study were basically consistent with those of the frequency-domain inverse Fourier transform method. The peak error between the curve of the gust grouping method and the baseline curve was only 1.3%, and there was a slight lag in the peak time. However, the error between RFA and the baseline curve was large, exceeding 40%.
Figure 16 shows the curve of the wing root aerodynamic bending moment coefficient: Figure 16a shows RFA’s approximation curve when the wing and tail were treated as a whole object; Figure 16b shows the gust grouping method’s approximation curve of the wing when the wing and tail were fitted separately; Figure 16c shows the gust grouping method’s approximation curve of the tail when the wing and tail were fitted separately. It can be seen that there were large errors in both the rational function approximation method and the gust grouping method.
Figure 16d shows the time-domain curves of the wing root aerodynamic bending moment calculated with the four different methods. The results were generally consistent with the baseline results, except for the result of RFA. Despite the large fitting curve error of the gust grouping method, its results for the wing root aerodynamic bending moment remained accurate.
The wing root aerodynamic bending moment was primarily influenced by the wing rather than the tail. The fitting of the low-frequency part in Figure 16b was accurate, and the aerodynamics also operated within the low-frequency range. Thus, the results for the wing root aerodynamic bending moment were accurate.The inaccurate fitting in Figure 16c had little impact on the wing root aerodynamic bending moment.
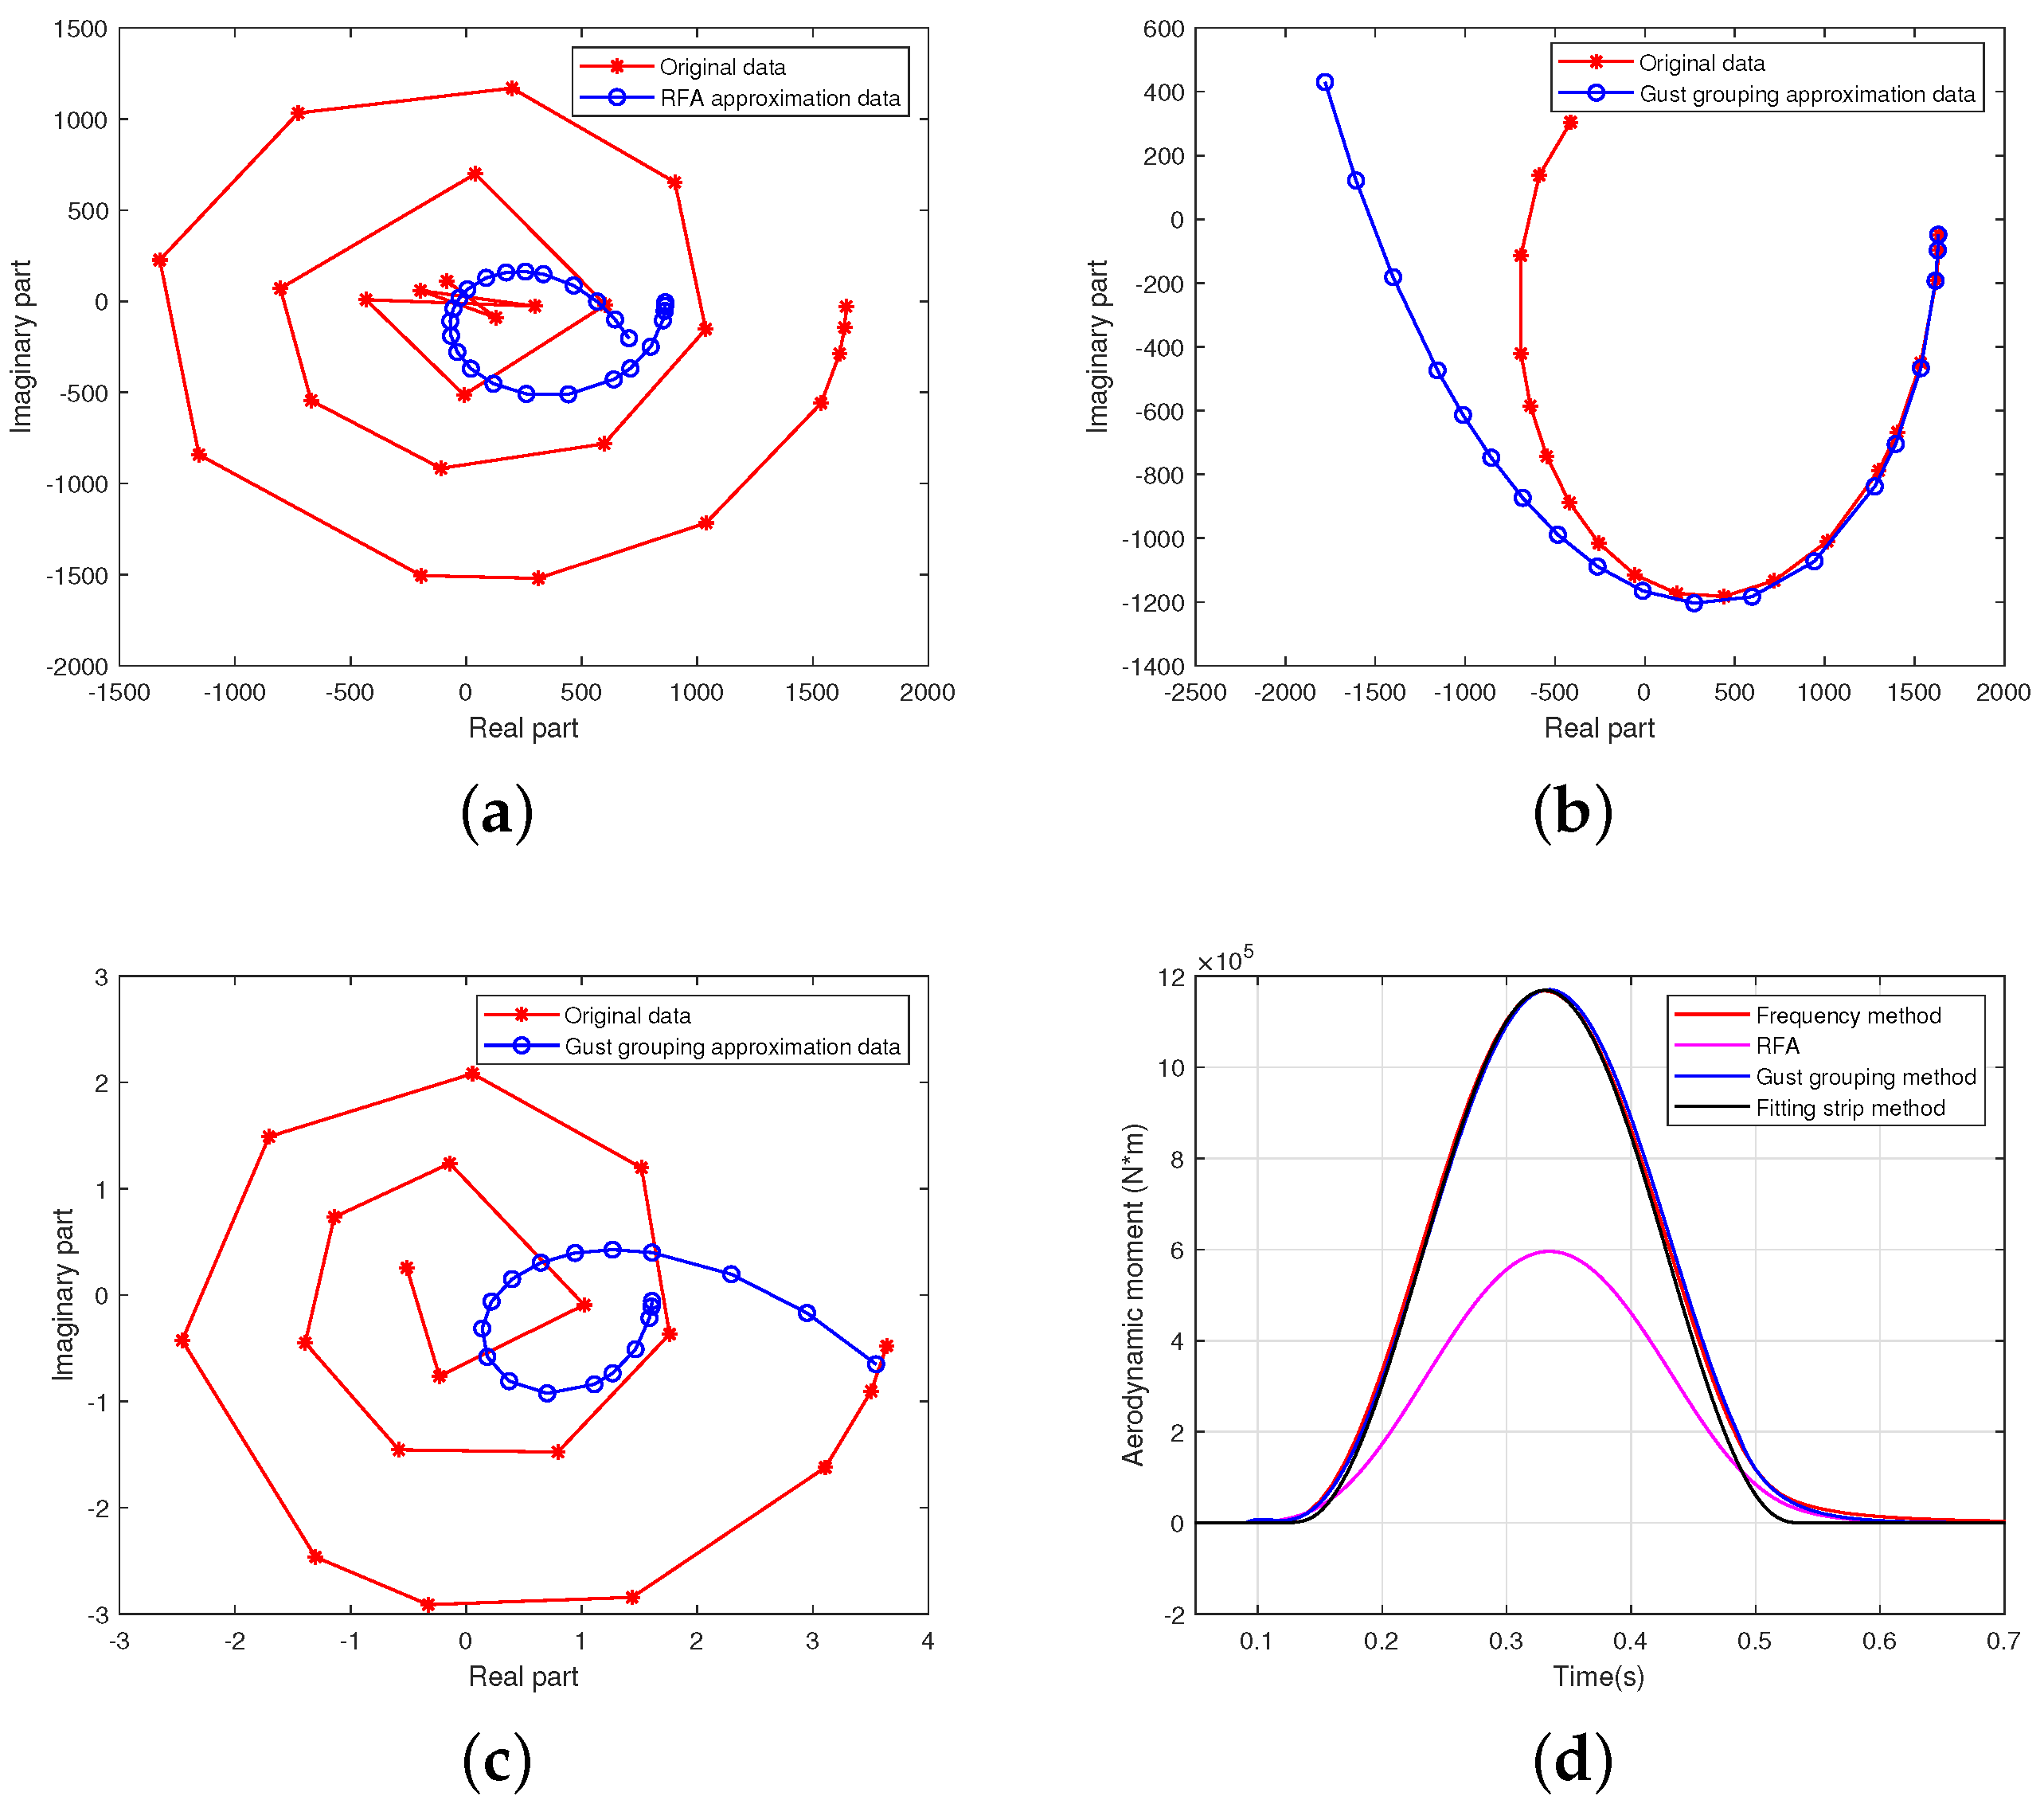
Figure 17 shows the curve of the tail root aerodynamic bending moment: Figure 17a shows RFA’s approximation curve when the wing and tail were treated as a whole object; Figure 17b shows the gust grouping method’s approximation curve when the wing was treated separately, while Figure 17c focuses on the tail. It is obvious that the fitting curve of RFA was highly spiralized. The wing-fitting curve of the gust grouping method was highly spiralized, and the fitting curve of the tail wing was accurate. The peak error of the RFA exceeded 60%, and the peak occurred with an obvious time lag. The results of the gust grouping method were relatively improved. The time of peak occurrence was calculated accurately, but the error remained at 27%.
Figure 17d shows the time-domain curves of the tail wing root aerodynamic bending moment calculated with the four different methods. The results of the fitting strip method were basically consistent with the baseline results. However, the peak error obtained by fitting the overall rational function exceeded 60% with a noticeable lag in peak occurrence.
The calculation results of the gust grouping method were better than those of RFA. Both the lift of the aircraft and the wing root aerodynamic bending moment had a little deviation from the baseline results. However, the tail root aerodynamic bending moment showed a significant deviation, approximately 25%, which did not meet the requirements of the calculation.
The lift of the aircraft and the wing root aerodynamic bending moment were mainly influenced by the wing and were less affected by the tail wing. Even though the fitting results of the tail wing were not accurate, the calculation was relatively accurate. The tail wing root aerodynamic bending moment was determined by combining the fitting results of the wing and the tail wing. However, the impact of the wing on it was relatively large, and the fitting accuracy was poor. Therefore, the tail wing root aerodynamic bending moment exhibited a considerable error.
The results obtained with the proposed fitting strip method exhibited notable improvements compared to those obtained with the RFA and gust grouping methods for the normal-layout aircraft. The results were consistent with those of the frequency-domain inverse Fourier transform method in terms of the load peak value and peak occurrence time, thus meeting engineering needs.

6. Application

In this section, an aircraft with a large aspect ratio was selected as the research object. A time-domain flight simulation with continuous gusts was calculated to prove the applicability of the fitting strip method in real-time flight simulations.

6.1. Calculation Model

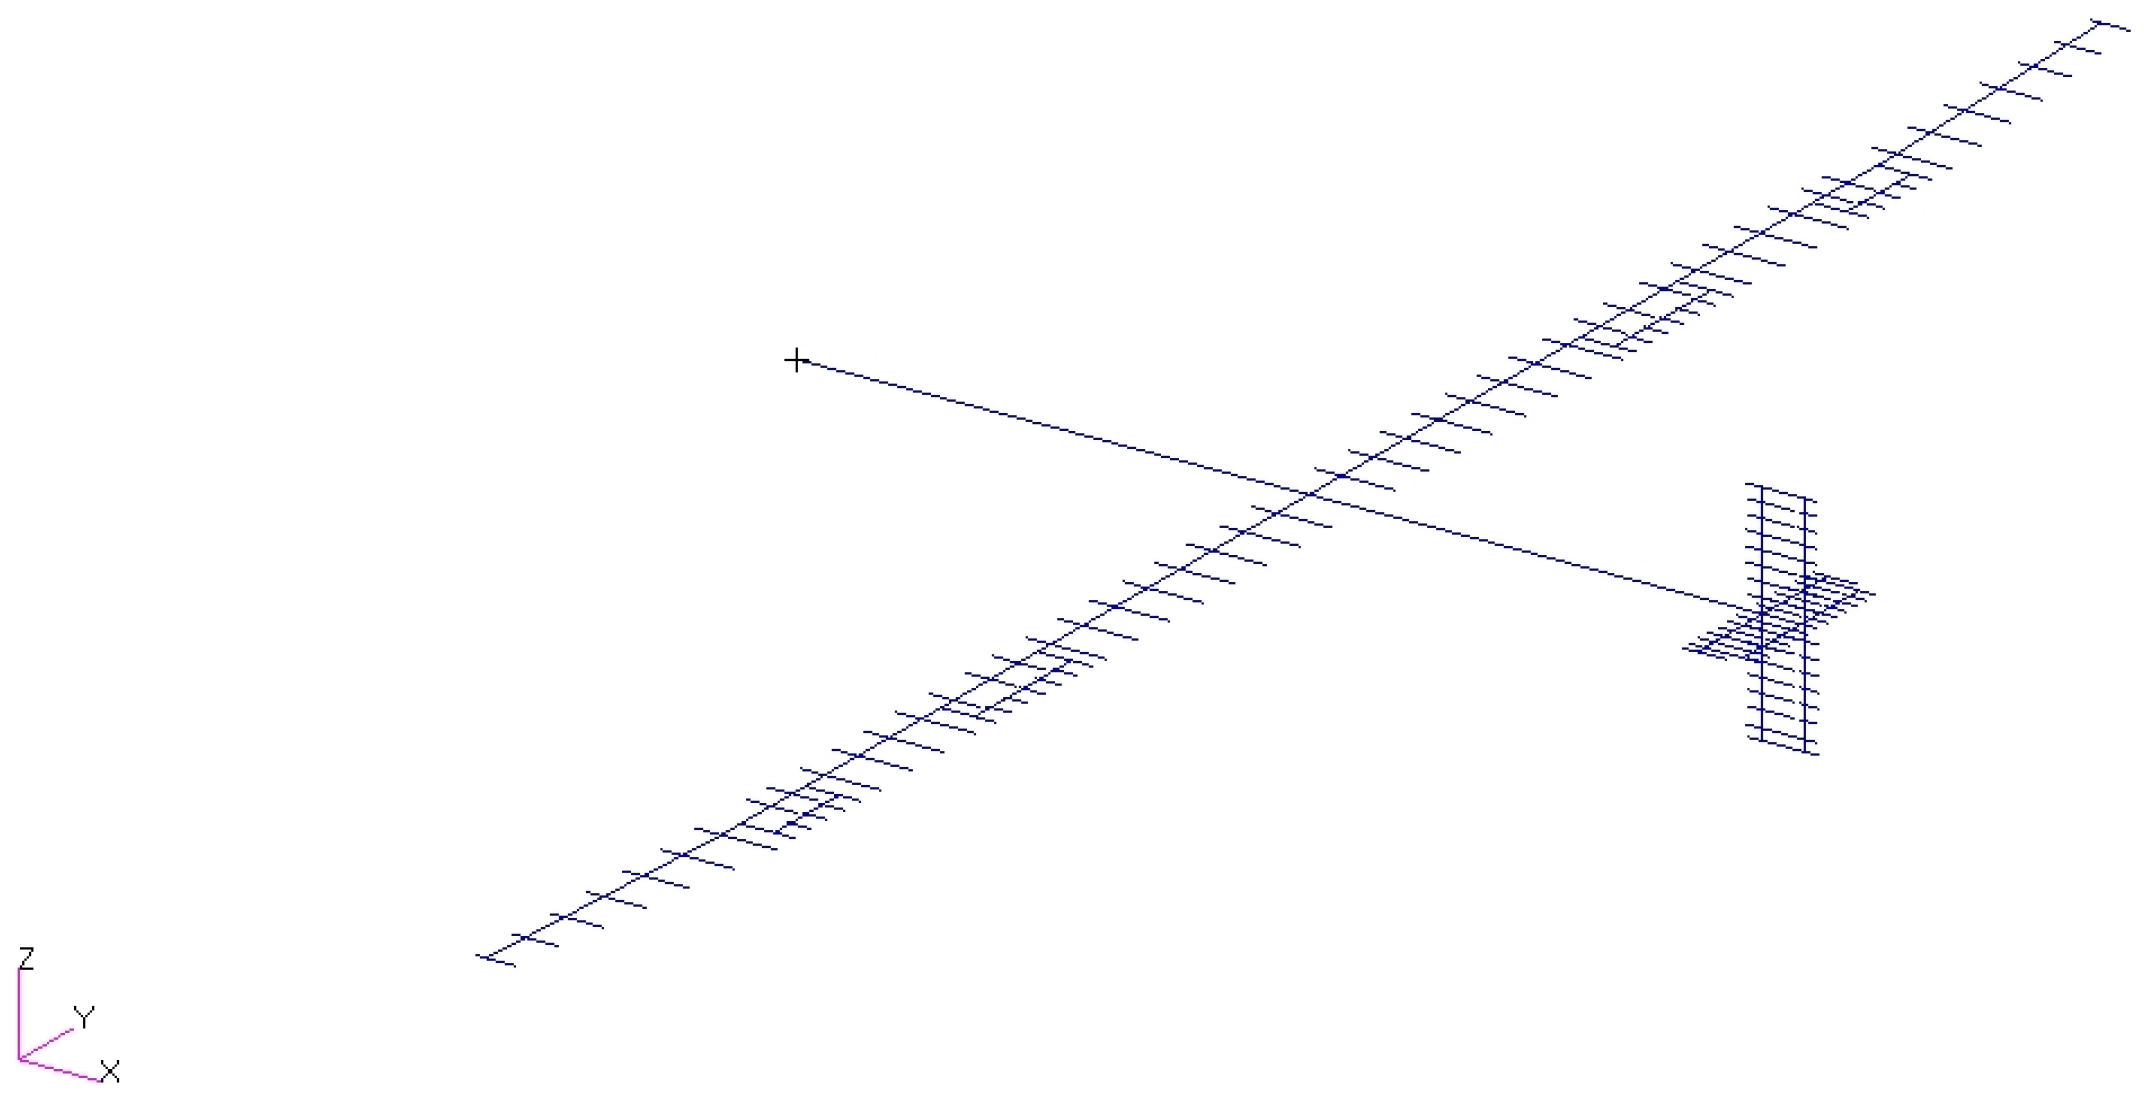
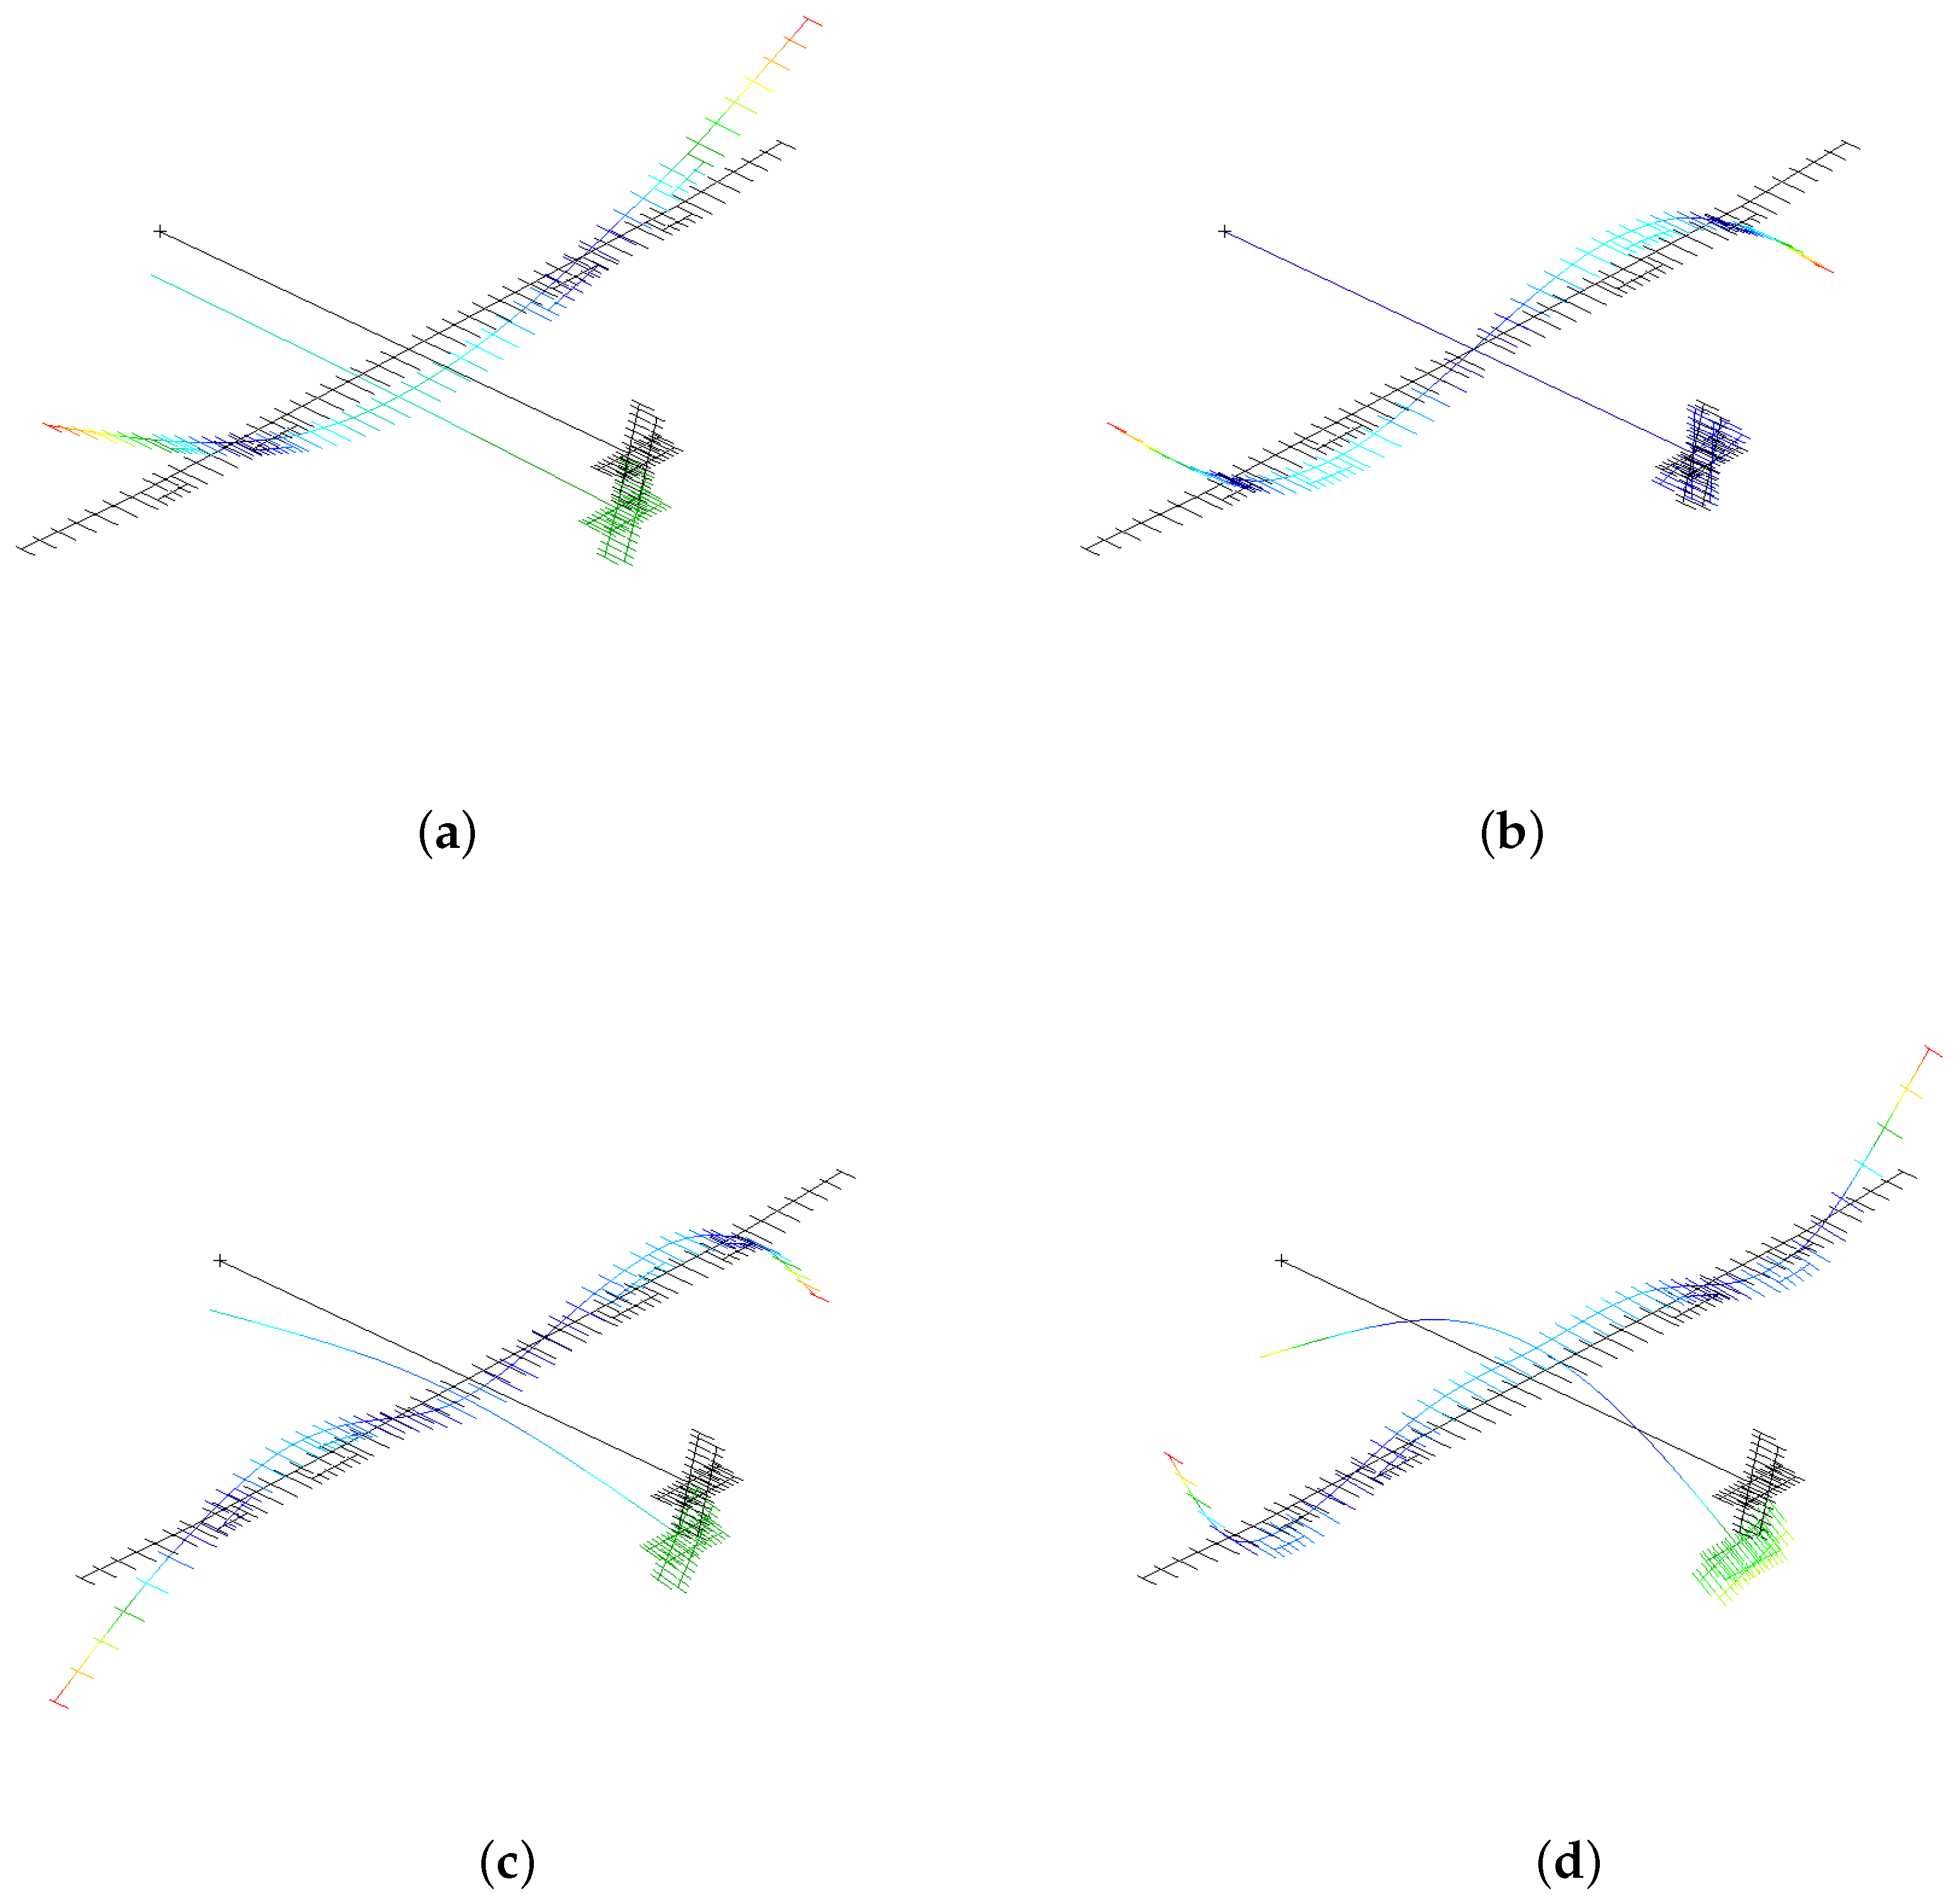
A finite element model of an aircraft with a large aspect ratio was established, and a modal analysis was performed, as shown in Figure 18. The first ten elastic modes were used in the simulation, as shown in Table 6. The first four mode shapes are shown in Figure 19.
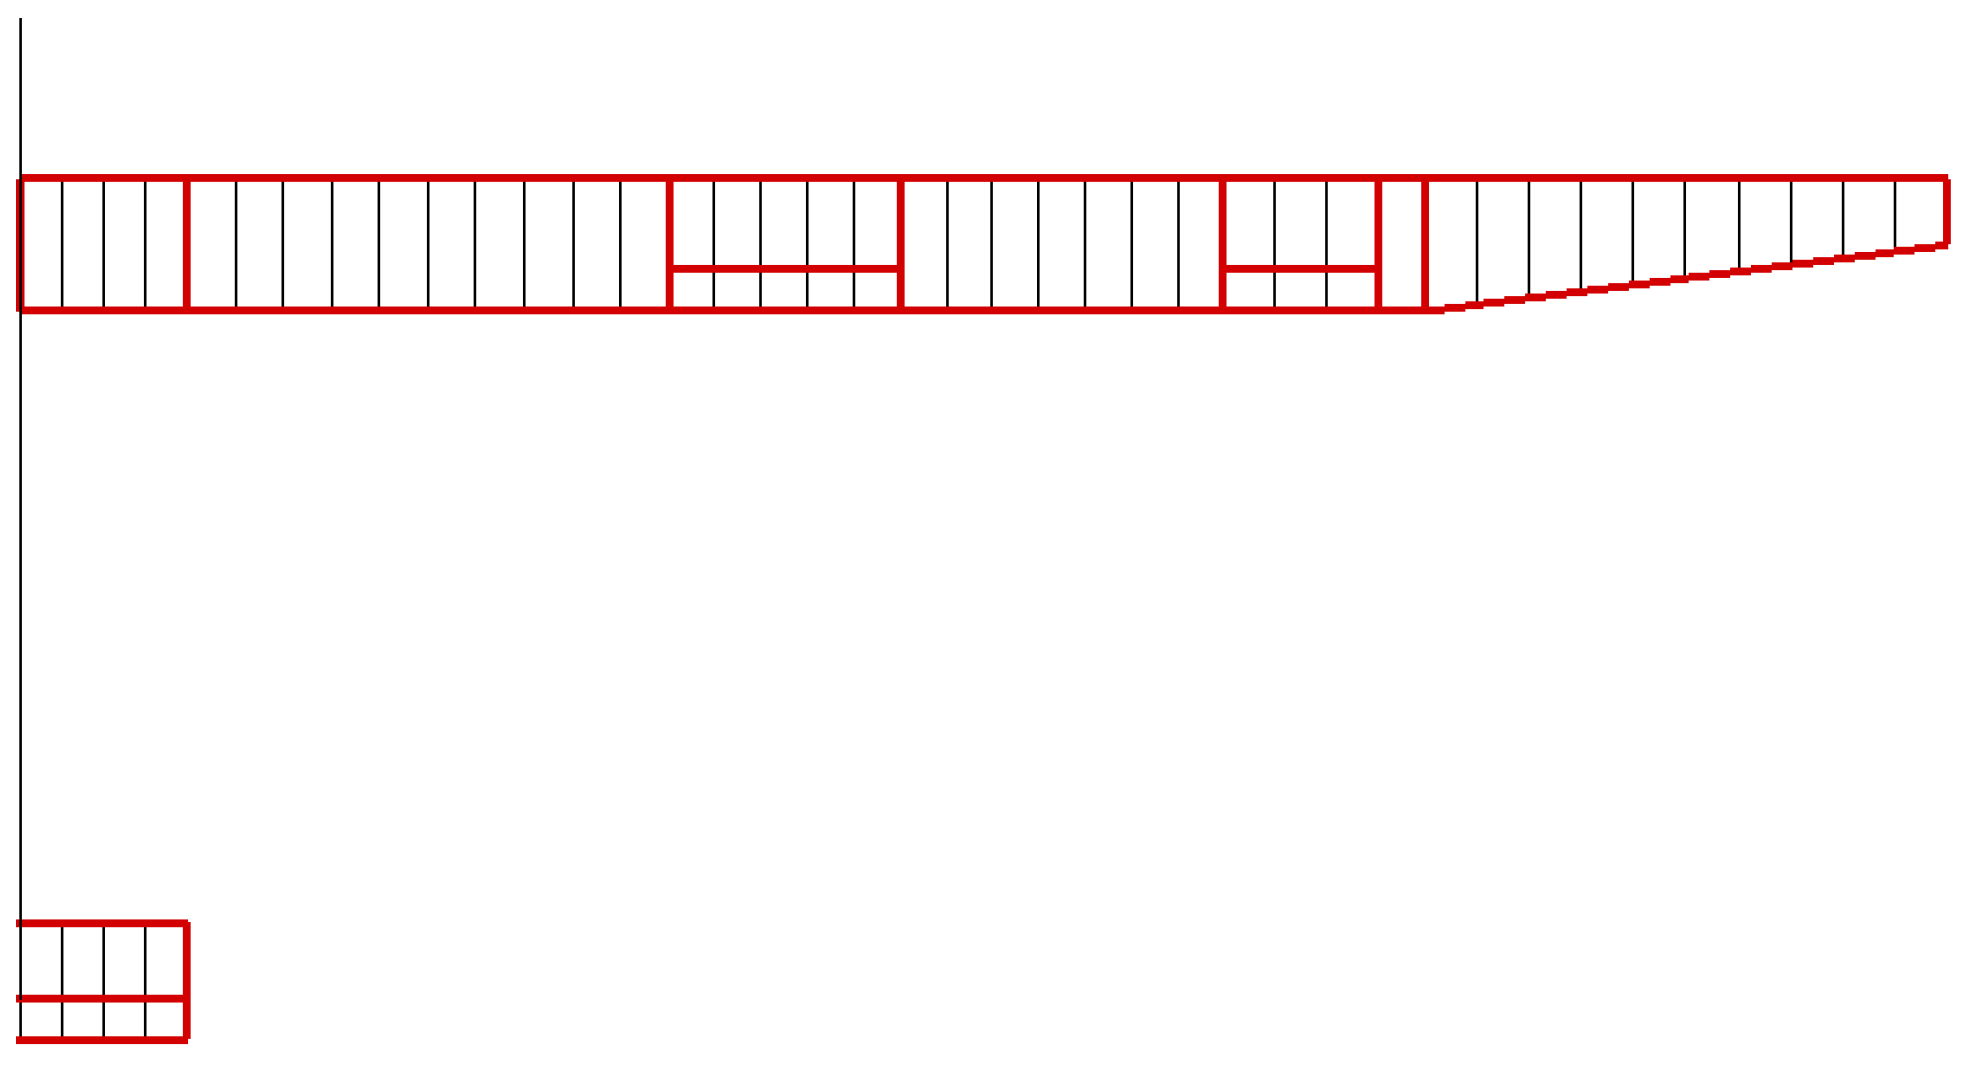
Based on the fitting strip method, the wing, horizontal tail, and vertical tail of the model were divided into 80, 8, and 8 aerodynamic strips, respectively, as shown in Figure 20.
For each strip, the aerodynamic forces of the rigid body, elasticity, and rudders were calculated according to the quasi-steady aerodynamic theory, while the gust aerodynamic force was computed with the fitting strip method.
Rigid aircraft flight simulation technology has reached a mature stage. To reduce computational costs, an elastic flight simulation was carried out based on a rigid-body flight simulation and the idea of an elastic patch module [25]. The simulation framework was built as shown in Figure 21. In this figure, η represents the rigid-body parameter, ξ is the elastic parameter, δ is the rudder control variable, x a is the state vector introduced by the aerodynamic lag root, F r is the rigid-body aerodynamic force, F e is the elastic aerodynamic force, and F w is the gust aerodynamic force.

6.2. Calculation Results of the Flight Simulation

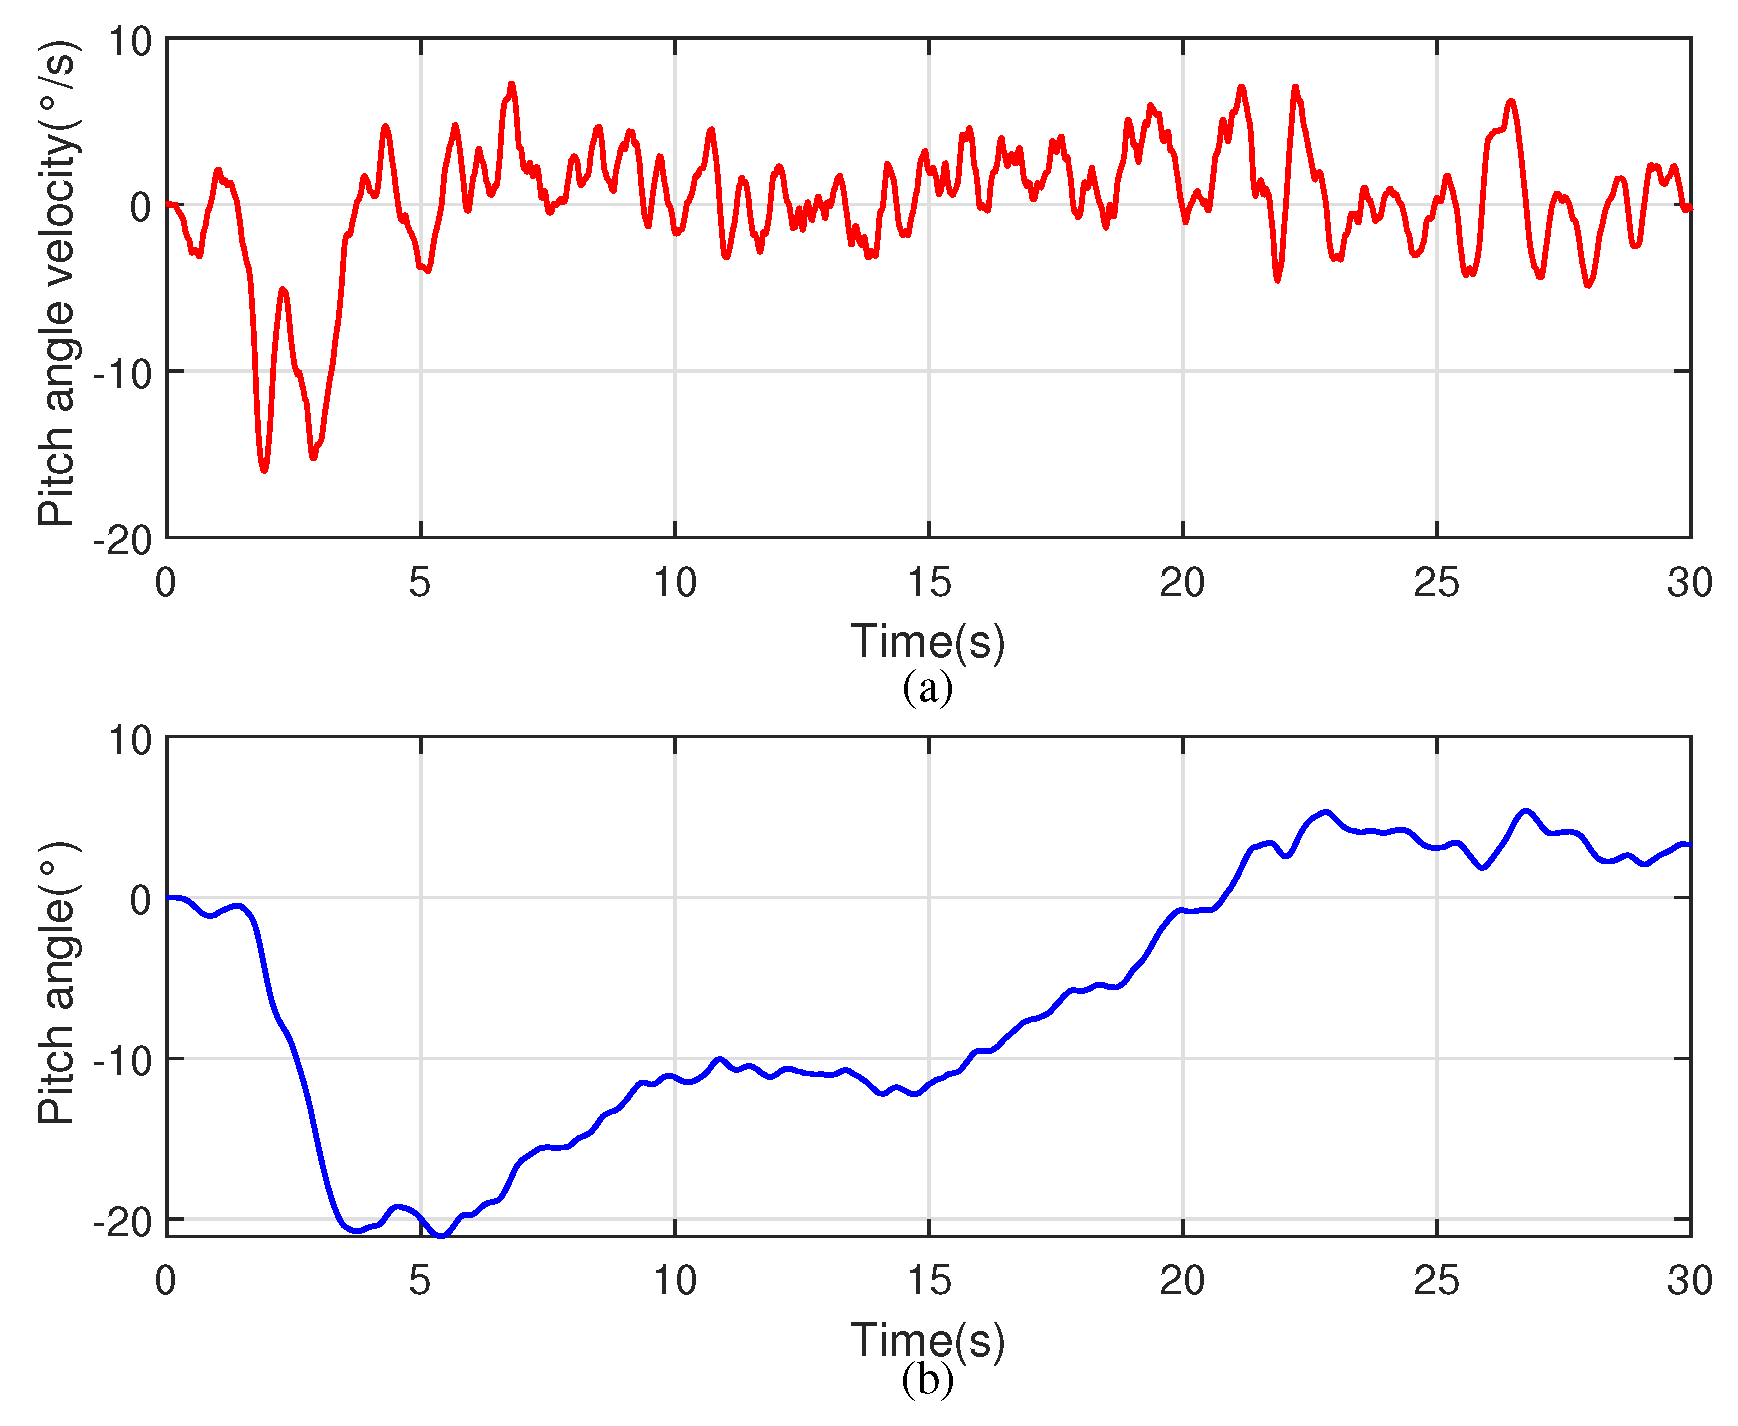
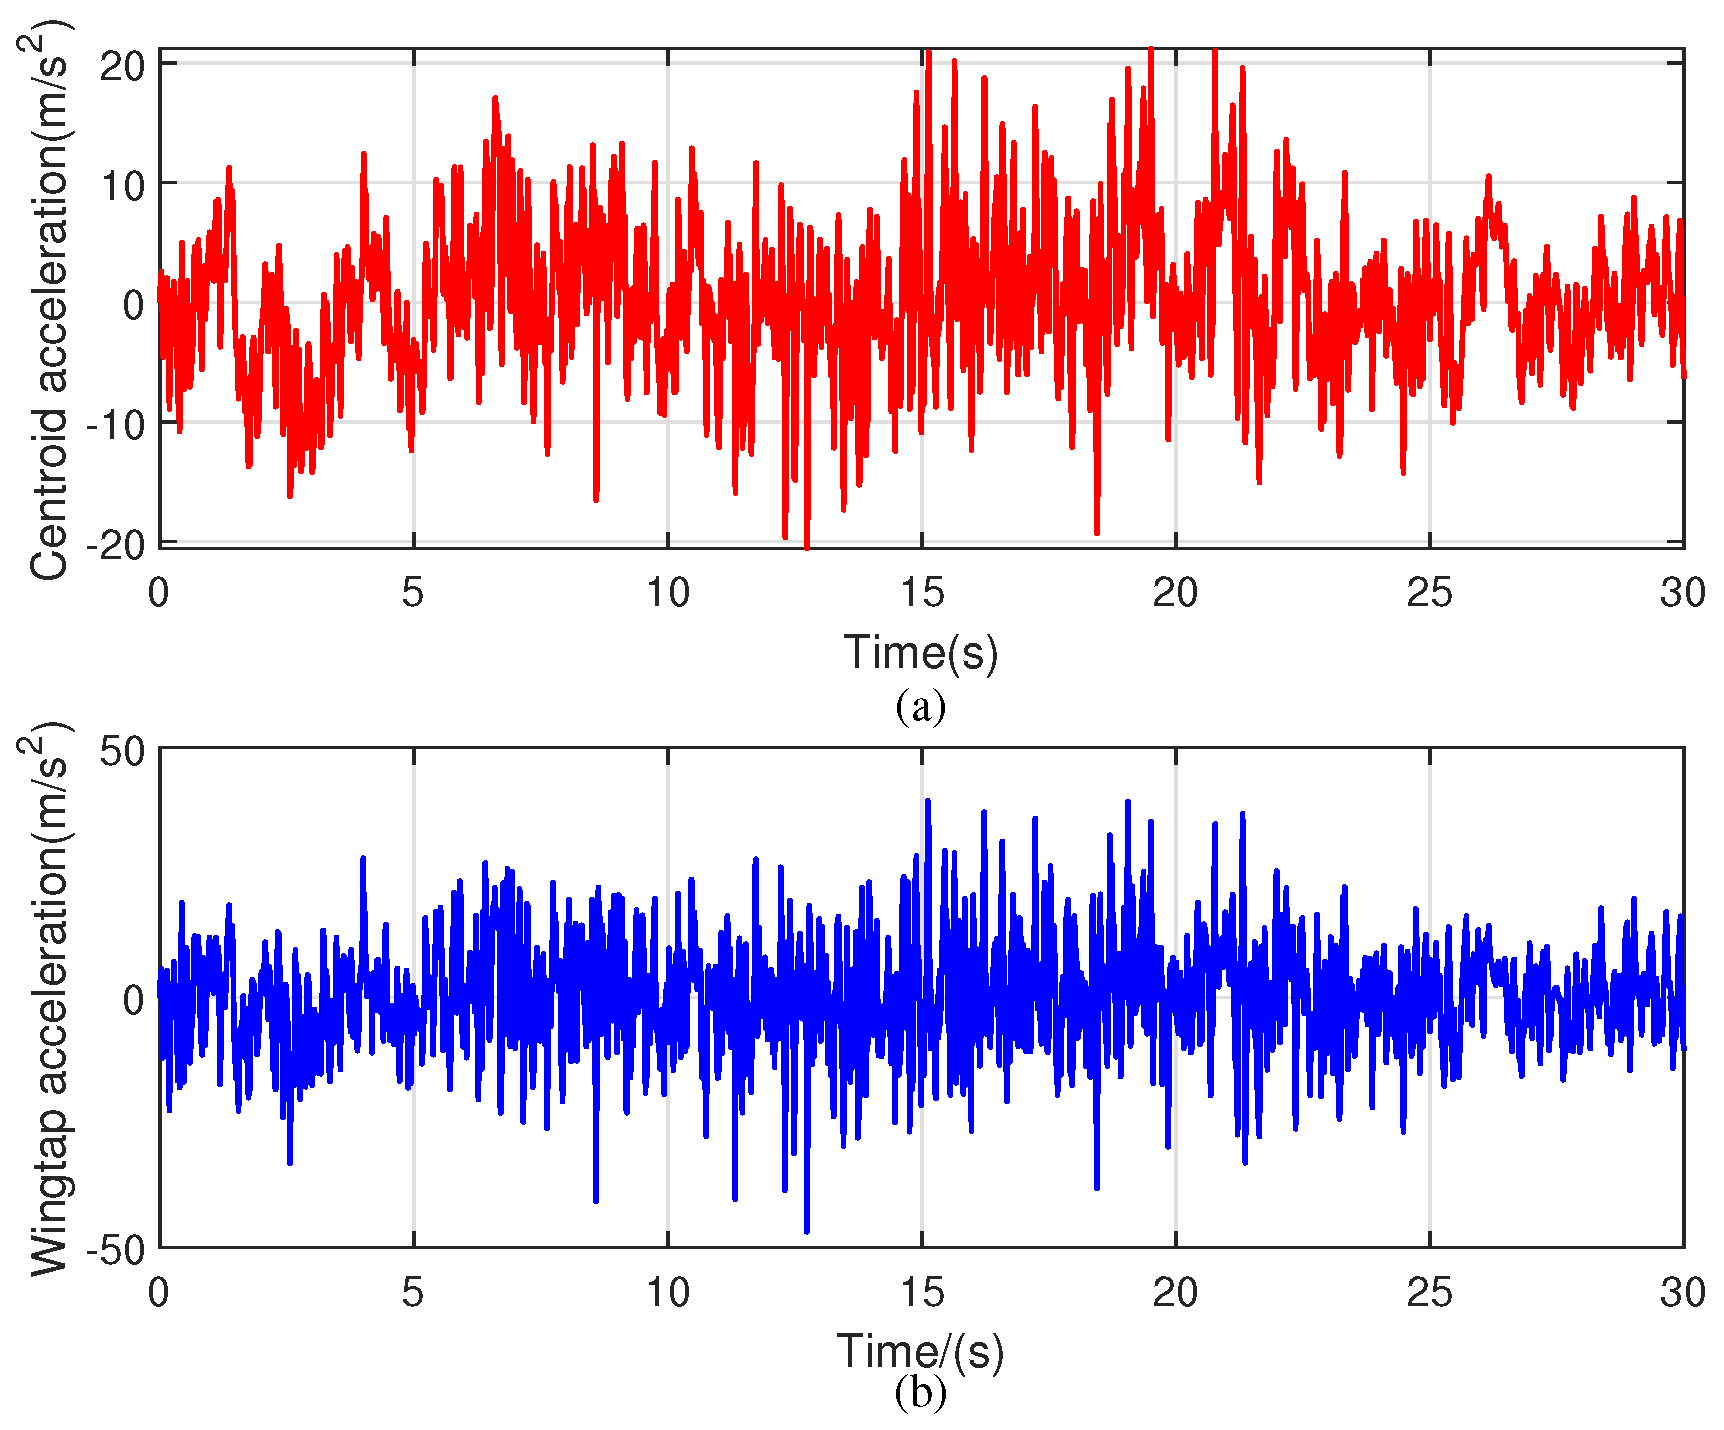
The altitude in the working conditions was set to 6000 m with a flight speed of 30 m/s, maintaining a steady and level flight. The Von Karman model was adopted for continuous gusts. The gust scale was 760 m, and the root mean square of the gusts was 3 m/s. The tail’s elevator movement was governed by a trapezoidal signal, deflecting downward from 0 to 5° at a constant speed between 1 and 1.5 s, maintaining a 5° deflection between 1.5 and 3 s, and returning to the center at a constant speed between 3 and 3.5 s. The flight simulation in a gusty environment was conducted according to the framework shown in Figure 21. Figure 22 shows the response curves of pitch angle and pitch angle velocity, and Figure 23 shows the acceleration responses of the center of mass and wingtip.
The simulation results show that under the action of the elevator, the aircraft initially pitched downward and then gradually raised its head after the elevator returned to the center. Under the action of continuous gusts, the pitch angle velocity continuously fluctuated near 0. The acceleration of the center of mass and wingtip always fluctuated irregularly, and they were mainly affected by continuous turbulence. Due to the obvious elastic effect of the wing with a large aspect ratio, the acceleration of the wingtip was significantly greater than that of the center of mass. These results prove the effectiveness of the fitting strip method in flight simulations with elastic aircraft in gusty conditions. Furthermore, the fitting strip method only needs the current gust information and the gust information from the last τ seconds.

7. Conclusions

(1) A new time-domain gust aerodynamic force calculation method, the fitting strip method, was proposed; it is only related to the past and current gust information, and its calculation is simple and fast. At the same time, it has the same calculation accuracy as that of the traditional frequency-domain method but takes less time, and it can avoid the spiralization caused by the RFA method.
(2) The calculation results of the swept-wing model were consistent with those of the traditional frequency-domain method and the experimental results, proving the effectiveness of the fitting strip method. This method can accurately calculate discrete gusts and continuous gusts, and it can be used with CFD in transonic conditions. The analysis of a normal-layout aircraft further proved that this approach avoids the spiralization issue of RFA and achieves a superior calculation accuracy to that of the gust grouping method.
(3) A flight simulation considering an aircraft with a large aspect ratio validated the applicability of this method in flight simulations involving elastic aircraft under gusty conditions. Compared with other methods, the fitting strip method is easy to apply in real-time flight simulations and has broad application prospects.

Author Contributions

Conceptualization, Z.W. and Z.Y.; methodology, Z.Y.; software, Z.Y.; validation, Z.Y. and D.W.; formal analysis, Z.Y.; investigation, Z.Y.; resources, W.Z.; data curation, W.Z.; writing—original draft preparation, Z.Y.; writing—review and editing, Z.W.; visualization, D.W.; supervision, C.Y.; project administration, C.Y.; All authors have read and agreed to the published version of the manuscript.

Funding

This research received no external funding.

Data Availability Statement

Data are contained within the article.

Conflicts of Interest

Author Wenbo Zhouwas employed by Shanghai Aircraft Design and Research Institute, Commercial Aircraft Corporation of China Ltd. The remaining authors declare that the research was conducted in the absence of any commercial or financial relationships that could be construed as a potential conflict of interest.

References

  1. Hunsaker, J.C.; Wilson, E.B. Report on Behavior of Aeroplanes in Gusts; Technical Report; NASA: Washington, DC, USA, 1915.
  2. Houbolt, J.C. Atmospheric turbulence. AIAA J. 1973, 11, 421–437. [Google Scholar] [CrossRef]
  3. Richardson, J.R.; Atkins, E.M.; Kabamba, P.T.; Girard, A.R. Scaling of Airplane Dynamic Response to Stochastic Gusts. J. Aircr. 2014, 51, 1554–1566. [Google Scholar] [CrossRef]
  4. Karpel, M. Time-domain aeroservoelastic modeling using weighted unsteady aerodynamic forces. J. Guid. Control. Dyn. 1990, 13, 30–37. [Google Scholar] [CrossRef]
  5. Zole, A.; Karpel, M. Continuous gust response and sensitivity derivatives using state space models. J. Aircr. 1994, 13, 30–37. [Google Scholar] [CrossRef]
  6. Karpel, M.; Moulin, B.; Presente, E. Dynamic Gust Loads Analysis for Transport Aircraft with Nonlinear Control Effects. In Proceedings of the 49th AIAA/ASME/ASCE/AHS/ASC Structures, Structural Dynamics, and Materials Conference, 16th AIAA/ASME/AHS Adaptive Structures Conference, 10th AIAA Non-Deterministic Approaches Conference, 9th AIAA Gossamer Spacecraft Forum, 4th AIAA Multidisciplinary Design Optimization Specialists Conference, Schaumburg, IL, USA, 7–10 April 2008. [Google Scholar]
  7. Wu, Z.; Yang, C. Continuous and Discrete Gust Responses of Elastic missiles. J. Beijing Univ. Aeronaut.-Tronautics 2007, 33, 136–140. (In Chinese) [Google Scholar]
  8. Qiu, Q.; Wu, Z.; Yang, C. An equivalent emulation method of gust response for flight tests. Aerosp. Sci. Technol. 2023, 142, 108649. [Google Scholar] [CrossRef]
  9. Zhang, L.; Zhao, Y. Adaptive Feed-Forward Control for Gust Load Alleviation on a Flying-Wing Model Using Multiple Control Surfaces. Aerospace 2023, 10, 981. [Google Scholar] [CrossRef]
  10. Parameswaran, V.; Baeder, J.D. Indicial Aerodynamics in Compressible Flow-Direct Computational Fluid Dynamic Calculations. J. Aircr. 1997, 34, 131–133. [Google Scholar] [CrossRef]
  11. De Nayer, G.; Breuer, M. A source-term formulation for injecting wind gusts in CFD simulations. J. Wind. Eng. Ind. Aerodyn. 2020, 207, 104405. [Google Scholar] [CrossRef]
  12. Zhang, Z.; Xie, C.; Huang, K.; Yang, C. Influence of Aerodynamic Interaction on Performance of Contrarotating Propeller/Wing System. Aerospace 2022, 9, 813. [Google Scholar] [CrossRef]
  13. Zhang, Z.; Xie, C.; Wang, W.; An, C. An Experimental and Numerical Evaluation of the Aerodynamic Performance of a UAV Propeller Considering Pitch Motion. Drones 2023, 7, 447. [Google Scholar] [CrossRef]
  14. Pflüger, J.; Breitsamter, C. Gust response of an elasto-flexible morphing wing using fluid–structure interaction simulations. Chin. J. Aeronaut. 2024, 37, 45–57. [Google Scholar] [CrossRef]
  15. Schmidt, D.K.; Raney, D.L. Modeling and simulation of flexible flight vehicles. J. Guid. Control Dyn. 2001, 24, 539–546. [Google Scholar] [CrossRef]
  16. Saltari, F.; Riso, R.; De Matteis, G.; Mastroddi, F. Finite element-based modeling for flight dynamics and aeroelasticity of flexible aircraft. J. Aircr. 2017, 54, 2350–2366. [Google Scholar] [CrossRef]
  17. Albano, E.; Hodden, W.P. A doublet lattice method for calculating lift distributions on oscillating surfaces in subsonic flows. AIAA J. 1969, 7, 279–285. [Google Scholar] [CrossRef]
  18. Bera, K.K.; Chandiramani, N.K. An element dependent multiple lag rational function approximation for aeroelastic analysis of cable bridge. Appl. Math. Model. 2022, 105, 95–113. [Google Scholar] [CrossRef]
  19. Karpel, M.; Moulin, B.; Chen, P.C. Dynamic Response of Aeroservoelastic Systems to Gust Excitation. J. Aircr. 2005, 42, 1264–1272. [Google Scholar] [CrossRef]
  20. Boulbrachene, K.; Breuer, M. Aeroelastic response of an elastically mounted 2-DOF airfoil and its gust-induced oscillations. J. Fluids Struct. 2023, 117, 103828. [Google Scholar] [CrossRef]
  21. Balatti, D.; Khodaparast, H.H.; Friswell, M.I.; Manolesos, M.; Castrichini, A. Experimental and numerical investigation of an aircraft wing with hinged wingtip for gust load alleviation. J. Fluids Struct. 2023, 119, 103892. [Google Scholar] [CrossRef]
  22. Yan, S.; Zhiqiang, W.; Zhigang, W.U.; Chao, Y. Gust response analysis and verification of elastic aircraft based on nonlinear aerodynamic reduced-order model. Acta Aeronaut. Astronaut. Sin. 2022, 43, 327–346. (In Chinese) [Google Scholar]
  23. He, T.; Su, W. Robust control of gust-induced vibration of highly flexible aircraft. Aerosp. Sci. Technol. 2023, 143, 108703. [Google Scholar] [CrossRef]
  24. Friedewald, D. Numerical Simulations on Unsteady Nonlinear Transonic Airfoil Flow. Aerospace 2021, 8, 7. [Google Scholar] [CrossRef]
  25. Peihan, W.; Zhigang, W.U.; Chao, Y.; Xiaoxu, S. Patch module method for flight simulation of flexible aircraft. Acta Aeronaut. ET Astronaut. Sin. 2023, 44, 80–96. (In Chinese) [Google Scholar]
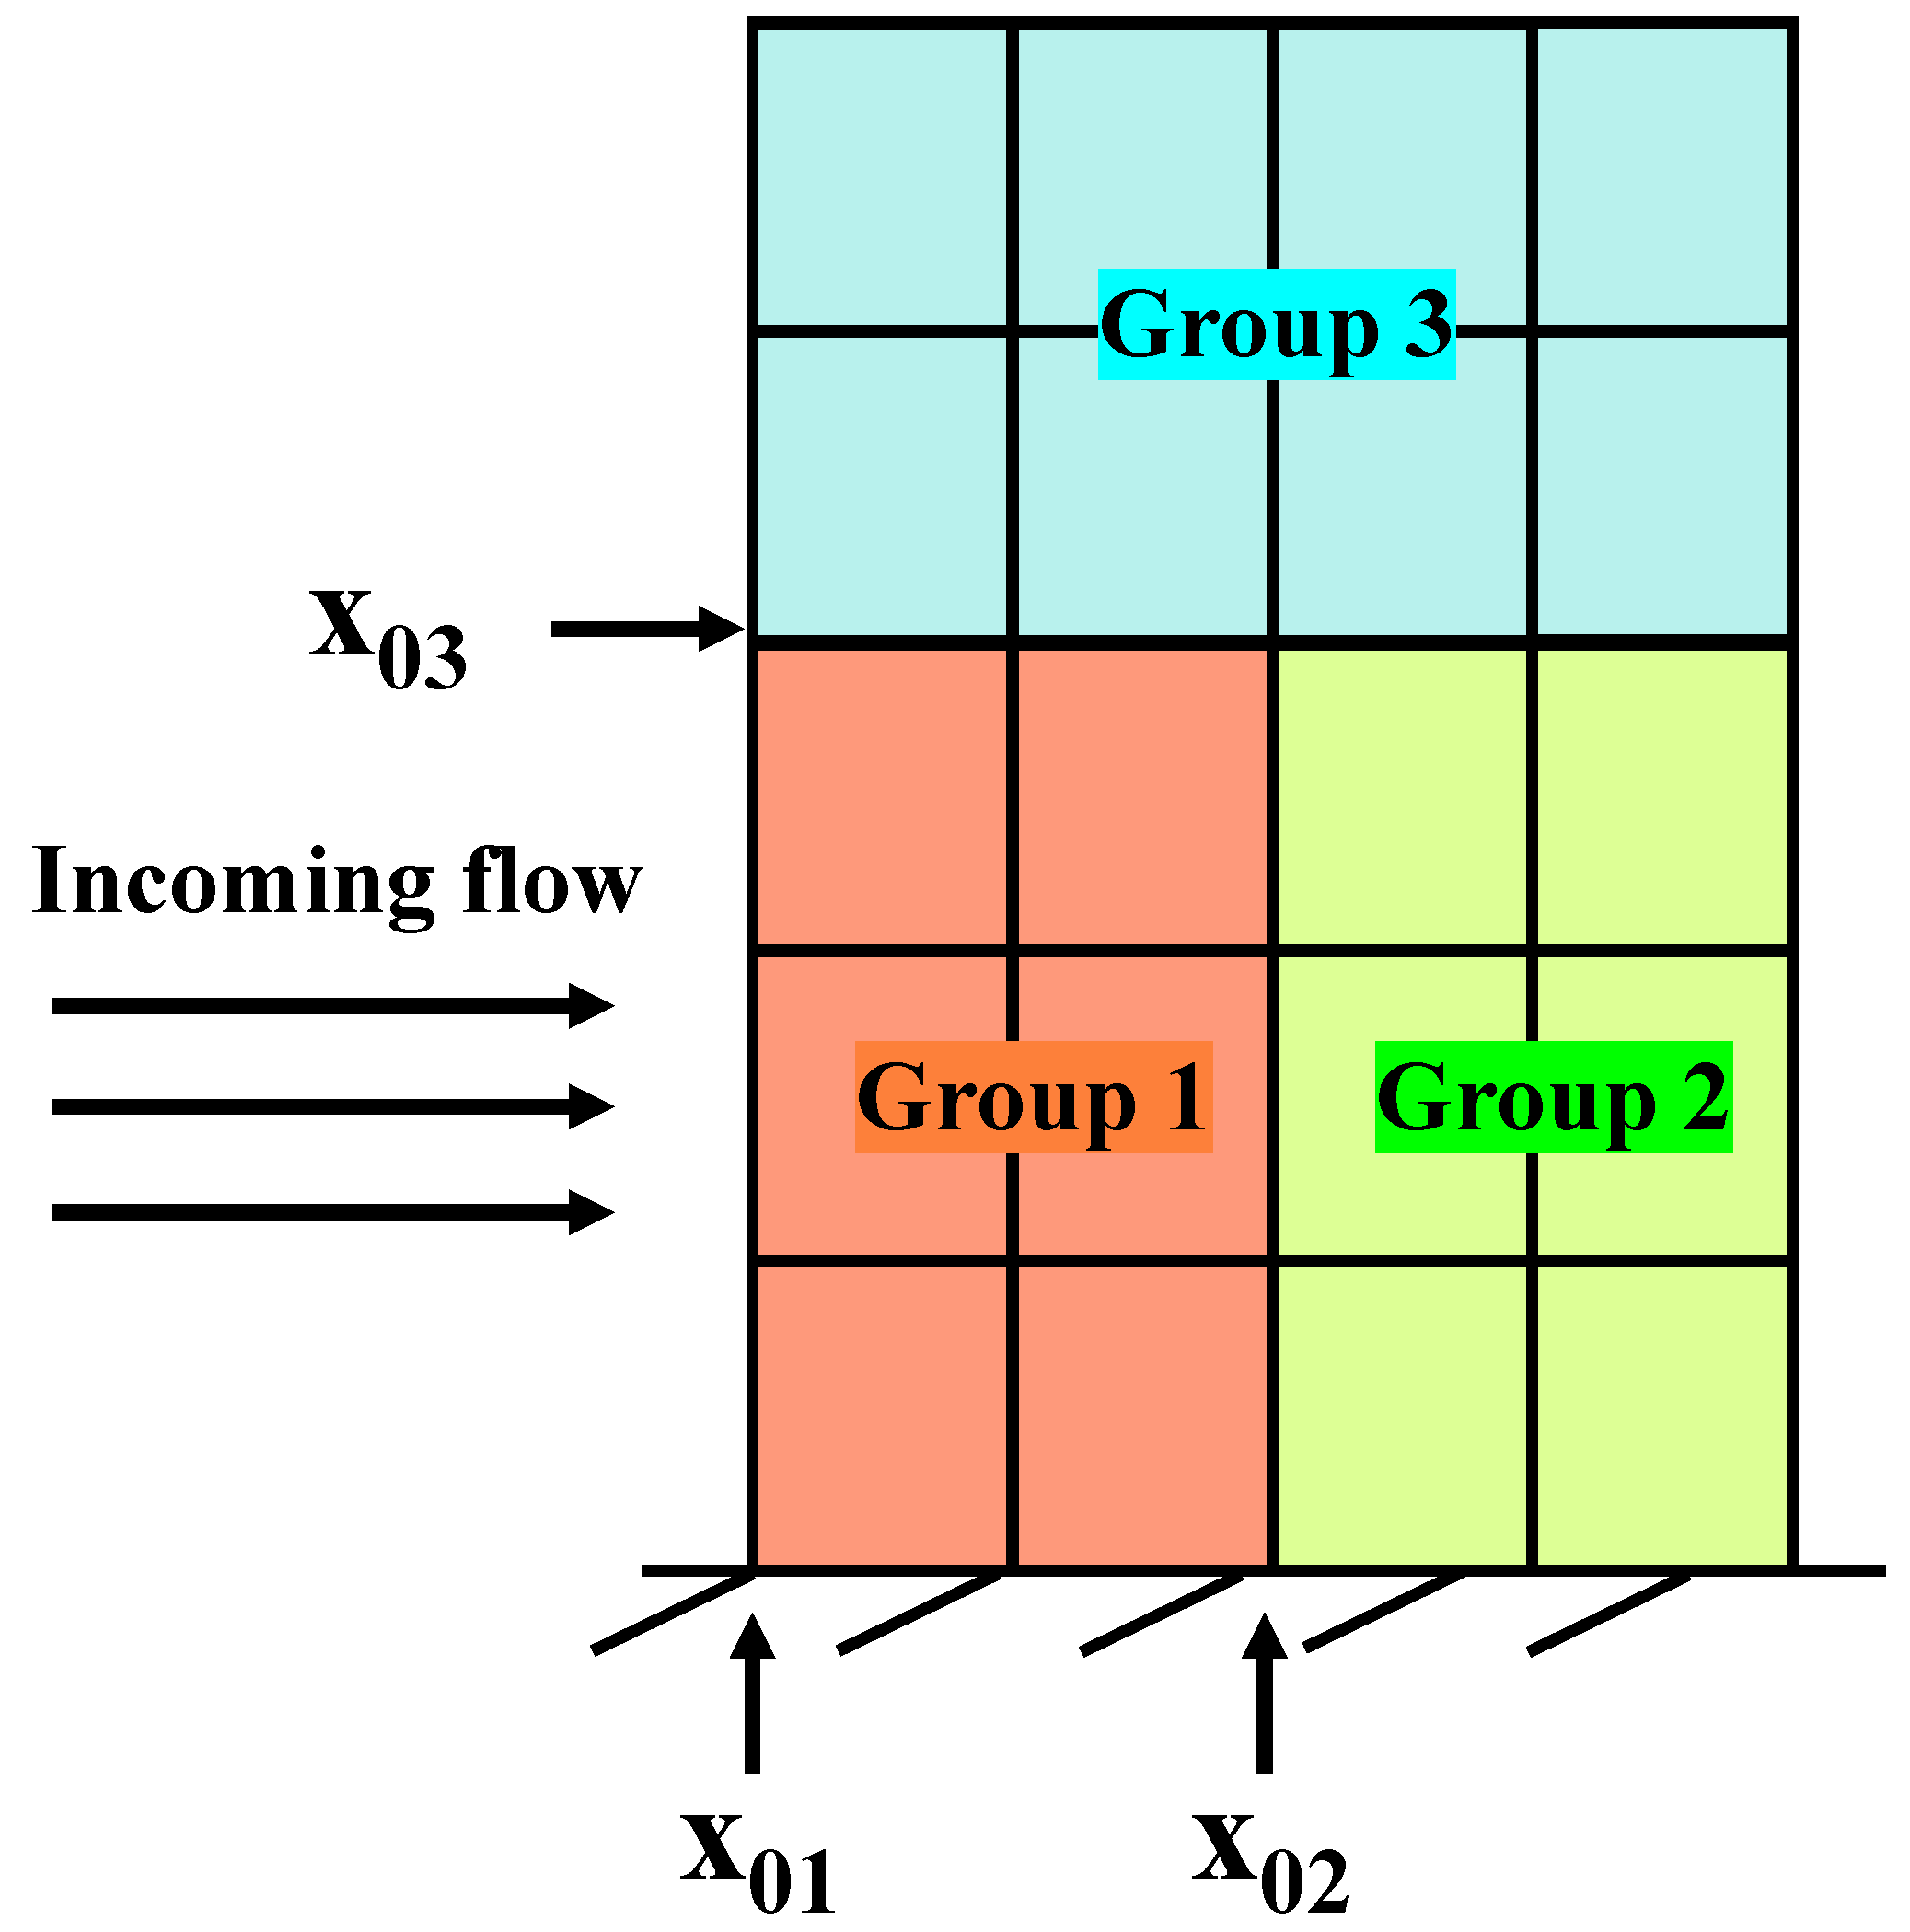
Figure 1. Schematic diagram of the gust grouping method.
Aerospace 11 00583 g001
Figure 2. Comparison of the gust waveform and aerodynamic force waveform.
Aerospace 11 00583 g002
Figure 3. Wing strip division in the fitting strip method.
Aerospace 11 00583 g003
Figure 4. Calculation flow.
Aerospace 11 00583 g004
Figure 5. Finite element model.
Aerospace 11 00583 g005
Figure 6. Aerodynamic mesh of the swept wing.
Aerospace 11 00583 g006
Figure 7. Mode shapes of the swept wing. (a) The first-order mode. (b) The second-order mode. (c) The third-order mode. (d) The fourth-order mode.
Aerospace 11 00583 g007
Figure 8. Scaled model in the wind tunnel.
Aerospace 11 00583 g008
Figure 9. Comparison of aerodynamic force coefficient in condition 1.
Aerospace 11 00583 g009
Figure 10. Comparison of aerodynamic moment coefficients in condition 1.
Aerospace 11 00583 g010
Figure 11. Comparison of the aerodynamic force and accelerometer response in the frequency domain (gust scale: 100 m). (a) Comparison of the aerodynamic force. (b) Comparison of the accelerometer response.
Aerospace 11 00583 g011
Figure 12. Comparison of the aerodynamic force and accelerometer response in the frequency domain (gust scale: 760 m). (a) Comparison of the aerodynamic force. (b) Comparison of the accelerometer response.
Aerospace 11 00583 g012
Figure 13. Structural model of an aircraft.
Aerospace 11 00583 g013
Figure 14. Aerodynamic model of the aircraft.
Aerospace 11 00583 g014
Figure 15. Results for the aircraft lift. (a) RFA’s approximation of the whole aircraft. (b) Gust grouping method’s approximation of the wing. (c) Gust grouping method’s approximation of the tail. (d) Comparison of aircraft lift.
Aerospace 11 00583 g015
Figure 16. Results for the wing-root-bending moment. (a) RFA’s approximation for the whole aircraft. (b) Gust grouping method’s approximation of the wing. (c) Gust grouping method’s approximation of the tail. (d) Comparison of the wing-root-bending moment.
Aerospace 11 00583 g016
Figure 17. Results for the tail-root-bending moment. (a) RFA’s approximation of the whole aircraft. (b) Gust grouping method’s approximation of the wing. (c) Gust grouping method’s approximation of the tail. (d) Comparison of the tail-root-bending moment.
Aerospace 11 00583 g017
Figure 18. Structural model of the aircraft.
Aerospace 11 00583 g018
Figure 19. Mode shapes of the aircraft model. (a) The first-order mode. (b) The second-order mode. (c) The third-order mode. (d) The fourth-order mode.
Aerospace 11 00583 g019
Figure 20. Aerodynamic model of the aircraft.
Aerospace 11 00583 g020
Figure 21. Flight simulation framework for a flexible aircraft based on the patch module method.
Aerospace 11 00583 g021
Figure 22. Response of the pitch angle and pitch angle velocity. (a) Response of pitch angle velocity. (b) Response of pitch angle.
Aerospace 11 00583 g022
Figure 23. Response of the centroid acceleration and wingtip acceleration. (a) Response of centroid acceleration. (b) Response of wingtip acceleration.
Aerospace 11 00583 g023
Table 1. The first four modes of the swept wing.
Mode OrderFrequency (Hz)Mode Name
138.3First-order bending mode
292.3Second-order bending mode
3140.6In-plane mode
4186.6Third-order bending mode
Table 2. Calculation conditions for discrete gusts.
NumberMach NumberDynamic Pressure (Pa)Maximum of Gust Velocity
( m · s 1 )
Gust Scale (m)
10.514,32454.2
20.514,32456.8
30.620,0183.55
40.8531,7633.414.6
Table 3. Results for the aerodynamic force coefficient.
Method Condition 1Condition 2Condition 3Condition 4
Frequency methodpeak value0.1140.1060.0730.064
duration (s)0.0320.0470.0310.051
Fitting strip methodpeak value0.1170.1060.0710.047
duration (s)0.0270.0410.0260.049
Experimentpeak value0.1140.1000.0700.042
duration (s)0.0190.0350.0250.042
CFDpeak value///0.047
duration (s)///0.065
Table 4. Results for the aerodynamic moment coefficient.
Method Condition 1Condition 2Condition 3Condition 4
Frequency methodpeak value0.0560.0470.0340.026
duration (s)0.0300.0460.0310.044
Fitting strip methodpeak value0.0560.0460.0350.020
duration (s)0.0260.0400.0260.050
Experimentpeak value0.0560.0440.0360.021
duration (s)0.0200.0300.0210.042
CFDpeak value///0.022
duration (s)///0.065
Table 5. Comparison of the computation time.
MethodCFDInverse Fourier Transform MethodFitting Strip Method
Time (s)37,8001.030.09
Table 6. The first ten modes of the model of an aircraft with a large aspect ratio.
Mode OrderFrequency (Hz)Mode Name
10.48Symmetrical first bending mode of the wing
21.34Antisymmetric second bending mode of the wing
32.00Symmetrical third bending mode of the wing
43.32First bending mode of the fuselage
53.55Antisymmetric fourth bending mode of the wing
64.72Symmetrical fifth bending mode of the wing
75.58Antisymmetric sixth bending mode of the wing
85.94First bending mode of the wing in plane
99.02First bending mode of the horizontal tail
109.30Second bending mode of the fuselage
Disclaimer/Publisher’s Note: The statements, opinions and data contained in all publications are solely those of the individual author(s) and contributor(s) and not of MDPI and/or the editor(s). MDPI and/or the editor(s) disclaim responsibility for any injury to people or property resulting from any ideas, methods, instructions or products referred to in the content.