Abstract
The aim of manufacturing large aerospace parts for the three-dimensional scanning field demands high precision and efficiency. However, it may be more challenging to meet the full coverage of the measurement problems for large aerospace parts with the scanning range of traditional three-dimensional scanning methods. This paper establishes a dynamic posturing scanning measurement system for large aerospace parts with a six-degree-of-freedom posturing platform and a six-degree-of-freedom industrial robot linkage. It establishes a mathematical model of dynamic three-dimensional scanning posturing. It proposes a platform attitude adjustment strategy based on the field of view angle of a 3D scanner during the adjustment of a six-degree-of-freedom platform. The dynamic scanning path planning is carried out using the three-dimensional spatial decomposition method, and the vector coordinates of the critical points at the edges of the missing areas of the scan are used to re-scan the missing areas to establish the dynamic scanning paths of large aerospace parts. It is experimentally verified that the system can realize the dynamic scanning of complex curved large aerospace parts. The experimental results show that the measurement efficiency is improved by more than 75%, and the point cloud coverage of the scanning reconstruction is improved by 18% for large aerospace components with complex surfaces.
1. Introduction
In aerospace manufacturing, workpiece machining and manufacturing accuracy are particularly important. Especially for large aerospace components with complex curved surfaces, it is not easy to fully assess the quality of the workpiece using CMM due to its large size and complex cross-section. Therefore, three-dimensional scanning reconstruction and re-measurements are generally used. This measures and evaluates the machining quality of large aerospace parts with complex curved surfaces through the 3D scanning tracking measurement process. Scanning equipment is often faced with the problem of large part sizes blocking the tracker’s field of view, causing the scanner to lose its position. The system is, therefore, unable to scan large aerospace components in their entirety, so the scanning position is manually adjusted before the scan to adopt the alignment fit. This process increases the measurement process and reduces the measurement efficiency. Moreover, the alignment fit of multiple scans introduces unnecessary measurement errors in the point cloud data, which affects the accuracy of the scanning measurements to some extent.
High-quality, high-efficiency, and high-precision measurements have become the research focus in this field. In recent years, the development and application of 3D laser scanning technology have widely penetrated several fields. These technologies significantly advance the aerospace industry by providing highly accurate and flexible measurement solutions [1]. Three-dimensional scanning technology has the advantages of high accuracy, high efficiency, and automation compared to traditional CMM measurement methods [2]. This method is particularly good at scanning large aerospace components [3]. Conventional CMM methods make it challenging to automate the adjustment of the workpiece attitude during the measurement process due to the measurement difficulty [4]. This results in measurement inefficiency, errors in the measurement results, and point cloud reconstruction inaccuracies, which pose challenges for meeting evaluation standards [5]. Conversely, 3D scanning technology provides an efficient and automated method of inspection [6,7,8]. This represents a new measurement concept that scholars from multiple countries are exploring. For example, Zhendong Shang et al. used 3D scanning tracking technology and fast non-contact three-dimensional (3D) shape measurement by combining a stereo tracking method based on feature point matching and a structured light measurement method to measure and analyze the surface accuracy in the manufacture of satellite antenna reflectors [9]. In the field of three-dimensional inspection, E. Aldao et al. applied aerospace part-deformation monitoring with three-dimensional scanning techniques to LiDAR and photogrammetric systems, which significantly improved inspection efficiency [10]. However, the accuracy could not be guaranteed due to the large size of the aerospace parts, although the inspection efficiency was improved. Piekarczuk et al. measured and analyzed a sizeable original area of an aerospace insulation system based on 3D scanning technology; the amount of deformation was continuously checked by exposing different stages of the deformation to 3D scanning technology [11]. However, its measurement uncertainty was significant, and the scanning results could be improved. The 3D scanning technology developed by Adrien Drouot et al. for high-precision aerospace measurement-assisted assembly was designed for use in conjunction with robots. It significantly reduced the need for the rectification and reworking that is commonly associated with traditional assembly processes [12]. Due to the assembled platform’s low degree of freedom, it was impossible to automate the assembly. In the surface assessment of honeycomb sandwich aircraft panels with the aid of 3D scanning by T. Reyno et al., the indentation depth and area measurements were rendered more accurate and reliable than with conventional measurements [13].
Based on the above research content, some scholars have established different 3D geometric measurement systems with the help of 3D scanning technology. In particular, the proposed spatial dynamic coordinate measurement method brings new ideas for measuring large-sized aerospace components [14]. Three-dimensional scanners with multiple optical trackers are distributed around the target in the measurement space, providing the simultaneous control of the attitude and scanning trajectory of the 3D scanner for the precision measurement of large aerospace components [15]. Based on this method, Yang Meng et al. from Beijing University of Aeronautics and Astronautics developed a reconstruction method for the 3D deformation of large aerospace components with slender beam-like structures; the change in the process in this case of applied heavy load deformation was tested by the simulation of the wing model [16]. However, if the applied load is too large, its profitable bending deformation will be even more significant, making it difficult to describe large deformations accurately. Professor Zhiyong An of Changchun University of Science and Technology built a measurement platform based on LiDAR for the on-site testing of the precision components of small aircraft. This platform enabled the fast, high-precision 3D measurement of large, regular, and complex workpieces [17]. The abovementioned method achieved accurate measurements of large aerospace workpieces. However, since building the system required multiple optical trackers to capture the 3D scanner in motion, the complex relationships between various components required many conversion relationships. While efficiency and precision go hand in hand, so do the necessary costs and workforce.
The above studies have shown that on-site, online geometric measurement of large and complex curved workpieces is crucial in aerospace manufacturing. The geometrical parameters of the workpieces must be strictly controlled at all stages of the production process, including the segmented production of the build and the final assembly, with real-time feedback on geometry [18]. As the production environment for large-sized workpieces has evolved and changed, the design of inspection systems based on new measurement technologies and methods has become a new research focus. Improvement and development of different 3D scanning measurement systems for specific medium- or large-sized targets, such as a dynamic envelope measurement system for high-speed trains, have also become a new research focus [19]. Step pipe I.D. inspection system, etc. [20]. These findings demonstrate the potential of 3D laser scanning technology to improve measurement accuracy and efficiency and reveal a wide range of possibilities for its practical application. However, the core problem is that there is no guarantee that the optical tracker can track the 3D scanner through the measurement process. The point cloud reconstruction rate could not be achieved due to the occlusion of some areas. The operator needs to manually adjust the position of the workpiece or use a handheld scanner to supplement the scan. Manual scanning is time-consuming and requires the alignment of the point cloud to be fitted to the remeasured part at the end of the scanning process, resulting in redundant scanning paths. It is not easy to scan a complete point cloud of the workpiece quickly and efficiently. Inspection accuracy and efficiency cannot be guaranteed only by increasing the process. Therefore, in the field of automated 3D scanning. Establishing a dynamic scanning method that can automatically adjust the position of large parts with complex surfaces in point cloud reconstruction is essential to improve the reconstruction rate and inspection efficiency of 3D scanning point clouds [21].
This paper aims to solve the difficulty of automating the position adjustment of large-sized workpieces, which results in a low scanning reconstruction rate and inspection efficiency. A dynamic attitude scanning measurement system is established based on dynamic tracking technology using a magnetic attraction target point. This system integrates a six-degree-of-freedom attitude platform with a six-degree-of-freedom industrial robot linkage. The system’s scanning principle is described in detail, and a mathematical model for tracking calibration and scanning position is established. The field-of-view angle is a reference for developing a position adjustment strategy for the 3D scanner and the six-degree-of-freedom platform in dynamic scanning. Additionally, the mathematical modeling of the position adjustment of the 3D scanner on a six-degree-of-freedom platform is elaborated. A trajectory planning strategy is established based on the stereo-spatial decomposition method. Dynamic scanning paths are calculated, and the point cloud coverage of these paths is simulated and tested using MATLAB(R2022a). The experiments verify that the system can effectively increase the coverage of the scanned point cloud, thereby ensuring accuracy and improving detection efficiency. Tests showed that this dynamic scanning system increased the point cloud reconstruction rate by 18 percent and enhanced detection efficiency by more than 75 percent, providing essential references for automated dynamic inspection of large-sized workpieces.
2. Dynamic Scanning System and Working Principle
2.1. Dynamic Scanning System Composition and Technical Parameters
- (1)
- Hardware composition
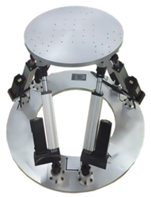
The measurement system consists of a C-track optical tracker, a 3D laser scanner, a six-degree-of-freedom industrial robotic arm, a six-degree-of-freedom measurement platform, and a magnetic suction target point. Figure 1 shows the coordinate system position relationship of each system.
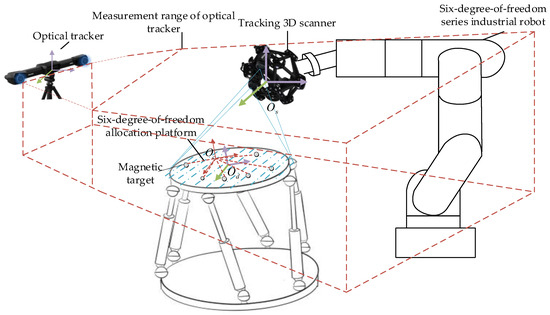
Figure 1.
Measurement system composition : three-dimensional scanner coordinate system. : optical tracker coordinate system. : six-degree-of-freedom allocation platform coordinate system. : magnetic target coordinate system.
- (2)
- Technical parameters
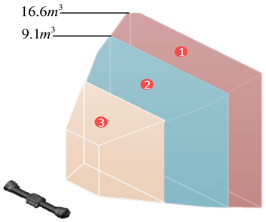
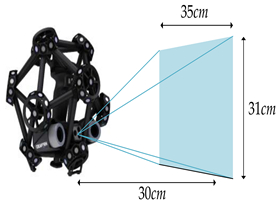
The measurement accuracy of the significant part dynamic attitude scanning measurement system linked with a six-degree-of-freedom attitude platform and a six-degree-of-freedom industrial robot can reach 0.03 mm, and the measurement rate can reach 1,800,000 mm/s; with the fixed optical tracker, its measurement range can reach 9.1 to 16.6 , which is suitable for inspecting and reverse reconstructing large-sized workpieces. The parameter information is shown in Table 1:

Table 1.
Technical parameter.
2.2. Dynamic Scanning Principle
The tracking three-dimensional scanning system captures the surface’s three-dimensional coordinates of the measured object using a laser emitter and a binocular camera. This system has an optical tracker and a three-dimensional scanner that features a reflective marker point. The phase method calculates the three-dimensional coordinate values of the reflective marker point in the workspace, accurately determining the pose matrix of the three-dimensional scanner relative to the optical tracker.
- (1)
- Pose calculation of optical tracker and tracking 3D scanner
As shown in Figure 1. There are N reflective markers in space fixed to . The coordinate value M of the reflective marker point in the coordinate system constitutes a matrix:
The coordinate values in the coordinate system constitute a matrix:
The transformation of the target in the scanner coordinate system and the optical tracker coordinate system is
Let
Constructing covariance matrix H:
Using the singular value decomposition method for Equation (5). Minimizing the point set alignment error can determine the optimal rotation matrix. The optimal rotation matrix is obtained as follows:
The translation vector t can be obtained by taking the obtained R into Equation (3), and the pose transformation relationship between the scanner coordinate system and the optical tracker coordinate system is shown in Equation (7).
- (2)
- Optical tracker and magnetic target pose calculation
The C-Track optical tracker will accurately read the coordinates of each magnetic target in space. For each magnetic target, calculate the optical tracker and its positional relationship matrix can be expressed by a chi-square transformation matrix, as shown in Equation (8):
where is a 3 × 3 rotation matrix. The rotation matrix between the magnetically attracted target and the optical tracker on a six-degree-of-freedom platform is a 3 × 1 vector, which indicates the position of the magnetic attraction target to the optical tracker.
By combining the positional transformation matrices of all magnetically attracted targets, the least squares method is used to solve the position relationship of the targets on the platform concerning the optical tracker by constructing an objective function, as shown in Equation (9):
where n is the number of magnetic targets. is the pose relation matrix of the i th target relative to the optical tracker. is the pose relationship matrix of the i th target relative to the six-degree-of-freedom funding platform. is the pose transformation matrix between the whole platform of the solution and the optical tracker.
The Levenberg–Marquardt algorithm is used to solve the attitude transformation matrix between the magnetic suction target and the optical tracker to find the optimal platform attitude matrix . When applied to the relative position of each magnetic attraction target point, the resulting position is possible. The steps of the position calculation for the optical tracker and the magnetic suction target point are shown in Figure 2.
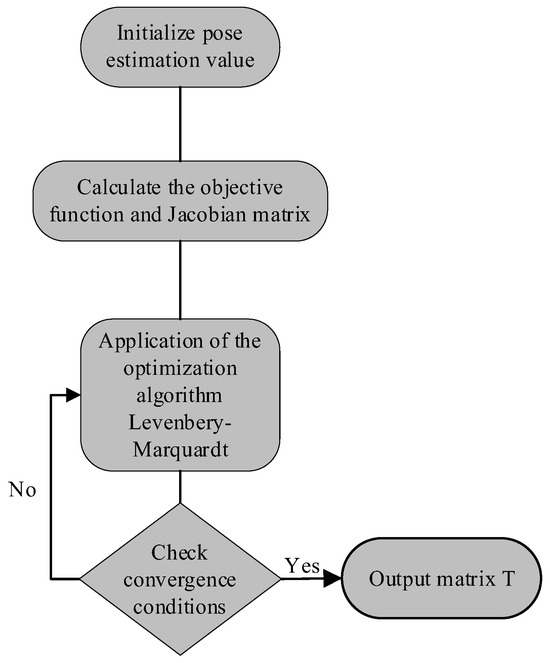
Figure 2.
Flow chart of the optical tracker and the magnetic suction target point.
(1) Initializes the pose estimation value and defines an objective function to represent the difference between the predicted pose and the actual pose; the two-paradigm number is calculated first, and then the result is squared. As shown in Equation (10):
where denotes the theoretical pose of the ith target. is the actual measured pose of the ith target, and n is the total number of targets.
(2) Compute the Jacobi matrix of the objective function. For each magnetic attraction target, the objective function is the difference between the theoretical pose of the target and the actual observed pose. The Jacobian matrix J is the partial derivative of the objective function concerning the pose parameters. For each magnetic target, a row of the Jacobian matrix is
T represents the pose transformation matrix between the six-degree-of-freedom platform and the optical tracker. indicates the current six-degree-of-freedom platform pose.
(3) Application of the Levenberg–Marquardt algorithm.
(4) Check the convergence conditions. In iteration and convergence determination, the pose difference transformation needs to be small enough. In mathematics, it can be expressed as . is the pose transformation of the k th iteration. is a preset small threshold. The minimum threshold should be set according to the 3D scanner’s scanning accuracy so that the deviation after the kth and (k − 1) st iterations is less than the specified threshold value .
(5) If the result meets the conditions, the best pose matrix can be obtained .
- (3)
- Pose calculation of magnetic target and tracking 3D scanner
The pose transformation can be expressed by a 4 × 4 homogeneous transformation matrix:
Construct the covariance matrix, which is a 6 × 6 matrix, as shown in Equation (13):
The number of magnetic targets is n. The Jacobian matrix J calculated by each transformation is a matrix of all first-order partial derivatives of a multivariate vector-valued function. It describes the change rate of each pose transformation relative to its parameters. Produces multiple pose transformations . It will constitute a plurality of corresponding covariance matrices . Then, the combined covariance matrix is shown in Equation (14):
The inverse transformation combination of the pose transformation matrix between the optical tracker and the 3D scanner is . The transformation matrix between the magnetic target and the three-dimensional scanner is obtained as follows:
3. Dynamic Scanning Pose Adjustment Strategy
To realize that the optical tracker can continuously capture the 3D scanner without interruption during the dynamic scanning process, the workpiece’s occlusion to the scanner is reduced by adjusting the posture of the measurement and posturing platform position. The posturing strategy of the measurement and posturing platform is affected by the scanning range of the scanner and the tracking range of the optical tracker.
3.1. Scanning Range Analysis
As shown in Figure 3, in the process of dynamic scanning, the field of view of the optical tracker is blocked by the workpiece, resulting in the three-dimensional scanner’s inability to track due to the optical tracker, as the world coordinate system position, being fixed and the measurement of the attitude of the platform adjusting the position, so that the three-dimensional scanner can be exposed to the field of view of the optical tracker to continue scanning.
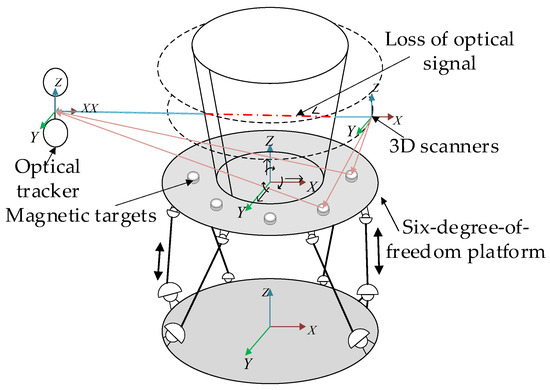
Figure 3.
Three-dimensional scanner loses field of view due to occlusion.
As shown in Figure 4, the occlusion of the 3D scanner’s field of view prevents the optical tracker from capturing the 3D scanner’s position in space at this point. This results in the loss of regions 1 and 2 due to the occlusion caused by the shape of the workpiece and the inability of the light source to capture these areas. Consequently, the position of the six-degree-of-freedom platform is adjusted to expose the 3D scanner to the optical tracker’s field of view, allowing for continuous scanning and sampling.
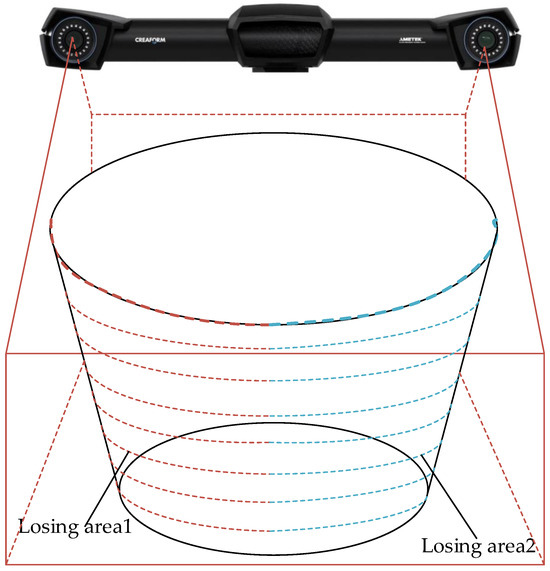
Figure 4.
Vision loss problem.
3.2. Pose Adjustment of Scanning Platform
When the optical tracker cannot capture the three-dimensional scanner, the pose of the six-degree-of-freedom platform is adjusted to expose the reflective marker points of the three-dimensional scanner itself as much as possible. As shown in Figure 5, the six-degree-of-freedom platform rotates θ° around the y-axis from the initial position. At this time, the three-dimensional scanner can be exposed to the measurement field of the optical tracker and continue to scan the workpiece.
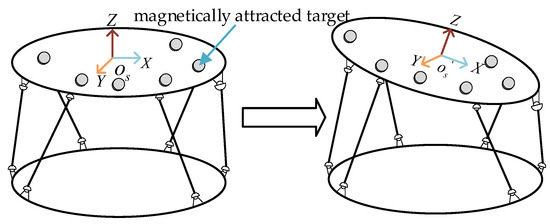
Figure 5.
Six-degree-of-freedom allocation platform adjustment.
- (1)
- Field of view angle calculation
When the large-sized workpiece is adjusted on the six-degree-of-freedom adjustment platform, the scanning distance and angle between the measured workpiece and the three-dimensional scanner will change. Determining the field of view angle becomes particularly important to ensure the scanning quality. As shown in Figure 6, the endpoint of the workpiece is at the center of the field of view of the laser plane emitted by the three-dimensional scanner. The angle of the field of view is the angle between the average vector of the endpoint and the central axis of the laser scanning surface. The maximum reflection angle of the 3D scanner is . The endpoint of the laser emitted by the three-dimensional scanner is under the field of view angle . Whether the sampling point of the measured workpiece is successful must satisfy that the angle between the average vector of the critical point of the measured surface and the axis of the scanning plane of the three-dimensional scanner is less than . According to Figure 6, when the six-degree-of-freedom platform is adjusted, the distance relationship between the three-dimensional scanner and the measured workpiece is shown in Equation (16):
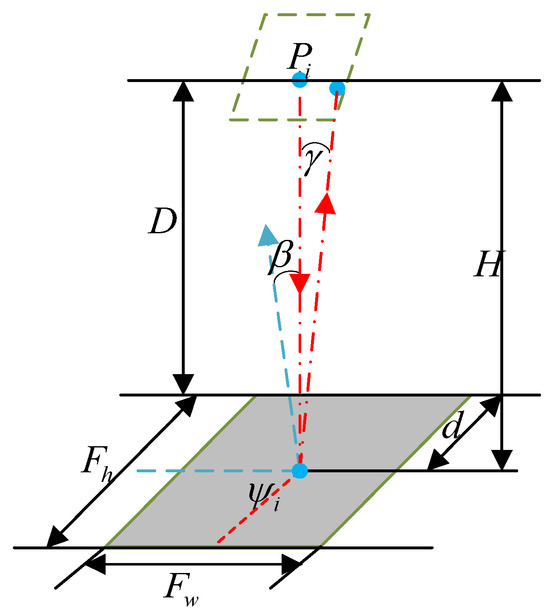
Figure 6.
Determination of the spatial position of the field of view angle.
- (2)
- Test of the inclined plane of a large rotary body
During the test, the area with a large cone slope of 300 mm × 300 mm was selected, and the flatness was low, as shown in Figure 7a. Figure 7b shows ten different scanning depths. The scanning depth level 1 represents the shortest distance between the scanner and the plane, set to 300 mm. Scanning depth levels 1–10 illustrate the maximum distance between the scanner and the plane, with an interval of 20 mm between adjacent scanning depth levels. Each scanning depth was repeated five times to obtain more accurate measurement results. In the measurement process, the point cloud data from the shortest distance between the scanner and the workpiece plane were selected to construct a plane fitting at least squares for the 50 results obtained from the total scanning of the aircraft.
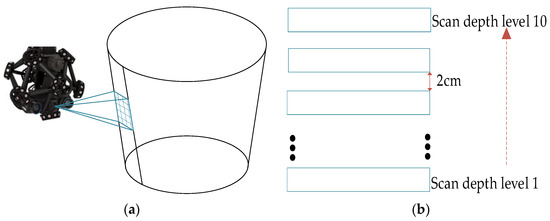
Figure 7.
Measurement of the inclined plane of a large-sized rotary body. (a) Scanned area; (b) horizontal interval.
Figure 8 and Figure 9 summarize the relationship between the scanning depth level and the digitization error. From Figure 8, the method categorizes the scanning depth into ten levels, each corresponding to a distinct depth. The results from five scans at each depth level are presented as separate data sequences. This segmentation is necessary because, in the experimental process, variations in the brightness of the light and vibrations from the robotic arm during adjustments are inconsistent, leading to varying degrees of error. These factors that affect the experimental data are unavoidable.
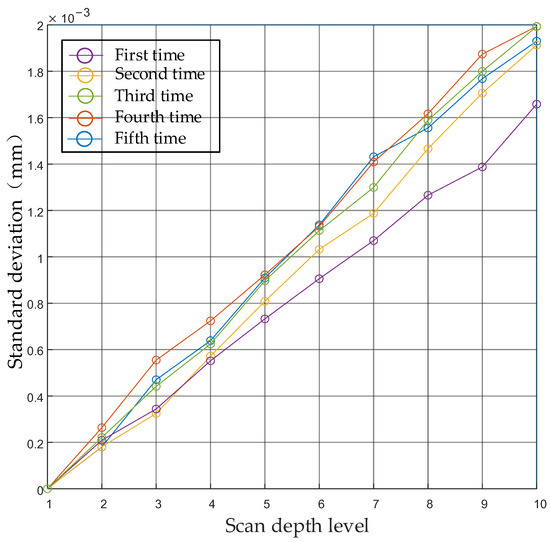
Figure 8.
The relationship curve between scanning depth and standard deviation.
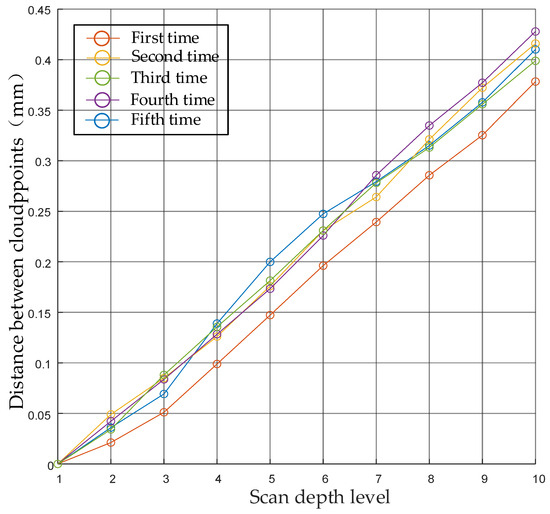
Figure 9.
The change curve of scanning depth and relative distance.
In Figure 8, the horizontal coordinate represents the scanning depth level, defined as the shortest distance between the 3D scanner and the measured workpiece. It is divided into ten levels, each representing a different distance. The vertical coordinate represents the standardized variance used to evaluate the variations in scanner proximity to the reference datum at different scanning depths. During each scan, the standardized variance of the measurement data increases as the scanning depth increases, owing to continuous adjustments of the six-degree-of-freedom stage during the scanning process.
Figure 8 shows that the measured data’s standard deviation increases with the increase in the scanning depth. The adjustment of the six-degree-of-freedom measurement platform will also affect the scanning depth. When the scanner is close to the reference, the standard deviation is about 0.8 mm; when scanned horizontally at level 10, the standard deviation is about twice that of the reference.
It can be seen in Figure 9 that, unlike the change in standard deviation, the change curve of relative distance has no obvious rule. The maximum difference between the single measurement curve at measurement point 1 and the measurement point 10 is about 0.4 mm. The distance difference in the scanning depth reflects the change in the system error because the relative distance between the three-dimensional scanner and the measured workpiece will change when adjusting the pose of the six-degree-of-freedom measurement platform.
As illustrated in Figure 8 and Figure 9, the data obtained varied in each case. This variation is due to the unpredictable vibration error caused by adjusting the robotic arm, although this error is minor and does not impact the scan results. Additionally, the intensity of the light and the room temperature influenced the experimental data.
3.3. Three-Dimensional Scanner Pose Adjustment
In adjusting the pose of the platform, in addition to determining the field angle of the three-dimensional scanner, the real-time pose of the three-dimensional scanner needs to be calculated during the adjustment of the six-degree-of-freedom platform. As shown in Figure 10, a 3D scanner coordinate system relative to the workpiece coordinate system relative motion, including translation and rotation motion, is shown. The workpiece coordinate system is the reference coordinate system. The scanning starting point of the 3D scanner is set to . When reaching , the limited scanner field of view requires adjusting its orientation with the Teach-In method. The scanning trajectory passes through , , …, , in turn, and the rising part of the scanning trajectory is represented by coordinate . The three-dimensional scanner performs translational motion before the overall scanning is completed. The mathematical model of the three-dimensional scanner in the process of pose adjustment is shown as follows in Equations (17)–(19):
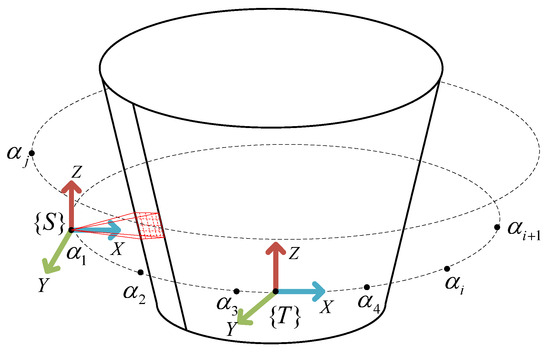
Figure 10.
Three-dimensional scanner pose schematic.
In the adjusted pose relationship, the pose of any point can be expressed as
where
After adjusting the position of the 3D scanner in space, it is also necessary to represent the amount of change in its position before and after adjustment. This is shown in Table 2 and Table 3.

Table 2.
Attitude adjustment of 3D scanner.

Table 3.
Euler angle calculation.
Let be expressed by Euler angle. is a 3 × 3 rotation matrix with elements, and the Euler angle is calculated as shown in Table 3.
Large hollow cones are used to measure the scanning quality of large-sized aviation components during the pose adjustment of the six-degree-of-freedom platform. The geometric parameters are shown in Table 4. The measurement system described in Figure 11 calculates the diameter of the large end face using the spatial circle fitting algorithm. The endpoint samples collected from the large-sized rotary parts before and after the adjustment of the six-degree-of-freedom platform are analyzed, and the corresponding diameter is obtained by fitting. Because the large-sized cone is a hollow workpiece, locating the end point is difficult. Therefore, the scanning speed of the three-dimensional scanner is reduced to 10 mm/s to maintain linear motion. To ensure that the C-Track optical tracker can read the position of the three-dimensional scanner in space more accurately. Figure 11 shows the end face circle fitted when the surface of the six-degree-of-freedom capital adjustment platform is horizontally placed, and the pose is adjusted to the limit. In Figure 11, the blue solid line represents the position of the measured workpiece after following the platform rotation, specifically the end face of the workpiece as fitted by the scanning point cloud. The red solid line indicates the initial position of the measured workpiece, which is also the end face supplied by the scanning point cloud. Additionally, the blue solid dots show that the 3D scanner can read part of the point cloud at the endpoint of the measured workpiece.

Table 4.
Geometric parameters of large size cone.
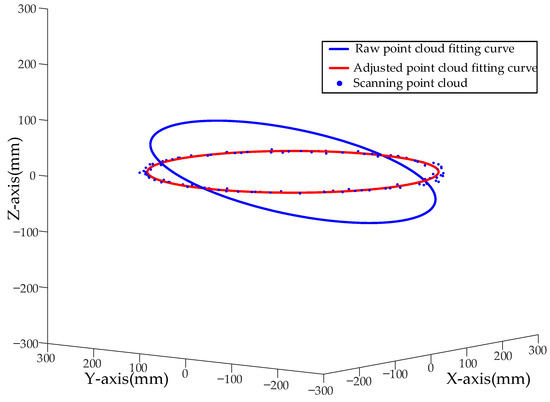
Figure 11.
Fitted end face circle when horizontal placement and pose adjustment to the limit.
Figure 11 shows that the sampling range of the large-sized conical workpiece is approximately the same, and the error between the fitted diameter value and the actual value is less than 0.040 mm. This shows that when other workpiece conditions are the same, adjusting the pose of the six-degree-of-freedom platform has little effect on the fitting results. It meets attitude adjustment requirements, and the sampling time is 32s.
4. Dynamic Scanning Path Trajectory Planning
A 3D data point cloud is considered to be a collection of ordered associated scans. When the 3D point cloud graphic is known, a collection of point cloud key points reflecting the changes in the collection of workpieces can be generated on the model. The spatial position information of the key points is used to directly control the position of the tracking 3D scanner in space to scan the whole workpiece.
4.1. Dynamic Scanning Trajectory Planning Strategy
In the path planning of significant aeronautical components, three main constraints must be included: (1) the spatial position of the tracked 3D scanner is close to the optimal scanning distance; (2) the generated paths are non-conflicting and cannot cause collisions and sharp stops of the tracked 3D scanner; (3) the maximum uncertainty range of the critical point features of the contour is satisfied. The tracking of 3D scanner measurements is mainly affected by the angle of view during scanning. The relative height of the measured surface and the dynamic changes in the speed of movement of the 3D scanner.
As shown in Figure 12, is the set of critical points to construct the scan path. A collection of key points in the coordinate system of the complete measuring system can all be read by the C-Track optical tracker. The distance between points in a part of its scanned area can be expressed as
where . In 3D space, the coordinates of the center of part of the region of this large-sizes workpiece is ; the point can be decomposed approximately, as follows:
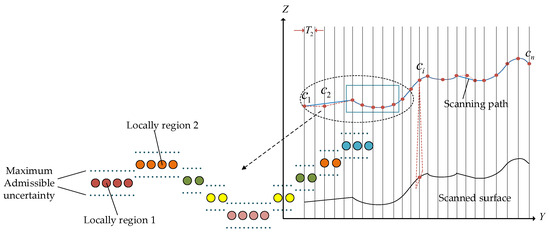
Figure 12.
Mathematical model of general linear scan planning.
Bringing Equation (21) into Equation (22) and first-order Taylor expansion of Equation (20) yields the following:
where
Considering the same case for all key point features, the linear programming can be expressed as .
Where the measuring distance , unknown vector , the path design matrix is
The unknown vector is
If the large-sized cone contains a single geometry, the rotational translation changes of the neighboring critical points along the x-axis, y-axis, and z-axis coordinate axes can be directly estimated according to the above equation. For a single large-sized workpiece feature, the initial position of the tracking 3D scanner is optimal with the measured surface, and the geometric information of the scanned point cloud obtained by the stereo-spatial decomposition method is used to calculate and guide the actions of the 3D scanner.
- (1)
- Three-dimensional space decomposition method
To clearly express the process of the three-dimensional spatial decomposition method in the rapid planning of the scanning path, the feature points of the large-sized cone workpiece are used as the upper surface, approximated to the shape of a circular arc. As can be seen from Figure 13, when the 3D scanner is in the initial position, the scan line is parallel to the x-axis, and the projection of the endpoints of the critical feature points of the cone is approximated to be at the center of the scanning surface of the 3D scanner. The 3D scanner is mounted on the end of a six-degree-of-freedom KUKA tandem robot, and the instructor controls the six-degree-of-freedom robot arm to drive the 3D scanner in a rotational and translational motion.
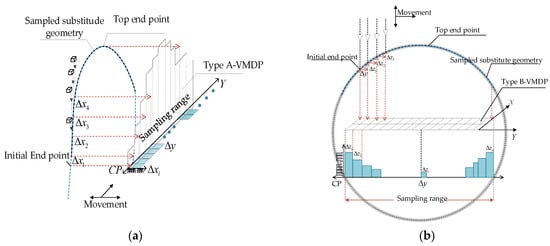
Figure 13.
Scanning path planning by cubic spatial decomposition. (a) Type A-VMDP, (b) Type B-VMDP.
The stereo-spatial decomposition method involves vertically projecting the geometric information in the neighboring key feature points onto the datum planes of types A and B, respectively, and calculating the relative spatial displacement information, which serves as the offset for the following positional change of the 3D scanner. As shown in Figure 13a, the 3D scanner moves along the axis at a constant speed, and the traveling distance is set to be . The displacement of the second endpoint from the initial endpoint concerning the type A surface is . As shown in Figure 13b, when the 3D scanner moves along the y-axis at a constant speed , the spatial position of the second endpoint is obtained from the scan-acquired point cloud; the displacement of the second endpoint from the initial endpoint is , the amount of displacement to move the 3D scanner along the z-axis. The models of Figure 13a,b are synchronized, and the position and orientation of the 3D scanner in space at the next moment are calculated according to the strategy of positional adjustment in Section 2. The point cloud data of the scanned contour can be obtained by repeating the above process.
Throughout the sampling process, the quality of point cloud sampling is mainly affected by the relative distance between the 3D scanner and the measured surface. A six-degree-of-freedom tandem robot arm controls the 3D scanner synchronously along the x-axis, y-axis, and z-axis. This will cause the scan depth deviations of and generated by the second endpoint position to be detected only at the spatial position of the third endpoint. Thus, the second scanning endpoint produces a scanning deviation . The deviation of the center of the laser plane emitted by the 3D scanner from the position of the second endpoint is . And since the size of and is mainly affected by , it is essential to adjust the field of view angle in time.
The three-dimensional spatial decomposition method is more straightforward and effective than the traditional scanning path design idea. It is more easily adapted to the rapid sampling of large-size features.
4.2. Dynamic Scan Path Calculation
Figure 14 shows the process of acquiring a point cloud of multiple regions of regular feature geometry. During the sampling process, the bounding box is parallel to the x-axis and y-axis, respectively, and the area it scans is slightly smaller than the range of the standard scanning grid of the 3D scanner (marginally less than 350 mm × 310 mm). The attitude of the six-degree-of-freedom platform needs to be adjusted when scanning to the missing area, and the 3D scanner’s scanning direction in space is adjusted according to the angle between the average vector of the point cloud surface in the bounding box. The direction vector of the scanning angle of the current 3D scanner using the stereo-spatial decomposition method is based on the 3D scanner’s current positional state. An adjustment is made according to the next position of the positional transformation, updating the average vector direction to the new scanning direction and determining whether it satisfies the threshold; if not, it is necessary to continue to adjust the change of the six-degree-of-freedom platform position so that the 3D scanner can expose more reflective marking points under the C-Track tracking; adjusting the real-time of the 3D scanner in space according to the spatial coordinate change of the critical points in the neighboring bounds position. Repeat step (3) of Figure 14 to fill in the missing areas.
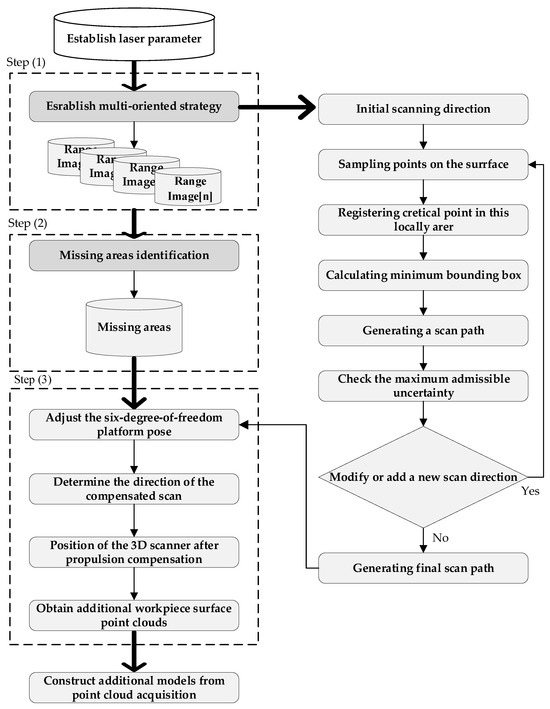
Figure 14.
Flowchart of laser-based data acquisition. Step (1): Esrablish multi-oriented strategy. Step (2): Missing areas identification. Step (3): Adjust the six-degree-of-freedom platform pose.
As can be seen in Figure 15, when the 3D scanner scans the part in the initial scanning attitude, missing regions are created. The attitude of the six-degree-of-freedom stage needs to be adjusted. A new scanning direction was added to the 3D scanner to continue sampling and replenish the actual regions until the critical contour sampling is complete. Figure 16 shows the new scanning direction calculated from the crucial point information of the point cloud of the missing region edges based on the field of view angle. As shown in Figure 15, the missing region is based on the new path planning model obtained by adjusting the position of the six-degree-of-freedom platform, selecting a point in the center of the bounding box to be marked as the critical point, and continuing to add the new scanning attitude from the boundary of the missing region to generate a new scanning path.

Figure 15.
Path planning for missing areas.
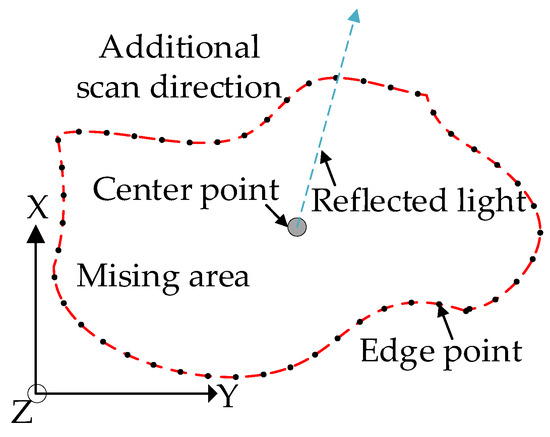
Figure 16.
Calculating the scanning direction of a missing region.
As shown in Figure 17, in the -plane, the geometric relationship between the initial endpoint and the center C of the end circle can be obtained. Similarly, the 3D scanner makes small translational, rotational movements along the y-axis relative to the workpiece . Then, the second endpoint can be obtained. The difference in heights between and is in the -plane. And by the geometric properties of a circle, the geometric relationship between the endpoints and the center of the circle C is expressed as
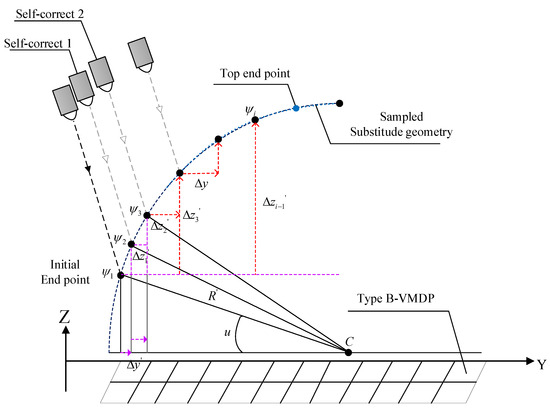
Figure 17.
Scan path planning.
Simplifying Equation (26), the angle u between the scanning endpoint and the center of the circle C can be found, as follows:
The 3D scanner continues its translational motion along the y-axis concerning the part under test. Then, the spatial position of the 3D scanner relative to the endpoint is adjusted to obtain the third endpoint . The geometric height difference between and is . According to the geometric properties of a circle, the geometric relationship between the endpoint and the center of the circle C can be expressed as
The simplification of Equation (28) gives the following:
The adjustment angle of the six-degree-of-freedom platform is the same as the tilt angle of the workpiece and can be expressed as follows:
Using Equation (26) to Equation (30), the parameters and were calibrated, respectively. The scanning interval of the 3D scanner along the y-axis is , and the change in height from endpoint to is
The height at which the 3D scanner moves along the z-axis is
The displacement of the 3D scanner along the x-axis is
The above implements the calculation of critical parameters in path planning. This enables a path to be fitted to the spatial position of the 3D scanner after adjusting the six-degree-of-freedom platform, which can be calculated by the stereo-spatial decomposition method. When the 3D scanner acquires the endpoints . The spatial position of the 3D scanner can be adjusted again. It is updating its position and attitude in space. Ensure precise positioning of the spatial location of the following critical points during the completion of route planning.
5. Three-Dimensional Dynamic Scanning Simulation and Experiment
5.1. Three-Dimensional Dynamic Scanning Simulation
The three-dimensional spatial decomposition method and the scanning strategy based on the positional transformation are simulated and analyzed in the simulation. The three-dimensional spatial decomposition method is tested with the classical dynamic scanning of a hollow cone, with a diameter of the large end face of 500.04 mm ± 0.05 mm, a diameter of the small end face of 300.05 mm ± 0.05 mm, and a length of 1000.05 mm ± 0.05 mm. The system device is a dynamic scanning system for a six-degree-of-freedom platform described in the first chapter. To verify the quality of the scanned point cloud in path planning, the endpoints of a large-sized conical workpiece are simulated and tested. Since the positioning calibration of the endpoints is difficult to achieve during the adjustment of the six-degree-of-freedom platform, the points in this neighborhood range are selected for simulation, and the critical points in its neighborhood range have a small positional change in the global coordinate system.
During the simulation, the 3D scanner moves at a speed of 20 mm/s along the y-axis, and the setting is 20 mm; the initial scanning direction is (0, 0, 1). The planning of the scanning path is executed with the stereo-spatial decomposition method. The speed is set to 20 mm/s, and the initial scanning direction is (0, 0, 1). The planning of the scanning path is executed by the stereo-spatial decomposition method. Since the interior of the large-sized conical workpiece is a hollow feature, the fixed position on the outer surface of the workpiece is selected as the critical point for scanning. Figure 18a shows that after the 3D scanner reaches a position approximately 200 mm along the x-axis. The 3D scanner is lost in the field of view of the optical tracker, preventing the 3D scanner from scanning the hollow region inside the large-sized cone and losing the internal point cloud data. After identifying the missing area, Figure 18b shows that after adopting the overall scanning planning strategy in Section 3.2. The 3D scanner starts from the position (200.249, 172.172, −6) at the edge of the missing region in the scanning direction (0, −0.561, 0.756) and arrives at the edge position (101.254, 159.254, −5.70) to re-sample the result of the scanning process bounding box, which was set to 20 mm × 15 mm. The sampling frequency is 50 ms.
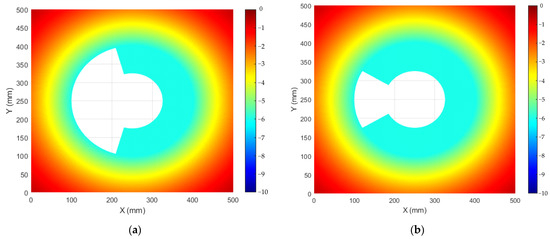
Figure 18.
Scanning results of large-sized hollow cone. (a) Original scanning point cloud. (b) Scanning point cloud after platform adjustment.
The scanning angle of the 3D scanner is calculated according to Section 3.2. The scanning angle of the 3D scanner on the upper face of the workpiece is 11.971°. The six-degree-of-freedom platform is rotated around the y-axis in degrees during the simulation. The simulation is repeated ten times for each angle. As seen in Figure 18, after adjusting the position of the six-degree-of-freedom platform, some areas still cannot be scanned. This is because the adjustment angle of the six-degree-of-freedom platform is limited, and adjusting the position of the six-degree-of-freedom platform still leaves the optical tracker with a blind spot in the field of view. From the simulation results, the coverage of the scanned point cloud is improved by 20.9% after adjusting the positional attitude of the six-degree-of-freedom measurement platform.
Table 5 summarizes the measurements obtained for ten repetitions of the relevant diameters. The diameters of the large and small ends of the workpiece are less than 0.06 mm from their actual values. The root-mean-square error is less than 0.05 mm, which meets the measurement accuracy requirement in the position adjustment.

Table 5.
Measurement results of geometrical parameters of conical workpieces.
5.2. Scanning Experiment
To verify the simulation results, the same experimental environment as the simulation is established, and the simulation data are imported to verify the method’s effectiveness, as shown in Figure 19. The operation flow of the experiment is as follows:
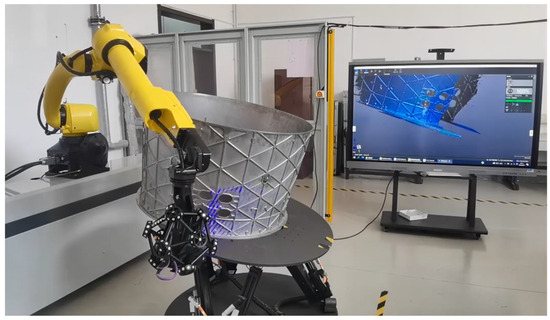
Figure 19.
Test system.
- (1)
- Pre-calibrate the laser scanner, optical tracker, scanning robot, and six-degree-of-freedom motion platform.
- (2)
- Place the measured workpiece on the six-degree-of-freedom parallel motion platform, place the magnetic suction target point, and adjust the platform attitude so that the inner and outer surfaces of the workpiece and the 3D scanner are captured as much as possible by the binocular camera of the C-Track optical tracker.
- (3)
- Configure the laser scanner parameters according to the material and reflectivity of the measured workpiece and establish a scanning template.
- (4)
- For the scanning path, use the teaching suspension or offline programming method to establish the TB program of the scanning robot.
- (5)
- Start the automatic control system and call the scanning template and path. The TB program scans the critical points on the surface of the measured workpiece and acquires its point cloud data; when the optical tracker fails to capture the area scanned by the 3D scanner, the teach pendant appropriately adjusts the position of the six-degree-of-freedom platform.
- (6)
- Post-process the point cloud data of the workpiece and import it into the Polyworks(R2022). Measure the inner and outer contour of the workpiece according to the pre-established measurement procedure and generate the measurement report.
The experiment executes the scanning principle in Section 2.2 and the method of trajectory planning strategy in Section 3. The initial position of the 3D scanner is (−44.9, −44, 21), the initial speed is 20 mm/s, the optimal distance from the workpiece is controlled between 200 and 400 mm, and the dynamic scanning is carried out along the outer contour of the workpiece. The scanning field of view is lost when the scanner reaches the place of (55.8, 46.7, 21) when the scanner reaches (55.8, 46.7, 21). The scanning field of view is lost, and the angle of the six-degree-of-freedom measuring platform is adjusted at this time so that it can be scanned again after adjusting the field of view angle of the 3D scanner to satisfy that the angle between the average vector of the critical point of the measured surface and the center axis of the scanning plane of the 3D scanner is less than . Continuing with the dynamic measurements, each step followed the process of Figure 14, and the operation was repeated until a complete point cloud model was scanned.
The test results show that the overall scanning time is 23 min. For measuring the part of the workpiece, the total time for scanning and measuring with the system is 30 min. The time required for the complete reconstruction of the point cloud model of the part was at least two hours with a handheld 3D scanner. Measurement efficiency improved by 75%. The point cloud data obtained using the least squares method was fitted, and the model was reconstructed after scanning the workpiece, as shown in Figure 20:
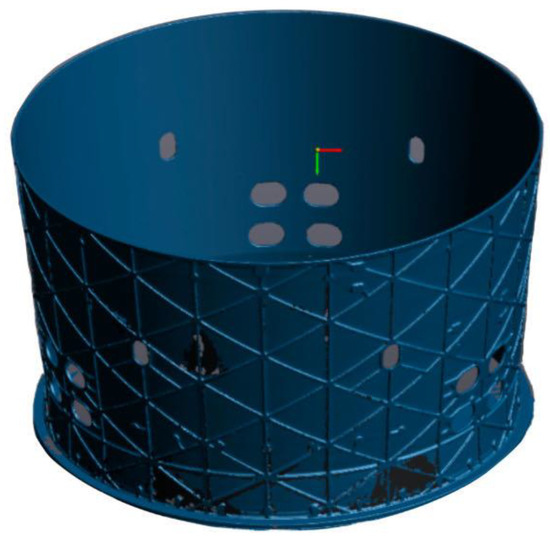
Figure 20.
Reconstructed point cloud.
Due to the limited angle of the six-degree-of-freedom platform posture adjustment, some point clouds cannot be acquired, as shown in Figure 21; at this time, the missing area path planning model in Section 4.2 will be the missing area to supplement the completion of the point cloud scanning.
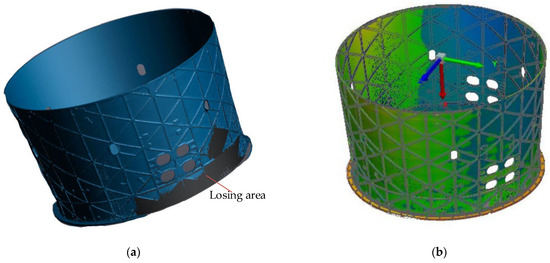
Figure 21.
Sampling of missing regions. (a) Missing regions. (b) Missing regions added after optimization.
Measurements were taken on the inner and outer surfaces of the reconstructed point cloud model, and ten typical actual surface measurement points were intercepted, as shown in Figure 22. Their measurements were compared with the theoretical design results, and the measurements are shown in Table 6. As seen from Table 6, the system’s measurement accuracy meets the requirements, and the actual surface deviation obtained through measurement is controlled within 0.4 mm.
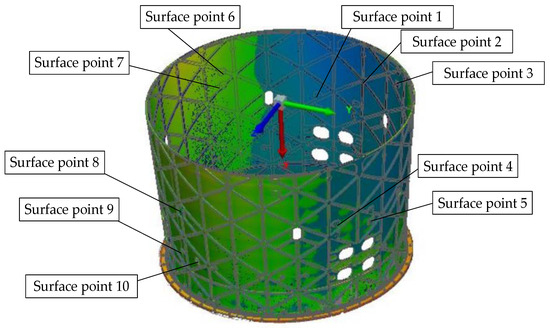
Figure 22.
Surface measurement points.

Table 6.
Surface point measurement data.
When measuring the outer surface with a bevel, three representative bevel surfaces are intercepted for comparison, as shown in Figure 23. The measured experimental data are shown in Table 7. Table 7 shows that the measured deviation value is controlled within 0.02 mm, which aligns with the measurement requirements.
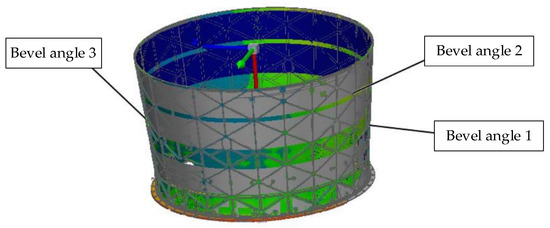
Figure 23.
Bevel angle measurement.

Table 7.
Bevel angle measurement.
The measurement was repeated ten times for this experiment to obtain the scan data. Figure 24 and Figure 25 show the results of 10 repeated scans of the workpiece during the six-degree-of-freedom stage adjustment. As seen in Figure 24 and Figure 25, the spatial position of the workpiece did not change significantly with the change of the six-degree-of-freedom platform adjustment angle 2. The positioning errors are less than 0.15 mm along the x-axis component and less than 0.1 mm along the z-axis component. In Figure 21, Figure 22, Figure 23, Figure 24 and Figure 25, it is fully illustrated that the six-degree-of-freedom dynamic scanning system follows the planning strategy and mathematical model in Section 3.2. In this way, the dynamic scanning technique can realize the all-around scanning and point cloud reconstruction of significant aerospace components, improving inspection efficiency.
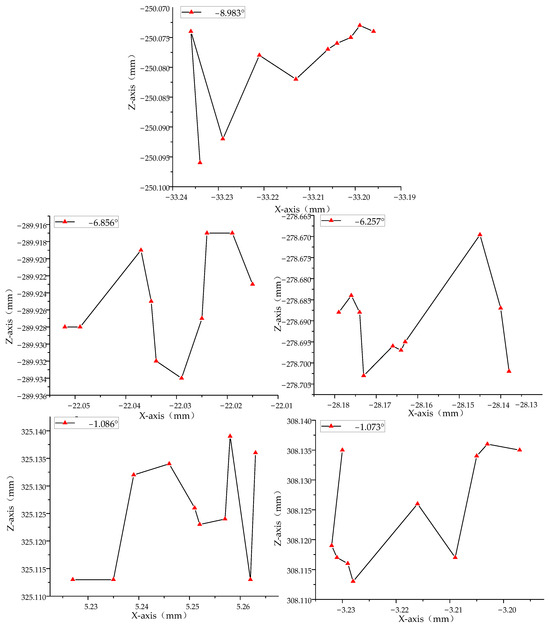
Figure 24.
Repeat ten times for negative angle workpiece endpoint measurements.
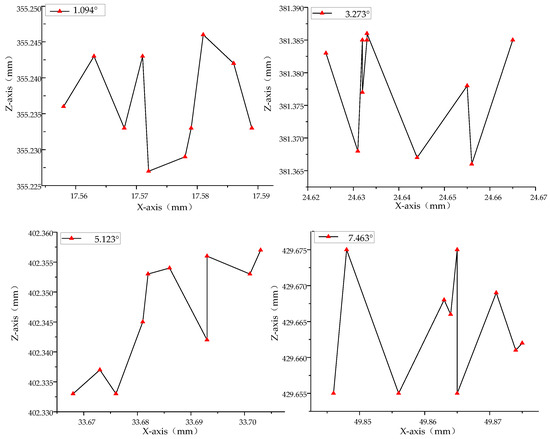
Figure 25.
Repeat ten times for positive angle workpiece endpoint measurements.
6. Conclusions
In response to the need for significant aerospace components with large dimensions and high measurement accuracy, this paper presents a dynamic scanning measurement method centered on a tracking-based scanning system. The positional relationship between the optical tracker, the 3D scanner, and the measurement attitude platform in dynamic scanning measurement is analyzed. The tuning strategy and path planning method for dynamic scanning are established, and the main conclusions are obtained as follows:
- (1)
- Establishment of a scanning measurement system for large parts with a six-degree-of-freedom posing platform and a six-degree-of-freedom industrial robot. Defined dynamic scanning process and measurement space.
- (2)
- Mathematical modeling of dynamic scanning platform attitude adjustment based on the field of view angle. By synchronizing the position of the scanning stage and the 3D scanner. Realized dynamic and precise scanning measurement of significant aerospace components. Measured in Matlab(R2022a) simulation, the standardized variance of the end face of the workpiece is less than 2.5 mm when the platform is adjusted in position. Endpoint accuracy is better than 15 μm. Tolerance is less than 0.04 mm.
- (3)
- Dynamic scanning trajectory planning using stereo-spatial decomposition method. Its point cloud coverage was simulated and experimented on in Matlab(R2022a). Experimental results show that after point cloud reconstruction, the overall surface deviation is controlled within 0.05 mm. Bevel angle deviation is controlled within 0.02 mm. The point cloud reconstruction rate is improved by 18%, close to the simulation results, and the detection efficiency is improved by more than 75%. When the workpiece changes position with the six-degree-of-freedom platform, the positioning errors are less than 0.15 mm along the x-axis and less than 0.1 mm along the z-axis.
Author Contributions
Conceptualization, Y.W. and L.Q.; methodology, Y.W.; software, Y.W.; validation, J.L., M.W. and L.Q.; formal analysis, J.L.; investigation, M.W.; resources, G.L.; data curation, Y.W.; writing—original draft preparation, Y.W.; writing—review and editing, Y.W.; visualization, P.S.; supervision, J.L.; project administration, M.W.; funding acquisition, L.Q. All authors have read and agreed to the published version of the manuscript.
Funding
This research was funded by the Liaoning Province’s Applied Basic Research project, the Funder Ligang Qu, grant number 2022JH2/101300211; The fundamental research funds for the universities of liaoning province and Key Laboratory of Rapid Development & Manufacturing Technology for Aircraft (Shenyang Aerospace University), Ministry of Education, the Funder: Jing Li, grant number: JYB202303.
Data Availability Statement
Data are contained within the article.
Conflicts of Interest
The authors declare no conflicts of interest.
References
- Narita, Y.; Chiba, K. Aerodynamics on a faithful hindwing model of a migratory dragonfly based on 3D scan data. J. Fluids Struct. 2024, 125, 104080. [Google Scholar] [CrossRef]
- Hu, D.; Gan, V.J.; Yin, C. Robot-assisted mobile scanning for automated 3D reconstruction and point cloud semantic segmentation of building interiors. Autom. Constr. 2023, 152, 104949. [Google Scholar] [CrossRef]
- Haleem, A.; Javaid, M.; Singh, R.P.; Rab, S.; Suman, R.; Kumar, L.; Khan, I.H. Exploring the potential of 3D scanning in Industry 4.0: An overview. Int. J. Cogn. Comput. Eng. 2022, 3, 161–171. [Google Scholar] [CrossRef]
- Sato, O.; Takatsuji, T.; Matsuzaki, K.; Watanabe, M.; Kajima, M.; Miura, Y.; Nakanishi, S. Practical experimental design and uncertainty evaluation method for dimensional and form measurements using coordinate measuring machines. Measurement 2024, 227, 114224. [Google Scholar] [CrossRef]
- Guillory, J.; Truong, D.; Wallerand, J.-P.; Lösler, M.; Eschelbach, C.; Mähler, S.; Klügel, T. Determination of the reference point of a radio telescope using a multilateration-based coordinate measurement prototype. Precis. Eng. 2023, 83, 69–81. [Google Scholar] [CrossRef]
- Zhao, W.; Jiang, Y.; Liu, Y.; Shu, J. Automated recognition and measurement based on three-dimensional point clouds to connect precast concrete components. Autom. Constr. 2022, 133, 104000. [Google Scholar] [CrossRef]
- Yuan, K.; Zhu, W.-D. A novel mirror-assisted method for full-field vibration measurement of a hollow cylinder using a three-dimensional continuously scanning laser Doppler vibrometer system. Mech. Syst. Signal Process. 2024, 216, 111428. [Google Scholar] [CrossRef]
- Jiang, H.; Wang, Q.; Zhao, H.; Li, X. High-precision composite 3D shape measurement of aeroengine blade based on parallel single-pixel imaging and high-dynamic range N-step fringe projection profilometry. Opt. Laser Technol. 2024, 170, 110085. [Google Scholar] [CrossRef]
- Shang, Z.; Chen, J.; Zhou, Y.; Cong, S.; Zhao, L.; Meng, X.; Wang, F.; Chen, M.; Yue, H.; Liu, J. Research on the rapid 3D measurement of satellite antenna reflectors using stereo tracking technique. Measurement 2024, 232, 114639. [Google Scholar] [CrossRef]
- Aldao, E.; González-Jorge, H.; Pérez, J.A. Metrological comparison of LiDAR and photogrammetric systems for deformation monitoring of aerospace parts. Measurement 2021, 174, 109037. [Google Scholar] [CrossRef]
- Piekarczuk, A.; Sudoł, E.; Mazurek, A. Measurement analysis of large-area elements of External Thermal Insulation Composite Systems using 3D scanning techniques. Measurement 2024, 233, 114755. [Google Scholar] [CrossRef]
- Drouot, A.; Zhao, R.; Irving, L.; Sanderson, D.; Ratchev, S. Measurement Assisted Assembly for High Accuracy Aerospace Manufacturing. The reported research has been funded by the EPSRC grant EP/K018205/1. IFAC-Pap. Online 2018, 51, 393–398. [Google Scholar] [CrossRef]
- Reyno, T.; Marsden, C.; Wowk, D. Surface damage evaluation of honeycomb sandwich aircraft panels using 3D scanning technology. NDT E Int. 2018, 97, 11–19. [Google Scholar] [CrossRef]
- Franceschini, F.; Maisano, D.; Mastrogiacomo, L. Mobile spatial coordinate measuring system (MScMS) and CMMs: A structured comparison. Int. J. Adv. Manuf. Technol. 2009, 42, 1089–1102. [Google Scholar] [CrossRef]
- Peggs, G.N.; Maropoulos, P.G.; Hughes, E.B.; Forbes, A.B.; Robson, S.; Ziebart, M.; Muralikrishnan, B. Recent developments in large-scale dimensional metrology. Proc. Inst. Mech. Eng. Part B J. Eng. Manuf. 2009, 223, 571–597. [Google Scholar] [CrossRef]
- Meng, Y.; Xie, C.; An, C.; Xu, Q.; Yang, C. Three-dimensional large deformation reconstruction for slender wing-like structures from strain measurements. Measurement 2022, 204, 111969. [Google Scholar] [CrossRef]
- Zhou, N.; An, Z.; Li, Y. Large-Scale Three-Dimensional Topographic Measurement Using Lidar. Infrared Laser Eng. 2011, 40, 2465–2468. [Google Scholar]
- Deng, Z.; Ruan, Y.S.; Hao, F.; Liu, T. Hand-eye calibration of line structured-light sensor by scanning and reconstruction of a free-placed standard cylindrical target. Measurement 2024, 229, 114487. [Google Scholar] [CrossRef]
- Guo, Y.; Liu, C. Dynamic Envelope Measurement System for High-Speed Trains. China Laser 2013, 2, 0208002. [Google Scholar]
- Zhang, F.; Qu, X.; Ouyang, J. An automated inner dimensional measurement system based on a laser displacement sensor for long-stepped pipes. Sensors 2012, 12, 5842–5843. [Google Scholar] [CrossRef]
- Zhou, Z.; Liu, W.; Wu, Q.; Wang, Y.; Yu, B.; Yue, Y.; Zhang, J. A Combined Measurement Method for Large-Size Aerospace Components. Sensors 2020, 20, 4843. [Google Scholar] [CrossRef]
Disclaimer/Publisher’s Note: The statements, opinions and data contained in all publications are solely those of the individual author(s) and contributor(s) and not of MDPI and/or the editor(s). MDPI and/or the editor(s) disclaim responsibility for any injury to people or property resulting from any ideas, methods, instructions or products referred to in the content. |
© 2024 by the authors. Licensee MDPI, Basel, Switzerland. This article is an open access article distributed under the terms and conditions of the Creative Commons Attribution (CC BY) license (https://creativecommons.org/licenses/by/4.0/).
